Submitted:
10 July 2023
Posted:
11 July 2023
You are already at the latest version
Abstract
In order to explore the genetic diversity of the extremely small population wild plant Habenaria dentata and protect and optimize its wild resources. The genetic diversity of 133 samples from 6 wild populations of H.dentata was analyzed by ISSR molecular marker technique to provide a scientific basis for the screening of improved germplasm resources. The results show that the average number of alleles (Na) was 1.765, the average number of effective alleles (Ne) was 1.424, the average Nei 's gene diversity index (He) was 0.252, the average Shannon information diversity index (I) was 0.381, and the average percentage of polymorphic loci (PPL) was 76.499%. The variation within populations was 77.34%, and the variation between populations was 22.66%. Gene flow (Nm) was 1.705 8, greater than 1. The results of cluster analysis showed that the six populations were mainly divided into four branches and not classified according to geographical location. There was no significant correlation between geographical location and genetic distance between populations (r=0.557, P>0.05). The genetic diversity of H.dentata is high. Among the six wild populations, the genetic diversity of Mulun population is the highest and this population can be used as a key protection unit.
Keywords:
Habenaria dentata
; medicinal orchid plant
; genetic diversity
; ISSR
; cluster analysis
1. Introduction
Habenaria dentata is a terrestrial herb of the genus Habenaria of Orchidaceae, which mainly grows in the gully or hillside woodland at an altitude of 190-2300 m. The plant is widely distributed in China, such as Guangdong and Guangxi, Anhui, Fujian, Yunnan, Guizhou and other southwest China[1]. And this plant also a medicinal plant, with its oval or oblong fleshy underground tubers used as medicine. This medicinal material is mild in nature, sweet in taste, slightly bitter, and has the effects of degassing, detoxication[3], relieving cough and phlegm[4], diuresis, anti-inflammatory[5] and so on. It can be used for the treatment of body deficiency, orchitis, impotence, tuberculosis cough, hernia, urinary tract infection and other diseases. Although H.dentata is widely distributed in China, the number of individuals in a single population in the field is small and the distribution is scattered. In addition, because of its certain medicinal value and ornamental value, the number of wild populations is decreasing dramatically. Based on the above reasons, it is necessary to accelerate the research and protection of this medicinal plant resource with great development potential.
At present, the research on H.dentata mainly focuses on resource investigation[7], tissue culture technology[8-9], mycorrhizal fungi[10-12], etc., and the conservation genetics and genetic breeding have not been studied. The study of genetic diversity is one of the first goals to be completed in the task of plant germplasm resources protection, and it is also a solid guarantee for the utilization and development of medicinal plant resources. Genetic diversity research mainly explores the diversity differences of DNA, protein, chromosome and phenotype [13]. The sum of genetic variation between different populations of the same species and between different individuals in the same population is often one of the main contents of genetic diversity research [14]. The study on the genetic diversity of medicinal plant germplasm resources can not only prove the genetic structure and gene polymorphism of the population, but also point out the direction for the selection of excellent germplasm resources and the selection of core protected populations. At present, the molecular marker technology represented by ISSR (Inter-simple Sequence Repeat), which has the advantages of simple operation, low cost and high polymorphism, has been widely used in the breeding of excellent germplasm resources, identification of new varieties and genetic diversity research of plants because of its advantages of simple operation, low cost and high polymorphism. This technique has also been widely used in the analysis of genetic diversity, identification of germplasm resources and genetic relationship of orchids[17-18]. Therefore, this paper intends to use ISSR to analyze the genetic diversity and genetic relationship among 133 samples of 6 wild populations of medicinal plant H.dentata. The purpose is to provide an important theoretical basis for the screening of excellent germplasm resources and the determination of key protection units at the molecular level.
2. Materials and Methods
2.1. Test materials
Mature, clean, and fresh leaves free of pest and disease contamination were collected from September 1–10, 2021, from H.dentata. for each field population according to the population size and number of individuals at the collection site. The collected fresh leaves were placed in molecular sample bags and dried quickly with varicolored silica gel. The samples were sealed in sealed bags and brought back to the laboratory in a cool and dry place. The details of the sample collection sites and the number of individuals collected from each field populations are shown in Table 1 6 populations were distributed in areas with sufficient light and deep soil layers, among which only the Minqiang population (MQ) was distributed in the hilltop grasses. The Jianfeng Mountain population (JFS), the Zhu’eshang village population (ZES), and the Longji village population (LJ) were all located in the mountains or on the slopes of roadsides, where there was sufficient light and the terrain was conducive to drainage. Compared with the other population, the Leye population (LY) and the Mulun population (ML) have more fertile soils, with the LY and ML located on hillside roadsides and the ML on river valley grasses. See Figure 1 for details of some population photos.
2.2. Methodology
2.2.1. Extraction of total DNA
The washed forceps and disposable small steel beads were placed in a washed and uncontaminated mortar, poured into an appropriate amount of anhydrous ethanol, and ignited for sterilization. After the sterilized equipment was brought to room temperature, about 500 mg of the dried leaves of H.dentata were taken in a sterile 2 mL centrifuge tube with forceps, and then the appropriate amount of PVP and 3–4 small steel balls were added. The centrifuge tube was placed in a bead mill to crush the sample. Then the total DNA was extracted from H.dentata by the modified CTAB method[13]. The concentration and quality of the total DNA obtained were detected by 1.2% agarose gel electrophoresis and microUV spectrophotometry, and finally, the extracted DNA was stored at -20 °C.
2.2.2. Synthesis and screening of ISSR primers
The ISSR primers were synthesized according to the 100 universal primers published by Columbia University, Canada, and synthesized by Bioengineering (Shanghai) Co. In this experiment, 133 samples of genomic DNA (6 populations, 133 samples in total) were used to screen the 100 universal primers, from which 8 primers with good amplification effect, good polymorphism, and clear bands were selected for the genetic diversity analysis of wild populations of H.dentata[19] .
2.2.3. ISSR reaction system and procedure
Refer to the Orchidaceae ISSR reaction system[20] and improve it: 25 µL reaction system including 1 µL of primers at 10 µM concentration, 1 µL of template DNA, 0.6 µL of Taq enzyme, 2.5 µL of 10×Taq Buffer, 1.5 µL of Mg2+ at 25 mM concentration, and the remaining volume was made up with ddH2O. PCR reaction procedure: pre-denaturation at 95°C for 5 min, 40 (95℃ for 20 s, 52℃ for 20 s, 72℃ for 2 min), followed by extension at 72℃ for 20 min to obtain PCR amplification products. The amplification products were sampled on a 1.2% agarose gel, then electrophoresed for 40 min, and finally photographed and stored in a UV gel imaging system.
2.2.4. Data processing
Using the electrophoresis spectrum of the DL 2000 Marker as a reference, the bands were read manually according to the electrophoretic mobility of each band, and the ISSR-PCR amplification bands were recorded separately by Excel 2010. The bands that were clear were recorded as "1", and those that were absent or faint were recorded as "0". The bands that were clear were recorded as "1" and those that were absent and faint were recorded as "0", and a 1/0 matrix was established. The genetic diversity indices of the six populations of H.dentata were calculated using POPGene 32 software, and the genetic similarity coefficients were calculated using NTSYs 2.10 software. The six populations were clustered and analyzed to construct a tree clustering map[20]. Principal component analysis (PCA) was performed on the six populations using GenAlex 6.502. Cluster analysis was performed using SPSS 19.0 software.
3. Results
3.1. Detection of total DNA quality
A total of 133 samples from six wild populations were examined for DNA quality using an ultra-micro UV spectrophotometer, and the results showed that the quality of DNA basically ranged from 80-400 ng, and the OD260/280 ranged from 1.7-2.0. Both assays showed that the proposed total DNA had few impurities, and was of good quality, and could be used for subsequent genetic diversity tests.
3.2. Primer screening
3.3. ISSR genetic diversity analysis
3.3.1. Analysis of genetic diversity parameters
The number of bits obtained for the proliferation of each of the eight derivatives was between 4 and 8, and the size of the molecule mass was basically distributed between 250 bp-1000 bp, and the statistical results of six residential genetic variations are shown in Table 3. The table shows that at species level, the percentage of polymorphic loci (PPL) in H.dentata at the species level is 100%, the Shannon Information Diversity Index (I) is 0.493, the Nei’s genetic diversity index (He) is 0.324, the effective equivalence gene number (Ne) is 1.538, and the equivalent genetic number(Na) is 2.00. At population level, six population had no significant differences in the equation gene number (Na), effective equation genome number (Ne), Nei’s genetic diversity index (He), Shannon information diversity Index (I), or polymorphic localization percentage (PPL) (P>0.05), of which Na and Ne did not indicate any significant difference, and the equation genes of six wild populations were evenly distributed across the group.
The percent polymorphic loci (PPL) of the six wild populations ranged from 69.23-84.62%, with a mean value of 76.497%, with the highest number of polymorphic loci in the Mulun population (ML) and the lowest in the Jianfeng Mountain population (JFS) and Minqiang population (MQ). The number of alleles (Na) ranged from 1.692 to 1.846, with a mean value of 1.765. The highest number of alleles was found in the Mulun population (ML), while the lowest number of alleles was found in the pointed Jianfeng Mountain population (JFS) and the Minqiang population (MQ). The effective number of alleles (Ne ) ranged from 1.353 to 1.506, with a mean value of 1.424, of which ML had the highest effective number of alleles and JFS had the lowest. The Shannon's information diversity index (I) ranged from 0.321-0.436 with a mean value of 0.381, with the highest diversity index for the Mulun population (ML) and the lowest for the JFS. The highest genetic diversity was found in the Mulun population (ML) and the lowest in the Jianfeng Mountain population (JFS).
3.3.2. Population genetic structure analysis
Nei's analysis of the genetic diversity of the populations of H.dentata. is shown in Table 4. From the table, the total genetic diversity (Ht) is 0.326 ± 0.019, the intra-population genetic diversity (Hs) is 0.252 ± 0.010, and the inter-population genetic diversity (Ht -Hs ) is 0.074. It can be concluded that in the six wild populations of H.dentata., the genetic diversity between populations (Ht -Hs) was 0.073 8, thus it can be concluded that in the six wild populations of H.dentata., the intra-population variation was 77.34% (Hs/Ht) and the inter-population variation was 22.66% (Ht-Hs/Ht), indicating that the genetic variation of H.dentata. occurred mainly within the populations. The gene flow (Nm) was 1.706>1, indicating that gene flow between populations is more frequent and less prone to genetic differentiation. Further AMOVA analysis of genetic variation in the six populations was performed, and the results are presented in Table 5. It is evident from the table that 27% of the genetic variation occurred between populations and 73% occurred within populations. The Nei's analysis of genetic diversity and the AMOVA analysis were in general agreement, which together indicated that the genetic variation of H.dentata. occurred mainly within populations, and that there was little genetic differentiation between populations.
3.3.3. Genetic distance and clustering analysis of H.dentata.
As shown in Figure 3, the genetic distances of the Jianfeng Mountain population (JFS) and the Leye population (LY) were the smallest, and the genetic distances of ZES and MQ were the largest. The genetic concordance of ZES and MQ was the smallest, and the genetic concordance of ZES and LY was the largest.
3.3.4. Cluster analysis of wild populations
As shown in Figure 4, the six H.dentata. populations were mainly divided into four branches, with the Mulun population (ML) and Jianfeng Mountain population (JFS) clustering into one category first, the Leye population (LY) and Zhu’eshang Village population (ZES) clustering into another category, and these two populations clustering with the Minqiang population (MQ) and finally with the Longji population (LJ). In order to investigate whether geographical location could influence the genetic distance between populations, further testing by the Mantel Test showed that there was no significant correlation between geographical location and the genetic distance between populations (r=0.557, P>0.05).
3.3.5. Principal component analysis of the populations
The genetic distances among 133 individuals of the six populations were analyzed by principal component analysis, and PCA plots were constructed for individuals of the six H.dentata. populations, details of which are shown in Figure 5. As can be seen from the figure, the difference represented by the horizontal axis (PC-1) was 13.31% and the difference represented by the vertical axis (PC-2) was 24.54%. The Longji population (LJ) was mainly distributed above the boundary line, and most of the individuals in its population were distant from the individuals of other populations. The Minqiang population (MQ) is mostly distributed to the left of the line of demarcation, and most of its individuals are also distant from other clusters. The majority of the individuals in the Leye (LY) and Zhu’eshang Village (ZES) populations were closer together and converged on the right side of the line of demarcation. The majority of the individuals of the Mulun (ML) and Jianfeng Mountain (JFS) populations were distributed below the boundary line, and the individuals of the two clusters were closer to each other. The results of principal component analysis were similar to those of the UPGMA clustering map.
4. Discussion
As one of the largest families of angiosperms, Orchidaceae is a highly evolved group of angiosperms with a distribution in all terrestrial ecosystems of the world except in polar regions and deserts[21]. However, because most orchids require specific mycorrhizal fungi for survival and seed germination[22-23] and more demanding growth environments, they have a narrower distribution and are vulnerable to external environmental influences[24] . In addition, many orchids also have high ornamental[25] and medicinal values[26], and their wild plant resources are often destroyed, reducing the variety and number of species are greatly affected. In Guangxi Zhuang Autonomous Region, there are 510 species of orchids in the wild, accounting for 31.88% of the total number of orchid species in China[27] . In the face of such a large population and an increasingly serious living environment, the screening of excellent germplasm resources is particularly important for the conservation of orchids. In general, the higher the genetic diversity of a population, the better its germplasm resources[28], the less the individuals in the population are affected by other external factors, the more adaptable they are to the environment, and the faster the expansion of the population. On the contrary, populations or species with lower genetic diversity are less adaptable to the environment and more likely to be endangered[29]. Populations with high genetic diversity can be used as raw materials for the selection and breeding of good species, which is especially important for the conservation of endangered species. At present, ISSR molecular marker technology is widely used in the research of genetic diversity and the phylogenetic analysis of orchids. The level of genetic diversity of species is often evaluated by the three parameters of percent polymorphic loci (PPL), Nei's genetic diversity index (H), and Shannon's information diversity index (I). Huang Jinchun et al.[30] used ISSR molecular marker technology to study the genetic diversity of germplasm resources of goldenrod, Anoectochilus roxburghii, produced in Zhejiang and Fujian from 43 seed sources, and the results of the study indicated that the PPL of goldenrod at the species level was 96.51%, I was 0.424 7, and H was 0.272 7. Li Zongyan et al.[31] examined seven sclerophyllous dourans. The genetic diversity analysis of seven populations of Paphiopedilum micranthum indicated that at the species level, the PPL of the seven populations was 96.04%, I was 0.488 9 and H was 0.324 4. Jiang Yawen et al.[32] selected 12 populations of Cymbidium kanran in the wild using ISSR molecular marker technology. The genetic information results pointed out that the genetic diversity of all 12 wild populations was high at the species level, and the genetic diversity of the 12 wild populations was high, with PPL of 78.90%, I of 0.399, and a H of 0.264 9 for the 12 populations. In this study, the ISSR molecular marker technique was used for the first time to analyze the genetic diversity of six wild populations of Cymbidium kanran in Guangxi Zhuang Autonomous Region, and the results showed that the genetic diversity of PPL was 100%, I was 0.493 3, and H was 0.324 3 at the species level, which showed that the genetic diversity of Habenaria dentata was higher than that of Anoectochilus roxburghii., Paphiopedilum micranthum. and Cymbidium kanran. In this study, the highest genetic diversity at the population level was found in the Mulun population (ML), and it is recommended that such populations be used as key conservation units and raw materials for the selection and breeding of good species.
According to population genetics, the genetic differentiation of populations can be divided into three levels according to the size of gene flow (Nm), with Nm >1 being high level, 0.25-0.99 being medium level, and 0-0.249 being low level[33-34] . In the case of high levels of gene flow, genetic differentiation due to genetic drift is small, and in the case of medium and low levels due to less gene exchange between populations, genetic drift is easily generated and leads to increased genetic differentiation. Referring to this criterion, the gene flow (Nm) of H.dentata. was 1.705 8>1, which is a high level, proving that H.dentata. populations have more frequent gene exchange and are less likely to produce genetic differentiation among populations. Furthermore, the genetic differentiation coefficient (Gst ) of the six wild populations of H.dentata. was 0.226 6, indicating that only 22.66% of the variation among populations and 77.34% of the genetic variation was generated within populations. The AMOVA analysis also showed that only 27% of the genetic variation occurred among populations and 73% of the genetic variation occurred within populations. A study by[35] showed that the genetic differentiation coefficient was 0.59 for self-incompatible taxa, 0.23 for heterozygous taxa, and 0.19 for mixed taxa, so it can be judged that H.dentata. is probably a heterozygous or mixed taxon plant.
Nowadays, it is increasingly believed that genetic distances between different populations of the same species do not necessarily lead to genetic variation, and that factors such as genetic mutations, selection, and gene flow are the main causes of genetic differentiation between populations[36]. Qin Huizhen et al.[37] used ISSR molecular marker technology to analyze the genetic diversity of a very small population of Paphiopedilum emersonii and cluster eight wild populations of white Paphiopedilum emersonii based on genetic distance, and the results showed that the clustered geographically close Mulun Lanhua Mountain population and Village populations of Yongkang Township, Libo City population did not strictly follow the geographic distribution of populations. Based on the cluster analysis of the genetic distance of the six populations and the results of the principal component analysis of all the individuals, it can be seen that the six populations are not clustered strictly according to geographical location, and all the individuals are clustered according to individual differences and not according to their natural populations. The results of the cluster analysis also showed that the two closest populations in Longji Village and Zhu’eshang Village in Jingxi City were not clustered together. The results of the Mantel Test on the genetic distance of the six clusters also showed that there was no significant correlation between the genetic distance of geographical location and clusters (r=0.557, P>0.05). Therefore, this paper suggests that even though there is frequent genetic exchange between populations in close proximity, strong genetic mutations and selection can lead to genetic differentiation between populations.
Author Contributions
Conceptualization, X.W.; methodology, R.Z.; validation, J,T.; formal analysis,Y,Y. and R.Z.; investigation, F,C and Z,D. (sampling), Y,L and D,L (sequencing), J.T. (data analysis); writing—original draft preparation,Y,Y.; writing—review and editing, Y,Y.; visualization, X.W. and J,T; supervision, J.T and R,Z.; funding acquisition, X.W. All co-authors have reviewed and approved the final version of the manuscript for publication.
Funding
This study was supported by the projects of National key research and development program (No. 2022YFF1300700), Chinese Academy of Sciences ‘Light of West China’ Program (2022). Guangxi Forestry Science and Technology Promotion Demonstration Project (2023LYKJ03 and [2022]GT23); Guangxi Key Laboratory of Plant Functional Phytochemicals Research and Sustainable Utilization Independent project (No. ZRJJ2022-2). Guilin Innovation Platform and Talent Plan (20210102-3). Guilin City Technology Application and Promotion Plan(20220134-3)
Institutional Review Board Statement
Not applicable
Informed Consent Statement
Not applicable
Data Availability Statement
All data cited in the study are publicly available.
Conflicts of Interest
The authors declare no conflict of interest.
References
- Azani, N. ; Babi[1]Luo Yajin, Tang Jianmin, Jiang Qiang, et al. Progress in Conservation Studies of Orchids in Plant in Guangxi Yachang Reserve[J]. Journal of Guangxi Academy of Sciences, 2020(1): 5-16.
- Editorial Committee of Flora of China, Chinese Academy of Sciences. Flora of China[M]. Beijing: Science Press, 1999, (17), 472.
- Jiangxi Provincial Health Bureau Revolutionary Committee. Jiangxi herbal medicine[M]. Nanchang: Xinhua Bookstore Jiangxi Province, 1970: 420-421.
- Liu Yitao, Long Chunlin, Dao Zhiling, et al. Ethnobotanical survey on medicinal roots eaten by the local people in Simao, Yunnan Province, during the Dragon-boat Festival [J]. Journal of Plant Resources and Environment, 2003, (2): 33-38. [CrossRef]
- Kunming Municipal Health Bureau. Commonly used folk herbal medicine in Kunming[M]. Kunming: Kunming Municipal Health Bureau, 1970: 392.
- Compilation group of ' National Chinese Herbal Medicine Compilation ' : National Chinese Herbal Medicine Compilation ( Vol II ) [M]. Beijing: People's health publishing Press, 1975.
- Wu Fuqin, Ma Licui, Zheng Jinxuan, et al. Diversity of Medicinal Vascular Plant Resources from Wetland in Yunnan Province[J], 2021, 40(9): 75-80. [CrossRef]
- Chen Yaya, Mao Tangfen, Li Qike et al. Tissue Culture and Plantlet Regeneration of Habenaria dentata[J]. Plant Physiology Letters, 2007, 244 (6): 1136.
- Shao, Li. Effects of different cytokinins on one-step seedling formation of aseptic seedlings of Habenaria dentata[J]. Contemporary Horticulture, 2022, 45(13): 15-17.
- Chen Yaya, Zhu Guosheng, Mao Tangfen et al. A Preliminary Study on Habenaria dentate Endophytic Fungi[J]. Guizhou Agricultural Sciences, 2008, 218 (3): 12-13,3.
- Chen Yaya, Yang Lin, Zhu Guosheng, et al. ISolation and Identification of Mycorhiza Fungi on Habenaria dentate[J]. Guizhou Agricultural Sciences, 2010, 38 (8): 84-86.
- Chen Yaya, Zhu Guosheng, Mao Tangfen et al. The Research on Habenaria dentate Mycorrhizal Fungi Acclerating the Growth of Habenaria dentate in vitro Seedling[J]. Guizhou Agricultural Sciences, 2009, 37 (12): 33-34, 39.
- Wang Caiyun, Hou Jun, Zhou Maochang, et al. Study in genetic diversity of Gastrodia elata[J]. Hubei Agricultural Sciences, 2022, 61(18): 131-138.
- Ge Song, Hong Deyuan. Genetic diversity and its detection methods[A]. Qian Yingqian, Ma Keping. Principles and Methods of Biological Genetic Diversity Research[M]. Beijing: Science Press, 1994, 123-140.
- Qiu Guojun, Cheng Min, Guo Jihua. Application of ISSR Molecular Marker Technology in Plants and Its Research Progress[J]. Journal of Minzu Normal University of Xingyi, 2020,(01):117-120.
- Luo Mingxin, Liu Fengmin, Zhang Weili, et al. Application of SRAP and CDDP Markers in Genetic Diversity Analysis of Morinda officinalis How.[J]. Molecular Plant Breeding, 2021, 19(11): 3661-3669. [CrossRef]
- Yang Shuting, Ma Xiaona, Bai Xiaolin,et al. CDDP genetic diversity analysis of a very small population of wild plant Cypripedium palangshanense[J]. Journal of Sichuan University(Natural Science Edition), 2022,59(06):155-163. [CrossRef]
- Elena E K, Irina Y G N,Vladimir V Z. Using ISSR-Markers for Genetic Diversity of some Representatives of Orchidaceae[J]. Biosciences Biotechnology Research Asia, 2016, 13(1). [CrossRef]
- Sun Feifei. Research on Genetic Diversity and Development and Utilization of Germplasm Resource of Medicinal Plant Tetrapanax papyrifer[D]. Guilin: Guilin Medical University.
- Lu Jiashi, Bu Chaoyang, Lv Weili, et al. Analysis on Genetic Diversity of 20 Plants of Orchidaceae by ISSR Molecular Marker[J]. Southwest China Journal of Agricultural Sciences, 2012, 25(6): 2252-2257.
- Zhang Qing, Wang Hanchen, Cheng Zhuo, et al. Current Status of Wild Orchid Resource in China, Focusing on Their Conservation and Utilization[J]. China Biotechnology, 2022, 42(11): 59-72. [CrossRef]
- Zhao Zeyu, Liu Na, Xing Xiaoke. Research advances in mechanisms of interaction between mycorrhizal fungi and Orchidaceae plants by using omics techniques[J]. Mycosystema,, 2021, 40(3): 423-435.
- Tang Yanjing, Guo Shunxing, Chen Juan. Advances in the specificity of Orchid-mycorrhizal fungi[J]. Journal of Capital Normal University(Natural Science Edition),2021, 42(3): 63-74.
- Zhang Z, Yan Y, Tian Y, et al. Distribution and conservation of orchid species richness in China[J]. Biological Conservation, 2015, 181: 64-72. [CrossRef]
- Su Ziying, Li Yue, Zhang Xiying, et al. Ornamental Evaluation of Endemic Orchids from Guangdong Province[J]. Chinese Journal of Tropical Crops, 2020, 41(8): 1560-1565. [CrossRef]
- Tang Huan. DNA barcoding identification and ecological suitability of important medicinal plants of Orchidaceae[D].Yaan: Sichuan Agricultural University.
- Wei Xiao, Tang Jianmin,Chai Shengfeng. Study on the Current Situation and Sustainable Development Strategy of Orchidaceas Resources in Guangxi[J]. Journal of Guangxi Academy of Sciences, 2022, 38(2): 99-107, 117.
- Wang Tiejuan, Li Weiqiong, Zhang Shuyan, et al. Genetic Diversity and Differentiation of Five Natural Populations of Artemisia halodendron[J]. Scientia Silvae Sinicae, 2010, 46(12): 171-175.
- Hutchison D W, Templeton A R. Correlation of pairwise genetic and geographic distance measures: inferring the relative influences of gene flow and drift on the distribution of genetic variability[J]. Evolution, 1999, 53(6): 1898-1914. [CrossRef]
- Huang Jinchun, Wan Siqi, Chen Yang, et al. Genetic diversity of Anoectochilus roxburghii based on ISSR and SRAP molecular markers[J]. Journal of Zhejiang A & F University, 2023, 40(1): 22-29. [CrossRef]
- Li Zongyan, Guan Mingyuan, Li Jing, et al. Genetic Diversity of Paphiopedilum micranthum Detected by ISSR Data[J]. Acta Botanica Boreali-Occidentalia Sinica,, 2016, 36(7): 1351-1356.
- Jiang Yawen, Sun Xiaoqin, Luo Huolin, et al. Studies on Genetic Diversity of Cymbidium kanran Populations from the Main Mountains in Jiangxi Province Based on ISSR Marker[J]. Acta Horticulturae Sinica, 2017, 44(10): 1993-2000. [CrossRef]
- Govindaraju D, R. Relationship between dispersal ability and levels of gene flow in plants[J]. Oikos, 1988: 31-35. [CrossRef]
- Wright, S. Evolution in Mendelian populations[J]. Genetics, 1931, 16(2): 97-159. [CrossRef]
- Nybom H, Bartish I V. Effects of life history traits and sampling strategies on genetic diversity estimates obtained with RAPD markers in plants[J]. Perspectives in Plant Ecology, Evolution and Systematics, 2000, 3(2): 93-114. [CrossRef]
- Fischer M, Matthies D. RAPD variation in relation to population size and plant fitness in the rare Gentianella germanica (Gentianaceae) [J]. American Journal of Botany, 1998, 85(6): 811-819. [CrossRef]
- Qin Huizhen, Pan Bo, Zhao Jian, et al. Genetic Diversity Analysis by ISSR of Paphiopedilum emersonill, a plant Species with Extremely Small Population[J]. Guangxi Sciences, 2022, 29(6): 1134-1140.
Figure 1.
Partial population photos of H.dentata. A: JFS population (Mountain slope) , B: MQ population (Hilltop grass) , C: LY population (Roadside grass).
Figure 1.
Partial population photos of H.dentata. A: JFS population (Mountain slope) , B: MQ population (Hilltop grass) , C: LY population (Roadside grass).
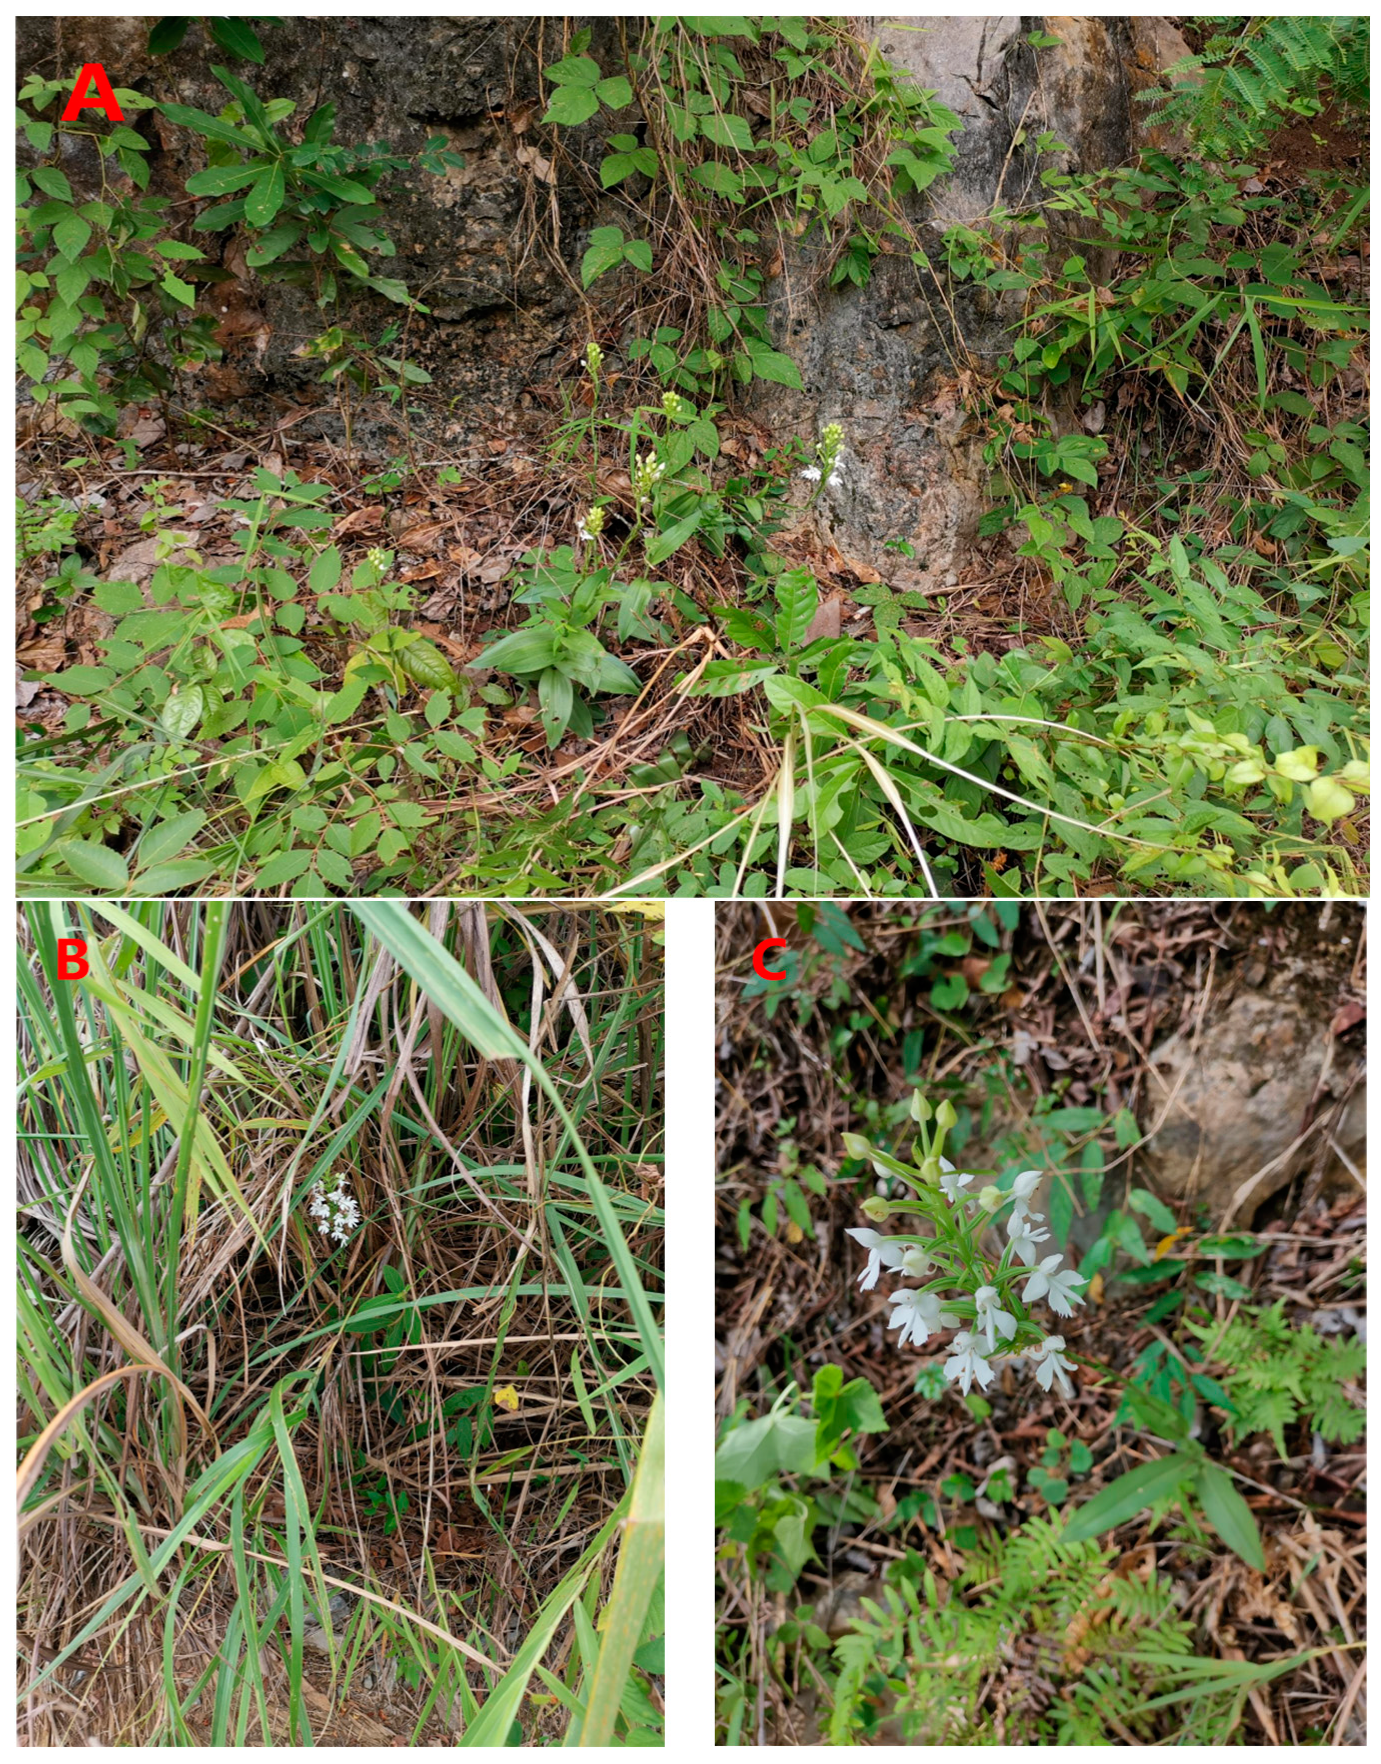
Figure 2.
Amplification map of primer U808 and U844 for 18 samples from 8 population.
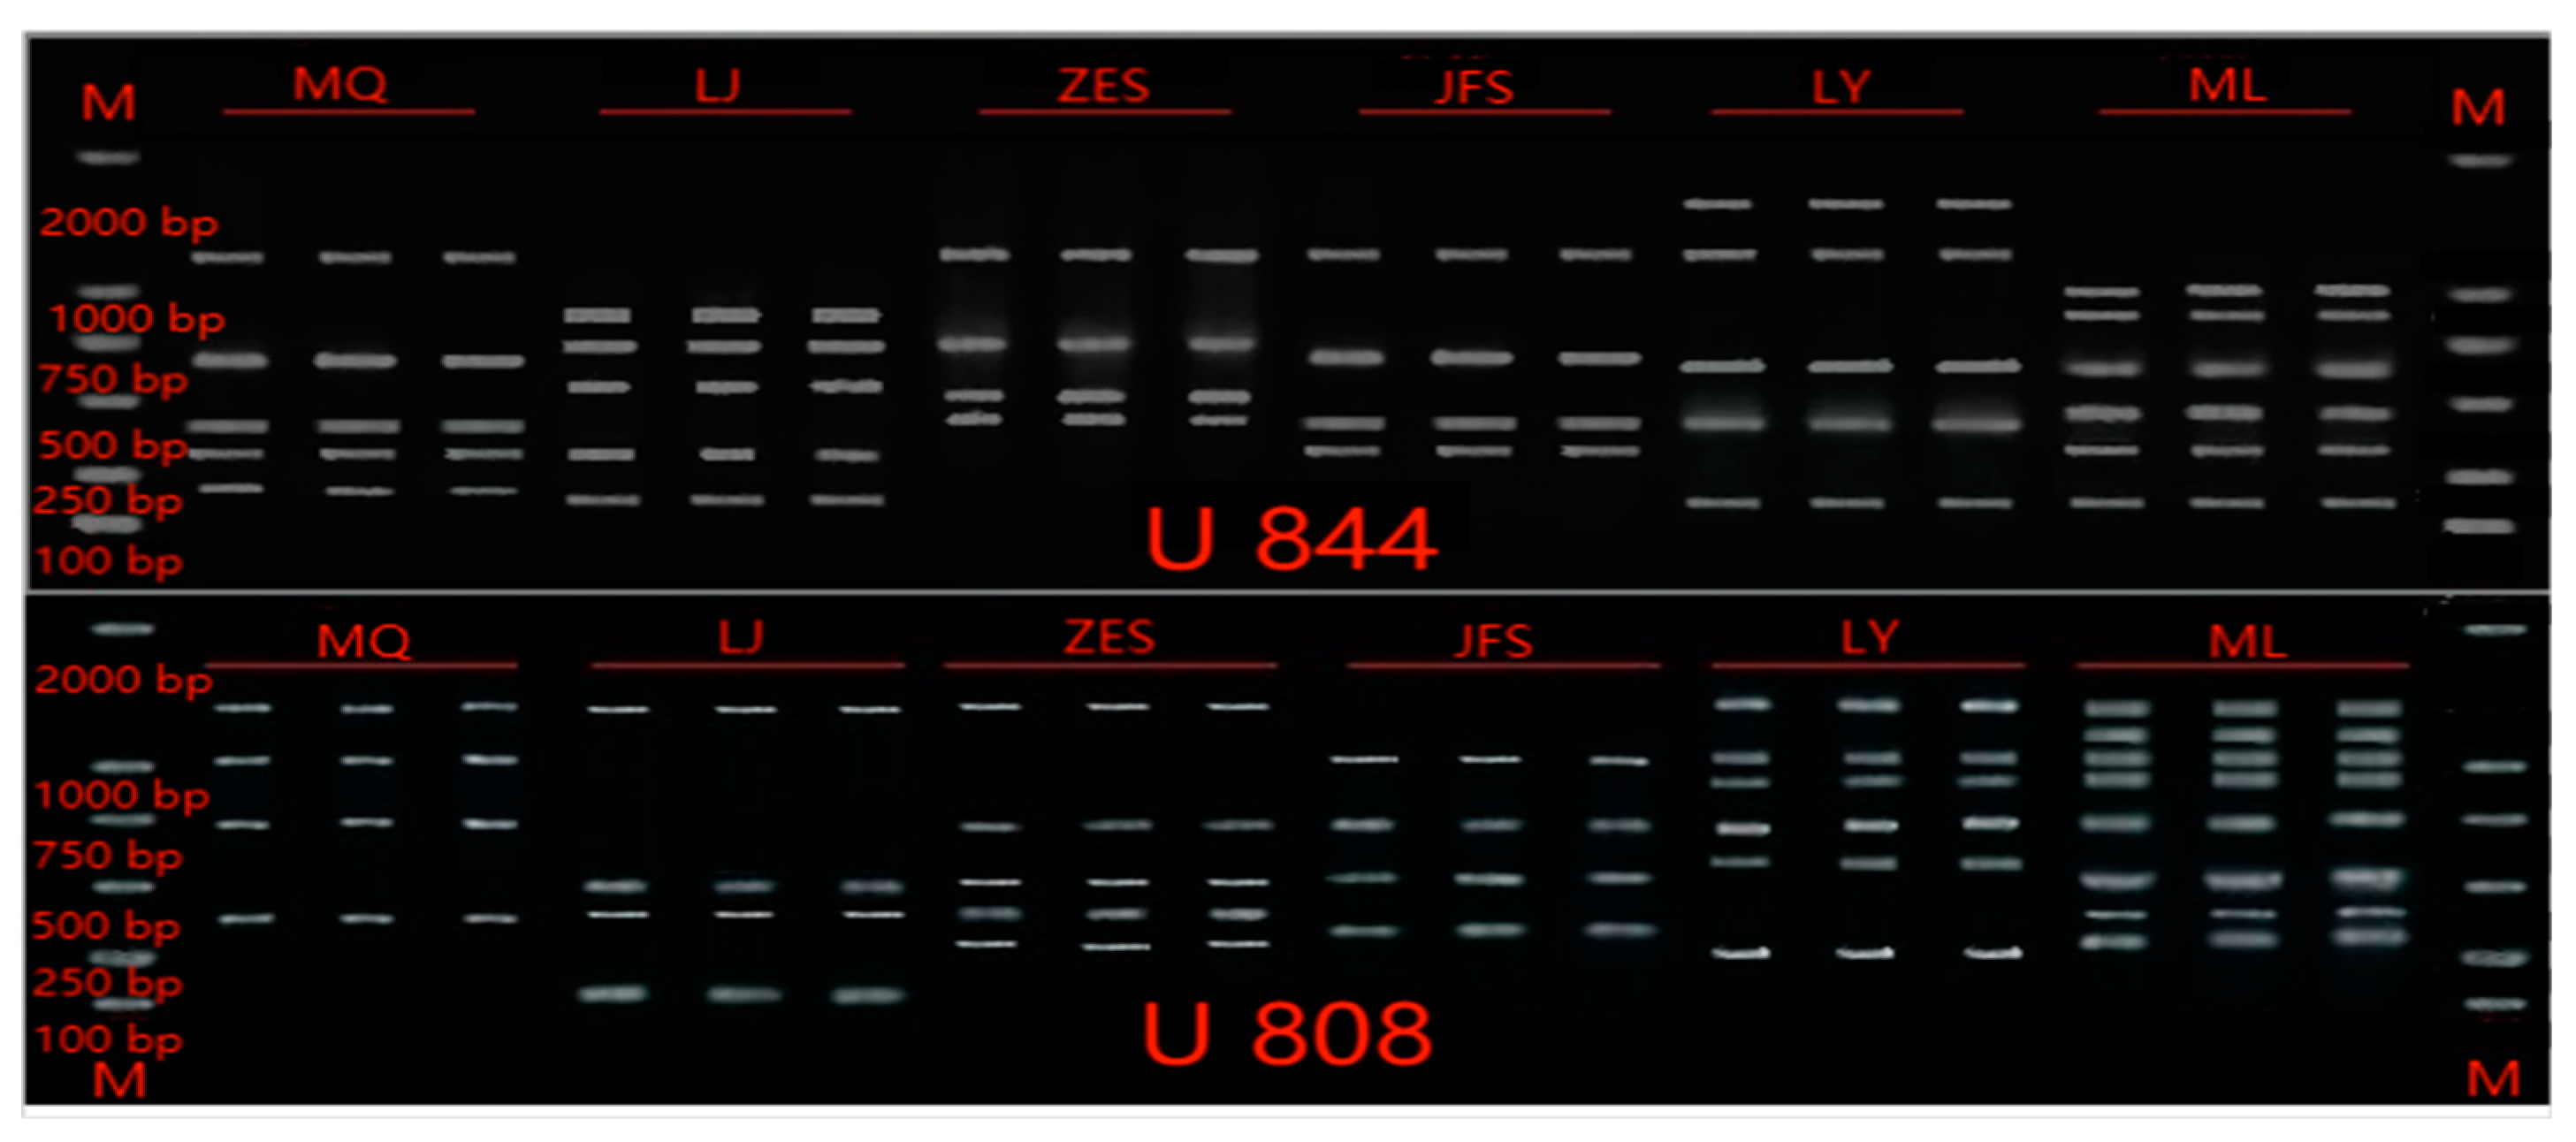
Figure 3.
Nei's genetic identity (above diagonal) and genetic distance (below diagonal) between population of the H.dentata.
Figure 3.
Nei's genetic identity (above diagonal) and genetic distance (below diagonal) between population of the H.dentata.
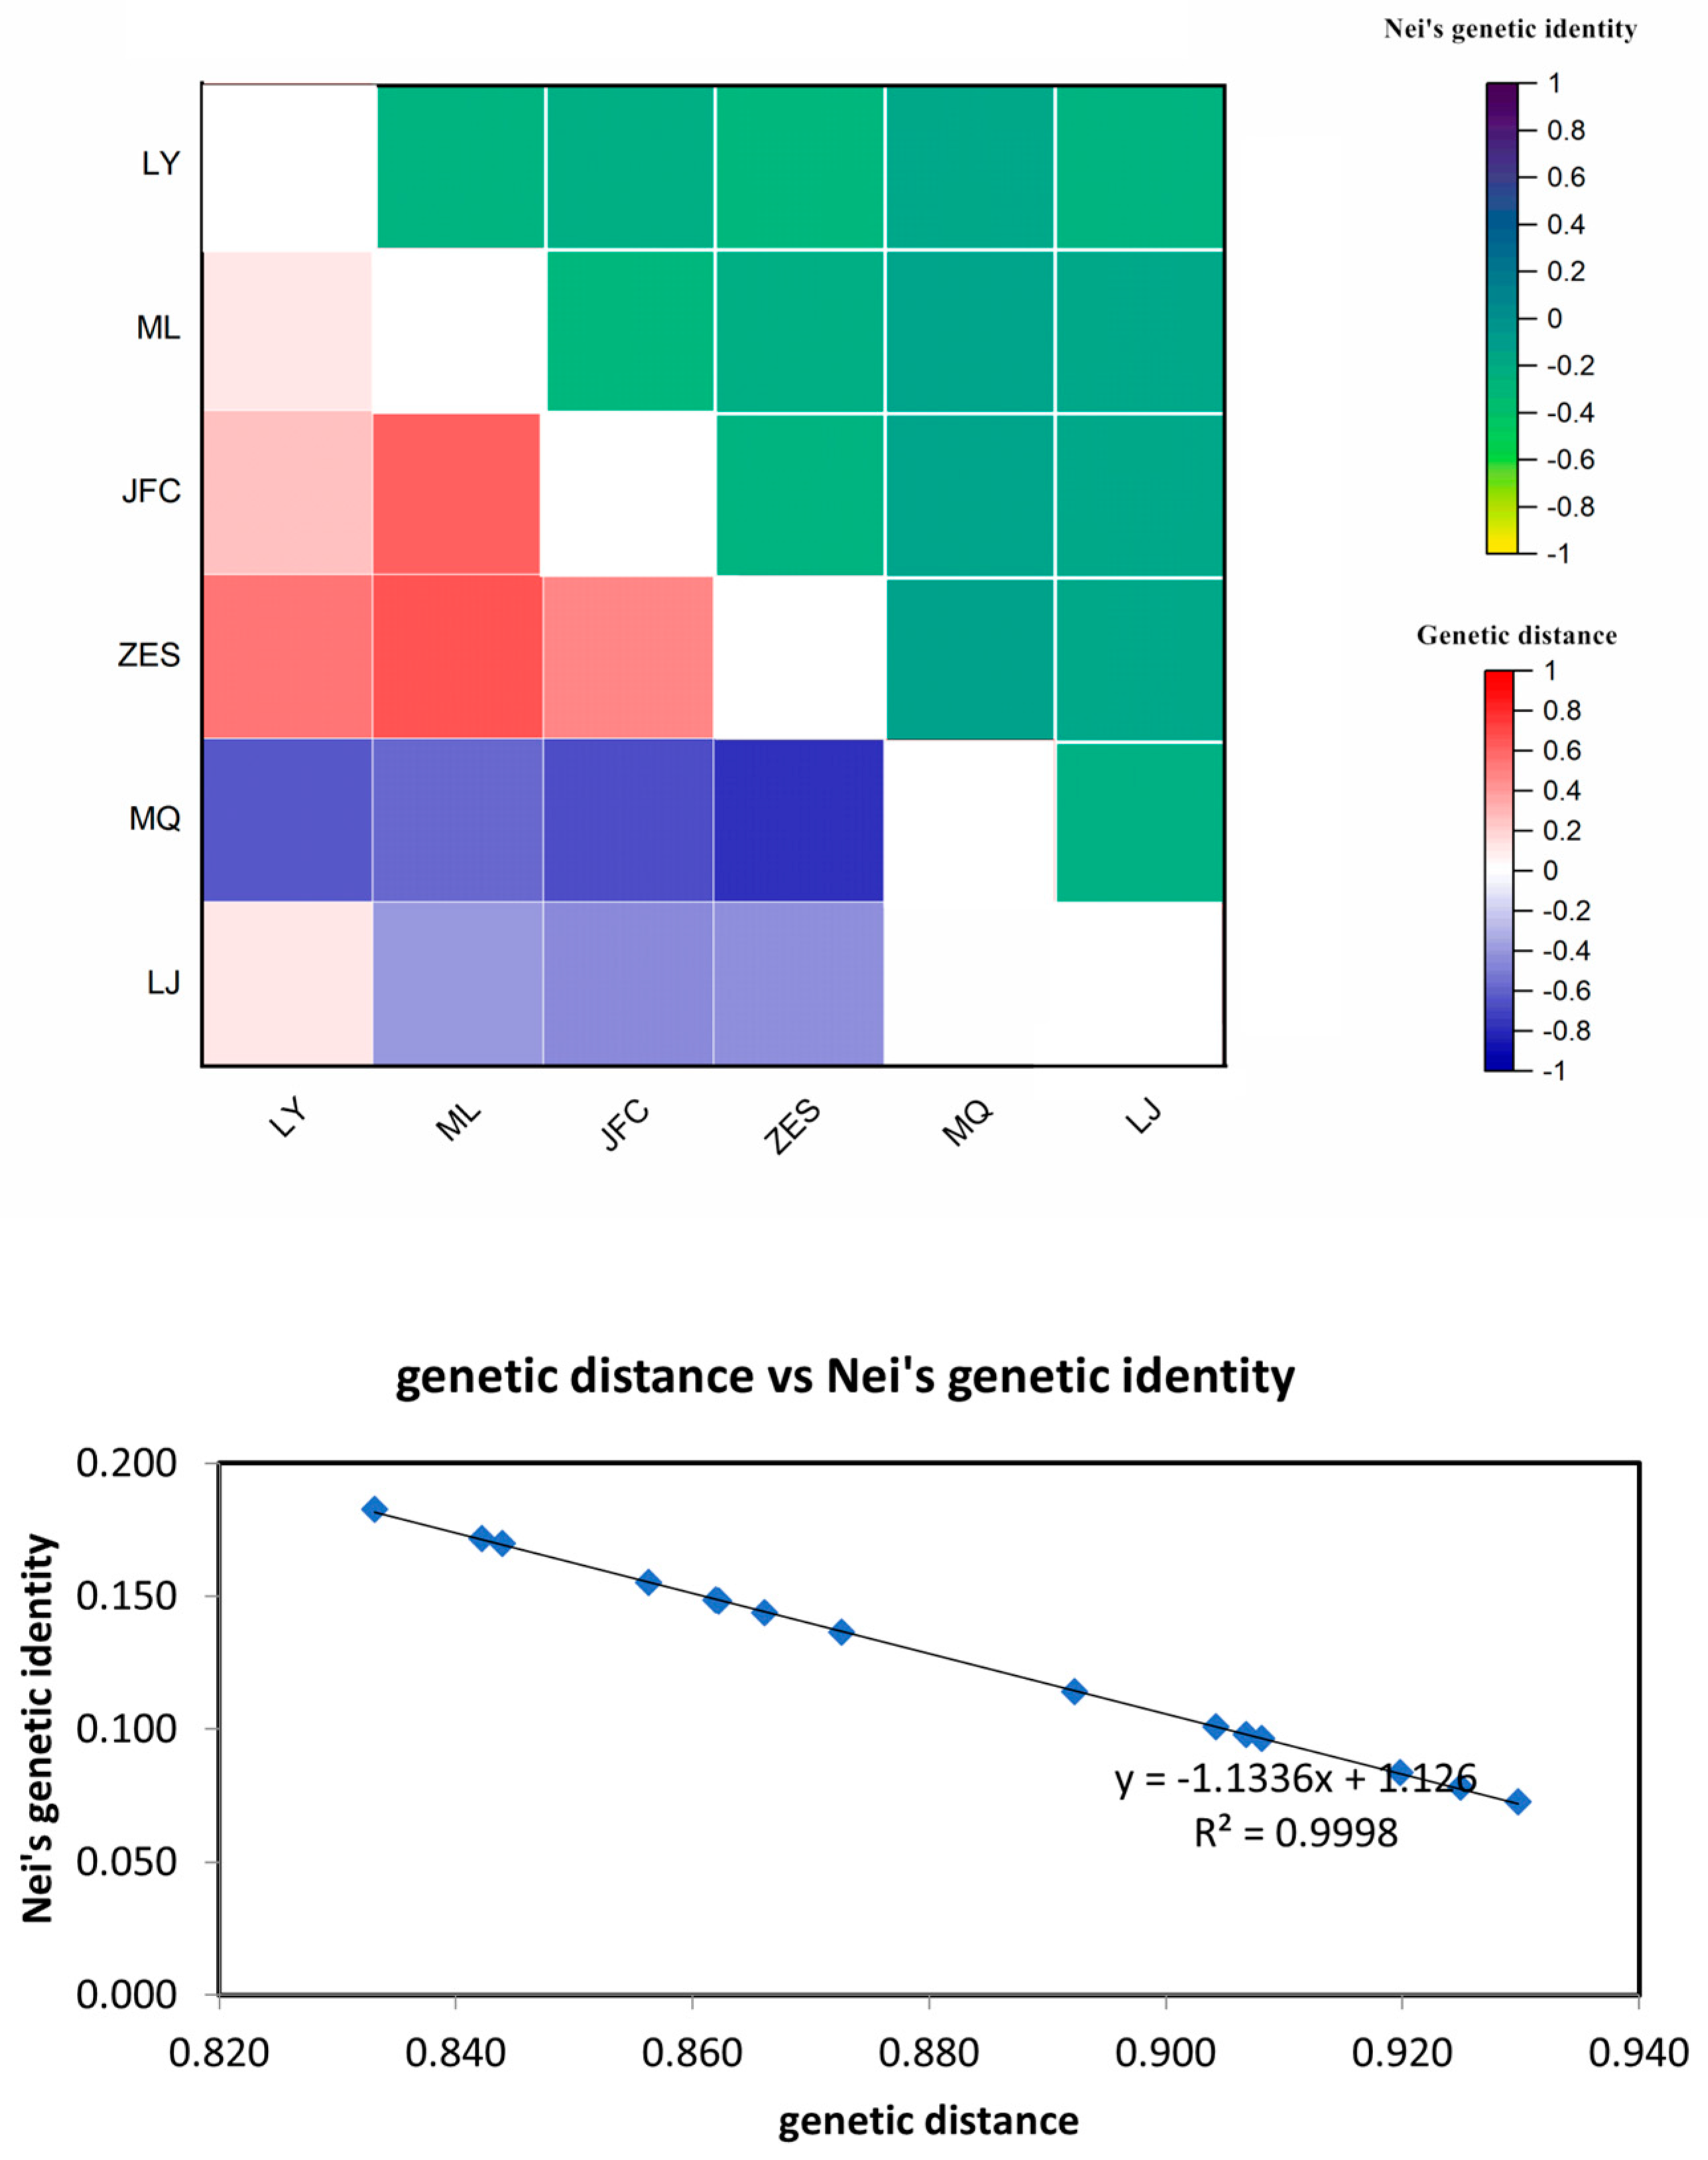
Figure 4.
Dendrogram of UPGMA cluster analysis based on Nei's genetic distance between 6 populations of the H.dentata.
Figure 4.
Dendrogram of UPGMA cluster analysis based on Nei's genetic distance between 6 populations of the H.dentata.

Figure 5.
PCA on the individuals of 6 population of the H.dentata.
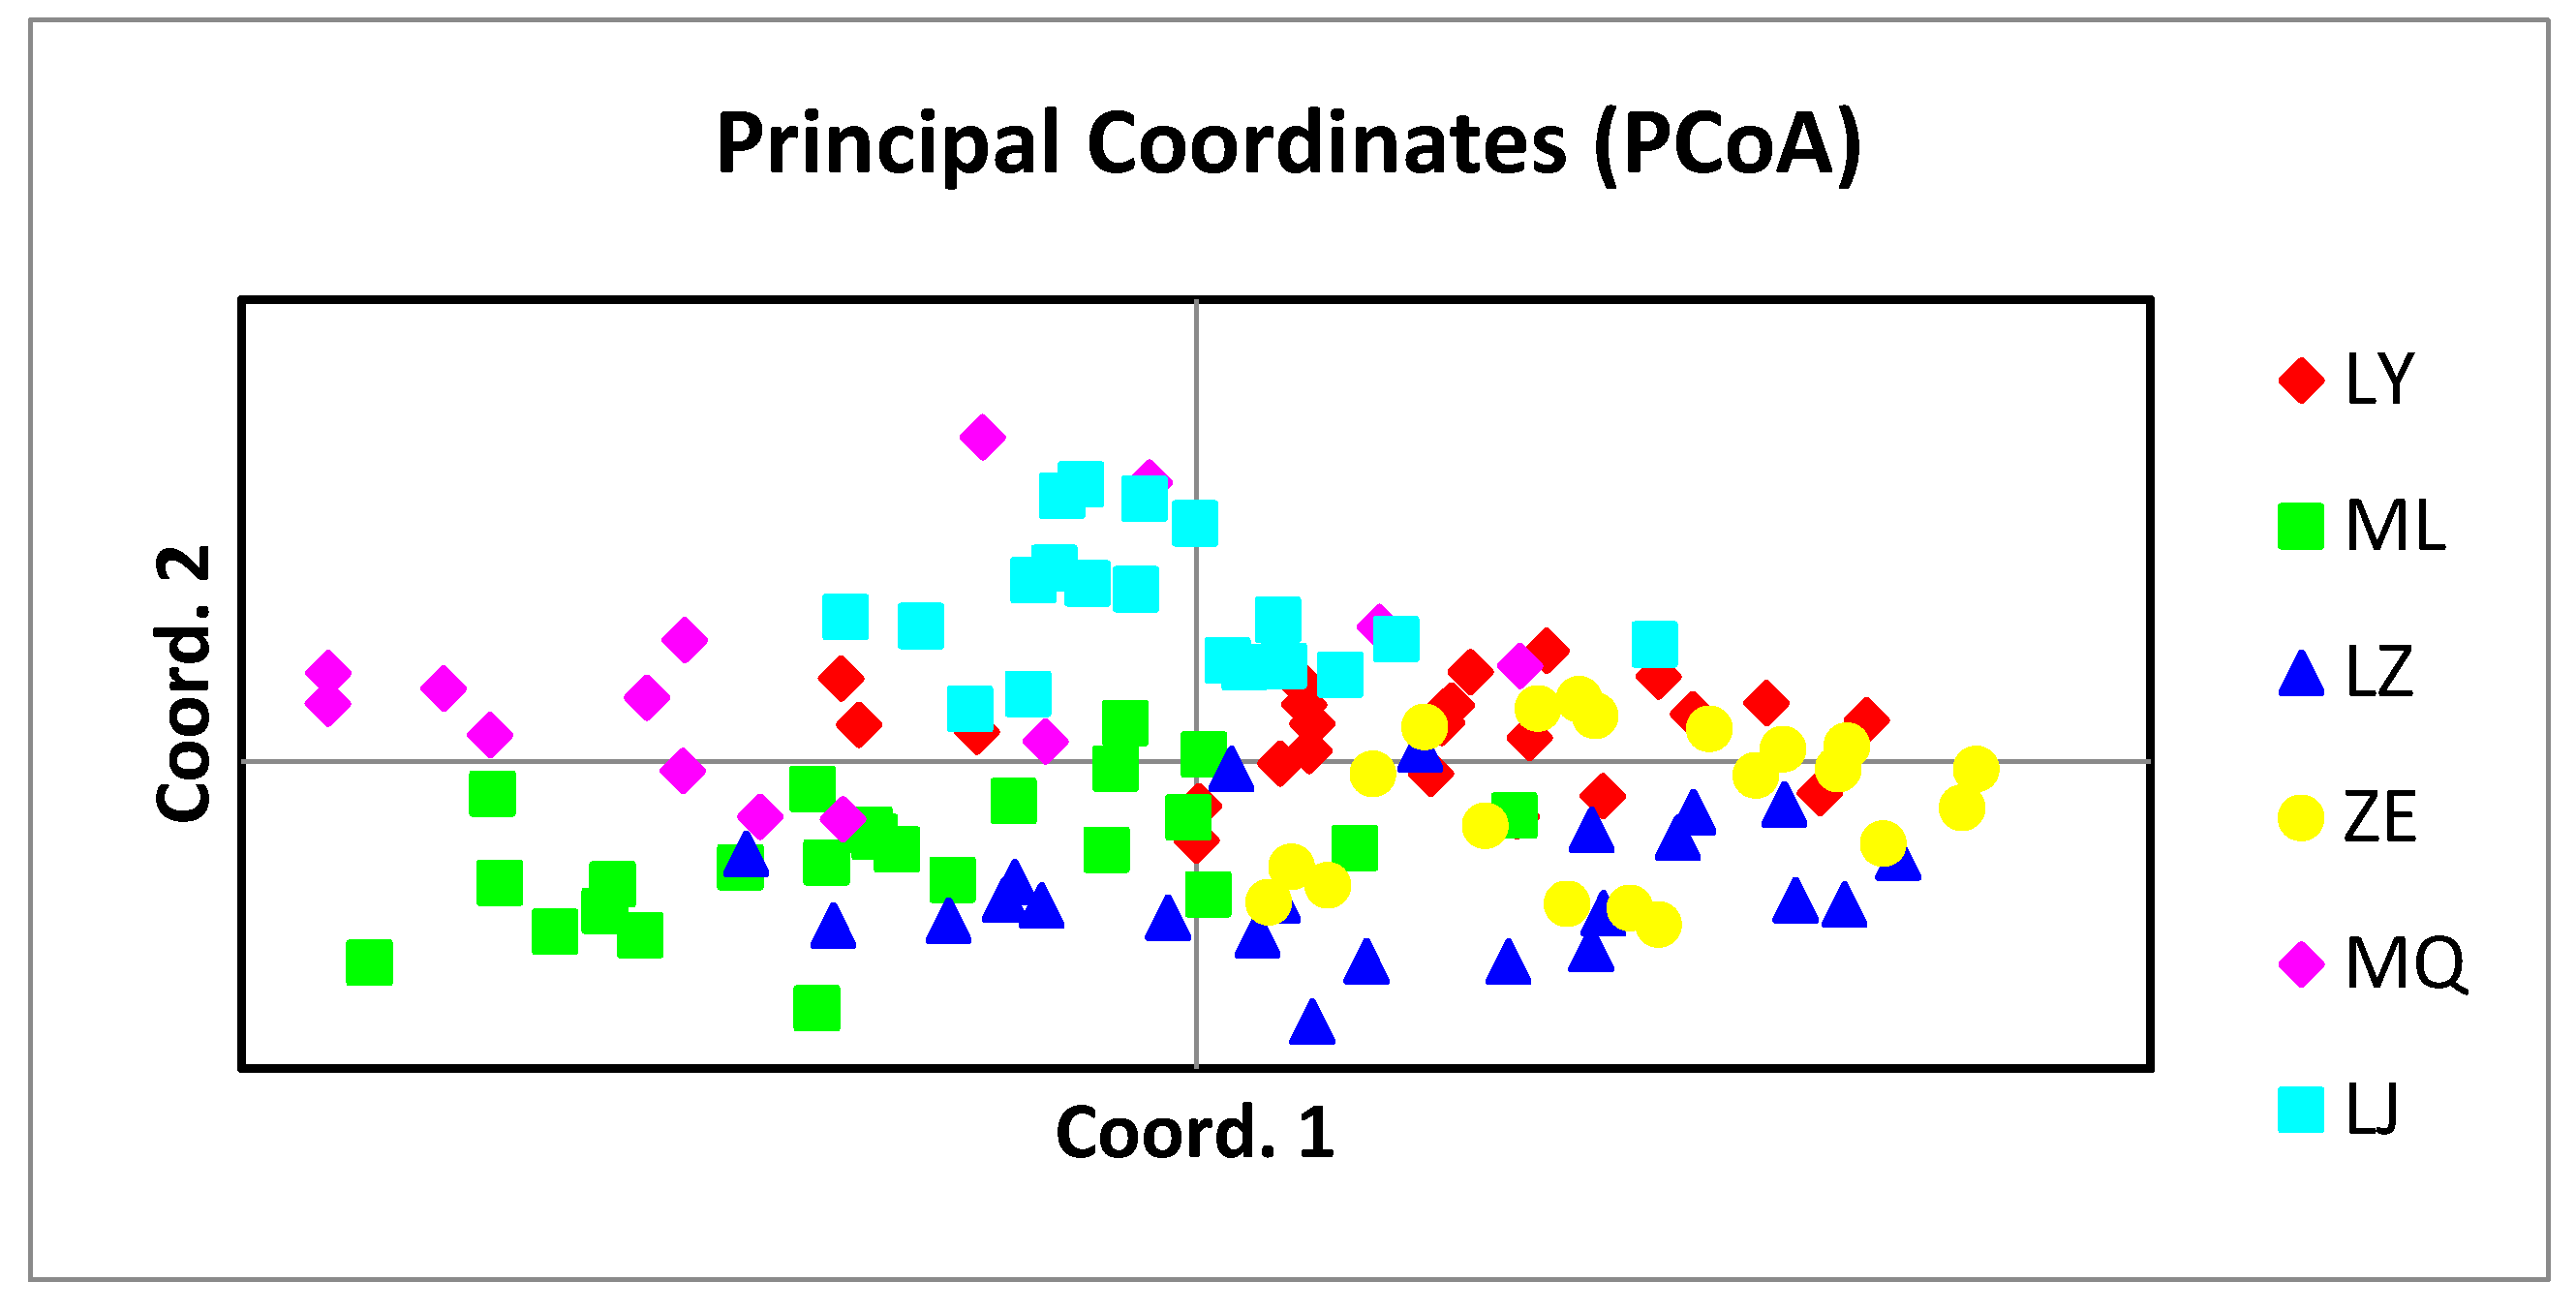

Table 1.
Information on the collection place of Habenaria dentata.
| Area | North latitude | East latitude | Number of samples | Biotope |
| Minqiang Village, Shanglong Township, Longzhou County, Chongzuo City (MQ) | 22°25′23″ | 106°54′43″ | 22 | Hilltop Grass |
| Jianfeng Mountain, Xinzhuangxiong Village, Jiangzhou District, Chongzuo City (JFS) | 22°29′30″ | 106°55′2″ | 23 | Mountain slopes |
| Jingxi City, Lu Dong Township, by the curse on the village (ZES) | 23°8′00″ | 106°19′45″ | 20 | Roadside slopes |
| Longji Village, Luodong Township, Jingxi City (LJ) | 23°8′22″ | 106°21′26″ | 20 | Roadside slopes |
| Huaping Village, Huaping Township, Leye County, Baise City (LY) | 24°50′55″ | 106°21′50″ | 24 | Roadside grasses |
| Huanjiang Maonan Autonomous County, Hechi City, Chuanshan Town, Xizaitun Mu Lun Nature Reserve (ML) | 24°55′33″ | 106°33′42″ | 24 | Grass by the river |
Table 2.
Amplification results of the eight ISSR primers.
| Primer | Sequence(5'-3') | Annealing temperature(℃) | Number of total amplified bands | Number of polymorphic bands | Percentage of polymorphic(%) |
| U808 | AGAGAGAGAGAGAGAGGC | 48.7 | 8 | 8 | 100% |
| U823 | TCTCTCTCTCTCTCTCTCC | 48.0 | 5 | 4 | 80.0% |
| U844 | CTCTCTCTCTCTCTCTCTRC | 48.6 | 6 | 6 | 100% |
| U855 | ACACACACACACACACACACYT | 52.7 | 7 | 5 | 71.4% |
| U876 | GATAGATAGACAGACA | 38.4 | 6 | 4 | 66.7% |
| U878 | GGATGGATGGATGGAT | 47.0 | 7 | 6 | 85.7% |
| U880 | GGAGAGGAGAGGAGA | 47.9 | 6 | 5 | 83.3% |
| U885 | BHBGAGAGAGAGAGAGAGA | 48.0 | 5 | 4 | 80.0% |
Table 3.
Genetic variation of different populations of H.dentata.
| Population | Number of polymorphic loci | Number of alleles | Effective number of alleles | Nei's genetic diversity | Shannon's information index | Percentage of polymorphic loci (PPL) |
| ML | 33 | 1.846±0.366 | 1.506±0.362 | 0.294±0.184 | 0.436±0.256 | 84.621 |
| LY | 31 | 1.795±0.409 | 1.463±0.350 | 0.275±0.1807 | 0.414±0.251 | 79.492 |
| JFS | 27 | 1.692±0.468 | 1.353±0.361 | 0.211±0.195 | 0.321±0.275 | 69.232 |
| ZES | 30 | 1.769±0.427 | 1.387±0.356 | 0.235±0.1806 | 0.361±0.252 | 76.922 |
| LJ | 31 | 1.795±0.409 | 1.430±0.353 | 0.257±0.1828 | 0.393±0.250 | 79.493 |
| MQ | 27 | 1.692±0.468 | 1.406±0.365 | 0.240±0.1949 | 0.360±0.277 | 69.234 |
| Mean | 29.8 | 1.765 | 1.424 | 0.252 | 0.381 | 76.499 |
| P value | 0.168 | 0.101 | 0.087 | 0.089 | ||
| Species level | 2.000 | 1.539 | 0.324 | 0.493 | 100 |
Table 4.
Nei's analysis of genetic diversity in H.dentata.
| Total genetic diversity (Ht ) | Population genetic diversity (Hs ) | Gene differentiation factor (Gst ) | Gene flow (Nm ) | |
| Mean | 0.326 | 0.252 | 0.227 | 1.706 |
| Standard deviation | 0.019 | 0.010 |
Table 5.
Analysis of genetic variation (AMOVA) for population of the H.dentata.
| Source of variation | df | Sum of squares | Variance components | Percentage of variation | P value |
| Among population | 5 | 250.856 | 2.014 | 27% | <0.01 |
| Within population | 127 | 708.618 | 5.580 | 73% | <0.01 |
| Total | 132 | 959.474 | 7.594 | 100% |
Disclaimer/Publisher’s Note: The statements, opinions and data contained in all publications are solely those of the individual author(s) and contributor(s) and not of MDPI and/or the editor(s). MDPI and/or the editor(s) disclaim responsibility for any injury to people or property resulting from any ideas, methods, instructions or products referred to in the content. |
© 2023 by the authors. Licensee MDPI, Basel, Switzerland. This article is an open access article distributed under the terms and conditions of the Creative Commons Attribution (CC BY) license (https://creativecommons.org/licenses/by/4.0/).
Copyright: This open access article is published under a Creative Commons CC BY 4.0 license, which permit the free download, distribution, and reuse, provided that the author and preprint are cited in any reuse.


