
Submitted:
03 July 2023
Posted:
05 July 2023
You are already at the latest version
Abstract
The cross-linked microspheres were prepared and loaded with Favipiravir SARS-CoV-2 antiviral drug, by copolymerization of chitosan (CS) with a polysaccharide extracted from fresh pomegranate peels. Moreover, glutaraldehyde (Glu) has been used as chemical cross-linker ,and sodium hexametaphosphate (SHMP) as physical cross-linker. The extracted polysaccharide was analyzed and different techniques have been used and the analyses leads to the fact that it is pectin .The surface morphology of the prepared microspheres was studied use scanning electron microscope where the size and the shape factor (S) of Glu microspheres have shown high values(74.27μm) and (0.852) respectively means their surfaces are tends to roughness, whereas the SHMP microspheres have shown size particle(20.47μm)and shape factor (0.748) which gives indication that the SHMP microspheres have smooth surfaces. The swelling studies have shown that Glu microspheres have higher degree of swelling which means SHMP microspheres are more compact. The prepared microspheres have shown more Loading percentage of Favipiravir antiviral drug in SHMP microspheres(37%w/w)in comparison with Glu microspheres(35%w/w) where the electrostatic interaction between the Favipiravir ions and SHMP anions help for more loading. The microspheres prepared under different types of cross-linking have shown initially burst release of Favipiravir and followed by a step of controlled release for a certain time where its period depends on the pH of the release media. Both Glu and SHMP cross-linked microspheres have shown high controlled release time in buffered release solution of pH 7.4 and for a less periods in pH 1.3 and pH 9.4 which may related to the type of electrostatic interactions between drug and polymer system and their reactions with release solution ions.
Keywords:
Favipiravir
; pomegranate peels
; chitosan
; pectin
; controlled drug release
; gluteraldehyde
; sodium hexametaphosphate
1. Introduction
Recently, some polysaccharides of biomedical properties have received great attention in sustained delivery of drugs [1]. Natural polysaccharides pectin and chitosan in particular have expand biological properties and wide range of applications in pharmacology [2,3]. Polymers have been improved to have a technique that adds an effort in the development of different technology such as bioengineering, biotechnology and medicine [4,5,6]. Drug delivery systems was early design for delivering medication to a certain target inside a patient to increase the drug concentration in that part and prevent any interactions [7]. Biomaterials or polymers showed ability to modify the pharmacokinetics of the drug [8].The selection of polymers could play a significant role in designing a drug delivery system with controlled profile and known physicochemical properties [9]. Polysaccharides are one types of biomaterials used in drug delivery system and have formulations suitable for drug delivery. Chitosan and pectin are polysaccharides of cationic and anionic structures respectively, have the important properties of biomedical polymers includes biocompatibility, biodegradability, non-toxicity and mucoadhesivity with mechanical strength [7]. Chitosan is a linear heteropolysaccharide consist of D-glucosamine and N-acetyl D-glucosamine connected with -(1-4) glycosidic linkages [10].
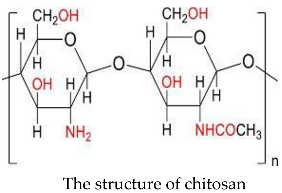
The main groups in chitosan are amino functional group have a significant role in the biochemical system and electrostatic interactions in drug delivery systems and it is soluble in slightly acidic solution [11,12]. The gelling biopolymer pectin is originating from plants and mainly its chain structure consists of α –(1-4) D- galacturonic acid units. Its chains interspersed by rhamnogalacturonan sections with alternate residues of rhamnose and galacturonic acid [13].
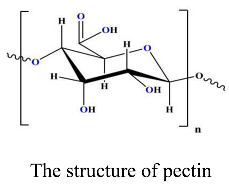
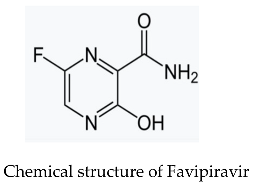
Recently, pectin–based drug delivery systems have been received a great turnout because of its gelling capacity, biocompatibility and low toxicity [14]. Pectin microspheres are used in drug delivery by mixing pectin with other polymers for hybrid pectin spheres [15]. Favipiravir, the antiviral agent is a purine nucleic acid analog that inhibits the RdRp proteins of RNA based viruses [16] also used as antiviral for Arena, Ebola, Bunya and influenza virus [17]. Favipiravir is an oral drug that was approved to treat COVID-19, it has shown fast viral clearance as compared to others [18].
The main purposes of this work were loading and orally releasing the Favipiravir drug under controlled. New hydrogel system was prepared by copolymerization of chitosan with freshly extracted pectin from pomegranate peels. The hydrogel was cross-linked by gluteraldehyde and by sodium hexametaphosphate for chemical and physical comparison respectively. The degree of swelling of the hydrogel microspheres was studied for both hydrogels of different cross-linkers. The hydrogel systems have been characterized by FTIR,1H NMR, GC/MS, XRD, thermal and SEM analyses. Maximum loading and efficiency of loading percentages were measured and the loaded microspheres were allowed to release in different pH buffered solutions and their cumulative release percentages were calculated.
2. Experimental
2.1. Materials and Methods
Pectin (PE) was extracted from pomegranate peels locally sourced. The chitosan (CS) sample (α-chitosan, 70% DDA) was obtained from Alpha Chemika, India and was dissolved in 2% (w/w) acetic acid for purification, then filtered under pressure to remove undissolved particles of chitosan. The clear filtrate was subsequently precipitated using 1M NaOH solution, filtered and dried at 25°C under vacuum. The Favipiravir drug was supplied by the state company for drugs industry and medical appliances, Samaraa, Iraq. The glutaraldehyde (Glu)(25% w/w) solution was obtained from Thomas Baker (chemicals) Pvt. Ltd. Mumbai, India. Sodium hexameta phosphate (SHMP) and ammonium persulphate (APS) were obtained from BDH,U.K. Ethanol (96% w/w) and different buffer solutions were analytical grades chemicals (Fluka, Swiss).
2.2. Preparation of Hydrogels
2.2.1. Extraction of Pectin
Pectin was extracted from fresh pomegranate peels, where the latter was washed with distilled water, dried and grinded. The crushed pomegranate peels 50g was poured inside the thimble of soxhlet extractor followed with 250mL ethanol (96% w/w) in the round bottom flask of soxhlet apparatus [19]. After heating the ethanol to its boiling point, the solvent was allowed to recycle for two hours passing through the crushed pomegranate peels for removal of proteins, lipids, wax and salts contents. Finally, the crushed pomegranate peels was taken out of the thimble of soxhlet and transferred to the reflux apparatus of 500 mL round bottom flask, then 250 mL distilled water was added. The solution was heated to the boiling point of water for one hour with continuous stirring, and the solution was cooled and filtered. The getting turbid solution was centrifuged and the pure solution was precipitated by ethanol (96%w/w) using three times the volume of peels solution and keep stirring extra for 30 min, and finally the solution was kept in a refrigerator for overnight. The precipitated pectin was filtered and dried in oven at 50°C, then grinded and its structure was examined by FTIR, GC/MS and 1H NMR.
2.2.2. Preparation of Chitosan-Pectin Copolymer
A polymer solution was prepared from dissolving 1.0 g of dry and pure chitosan (CS) in 100 mL (2.0 %w/w) acetic acid prepared in distilled water and the solution was kept with stirring for 3h at room temperature. Similarly, 1.0 g dry pectin (PE) was dissolved in100 mL distilled water and heated at 50°C with continuous stirring for 20 min. A solution of 100 mL was prepared from previous solutions, where (1.0: 0.5M) of chitosan to pectin solution in 250 mL beaker was mixed. The initiator solution of 5ml (10 %w/w) APS in distilled water was added slowly with continuous stirring at room temperature. The viscous chitosan/pectin solution with initiator was blown slowly through nozzle into beaker containing 100 mL of (5 %w/w) neutral solution of glutaraldehyde (Glu). The solution was heated at 60°C with slow stirring and the formed microspheres were kept under stirring for extra 1h.The microspheres were separated and wished several times with hot and cold water and finally, vacuum dried at 30°C. The similar procedure has been used only 100 mL of sodium hexametaphosphate (SHMP) with (6 %w/w) concentration instead of glutaraldehyde for preparation of chitosan/pectin microspheres.
2.3. Measurement of Size and Morphology of Different Microspheres
The size and morphology of prepared microspheres were measured to determine their effects on loading and release characteristics of microspheres by scanning electron microscope (SEM) using TESCAN MIRA FESEM, Czech Republic and ZEISS microscopy system, Germany. The size and morphology of microspheres varied as the type of cross-linker was changed [20]. Shape factor(S) was calculated using size parameters for surface characteristics of microspheres by the following equation [21];
Where L is represent the perimeter, and A is the surface area of prepared microspheres. It was shown that the value of (S) above 0.80 means the surface roughness increase progressively [20].
2.4. Degree of Swelling (DS) in Cross-Linked Microspheres
The degree of swelling (DS) of the prepared microspheres with glutaraldehyde cross-linked (CS-co-PE)/Glu and with sodium hexametaphosphate cross-linked (CS-co-PE)/SHMP was measured by keeping 100mg dry microspheres in 20 mL phosphate buffered solution (pH7). The microspheres was taken out of buffer solution after 6h and filtered by fine mesh sieve of (100 mesh) and left 10 min for drain and weighted. The swollen microspheres were then returned to the solution and the process was repeated each 6h until no change in their weight. The following equation was used for calculation of degree of swelling [22];
Where Wt and Wo are the weights of swelling microspheres after time (t) and at zero time, respectively.
2.5. Loading of Favipiravir on Microspheres
The loading of Favipiravir on prepared microspheres was carried out by immersing 100mg microspheres of (CS-co-PE)/Glu or (CS-co-PE)/SHMP in 50 mL phosphate buffered solution (pH7), containing different concentrations of Favipiravir start from 10mg to 100mg in 50mL loading solution. The loading temperature was fixed at 25°C and the different microspheres were kept in loading solution for 24h under slow stirring. The amount of Favipiravir loaded on microspheres was appointed by recording the absorbance of the remain loading solution after removing microspheres at λmax=274nm, using UV-1800, Shimadzu Spectrophotometer, Kyoto, Japan. The loading of Favipiravir in the microspheres was calculated as maximum loading percentage (L %) using Eq.3 [21];
Also, the loading of Favipiravir was calculated as efficiency of loading ELmax (%) using Eq.4 [21];
2.6. Release of Favipiravir from Loaded Microspheres
The release characteristics of chitosan/pectin microspheres of both cross-linked were determined by immerse 100 mg of Favipiravir loaded microspheres in 20 mL buffered solution of different pH at 37oC. Where the release behavior of the Favipiravir loaded microspheres have done in pH1.3, pH7.4 and pH9.4 which simulates the pH of gastric fluid, plasma blood fluid and intestinal fluid in the human body, respectively [23]. The amount of Favipiravir released in the media was fixed by recording the absorbance at λmax = 274 nm of solution sample withdrawn from the release media and replaced with same quantities of native solution. The release of Favipiravir was given as controlled release percentage (CRmax %) using Eq.5 [24];
and as burst release percentage (BRmax%) using Eq.6;
Where is variable amount for burst release while constant for controlled release at 37 oC and for a fixed time interval of 6h.
The overall release was calculated as cumulative release percentage (Rcum%) using Eq.7, for fixed time interval of 6h.
Where Wt is the cumulative amount of Favipiravir release at time (t) andis total amount of Favipiravir released [23].
3. Results and Discussion
Natural polymers like polysaccharides are biocompatible materials used in drug release systems have the ability to encapsulate drugs and release in a sustained and controlled manner [24]. The polymeric systems shows physicochemical properties can play a significant role in controlling drug release from the systems. Moreover, copolymerization of chitosan the cationic polysaccharide with pectin the anionic hetropolysaccharide produce hydrogel have both functional groups help the hydrogel for swelling to a wide range in different pH media. The high degree of swelling hydrogels can be loaded with chronic drugs or those have harmful effects on digestive system. The loaded drug hydrogels have shown long time release under controlled manner.
Pectin was extracted from pomegranate peels and before copolymerized with chitosan, its structure was characterized by FTIR using 8400 Shimadzu spectrophotometer, Japan, with (400-4000 cm−1). The following major peaks of the extracted pectin (Figure 1) was studied where the absorption frequency at 3437 cm−1 belongs to hydroxyl group (O-H)str. The band at 2947 cm−1 is representing the methine group(C-H)str in pectin. The absorption frequency at 1744 cm−1 is attributed to the carbonyl group(C=O)str of methyl ester group(COOCH3), and that at 1678 cm−1 is belongs to(C=O)str of undissociated to carboxylic acid (COOH) [25]. The absorption band at 1620 cm−1 is represent asymmetric stretching vibration belongs to (C=O) of the carboxylate ion (COO-). The absorption bands which was appeared at 1443 cm−1 and 1331 cm−1 (Figure 1) are belongs to (-CH2) scissoring and (-OH) bending vibrations respectively. Finally, those bands appears at 1146 cm−1 and 1022 cm−1 are represent (-OH) the secondary alcohol in aliphatic cycle and stretching of methoxy group, respectively.
The 1H NMR spectroscopy of the extracted pectin was studied by Varian Inova spectrophotometer at 500MHz, Palo Alto, California, USA, and using deuterated water solvent. The 1H NMR spectrum (Figure 2) shows resonance (3H,m) at (1.06 and1.12) ppm, which represent the methyl (CH3) group of rhamnose. The resonance (3H,w) at (1.86 and 1.97) ppm which represent acetyl group located at 2- and 3-o- galacturonic acid respectively. Whereas, the resonance (3H,m) observed at 3.76 ppm (Figure 2) belongs to the methoxy (CH3O-) group of galacturonic acid esterification unit. The following resonances at (3.69, 3.8, 3.92, 4.03, and 5.11) ppm are represent the protons of galacturonic acid units [26,27].
The GC/MS analysis was also used for characterization of extracted pectin, where the analysis was carried out by Agilent 6890/5973 inert GC/MSD; Agilent Technologies; Palo Alto; CA, USA. The extracted pectin from pomegranate peels have shown many neutral sugars distributed gradually (Figure 3) start from glucose followed by mannose, arabinose, xylose, galactose, rhamnose and others. In addition, uronic acid with low amount and high amount of fibers are present (Figure 3). The presence of galactose and rhamnose the main components of pectin means the extracted polysaccharide from pomegranate peels is mainly pectin beside other natural materials such as wax, proteins and some salts [28,29].
3.1. Studies of the Prepared Hydrogels
Hydrogels cross-linked differently were prepared by copolymerization of chitosan with freshly extracted pectin. Generally the prepared hydrogels were cross-linked chemically by glutaraldehyde(CS-co-PE)/Glu and physically by sodium hexametaphosphate(CS-co-PE)/SHMP. The hydrogels were characterized and their FTIR spectrum (Figure 4 and Table 1) has shown absorption frequency at 3426cm−1 represents the hydroxyl group of both chitosan and pectin. The band at 1717cm−1 is belongs to carbonyl group of methyl ester and undissociated carboxylic acid. Whereas, the band at 1678 cm−1 represent (amide-I) of chitosan beside the carbonyl group of glutaraldehyde and pectin .The absorption frequency at 1555cm−1 is belongs to (amide-II) of chitosan, while the band at 1640cm−1 (Figure 4a and Table 1) belongs to the imine bonding (C=N) formed due to the interactions between amine group of chitosan and the aldehyde group of glutaraldehyde [25]. The peaks of (CS-co-PE)/SHMP are almost similar to those of (CS-co-PE)/Glu except those at 1157cm−1 and 1069cm−1 (Figure 4b and Table 1) are representing the P-O-P connections in sodium hexametaphosphate [30].
The 1H NMRspectroscopy of (CS-co-PE)/Glu hydrogel (Table 2) has shown the resonance of protons of the main groups in the hydrogel composite. The resonances of (2H,m) at 1.0-1.7 ppm (Table 2) are represent the methylene (CH2) groups of glutaraldehyde. The signals of (3H,w) at 1.84 and1.96 ppm are belongs to acetyl groups of galacturonic acid in pectin. The methoxy group of galacturonic acid esterification unit in pectin gives signal at 3.72ppm (Table 2). While chitosan give main resonance at 1.8ppm of (3H,s) represent acetyl group of N-acetylglucosamine and the signal of (2H,m) at 3.0 ppm is belongs to D- glucosamine fraction. The resonance at 3.0-3.8 ppm (Table 2) represent the cross-linking of glucosamine groups with glutaraldehyde [31].
The XRD pattern of both hydrogels (Figure 5) have shown that the compounds are amorphous in their nature with low crystalline structures and the broad maxima start from 20° to 26° in (CS-co-PE)/Glu is belongs to the polysaccharides chitosan and pectin(Figure 5a) which was shifted little bit to 28°(Figure 5b) under the effect of the crystalline nature of sodium hexametaphosphate in (CS-co-PE)/SHMP [32].
The thermal studies of the prepared hydrogels using SDT Q600 V20.9 Build 20, have shows the hydrogels are thermal stable almost up to 200 oC. Where the TGA of (CS-co-PE)/Glu hydrogel (Table3) has shown at the initial decomposition temperature (IDT), the weight loss% was 2.0% at 72oC and at the final decomposition temperature (FDT), the weight loss % was 52.0% at 382oC and 32.0% weight loss at 277oC representing maximum decomposition temperature (Tmax).Whereas, 60.0% weight loss at 450oC representing the crystalline decomposition temperature (Tcr) (Table 3).The DSC thermogram of (CS-co-PE)/Glu hydrogel (Table 3) shows the (Tg) of the hydrogel is at 42 oC and has heat of fusion Hf) at 240 oC of (+389J/g) with endothermic behavior. Similarly, the thermogram of (CS-co-PE)/SHMP hydrogel has shown weight loss% of 2.9% at 92oC representing IDT, and 46.0% at 398oC representing FDT. The weight loss% is reaching 28.5% at 290 oC representing Tmax, whereas the weight loss% of 56.8% at 458 oC representing Tcr. The DSC thermogram of (CS-co-PE)/SHMP hydrogel has shown thermal data (Table 3) which it gives an impression that the hydrogel is thermally more stable than (CS-co-PE)/Glu hydrogel.
The SEM images of the prepared hydrogels were studied and the SEM image of CS-co-PE/Glu hydrogel (Figure 6) has shown clusters of microspheres have non-uniform surfaces, accumulated as irregular agglomerate shows non-crystalline, elastic nature, interspersed with holes and folds. Those properties give the CS-co-PE/Glu hydrogel high ability for loading and delivering of drugs. The SEM image of CS-co-PE/SHMP hydrogel (Figure 7) has shown compact microspheres with small sizes, have almost same properties like CS-co-PE/Glu hydrogel microspheres only they are accumulate more in a clusters form.
Finally the surface area of the prepared hydrogel particles was studied using BET technique type BELSORP MINI II, surface area and porosimetry analyzer (Osaka, Japan).The BET Plot has shown specific BET area of CS-co-PE/Glu hydrogel particles is (2.261m2/g) with total pore volume (0.0059 cm3/g) (Table 4), while CS-co-PE/SHMP hydrogel particles have specific BET area (334.88 m2/g) and their total pore volume (0.918 cm3/g) (Table 4). The BJH plot of (CS-co-PE)/Glu hydrogel particles gives the pore area (1.21nm) and specific surface area (5.0978m2/g) (Table 4). Whereas, the pore area of (CS-co-PE)/SHMP hydrogel particles is (4.61nm) and its specific surface area is (420.24m2/g) (Table 4). The BET measurement data shows that the (CS-co-PE)/SHMP hydrogel particles have more specific surface area than (CS-co-PE)/Glu hydrogel particles.
3.2. Surface Measurement of Microspheres and Their Physical Characteristics
The type of cross-linking has shown a significant effects on the morphology of the hydrogel microspheres [20,33], from studying the SEM images of microspheres cross-linked with glutaraldehyde (Glu) (Figure 8a) and sodium hexametaphosphate (SHMP) (Figure 8b).Those microspheres cross-linked with Glu were large in size (74.97μm) with rough surface (Figure 8a), while those cross-linked with SHMP, the size of microspheres become small (20.47μm) and the surface become smooth (Figure 8b). Another effect on surface roughness of microspheres has been shown through changes in type of cross-link, where the change appear clearly in shape factor (S) of microspheres that calculated by Eq.1.The high value of shape factor(S), greater than 0.80, the surface of microspheres tends to roughness, while it become smooth when S is equal or lower than 0.80.The microspheres cross-linked by Glu have shown a high value of S (0.852) which mean a high degree of roughness (Figure 8a).Whereas, those microspheres cross-linked with SHMP shows a low value of S (0.748) therefore, the microspheres have shown smooth surfaces (Figure 8b).
3.3. Degree of Swelling
The degree of swelling of (CS-co-PE)/Glu and (CS-co-PE)/SHMP in hydrogel microspheres controlled drug loading and release behavior of prepared microspheres, hence the swelling characters were given in (Figure 9). The microspheres cross-linked with Glu reveal a maximum degree of swelling 290% (Figure 9), while those cross-linked with SHMP their maximum degree of swelling decreased to 250% (Figure 9). In general, the morphology of microspheres from the SEM micrographs has shown that microspheres cross-linked with Glu have rough surface (Figure 8a) with high value of shape factor (S) greater than 0.80 means easier penetration of phosphate buffered solution pH7 into the polymer chains and finally increase the degree of swelling. Whereas, microspheres cross-linked with SHMP has smooth surface and lower S with lower degree of swelling (Figure 9).
3.4. Loading of Favipiravir on Prepared Microspheres.
The differences in cross-linking of microspheres have significantly influenced many physico-chemical properties of the hydrogel microspheres including their loading behavior of Favipiravir. The loading process of Favipiravir in microspheres was done, where 100mg microspheres were kept in 50mL solution prepared from Favipiravir dissolved in buffered solution of pH7 under slow stirring and for 24h. To study the effect of initial concentration of Favipiravir, the concentration of Favipiravir was varied from 10mg to 100mg in 50mL loading solution. The microspheres cross-linked with Glu (Table 5, Figure 10) resulted in a maximum loading (Lmax) of 35mg per 100mg microspheres. Whereas the microspheres cross-linked with SHMP (Table 5, Figure 10) their maximum loading (Lmax) has increased to 37mg per 100mg microspheres. The increasing trend in maximum loading (Lmax) for Favipiravir in SHMP cress-linked microspheres (37mg Favipiravir per 100mg microspheres) was due to highly electrostatic interactions between the water soluble Favipiravir at pH7 [34], and the highly ionic salt sodium hexametaphosphate anions, added to that the dispersal holes and folds on their surfaces, beside the SHMP microspheres are present in clusters, where all significantly increase the retention capacity of SHMP microspheres in comparison with the non-ionic Glu microspheres.
3.5. Release of Favipiravir from Loaded Microspheres
The release profile of Favipiravir has indicated that the release of drug was dependent on the type of cross-linking and on the pH of release media. Where the pH of the release media have controlled the drug release pattern of microspheres by changing their degree of swelling due to variations in electrostatic interactions between microspheres and their ionic cross-linkers like sodium hexametaphosphate anions. The release pattern of Favipiravir from microspheres at different pH was studied (Table 5, Figure 11) and the Favipiravir was released first with burst trend (%RB), where the amount of released drug increase in a fixed interval of time (Table 5, Figure 11). Moreover the polymer chains in microspheres were relaxed and the degree of swelling continued to increase, with microspheres structural changes have taken place. Accordingly, and because the released drug in burst step was not constant, therefore this type of release is not useful for sustainable release of drug. After the microspheres structure reaches its equilibrium start release drug in a constant manner within fixed interval of time. This step of drug release with controlled trend (%Rc) has shown (Table 5, Figure 11) dependence on the release media and types of microspheres cross-linker. The trend in burst release of Favipiravir from Glu microspheres has shown increase from 9.8mg in release solution of pH 7.4 to 23.8 mg in pH9.4 means at high pH the Glu microspheres reach their high structural relaxation whereas, in acidic release solution pH1.3 the microspheres compact same as those in pH7.4 and reach their controlled release with minimum lose. The Glu microspheres give controlled release trend different to the burst release step, where they released in controlled for 30h in release solution of pH 7.4 and the released amount of drug represent 72% w/w of their load Favipiravir (Table 5, Figure 11). Similarly, the Glu microspheres were release 66.8% w/w of their loaded Favipiravir in controlled manner for 24 h in release solution of pH 1.3 means the microspheres are swell in moderate degree in acidic medium. The release in pH9.4 was mostly in burst step and only 48.6% w/w of the loaded Favipiravir was released in controlled and only for 18h.
On the other hand, the SHMP microspheres have shown almost same trend of Glu microspheres. The Favipiravir loaded microspheres were released 72% w/w of their loaded Favipiravir and for 36h in release solution of pH 7.4 (Table 5, Figure 11). However, the main difference between the two systems is the controlled release time where it is 36h from SHMP microspheres while it is 30h from Glu microspheres (Table 5, Figure 11). In addition the release of Favipiravir from SHMP microspheres in release media of pH9.4 was improved under controlled region, while it seems not good in pH1.3 acidic release media may be due to the electrostatic interactions between Favipiravir ions and the SHMP anions.
The SEM images of the released microspheres (Figure 12a,b) have been shown an cracked form in their structure after release the loaded Favipiravir into the release media. Accordingly, the SEM image of Glu microspheres (Figure 12a) has shown the microspheres after release in pH 7.4 media are still have integrated structure with some cracks on their surface permeated with few holes may be due to the exit of Favipiravir. Moreover, the SHMP microspheres has shown SEM image after release (Figure 12b) almost similar to that of Glu microspheres image, except some microspheres are broken and their pieces are scattered may be due to their brittleness structure.
4. Conclusion
Chitosan was copolymerized with pectin where the latter was extracted from fresh pomegranate peels and characterized for its structure. The prepared copolymers were cross-linked physically by SHMP and chemically the microspheres were cross-linked by Glu. The formed microspheres were characterized for their structures, crystallinity, thermal behaviors, surface morphologies, surface area and their degree of swelling. Types of cross-linking of microspheres have shown significant effects on their surface morphology, where SHMP cross-linked microspheres appeared small in size with smooth surface, while Glu cross-linked microspheres have larger size with rough surface. The loading of chitosan/pectin microspheres with Favipiravir and their release characteristics were evaluated as a function of physical and chemical cross-linking and on varying the solution pH of Favipiravir release media. The depression in the degree of swelling of SHMP cross-linked microspheres shows the compactness in their form structure in comparison with those of Glu microspheres, and as the shape factor (S) measurements were proved. The prepared microspheres have shown after 24h inside pH7 buffered solution of Favipiravir a maximum loading of 37% (w/w) for SHMP microspheres and 35% (w/w) for Glu microspheres. The release characteristics of leaded microspheres have shown differences on varying the pH of release solution from 1.3 to 7.4 and then to 9.4 especially in case of SHMP microspheres due to the strength of electrostatic interactions between sodium hexametaphosphate anions and the ionized chitosan/pectin molecules, which controlled the release of Favipiravir in better way. The SHMP microspheres in pH7.4 release media have shown better controlled pattern for releasing Favipiravir where the media ions could help for more interactions. Whereas, the Glu microspheres system have shown controlled release of Favipiravir better in pH 1.3 beside pH 7.4 which may provide more protons for electrostatic interactions between chains of chitosan and pectin molecules.
References
- Gutierrez-Alvarado, K.; Chacon-Cerdas, R.; Starbird-Perez, R. Pectin Microspheres: Synthesis Methods, Properties, and Their Multidisciplinary. Applications. Chemistry, 2022, 4, 121–136. [Google Scholar] [CrossRef]
- Noreen, A.; Nazli, Z.-I.-H.; Akram, J.; Rasul, I.; Mansha, A.; Yagoob, N.; Iqbal, R.; Tabasum, S.; Zuber, M.; Zia, K.-M. Pectins Functionalized Biomaterials; A new Viable Appreach for Biomedical Applications. Int. J. Biolog. Macromol., 2017, 1019, 254–272. [Google Scholar] [CrossRef]
- Yu, Y.; Shen, M.; Song, Q.; Xie, J. Biological Activities and Pharmaceutical Applications of Polysaccharide from Natural Resources. Carbohydr. Polym., 2018, 183, 91–101. [Google Scholar] [CrossRef] [PubMed]
- Peian, Z.; Haifeng, J.; Peijie., G.; Sadeghnezhad, E.; Qiangjan, P.; Tianyu, D.; Feng, L.; Huanchun, J.; Jinggui, F. Chitosan Induces Jasmonic Acid Production leading to Resistance of Ripened Fruit Against Botrytis Cinerea Infection. Food Chem., 2021, 337, 124472. [Google Scholar] [CrossRef] [PubMed]
- Periyasamy, K.G.K.; Zuo, H.; He, S. Flexible Printed Circuit Board Magnetic Micromirror for Laser Marking / Engraving. J. Micromech. Microeng., 2019, 29, 1–11. [Google Scholar] [CrossRef]
- Caykara, T.; Sande, M.G.; Azaia:, N.; Rodrigues, L.R.; Silva, C.J. Exploring the Potential of Polyethylene terephthalate in the Design of Antibacterial Surfaces. Med. Microbiol. Immunol., 2019, 209, 363–372. [Google Scholar] [CrossRef]
- Adepu, S.; Ramakrishna, S. Controlled Drug Delivery Systems: Current Status and Future Directions. Molecules, 2021, 26, 5905–5950. [Google Scholar] [CrossRef]
- Fenton, O.S., Olafson; Pillai, P.S.; Mitchell, M.; Jis Langer, R. Advances in Biomaterials for Ding Delivery. Adv. Mater., 2018, 30, 1705328. [Google Scholar] [CrossRef]
- Yun, Y.H.; Lee, B.K.; Park, K. Controlled Drug Delivery: Historical Perspective for the Next Generation. J. Control Release, 2015, 219, 2–7. [Google Scholar] [CrossRef]
- Rashki, S.; Asgarpour, K.; Tarrahimofrad, H.; Hashemipour, M.; Ebrahimi, M.S.; Fathizadeh, H.; Khorshidi, A.; Khan, H.; Marzhosey- ni, Z.; Salavati-Niasari, M.; et al. Chitosan-based Nanoparticles. Against Bacterial Infections. Carbohyd. Polym., 2021, 251, 117108. [Google Scholar] [CrossRef]
- Zhang, Y.; Sun, T.; Jiang, C. Biomacromolecules as Carriers in Drug Delivery and Tissue Engineering. Acta Pharm. Sin. B, 2018, 8, 34–50. [Google Scholar] [CrossRef] [PubMed]
- Zhou, Y.; Li, S.; Li, D.; Wang, S.; Zhao, W.; LV, Z.; Li, H.; Han, Y. Enzymatic preparation of chitooligosaccharides and their Anti-obesity Application. Biosci. Biotechnol. Biochem., 2020, 84, 1460–1466. [Google Scholar] [CrossRef] [PubMed]
- Abid, M.; Cheikhrouhou, S.; Renard, C.M.G.C.; Bureau, S.; Cuvelier, G.; Attia, H.; Ayadi, M.A. Characterization of Pectin Extracted from Pomegranate Peel and their Gelling Properties. Food Chem., 2017, 215, 318–325. [Google Scholar] [CrossRef] [PubMed]
- Burapapadh, K.; Takeuchi, H.; Sriamornsak, P. Development of Pectin Nanoparticles Through Mechanical Homogenization for Dissolution Enhancement of Itraconazole. Asian. J. Pharm. Sci., 2016, 11, 365–375. [Google Scholar] [CrossRef]
- Shukla, S.; Verma., K.; Jain, D.; Verma, S. Pectin-based Colon-specific Drug Delivery. Chronicles Young Sci., 2011, 2, 83. [Google Scholar] [CrossRef]
- Furuta, Y.; Komeno, T.; Nakamura, T. Favipiravir (T705) Abroad Spectrum Inhibiter of Viral RNA Polymerase. Proc. Jpn. Acad. Sex. B, 2017, 93, 449–463. [Google Scholar] [CrossRef]
- Bai, C.Q.; Mu, J.S.; Kargbo, D.; Song, Y.; Biniu, W.K.; Nie, W.M.; Kanu, A.; Liu, W.W.; Wang, Y.P.; Dafae, F.; et al. Clinical and Virological Characteristics of Ebola Virus Disease Patients Treated With Favipiravir (T- 705). Sierra Leone, 2014 Clin. Infect. Dis., 2016, 63, 1288–1294. [Google Scholar]
- Josh, S.; Parkar, J.; Ansari, A.; Vora, A.; Talwar, D.; Tiwashar, M.; Patil, S.; Barkate, H. Role of Favipiravir in the Treatment of COVID-19. Inter. J. Infec Dise; 2021, 102, 501–508. [Google Scholar] [CrossRef]
- Hamed, A.A.-R.; Elkhedir, A.E.E.; Mustafa, S.E. Effect of Soxhlet Method Extraction on Characterization of Pectin of Pumpkin Peels. J. Exp. Food Chem., 2017, 3, 1–4. [Google Scholar]
- Gupta, K.C.; Jabrail, F.H. Effects of Degree of Deacetylation and Cross-linking on Physical Characteristics, Swelling and Release Behavior of Chitosan Microspheres. Carbohyd. Polym., 2006, 66, 43–54. [Google Scholar] [CrossRef]
- Gupta, K.C.; Jabrail, F.H. Gluteraldehyde Cross- linked Chilosan Microspheres for Controlled Release of Centchroman. Carbohyd. Res., 2007, 34, 2244–2252. [Google Scholar] [CrossRef] [PubMed]
- Gupta, K.C.; Jabrail, F.H. Gluteraldehyde and Glyoxal Cross-linked Chitosan Microspheres for Controlled Delivery of Centchroman. Carbohyd. Res., 2006, 341, 744–756. [Google Scholar] [CrossRef] [PubMed]
- Hanze, L.J.; Koehl, N.J.; Jansen, R.; Holm, R.; Vertzoni, M.; Whitfield, P.D.; Griffin, B.T. Development and Evaluation of a Biorelevant Medium Simulating Porcine Gastrointestinal Fluids. Euro. J. pharm. Biopharm., 2020, 154, 116–126. [Google Scholar] [CrossRef] [PubMed]
- Gupta, K.C.; Jubrail, F.H. Controlled-Release Formulations for Hydroxy Urea and Rifampicin Using Polyphosphate—Anion—Crosslinked Chitosan Microspheres. J. Appl. Polym. Sci., 2007, 104, 1942–1956. [Google Scholar] [CrossRef]
- Demir, D.; Ceylan, S.; Gokturk, D.; Bolgen, N. Extraction of Pectin from Albedo of Lemon Peels for Preparation of Tissue Engineering Scaffolds. Polym. Bull. 2021, 78, 2211–2226. [Google Scholar] [CrossRef]
- Koziel, A.; Skoda - Pomianek, K.; Gorniak, A.; Wikiera, A.; Cyprych, K.; Malik, M. Structural Determination of Pectin by Spectroscopy Methods. Coating, 2022, 12, 546. [Google Scholar] [CrossRef]
- Duan, X.; Zhu, Y.; Shu, C.; Gao, J.; Liu, F.; Pan, S. Extraction of Pectin from Satsuma Mandarin Peel: A Comparison of High Hydrostatic Pressure and Conventional Extractions in Different Acids. Molecules, 2022, 27, 3747. [Google Scholar] [CrossRef]
- Pasarin, D.; Ghizdareanu, A.L.; Teodorescu, F.; Rovinaru, C.; Banu, A. Characterization of Pectin Oligosaccharides Obtained from Citrus Peel Pectin. Ferment. 2023, 9, 312. [Google Scholar] [CrossRef]
- Florez-Pardo, L.M.; Gonzalez-Cordoba, A.G.; Lopez- Galen, J.E. Characterization of Hemicellulose from Leaves and Tops of the CC 8475, CC 8592 and V7151 Varieties of Sugarcane (Saccharum officin aruml). Revista DYNA, 2020, 86, 98–107. [Google Scholar] [CrossRef]
- Baum, A.; Dominial, M.; Vidal-Melgosa, S.; Willats, W.G.T.; Sonderguard, K.M. Prediction of Pectin Yield and Quality by FTIR and Carbohydrate Microarray Analysis. Food Bio. Proc. Tech., 2017, 10, 143–154. [Google Scholar] [CrossRef]
- Facchinatto, W.M.; Santos, D.M.; Fiamingo, A.; Barnardes-Filho, R.; Campana - Filho, S.P.; de Azevedo, E.R.; Colnago, L.A. Evaluation of Chitosan Crystallinity: A high Resolution Solid-state NMR Spectroscopy Approach Carbohyd. Polym., 2020, 250, 116891. [Google Scholar] [CrossRef] [PubMed]
- Dalpasquale, G.; Delbem, A.C.B.; Passan, J.P.; Nunes, G.; Gorup, L.F.; Neto, F.N.S.; Camargo, E.; Danelon, M. ffect of the Addition of Nano-sized Hexametaphosphate to Fluoride Toothpastes on Tooth Demineralization: An In Vitro Study. Clin. Oral Invest., 2017, 21, 1821–1827. [Google Scholar] [CrossRef] [PubMed]
- Gupta, K.C.; Jabrail, F.H. Preparation and Characterization of Sodium Hexametaphosphate Cross-linked Chitosan Microspheres for Controlled and Sustained Delivery of Centchroman. Inter. J. Biolog. Macromole., 2006, 38, 272–283. [Google Scholar] [CrossRef] [PubMed]
- Domotor, O.; Enyedy, E.A. Evaluation of In Vitro Distribution and Plasma Protein Binding of Selected Antiviral Drugs (Favipiravir, Molnupiravir and Imatinib) Against SARS-CoV-2. Int. J. Mol. Sci. 2023, 24, 2849. [Google Scholar] [CrossRef]
Figure 1.
FTIR spectrum of polysaccharide extracted from pomegranate peels.
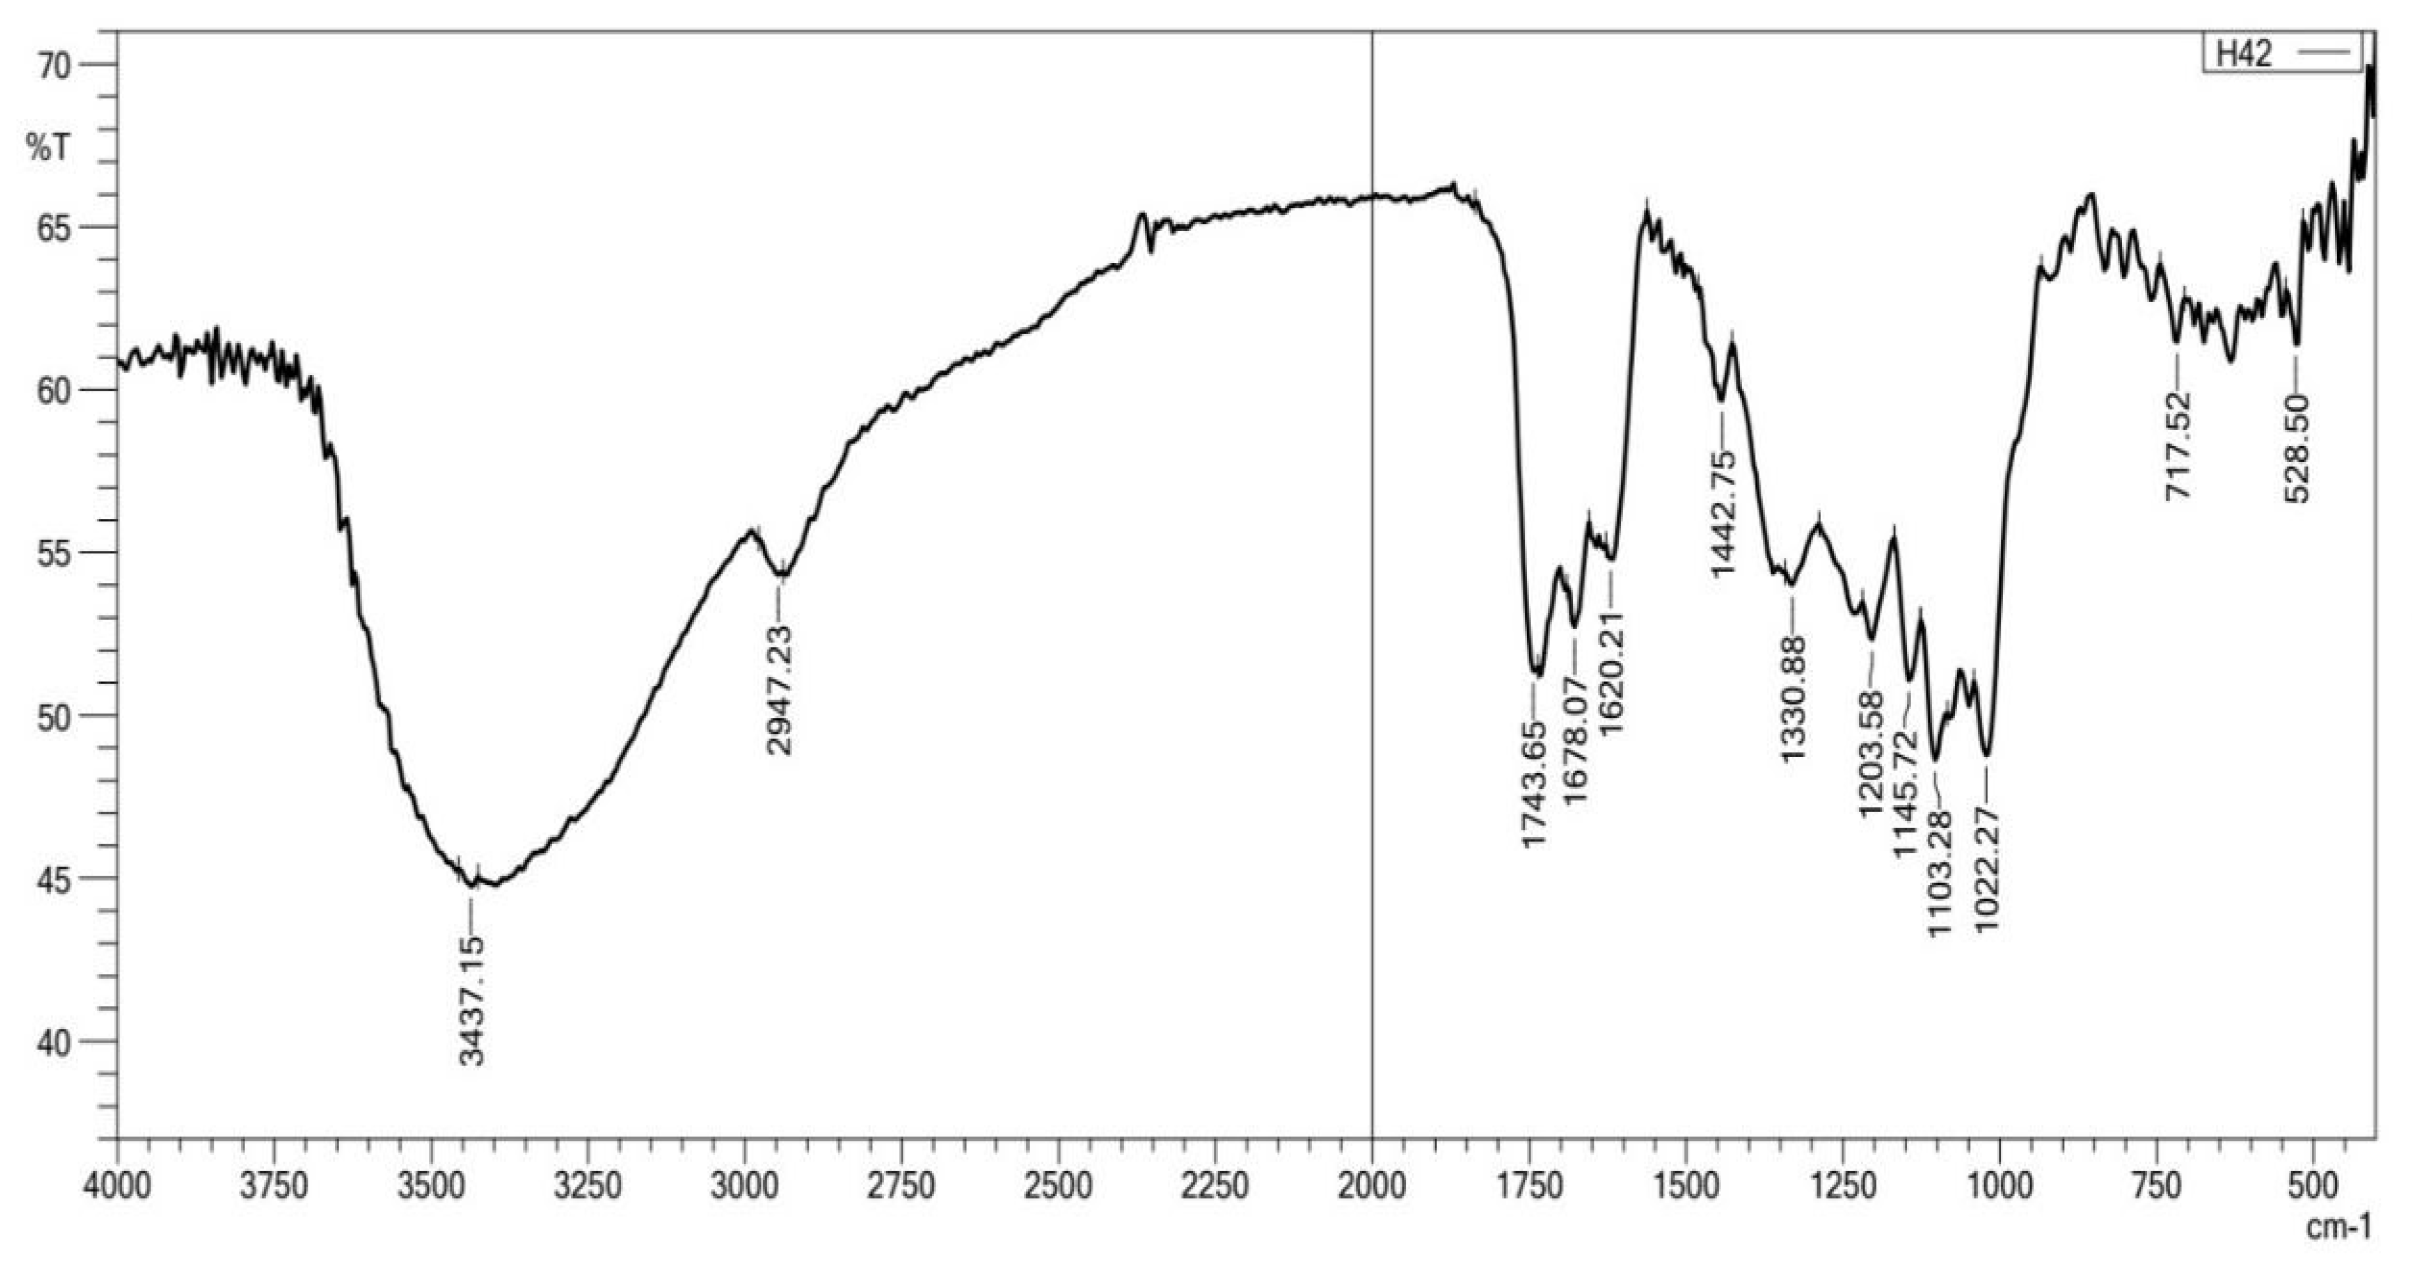
Figure 2.
1H NMR spectrum of extracted polysaccharide from pomegranate peels.
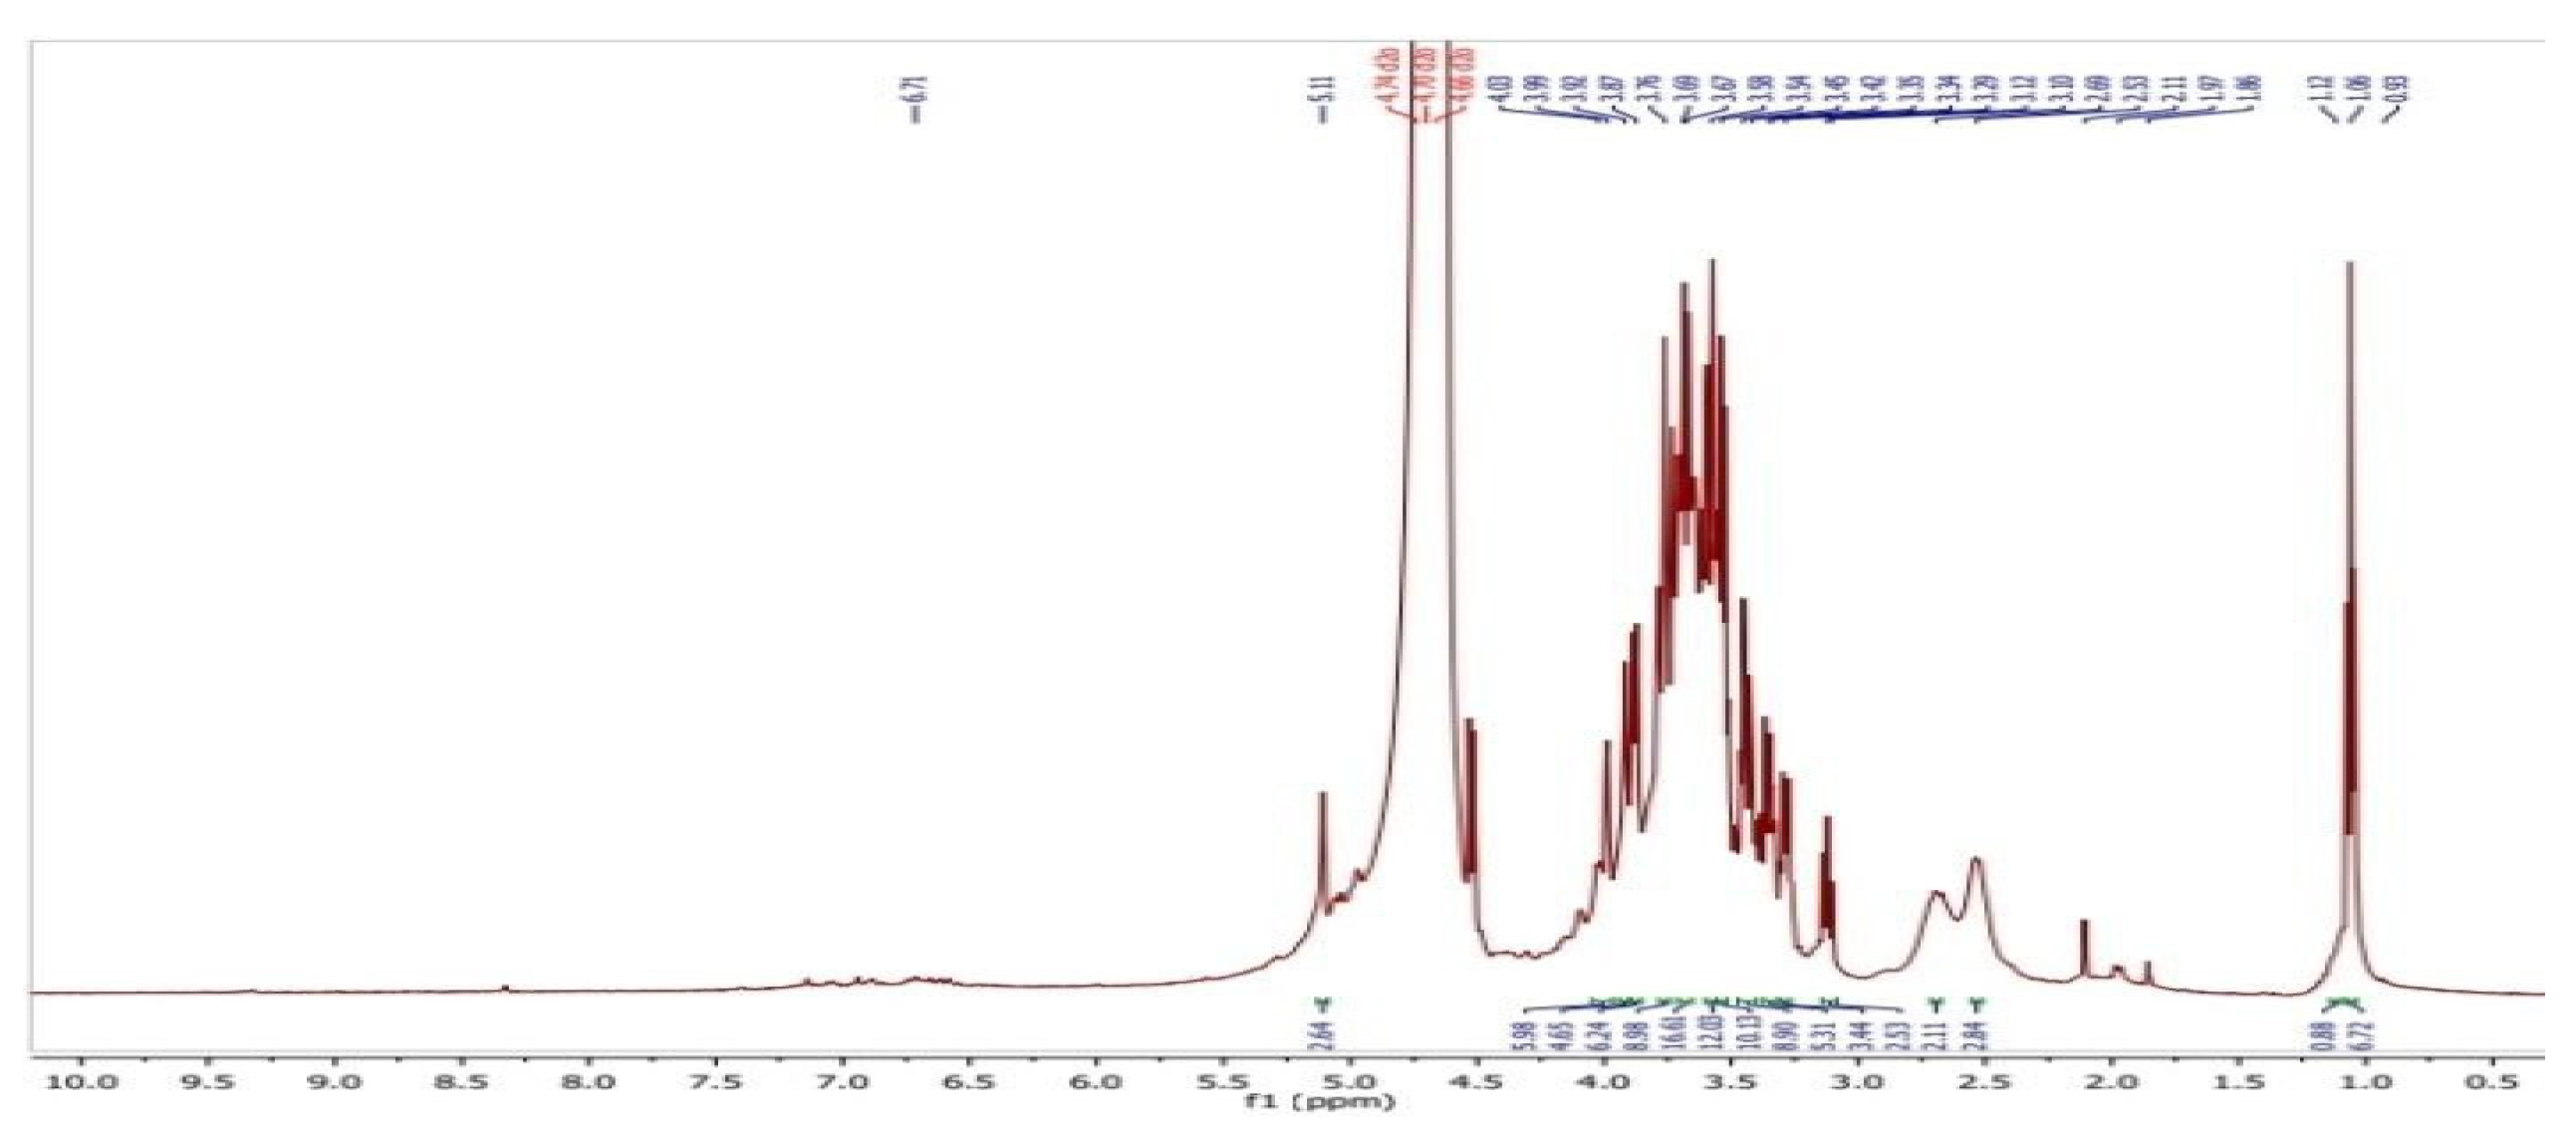
Figure 3.
GC/MS spectrum of extracted polysaccharide from pomegranate peels.
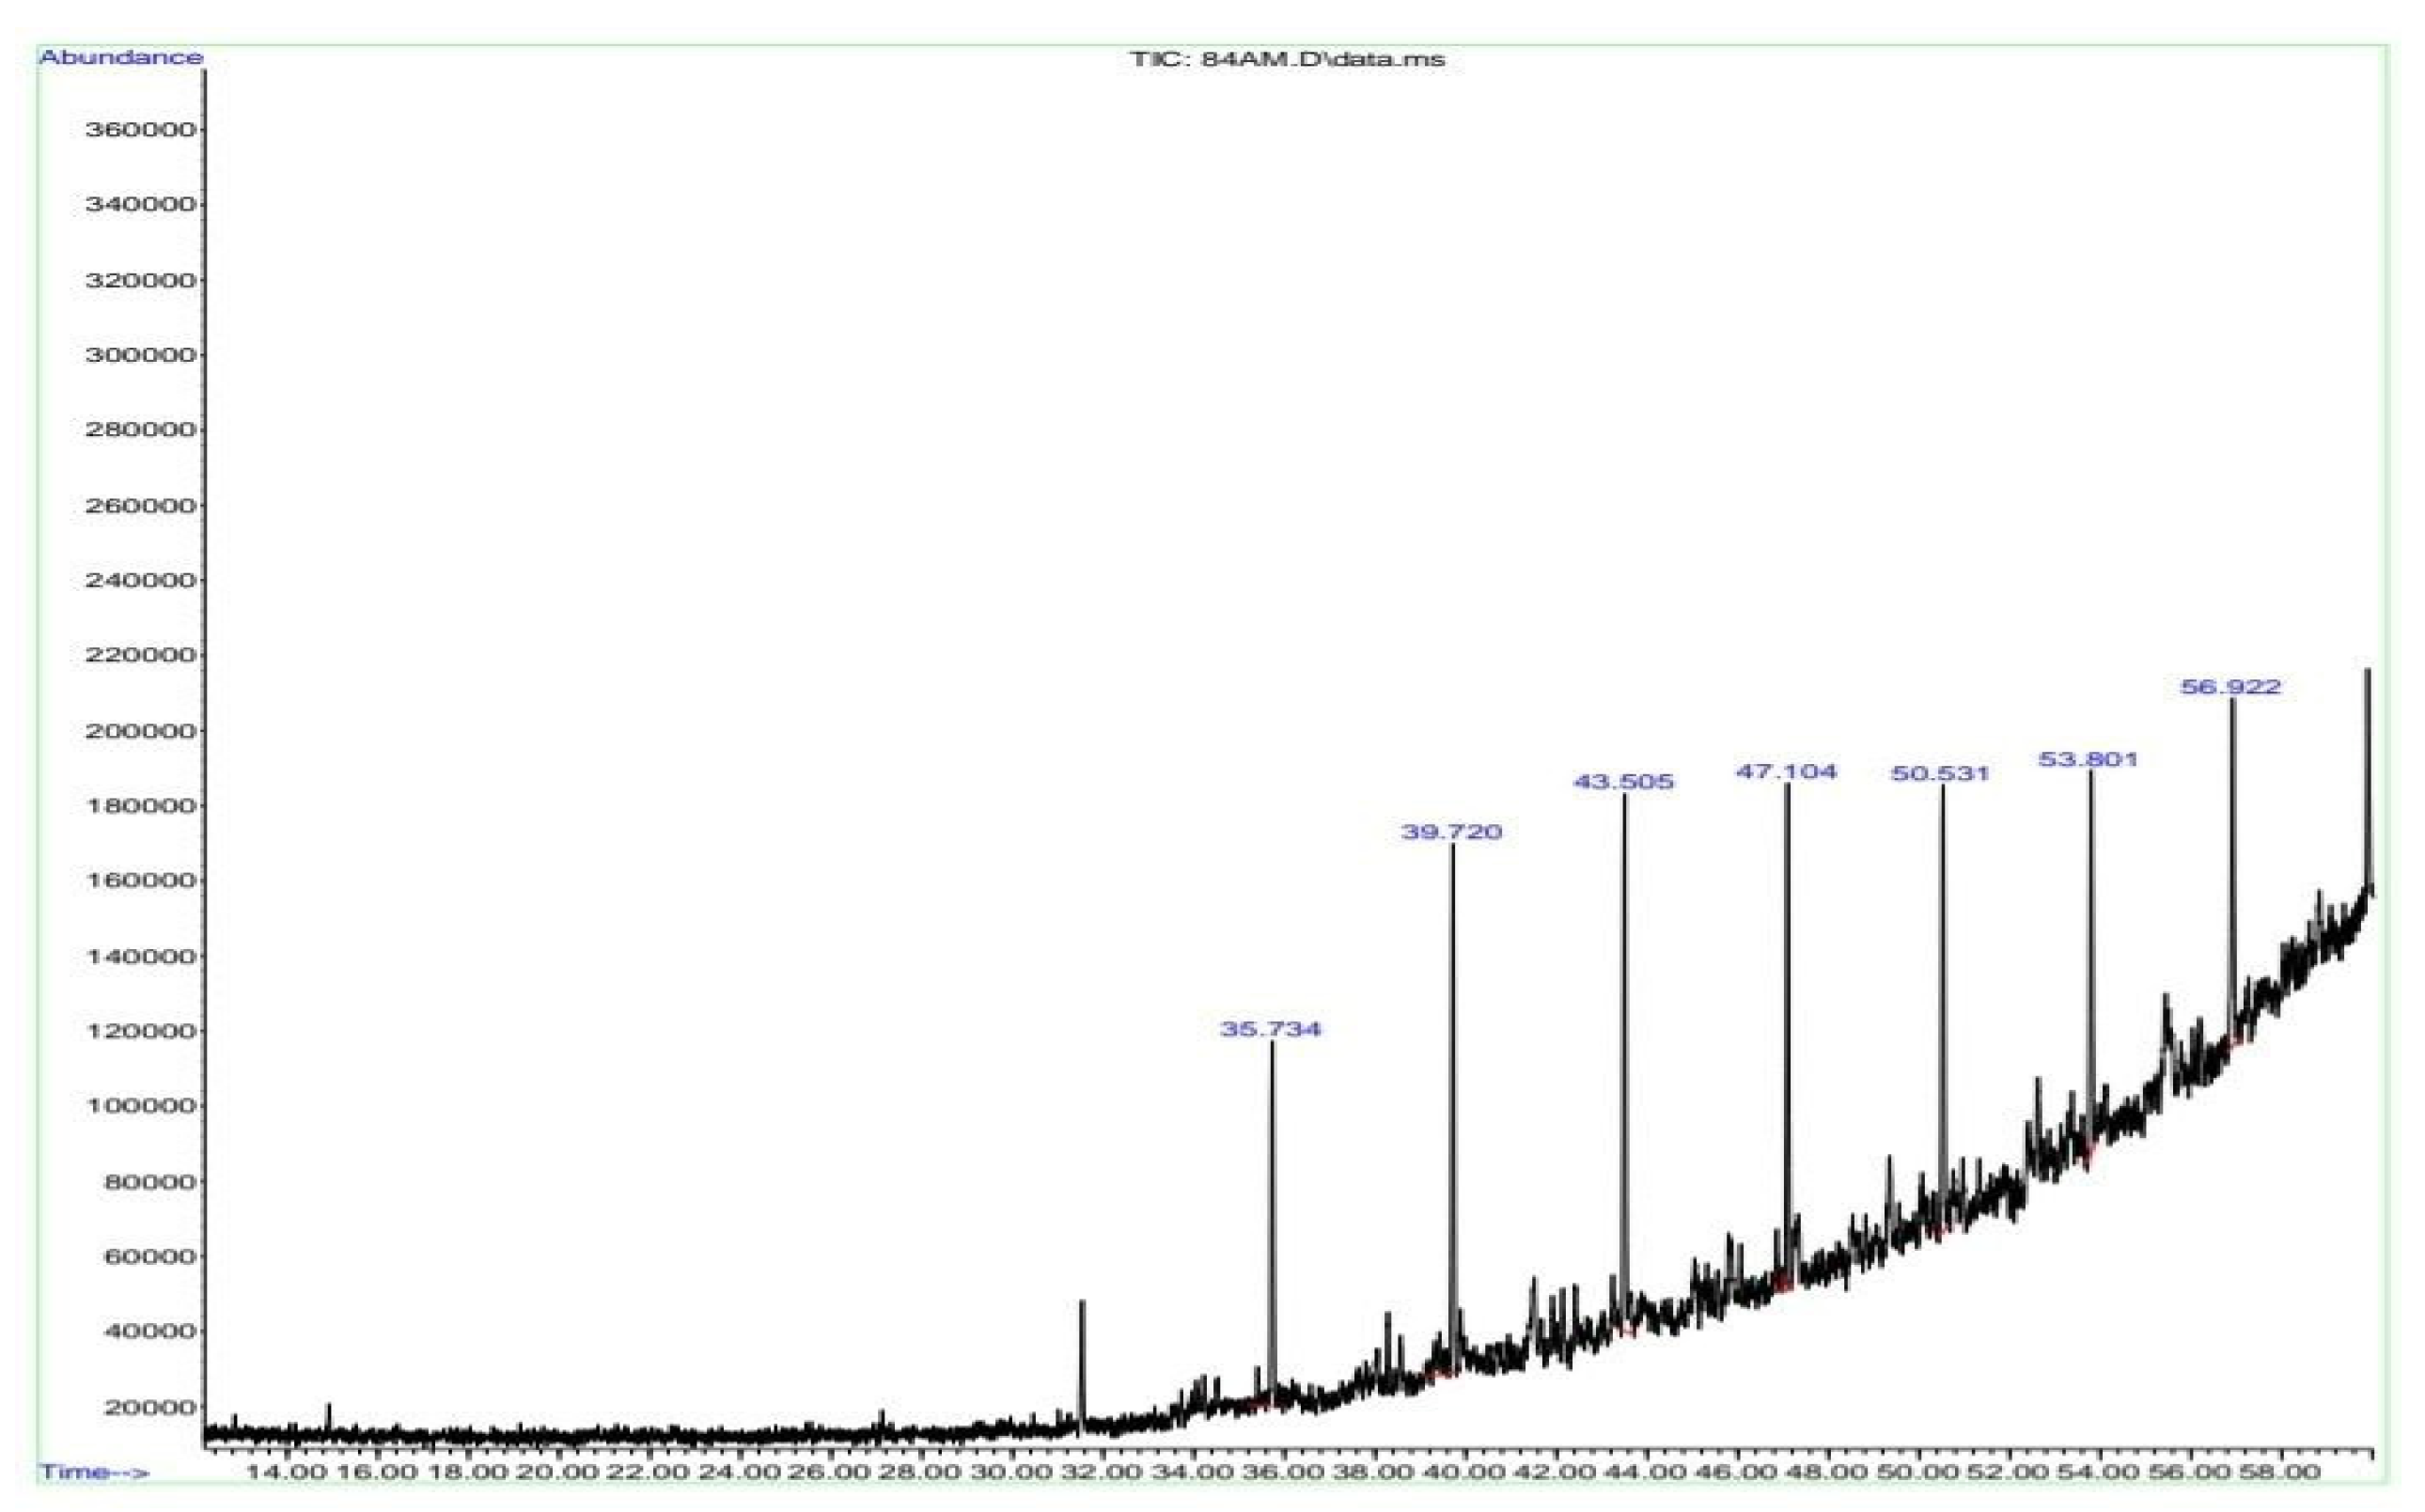
Figure 4.
FTIR spectrum of a) (CS-co-PE)/Glu, b) (CS-co-PE)/SHMP microspheres.
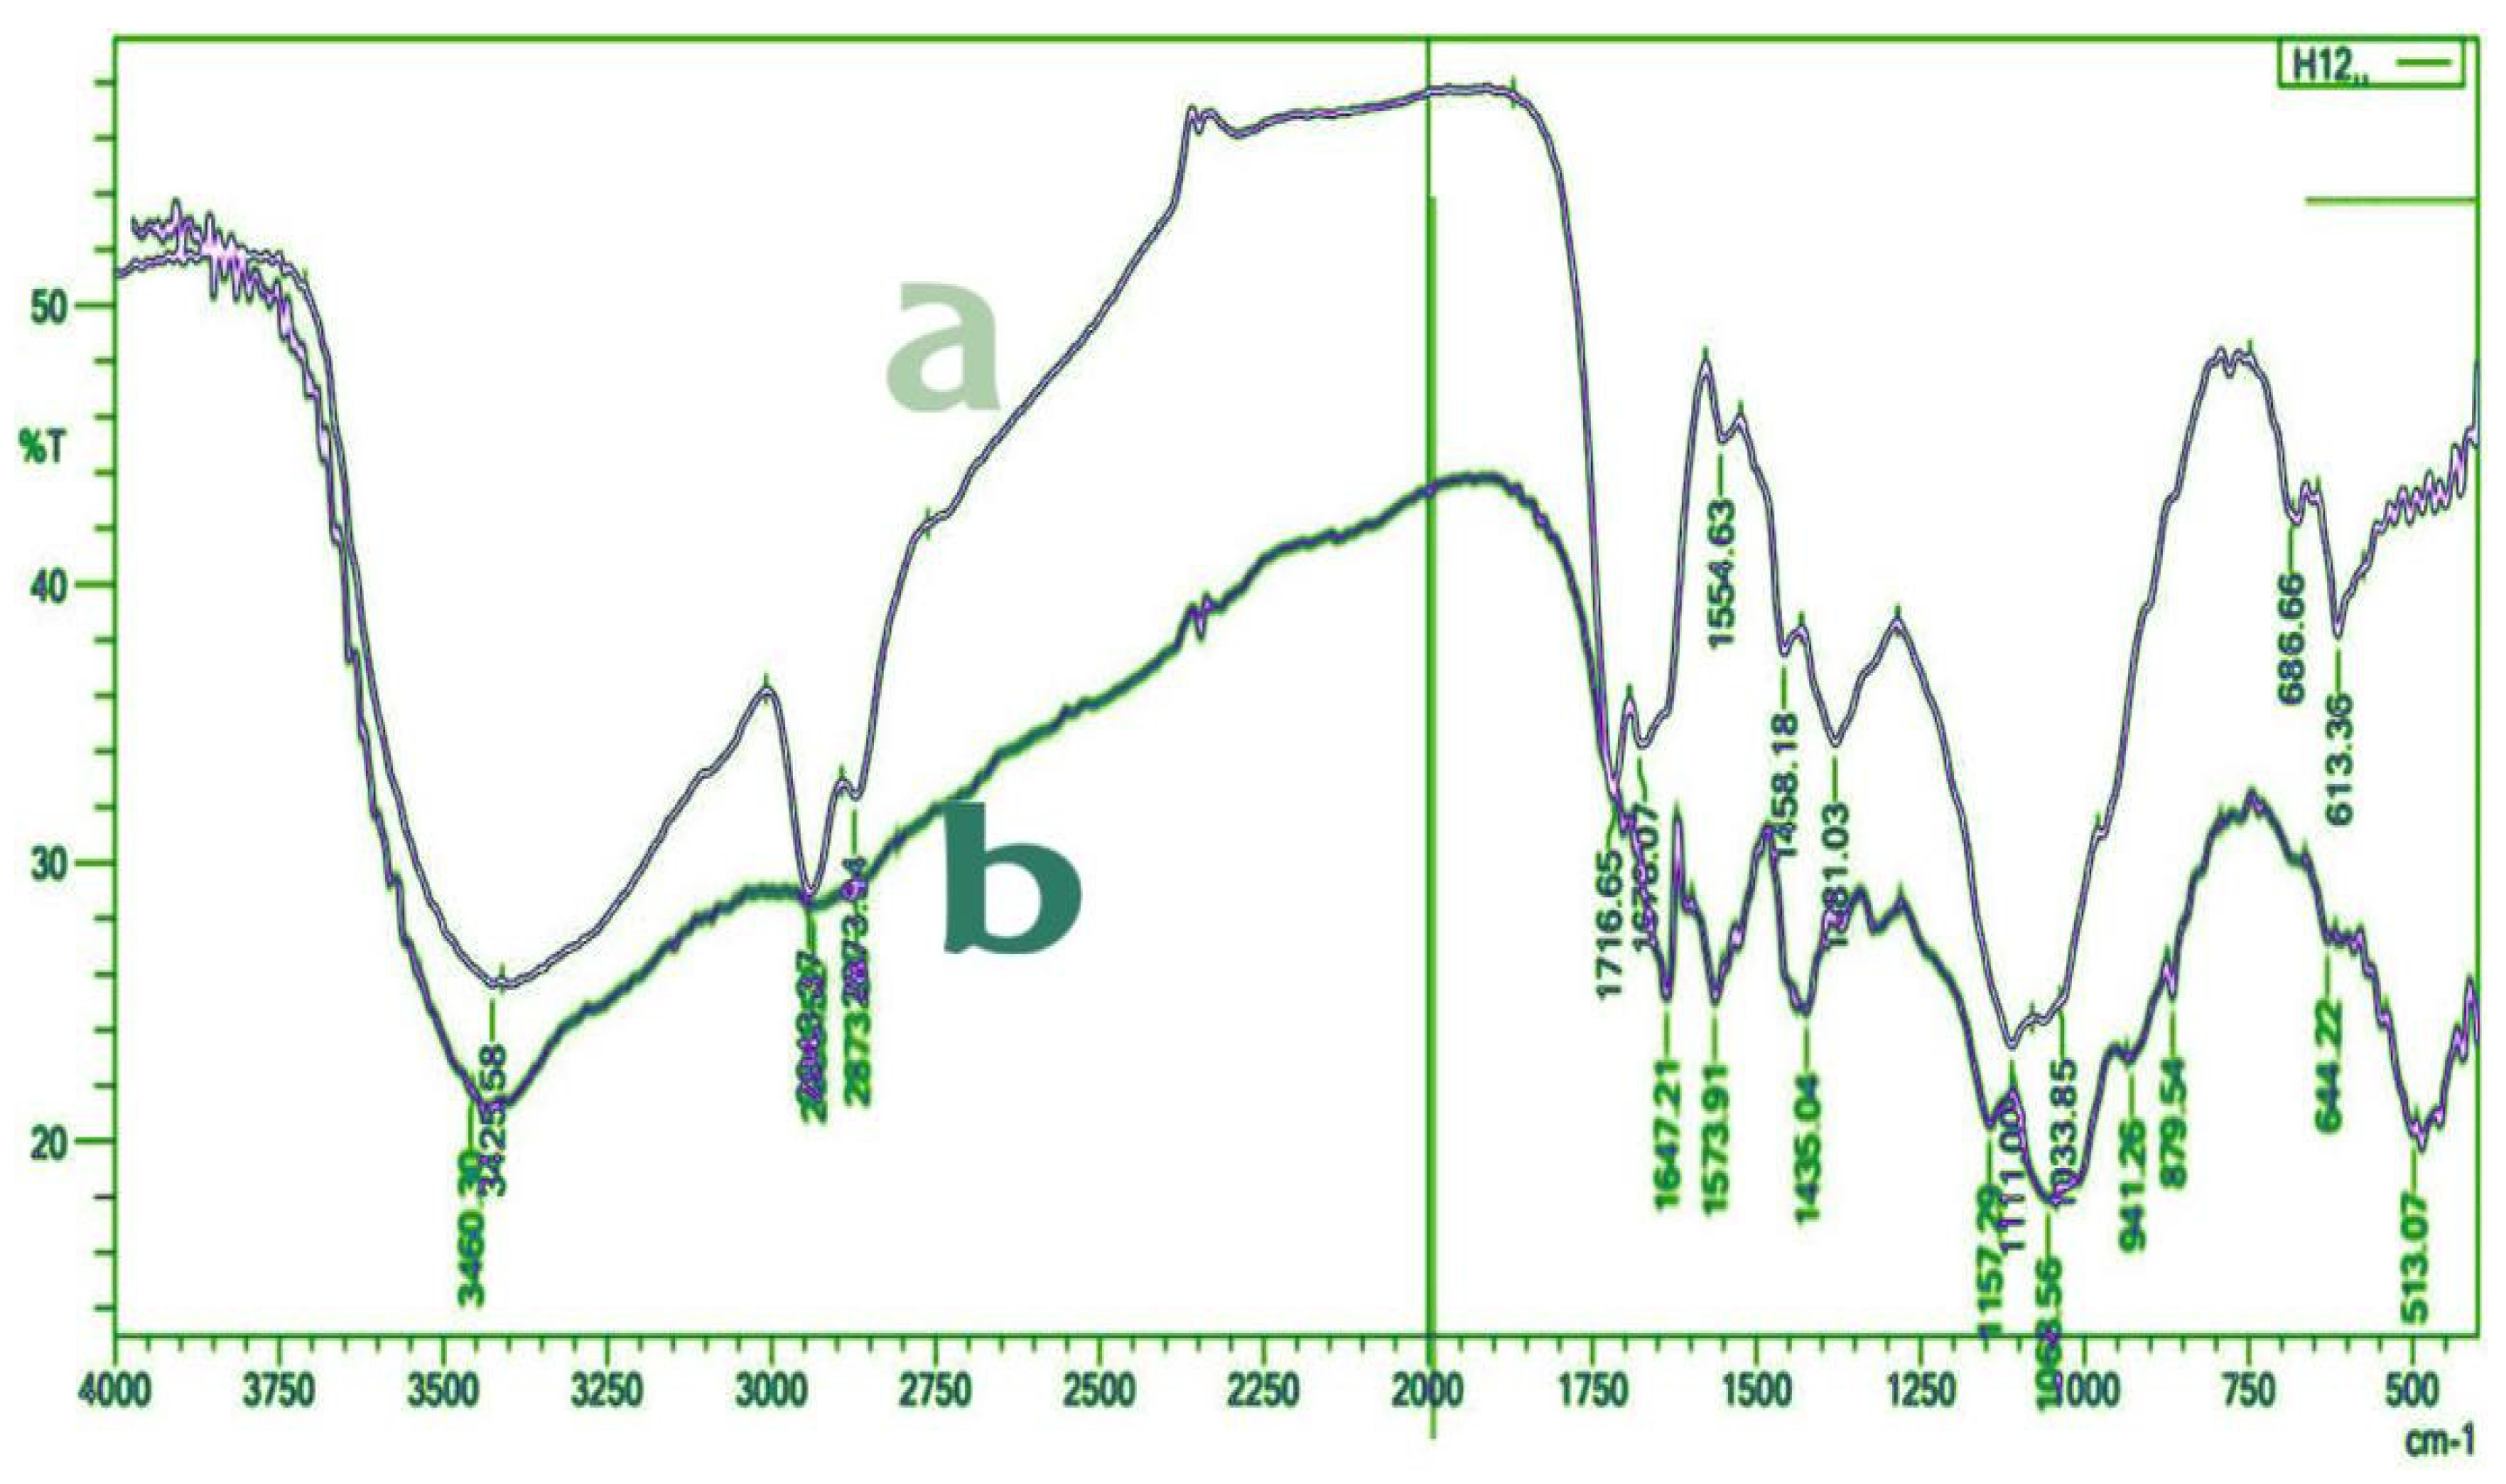
Figure 5.
XRD Pattern of a) (CS-co-PE)/Glu, b)(CS-co-PE)/SHMP hydrogels.
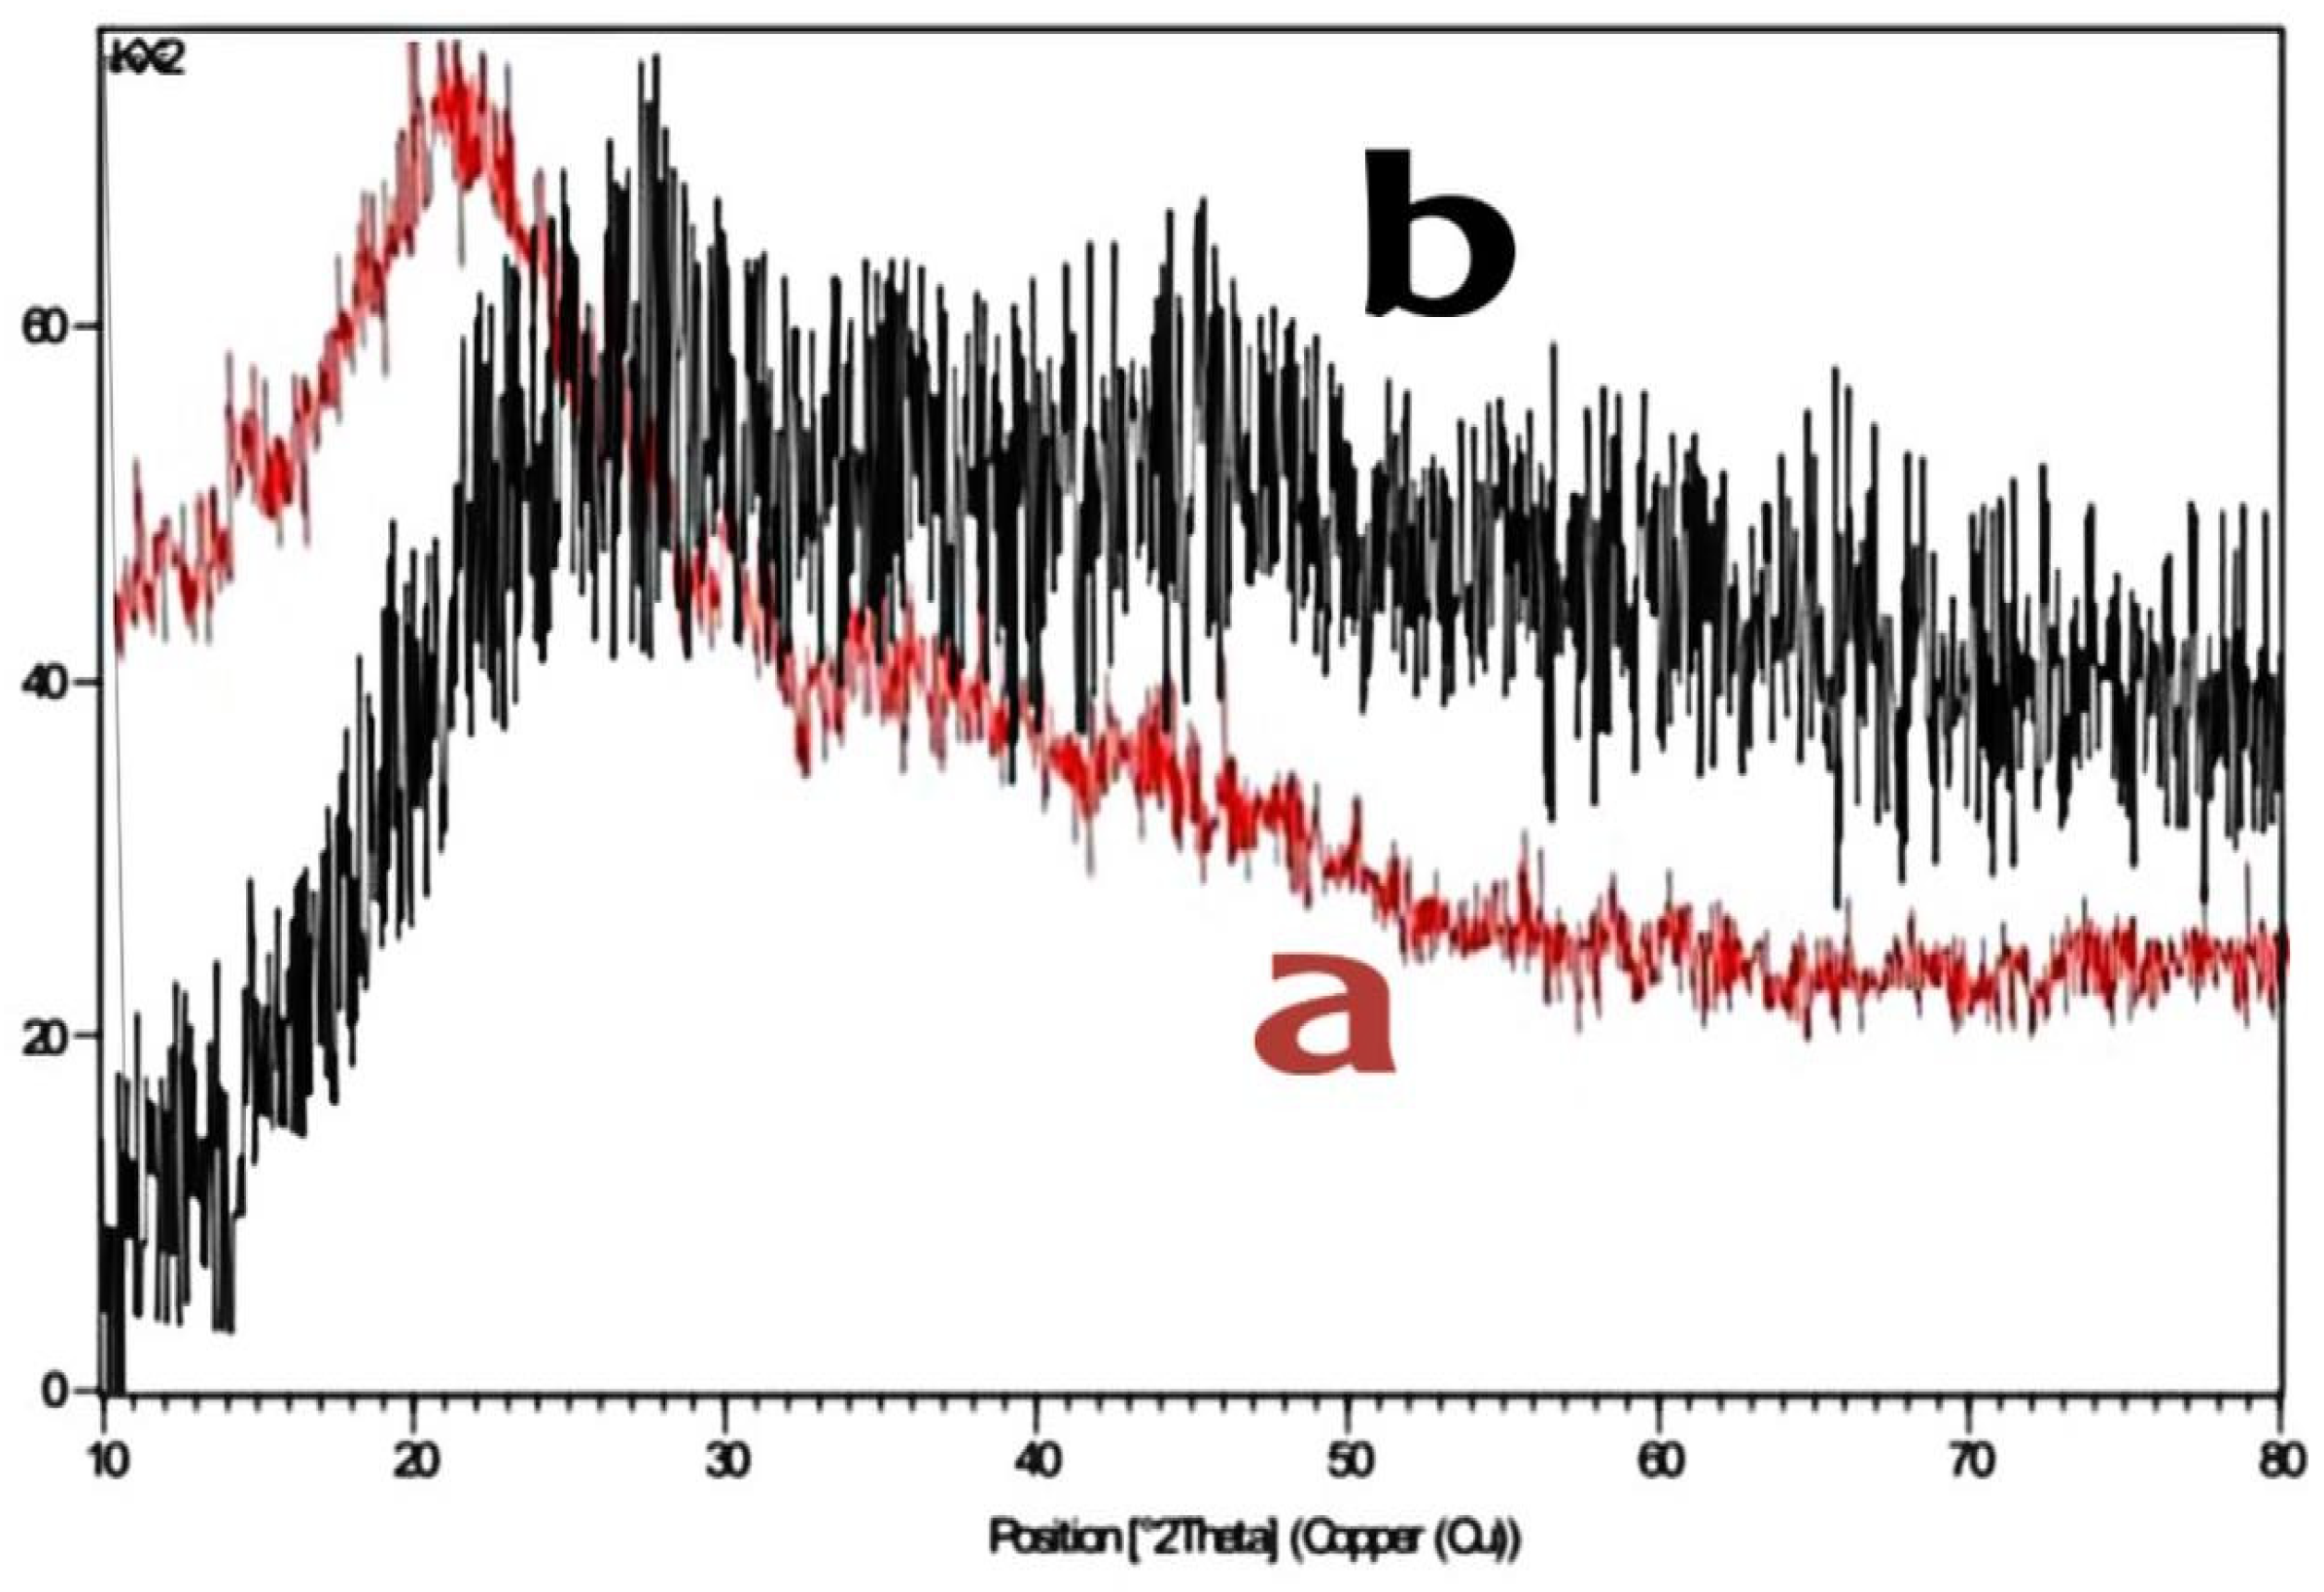
Figure 6.
SEM image of (CS-co-PE)/Glu.
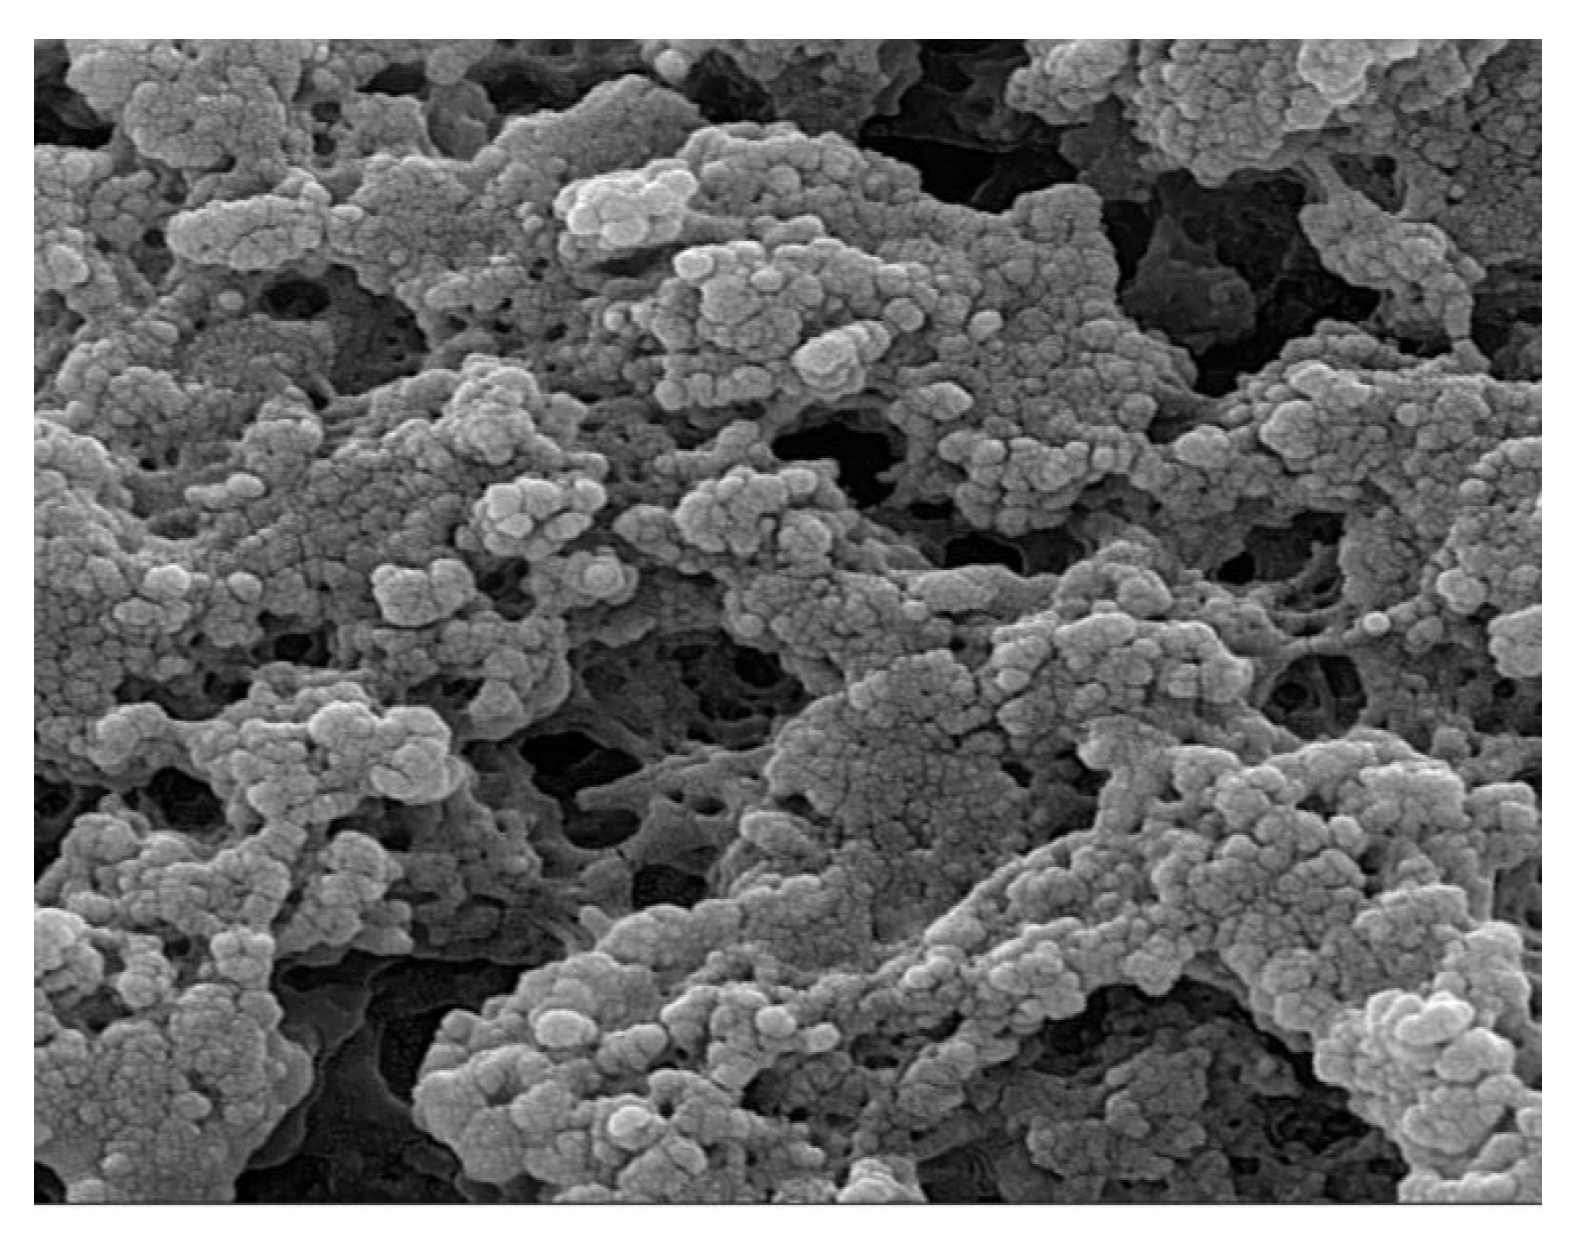
Figure 7.
SEM image of (CS-co-PE)/SHMP.
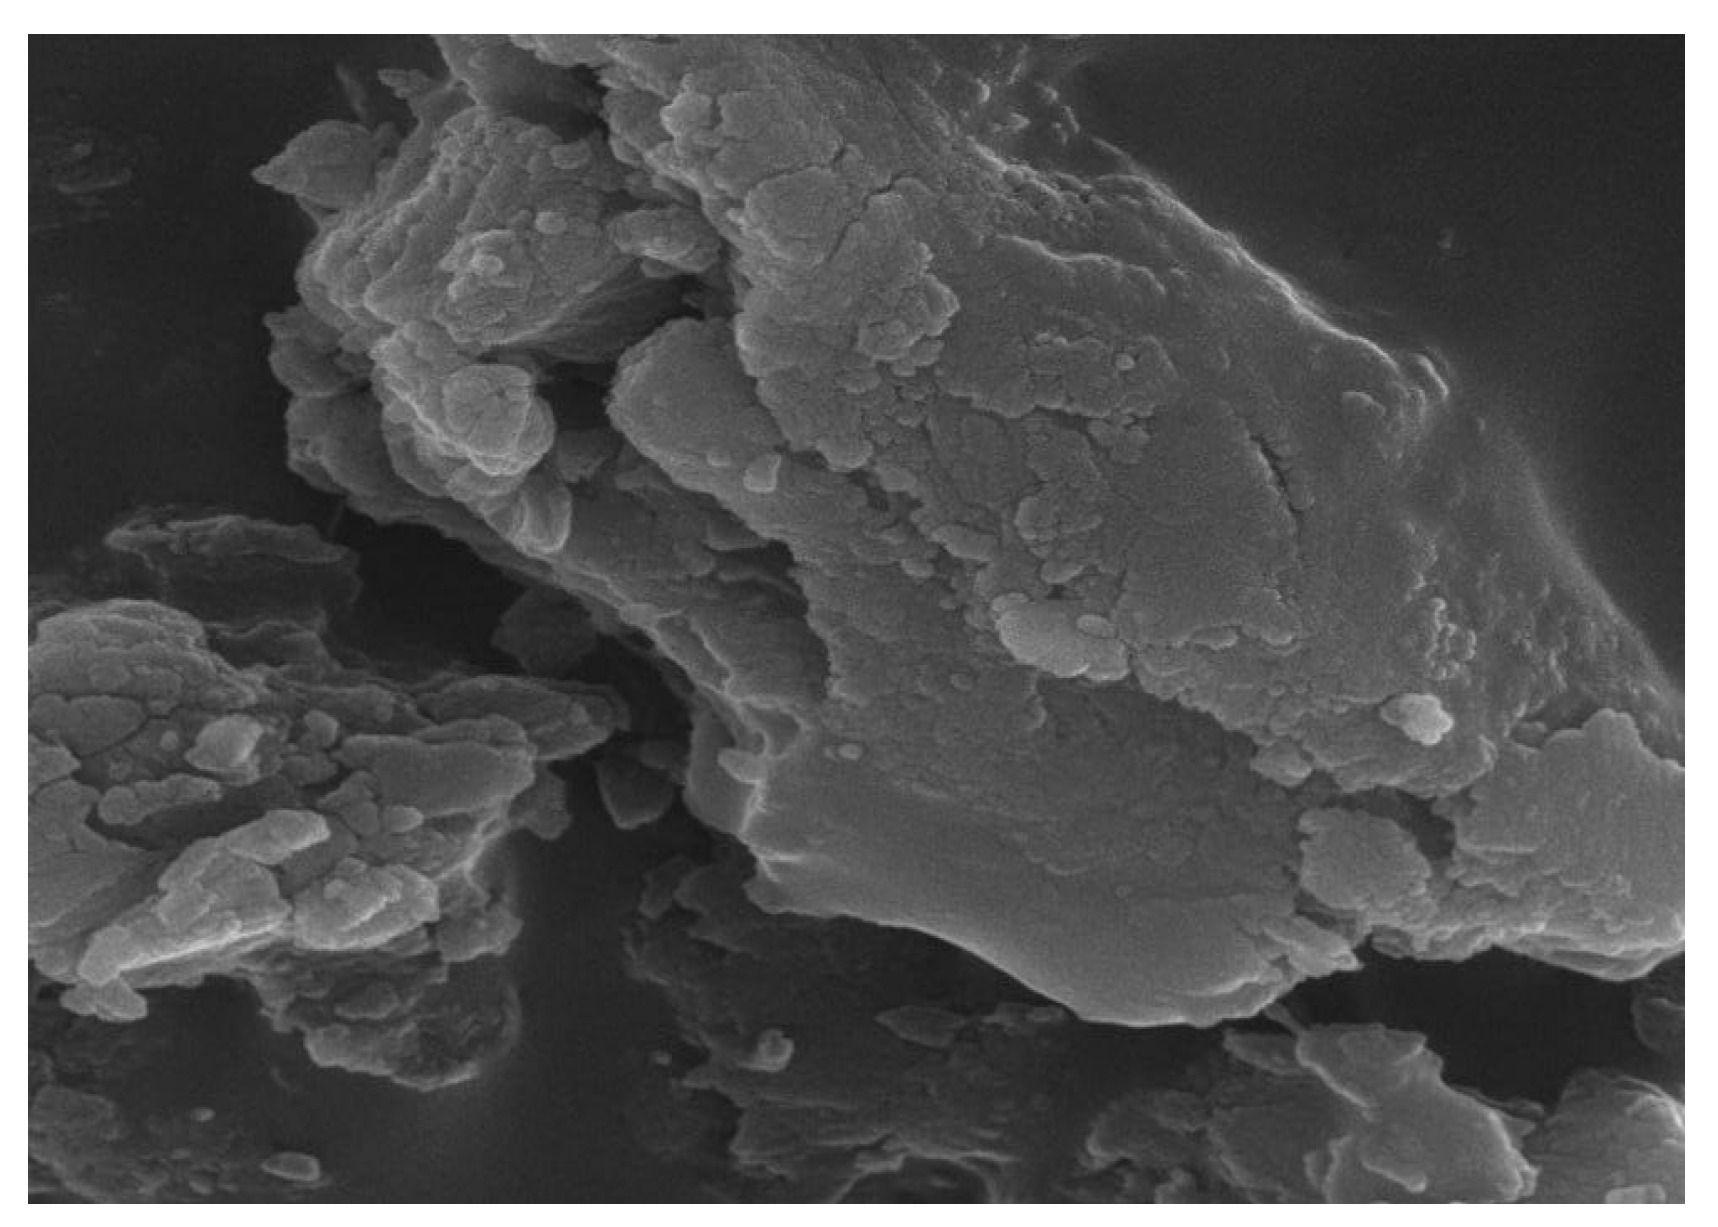
Figure 8.
SEM image of a) (CS-co-PE)/Glu, b)(CS-co-PE)/SHMP hydrogels.
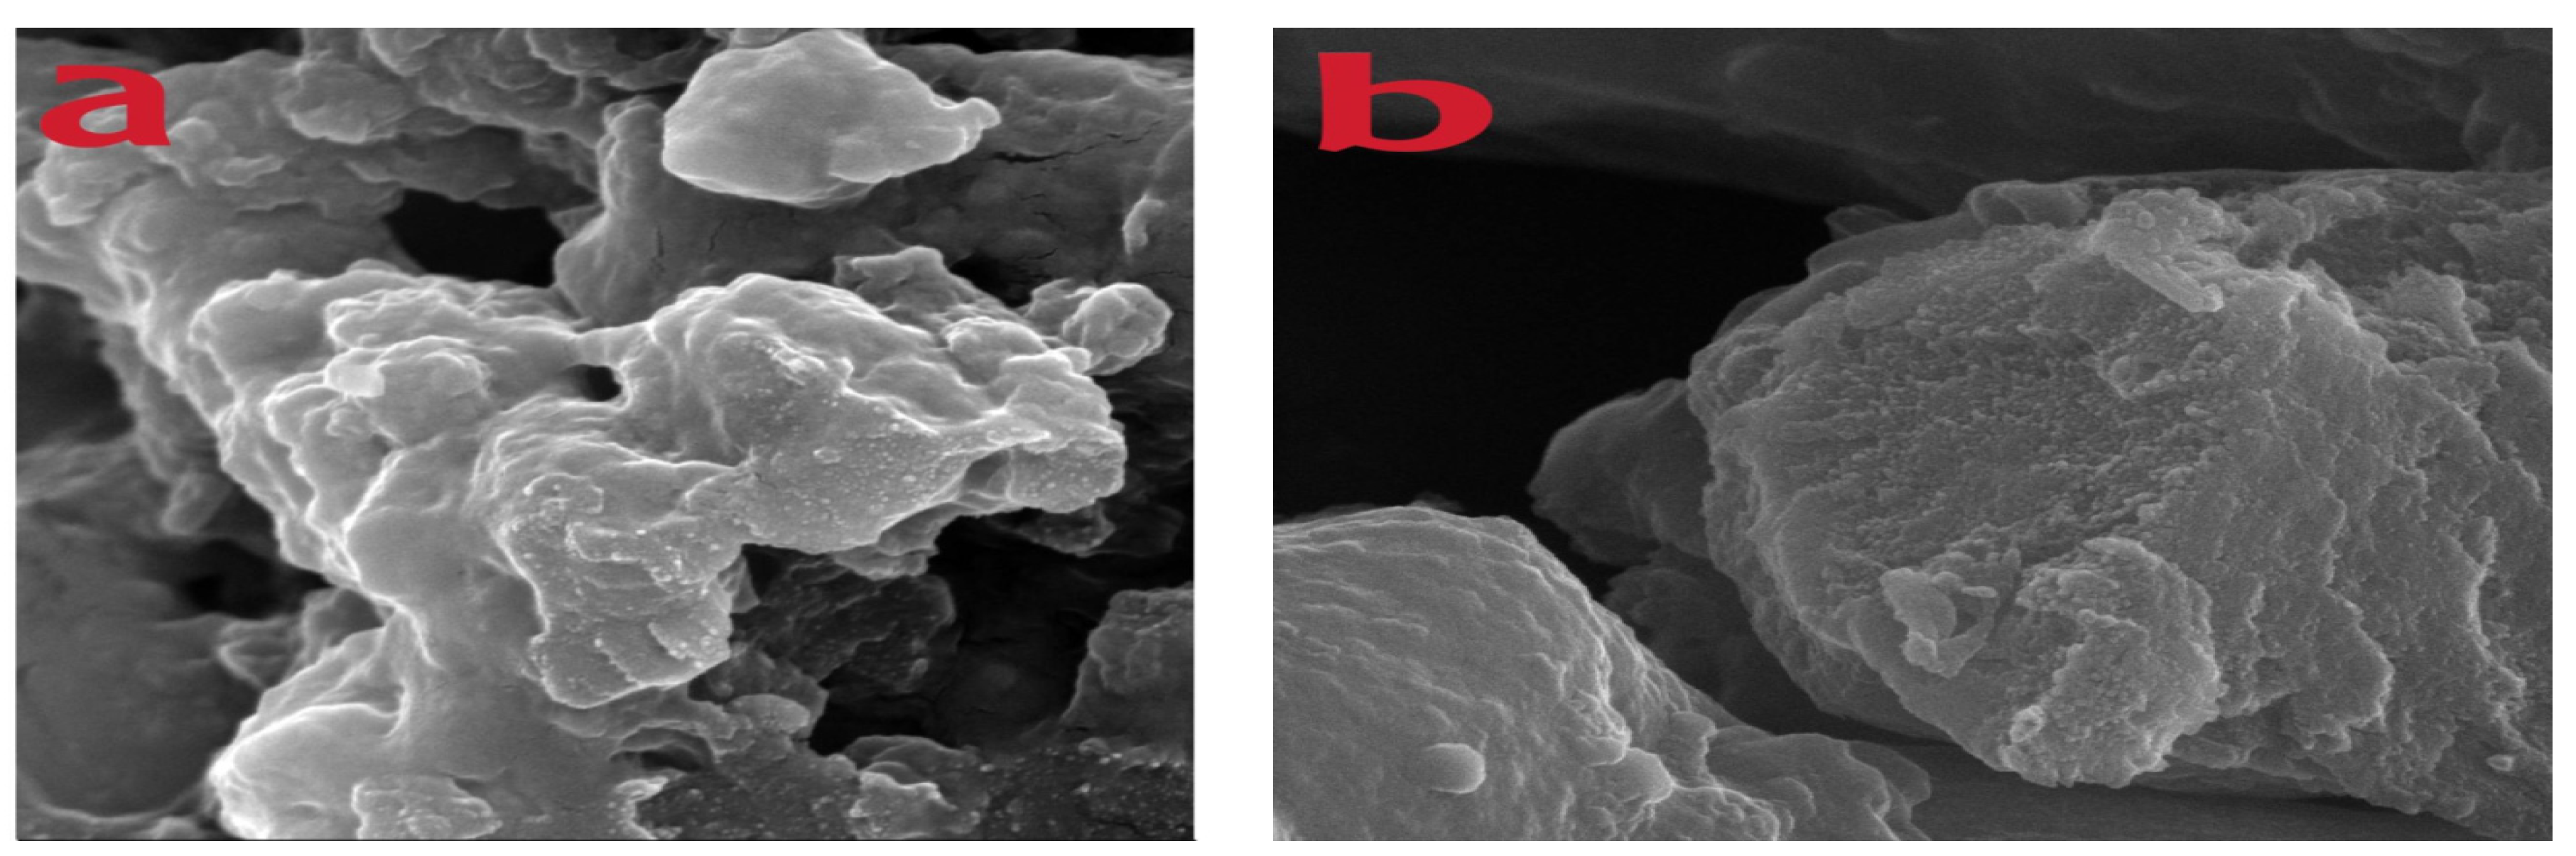
Figure 9.
Degree of swelling of (CS-co-PE)/Glu and(CS-co-PE)/SHMP microspheres in pH7.
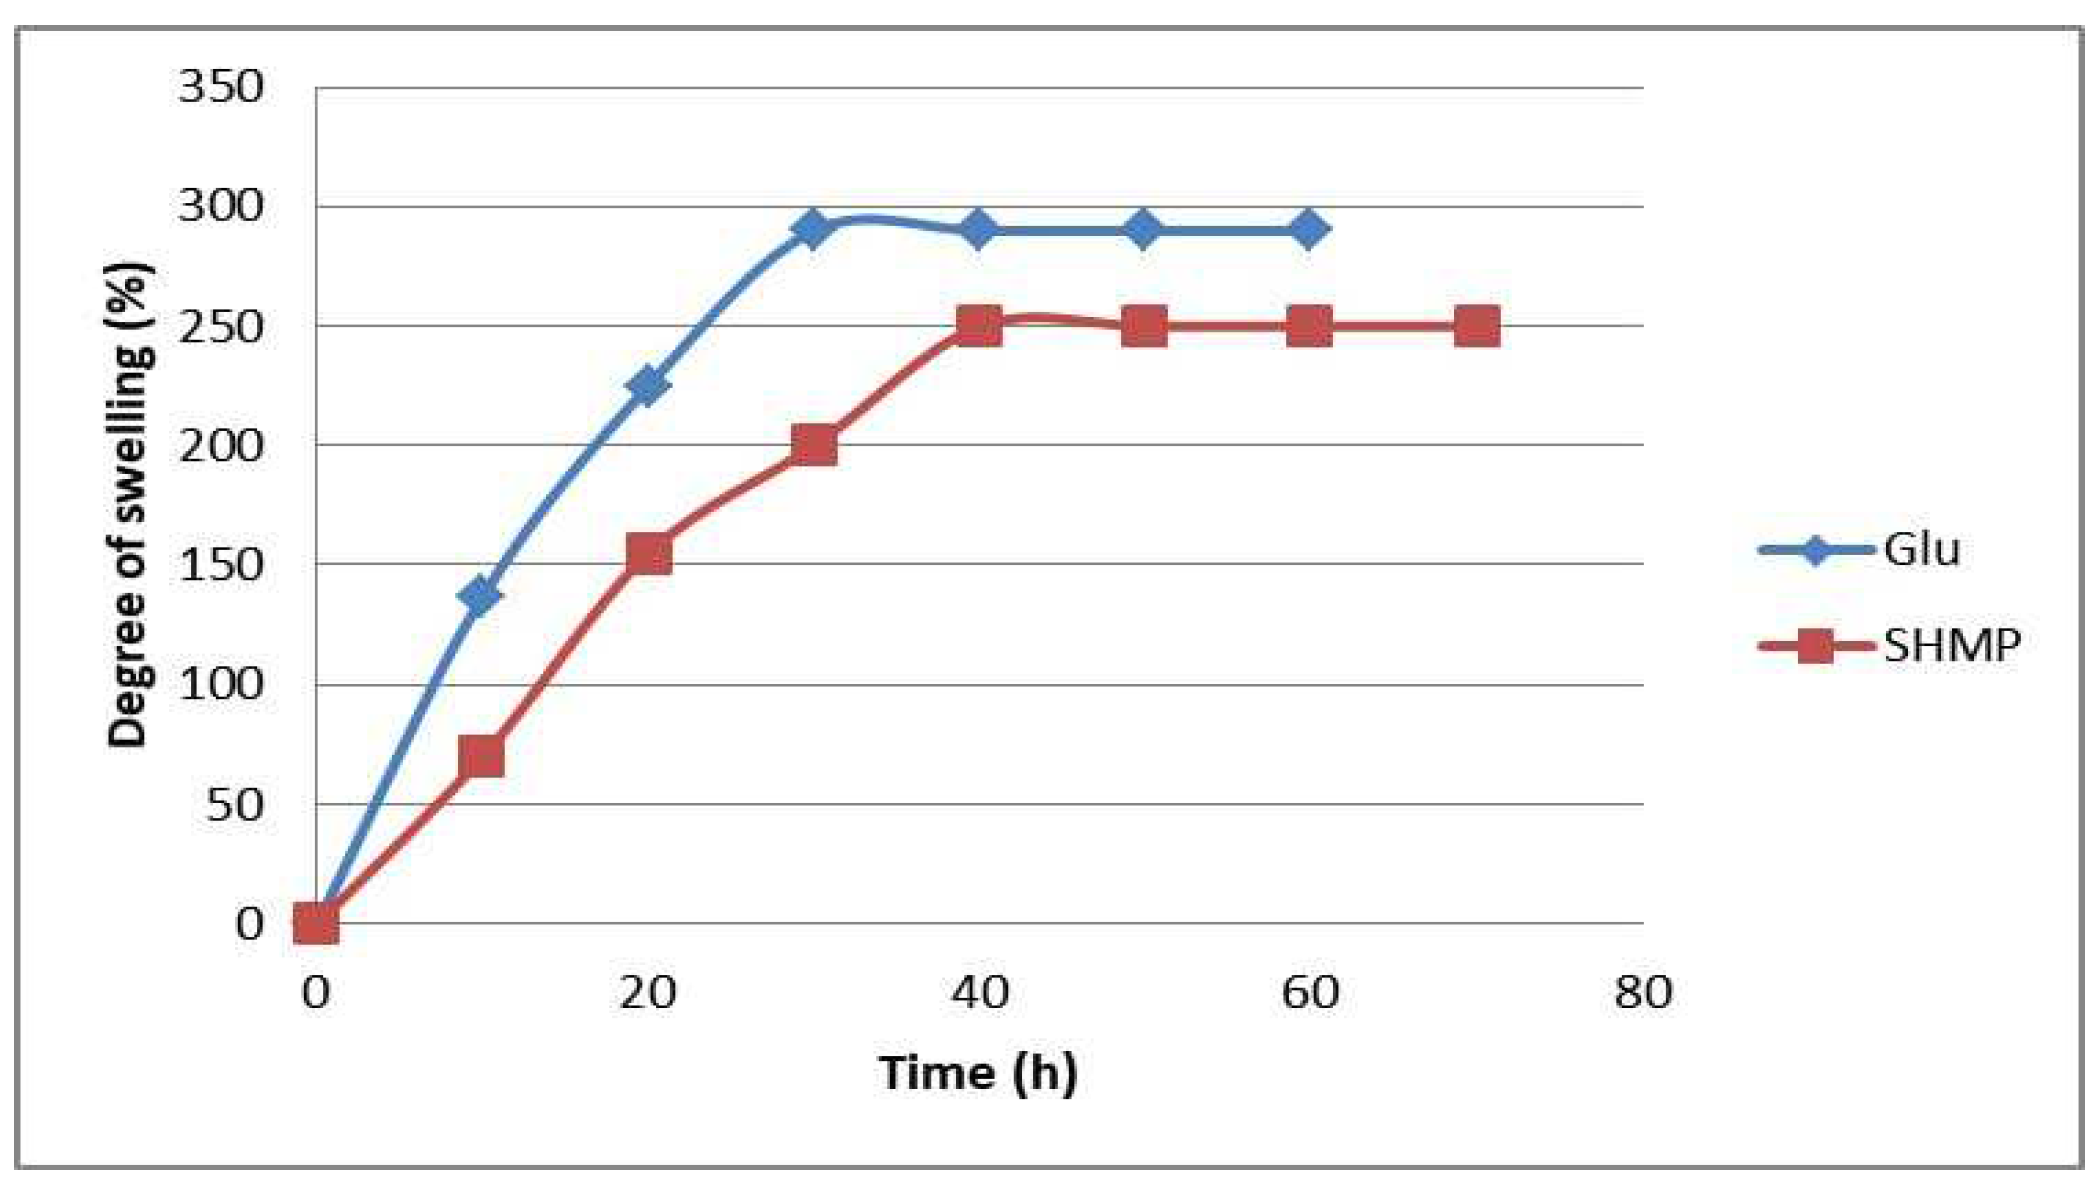
Figure 10.
Loading of Favipiravir on (CS-co-PE) microspheres cross-linked with Glu and SHMP. Loading time =24h, loading media = 100mg microspheres in 50mL phosphate buffered solution of Favipiravir pH=7, T=25oC.
Figure 10.
Loading of Favipiravir on (CS-co-PE) microspheres cross-linked with Glu and SHMP. Loading time =24h, loading media = 100mg microspheres in 50mL phosphate buffered solution of Favipiravir pH=7, T=25oC.
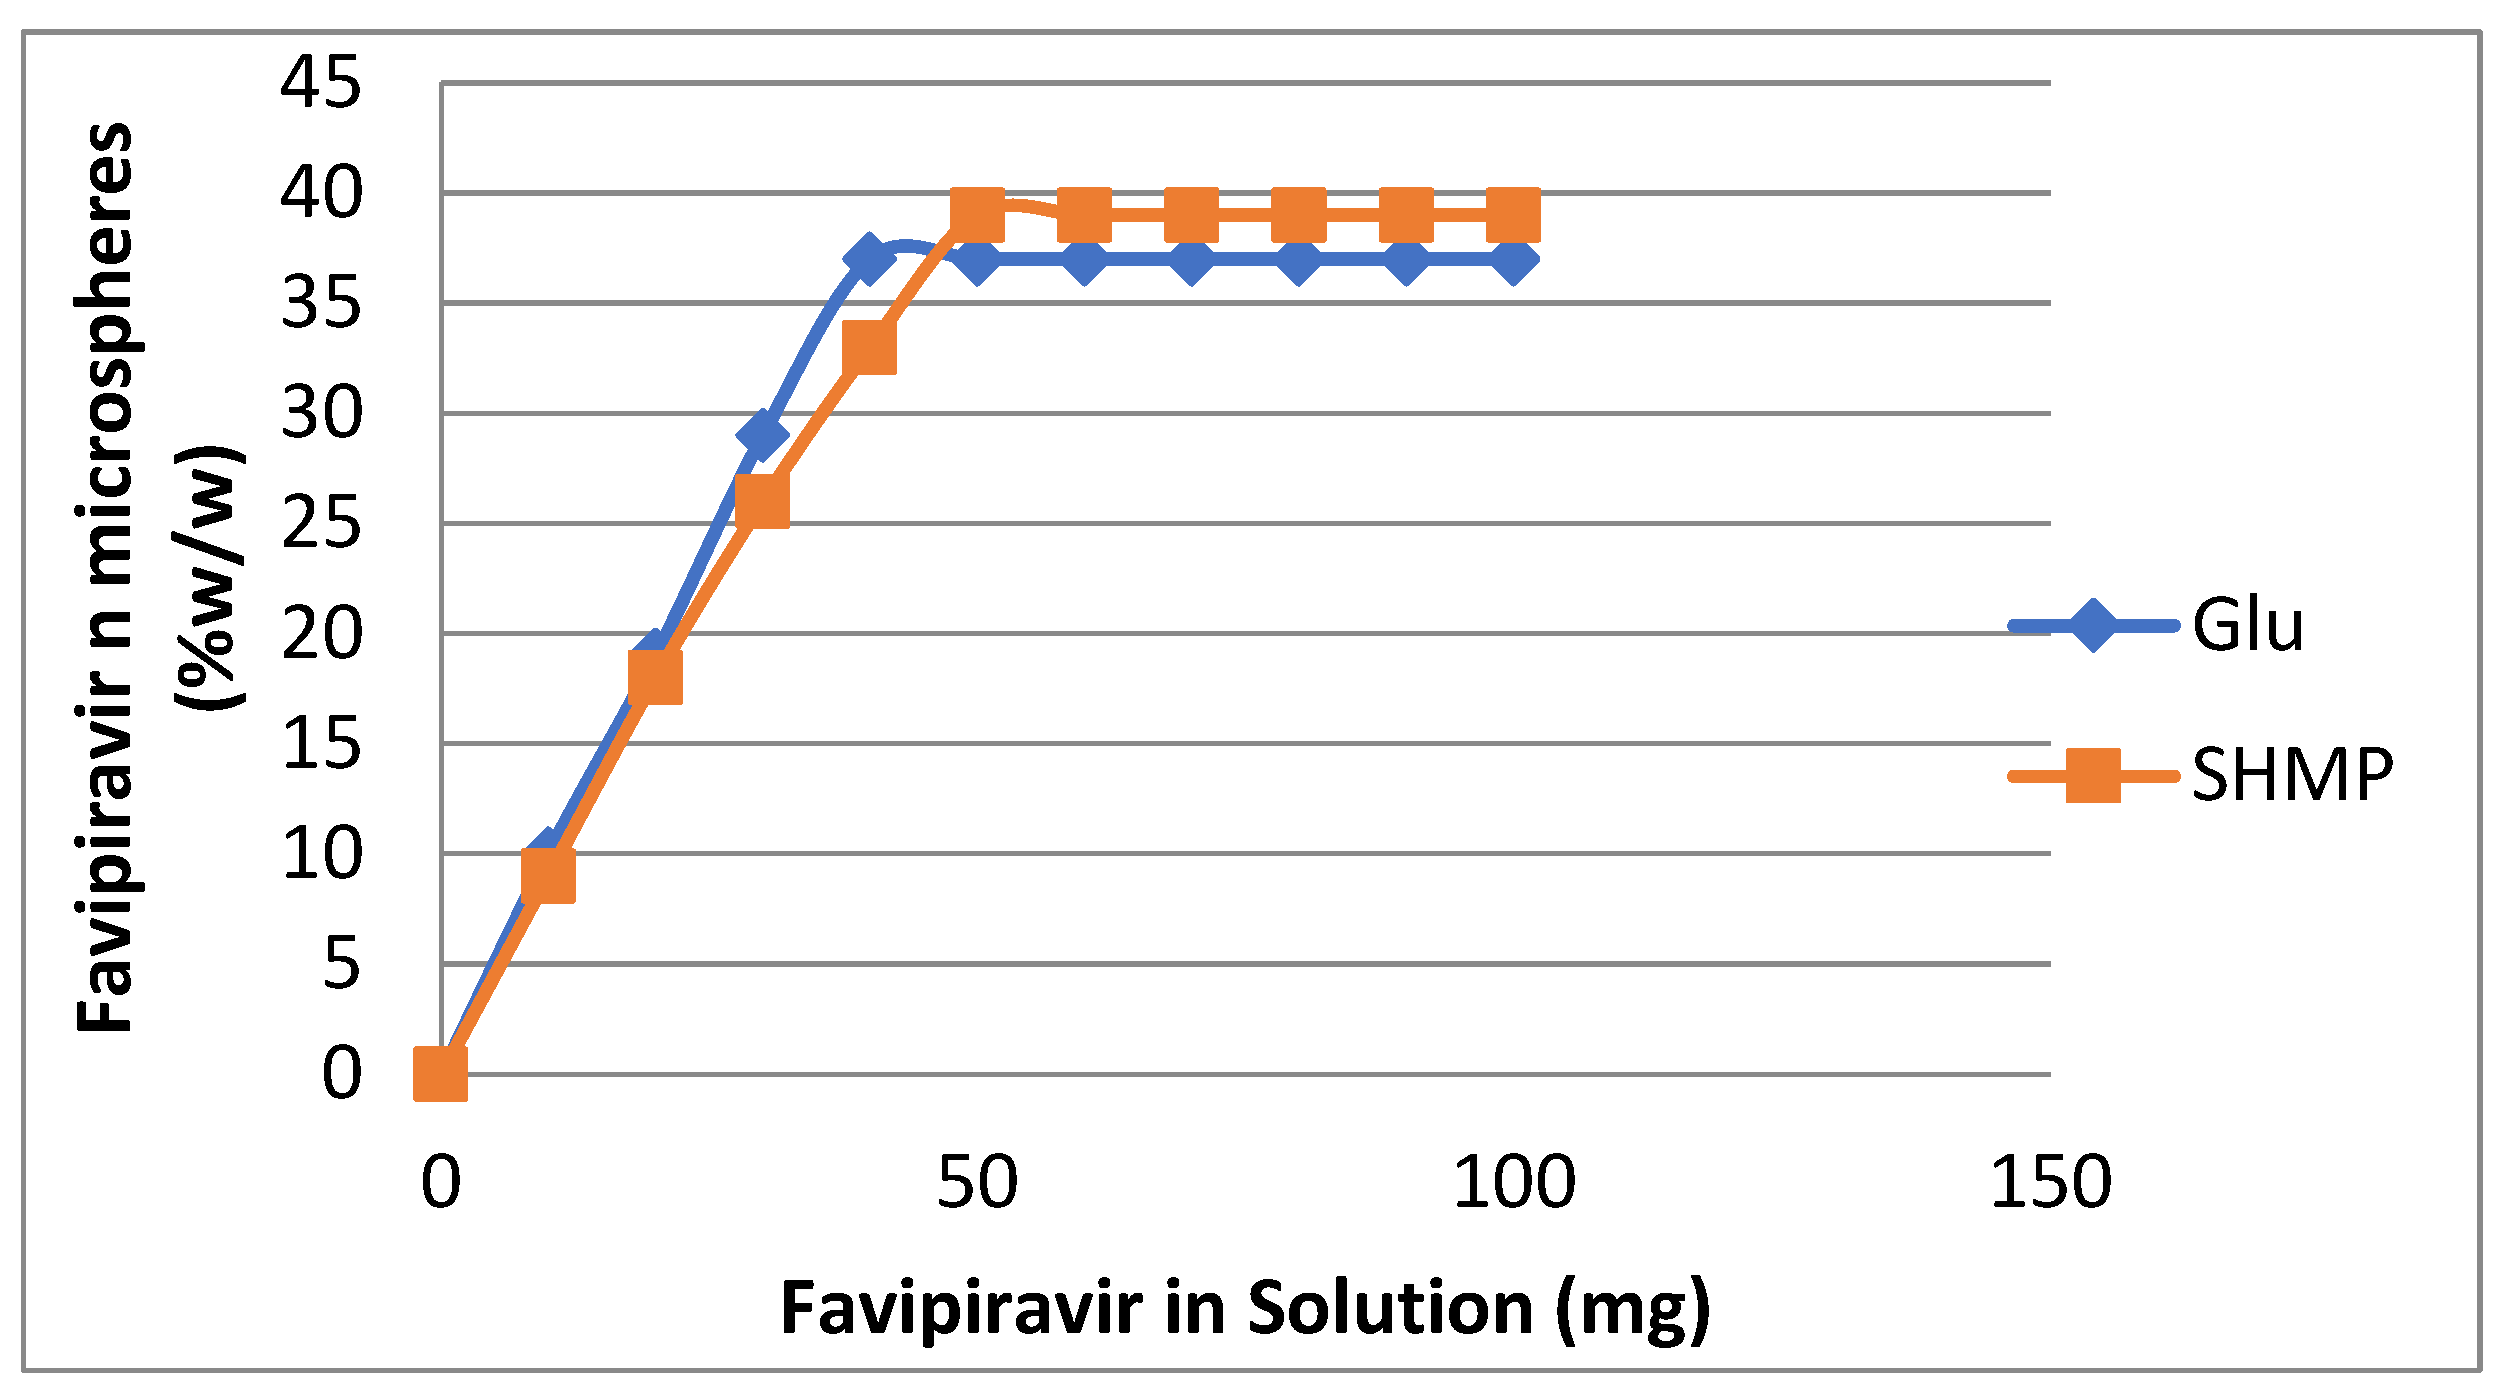
Figure 11.
effect of solution pH on release percentage of Favipiravir from Glu and SHMP cross-linked (CS-co-PE) microspheres. Release media=100mg, loaded microspheres in 20mL buffered solution (pH 7.4; pH 9.4 and pH 1.3) at T=37oC.
Figure 11.
effect of solution pH on release percentage of Favipiravir from Glu and SHMP cross-linked (CS-co-PE) microspheres. Release media=100mg, loaded microspheres in 20mL buffered solution (pH 7.4; pH 9.4 and pH 1.3) at T=37oC.
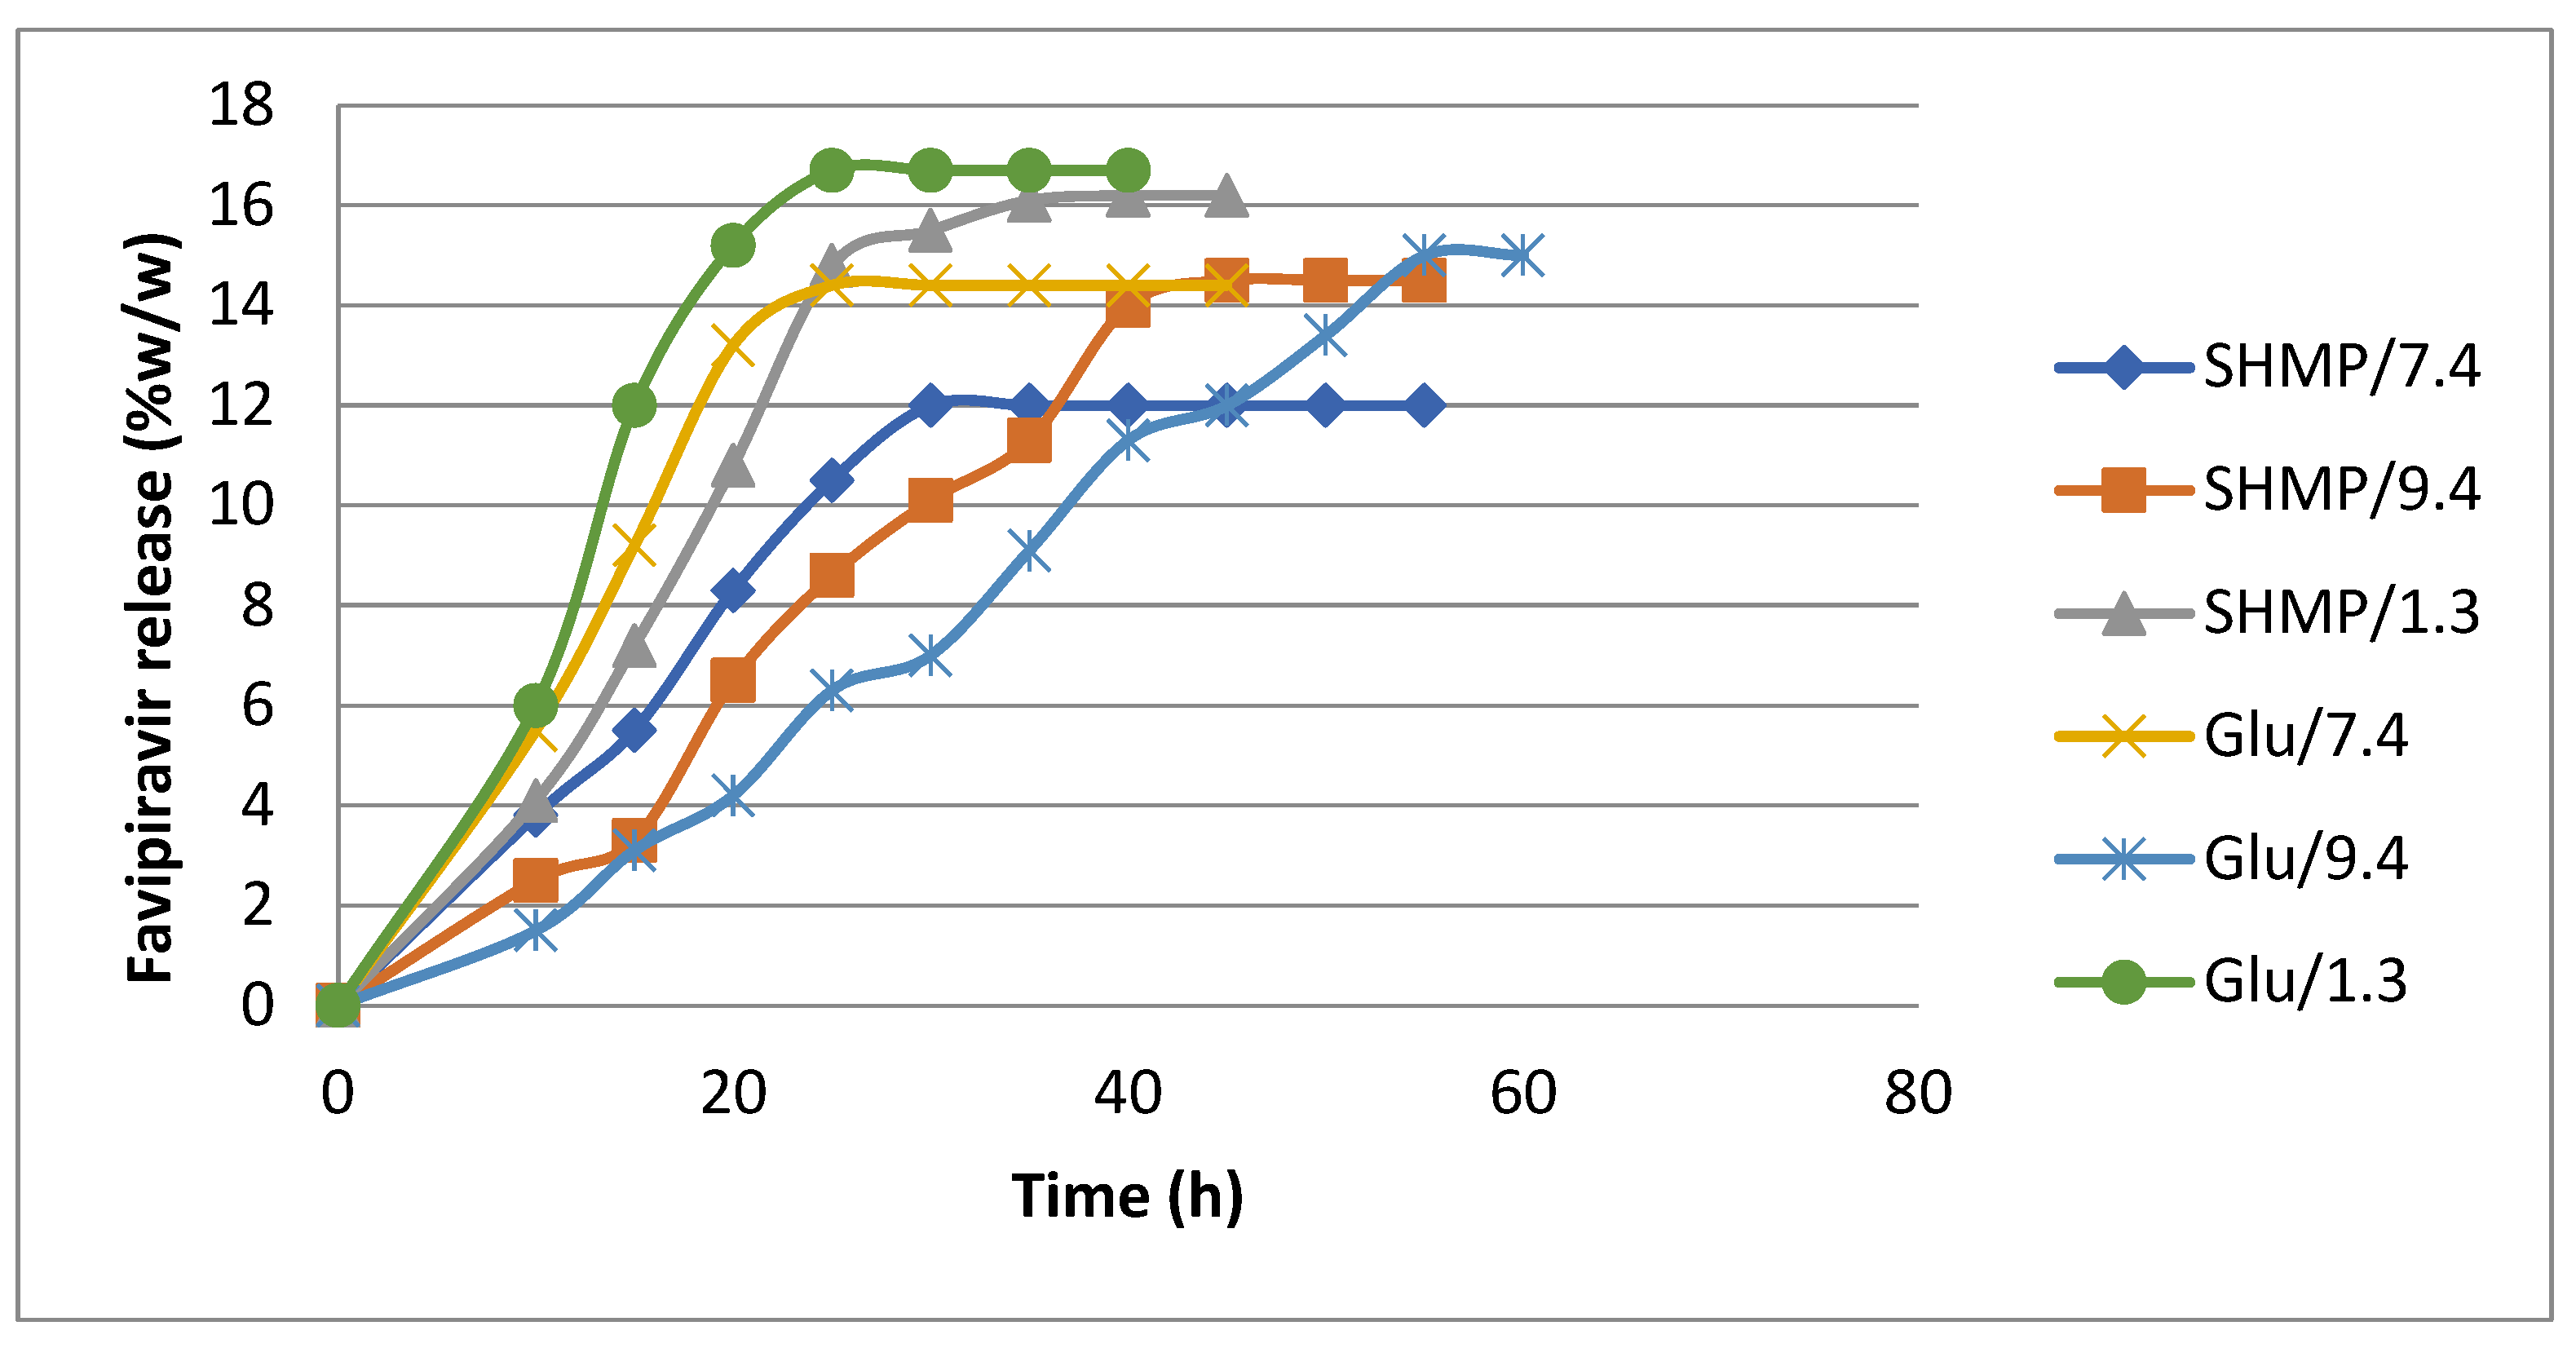
Figure 12.
SEM images of a) (CS-co-PE)/Glu, b)(CS-co-PE)/SHMP microspheres after release.
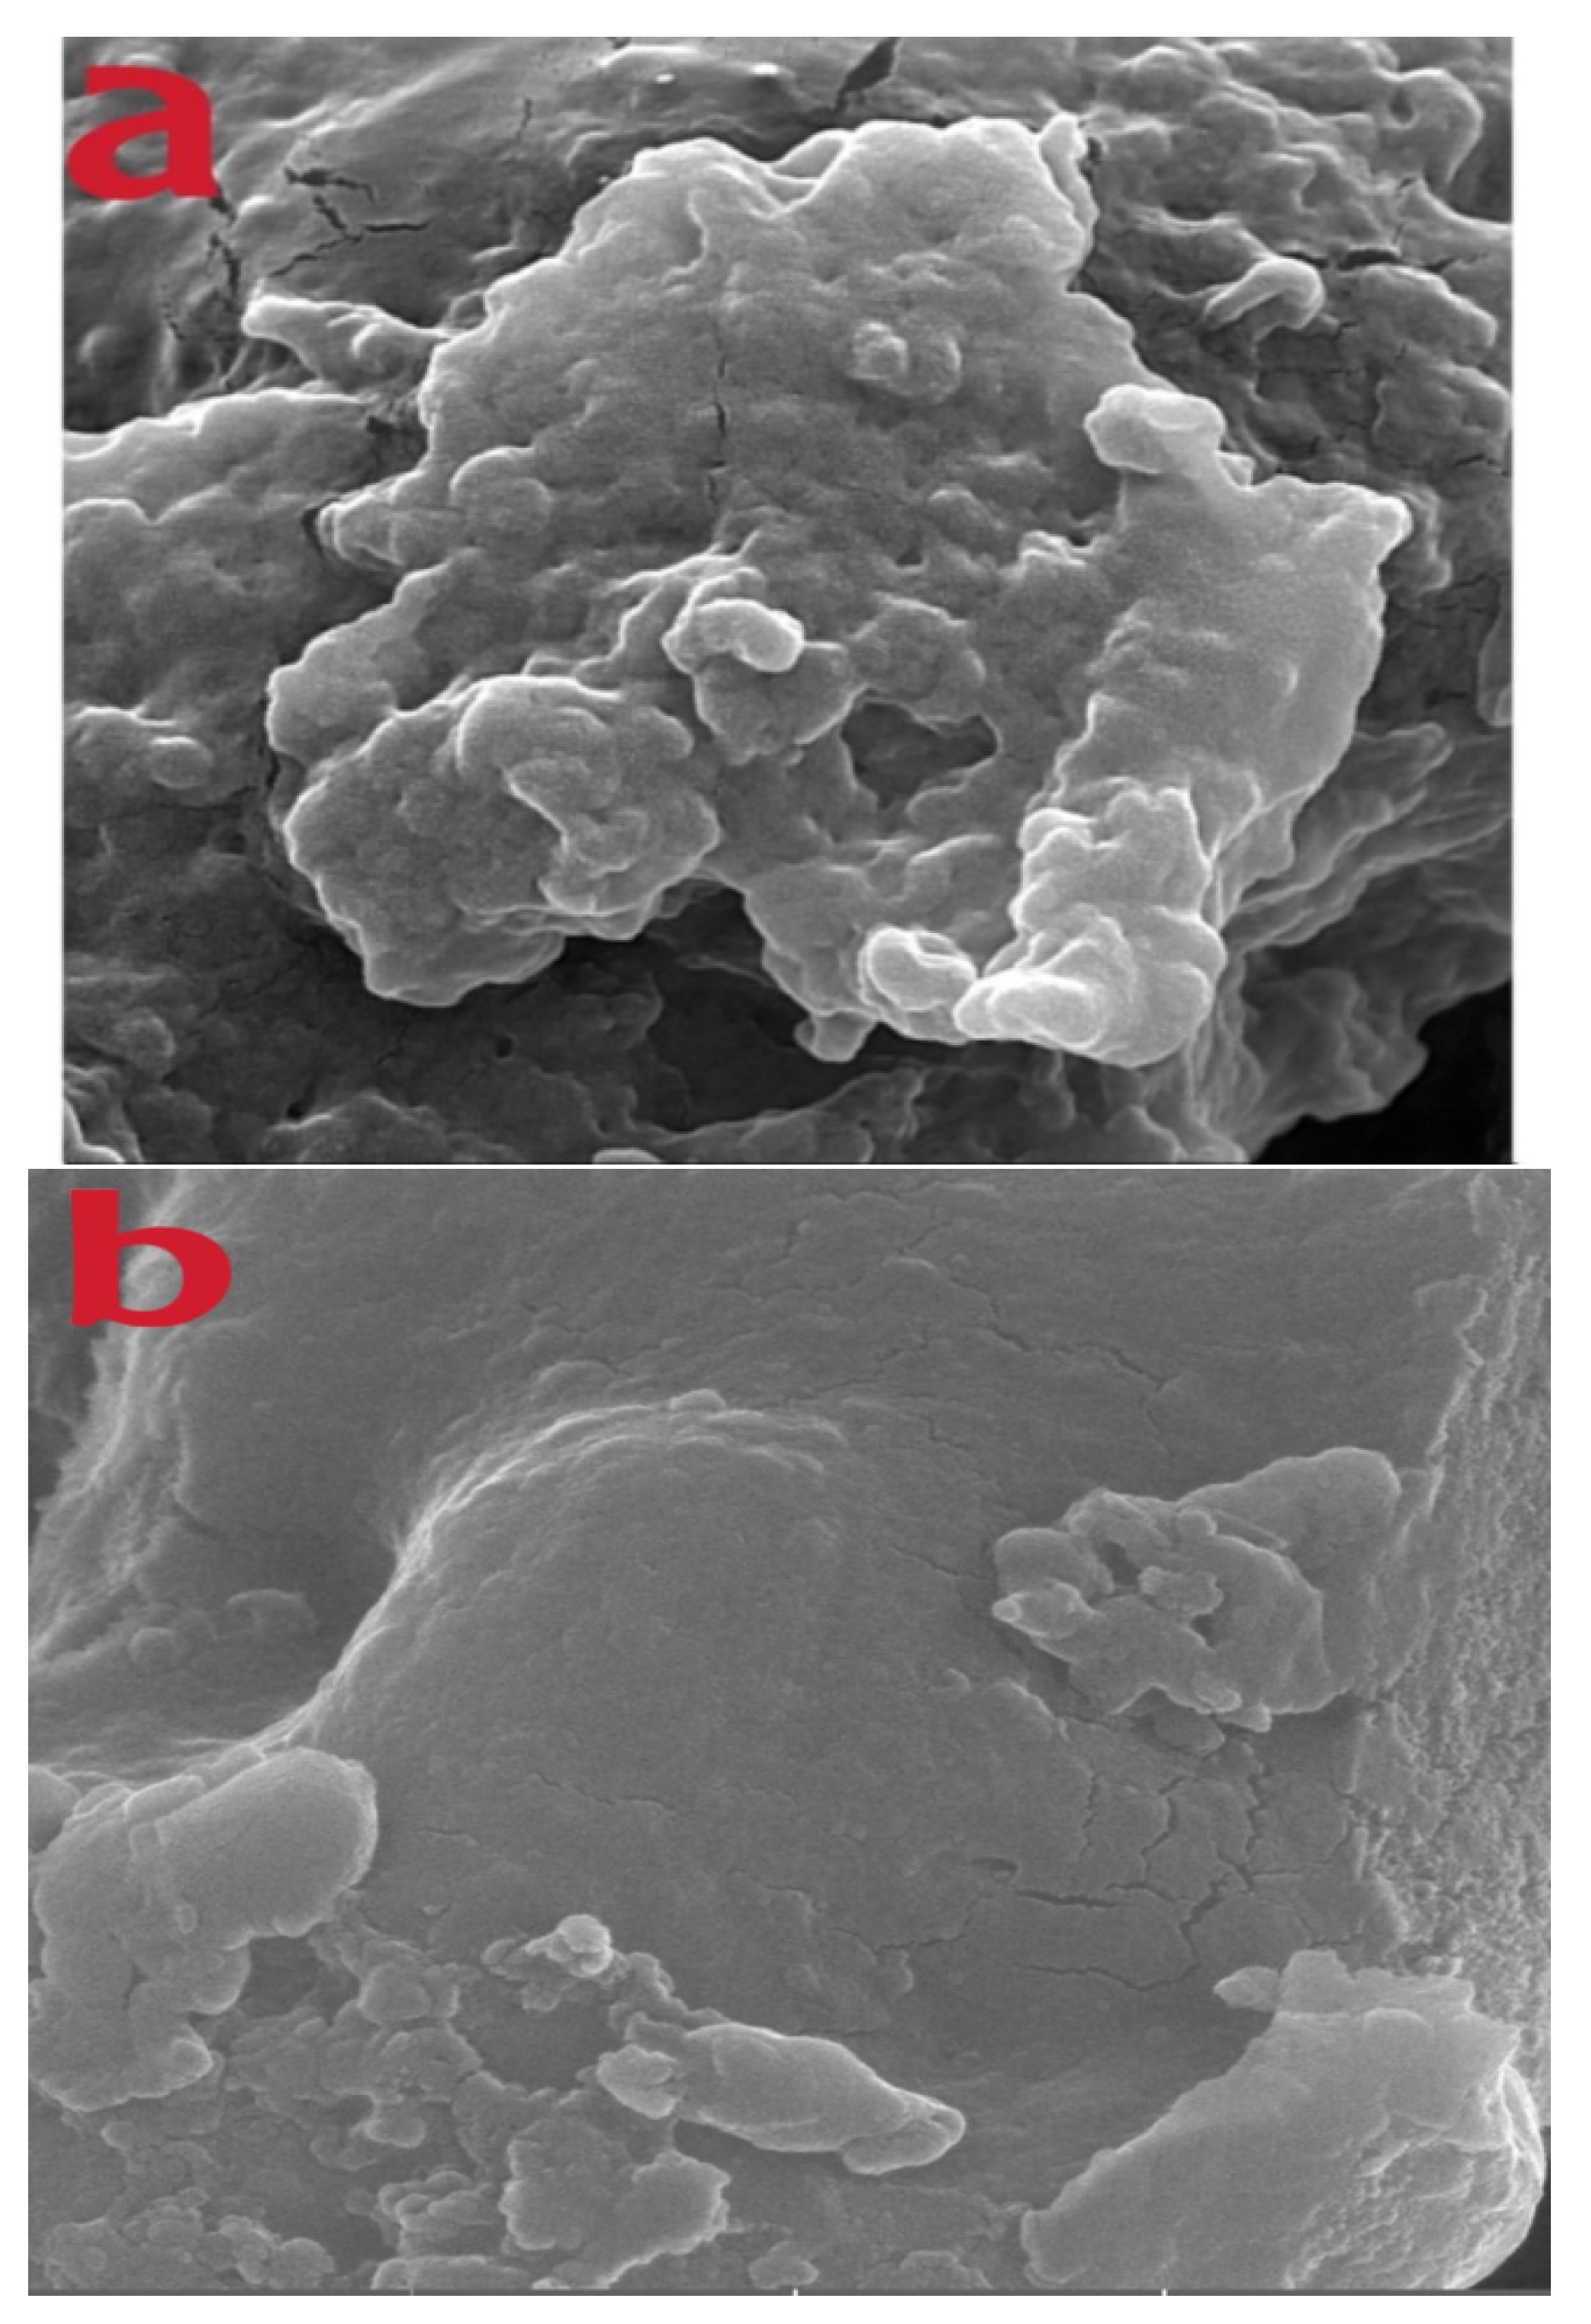

Table 1.
FTIR major functional groups of Glu and SHMP cross-linked microspheres with their absorption frequencies.
Table 1.
FTIR major functional groups of Glu and SHMP cross-linked microspheres with their absorption frequencies.
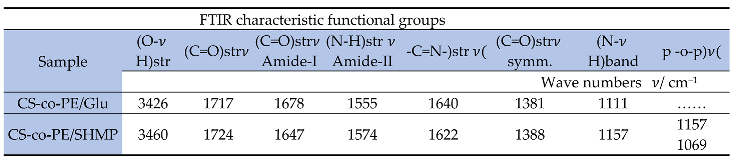 |
Table 2.
1H NMR chemical shift of the main protons of CS-co-PE/Glu hydrogel.
| sample | Chemical shift σ/ppm |
Description of proton |
| CS-co-PE/Glu | 1.0-1.7 1.04-1.1 1.84-1.96 3.72-3.8 3.5-4.0 3.0-3.8 |
(CH2) groups of gluteraldehyde. (CH3) groups of rhamnose. Acetyl groups of pectin. Methoxy group of pectin & D-glucopyranose of chitosan. Protons of glucopyranose ring in chitosan. Cross-linking of glucosamine groups with gluteraldehyde. |
Table 3.
TGA and DSC thermal data of the Glu and SHMP cross-linked microspheres.
| Sample | TGA weight loss (%) | DSC (w/g) | ||||
| IDT/ oC | FDT/ oC | Tmax/ oC | Tcr/ oC |
Tg/ oC |
Hf (J/g) |
|
| (CS-co-PE)/Glu |
2.0% 72oC |
52% 382oC |
32.0% 277oC |
60.0% 450 oC |
42 oC |
+389 J/g 240 oC |
| (CS-co-PE)/SHMP |
2.9% 92oC |
46% 398oC |
28.5% 290oC |
56.8% 458 oC |
51 oC |
+468 J/g 251 oC |
Table 4.
BET measurements of microspheres and their specific surface area.
| Plot type | Plot data | CS-co-PE/Glu | CS-co-PE/SHMP |
| Adsorption branch | |||
| BET Plot | Vm as, BET Total pore volume (P/Po = 0.990) Mean pore diameter |
0.5184 [cm(STP)g−1] 2.2561 [m2g−1] 0.0059719 [cm3g−1] 10.588 [nm] |
76.94 [cm3(STP)g−1] 334.88 [m2g−1] 0.9177 [cm3g−1] 10.961 [nm] |
| BJH Plote | Vp rp, peak (Area) ap |
0.0070665 [cm3g−1] 1.21 [nm] 5.0978 [m2g−1] |
0.9339 [cm3g−1] 4.61 [nm] 420.24 [m2g−1] |
Table 5.
Loading and release characteristics of (CS-co-PE) microspheres cross-linked with Glu and SHMP.
Table 5.
Loading and release characteristics of (CS-co-PE) microspheres cross-linked with Glu and SHMP.
| Microsphere Sample | L max (mg) loading | pH of release solution | Burst release (mg) | Controlled release (mg) | Controlled release time (h) |
| CS-co-PE/Glu | 35 | 1.3 7.4 9.4 |
11.6 9.8 23.8 |
23.4 25.2 11.2 |
24 30 12 |
| CS-co-PE/SHMP | 37 | 1.3 7.4 9.4 |
19.2 10.4 20.9 |
17.8 26.6 16.1 |
18 36 18 |
Disclaimer/Publisher’s Note: The statements, opinions and data contained in all publications are solely those of the individual author(s) and contributor(s) and not of MDPI and/or the editor(s). MDPI and/or the editor(s) disclaim responsibility for any injury to people or property resulting from any ideas, methods, instructions or products referred to in the content. |
© 2023 by the authors. Licensee MDPI, Basel, Switzerland. This article is an open access article distributed under the terms and conditions of the Creative Commons Attribution (CC BY) license (http://creativecommons.org/licenses/by/4.0/).
Copyright: This open access article is published under a Creative Commons CC BY 4.0 license, which permit the free download, distribution, and reuse, provided that the author and preprint are cited in any reuse.


