Submitted:
22 June 2023
Posted:
26 June 2023
Read the latest preprint version here
Abstract
To avoid the endless accumulation of QTL effects when pyramiding breeding, QTL epistasis plays a role of homeostasis. Four single segment substitution lines with heading date QTLs were applied to construct pyramiding materials of dual QTLs and triple QTLs, so that QTL epistatic effects were allowed to be estimated on heading date in rice. Epistatic components of dual QTL and triple QTL interactions were analyzed via the data from three seasons of two years. Four QTLs can be treated as dominant loci, all appearing superdominance. 75% of dual QTL interactions and 81.25% of triple QTL interactions reached statistically significance, confirming again the prevalence of epistasis. Interactions of four QTLs with three positive effects and one negative effect generated 62.5% negative dual QTL epistatic effects and 57.7% positive triple QTL epistatic effects, forming the balance relationship “positive-negative-positive”. In fact, QTL effects were always neutralized partly by mixed QTL epistatic effects so as to control the infinite accumulation of QTL effects. Specially, the directions of OsMADS50 and Hd3a-2 were always consistent with those of their mixed epistases, suggesting that the QTL or gene could be applied to the pyramiding breeding with different targets. This paper revealed the mechanism of epistatic interactions among four QTLs and provided the gene materials for improving heading date in rice.
Keywords:
Epistasis
; Homeostasis
; Single segment substitution line
; Heading date
; Rice
1. Introduction
High yield is the eternal theme of rice breeding. Heading date is one of the important agronomic traits, which is closely related with yield of rice [1,2]. Heading date (anthesis) of rice is the critical mark of the transition from vegetative growth to reproductive growth [3,4]. The length of heading date will affect the accumulation of photosynthetic products, then the grain filling process and finally the yield [5,6]. Heading date also determines the adaptation to specific cropping locations and growing seasons for current varieties of cultivated rice, playing an important role for producing and introducing of rice varieties [7,8]. In practice, the conflict ‘early ripening and high yield’ and ‘late ripening and adversity’ exists always [9,10,11]. Thus it is of great theoretical and practical significance to study the molecular regulation mechanism of rice heading date for molecular breeding and agricultural production.
Heading date in rice is also a complex quantitative trait, regulated by a multiple QTL system companying with additive, dominance and epistasis, as well as their interaction with environments [7,12]. Researches over the last 20 years have found that there are at least 734 QTLs on heading date according to the data published on Gramene website (http://www.gramene.org/qtl/). There are two independent flowering pathways to control heading date in rice, one is the conserved Hd1-dependent pathway and the other unique Ehd1-dependent [13,14]. Hd3a is located in the center of two pathways, which encodes directly florigen to form flowers and is always regulated by the upstream QTLs of Hd1, Ehd1, OsMADS50 and others [12]. Hd1 upregulates Hd3a under short day and downregulates it under long day [15,16], while Ehd1 and OsMADS50 always accelerate heading under both short and long days by upregulating Hd3a [4,17]. However, recent studies revealed more complex rice-specific gene networks regulating the heading [4,12]. The regulating relationship and the regulating degree still need further discussion.
Gene interactions, including allelic interactions (dominance) and nonallelic interactions (epistasis), play an important role in the flowering of rice [18,19]. Epistasis is one of important genetic components for a complex quantitative trait, which was defined as the effect of one gene modified by another gene or several other genes (biological epistasis) and is estimated as the deviation from additivity in a linear statistical model (statistical epistasis) [20,21]. To date studies have targeted mostly on biological epistasis by molecular means, while few on statistical epistasis since the limitations of research materials and statistical methods [11,15,22]. Using QTL near isogenic lines or single segment substitution lines (SSSLs) dual QTL epistatic effects were estimated effectively on lots of important quantitative traits [18,23,24,25]. However, the interaction among multiple QTLs, called as “high-order epistasis” [20,21], was reported rarely. Higher-order epistasis is even more common in the multiple gene system [26,27]. Epistasis was considered to be an important factor in homeostasis for organism [21,27].
In this paper, four SSSLs, which were confirmed with heading date QTLs in our previous study [28], were applied for estimation of epistatic effects. Some crossing combinations of dual QTLs and triple QTLs were configured to analyze QTL genetic effects, including single QTL effects (additive and dominance) and epistatic effects (dual QTL interaction and triple QTL interaction). The trial was conducted at three seasons in two years so that the environmental sensitivity for these genetic components could be evaluated. This paper was with two purposes, to quantitatively analyze the interaction mechanism for the four heading date QTLs and to excavate the favorable gene materials for design breeding on heading date in rice.
2. Results
2.1. Phenotypic Variation on HD
The phenotypic values on HD were mainly influenced by environments, genotypes, genotypes × environments, and experimental error. The environments e1 and e3 represented the short day condition, which shorten the heading periods. While the e2 was the long day condition, delaying flowering. These genotypes, involving in four QTLs, included 65 different types. The average HD of the genotypes ranged from 72.9d to 105.6d, with the standard deviation of 8.9d (data not shown). Joint analysis of variance on phenotypic values of HD in the three environments showed that the mean square of interaction between genotypes and environments was also significant at p=0.0001 (Table S1). According to the equivalence relations between the expecting mean squares (EMSs) and the mean squares, the variance components could be estimated, and then the general heritability and the peculiar heritability were estimated as 31.78% and 1.27% for HD, respectively. The results verified that HD was a complex trait, which was simultaneously controlled by genetic factors, environmental factors, and their interactions etc., just the special heritability is small.
2.2. Additive Effects (a) and Additive × Environment Effects (ae) of QTLs on HD
Genotype is composed of genes, thus genotypic effect can be divided into gene effects. Gene effects generally include additive, dominance, epistasis and their interaction effects with environments. SSSLs and their pyramiding lines allow estimation of gene effects. Additive effects (a) and additive × environment effects (ae) of QTLs on HD were estimated by the difference values between homozygotes of SSSLs and receptor HJX74 (Table 1). Hd1 hadn’t significant additive. Ehd1 had significant additive to delay heading date 3.4d only in the e3. OsMADS50 shorten heading date of 6.1d by the additive, but there were significant difference among different environments. Hd3a increased heading date of 5.6d, which wasn’t influenced by environments.
In summary, two QTLs of OsMADS50 and Hd3a had general additives, which could be detected in different environments. OsMADS50 promoted flowering and was regulated by environments, while Hd3a inhibited heading. Ehd1 was a specific QTL, which be expressed only in specific environments. Hd1 was detected without additive.
2.3. Dominant Effects (d) and Dominance × Environment Effects (de) of QTLs on HD
Dominance is the interaction between alleles. Dominant effects (d) and dominance ×environment effects (de) of QTLs were estimated on HD by the difference values between heterozygotes of SSSLs and receptor HJX74 (Table 2). All of the four QTLs were detected with significant dominant effects. OsMADS50 shorten HD of 8.0d, being a early ripe gene. While Hd3a delayed HD 18.5d, a very late maturation gene. Both Ehd1 and Hd3a were environmental sensitivity, and the others were environmental stability. Comparing with the additives, the dominance of the QTLs had same effect direction and larger effect values. For instance, the dominant degree (dominance/additive) of Ehd1 equaled to 2.07, being larger than 1.
In summary, all of four QTLs were with the genes associated with heading date. Three QTLs carried with additive and dominance simultaneously, while Hd1 dominance only. Except for Hd1, additives or dominances of all QTLs were influenced by environments. All of these QTLs could be applied in heterosis for the target of early ripening or late ripening.
2.4. Pyramiding Effects of QTLs and Their Interaction with Environments on HD
After the effects of single QTL were tested, we conducted the polymerization of dual-QTLs and triple-QTLs to test the pyramiding effects. The pyramiding effects were estimated by the difference values between the pyramiding lines and HJX74, which were the bases to estimate epistatic effects and for pyramiding breeding (Table 3). Of the 56 pyramiding materials measured, there were 49 estimations to reach the significance level of p<0.05 and 4 pyramiding effects to be significant only in special environments. Three combinations hadn’t significant pyramiding effects. Since OsMADS50 carried with large negative effects (additive or dominance), most combinations with OsMADS50 appeared negative pyramiding effects, indicating that the QTL had strong expression power to promote heading. Hd3a had large positive effects, thus the pyramiding effects of Hd3a, especially being the homozygote Hd3a-2, were always with large positive effects to delay flowering. When OsMADS50 encountering Hd3a-1, the pyramiding effects were usually negative. While the combinations between OsMADS50 and Hd3a-2 generated always positive effects. Thus OsMADS50 was suggested to be applied to early ripe breeding, while Hd3a-2 to late ripe breeding.
2.5. The Network Relationship among the 4 QTLs
Analysis of pyramiding effects of QTLs contributed to reveal the promoting and inhibiting relationship between QTLs. When the effect of one QTL remains unchanged under the background of another QTL, the two QTLs are independent each other. Otherwise, one QTL is promoted or inhibited by another QTL when the QTL effect changes. The effect changes of the 4 QTLs showed in Figure S1. For Ehd1, OsMADS50 and Hd3a apparently reduced and increased its effect respectively, while Hd1 changed it few. Thus it was suggested that Hd1 was independent of Ehd1, while OsMADS50 and Hd3a inhibited and promoted it, respectively. However, the regulations for these QTLs to Ehd1 were influenced by environments, existing the difference among different environments. For OsMADS50-1, Ehd1-2 and Hd3a had the significant effects to inhibit the expression of the gene, while Hd1 changed it few. For OsMADS50-2, Hd3a-2 still inhibited the gene, while Hd1 promoted its expression. All of QTLs inhibited Hd3a-1 and promoted Hd3a-2 except for OsMADS50 inhibiting slightly the expression of Hd3a-2. OsMADS50 and Hd3a inhibited and promoted Hd1 respectively, while Ehd1 affected Hd1 few.
In summary, Hd1 and Ehd1 were independent, while the other QTLs were related to each other, promoting or inhibiting (Figure 1). We could clearly see that two flowering paths since Hd1 and Ehd1 were independent each other. They regulated flowering via to directly regulate Hd3a or to indirectly influence OsMADS50, respectively. Hd3a is the induce factor of flowering, which is regulated by lots of upstream or downstream QTLs.
2.6. Epistatic Effects (e) and Epistasis × Environment Effects (ee) of QTLs on HD
The epistatic effects and epistasis × environment effects between dual QTLs
Epistasis is the interaction among nonalleles. Based on SSSLs and their pyramiding lines, the epistatic effects and epistasis × environment interaction effects between dual QTLs were estimated by the residual effects between the pyramiding effects and the sum of single QTL effects (Table 4). Here epistatic effects estimated included four interaction components such as dominance-dominance, dominance-additive, additive- dominance and additive-additive, in proper order corresponding QTL-1--QTL-1, QTL-1--QTL-2, QTL-2--QTL-1 and QTL-2--QTL-2 in Table.
All of six pairs of QTLs were detected with significant epistatic effects, further confirming the prevalence of epistatic interactions among QTLs on heading date. One QTL interacted with the other three QTLs. Of 24 epistatic components, 18 estimations reached the significant level of p<0.05 or 0.01. Where 9 epistatic components were environmentally sensitive, which accompanied with significant epistasis×environments. Two pairs of genes, Ehd1-1 and OsMADS50-1, OsMADS50-2 and Hd3a-2, showed significant epistatic interactions in particular environments only. Eshed and Zamir [24] found first the phenomena less than-additive epistatic interactions between QTLs in tomato. This paper found also that 10 estimations were negative, occupying up 62.5% of 16 significant epistatic components. Generally, negative epistasis is mainly derived from the interaction of positive QTLs [28,29]. Here three QTLs, Ehd1, Hd3a and Hd1, carried positive effects, so their epistases appeared mostly negative effects. An interesting result was that Hd3a-1 and Hd3a-2 always generated large, opposite epistases. Another result was that OsMADS50, with large and negative additive or dominance effects, mostly generated negative epistases. The genetic mechanisms for these results need to be further explored. The two results also indicated that OsMADS50 and Hd3a-2 could be applied to different targets of ripe breeding.
The epistatic effects and epistasis × environment effects among triple QTLs
In the multiple gene genetic system, the interactions among multiple genes are inevitable. The epistatic effect and epistasis × environment interaction effects among triple QTLs were estimated by the residual effect between the pyramiding effect and the sum of single QTL effects and the interaction effects between dual QTLs (Table 5).
Of 32 epistatic effects, 81.25% estimations were statistically significant, also indicating the prevalence of epistasis. Where 10 epistatic components were environmentally sensitive, which accompanied with significant epistasis × environments. The combination of OsMADS50/Hd3a-2/Hd1-2 showed significant epistatic interactions in particular environments only. However, most of epistatic effects among triple QTLs were positive, occupying up 57.7% of 26 significant estimations. The pattern “positive effect of single QTL—negative epistatic effects between dual QTLs—positive epistatic effects among triple QTLs” needed to be further verified. Hd3a-1 and Hd3a-2 always generated large, inverse epistases in triple QTL interactions also. On magnitude, the average of epistatic effects among three QTLs was approximately 8.6±5.5d, while that between dual QTLs was 6.8±5.9d. It was showed that triple QTL interactions might play a more important role than dual QTL interactions.
In fact, epistasis in a three QTL genotype includes each of two QTL interactions and three QTL interaction, called mixed epistasis. The mixed epistatic effect and mixed epistasis × environment interaction effects among triple QTLs were estimated by the residual effect between the pyramiding effect (Table 3) and the sum of single QTL effects (Table 1 and Table 2). The estimations were listed in Table 6.
90.6% of mixed episrases reached statistically significant levels, 11 estimations of which were influenced by environments. Two combinations, OsMADS50/Hd3a-2/Hd1-1 and OsMADS50/Hd3a-2/Hd1-2, showed significant epistatic interactions in particular environments only. 18 of 27 significant epistatic effects were negative, acting as a balance of single QTL effects on the whole. Similarly, Hd3a-1 and Hd3a-2 generated also opposite mixed epistases in QTL interactions. On magnitude, the average of mixed epistatic effects was -3.5±11.3d, indicating also the mechanism of homeostasis.
3. Discussion
3.1. Genetic Mechanisms of QTLs on Heading Date
Heading date is one of complex quantitative traits controlled by a multiple gene system [3,7]. At least more than 734 heading date QTLs were identified in rice (http://archive.gramene.org/qtl/). Four QTLs, Hd1, Ehd1, OsMADS50 and Hd3a, have detailed gene products and biological functions [4,12,13,15,30,31]. The interactions among the four QTLs have also been explored in-depth via molecular technique [6,32,33], and preliminary genetic networks have also been formed for rice flowering [34]. In one of our previous papers, we tested the phenotypic functions for the four QTLs and their epistatic effects between dual QTLs, and confirmed also the existing of flowering network [28]. In this paper, the four QTLs on heading date were tested again in three seasons of two years (Table 1 and Table 2). We detected that Ehd1 delayed heading under the status of homozygote or heterozygote, which was regulated by environmental conditions. OsMADS50 and Hd3a always promoted and delayed heading, respectively. Hd1 had a little effect on heading date. We also found the network relationship of the four QTLs. Hd1 and Ehd1 were independent, while the other QTLs related each other. Hd1 and Ehd1 regulated flowering via to directly or indirectly regulate Hd3a to form two flowering pathways (Figure 1). These results basically were consistent with those in the previous study [28]. However, OsMADS50 also directly or indirectly regulated Hd3a than to influence flowering, perhaps being a new flowering path.
3.2. Epistasis among QTLs on Heading Date
Epistasis is an important genetic component and a plausible feature of the genetic architecture of quantitative traits [20,26]. Epistatic interactions between QTLs on heading date were found qualitatively in earlier studies [4,12,15,16,17], and were quantificationally estimated based on near isogenic lines and SSSLs [18,24,25]. Utilization of SSSLs, we estimated epistatic components between dual QTLs on lots of important traits such as tiller number, plant height, heading date, yield and its component traits [5,28,29,35,36,37,38,39,40,41,42]. One common feature for epistasis was verified again by this paper, i.e., less-than-additive epistatic interactions of quantitative trait loci. Here 75% of QTL effects were positive (Table 1 and Table 2), then 62.5% of epistatic components between two QTLs appeared negative (Table 4). In fact, epistatic effects estimated would be mostly positive if two QTL effects were negative [29,41]. The change of a gene effect may be brought about by modification of gene function due to alterations in the signal-transducing pathway [21]. Opposite expression between genes and gene interactions was considered to be an important mechanism for maintaining homeostasis [27]. That mixed epistatic effects in a genotype of triple QTLs were always opposite with the single gene effects also showed the mechanism (Table 6). The combination of three positive effect QTLs usually generated negative mixed epistatic effect.
3.3. Application of Gene Interactions on Heading Date
Knowledge of epistatic interactions not only improve our understanding of genetic networks and mechanisms that underlie genetic homeostasis, but also enhance predictions of responses to artificial pyramiding breeding for quantitative traits in agricultural crop species. The success of molecular pyramiding breeding dependents directly on gene interactions except for gene additive. Line breeding is to select improved homozygous genotypes, in which additive and additive × additive epistasis play a leading role. As the additive effect, the epistasis of additive × additive is also a stabilize genetic component between selfing generations. Full consideration of additive × additive epistasis is helpful to evaluate the potential benefits of special combining ability in breeding [43]. In this paper, OsMADS50 seemed to have large and negative average effects of interactions with other genes (Table 4), this QTL can be applied to early ripe breeding. Reversely, Hd3a-2 always generated large and positive epistatic effects, this gene can be acted as pyramiding material for late ripe breeding. For the interactions among three QTLs, we should consider simultaneously the dual-gene interaction and the triple gene interaction, i.e., mixed epistasis (Table 6). Since both OsMADS50-2 and Hd1-2 had the mixed epistatic effects to promote heading in this paper, which are perhaps appropriate genes for the pyramiding breeding of early ripe rice. That Hd3a-2 mostly generated large and positive mixed epistatic effects also indicated that this gene can be applied to late ripe breeding.
Heterosis is a very common phenomenon in plant breeding, and was deciphered by many hypotheses. The dominant hypothesis and the superdominant hypothesis were the most representative [44]. However, these hypotheses were based on single-gene theory. Multiple gene theory suggested that heterosis was closely related to epistatic effects except for dominant effect [45]. In this paper, we detected four dominant QTLs on heading date, all of which appeared superdominant effects (Table 1 and Table 2). These dominant QTLs would generate three types of dual gene interactions (Table 4) and seven types of triple gene interactions (Table 5). Compared with additive-additive epistatic components (3.2±7.3d), the dominance-dominance epistatic components (-8.2±7.2d) were always small. Obviously, the dominance and its epistasis play a greater role than the additive and its epistasis between QTLs for breeding of early ripe varieties. Thus, the heterozygote had often greater advantage in early ripe than the homozygote between two QTLs. For triple QTL combinations, the case was the same. The mixed epistatic component of additive-additive-additive was 4.8±8.2d, while dominance- dominance-dominance was -12.5±6.6d. It also showed that the heterozygote of triple QTLs still appeared heterosis in early ripe since the mixed epistatic components. Thus, we suggested that the dominance and its epistasis of QTLs were the main genetic factors to result in heterosis of early ripening. In practice, when epistatic effect was no significant or with the same direction with the effects of constituted QTLs, these QTLs might be considered as gene materials for molecular aggregation breeding [28]. In this paper, negative OsMADS50 and positive Hd3a-2 generated always the same direction effects of dual QTL epistasis and triple QTL mixed epistasis, they might be the ideal gene aggregation materials for different breeding targets.
4. Materials and Methods
4.1. Plant Materials
Hua-jing-xian 74 (HJX74) and its four single segment substitutions lines (SSSLs) were as basic experimental materials. HJX74 is an elite indica variety, developed by our laboratory, Guangdong Key Laboratory of Plant Molecular Breeding at South China Agricultural University in Guangzhou of China. SSSL contains only one segment of donor chromosome introgressed into a recipient genetic background. A SSSL library, nearly 2000 members, was bred by successive backcrosses, in which HJX 74 was as the recipient parent and more than 30 excellent varieties from around the world as the donor parents [46]. Relevant SSR markers were applied to foreground selection of donor segments and background selection of HJX74 [47,48]. In our previous studies the 4 SSSLs were detected with QTLs controlling heading date in rice, and then epistases between double QTLs were analyzed via pyramiding of SSSLs [28]. Some background information for SSSLs, including the SSSL codes, heading date QTL names, donor varieties, and marker intervals on corresponding chromosomes, were showed in Table 7 and Figure 2, respectively.
Some pyramiding materials of SSSLs (including heterozygotes and heterozygotes) were configured to analyze epistasis among QTLs. The crossing between a SSSL and HJX74 would generate the heterozygote of SSSL. From the F2 populations derived from the F1 crossing combinations between two SSSLs, the homozygotes and the heterozygotes of dual QTLs could be obtained by marker assisted selection. Similarly, triple-QTL pyramiding materials could also be selected from the F1 generation of three QTL combinations.
4.2. Field Trials
Phenotypic experiments were conducted at the experimental farm of South China Agricultural University, Guangzhou (at ~113° east longitude and ~23° north latitude), China, in spring (from March to July, suggested as natural long-day condition, NLD) 2016 and autumn (from July to November, suggested as natural short-day condition, NSD) 2015 and 2016. Meteorological data showed that the average duration of possible sunshine is larger than 13 hours under the spring season and less than 12 hours under the autumn season in Guangzhou. A total of 65 plant materials, including HJX74, 4 homozygotes and 4 heterozygotes of SSSLs, 24 dual-QTL polymers and 32 triple-QTL polymers, were grown in all three environments. In each experiment, the germinated seeds were sown in a seedling bed and seedlings were transplanted to a paddy field 20 days later, with one plant per hill spaced at 16.7 cm × 16.7 cm. A randomized block design was adopted in field trails, in which each plot consisted of four rows with ten plants each row. The management of the field experiments was in accordance with local standard practices. The heading date (HD) of twenty plants at the center of each plot was measured as the number of days from sowing to the appearance of the first panicle. Averages on HD over twenty plants each plot were as inputting data for statistical analysis.
4.3. Mixed Linear Models for Estimating G Effects and GE Interaction Effects
For a genetic experiment conducted within multiple environments, the phenotypic performance of the jth genetic entry in the kth block within the hth environment can be expressed by,
where and were the observation value each plot, population mean value, environmental effect, genotypic effect, genotype-environment interaction effect, block effect and the residual error, respectively. The minimum norm quadratic unbiased estimation (MINQUE) method with all prior values set at 1 was used to estimate variance components for the trait [44]. Values of G and GE were predicted by the Best Linear Unbiased Prediction (BLUP) method [44]. All estimations were performed using the QGAStation software package [49].
4.4. QTL Analysis
An indirect approach was conducted to analyze QTL effects [50]. First, values of G and GE for all genetic materials on HD were estimated according to the model mentioned above, respectively. Next, QTLs were mapped using these estimated values as input data separately. QTLs identified according to G were referred to main QTLs, including additive effect (a), dominant effect (d) and epistatic effect (e). QTLs obtained from GE were called as interaction QTLs, including additive interacted by environment (ae), dominance interacted by environment (de), and epistasis interacted by environment (ee). According to the models and the effect values of QTLs could be estimated by the lm( ) function in R language(http://cran.r- project.org).
Supplementary Materials
The following supporting information can be downloaded at the website of this paper posted on Preprints.org. Figure S1: The effect changes of 4 QTLs under different background QTLs; Table S1: Analysis of variance on phenotypic values of heading date in the three environments.
Author Contributions
L.H., J.T., B.Z. and G.C. were the executives of trials and the writers, L.C., S.B., H.Z., Z.L. and Z.L. were the participators, L.M. was the cooperator, G.L. was the constitutor of this study, and S.W. was the leaders of our research team. All authors have read and agreed to the published version of the manuscript.
Funding
This research was funded by Science and Technology Projects in Guangzhou(2023B03J1355)and the National Natural Science Foundation of China(32072040).
Data Availability Statement
Data are contained within the article or Supplementary Materials.
Acknowledgments
We appreciate the paper invitation and the useful recommendations from Professor Zhenlan Liu at South China Agricultural University.
References
- Huang, X.; Zhao, Y.; Li, C.; Wang, A.; Zhao, Q.; Li, W.; Guo, Y.; Deng, L.; Zhu, C.; Fan, D.L.; Lu, Y.Q.; Weng, Q.; Liu, K.; Li, J.Y.; Han, B. Genome-wide association study of flowering time and grain yield traits in a worldwide collection of rice germplasm. Nat. Genet. 2012, 44, 32–39. [Google Scholar] [CrossRef]
- Fei, C.; Xu, Q.; Xu, Z.J.; Chen, W.F. Effect of Rice Breeding Process on Improvement of Yield and Quality in China. Rice Sci. 2020, 27, 363–367. [Google Scholar]
- Hayama, R.; Yokoi, S.; Tamaki, S.; Yano, M.; Shimamoto, K. Adaptation of photoperiodic control pathways produces short-day flowering in rice. Nature 2003, 422, 719–722. [Google Scholar] [CrossRef] [PubMed]
- Takahashi, Y.; Teshima, K.M.; Yokoi, S.; Innan, H.; Shimamoto, K. Variations in Hd1 proteins, Hd3a promoters, and Ehd1 expression levels contribute to diversity of flowering time in cultivated rice. Proc. Natl. Acad. Sci. USA 2009, 106, 4555–4560. [Google Scholar] [CrossRef] [PubMed]
- Chen, J.Y.; Guo, L.; Ma, H.; Chen, Y.Y.; Zhang, H.W.; Ying, J.Z.; Zhuang, J.Y. Fine mapping of qHd1, a minor heading date QTL with pleiotropism for yield traits in rice (Oryza sativa L.). Theor. Appl. Genet. 2014, 127, 2515–2524. [Google Scholar] [CrossRef] [PubMed]
- Du, A.; Tian, W.; Wei, M.; Yan, W.; He, H.; Zhou, D.; Huang, X.; Li, S.; Ouyang, X. The DTH8-Hd1 module mediates day-length-dependent regulation of rice flowering. Mol. Plant 2017, 10, 948–961. [Google Scholar] [CrossRef]
- Andrés, F.; Coupland, G. The genetic basis of flowering responses to seasonal cues. Nat. Rev. Genet. 2012, 13, 627–639. [Google Scholar] [CrossRef] [PubMed]
- Goretti, D.; Martignago, D.; Landini, M.; Brambilla, V.; Gomez-Ariza, J.; Gnesutta, N.; Galbiati, F.; Collani, S.; Takagi, H.; Terauchi, R.; Mantovani, R.; Fornara, F. Transcriptional and post-transcriptional mechanisms limit Heading Date 1 (Hd1) function to adapt rice to high latitudes. PLoS Genet. 2017, 13, e1006530. [Google Scholar] [CrossRef]
- Sun, K.L.; Huang, M.H.; Zong, W.B.; Xiao, D.D.; Lei, C.; Luo, Y.Q.; Song, Y.G.; Li, S.T.; Hao, Y.; Luo, W.N.; Xu, B.Q.; Guo, X.T.; Wei, G.L.; Chen, L.T.; Liu, Y.G.; Guo, J.X. Hd1, Ghd7, and DTH8 synergistically determine the rice heading date and yield-related agronomic traits. J. Genet. Genom. 2022, 49, 437–447. [Google Scholar] [CrossRef]
- Zhu, Y.J.; Fan, Y.Y.; Wang, K.; Huang, D.R.; Liu, W.Z.; Ying, J.Z.; Zhuang, J.Y. Rice Flowering Locus T 1 plays an important role in heading date influencing yield traits in rice. Sci. Rep. 2017, 7, 4918. [Google Scholar] [CrossRef]
- Fujino, K. Days to heading, controlled by the heading date genes, Hd1 and DTH8, limits rice yield-related traits in Hokkaido, Japan. Breed. Sci. 2020, 70, 277–282. [Google Scholar] [CrossRef] [PubMed]
- Vicentini, G.; Biancucci, M.; Mineri, L.; Chirivì, D.; Giaume, F.; Miao, Y.; Kyozuka, J.; Brambilla, V.; Betti, C.; Fornara, F. Environmental control of rice flowering time. Plant Commun. 2023, 100610. [Google Scholar] [CrossRef] [PubMed]
- Doi, K.; Izawa, T.; Fuse, T.; Yamanouchi, U.; Kubo, T.; Shimatani, Z.; Yano, M.; Yoshimura, A. Ehd1, a B-type response regulator in rice, confers short-day promotion of flowering and controls FT-like gene expression independently of Hd1. Genes Dev. 2004, 18, 926–936. [Google Scholar] [CrossRef] [PubMed]
- Komiya, R.; Yokoi, S.; Shimamoto, K. A gene network for long-day flowering activates RFT1 encoding a mobile flowering signal in rice. Development 2009, 136, 3443–3450. [Google Scholar] [CrossRef]
- Kojima, S.; Takahashi, Y.; Kobayashi, Y.; Monna, L.; Sasaki, T.; Araki, T.; Yano, M. Hd3a, a rice ortholog of the Arabidopsis FT gene, promotes transition to flowering downstream of Hd1 under short-day conditions. Plant Cell Physiol. 2002, 43, 1096–1105. [Google Scholar] [CrossRef] [PubMed]
- Ishikawa, R.; Aoki, M.; Kurotani, K.; Yokoi, S.; Shinomura, T.; Takano, M.; and Shimamoto, K. Phytochrome B regulates Heading date 1 (Hd1)-mediated expression of rice florigen Hd3a and critical day length in rice. Mol. Genet. Genom. 2011, 285, 461–470. [Google Scholar] [CrossRef]
- Ryu, C.H.; Lee, S.; CHO, L.H.; Kim, S.L.; Lee, Y.S.; Choi, S.C.; Jeong, H.J.; Yi, J.; Park, S.J.; Han, C.D.; An, G. OsMADS50 and OsMADS56 function antagonistically in regulating long day (LD)-dependent flowering in rice. Plant Cell Environ. 2009, 32, 1412–1427. [Google Scholar] [CrossRef]
- Lin, H.X.; Yamamoto, T.; Sasaki, T.; Yano, M. Characterization and detection of epistatic interactions of 3 QTLs, Hd1, Hd2, and Hd3, controlling heading date in rice using nearly isogenic lines. Theor. Appl. Genet. 2000, 101, 1021–1028. [Google Scholar] [CrossRef]
- Guo, T.; Mu, Q.; Wang, J.; Vanous, A. E.; Onogi, A.; Iwata, H.; Li, X.; and Yu, J. Dynamic effects of interacting genes underlying rice flowering-time phenotypic plasticity and global adaptation. Genome Res. 2020, 30, 673–683. [Google Scholar] [CrossRef]
- Carlborg, O.; Haley, C.S. Epistasis: too often neglected in complex trait studies? Nat Rev Genet 2004, 5, 618–625. [Google Scholar] [CrossRef]
- Mackay, T.F.; Stone, E.A.; Ayroles, J.F. The genetics of quantitative traits: challenges and prospects. Nat. Rev. Genet. 2009, 10, 565–577. [Google Scholar] [CrossRef] [PubMed]
- Zhang, Z.H.; Zhu, Y.J.; Wang, S.L.; Fan, Y.Y.; Zhuang, J.Y. Importance of the Interaction between Heading Date Genes Hd1 and Ghd7 for Controlling Yield Traits in Rice. Int. J. Mol. Sci. 2019, 20, 516. [Google Scholar] [CrossRef]
- Tanksley, S.D. Mapping polygenes. Annu. Rev. Genet. 1993, 27, 205–233. [Google Scholar] [CrossRef]
- Eshed, Y.; Zamir, D. Less-than-additive epistatic interactions of yield associated QTL. Genetics 1996, 141, 1147–1162. [Google Scholar] [CrossRef]
- Yamamoto, T.; Lin, H.; Sasaki, T.; Yano, M. Identification of heading date quantitative trait locus Hd6 and characterization of its epistatic interactions with Hd2 in rice using advanced backcross progeny. Genetics 2000, 154, 885–891. [Google Scholar] [CrossRef] [PubMed]
- Phillips, P.C. Epistasis-the essential role of gene interactions in the structure and evolution of genetic systems. Nat. Rev. Genet. 2008, 9, 855–867. [Google Scholar] [CrossRef] [PubMed]
- Mackay, T.F. Epistasis and quantitative traits: using model organisms to study gene-gene interactions. Nat. Rev. Genet. 2014, 15, 22–33. [Google Scholar] [CrossRef] [PubMed]
- Yang, Z.; Jin, L.; Zhu, H.; Wang, S.; Zhang, G.; Liu, G. Analysis of Epistasis among QTLs on Heading Date based on Single Segment Substitution Lines in Rice. Sci. Rep. 2018, 8, 3059. [Google Scholar] [CrossRef]
- Fu, Y.; Zhao, H.; Huang, J.; Zhu, H.; Luan, X.; Bu, S.; Liu, Z.; Wang, X.; Peng, Z.; Meng, L.; Liu, G.; Zhang, G.; Wang, S. Dynamic analysis of QTLs on plant height with single segment substitution lines in rice. Sci. Rep. 2022, 12, 5465. [Google Scholar] [CrossRef]
- Yano, M.; Katayose, Y.; Ashikari, M.; Yamanouchi, U.; Monna, L.; Fuse, T.; Baba, T.; Yamamoto, K.; Umehara, Y.; Nagamura, Y.; Sasaki, T. Hd1, a Major Photoperiod Sensitivity Quantitative Trait Locus in Rice, Is Closely Related to the Arabidopsis Flowering Time Gene CONSTANS. Plant Cell 2000, 12, 2473–2483. [Google Scholar] [CrossRef]
- Tamaki, S.; Matsuo, S.; Wong, H.L.; Yokoi, S.; Shimamoto, K. Hd3 a protein is a mobile flowering signal in rice. Science 2007, 316, 1033–1036. [Google Scholar] [CrossRef] [PubMed]
- Lee, Y.S.; Yi, J.; An, G. OsPhyA modulates rice flowering time mainly through OsGI under short days and Ghd7 under long days in the absence of phytochrome B. Plant Mol. Biol. 2016, 91, 413–427. [Google Scholar] [CrossRef] [PubMed]
- Zong, W.; Ren, D.; Huang, M.; Sun, K.; Feng, J.; Zhao, J.; Xiao, D.; Xie, W.; Liu, S.; Zhang, H.; Qiu, R.; Tang, W.; Yang, R.; Chen, H.; Xie, X.; Chen, L.; Liu, Y.; Guo, J. Strong photoperiod sensitivity is controlled by cooperation and competition among Hd1, Ghd7 and DTH8 in rice heading. New Phytol. 2020, 229, 1635–1649. [Google Scholar] [CrossRef] [PubMed]
- Tsuji, H.; Taoka, K.; Shimamoto, K. Regulation of flowering in rice: two florigen genes, a complex gene network, and natural variation. Curr. Opin. Plant Biol. 2011, 1, 45–52. [Google Scholar] [CrossRef]
- Chen, J.; Li, X.; Cheng, C.; Wang, Y.; Qin, M.; Zhu, H.; Zeng, R.; Fu, X.; Liu, Z.; Zhang, G. Characterization of epistatic interaction of QTLs LH8 and EH3 controlling heading date in rice. Sci. Rep. 2014, 4, 1–9. [Google Scholar] [CrossRef]
- Qin, M.; Zhao, X.Q.; Ru, J.; Zhang, G.Q.; Ye, G.Y. Bigenic epistasis between QTLs for heading date in rice analyzed using single segment substitution lines. Field Crop Res. 2015, 178, 16–25. [Google Scholar] [CrossRef]
- Zhu, H.; Liu, Z.; Fu, X.; Dai, Z.; Wang, S.; Zhang, G.; Zeng, R.; Liu, G. Detection and characterization of epistasis between QTLs on plant height in rice using single segment substitution lines. Breed. Sci. 2015, 65, 192–200. [Google Scholar] [CrossRef]
- Wang, X.; Jin, L.; Zhu, H.; Wang, S.; Zhang, G.; Liu, G. QTL epistatic analysis for yield components with single-segment substitution lines in rice. Plant Breed. 2018, 137, 346–354. [Google Scholar] [CrossRef]
- Zhu, H.; Li, Y.; Liang, J.; Luan, X.; Xu, P.; Wang, S.; Zhang, G.; Liu, G. Analysis of QTLs on heading date based on single segment substitution lines in rice (Oryza Sativa L. ). Sci. Rep. 2018, 8, 13232. [Google Scholar] [CrossRef]
- Zhou, H.; Yang, W.; Ma, S.; Luan, X.; Zhu, H.; Wang, A.; Huang, C.; Rong, B.; Dong, S.; Meng, L.; Wang, S.; Zhang, G.; Liu, G. Unconditional and conditional analysis of epistasis between tillering QTLs based on single segment substitution lines in rice. Sci. Rep. 2020, 10, 15912. [Google Scholar] [CrossRef]
- Luan, X.; Xiong, L.; Xu, H.; Zhu, H.; Bu, S.; Meng, L.; Liu, G.; Wang, S. Functional mapping of tillering QTLs using the Wang-Lan-Ding model and a SSSL population. Mol. Genet. Genom. 2021, 296, 1279–1286. [Google Scholar] [CrossRef] [PubMed]
- Bu, S.; Zhan, P.; Huang, L.; Tang, J.; Chen, L.; Zhu, H.; Liu, Z.; Meng, L.; Liu, G.; Wang, S. Identification, Interaction, Expression, and Function of QTLs on Leaf Numbers with Single-Segment Substitution Lines in Rice. Agronomy 2022, 12, 2968. [Google Scholar] [CrossRef]
- Zhu, J. Mixed linear model approaches for analyzing genetic models of complex quantitative traits(supplementary issue). Hereditas 1998, 20, 137–138. [Google Scholar]
- Zhu, J.; Weir, B.S. Diallel analysis for sex-linked and maternal effects. Theor. Appl. Genet. 1996, 92, 1–9. [Google Scholar] [CrossRef]
- Zhu, J. Methods of predicting genotype value and heterosis for offspring of hybrids. . Biomath. 1993, 8, 32–44. [Google Scholar]
- Zhang, G. The platform of breeding by design based on the SSSL library in rice. Hereditas 2019, 41, 754–760. [Google Scholar] [PubMed]
- Zhang, G.Q.; Zeng, R.Z.; Zhang, Z.M.; Lu, Y.G. The construction of a library of single segment substitution lines in rice (Oryza sativa L.). Rice Genet. Newsl. 2004, 21, 85–87. [Google Scholar]
- Xi, Z.Y.; He, F.H.; Zeng, R.Z.; Zhang, Z.M.; Ding, X.H.; Li, W.T.; Zhang, G.Q. Development of a wide population of chromosome single-segment substitution lines in the genetic background of an elite cultivar of rice (Oryza sativa L. ). Genome 2006, 49, 476–484. [Google Scholar] [CrossRef]
- Chen, G.B.; Zhu, J. Department of Agronomy, Zhejiang University. Hangzhou, China 2003.
- Zhu, J. Mixed model approaches of mapping genes for complex quantitative traits. J. Zhejiang Univ. 1999, 33, 327–335. [Google Scholar]
Figure 1.
The network relationship among the four
QTLs on heading date in rice. Hd3a-1 and Hd3a-2 were the
heterozygote and homozygote on Hd3a, respectively. → promoting;  inhibiting. Except that Hd1
and Ehd1 were independent, the other QTLs were related to each other,
promoting or inhibiting.
inhibiting. Except that Hd1
and Ehd1 were independent, the other QTLs were related to each other,
promoting or inhibiting.
inhibiting. Except that Hd1
and Ehd1 were independent, the other QTLs were related to each other,
promoting or inhibiting.
Figure 1.
The network relationship among the four
QTLs on heading date in rice. Hd3a-1 and Hd3a-2 were the
heterozygote and homozygote on Hd3a, respectively. → promoting; inhibiting. Except that Hd1
and Ehd1 were independent, the other QTLs were related to each other,
promoting or inhibiting.
inhibiting. Except that Hd1
and Ehd1 were independent, the other QTLs were related to each other,
promoting or inhibiting.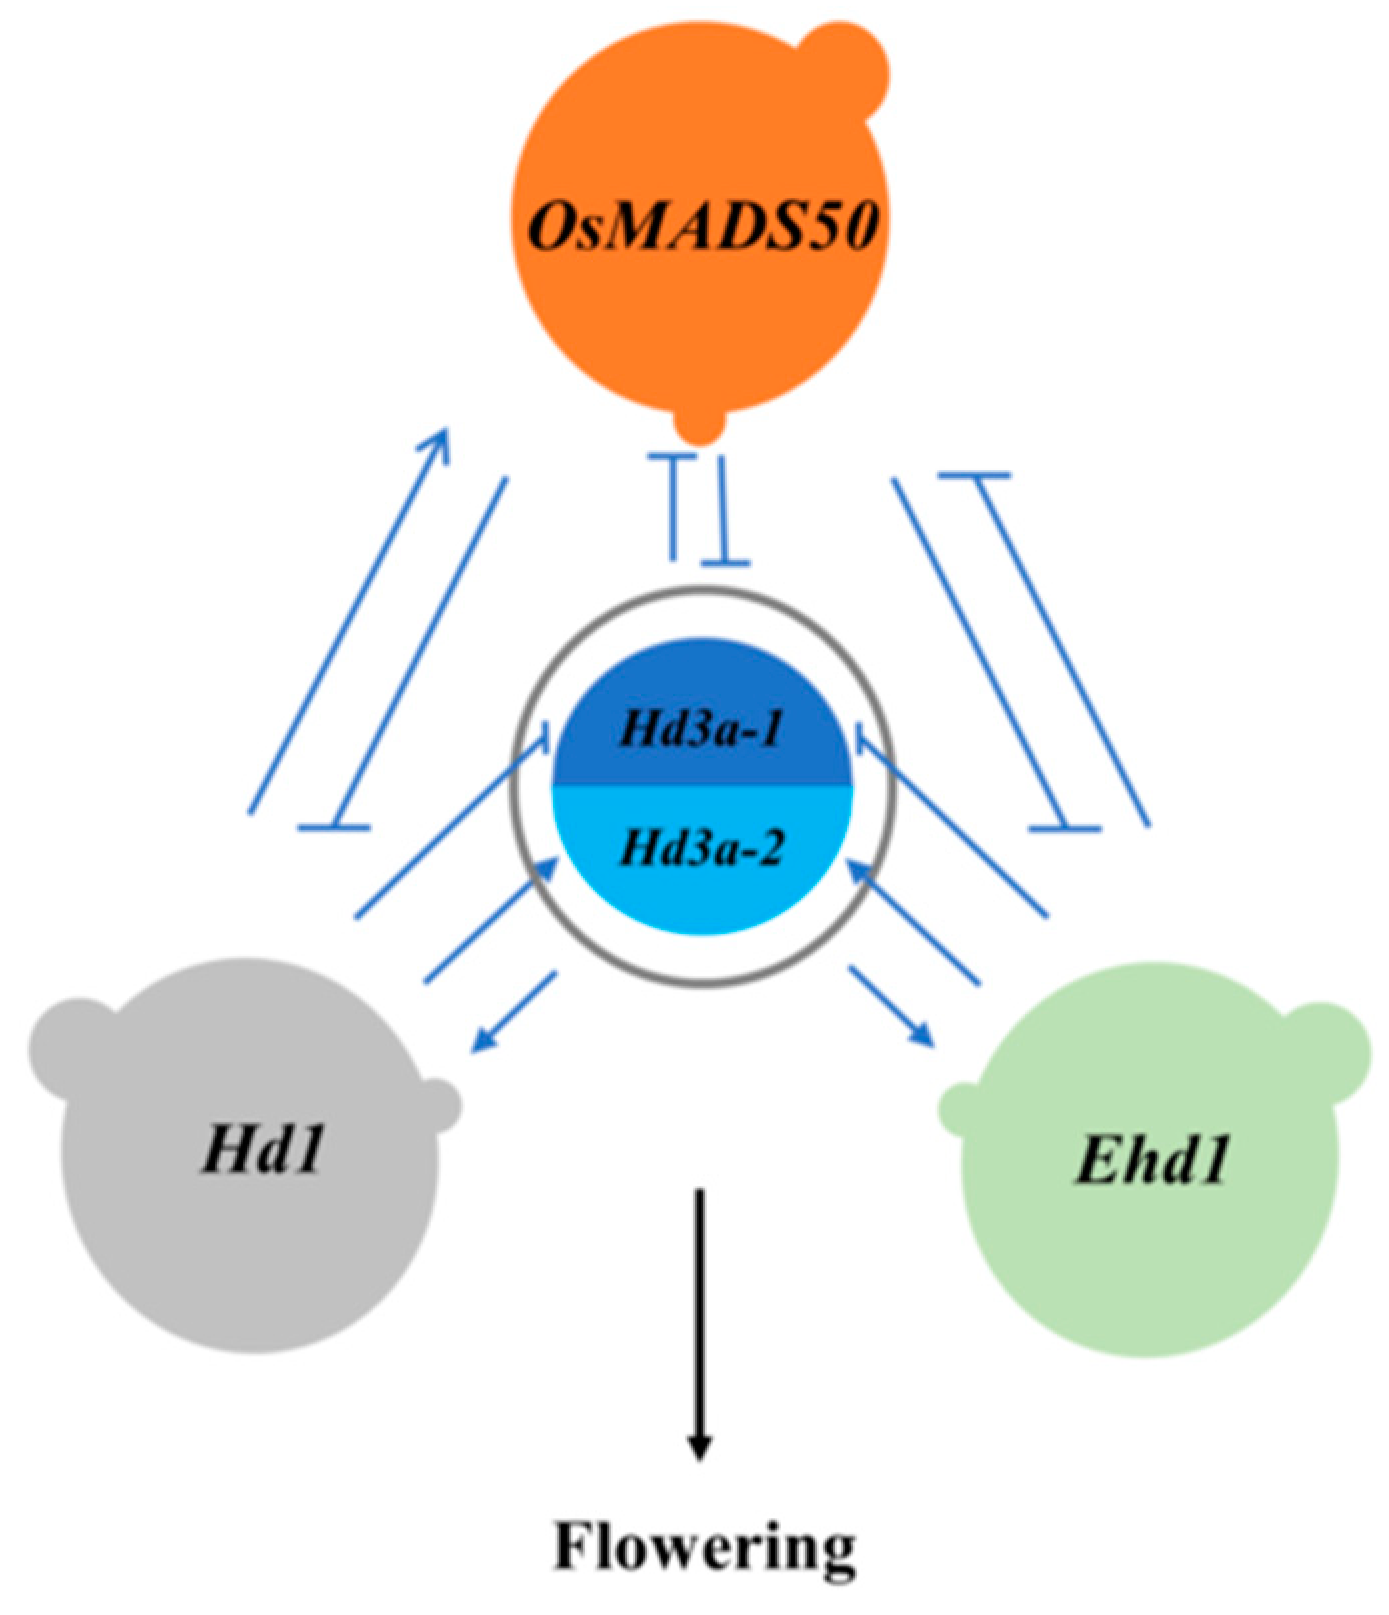
Figure 2.
Marker intervals for substitution segments of single segment substitution lines on corresponding chromosomes. Chr. and S were the abbreviation of chromosome and single segment substitution line, followed by serial numbers, respectively. The rectangular frames and the bold vertical lines represented chromosomes and substitution segments from donors of single segment substitution lines, respectively. The genetic distances (cM) for each marker and the marker names were listed on either side of chromosomes, respectively.
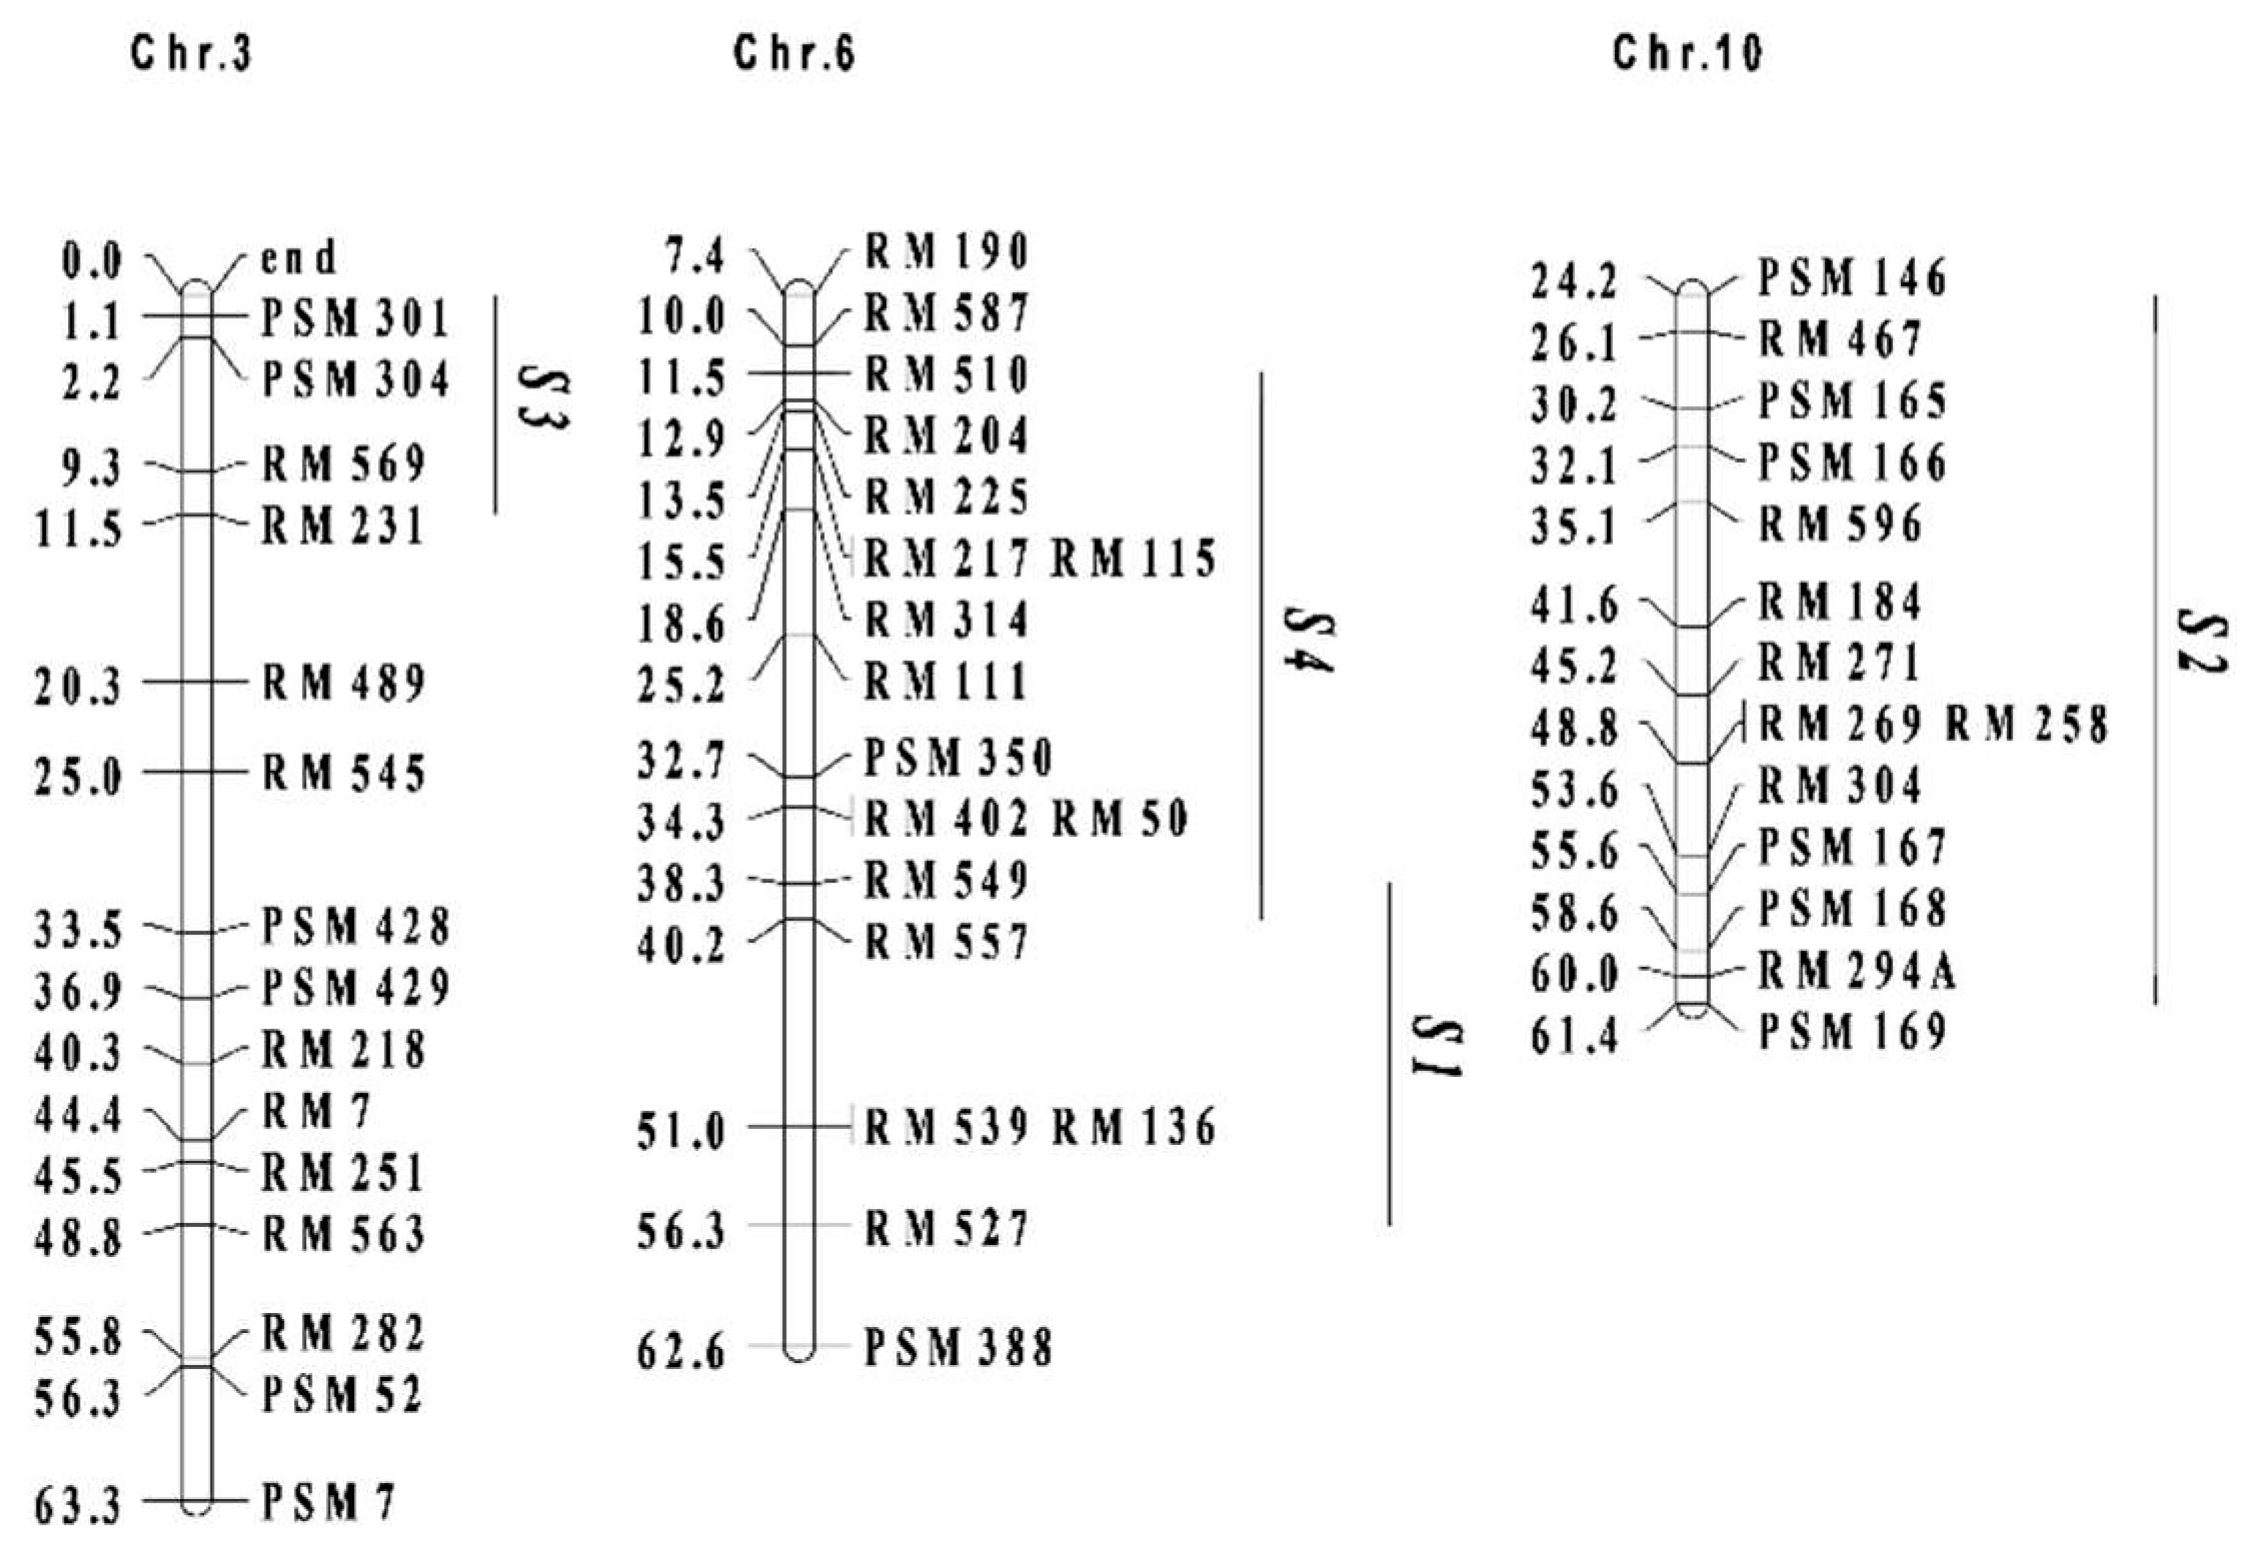

Table 1.
Additive effects (a) and additive × environment interaction effects (ae) of QTLs on heading date (day, d). “-” indicated that the allele from the donor shorten heading date. “*” and “**” represented the significance at the probability levels 0.05 and 0.01, respectively.
Table 1.
Additive effects (a) and additive × environment interaction effects (ae) of QTLs on heading date (day, d). “-” indicated that the allele from the donor shorten heading date. “*” and “**” represented the significance at the probability levels 0.05 and 0.01, respectively.
| QTL | a | ae1 | ae2 | ae3 |
|---|---|---|---|---|
| Ehd1 | 2.1* | |||
| OsMADS50 | -6.1** | -1.9* | ||
| Hd3a | 5.6** | |||
| Hd1 |
Table 2.
Dominance effects (d) and dominance × environment effects (de) of QTLs on heading date (day, d). “-” indicated that the allele from the donor shorten heading date. “*” and “**” represented the significance at the probability levels 0.05 and 0.01, respectively.
Table 2.
Dominance effects (d) and dominance × environment effects (de) of QTLs on heading date (day, d). “-” indicated that the allele from the donor shorten heading date. “*” and “**” represented the significance at the probability levels 0.05 and 0.01, respectively.
| QTL | d | de1 | de2 | de3 |
|---|---|---|---|---|
| Ehd1 | 2.7** | -2.3* | 2.6* | |
| OsMADS50 | -8.0** | |||
| Hd3a | 18.5** | -2.4* | ||
| Hd1 | 1.7* |
Table 3.
Pyramiding effects of QTLs on heading date (day, d). g was pyramiding effect, and ge was the interaction effect of genotype by environment. Ehd1-1 and Ehd1-2 respectively represented the heterozygote and homozygote of the QTL, and the rests were similar. “-” indicated that the allele from the donor shorten heading date. “*” and “**” represented the significance at the probability levels 0.05 and 0.01, respectively.
| QTL combination | g | ge1 | ge2 | ge3 | ||
|---|---|---|---|---|---|---|
| Ehd1-1 | OsMADS50-1 | -6.8** | 3.2* | |||
| Ehd1-1 | OsMADS50-2 | -6.6** | ||||
| Ehd1-1 | Hd3a-1 | 6.0** | 3.2* | |||
| Ehd1-1 | Hd3a-2 | 21.3** | ||||
| Ehd1-1 | Hd1-1 | |||||
| Ehd1-1 | Hd1-2 | 1.7* | -2.9* | 3.2* | ||
| Ehd1-2 | OsMADS50-1 | -3.9** | -3.4** | |||
| Ehd1-2 | OsMADS50-2 | -5.9** | -2.6* | |||
| Ehd1-2 | Hd3a-1 | 7.6** | -2.8* | 2.5* | ||
| Ehd1-2 | Hd3a-2 | 23.2** | -4.4** | 2.5* | ||
| Ehd1-2 | Hd1-1 | |||||
| Ehd1-2 | Hd1-2 | 2.7** | -2.9* | 2.6* | ||
| OsMADS50-1 | Hd3a-1 | -3.0** | ||||
| OsMADS50-1 | Hd3a-2 | 4.8** | ||||
| OsMADS50-1 | Hd1-1 | -6.6** | ||||
| OsMADS50-1 | Hd1-2 | -7.6** | 2.6* | |||
| OsMADS50-2 | Hd3a-1 | -6.2** | ||||
| OsMADS50-2 | Hd3a-2 | 3.6** | -2.8* | |||
| OsMADS50-2 | Hd1-1 | -9.0** | ||||
| OsMADS50-2 | Hd1-2 | -9.5** | ||||
| Hd3a-1 | Hd1-1 | 4.9** | ||||
| Hd3a-1 | Hd1-2 | 5.7** | ||||
| Hd3a-2 | Hd1-1 | 16.4** | 2.7* | -4.9** | ||
| Hd3a-2 | Hd1-2 | 13.1** | 5.7** | -7.9** | ||
| Ehd1-1 | OsMADS50-1 | Hd3a-1 | -5.6** | 6.0** | ||
| Ehd1-1 | OsMADS50-1 | Hd3a-2 | 9.4** | -3.1* | 3.1* | |
| Ehd1-1 | OsMADS50-1 | Hd1-1 | -6.6** | |||
| Ehd1-1 | OsMADS50-1 | Hd1-2 | -6.5** | 2.5* | ||
| Ehd1-1 | OsMADS50-2 | Hd3a-1 | -2.9** | |||
| Ehd1-1 | OsMADS50-2 | Hd3a-2 | 3.9** | |||
| Ehd1-1 | OsMADS50-2 | Hd1-1 | -8.2** | |||
| Ehd1-1 | OsMADS50-2 | Hd1-2 | -8.7** | |||
| Ehd1-1 | Hd3a-1 | Hd1-1 | 5.3** | |||
| Ehd1-1 | Hd3a-1 | Hd1-2 | 5.7** | |||
| Ehd1-1 | Hd3a-2 | Hd1-1 | 19.9** | |||
| Ehd1-1 | Hd3a-2 | Hd1-2 | 19.4** | |||
| Ehd1-2 | OsMADS50-1 | Hd3a-1 | -4.7** | 2.5* | ||
| Ehd1-2 | OsMADS50-1 | Hd3a-2 | 12.5** | -4.2** | 2.9* | |
| Ehd1-2 | OsMADS50-1 | Hd1-1 | -5.2** | 3.0* | ||
| Ehd1-2 | OsMADS50-1 | Hd1-2 | -3.8** | |||
| Ehd1-2 | OsMADS50-2 | Hd3a-1 | -1.9* | |||
| Ehd1-2 | OsMADS50-2 | Hd3a-2 | 8.4** | -3.1* | ||
| Ehd1-2 | OsMADS50-2 | Hd1-1 | -6.2** | |||
| Ehd1-2 | OsMADS50-2 | Hd1-2 | -6.6** | 3.0* | ||
| Ehd1-2 | Hd3a-1 | Hd1-1 | 8.7** | -2.9* | 2.6* | |
| Ehd1-2 | Hd3a-1 | Hd1-2 | 7.1** | |||
| Ehd1-2 | Hd3a-2 | Hd1-1 | 21.9** | |||
| Ehd1-2 | Hd3a-2 | Hd1-2 | 22.9** | -2.5* | ||
| OsMADS50-1 | Hd3a-1 | Hd1-1 | -3.8** | |||
| OsMADS50-1 | Hd3a-1 | Hd1-2 | -2.8** | 2.7* | ||
| OsMADS50-1 | Hd3a-2 | Hd1-1 | 2.9** | |||
| OsMADS50-1 | Hd3a-2 | Hd1-2 | 4.7** | |||
| OsMADS50-2 | Hd3a-1 | Hd1-1 | -4.4** | |||
| OsMADS50-2 | Hd3a-1 | Hd1-2 | -5.2** | |||
| OsMADS50-2 | Hd3a-2 | Hd1-1 | 4.0** | -2.6* | ||
| OsMADS50-2 | Hd3a-2 | Hd1-2 | ||||
Table 4.
The epistatic effect (e) and epistasis × environment effects (ee) between dual QTLs on HD (day, d). The numbers 1 and 2 immediately following the QTL names indicated the heterozygotes and the homozygotes of QTLs, respectively. For instance, Ehd1-1 and Ehd1-2 were the heterozygote and the homozygote of Ehd1, respectively. ee1, ee2 and ee3 represented the interaction effects of epistasis and three environments, respectively. “-” indicated that the interaction between the alleles from the donor shorten heading date. “*” and “**” represented the significance at the probability levels 0.05 and 0.01, respectively.
| QTL | e | ee1 | ee2 | ee3 | |
|---|---|---|---|---|---|
| Ehd1-1 | OsMADS50-1 | 3.5* | -3.4* | ||
| Ehd1-2 | OsMADS50-1 | 2.7** | |||
| Ehd1-1 | OsMADS50-2 | -3.2** | |||
| Ehd1-2 | OsMADS50-2 | ||||
| Ehd1-1 | Hd3a-1 | -15.2** | |||
| Ehd1-2 | Hd3a-1 | -12.2** | 3.7* | ||
| Ehd1-1 | Hd3a-2 | 13.0** | -3.5* | ||
| Ehd1-2 | Hd3a-2 | 16.2** | 4.1* | ||
| Ehd1-1 | Hd1-1 | -3.4** | 3.3* | -3.1* | |
| Ehd1-2 | Hd1-1 | ||||
| Ehd1-1 | Hd1-2 | ||||
| Ehd1-2 | Hd1-2 | ||||
| OsMADS50-1 | Hd3a-1 | -13.5** | 3.5* | ||
| OsMADS50-2 | Hd3a-1 | -18.6** | |||
| OsMADS50-1 | Hd3a-2 | 7.2** | |||
| OsMADS50-2 | Hd3a-2 | 6.4** | -3.6* | ||
| OsMADS50-1 | Hd1-1 | ||||
| OsMADS50-2 | Hd1-1 | -4.6** | |||
| OsMADS50-1 | Hd1-2 | -7.6** | |||
| OsMADS50-2 | Hd1-2 | -4.4** | |||
| Hd3a-1 | Hd1-1 | -15.3** | |||
| Hd3a-2 | Hd1-1 | 9.1** | 5.0** | -7.1** | |
| Hd3a-1 | Hd1-2 | ||||
| Hd3a-2 | Hd1-2 | 6.6** | 7.3** | -9.7** | |
Table 5.
The epistatic effect (e) and epistasis × environment effects (ee) among triple QTLs on HD (day, d). The numbers 1 and 2 immediately following the QTL names indicated the heterozygotes and the homozygotes of QTLs, respectively. ee1, ee2 and ee3 represented the interaction effects of epistasis and three environments, respectively. “-” indicated that the interaction between the alleles from the donor shorten heading date. “*” and “**” represented the significance at the probability level 0.05 and 0.01, respectively.
| QTL | e | ee1 | ee2 | ee3 | ||
|---|---|---|---|---|---|---|
| Ehd1-1 | OsMAD50-1 | Hd3a-1 | 16.8** | -5.6* | 7.5** | |
| Ehd1-1 | OsMAD50-1 | Hd3a-2 | -9.7** | 7.4** | ||
| Ehd1-1 | OsMAD50-1 | Hd1-1 | ||||
| Ehd1-1 | OsMAD50-1 | Hd1-2 | 8.9** | |||
| Ehd1-1 | OsMAD50-2 | Hd3a-1 | 19.0** | |||
| Ehd1-1 | OsMAD50-2 | Hd3a-2 | -9.3** | -6.0* | ||
| Ehd1-1 | OsMAD50-2 | Hd1-1 | 4.8** | |||
| Ehd1-1 | OsMAD50-2 | Hd1-2 | 3.3* | |||
| Ehd1-1 | Hd3a-1 | Hd1-1 | 16.3** | |||
| Ehd1-1 | Hd3a-1 | Hd1-2 | ||||
| Ehd1-1 | Hd3a-2 | Hd1-1 | -8.8** | -5.9* | 7.0** | |
| Ehd1-1 | Hd3a-2 | Hd1-2 | -7.5** | -5.7* | 9.0** | |
| Ehd1-2 | OsMAD50-1 | Hd3a-1 | 11.1** | |||
| Ehd1-2 | OsMAD50-1 | Hd3a-2 | -12.6** | |||
| Ehd1-2 | OsMAD50-1 | Hd1-1 | ||||
| Ehd1-2 | OsMAD50-1 | Hd1-2 | 6.4** | |||
| Ehd1-2 | OsMAD50-2 | Hd3a-1 | 14.0** | |||
| Ehd1-2 | OsMAD50-2 | Hd3a-2 | -8.7** | |||
| Ehd1-2 | OsMAD50-2 | Hd1-1 | 4.5** | |||
| Ehd1-2 | OsMAD50-2 | Hd1-2 | ||||
| Ehd1-2 | Hd3a-1 | Hd1-1 | 16.6** | |||
| Ehd1-2 | Hd3a-1 | Hd1-2 | ||||
| Ehd1-2 | Hd3a-2 | Hd1-1 | -10.1** | -5.5* | 6.8** | |
| Ehd1-2 | Hd3a-2 | Hd1-2 | -8.2** | -5.3* | 9.0** | |
| OsMAD50-1 | Hd3a-1 | Hd1-1 | 13.1** | |||
| OsMAD50-1 | Hd3a-1 | Hd1-2 | 8.6** | |||
| OsMAD50-1 | Hd3a-2 | Hd1-1 | -12.5** | |||
| OsMAD50-1 | Hd3a-2 | Hd1-2 | -7.0** | 10.7** | ||
| OsMAD50-2 | Hd3a-1 | Hd1-1 | 20.0** | |||
| OsMAD50-2 | Hd3a-1 | Hd1-2 | 6.1** | |||
| OsMAD50-2 | Hd3a-2 | Hd1-1 | -6.0** | -5.1* | 5.7* | |
| OsMAD50-2 | Hd3a-2 | Hd1-2 | -4.2** | -10.4** | 12.6** | |
Table 6.
The mixed epistatic effect (e) and mixed epistasis × environment effects (ee) among triple QTLs on HD (day, d). The numbers 1 and 2 immediately following the QTL names indicated the heterozygotes and the homozygotes of QTLs, respectively. ee1, ee2 and ee3 represented the interaction effects of mixed epistasis and three environments, respectively. “-” indicated that the interaction between the alleles from the donor shorten heading date. “*” and “**” represented the significance at the probability levels 0.05 and 0.01, respectively.
| QTL | e | ee1 | ee2 | ee3 | ||
|---|---|---|---|---|---|---|
| Ehd1-1 | OsMADS50-1 | Hd3a-1 | -13.4** | -4.5* | ||
| Ehd1-1 | OsMADS50-1 | Hd3a-2 | 19.1** | |||
| Ehd1-1 | OsMADS50-1 | Hd1-1 | -3.0* | |||
| Ehd1-1 | OsMADS50-1 | Hd1-2 | ||||
| Ehd1-1 | OsMADS50-2 | Hd3a-1 | -18.0** | |||
| Ehd1-1 | OsMADS50-2 | Hd3a-2 | -5.3** | |||
| Ehd1-1 | OsMADS50-2 | Hd1-1 | -3.8** | |||
| Ehd1-1 | OsMADS50-2 | Hd1-2 | -6.2** | 4.8* | -5.3* | |
| Ehd1-1 | Hd3a-1 | Hd1-1 | -17.6** | -4.8* | ||
| Ehd1-1 | Hd3a-1 | Hd1-2 | -16.4** | |||
| Ehd1-1 | Hd3a-2 | Hd1-1 | 9.9** | 4.4* | -6.7** | |
| Ehd1-1 | Hd3a-2 | Hd1-2 | 10.2** | |||
| Ehd1-2 | OsMADS50-1 | Hd3a-1 | -11.8** | -4.8* | 5.9* | |
| Ehd1-2 | OsMADS50-1 | Hd3a-2 | 13.6** | |||
| Ehd1-2 | OsMADS50-1 | Hd1-1 | ||||
| Ehd1-2 | OsMADS50-1 | Hd1-2 | ||||
| Ehd1-2 | OsMADS50-2 | Hd3a-1 | -15.6** | |||
| Ehd1-2 | OsMADS50-2 | Hd3a-2 | 7.6** | |||
| Ehd1-2 | OsMADS50-2 | Hd1-1 | -3.1* | |||
| Ehd1-2 | OsMADS50-2 | Hd1-2 | -2.7** | -4.8* | ||
| Ehd1-2 | Hd3a-1 | Hd1-1 | -12.8** | |||
| Ehd1-2 | Hd3a-1 | Hd1-2 | -13.6** | |||
| Ehd1-2 | Hd3a-2 | Hd1-1 | 13.3** | -4.6* | ||
| Ehd1-2 | Hd3a-2 | Hd1-2 | 15.1** | |||
| OsMADS50-1 | Hd3a-1 | Hd1-1 | -16.0** | |||
| OsMADS50-1 | Hd3a-1 | Hd1-2 | -14.2** | 4.4* | ||
| OsMADS50-1 | Hd3a-2 | Hd1-1 | 3.6** | -4.4* | ||
| OsMADS50-1 | Hd3a-2 | Hd1-2 | 6.2** | |||
| OsMADS50-2 | Hd3a-1 | Hd1-1 | -18.5** | |||
| OsMADS50-2 | Hd3a-1 | Hd1-2 | -18.5** | |||
| OsMADS50-2 | Hd3a-2 | Hd1-1 | 8.2** | -5.3* | ||
| OsMADS50-2 | Hd3a-2 | Hd1-2 | 4.2* | |||
Table 7.
The codes, heading date QTLs and donor sources of single segment substitution lines (SSSLs).
Table 7.
The codes, heading date QTLs and donor sources of single segment substitution lines (SSSLs).
| SSSL | Code | QTL on heading date | Donor source |
|---|---|---|---|
| W08-18-09-09-06-02 | IR64 | ||
| W27-18-03-21 | IAPAR9 | ||
| W23-03-08-09-27-82 | Lemont | ||
| W04-47-68-05-04-04-02-02 | BG367 |
Disclaimer/Publisher’s Note: The statements, opinions and data contained in all publications are solely those of the individual author(s) and contributor(s) and not of MDPI and/or the editor(s). MDPI and/or the editor(s) disclaim responsibility for any injury to people or property resulting from any ideas, methods, instructions or products referred to in the content. |
© 2023 by the authors. Licensee MDPI, Basel, Switzerland. This article is an open access article distributed under the terms and conditions of the Creative Commons Attribution (CC BY) license (http://creativecommons.org/licenses/by/4.0/).
Copyright: This open access article is published under a Creative Commons CC BY 4.0 license, which permit the free download, distribution, and reuse, provided that the author and preprint are cited in any reuse.


