
Submitted:
21 June 2023
Posted:
22 June 2023
You are already at the latest version
Abstract
(1) Background: Truing to find a fast and representative method for the approximate calculation of the culture density and the cell content of useful pigments, the examination of the absorption spectra of cultures of the dinoflagellate Amphidinium carterae, the haptophyte Isochrysis galbana, the chlorophyte Nephroselmis sp. and the filamentous cyanobacterium Anabaena sp. were chosen, as representative species of different taxa. (2) Methods: The experimental cultures were made in small volumes with the discontinuous method, under specific conditions each one and during the culture the absorption spectra, the density of the culture and the concentration in the pigments chlorophyll, total carotenoids and phycocyanin was recorded. (3) Results: The algal density can be quite precisely predicted as the regression equation of the correlation of the OD value of 750 nm drawn from each absorption spectrum and the measured algal biomass was very strong. The same applies also for the relevant correlations between OD 750 nm and the recorded pigments. (4) Conclusions: Absorption spectra of microalgal cultures can be an easy, low cost and non-invasive method to get the necessary information for predicting the right time to collect an ideal combination of maximum biomass and useful pigments, provided that the interpretation of the spectra is done considering that they are usefully applicable for that purpose in a case sensitive manner in terms of species and prevailing conditions.
Keywords:
Keywords microalgae
; pigments
; Amphidinium
; Isochrysis
; Nephroselmis
; Anabaena
; absorption spectrum.
1. Introduction
Microalgae are widely grown throughout the world to either produce raw biomass that can be fed to other organisms (such as rotifers in fish farms, mollusks, and crustaceans) or processed biomass that can be used to extract useful chemical molecules (such as biological pigments, biofuels, proteins, etc.) from the biomass [1,2,3]. It is essential to precisely and efficiently quantify the biomass of cultivated algae in order to assess their growth performance and gather information on their physiological and biochemical processes. An algae culture's growth can be monitored using both invasive and non-invasive methods, whether it's in a lab for research or an industrial plant for production. Which approach is more efficient relies on how carefully the operators use the techniques and how sensitive they are. Noninvasive methods include measuring optical absorbance in a spectrophotometer [10], determining dry weight after filtering, drying, and weighing, and quantifying cells with a hemocytometer [4,5,6,7,8,9]. Any other method that necessitates smashing cells and chemically analyzing their contents (such as those involving pigments, lipids, proteins, etc.) is intrusive. The algal mass can be precisely calculated by counting the cells with a hemocytometer [11,12] or by filtering and weighing the sample after it has dried. Cell counting is considered the most accurate method, although it takes a long time, is prone to misinterpretation, and is not suitable for microalgae that are filamentous, concatenated, or agglomerated [11]. In addition, both cell counting and weighing require some time to prepare and perform, and the challenge increases when there are many samples. Although cell counting based on the principle of suspended particle counting has recently been simplified and made more accurate with a flow cytometer [13,14], the method still requires an expensive, fine calibrated instrument, trained personnel, and can be used mainly only with unicellular microalgae [15,16]. However, the determination of the optical density of the sample using a spectrophotometer greatly simplifies the problem, since the optical density value can be very easily related to either dry weight or cell density if the necessary regression equations have been developed beforehand [9,17,18]. But in addition to biomass estimation at a single wavelength, the absorption spectrum can also be used to obtain relevant information about the composition of photosynthetic pigments. In order to harvest the biomass from a practical and cultural standpoint, it is essential to understand when the desired pigment reaches its peak concentration in the cells. Continuing the cultivation would be a waste of time, effort, and resources with no added benefit. We have no doubt that by simply looking at the absorption spectra, we can determine the density of the culture, the time at which certain pigments reach their peak, and the best time to harvest. This is based on our extensive observations of absorption spectra over a long period of time in various microalgal species. Estimating peak pigments from spectra can save growers time and money, even though it cannot entirely replace a full analytical methodology. However, prior research on individual microalgal species is necessary for the proper application of this method in order to understand how their culture develops under different environmental conditions and how their pigment concentration changes over time. In the current work, we have examined a number of microalgae (eukaryotic and cyanobacterial), all of which have been preliminary shown to be easily cultured and produce useful amounts of pigment. We investigated how the absorption spectra change during the cultivation period for a given set of environmental factors (salinity, temperature, white light intensity) for each particular species. As illumination is a highly representative and influential condition for cultivation, we evaluated the change in spectra during the cultivation period, by comparing two different lighting situations in the case of the cyanobacterium Anabaena sp. The results of the current study can be used as a planning tool for mass production of the microalgae described here, as well as other microalgae that are first subjected to a similar study. The growers using white or colored light and the absorption spectra can determine the best time to achieve the perfect combination of microalgae quantity and pigment content by evaluating the absorption spectra.
2. Materials and Methods
The species of marine microalgae used were the chlorophyte Nephroselmis sp., the dinophyte Amphidinium carterae, the haptophyte Isochrysis galbana and the cyanobacterium Anabaena sp. All 4 species were isolated from a survey in the lagoon of Messolonghi (W. Greece, 38°20′05.16″ N, 21°25′28.51″ E) [19,20] and were kept in the laboratory as monocultures. All were batch cultured indoors (Figure 1) in air-conditioned room at 20-21 oC, at salinity of 30 ppt (Amphidinium) or 40 ppt (Nephroselmis, Isochrysis, Anabaena) and 8000 lux white light intensity while for Anabaena 2000 lux were also used. One-liter glass Erlenmeyer flasks or specially configured 1 L plastic bottles (for Amphidinium) were used, , filled to the 0.9 L mark with previously sterilized water enriched with Walne’s medium. Walne's medium formula consists of 3 final stock solutions A, B, and C, each of which was employed in a ratio of 1 mL per liter of culture water. Basic nutrients N, P and K comprise solution A made by dilution of 300 g of NaNO3, 20 g of NH4Cl, and 30 g of KH2PO4 (Merck, Germany) in 1 L of distilled water. Trace elements (Merck, Germany) in solution B include ZnSO4.H2O (30 g), CuSO4.5H2O (25 g), CoSO4.7H2O (30 g), and MnSO4.H2O (20 g) diluted in 1 L of distilled water. Vitamin B12 (100 mg), biotin (100 mg), and thiamine (10 mg) (Merck, Germany) diluted in 1 L of distilled water make up solution C. Cultures and measurements of the various analyses were done in triplicates.
White light emitted by an array of 20 Watt 1600 lm LED lamps was used and the desired intensities of 40 and 160 μmol photons/m2/s (2000 and 8000 lux, respectively in the case of Anabaena) were attained by properly placing the vessels at the proper distance from the lamps. Intensity was measured at the middle of the outer surface of the vessels by means of a luminometer (BIOBLOCK LX-101, Panasonic). The illumination period of 16hL:8hD was controlled by an electric timer switching on/off appropriately the lamps. The cultures were kept in suspension by means of bubbling air (with its natural CO2 level) through a 2-mL glass pipettes (one in every vessel) at a rate of half culture volume/min. The pipettes were connected through sterilized plastic hoses to the 0.45 μm filtered central air supply system fed by a blower.
A known volume of culture was filtered using 0.45 m GF/C filters in a vacuum pump (Heto-SUE-3Q) to determine the dry weight. The filters were washed with ammonium formate to remove salts and then placed in a 100 oC oven for two hours. The dry weight was then calculated as g/L after they had been weighted to the fourth decimal digit.
Chlorophyll-a and total carotenoids in the case of the cyanobacterium Anabaena sp. were extracted with absolute methanol from centrifuged culture samples. In brief, 2mL of cyanobacterial culture was centrifuged at 5000 rpm for 7 min and then 2mL of methanol pre-cooled at 4 oC was added to the sediment and vigorously homogenized. Then the tube was covered with foil and incubated for 20 min. at 4 oC. The mixture was centrifuged at 5000 rpm at 4 oC for 7 min and the supernatant was measured in the spectrophotometer. Their concentrations (μg/mL) were determined using the following equations [21]:
where: (A) stands for the absorbance (or optical density-OD) of the processed sample at the indicated wave length using a Shimadzu UVmini-1240 UV-visible (Kyoto, Japan) spectrophotometer.
chl-a =12.9447 (A665-A720)
Chlorophyll-a, chlorophyll-b and total carotenoids in the case of the chlorophyte Nephroselmis sp. were extracted with DMSO from centrifuged culture samples. In brief, 2mL of algal culture was centrifuged at 5000 rpm for 7 min and then 2mL of prewarmed at 60 oC DMSO was added to the sediment and vigorously homogenized. Then the tube was covered with foil and incubated for 10 min. at 50 oC. The mixture was centrifuged at 5000 rpm for 5 min. and the supernatant was measured in the spectrophotometer. Their concentrations (μg/mL) were determined using the following equations [6]:
chl-a = 12.47(A665)−3,62(A649)
chl-b = 25.06(A649)−6.5(A665)
Chlorophyll-a and total carotenoids in the case of the dinophyte A. carterae and the haptophyte I. galbana were extracted with DMSO and determined as above, but for chlorophyll-c, the extraction was done with methanol at 20 oC and its concentration (μg/mL) was determined according to the equation [22]:
chl-c = 23.5902(A630)-7.8516(A647)- 1.5214(A664)-1.7443(A691)
The phytocyanin (PC) content was extracted by freezing (-20 oC) for 24 hours a concentrated known amount of culture in 0.1 M sodium phosphate buffer (pH 7.1) as solvent at a ratio of 1:10 (algal mass: solvent), and then thawing at 4 oC in the dark. The freezing and thawing process was repeated over the period of two days. The sample's slurry was then centrifuged for 5 minutes at 3000 rpm, and the supernatant's concentration of phycocyanin (measured in mg/mL) was calculated using the formula.:
From the above equation the yield in phycocyanin (PC) in mg PC/g dry weight was calculated using the equation [23]:
where: PCyield = mg of phycocyanin per g algal dry weight
V = volume of solvent used (mL)
D.W. = grams of dry weight of the algal mass used
Daily cell counting with a Fuchs-Rosenthal haematocytometer for single-celled species and drying-weighing a sample filtrate of the filamentous cyanobacterium every 3–4 days were used to measure algal growth, which was measured as either cells/mL for single-celled microalgae or dry weight (g/L) for the filamentous cyanobacterium. At the same time, the optical density at 750 nm was recorded in the spectrophotometer (for all species). Using untreated culture samples, the absorption spectra of the cultures at different stages of maturation were recorded in a Shimadzu UV-1800 (Kyoto, Japan) spectrophotometer, and the data were transformed using its UVprobe 3.2 software.3. Statistical calculations of regression lines, Pearson’s correlation coefficient, standard deviation (SD) and standard error (SE) were made with Excel (Microsoft, USA). For comparisons of pigment content ANOVA was used followed by pair wised Tukey’s test using the free PAST3 software.
3. Results
3.1. Amphidinium carterae
A. carterae was cultured for 15 days in 1 L plastic bottles with a salinity of 30 ppt and 8000 lux of illumination. From the second to the fifteenth day of culture, six absorption spectra were recorded, with cell densities ranging from 485,000 cells/mL on the second day to 3,050,000 cells/mL on the fifteenth day (Figure 2). Based on the plot of each spectrum's optical density (OD) at 750 nm versus the corresponding algal densities (Figure 3A), a regression line with R2=0.986 and its first order equation was produced: “cell density (cells/mL) = 3,000,000 x OD750nm - 317,746”.
The overall picture of the spectra displays a uniform shape of the curves with virtually flat shape for the first (2nd day), and then, in the following days, a gradually increasing peaking at the wave lengths that distinguish the different pigments (675 and 440 nm for chlorophyll-a, 465 nm for carotenoids and 590 nm for chlorophyll-c). In the final spectrum (of the highest algal density), peaks for all the aforementioned wave lengths became significantly more pronounced. Figure 4 shows the values of each pigment for each spectrum's associated wave length and algal density. All pigments clearly increased as the culture matured, and this rise was especially noticeable in the last two spectra with algal densities of 2,460,000 and 3,050,000 cells/mL. Chlorophyll-a was always much higher than chlorophyll-c or total carotenoids at all densities. At the density of 3,050,000 cells/mL, the maximum concentration of all pigments was recorded as: 5.863±0.322(SE) μg/mL chlorophyll-a, 2.183±0.019(SE) μg/mL chlorophyll-c and 4.517±0.099(SE) μg/mL total carotenoids. Using the pigment values, their plot against their corresponding values of 750 nm are depicted in Figure 3B. The regression equations for pigment – OD 750 nm relation: ”Chlor.-a (μg/mL) = 6.0279x(OD 750 nm) - 0.8847” (R² = 0.9833), “Total carot. (μg/mL) = 5.26x(OD 750 nm) - 1.2923” (R² = 0.9865) and “Chlor.-c (μg/mL) = 2.4032x(OD 750 nm) - 0.5071” (R² = 0.9843), are all very predictive as indicated by their very high Pearson’s coefficient (R2>0.98).
3.2. Isochrysis galbana
I. galbana was cultured for 18 days in 40 ppt salinity, 8000 lux illumination, and 1 L glass Erlenmeyer flasks. From the second to the sixteenth day of culture, 8-day absorption spectra were recorded, with cell densities ranging from 1,420,000 cells/mL on the second day to 17,000,000 cells/mL on the sixteenth day (Figure 5). The plot of each spectrum's optical density (OD) versus the corresponding algal densities at 750 nm (Figure 6A) produced a regression line with R2=0.996 and was described by the first order equation: “cell density (cells/mL) = 107 x OD750nm – (6x10⁶)”.
The overall appearance of the spectra displays a uniform shape of the curves with an almost flat shape for the first spectrum (2nd day), followed by gradual increases in the following days (4th, 6th, 7th, and 9th) and then an abrupt increase (11th, 13th, and 16th day) in the peaking at the wave lengths that are indicative of its various pigments (680 and 435 nm for chlorophyll-a, 500 nm for carotenoids, 590 and 640 nm for chlorophyll-c). The final spectrum (with the greatest algal density of17 x 106 cells/mL, 16th day) showed peaks for all of the aforementioned wave lengths that were significantly more pronounced. The values of each pigment for every corresponding wave length and algal density of each spectrum are depicted in Figure 7. There is an obvious increase of all pigments along the maturation of the culture which became much prominent in the last two spectra of algal densities of 10,400,000 and 17,000,000 cells/mL. The value of chlorophyll-a at all densities was always higher than either chlorophyll-c or total carotenoids (P<0.05). The maximum content in all pigments was recorded at the density of 17 x 106 cells/mL with: 11.977±0.052(SE) μg/mL chlorophyll-a, 7.987±0.084(SE) μg/mL chlorophyll-c and 10.113±0.074(SE) μg/mL total carotenoids. Using the measurent pigment concentrations, their plot against their corresponding values of 750 nm are depicted in Figure 6B. The regression equations for pigment – OD 750 nm relation: ”Chlor.-a (μg/mL) = 5.3491x(OD 750 nm) + 2.5417” (R² = 0.9879), “Total carot. (μg/mL) = 6.399x(OD 750 nm) - 1.2655” (R² = 0.9856) and “Chlor.-c (μg/mL) = 3.8151x(OD 750 nm) + 1.3218” (R² = 0.9721), are all very predictive as indicated by their very high Pearson’s coefficient (R2>0.97).
3.3. Nephroselmis sp.
Nephroselmis sp. was cultured for 20 days in 1 L glass Erlenmeyer flasks at a salinity of 40 ppt with 8000 lux illumination. From the second to the nineteenth day of culture, seven absorption spectra were recorded, with cell densities ranging from 6,350,000 cells/mL on the second day to 28,4000,000 cells/mL on the nineteenth day (Figure 8). The plot of each spectrum's optical density (OD) at 750 nm versus the corresponding algal densities (Figure 9A) produced a regression line with R2=0.9947 and was explained by the first order equation: “cell density (cells/mL) = 3x10⁷ x OD750nm - 107”.
The overall appearance of the spectra reveals a consistent unique shape of the curves with barely perceptible peaks in the first one (2nd day), and then, in the following days, a gradually increasing peaking at the wave lengths that distinguish the different pigments (682 and 440 nm for chlorophyll-a, 491 nm for carotenoids and 627 nm for chlorophyll-b). In the last two spectra, peaks for all of the aforementioned wave lengths became considerably more noticeable (of days 17 and 19 with the highest algal densities). Figure 10 shows the values of each pigment for each corresponding algal density of each spectrum. There is an obvious increase of all pigments along the maturation of the culture which became much prominent in the last two spectra of algal densities of 26,900,000 and 28,400,000 cells/mL. The value of chlorophyll-a at all densities was always higher than either chlorophyll-b or total carotenoids (P<0.05). The maximum content in all pigments was recorded at the density of 28,400,000 cells/mL with: 12.487±0.273(SE) μg/mL chlorophyll-a, 3.733±0.033(SE) μg/mL chlorophyll-b and 7.99±0.064(SE) μg/mL total carotenoids. Using the pigment values, their plots against their corresponding values of 750 nm are depicted in Figure 9B. The regression equations for pigment – OD 750 nm relation: ”Chlor.-a (μg/mL) = 10.205x(OD 750 nm) – 3.166” (R² = 0.9793), “Total carot. (μg/mL) = 8.516x(OD 750 nm) – 4.9908” (R² = 0.987) and “Chlor.-b (μg/mL) = 4.429x(OD 750 nm) – 3.0029” (R² = 0.9716), are all very predictive as indicated by their very high Pearson’s coefficient (R2>0.97).
3.4. Anabaena sp.
The culture of Anabaena sp. lasted 17 days and was done in 40 ppt salinity, illumination of 2000 and 8000 lux and using three 1 L glass Erlenmeyer flasks for each set of illumination. All parameters were examined and recorded separately for each of the light intensities except for the correlation of the dry weight – OD 750 nm where pooled data from both intensities were used.
Absorption spectra of 5 days were recorded covering the period from the 2nd till the 16th day of culture, with recorded dry weights from 0.45 and 0.407 g/L the second day up to 1.141 and 1.727 g/L the sixteenth day for low light (L) of 2000 lux and extra light (XL) of 8000 lux, respectively (Figure 11). Based on the 750 nm value of optical density (OD) of each spectrum, their pooled plot against the corresponding dry weight (Figure 12A) resulted in a regression line with R2=0.9989 and described by the first order equation “dry weight (g/L) = 1.2368 x OD750nm + 0.0754”.
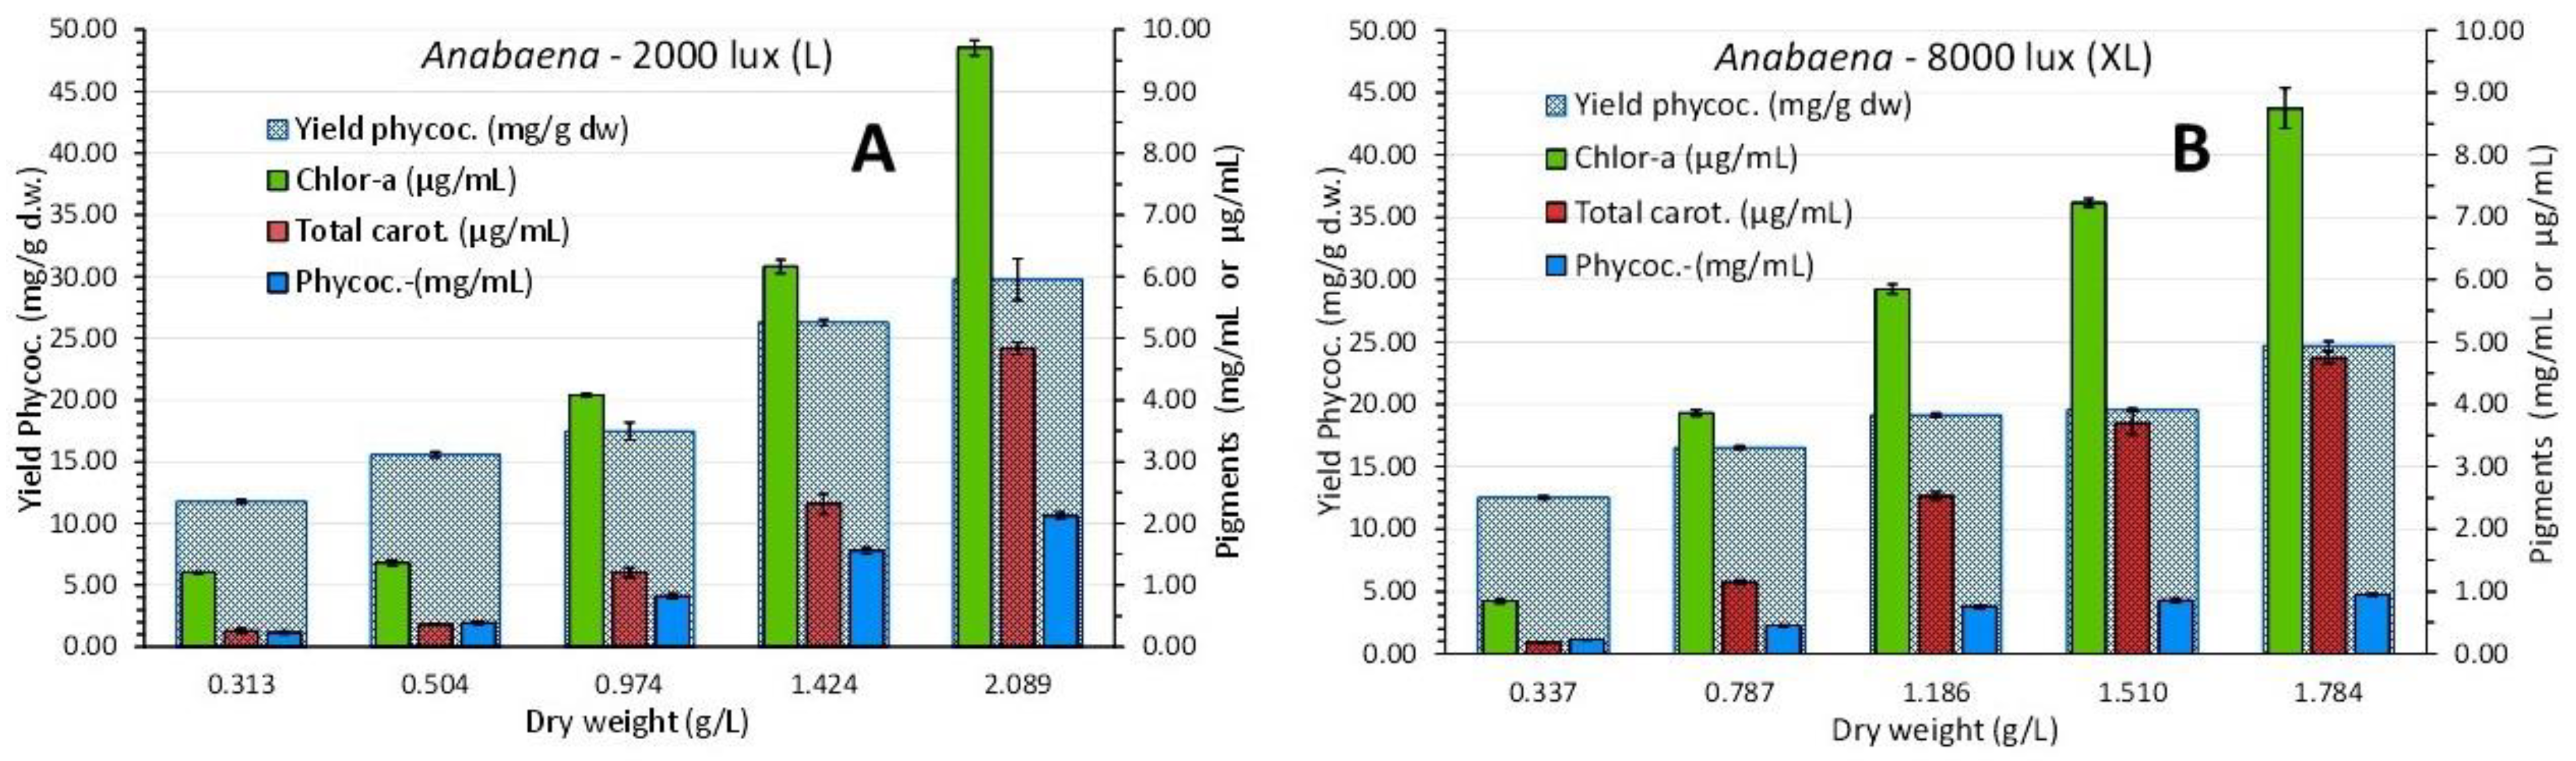
The overall picture of the spectra shows a uniform overall shape of the curves with slightly discernable peaks for the first one (2nd day) and afterwards, in the next days, a gradual increase in the peaking at the wave lengths that characterize the various pigments (679 and 439 nm for chlorophyll-a, 490 nm for carotenoids and 630 nm for phycocyanin). Peaks for all the above wave lengths became much prominent in the last two spectra (of days 12 and 16 with the highest algal densities). The values of each pigment for every corresponding algal density of each spectrum are depicted in Figure 13. There is an obvious increase of all pigments along the maturation of the culture which became much prominent in the last two spectra of algal densities of 1.424 and 2.089 g/L in L and 1.510 and 1.784 g/L in XL.
The value of chlorophyll-a at all densities of both light conditions was always higher than that of total carotenoids. The maximum content was recorded at the dry weight of 2.089 g/L with: 9.713 ± 0.123(SE) μg/mL chlorophyll-a and 4.839 ± 0.095(SE) μg/mL total carotenoids in “L” and at 1.784 g/L with: 8.75 ± 0.323(SE) μg/mL chlorophyll-a and 4.742 ± 0.091(SE) μg/mL total carotenoids in “XL”, values statistically equal (P>0.05) for carotenoids between the two light regimes and higher (P<0.05) in the case of chlorophyll in the “L” regime. In the case of phycocyanin the situation was totally different as the proportion of phycocyanin content in either concentration (mg/mL) or yield (mg/g dw), was significantly higher (P<0.05) in the final stages of the cultures in the condition of low (L) light (2.126 ± 0.078 mg/mL and 29.785 ± 1.687 mg/g d.w.) as compared to high (XL) light (0.943 ± 0.102 mg/mL and 24.697 ± 0.366 mg/g d.w.) (Figure 13).
Using the pigment values, their plot for chlorophyll-a and total carotenoids against their corresponding values of 750 nm using pooled data from both light regimes are depicted in Figure 12B. The regression equations for pigment – OD 750 nm relation: ”Chlor.-a (μg/mL) = 7.6403x(OD 750 nm) – 0.8902” (R² = 0.9847) and “Total carot. (μg/mL) = 4.3358x(OD 750 nm) – 1.1666” (R² = 0.9907), are both very predictive as indicated by their very high Pearson’s coefficient (R2>0.98). The corresponding equations for phycocyanin – OD 750 nm relation (Figure 12C) were calculated separately for “L” and “XL” illumination and resulted in: ”Phycocyanin (mg/mL) = 1.7797x(OD 750 nm) – 0.2299” (R² = 0.9687) in “L” and ”Phycocyanin (mg/mL) = 0.6984x(OD 750 nm) + 0.0765” (R² = 0.9897) in “XL”, both very predictive as indicated by their very high Pearson’s coefficient (R2>0.965), much higher than their respective one using pooled data from both light regimes (R² = 0.6389).
4. Discussion
The ability of each alga to photosynthesize depends on (and is influenced by) the composition of pigments in its photosynthetic system [24] and more generally on the size and shape of cells, especially those of phytoplankton species. Therefore, when two microalgal species are compared in monoculture, their absorption spectra can be expected to have (and do have) a particular shape that distinguishes them from each other. There are many reasons to study the absorption spectra of different microalgae [25]. For example, one can identify the pigments they contain or compare the location and height of a pigment's peak between a live culture sample and the extracted pigment to calculate the extent to which the pigment's absorption properties are altered by coupling to proteins. Applying the absorbance spectrum of a culture sample of a particular microalga to the calculation of important culture parameters (such as culture density, amount of pigment, etc.) cannot be done with absolute precision. This is because various factors, such as turbidity or other water constituents, either mask or introduce "noise" to the true shape of the spectrum as it would be produced by the pigments present alone. Although such a method may be considered inferior to the highest precision of a biochemical analysis, under production conditions it is critical to have a rapid and repeatable means of determining when the maximum algal biomass should be harvested or when the level of a desired pigment reaches its peak. When analyzing an absorption spectrum, two important things can be discovered. First, whether the culture density is expressed as cells/ml or as grams of dry weight per liter, the absorbance value at 750 nm has been shown to be the most accurate in numerous experiments [6,9] as this wavelength avoids the absorption of light by the photosynthetic pigments, which can affect this parameter, and only allows the measurement of the optical density of the cells. The spectra of all varieties of microalgae in the current study were examined and the values around 750 nm were found to have no peaks, making them the best predictors of biomass. The second component is to determine how the pigment peaks changed as the culture successively matured. This allows the grower to decide, or even predict, the best time to harvest the highest yield from the crop. In the current work, it was shown that the correlations between the concentration values of each pigment and the corresponding absorbance values at 750 nm for each absorbance spectrum of a given culture density cannot be ignored. But the next point must be noted. According to this, each absorption spectrum has its own characteristics and predictive value only under certain circumstances (phytoplankton species, temperature, and illumination)since the spectra are shaped differently depending on the conditions with respect to the critical values of absorption at 750 nm and the various other wavelengths that characterize the different pigments. This, together with the fact that not all pigments give rise to the same intense and obvious change in their peaks in the spectra, must make us particularly cautious when applying the predictive power of the spectra in relation to the concentration of the pigments, as shown by the present study. The case of the cyanobacterium Anabaena, where two different illumination intensities were applied, is the most illustrative example supporting the aforementioned claim. While the correlations between dry weight and 750 nm and between chlorophyll-a or total carotenoids and 750 nm with pooled values for both intensities show a very strong relationship with an apparent predictive value, in the case of phycocyanin such a strong correlation is shown only when the correlation of phycocyanin-750 nm is applied separately for the spectral values of each light intensity. The results on the effects of illumination on cyanobacteria in recent works [21,26,27] can also be seen as confirming this phenomenon although culture parameters (light, temperature, salinity, aeration, pH) have a significant effect on cell growth of a given microalgal species and the same is true for pigment content [24,29,30,31], this should not deter researchers from exploring the predictive potential of absorption spectra. However, this should be done only after sufficient time and effort has been invested in the basic biochemical studies in the culture of an algae under conditions found to be suitable so that they can be recorded as reference values in the respective environments. In the current study, selected species of microalgae from different taxa were examined, and it was shown that analysis of absorption spectra can be predictive for all of them, even when pigment content varies. While other researchers have found similar predictive power for cell density and pigment content using the corresponding wavelengths [7,8,32,33,34,35] without looking at the absorption spectra, our study uses similar techniques and an integrated approach that uses the absorption spectra as a comprehensive predictive tool for both qualification and quantification of biomass and pigment content.
5. Conclusions
The measurement of the biomass growth efficiency of 4 microalgae under laboratory circumstances was made possible by spectrophotometric analyses employing the absorption spectra. Monitoring of cell density or dry weight is made possible by using the optical density at 750 nm while also figuring out how much pigment is present in the microalgae that have been developed. On the basis of the data gathered, conclusions about different stages of the growth of the algae population can be made. By analyzing the absorption spectrum of a particular species' culture, under a particular set of conditions, and at a particular stage of growth, the optical density value of 750 nm and the various respective values at the wave lengths characterizing various pigments of each particular spectrum can be used as a reliable predictor of algal biomass and pigment content.
Author Contributions
Conceptualization, G.H.; methodology, G.H.; V.B. software, G.H.; V.B.; validation, G.H.; formal analysis, G.H.; V.B.; investigation, G.H.; resources, G.H.; data curation, G.H..; writing—original draft preparation, G.H.; writing—review and editing, G.H.; visualization, G.H.; supervision, G.H.; project administration, G.H.; funding acquisition, G.H. All authors have read and agreed to the published version of the manuscript.
Funding
This research was financially supported by the research program “ALGAVISION: Isolation and culture of local phytoplankton species aiming to mass production of antibacterial substances, fatty acids, pigments and antioxidants” (MIS 5048496), funded by the General Secretariat of Research and Technology of the Greek Government.
Institutional Review Board Statement
Not applicable.
Acknowledgments
The authors thank the technical staff of the laboratory Despoina Avramidou for her help in the experimentation.
Conflicts of Interest
The authors declare no conflict of interest. The funders had no role in the design of the study; in the collection, analyses, or interpretation of the data; in the writing of the manuscript; nor in the decision to publish the results.
References
- Chisti, Y. Biodiesel from Microalgae. Biotechnol Adv 2007, 25, 294–306. [Google Scholar] [CrossRef] [PubMed]
- Ajanovic, A. Renewable Fuels – A Comparative Assessment from Economic, Energetic and Ecological Point-of-View up to 2050 in EU-Countries. Renew Energy 2013, 60, 733–738. [Google Scholar] [CrossRef]
- Bharathiraja, B.; Chakravarthy, M.; Ranjith Kumar, R.; Yogendran, D.; Yuvaraj, D.; Jayamuthunagai, J.; Praveen Kumar, R.; Palani, S. Aquatic Biomass (Algae) as a Future Feed Stock for Bio-Refineries: A Review on Cultivation, Processing and Products. Renewable and Sustainable Energy Reviews 2015, 47, 634–653. [Google Scholar] [CrossRef]
- Sandnes, J.M.; Ringstad, T.; Wenner, D.; Heyerdahl, P.H.; Källqvist, T.; Gislerød, H.R. Real-Time Monitoring and Automatic Density Control of Large-Scale Microalgal Cultures Using near Infrared (NIR) Optical Density Sensors. J Biotechnol 2006, 122, 209–215. [Google Scholar] [CrossRef]
- White, L.H.; Martin, D.W.; Witt, K.K.; Vogt, F. Impacts of Nutrient Competition on Microalgae Biomass Production. J Chemom 2014, 28, 448–461. [Google Scholar] [CrossRef]
- Griffiths, M.J.; Garcin, C.; van Hille, R.P.; Harrison, S.T.L. Interference by Pigment in the Estimation of Microalgal Biomass Concentration by Optical Density. J Microbiol Methods 2011, 85, 119–123. [Google Scholar] [CrossRef] [PubMed]
- Ribeiro-Rodrigues, L.H.; Arenzon, A.; Raya-Rodriquez, M.T.; Ferreira Fontouna, N. Algal Density Assessed by Spectrophotometry: A Calibration Curve for the Unicellular Algae Pseudokirchneriella Subcapitata. Journal of Environmental Chemistry and Ecotoxicology 2011, 3, 225–228. [Google Scholar] [CrossRef]
- Santos-Ballardo, D.U.; Rossi, S.; Hernández, V.; Gómez, R.V.; del Carmen Rendón-Unceta, M.; Caro-Corrales, J.; Valdez-Ortiz, A. A Simple Spectrophotometric Method for Biomass Measurement of Important Microalgae Species in Aquaculture. Aquaculture 2015, 448, 87–92. [Google Scholar] [CrossRef]
- Hotos, G.N.; Avramidou, D.; Bekiari, V. Calibration Curves of Culture Density Assessed by Spectrophotometer for Three Microalgae (Nephroselmis Sp., Amphidinium Carterae and Phormidium Sp.). European Journal of Biology and Biotechnology 2020, 1. [Google Scholar] [CrossRef]
- Lu, L.; Yang, G.; Zhu, B.; Pan, K. A Comparative Study on Three Quantitating Methods of Microalgal Biomass. Indian J Geomarine Sci 2017, 46, 2265–2272. [Google Scholar]
- Stein, J.R. Dry Weight, Volume and Optical Density. In Handbook of Phycological Methods: Culture Methods and Growth Measurements; Stein, J.R., Ed.; Cambridge University Press: London, 1973; pp. 21–22. [Google Scholar]
- Guillard, R.R.L.; Sieracki, M.S. Counting Cells in Cultures with the Light Microscope. In Algal Culturing Techniques; andersen, R.A., Ed.; Elsevier: Amsterdam, 2005; pp. 239–252. [Google Scholar]
- Hyka, P.; Lickova, S.; Přibyl, P.; Melzoch, K.; Kovar, K. Flow Cytometry for the Development of Biotechnological Processes with Microalgae. Biotechnol Adv 2013, 31, 2–16. [Google Scholar] [CrossRef]
- Rottberger, J.; Gruber, A.; Kroth, P.G. Analysing Size Variation during Light-Starvation Response of Nutritionally Diverse Chrysophytes with a Coulter Counter. Arch Hydrobiol Suppl Algol Stud 2013, 141, 37–51. [Google Scholar] [CrossRef]
- Marie, D.; Simon, N.; Vaulot, D. Phytoplankton Cell Counting by Flow Cytometry. In Algal culturing techniques; Andersen, R.A., Ed.; Academic Press, 2005; pp. 253–267. [Google Scholar]
- Moheimani, N.R.; Borowitzka, M.A.; Isdepsky, A.; Sing, S.F. Standard Methods for Measuring Growth of Algae and Their Composition. In Algae for Biofuels and Energy; Springer Netherlands: Dordrecht, 2013; pp. 265–284. [Google Scholar]
- Sarrafzadeh, M.H.; La, H.-J.; Seo, S.-H.; Asgharnejad, H.; Oh, H.-M. Evaluation of Various Techniques for Microalgal Biomass Quantification. J Biotechnol 2015, 216, 90–97. [Google Scholar] [CrossRef] [PubMed]
- Almomani, F.A.; Örmeci, B. Monitoring and Measurement of Microalgae Using the First Derivative of Absorbance and Comparison with Chlorophyll Extraction Method. Environ Monit Assess 2018, 190, 90. [Google Scholar] [CrossRef] [PubMed]
- Hotos, G.N. A Preliminary Survey on the Planktonic Biota in a Hypersaline Pond of Messolonghi Saltworks (W. Greece). Diversity (Basel) 2021, 13, 270. [Google Scholar] [CrossRef]
- Hotos, G.; Avramidou, D.; Mastropetros, S.G.; Tsigkou, K.; Kouvara, K.; Makridis, P.; Kornaros, M. Isolation, Identification, and Chemical Composition Analysis of Nine Microalgal and Cyanobacterial Species Isolated in Lagoons of Western Greece. Algal Res 2023, 69, 102935. [Google Scholar] [CrossRef]
- Hotos, G.N.; Antoniadis, T.I. The Effect of Colored and White Light on Growth and Phycobiliproteins, Chlorophyll and Carotenoids Content of the Marine Cyanobacteria Phormidium Sp. and Cyanothece Sp. in Batch Cultures. Life 2022, 12, 837. [Google Scholar] [CrossRef] [PubMed]
- Ritchie, R.J. Universal Chlorophyll Equations for Estimating Chlorophylls a, b, c, and d and Total Chlorophylls in Natural Assemblages of Photosynthetic Organisms Using Acetone, Methanol, or Ethanol Solvents. Photosynthetica 2008, 46, 115–126. [Google Scholar] [CrossRef]
- Moraes, C.C.; Sala, L.; Cerveira, G.P.; Kalil, S.J. C-Phycocyanin Extraction from Spirulina Platensis Wet Biomass. Brazilian Journal of Chemical Engineering 2011, 28, 45–49. [Google Scholar] [CrossRef]
- Maltsev, Y.; Maltseva, K.; Kulikovskiy, M.; Maltseva, S. Influence of Light Conditions on Microalgae Growth and Content of Lipids, Carotenoids, and Fatty Acid Composition. Biology (Basel) 2021, 10, 1060. [Google Scholar] [CrossRef]
- Kirk, J.T.O. Light Capture by Aquatic Plants. In Light and photosynthesis in aquatic ecosystems; Kirk, J.T.O., Ed.; Cambridge University Press: Cambridge, 1994; pp. 201–218. ISBN 9780511623370. [Google Scholar]
- Hotos, G.N. Culture Growth of the Cyanobacterium Phormidium Sp. in Various Salinity and Light Regimes and Their Influence on Its Phycocyanin and Other Pigments Content. J Mar Sci Eng 2021, 9, 798. [Google Scholar] [CrossRef]
- Hotos, G.N.; Avramidou, D.; Samara, A. The Effect of Salinity and Light Intensity on the Batch Cultured Cyanobacteria Anabaena Sp. and Cyanothece Sp. Hydrobiology 2022, 1, 278–287. [Google Scholar] [CrossRef]
- Guedes, A.; Malcata, X. Nutritional Value and Uses of Microalgae in Aquaculture. In Aquaculture; Zainal Abidin, Muchlisin, Ed.; InTech, 2012; pp. 63–66. [Google Scholar]
- Healey, F.P. Physiological Indicators of Nutrient Deficiency in Algae. SIL Communications, 1953-1996 1978, 21, 34–41. [Google Scholar] [CrossRef]
- Minhas, A.K.; Hodgson, P.; Barrow, C.J.; Adholeya, A. A Review on the Assessment of Stress Conditions for Simultaneous Production of Microalgal Lipids and Carotenoids. Front Microbiol 2016, 7. [Google Scholar] [CrossRef]
- Montero-Lobato, Z.; Vázquez, M.; Navarro, F.; Fuentes, J.; Bermejo, E.; Garbayo, I.; Vílchez, C.; Cuaresma, M. Chemically-Induced Production of Anti-Inflammatory Molecules in Microalgae. Mar Drugs 2018, 16, 478. [Google Scholar] [CrossRef]
- Valer, R.M.; Glock, L. Quantificação de Algas Clorofíceas Deinteresse Ecotoxicológico a Través Do Método Espectrofotométrico. Acta Limnol. Bras. 1998, 11, 148–156. [Google Scholar]
- Rossi, S.; Fiorillo, I. Biochemical Features of a <I>Protoceratium Reticulatum</I> Red Tide in Chipana Bay (Northern Chile) in Summer Conditions. Sci Mar 2010, 74, 633–642. [Google Scholar] [CrossRef]
- Ebenezer, V.; Ki, J.-S. Quantification of Toxic Effects of the Herbicide Metolachlor on Marine Microalgae Ditylum Brightwellii (Bacillariophyceae), Prorocentrum Minimum (Dinophyceae), and Tetraselmis Suecica (Chlorophyceae). Journal of Microbiology 2013, 51, 136–139. [Google Scholar] [CrossRef] [PubMed]
- Lee, E.; Heng, R.-L.; Pilon, L. Spectral Optical Properties of Selected Photosynthetic Microalgae Producing Biofuels. J Quant Spectrosc Radiat Transf 2013, 114, 122–135. [Google Scholar] [CrossRef]
Figure 1.
Representative photos of the cultures of the 4 microalgae shot at various days of their culture period. A and B: Amphidinium carterae at 2nd and 10th day, respectively. C and D: Isochrysis galbana at 2nd and 9th day, respectively. E and F: Nephroselmis sp. at 2nd and 8th day, respectively. G and H: Anabaena sp. at 3rd and 9th day, respectively.
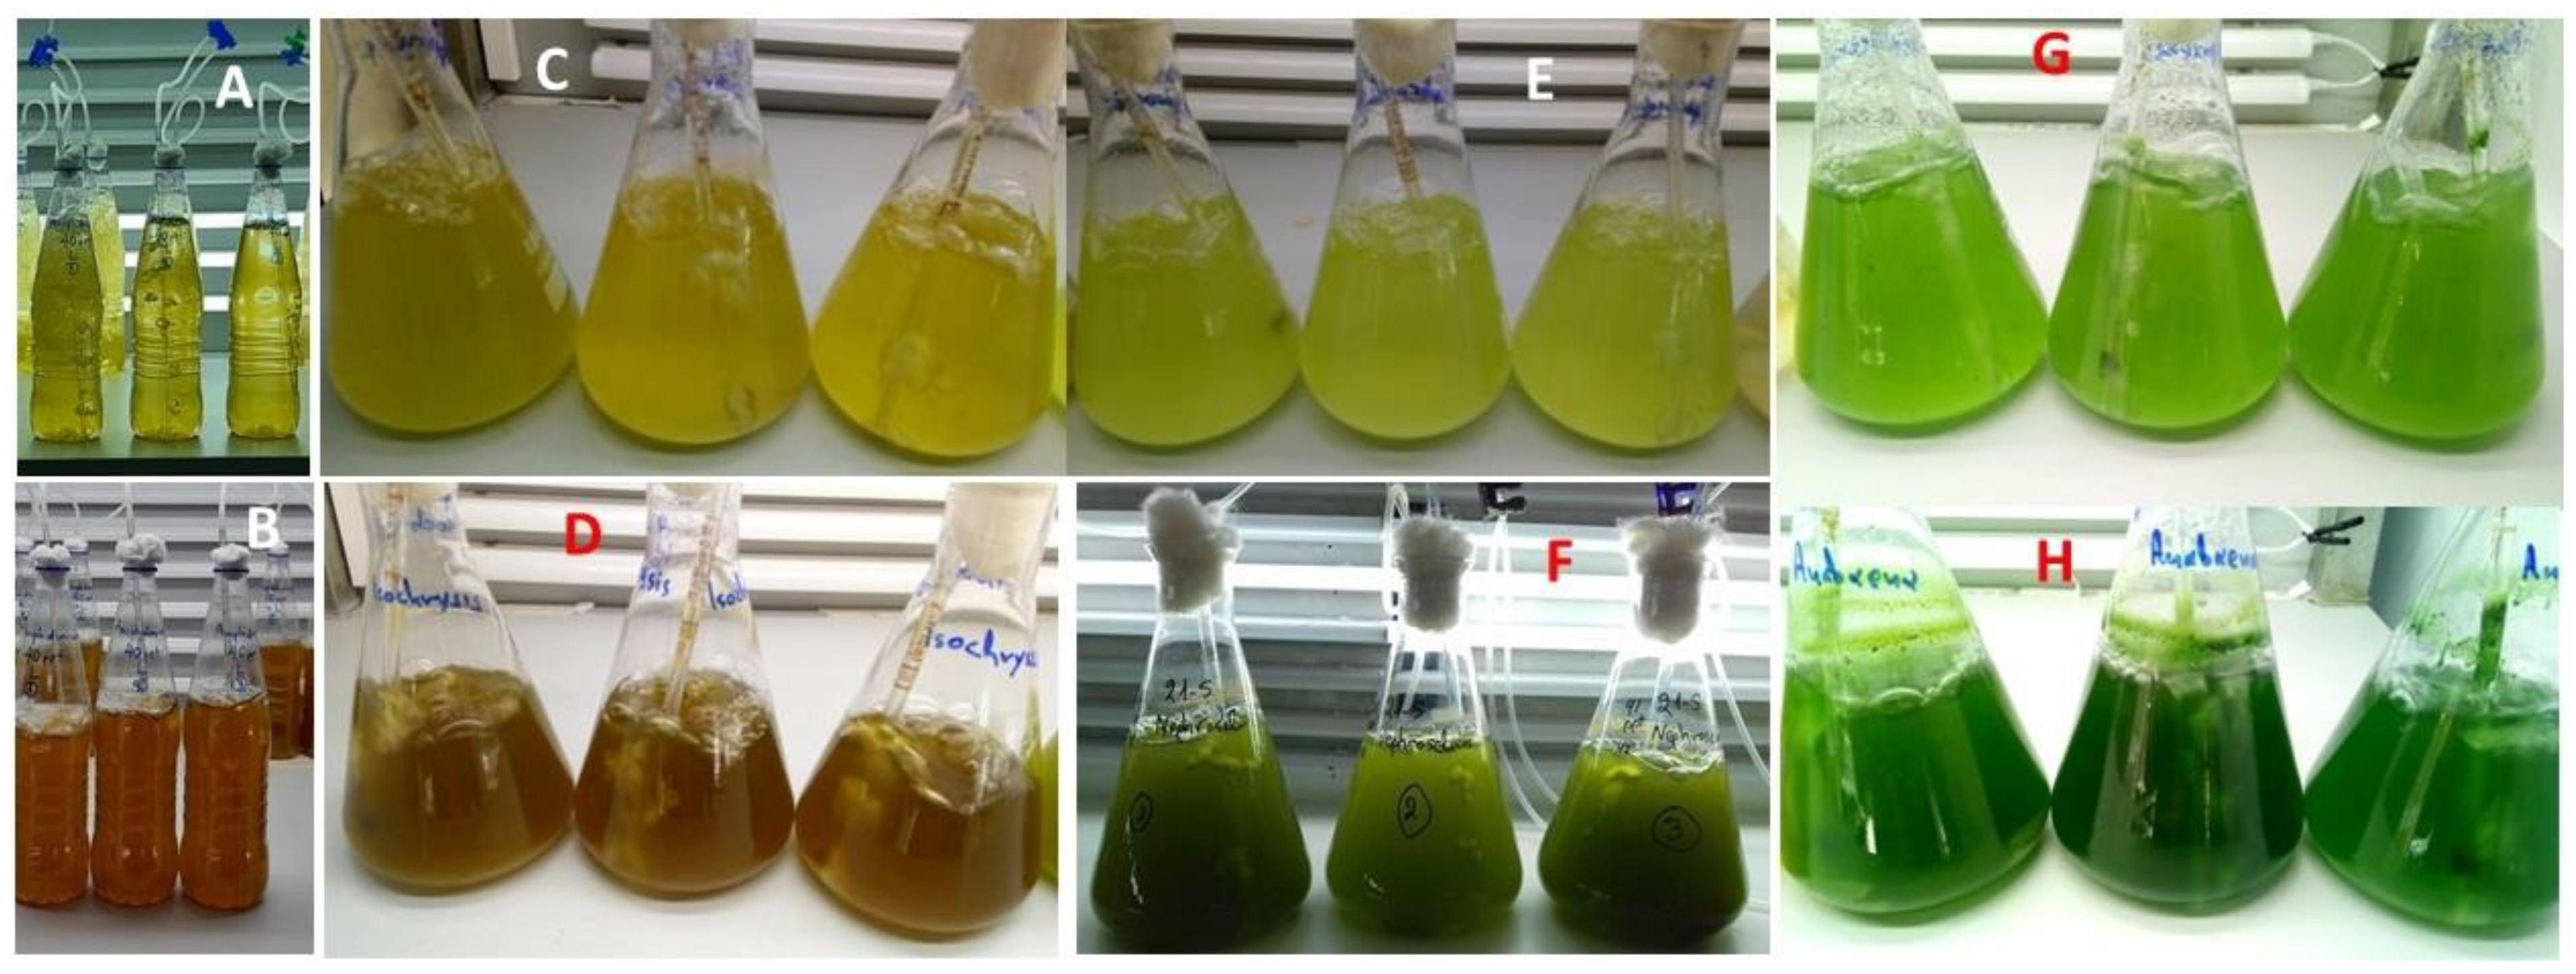
Figure 2.
Absorption spectra of Amphidinium carterae culture at different cell densities.
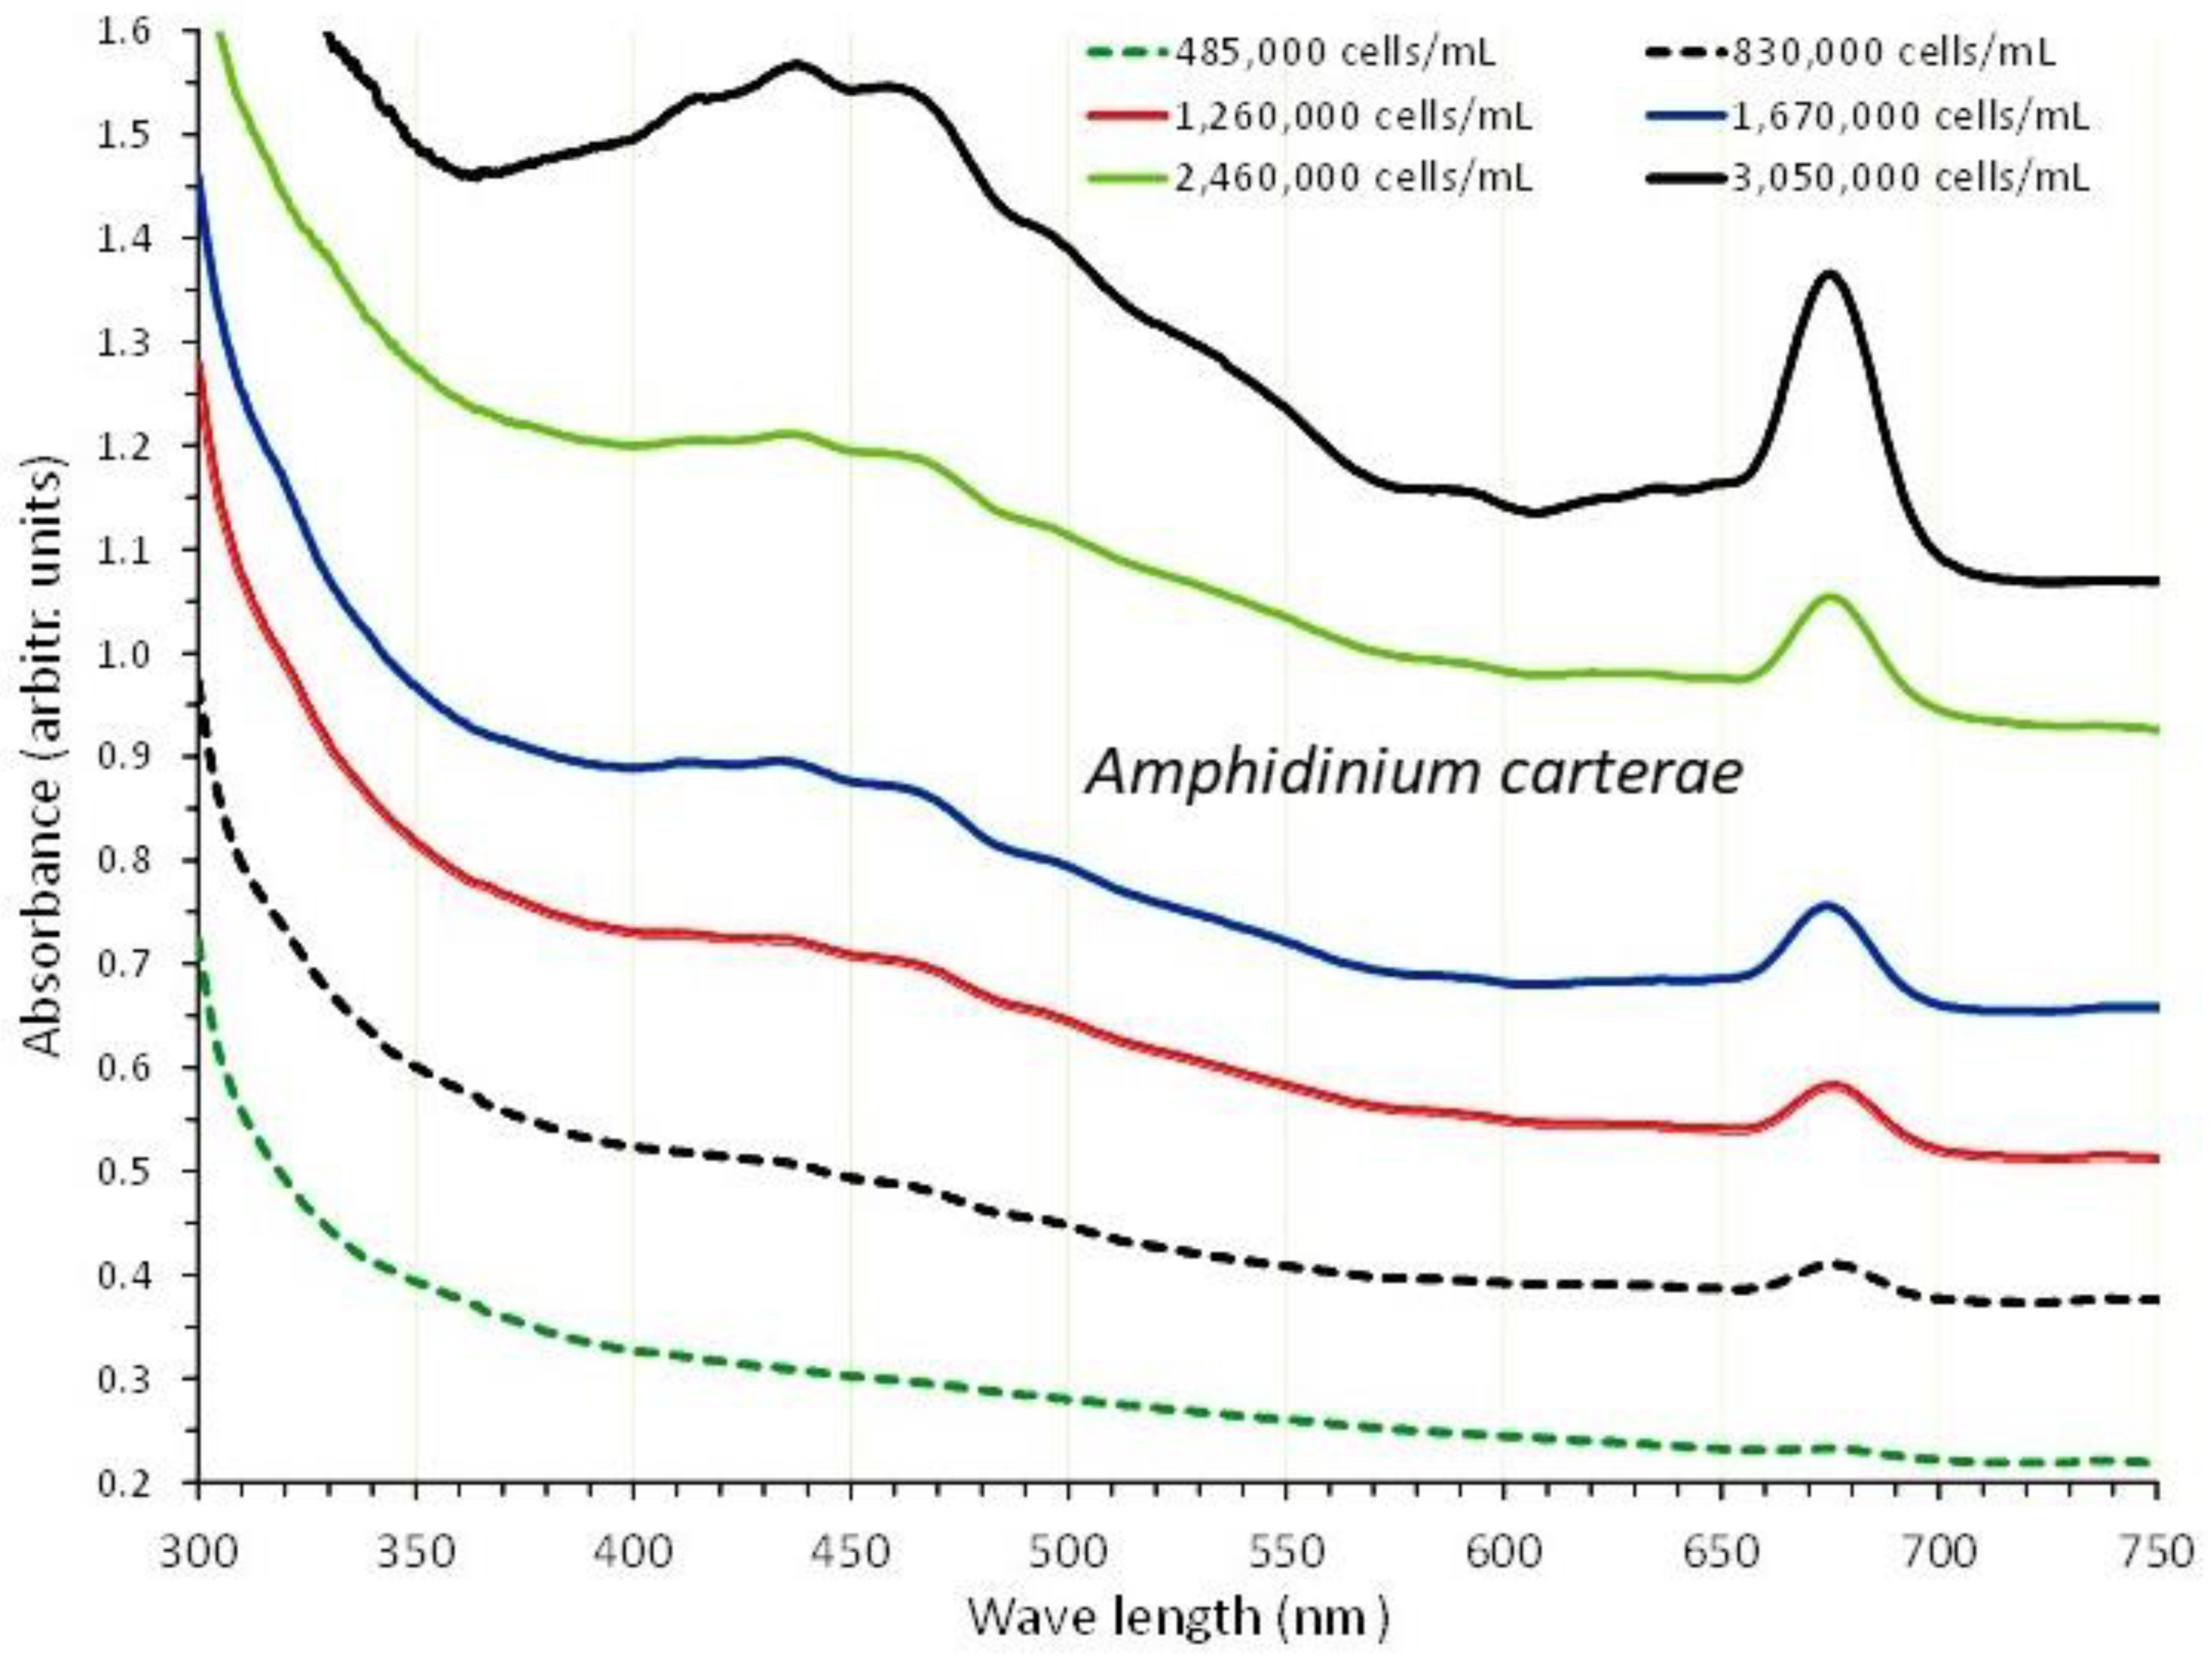
Figure 3.
Correlation of algal density (A) and pigment concentration (B) with absorption (Optical Density-OD) at 750 nm in Amphidinium carterae culture. Values are means of 3 replicates ± SD.
Figure 3.
Correlation of algal density (A) and pigment concentration (B) with absorption (Optical Density-OD) at 750 nm in Amphidinium carterae culture. Values are means of 3 replicates ± SD.
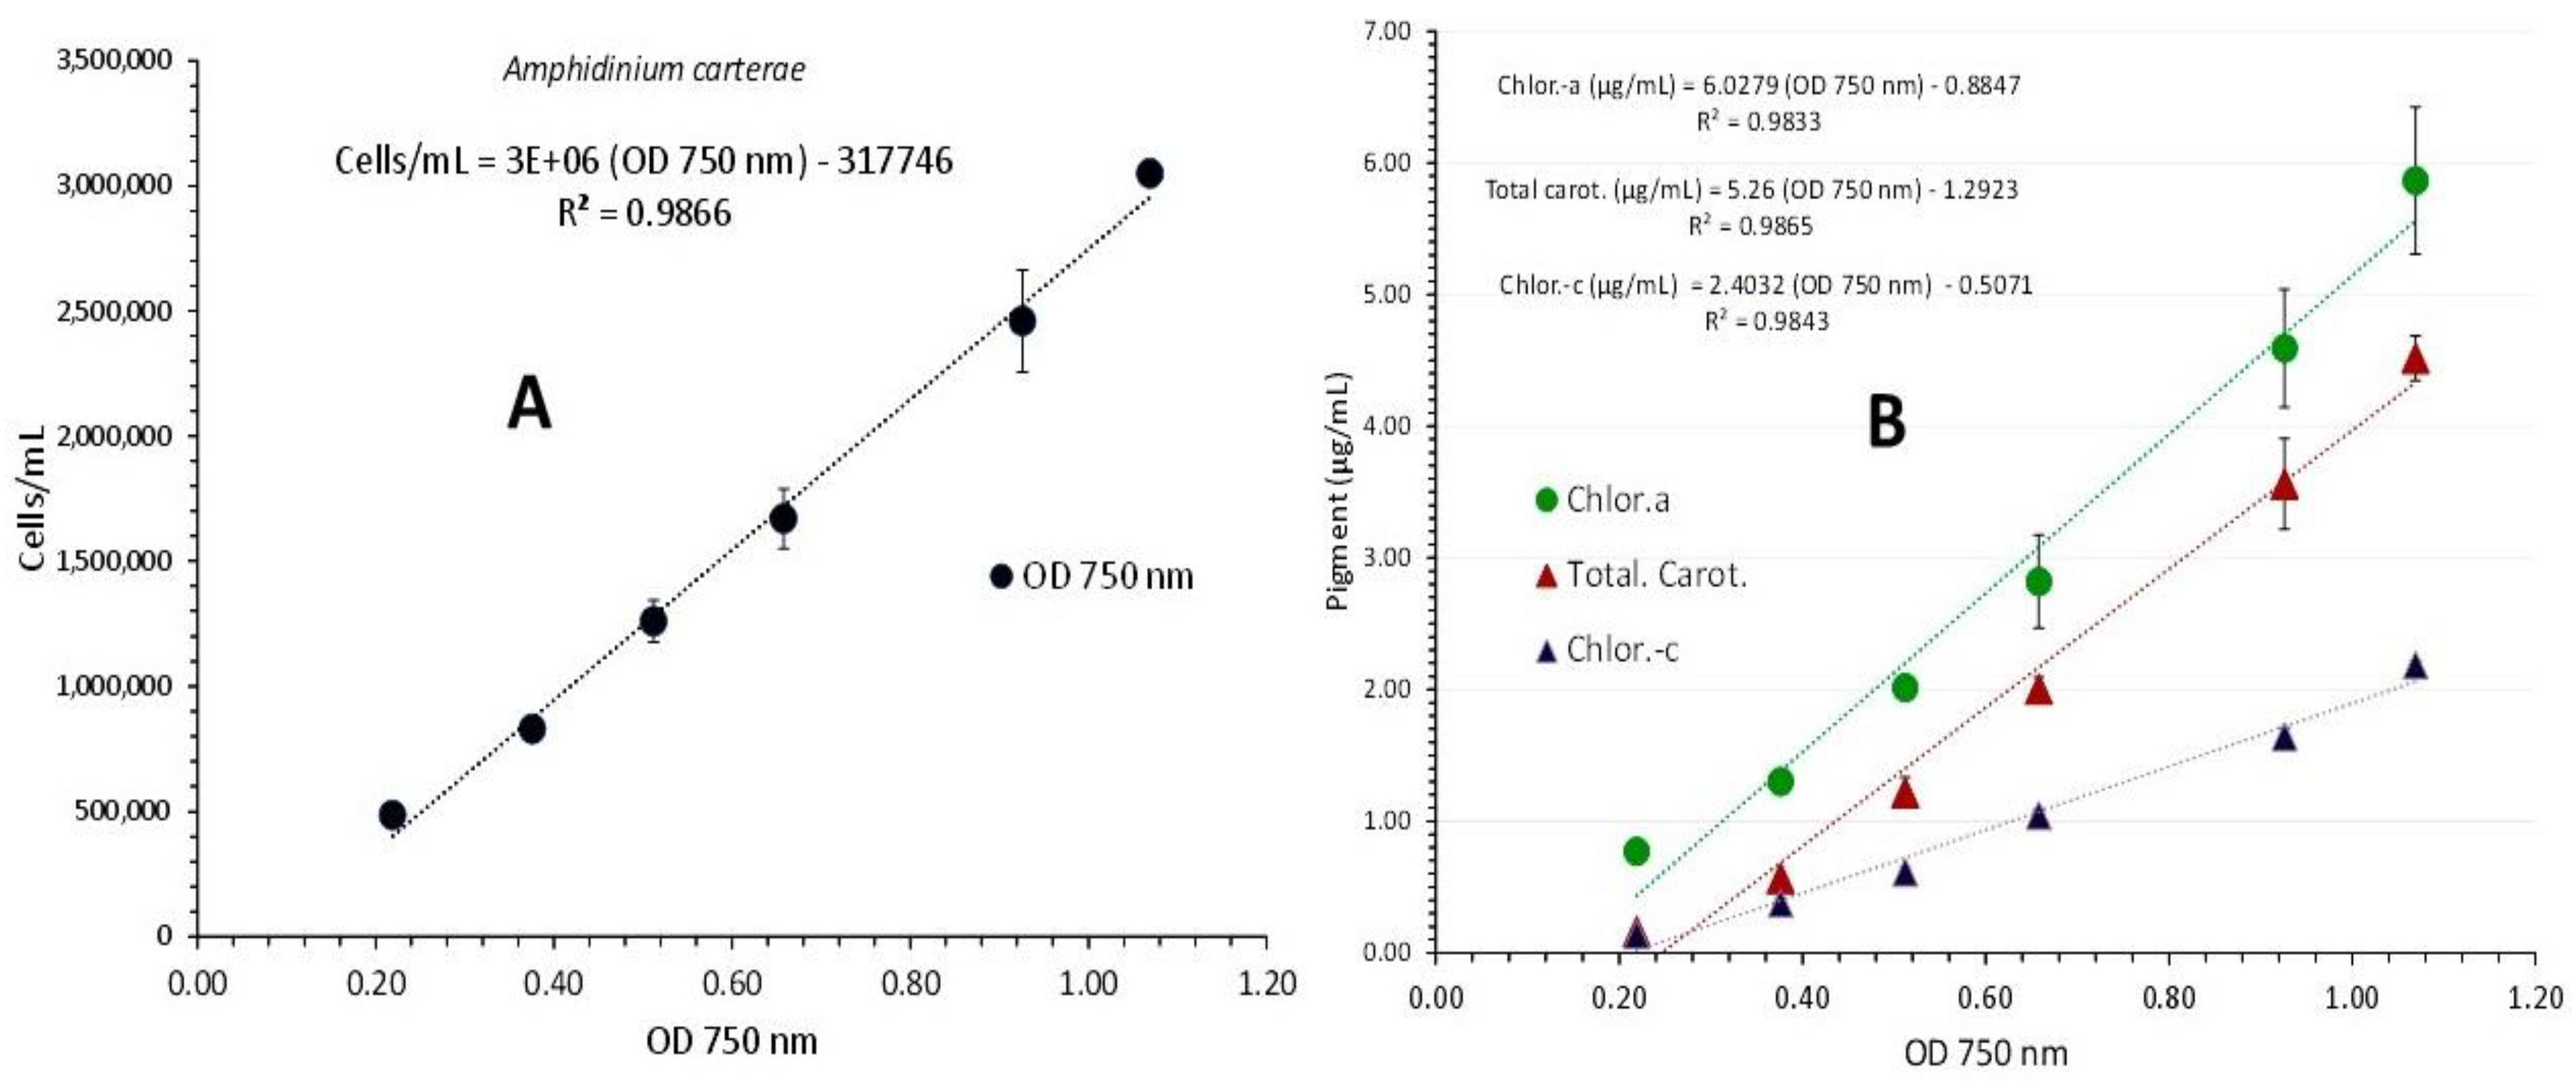
Figure 4.
Pigment content in μg/mL ± SE of Amphidinium carterae culture at different cell densities. Values are means of 3 replicates ± SE.
Figure 4.
Pigment content in μg/mL ± SE of Amphidinium carterae culture at different cell densities. Values are means of 3 replicates ± SE.
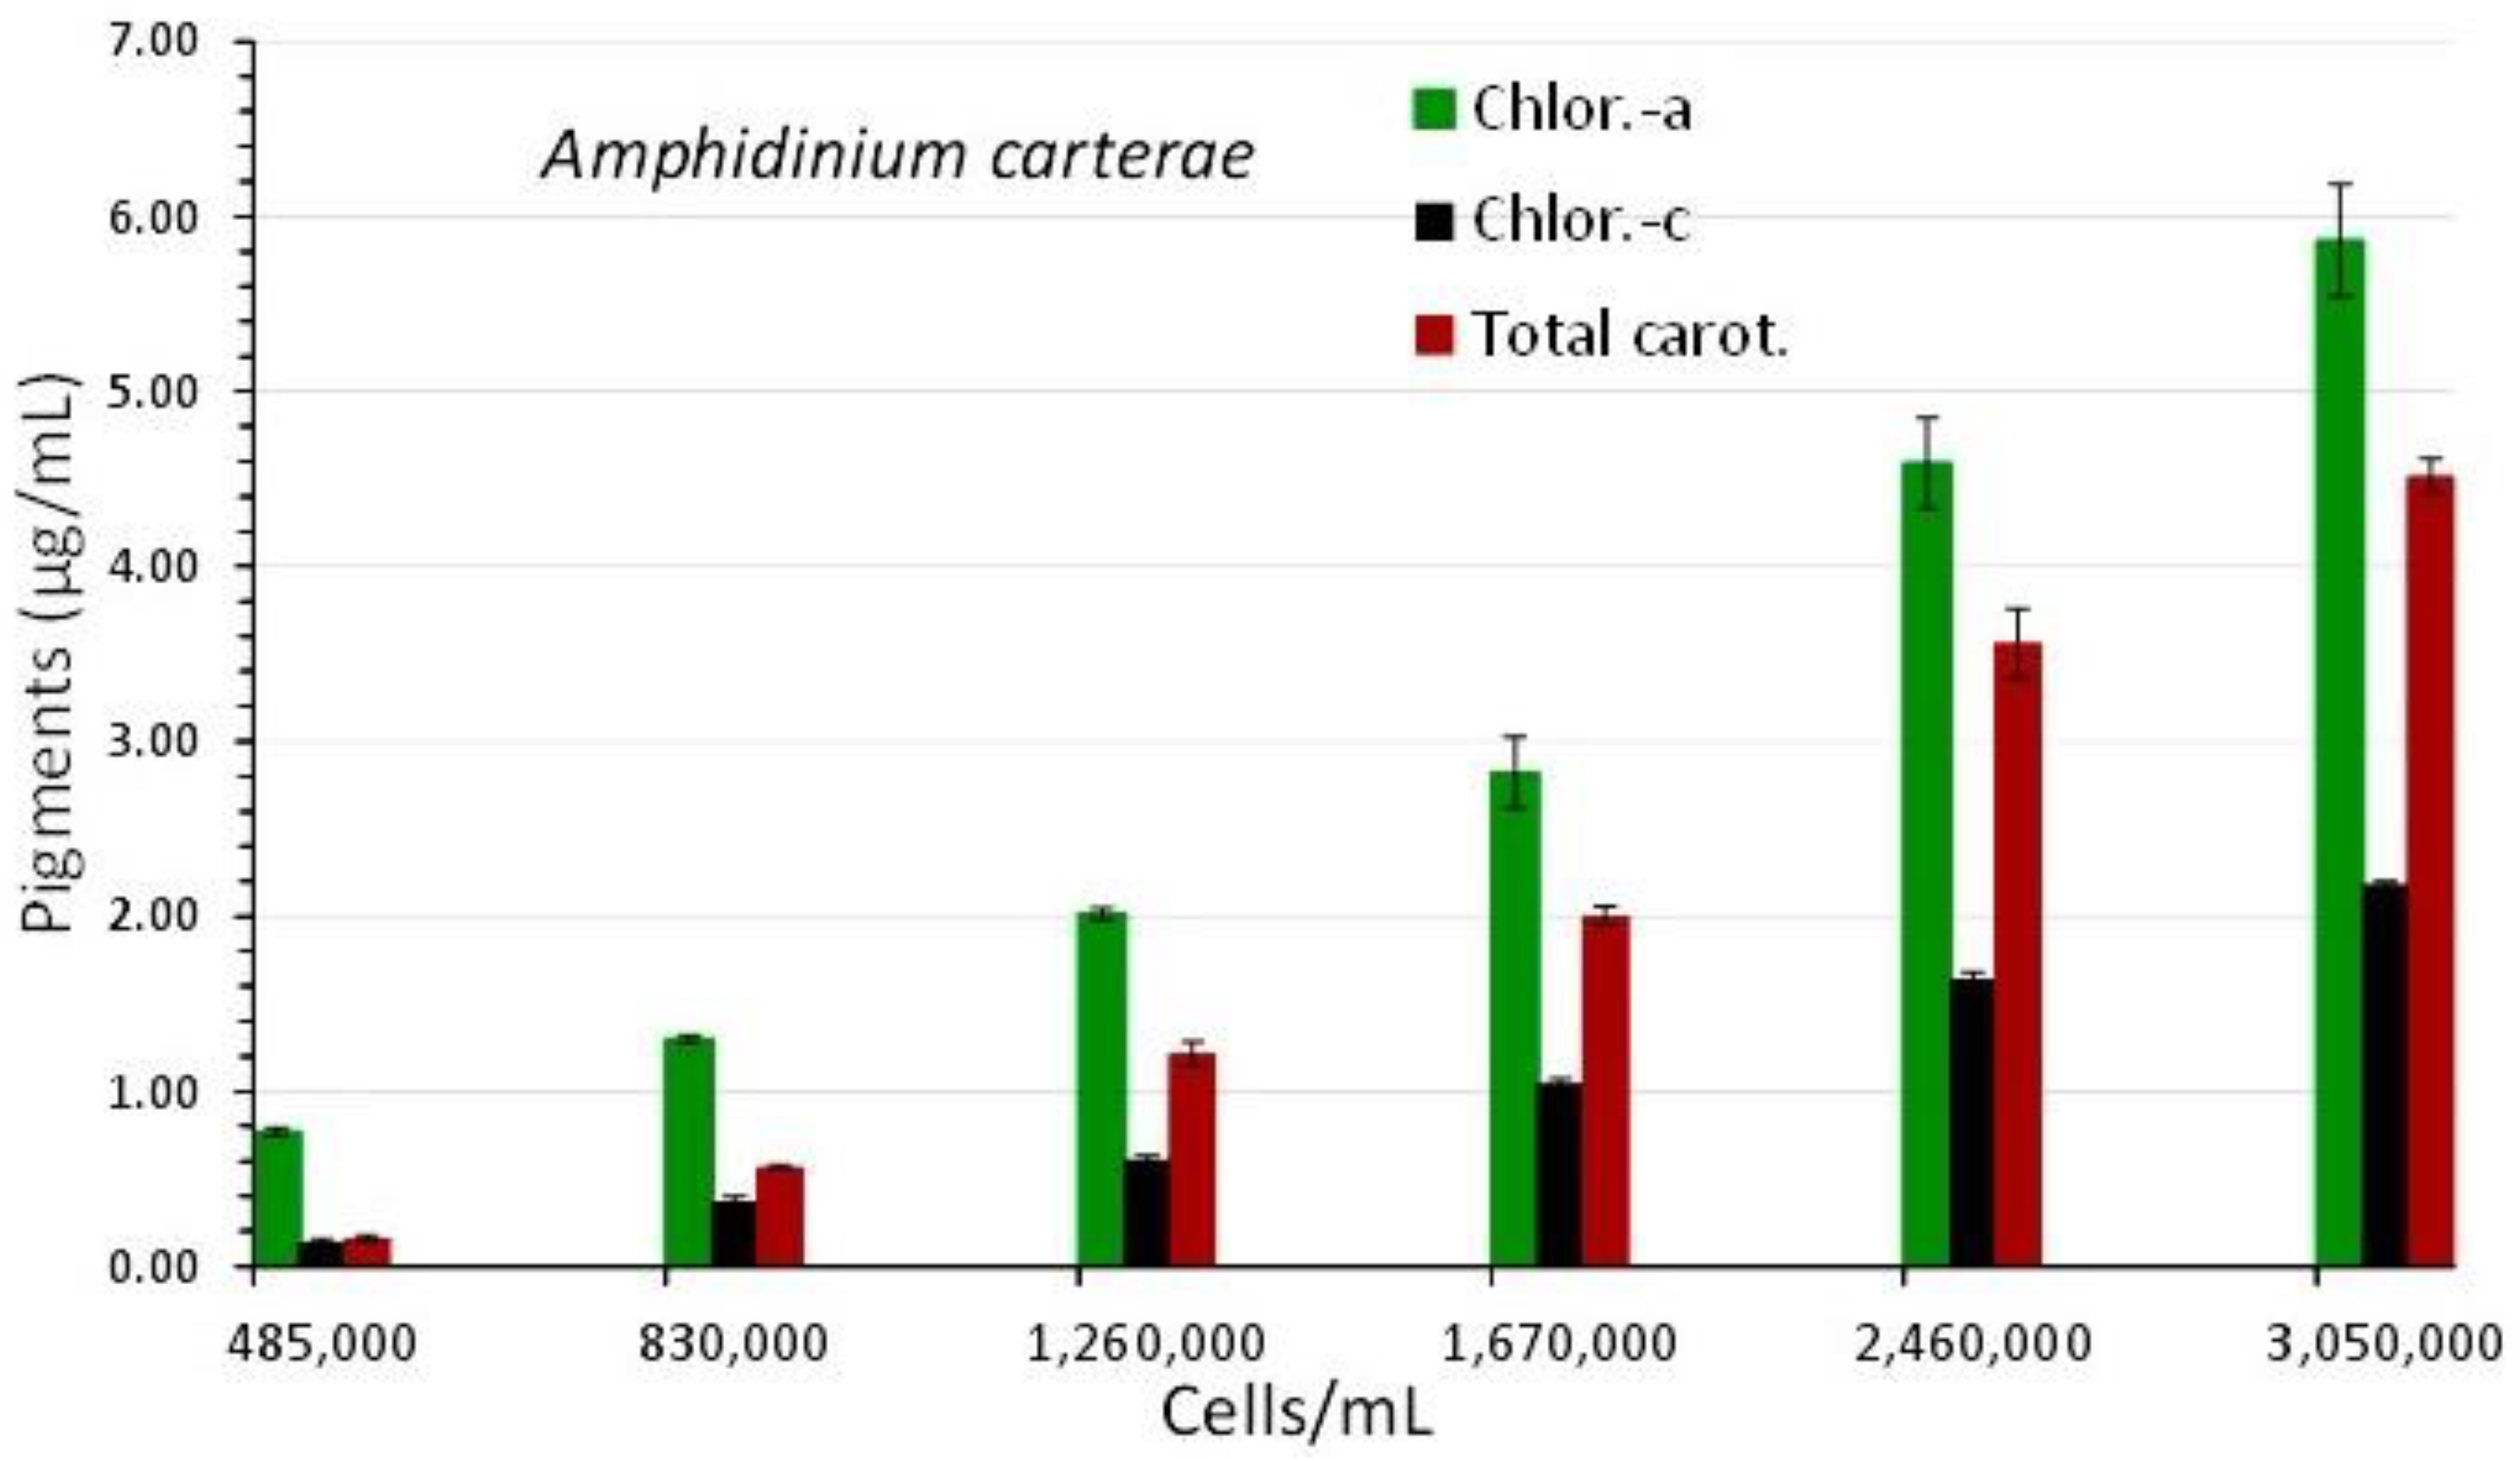
Figure 5.
Absorption spectra of Isochrysis galbana culture at different cell densities.
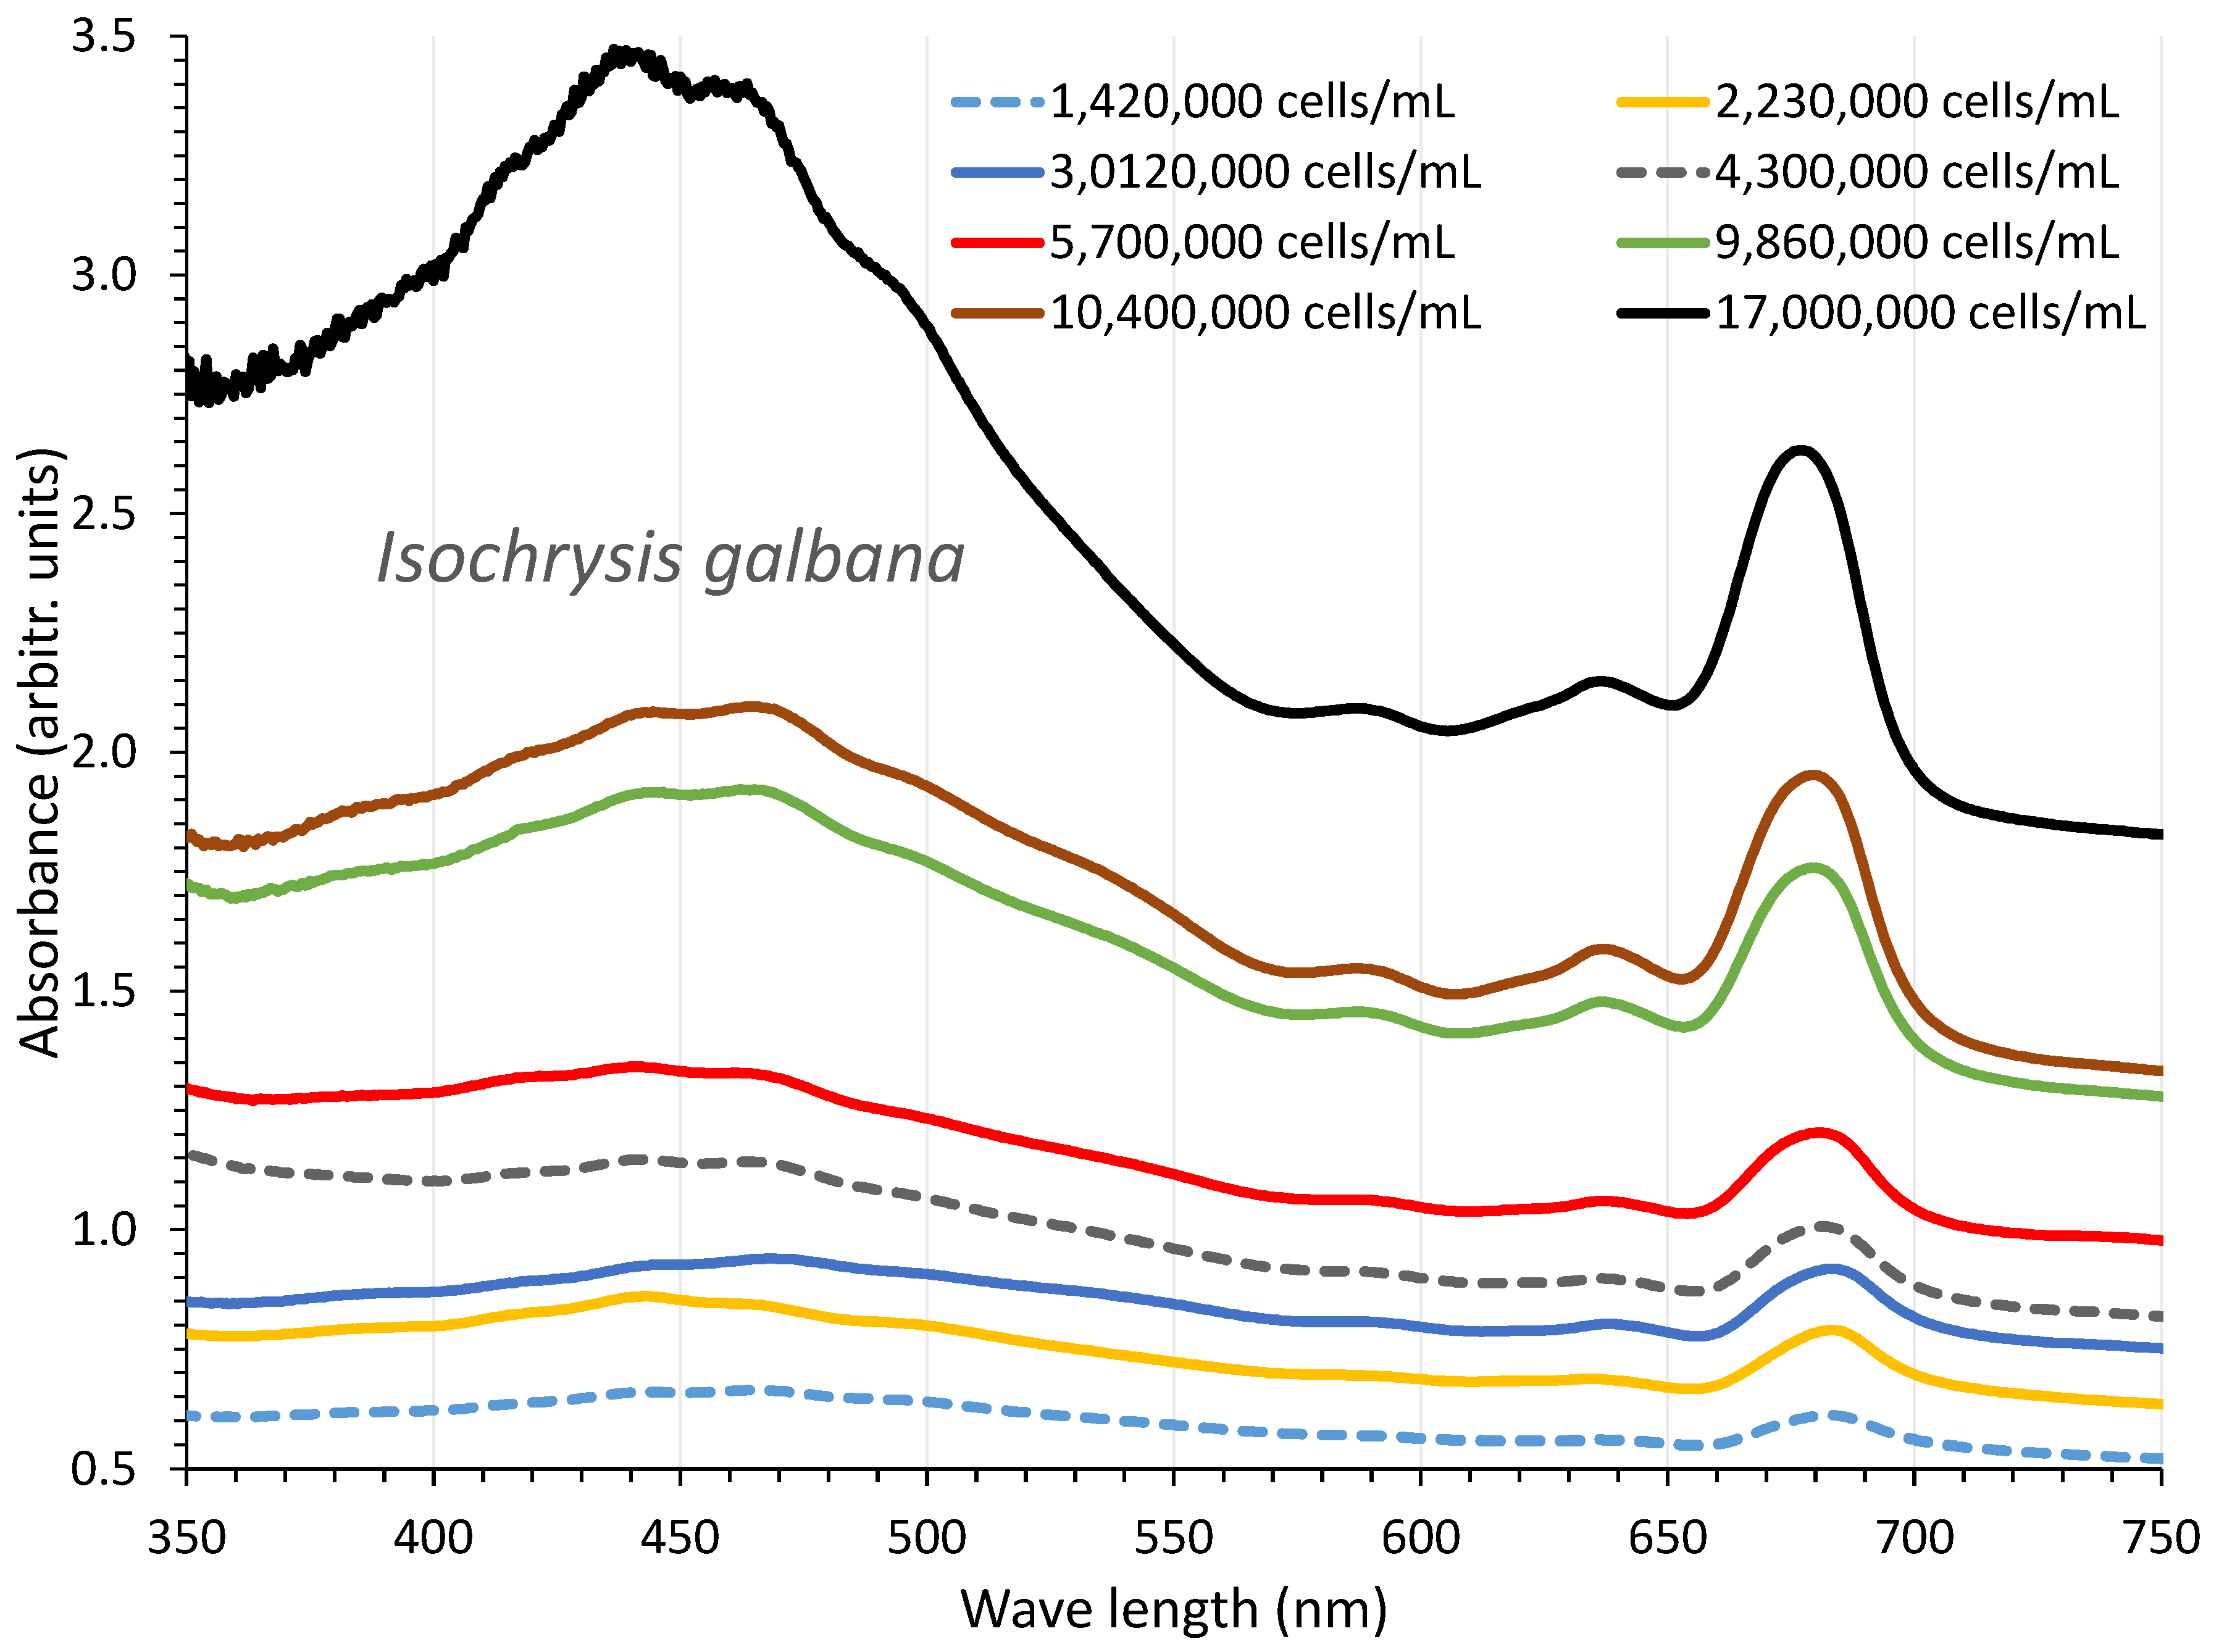
Figure 6.
Correlation of algal density (A) and pigment concentration (B) with absorption (Optical Density-OD) at 750 nm in Isochrysis galbana culture. Values are means of 3 replicates ± SD.
Figure 6.
Correlation of algal density (A) and pigment concentration (B) with absorption (Optical Density-OD) at 750 nm in Isochrysis galbana culture. Values are means of 3 replicates ± SD.
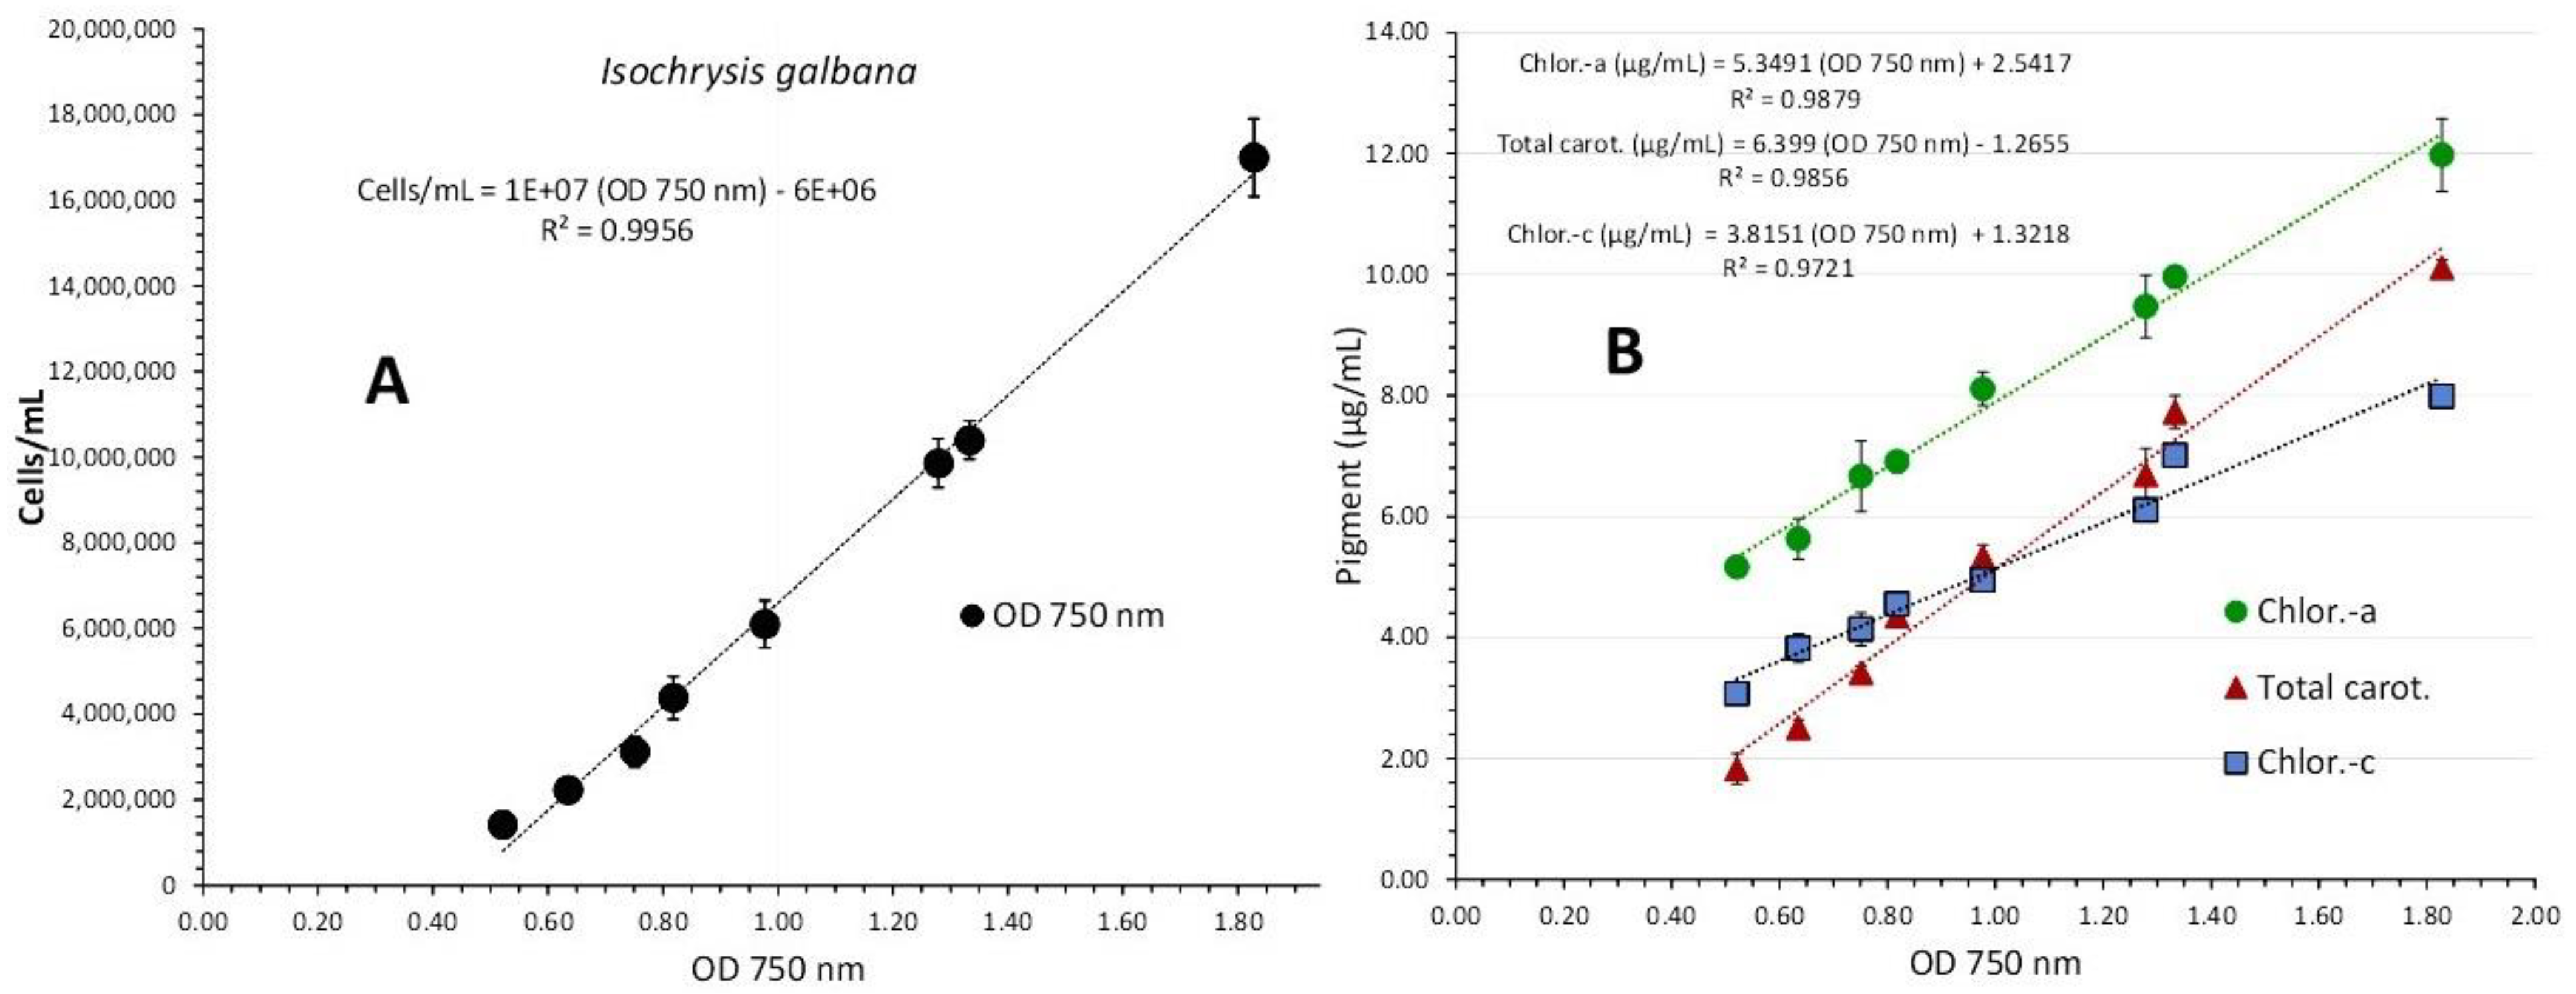
Figure 7.
Pigment content in μg/mL of Isochrysis galbana culture at different cell densities. Values are means of 3 replicates ± SE.
Figure 7.
Pigment content in μg/mL of Isochrysis galbana culture at different cell densities. Values are means of 3 replicates ± SE.
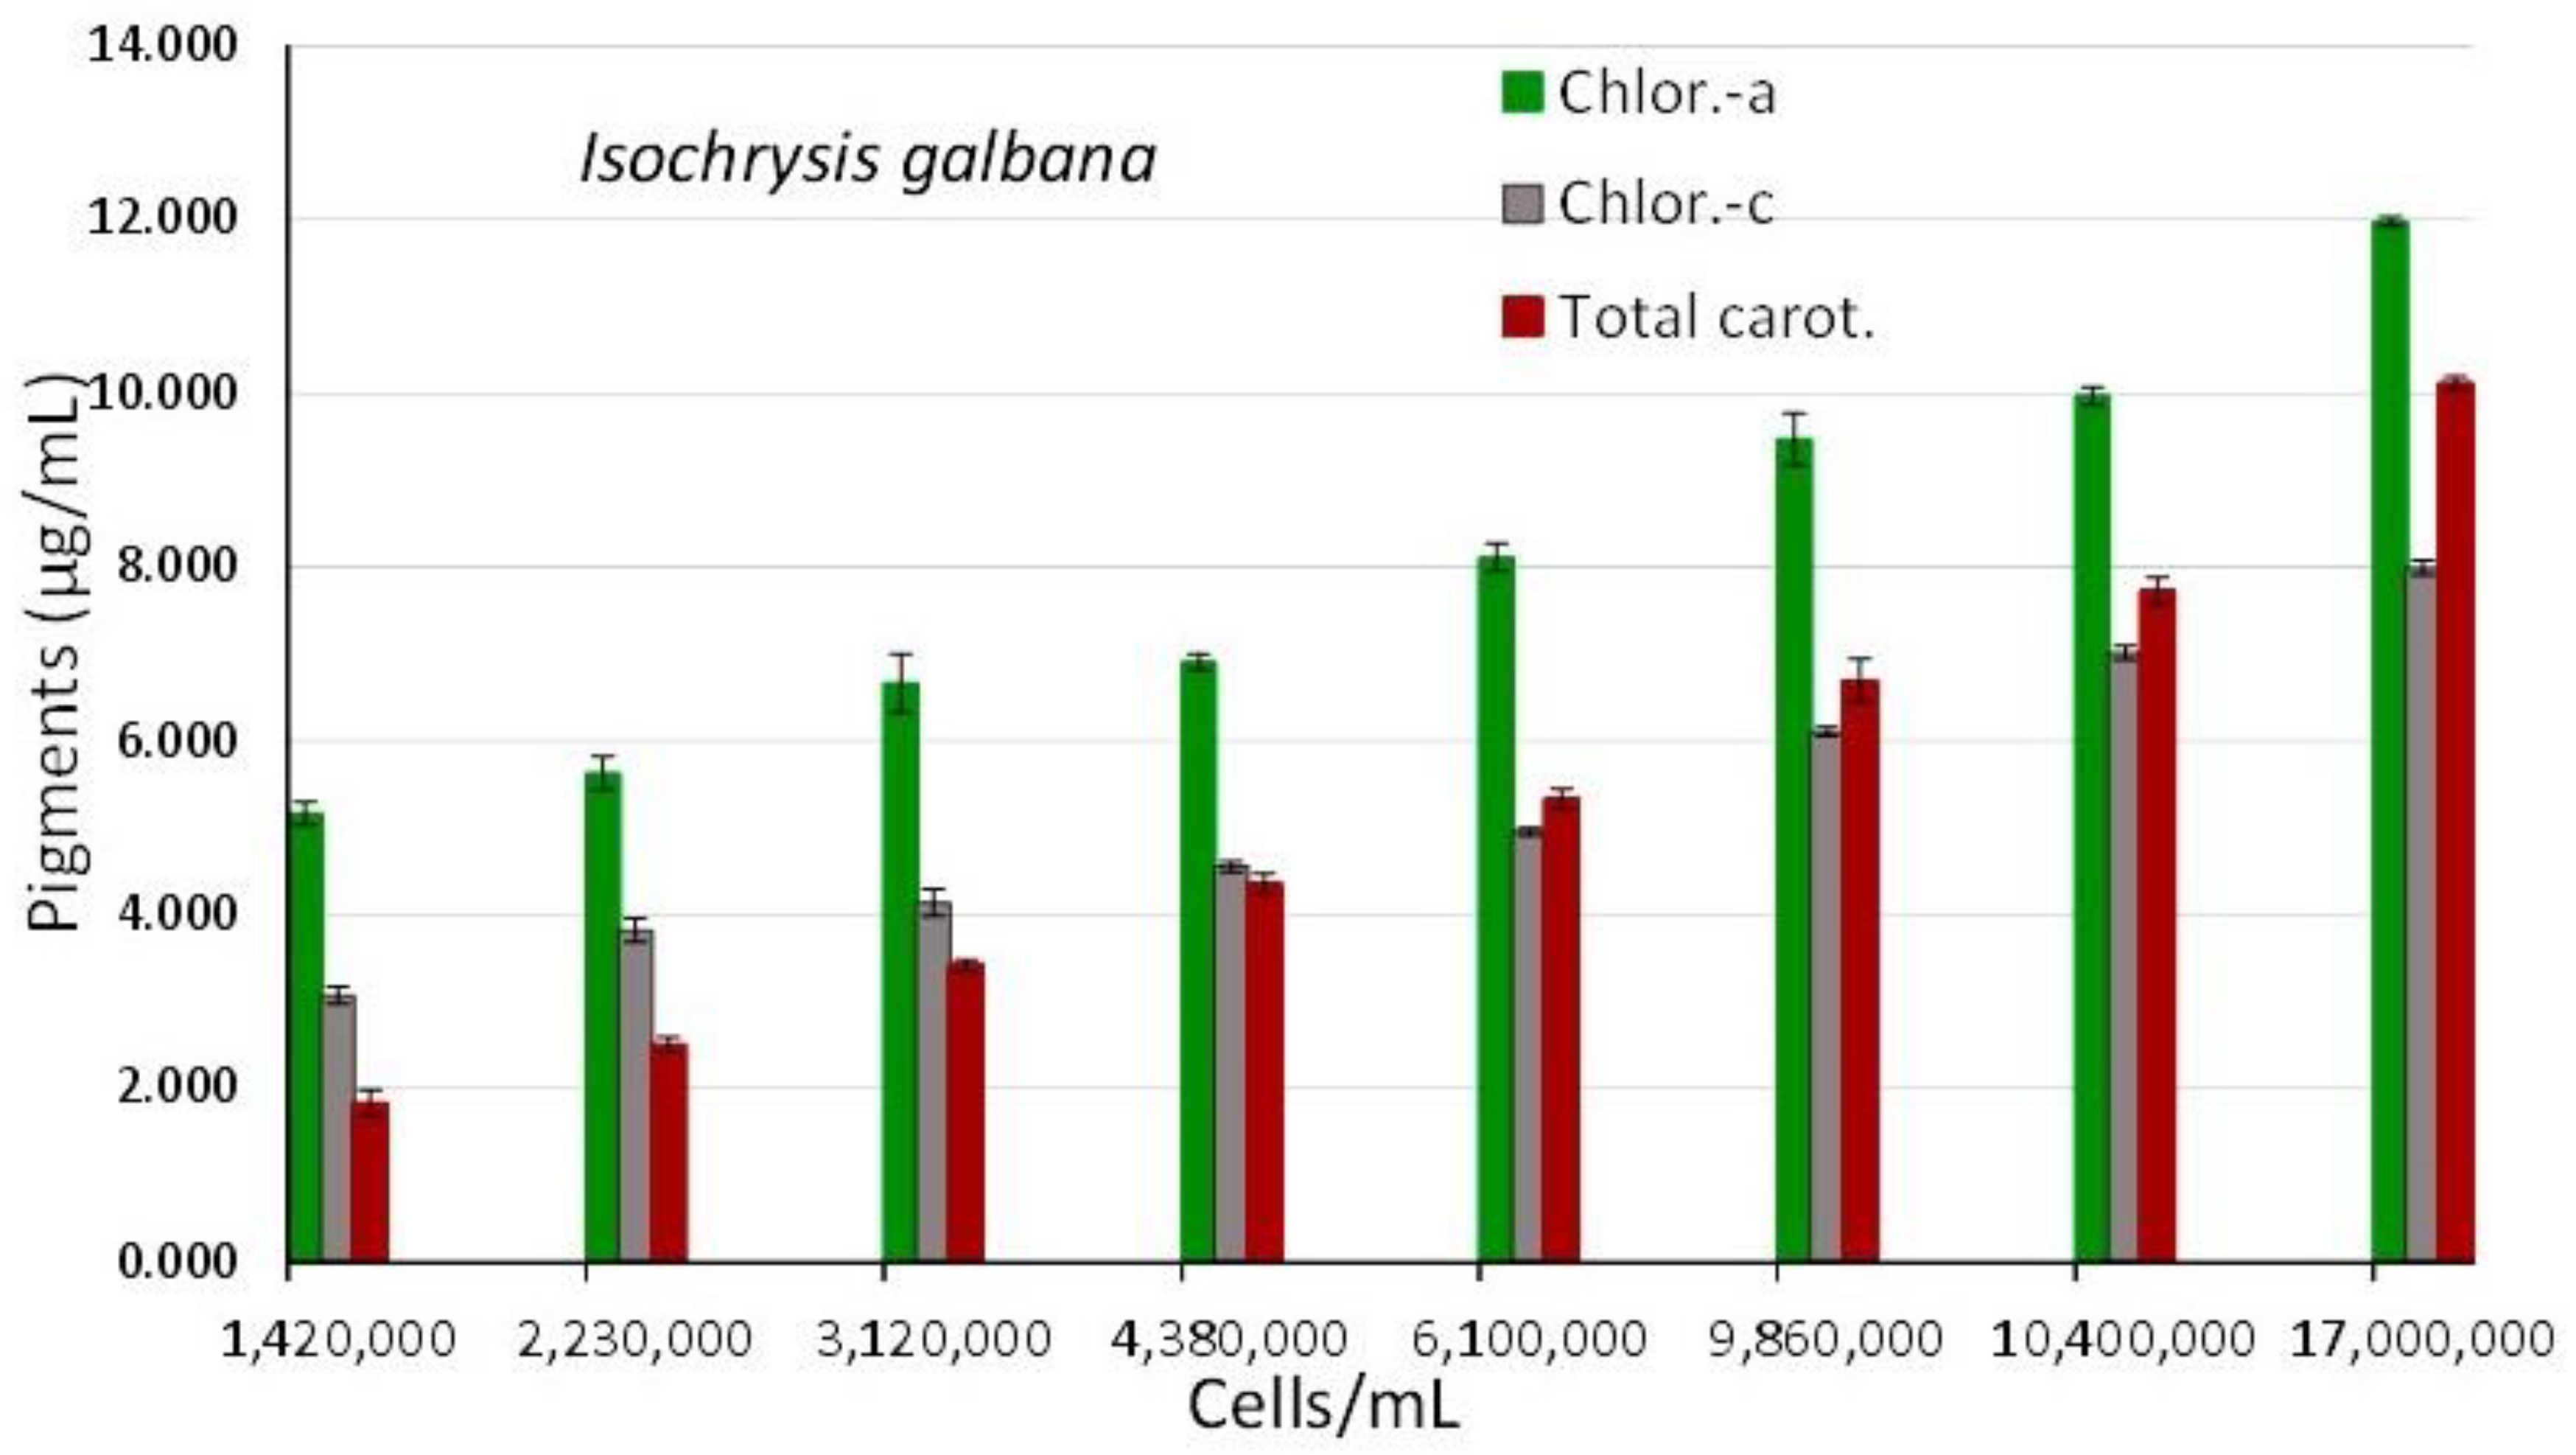
Figure 8.
Absorption spectra of Nephroselmis sp. culture at different cell densities.
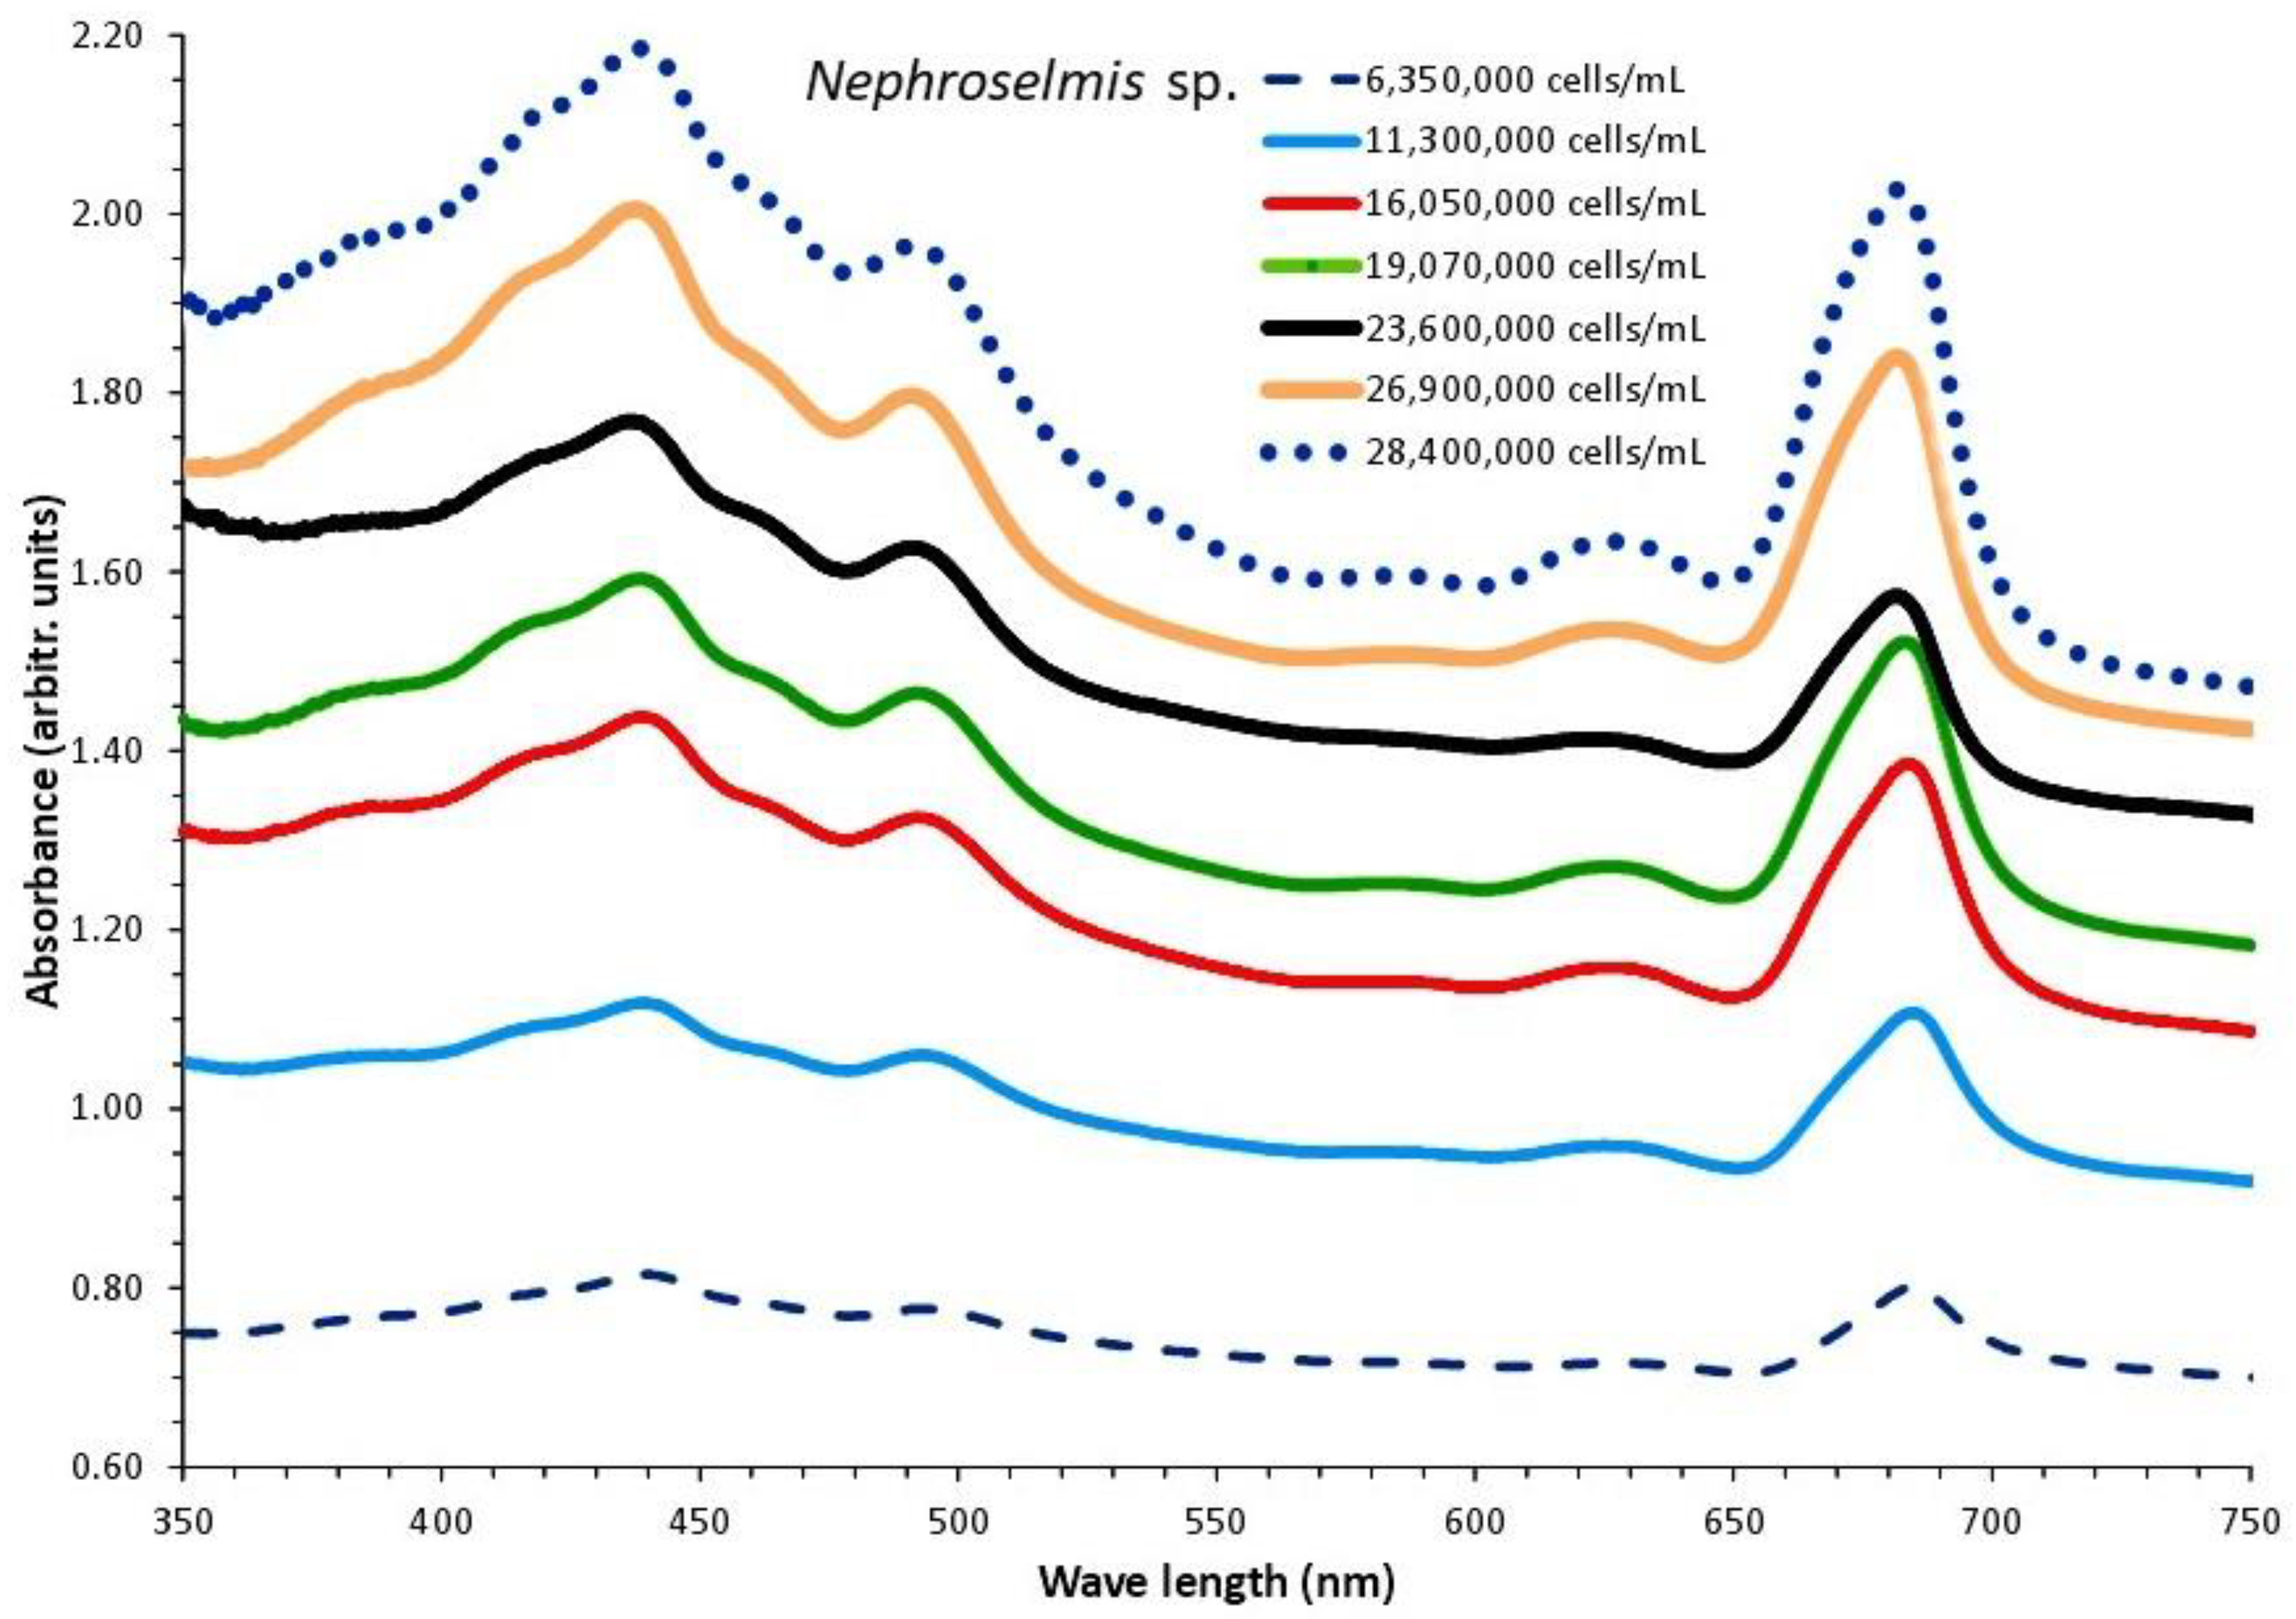
Figure 9.
Correlation of algal density (A) and pigment concentration (B) with absorption (Optical Density-OD) at 750 nm in Nephroselmis sp. culture. Values are means of 3 replicates ± SD.
Figure 9.
Correlation of algal density (A) and pigment concentration (B) with absorption (Optical Density-OD) at 750 nm in Nephroselmis sp. culture. Values are means of 3 replicates ± SD.
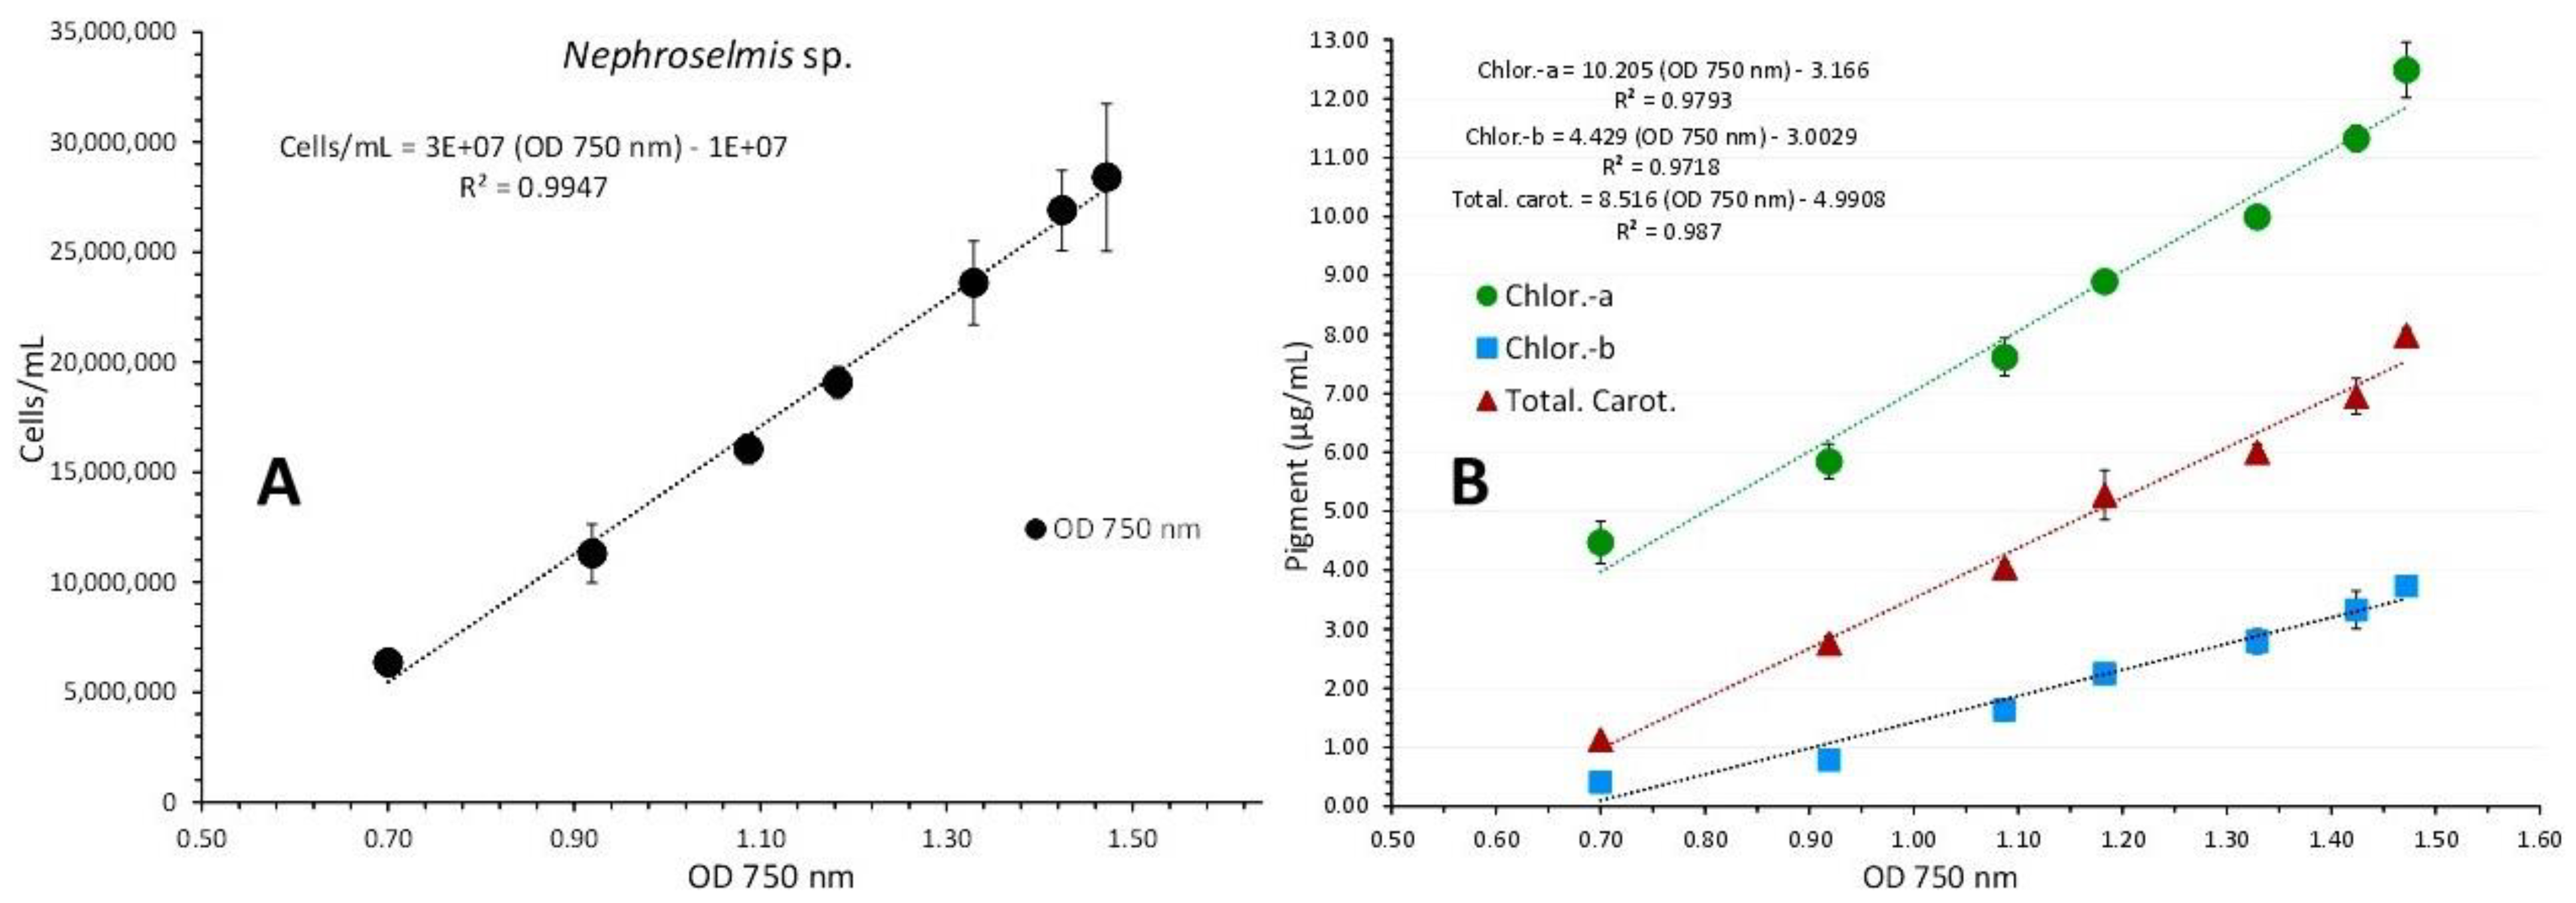
Figure 10.
Pigment content in μg/mL of Nephroselmis sp. culture at different cell densities. Values are means of 3 replicates ± SE.
Figure 10.
Pigment content in μg/mL of Nephroselmis sp. culture at different cell densities. Values are means of 3 replicates ± SE.
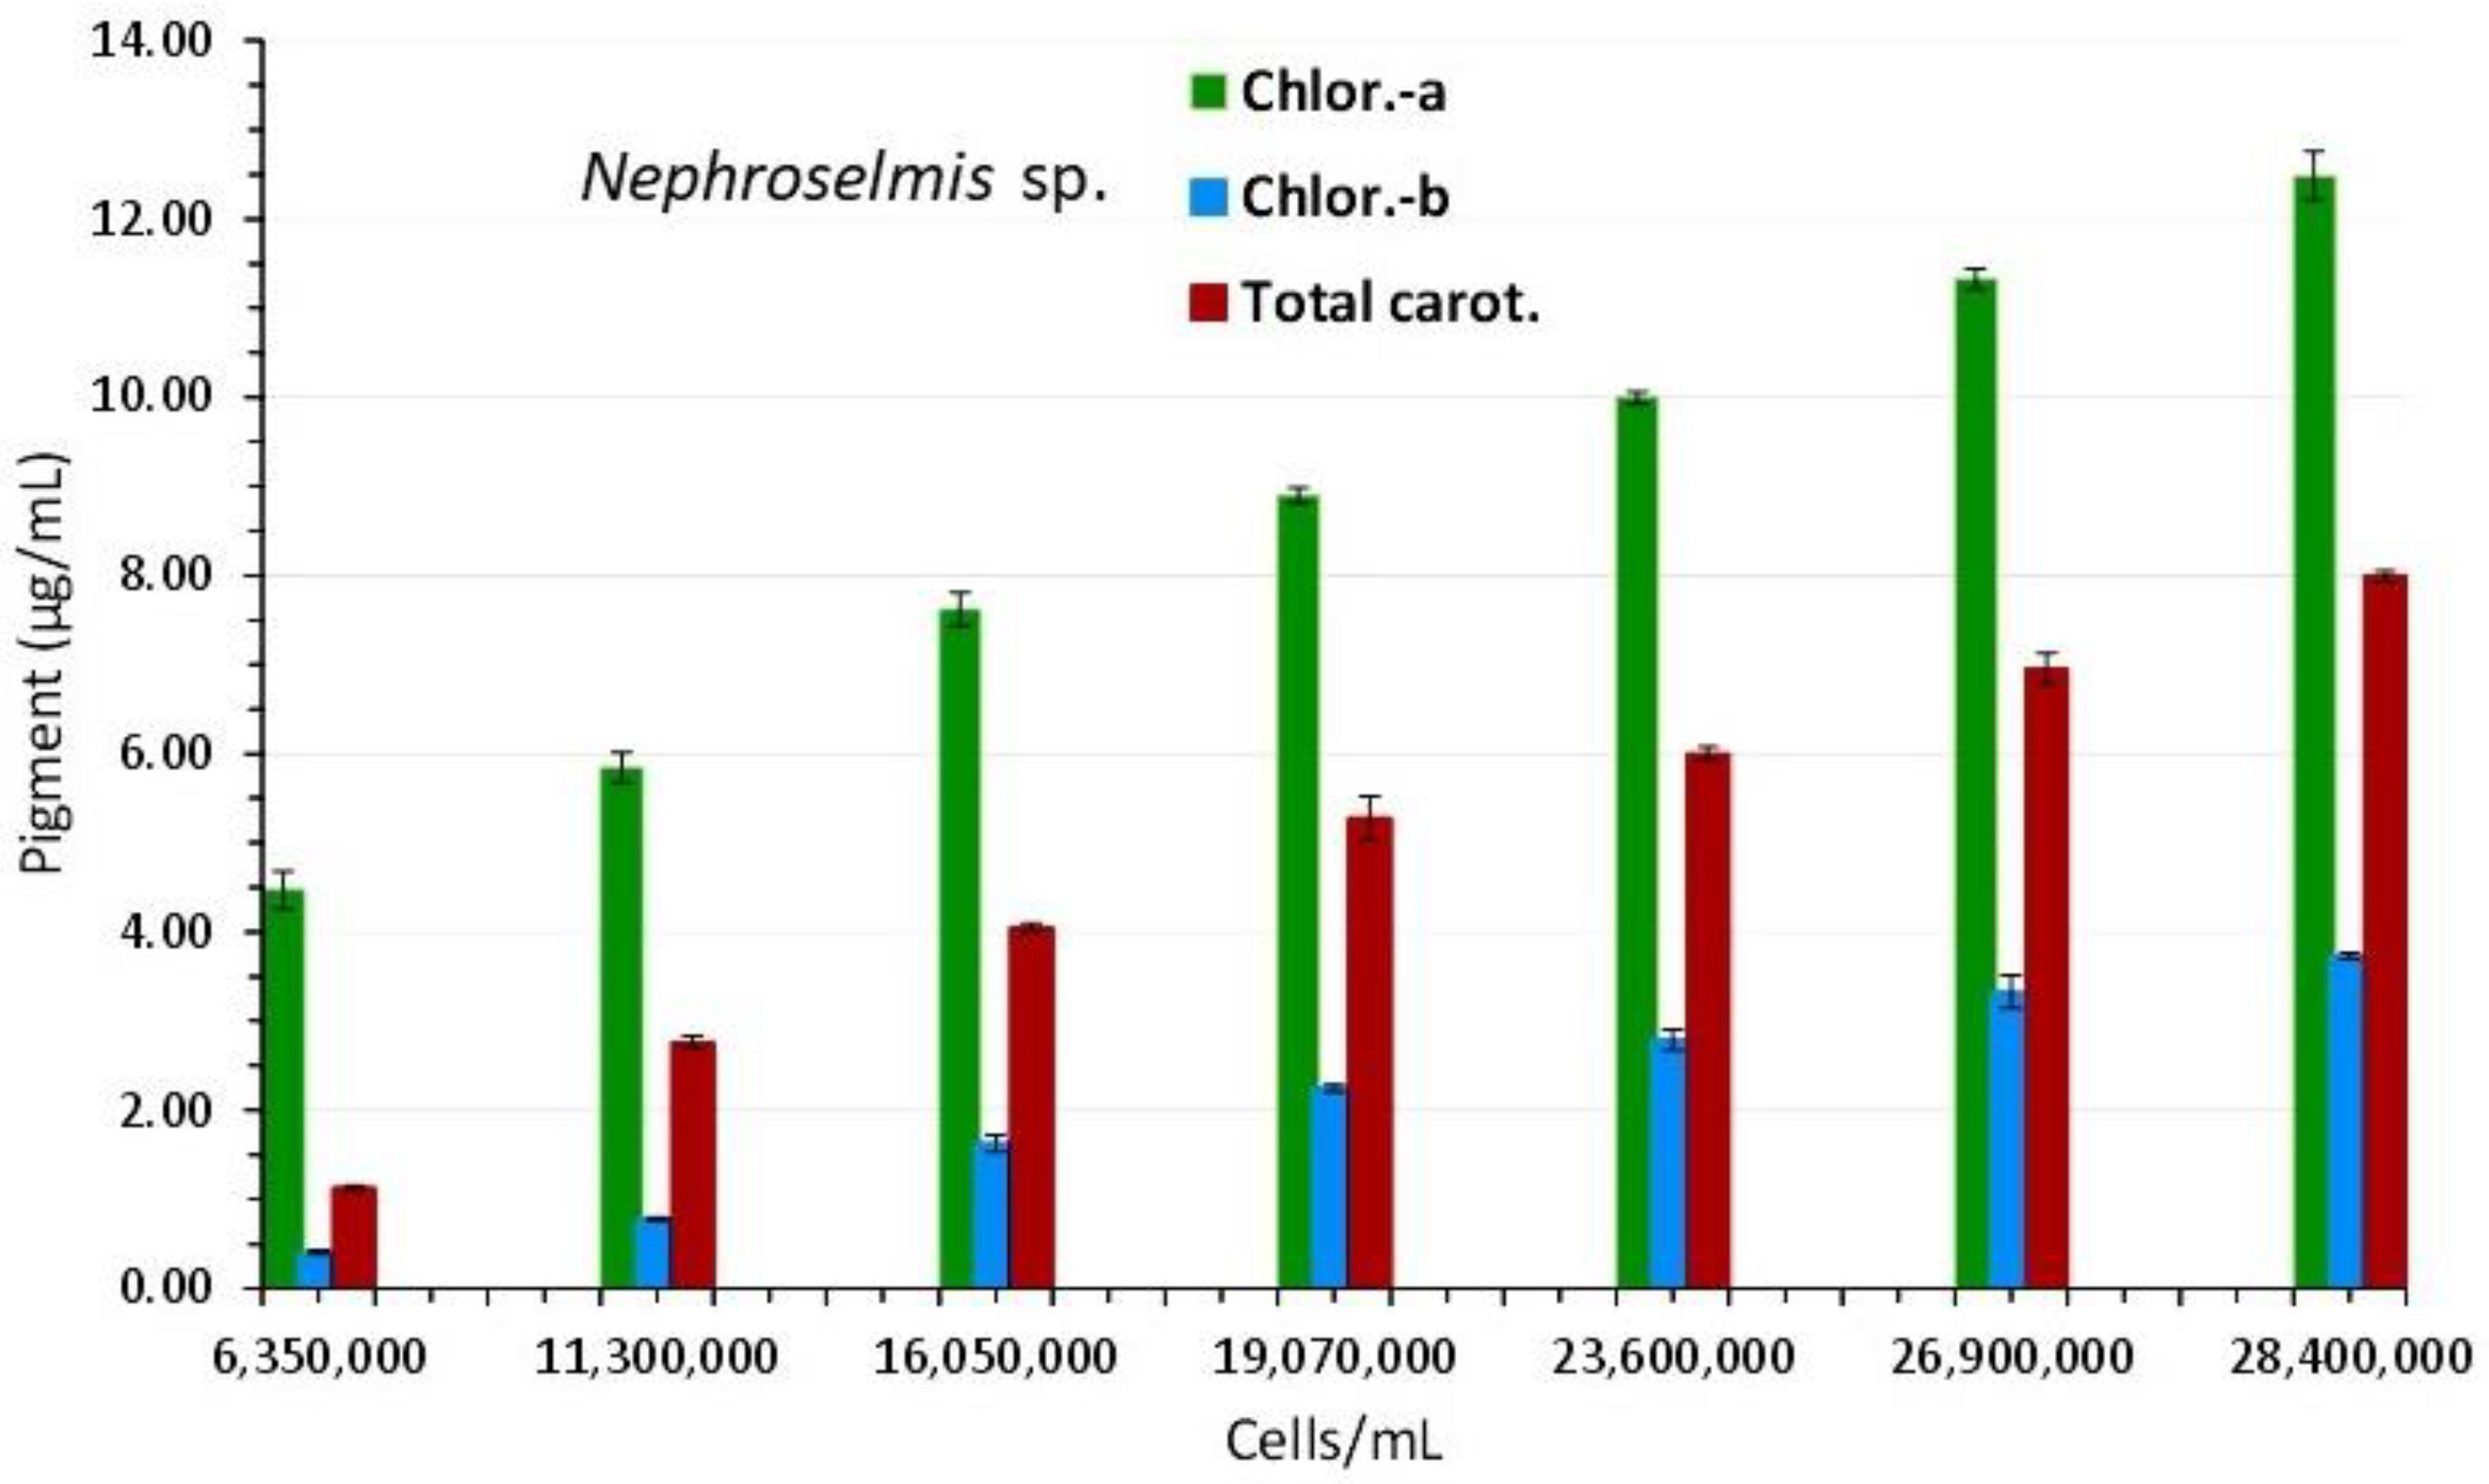
Figure 11.
Absorption spectra of Anabaena sp. culture at different dry weights and light intensities, A: 2000 lux (L), B: 8000 lux (XL).
Figure 11.
Absorption spectra of Anabaena sp. culture at different dry weights and light intensities, A: 2000 lux (L), B: 8000 lux (XL).
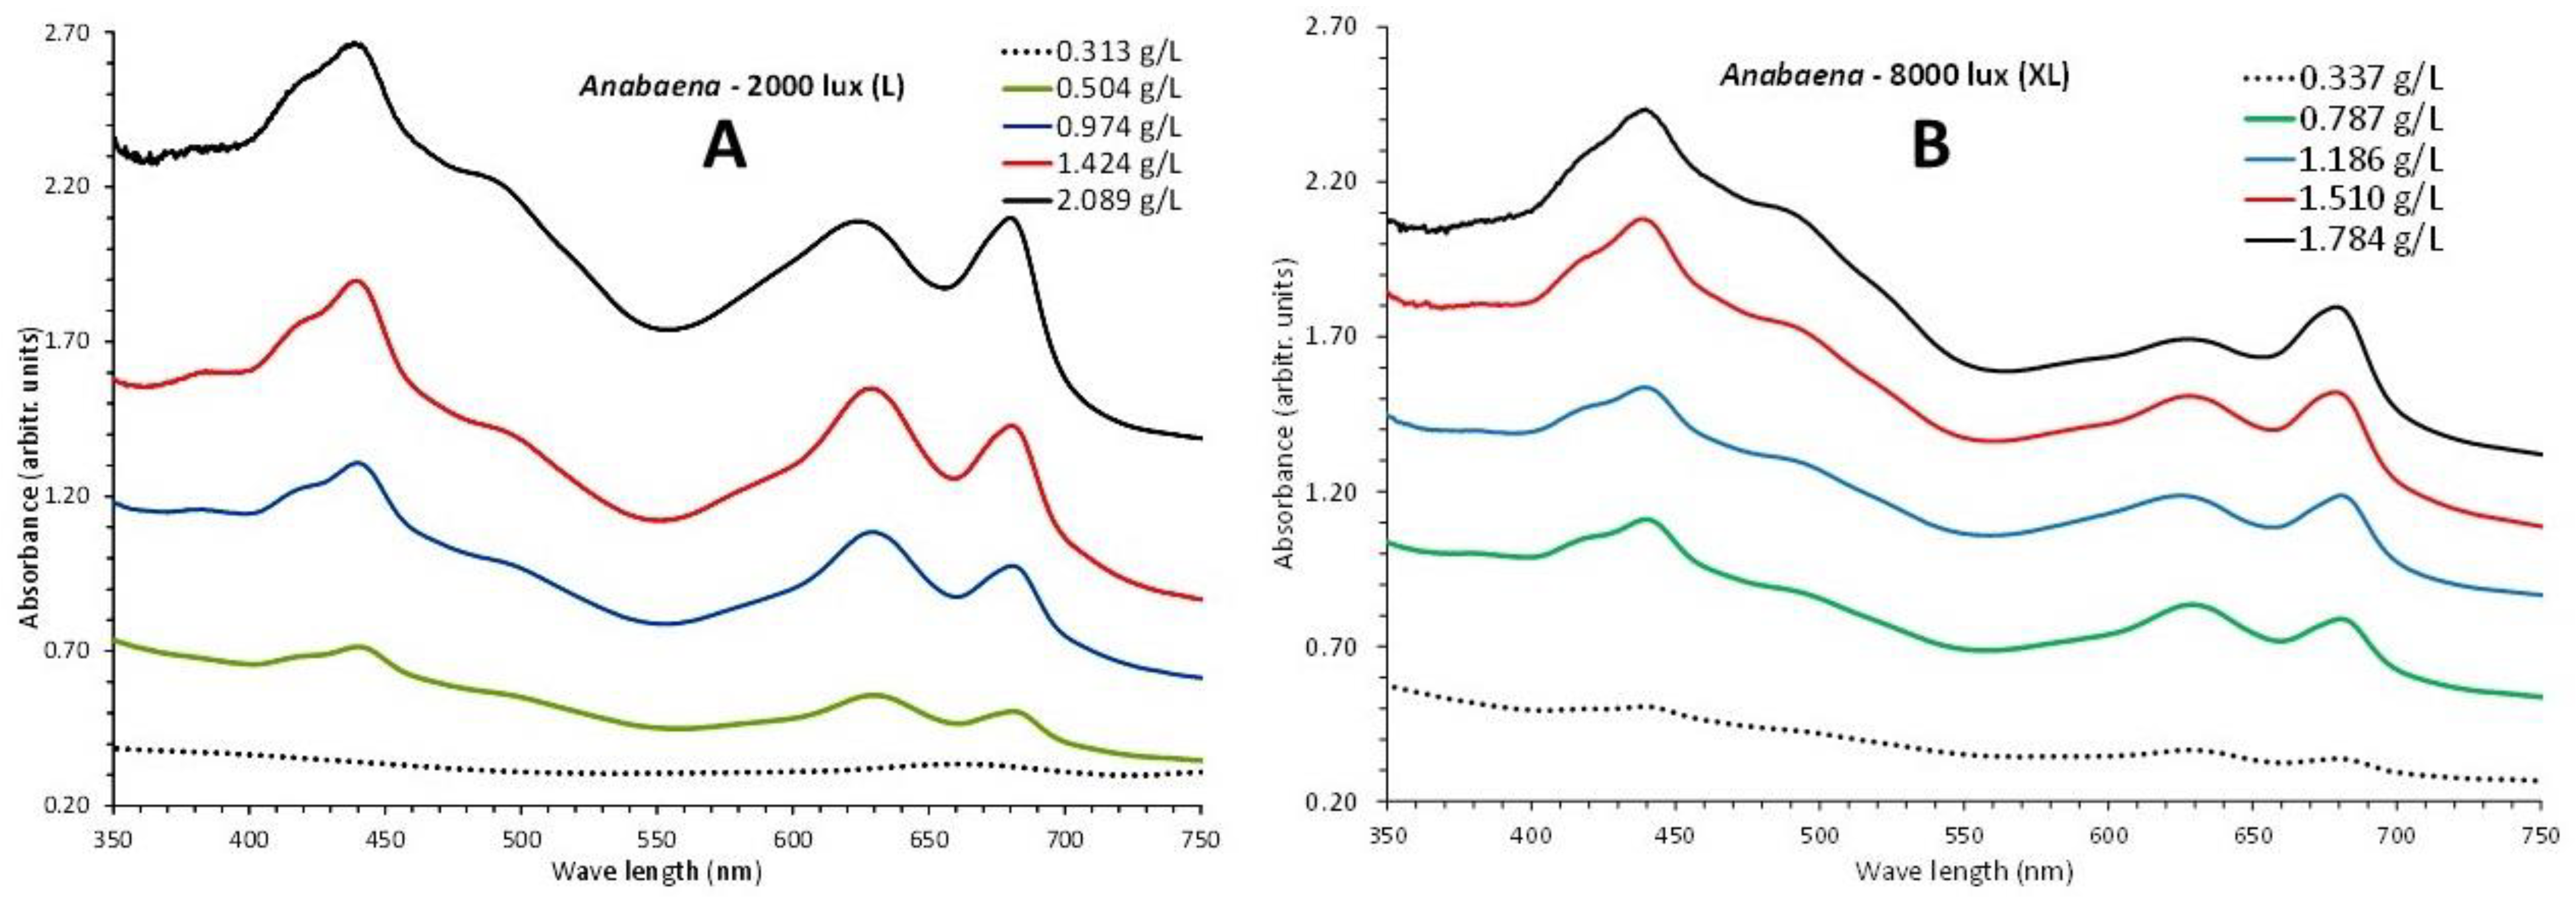
Figure 12.
Correlation of dry weight (A), chlorophyll-a and total carotenoids (B) and phycocyanin (C) under low (2000 lux-L) and high (8000 lux-XL) illumination, with absorption (Optical Density-OD) at 750 nm in Anabaena sp. culture. Values are means of 3 replicates ± SD.
Figure 12.
Correlation of dry weight (A), chlorophyll-a and total carotenoids (B) and phycocyanin (C) under low (2000 lux-L) and high (8000 lux-XL) illumination, with absorption (Optical Density-OD) at 750 nm in Anabaena sp. culture. Values are means of 3 replicates ± SD.
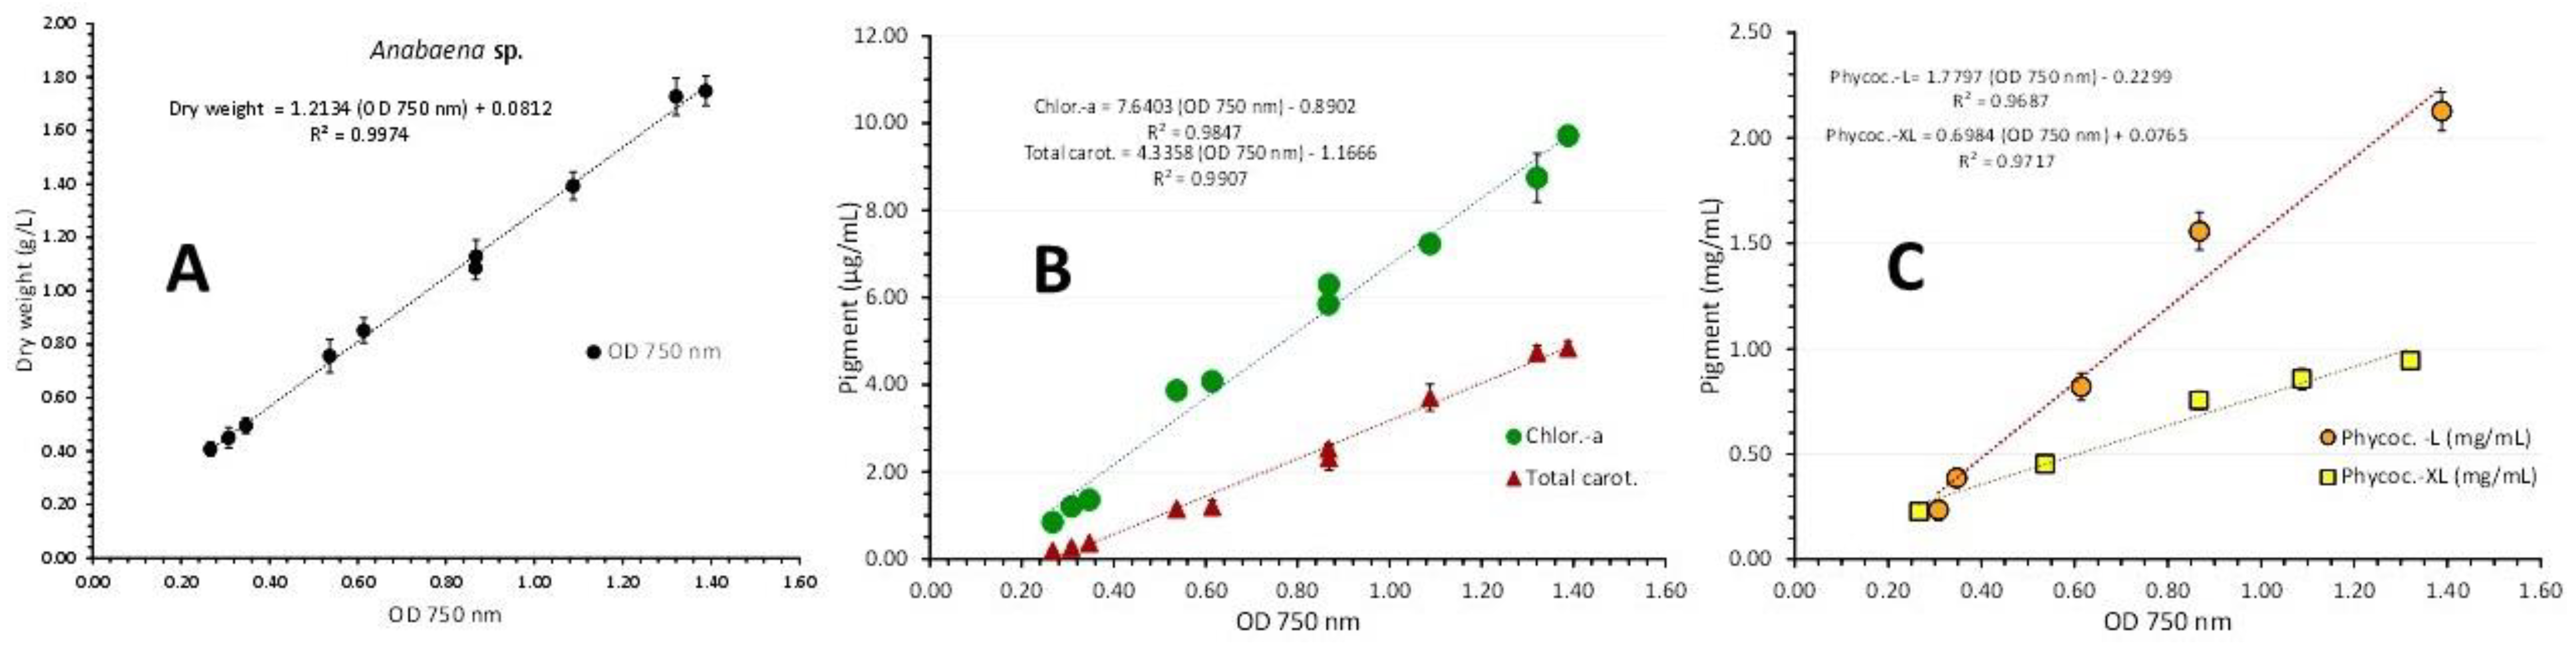
Figure 13.
Pigment content in μg/mL (chlorophylls, total carotenoids) or mg/mL (phycocyanin) and phycocyanin yield in mg/g d.w. of Anabaena sp. culture at different dry weights and light intensities, A: 2000 lux (L), B: 8000 lux (XL). Values are means of 3 replicates ± SE.
Figure 13.
Pigment content in μg/mL (chlorophylls, total carotenoids) or mg/mL (phycocyanin) and phycocyanin yield in mg/g d.w. of Anabaena sp. culture at different dry weights and light intensities, A: 2000 lux (L), B: 8000 lux (XL). Values are means of 3 replicates ± SE.
Disclaimer/Publisher’s Note: The statements, opinions and data contained in all publications are solely those of the individual author(s) and contributor(s) and not of MDPI and/or the editor(s). MDPI and/or the editor(s) disclaim responsibility for any injury to people or property resulting from any ideas, methods, instructions or products referred to in the content. |
© 2023 by the authors. Licensee MDPI, Basel, Switzerland. This article is an open access article distributed under the terms and conditions of the Creative Commons Attribution (CC BY) license (http://creativecommons.org/licenses/by/4.0/).
Copyright: This open access article is published under a Creative Commons CC BY 4.0 license, which permit the free download, distribution, and reuse, provided that the author and preprint are cited in any reuse.


