
Submitted:
10 July 2023
Posted:
10 July 2023
You are already at the latest version
Abstract
(1) Background: Microalgae cultures are greatly facilitated if growers can easily and economically ascertain the quantitative and qualitative status of the culture continuously with satisfactory ac-curacy. (2) Methods: The locally isolated microalgae Dunaliella sp. and Anabaena sp. were cultured in small volumes with 2 intensities of white light (2000 and 8000 lux) and with green, blue and red light and the increase of their biomass and pigments was studied. Pigment analyses, continuous recordings of absorption spectra and calibration curves were performed. (3) Results: The intensity of 8000 lux white light yielded the highest increase in biomass, chlorophylls and carotenoids in Dunaliella sp. while 2000 lux and green light caused the greatest increase in biomass and phy-cocyanin in Anabaena sp. From the examination of the absorption spectra, the evolution of the pigment content can be estimated and both pigments and biomass are correlated very satisfactorily with the wavelength of 750 nm. (4) Conclusions: The use of absorption spectra as an easy, fast and economical method can be a useful tool for a good approximation of the state of the microalgae culture. This is clearly shown when the spectra of the culture under different lighting colors are compared which have a catalytic effect on the level of the pigments leading to the increase in carotenoids and phycocyanin of the green light.
Keywords:
Microalgae culture
; Pigments
; Absorption spectrum
; Dunaliella
; Anabaena
1. Introduction
Microalgae are now a widespread and rapidly growing branch of primary production, as they offer many and important advantages in terms of biomass production [1,2,3,4]. From an ecological point of view, they can contribute significantly to curbing anthropogenic carbon emissions, becoming a useful tool in the arsenal of climate change mitigation [5,6]. In particular, cultivation of marine species compares favorably with both freshwater species and grass crops, both because valuable irrigation resources are not lost and because it is possible to use coastal or degraded saline soils for cultivation [7]. In many countries of the world, the cultivation of marine microalgae serves productive purposes in a wide range of applications, from live food in fish hatcheries, feed production, biofuel production, soil remediation and fertilization, water decontamination, chemical production, pharmaceutical and cosmetic substances, to direct human consumption and the production of valuable antioxidant pigments [8,9,10,11,12].
In particular, for these pigments that make up the photosynthetic machinery of algae (chlorophylls, carotenoids, phycobiliproteins), a thriving industry has developed, producing ever-increasing quantities of pigments that have been shown to have beneficial effects on human health [13,14,15]. For example, the carotenes and xanthophylls found in all microalgae (eukaryotes and cyanobacteria), as well as the phycocyanin of cyanobacteria, have potent antioxidant and possibly anticancer effects [16]. The content of photosynthetic units of cells in relation to their pigment composition differs between different species of microalgae and for this reason breeders have selected certain species known to overproduce some of them [15]. Well-known cases are the species of the genus Dunaliella for the production of β-carotene [17,18] and Arthrospira (Spirulina) for phycocyanin [19,20].
However, even for species selected for cultivation, there is much scope for optimizing and maximizing their pigment content, depending on how some critical conditions for cultivation are modified. Much work has examined the effects of conditions (temperature, salinity, pH, nutrients, light) on the growth rate of the culture, the amount of phyco-mass produced, and the change in cellular constituents in various microalgae. If the goal of cultivation is to maximize production of either the final biomass or selected constituents, or (what makes most sense) to achieve the ideal combination of both, this should be done simultaneously at the lowest possible cost and, of course, under the desired growth conditions. Undoubtedly, according to many researchers, the quantity and quality of light have a catalytic effect on this process. The intensity of white light has the greatest influence on cell growth and pigment content [21]. Too low an intensity results in a slow increase, while too high an intensity has an inhibitory effect. At the same time, the content of cells in terms of the proportions of photosynthetic pigments changes drastically depending on the intensity of illumination. In addition to light intensity, color has also been found to have a catalytic effect, especially in the synthesis of the pigments of the photosynthetic apparatus of microalgae [22]. More and more studies are focusing on the effect of colored light on changing photosynthetic pigment ratios. Therefore, a production scheme with a suitable arrangement of white and colored light is of utmost importance to produce the maximum algal biomass with the maximum yield of desired pigments in the shortest time and with the lowest financial cost. In this sense, any monitoring technique that allows growers to assess the condition of the developing phyco-culture can be a useful tool with predictive value. The absorbance spectrum of a live culture sample can provide valuable information about both the density of the culture and the pigments it contains. However, in the literature, the absorption spectrum has received little attention for this purpose, whereas in reality and under production conditions, it can provide valuable information about the current condition of the culture in a simple and inexpensive way, if not with the precision required for laboratory analysis, at least with an approach that meets the general needs of the grower who wants to know what condition his culture is in. In the present work we try to combine the evaluation of the use of the absorption spectrum as a predictive tool for the density of the culture and the content of the cell in photosynthetic pigments and at the same time to study the effect of the intensity and color of the light on the increase of the biomass and of cellular pigment composition. For this purpose, locally isolated marine microalgae [23,24], the chlorophyte Dunaliella sp. and the filamentous cyanobacterium Anabaena sp., were chosen for the experiments. Because these species are either established species in algae cultures (Dunaliella), or species with promising cultivation potential (Anabaena) in the way the well-known cyanobacterium Spirulina is cultivated [25], I attempt in the present work to study their absorption spectra in the various lighting conditions in order to give growers a quick and efficient way to assess crop condition and predict pigment content with reasonable accuracy.
2. Materials and Methods
The chlorophyte Dunaliella sp., and the cyanobacterium Anabaena sp. were the marine microalgae species utilized. Both species were isolated during a survey in the lagoonal waters of Messolonghi in Western Greece (38°20′05.16′′ N, 21°25′28.51′′ E) and were maintained as monocultures in the lab. According to an experimentation protocol, all were batch-cultured indoors (Figure 1) in air-conditioned room at 19–20 oC, at salinity of 35 ppt, and at white light intensities of 2000 and 8000 lux. The Anabaena culture vessels consisted of 1.5 L inverted plastic bottles and for Dunaliella 1-L conical glass Erlenmeyer flasks were used, filled to the 1L mark with previously sterilized sea water enriched with Walne’s medium. The three final stock solutions A, B, and C that make up Walne's medium formula were each used at a ratio of 1 mL per liter of culture water. For essential nutrients N, P, and K, 300 grams of NaNO3, 20 grams of NH4Cl, and 30 grams of KH2PO4 (Merck, Germany) were diluted in 1 liter of distilled water to create solution A. ZnSO4.H2O (30 g), CuSO4.5H2O (25 g), CoSO4.7H2O (30 g), and MnSO4.H2O (20 g) are trace elements (Merck, Germany) dissolved in 1 L of distilled water to make solution B. Solution C contains 100 mg of vitamin B12, 100 mg of biotin and 10 mg of thiamine (Merck, Germany) diluted in 1 L of distilled water.
White light emitted by a series of 20 watt 1600 lm LED lamps was used. Intensities of 40 and 160 μmol photons/m2/s (2000 and 8000 lux, respectively) were obtained by placing the vessels at the correct distance from the lamps. Intensity was measured at the center of the outer surface of the vessels using a luminometer (BIOBLOCK LX -101, Panasonic). The illumination period of 16hL:8hD was controlled by an electric timer that switched the lamps on and off accordingly. For the experimentation using colored light, the vessels were covered with different color filter wrappers (green, blue and red) and placed at the appropriate distance of white LED light receiving 8000 lux. Cultures were maintained in suspension by injecting air (with its natural CO2 content) through 2-mL glass pipettes (one in each vessel) at a rate of half the culture volume per minute. The pipettes were connected via sterilized plastic tubing to the 0.45 μm filtered central air supply system, which was fed by a blower.
Daily cell counts using a Fuchs-Rosenthal hematocytometer for unicellular species and drying and weighing a sample of the filamentous cyanobacteria filtrate every 2-4 days were used to record algal growth, which was measured either as cells/mL for unicellular microalgae or as dry weight (g/L) for the filamentous cyanobacterium. Simultaneously, optical density was recorded at 750 nm in the spectrophotometer (for all species). Dry weight was calculated by filtering a known amount of culture through 0.45 μm GF/C filters in a vacuum pump (Heto-SUE-3Q). The filters were next washed with ammonium formate for removing salts and then placed in an oven at 100 °C for 2 h.
Untreated culture samples were used to measure the absorbance spectra of the cultures at different stages of maturation. The spectra were recorded in a Shimadzu UV-1800 (Kyoto, Japan) spectrophotometer and the data were transformed using its UVprobe 3.2 software.3.
Chlorophyll-a and total carotenoids in the case of the cyanobacteria. were extracted with absolute methanol from centrifuged culture samples, and their concentrations (μg/mL) were determined spectrophotometrically in a Shimadzu Uvmini-1240 UV-visible (Kyoto, Japan) spectrophotometer using the following equations:
where: (A) stands for the absorbance (or optical density-OD) of the processed sample at the indicated wave length.
chl-a =12.9447 (A665-A720)
In the case of the chlorophyte Dunaliella sp. chlorophyll-a, chlorophyll-b, and total carotenoids were extracted with DMSO from centrifuged culture samples, and their concentrations (μg/mL) were calculated spectrophotometrically using the following equations
chl-a = 12.47(A665)−3,62(A649)
chl-b = 25.06(A649)−6.5(A665)
The estimation of β-carotene was done according to [26]. Briefly, 1 mL of algal cells were harvested, centrifuged for 10 min at 3000 rpm to remove the pellet, and then 3 mL of a hexane/ethanol (1:2) mixture was added to the vortex. After that, the mixture was centrifuged at 3000 rpm for 10 minutes. After two phases had formed, the upper phase which contained the β-carotene was collected and its optical densities at 450 nm was assessed The following formula was used to determine the concentration of β-carotene as μg/mL:
β-carotene (μg/mL) = 25 x A450
By freezing (-20 oC) for 24 hours a concentrated known amount of cyanobacterial culture in 0.1 M sodium phosphate buffer (pH 7.1) as solvent at a ratio of 1:10 (algal mass: solvent), and then thawing at 4 oC in the dark, the phytocyanin (PC) content was extracted. Over the course of two days, the process of freezing and thawing was repeated. The slurry of the sample was then centrifuged at 3000 rpm for 5 minutes to determine the concentration of phycocyanin (PC, measured in mg/mL) in the supernatant using spectrophotometry and the equation:
From the above equation the yield in phycocyanin (PC) in mg PC/g dry weight was calculated using the equation:
where: PCyield = mg of phycocyanin per g algal dry weight
V = volume of solvent used (mL)
D.W. = grams of dry weight of the algal mass used
Using the free PAST3 program, the various variables were statistically treated using ANOVA and Tukey's test for comparison of means at the 0.05 level of significance. Statistical calculations of regression lines, Pearson’s correlation coefficient, standard deviation (SD) and standard error (SE) were made with Excel software (Microsoft, USA).
3. Results
3.1. Dunaliella sp.
3.1.1. Effect of low (2000 lux) and high (8000 lux) white light illumination
The cultures lasted 17 days and their absorption spectra were taken every second day from the 3rd day onwards. As seen in Figure 2, on day 3, the cell density in the condition of low light (to be named hereafter as L-light) (Figure 2A) the cell density of the culture was 850,000 ± 35,117 (SE) cells/mL while in the condition of high light (to be named hereafter as XL-light) (Figure 2B) on the same day reached 4,600,000 ± 149,332 cells/mL, an indication of rapid growth since the beginning in XL as contrasted to L, where an initial lag phase was much pronounced approaching a similar cell density only around the 7th-8th day.
Maximum cell density on day 18 in XL reached 25,150,000 ± 524,309 cells/mL significantly higher (P<0.05) than the relevant one of the same day in L (18,529,000 ± 265,016 cells/mL). Comparing also the cell densities in previous days (5th-7th-9th-11th-13th-15th), it was found that in XL, the densities of each day were higher (P<0.05) than their counterparts in L.
In L-light (Figure 2A) till the 11th day the spectra exhibited weak peaks with only a slight elevation at the wave length of 680 nm which corresponds to chlorophyll-a. On the 13th day and afterwards (15th and 17th day) when cell densities exceeded 11,000,000 cells/mL all characteristics peaks for chlorophyll-a (680 and 440 nm), chlorophyll-b (650 nm) and total carotenoids (484 nm) became very evident. The situation in XL-light spectra was totally different (Figure 2B) as the above mentioned peaks became clearly evident as early as from the 7th day (at 7,700,000 cells/mL) and onwards, reaching much higher peaks than the corresponding ones of L-light at all the characteristic of each pigment wave lengths. In the highest cell density of 25,150,000 cells/mL of the 17th day the peak for total carotenoids (484 nm) was much pronounced.
Using the values of absorbance (OD) at 750 nm from the spectra of Figure 3 the regression lines of cell density vs absorbance in both light regimes (L and XL) resulted in perfect fitness with equations of: cells/mL = (2 x 10⁷ x OD 750nm) – 4 x 10⁶ with R2 = 0.9951 for L-light and cells/mL = (2 x 10⁷ x OD 750nm) – 9 x 10⁶ with R2 = 0.9971 for XL-light (Figure 3A and 3D respectively).
Before using as above the corresponding values of OD at 750 nm for examining the correlation between the content of various pigments with their spectrum’s value of OD at 750 nm, their OD values corresponding to the peak at the spectrum for each particular pigment were examined. In L-light (Figure 3B) using the spectral OD values of 680 nm for chlorophyll-a, 650 nm for chlorophyll-b and 484 nm for total carotenoids, the resulted equations were: Chlor.-a (μg/mL) = (6.8971 x OD 680 nm) - 0.1385 with R² = 0.9939, Chlor.-b (μg/mL) = (3.3745 x OD 650 nm) - 0.0168 with R² = 0.9748 and Total carot. (μg/mL) = (3.4821 x OD 484 nm) - 0.4589 with R² = 0.997. In XL-light (Figure 3E) the relevant equations were: Chlor.-a (μg/mL) = (7.2023 x OD 680 nm) - 0.1264 with R² = 0.9761, Chlor.-b (μg/mL) = (4.5273 x OD 650 nm) - 0.215 with R² = 0.9725 and Total carot. (μg/mL) = (7.6317 x OD 484 nm) - 3.0762 with R² = 0.965. After the ascertainment of the strong relation between the pigment content and the relevant OD of maximum absorbance as were exhibited above, the use of OD at 750 nm was applied to all (Figure 3C and 3F). In L-light (Figure 3C) the resulted equations were:
Chlor.-a (μg/mL) = (9.8992 x OD 750 nm) - 0.9434 with R² = 0.9896, Chlor.-b (μg/mL) = (4.261 x OD 750 nm) - 0.3334 with R² = 0.9588 and Total carot. (μg/mL) = (5.0897 x OD 750 nm) - 0.095 with R² = 0.9956. In XL-light (Figure 3F) the relevant equations were: Chlor.-a (μg/mL) = (10.713 x OD 750 nm) - 0.3762 with R² = 0.9836, Chlor.-b (μg/mL) = (5.9525 x OD 750 nm) - 0.9848 with R² = 0.9773 and Total carot. (μg/mL) = (12.265 x OD 750 nm) - 5.4663 with R² = 0.978.
Starting the measurement of pigments on the 3rd day of the cultures, it was found that in XL-light (Figure 4B) at all days (3rd-5th-7th-9th-11th-13th-15th-17th) all pigment concentrations were significantly higher (P<0.05) than their counterparts in L-light (Figure 4A). Maxima of all pigments (in μg/mL ± SE) were recorded on the 17th day for both light regimes. In L-light chlor.-a: 12.43 ± 0.815, chlor.-b: 5.997 ± 0.204, total carot.: 7.173 ± 0.606 and β-carot: 3.113 ± 0.126. In XL-light chlor.-a: 17.283 ± 1.046,, chlor.-b: 8.290 ± 0.569, total carot.: 15.03 ± 0.977 and β-carot: 7.152 ± 0.318.
3.1.2. Effect of colored (green, blue and red) light illumination
The cultures lasted 18 days and their absorption spectra were taken on 2nd, 4th, 6th, 12th, 15th and 18th days. As seen in Figure 5 the spectra of green (Figure 5A) and blue light (Figure 5C) were prominently much more elevated in terms of absorption values as compared to red light (Figure 5B) in which a collapse of the culture occurred on 18th day with its spectrum plummeting. In fact, the signs of collapse in the red light became evident from the 15th day’s spectrum which became almost indistinguishable from the spectrum of the 12th day. The uppermost spectra correspond to the measured highest cell densities of the 18th day which were 18,850,000 ± 287,924 (SE) cells/mL for green light, 20,150,000 ± 504,477 cells/mL for blue light and 11,776,600 ± 103,494 cells/mL for red light (on the 15th day). The density in blue light is significantly higher than that in green light and both are higher (P<0.05) than the relevant one in red light. In general, all cell densities of every day in green and blue light are significantly higher than their counterparts in red light. Using the values of absorbance (OD) at 750 nm from the spectra of Figure 5A, the regression line of cell density vs absorbance using data from all colors resulted in perfect fitness with equation of: cells/mL = (2 x 10⁷ x OD 750nm) – 5 x 10⁶ with R2 = 0.9867.
Before using as above the corresponding values of OD at 750 nm for examining the correlation between the content of various pigments with their spectrum’s value of OD at 750 nm, their OD values corresponding to the peak at the spectrum for each particular pigment were examined. First this procedure was made using the sum of data from all colors for each pigment (Figure 6B), using the spectral OD values of 680 nm for chlorophyll-a, 650 nm for chlorophyll-b and 484 nm for total carotenoids. The resulted equations were: Chlor.-a (μg/mL) = (7.6573 x OD 684nm) + 0.6695 with R² = 0.97, Chlor.-b (μg/mL) = (4.5815 x OD 650nm) + 0.1873 with R² = 0.9178 and Total carot. (μg/mL) = (4.0644 x OD 484nm) + 0.6199 with R² = 0.9276. After the ascertainment of the strong relation between the pigment content and the relevant OD of maximum absorbance as were exhibited above, the use of OD at 750 nm was applied to all (Figure 6C). The resulted equations were: Chlor.-a (μg/mL) = (12.15 x OD 750nm) - 1.2231 with R² = 0.9454, Chlor.-b (μg/mL) = (6.2648 x OD 750nm) - 1.007 with R² = 0.8709 an Total carot. (μg/mL) = (6.6353 x OD 750nm) - 0.4964 with R² = 0.931.
From Figure 7 where the above described regression equations were applied to each color separately, it was found that even better perfect fits were produced for each pigment with values of R2 above 0.9.
Pigment content was clearly affected by the light color used (Figure 8). All kind of pigments (chlor.-a, chlor.-b, total carot., b-carot.) were much higher (P<0.05) in green and blue color compared to red at all relevant days (except the first one between green and red). Although for the first 4 measurements (except for the first on 3rd day) chlorophylls, total carotenoids and b-carotene were significantly higher in green light compared with the respective values in blue light (P<0.05), in the last 2 measurements on 15th and 18th day (15.5 x 10⁶ and 18.85 x 10⁶ cells/mL for green light and 16.3 x 10⁶ and 20.15 x 10⁶ cells/mL for blue light respectively), chlorophyll-a (15.69 ± 0.410 and 17.47 ± 0.274 in green and 15.06 ± 0.163 and 17.41 ± 0.308 in blue light, respectively) and chlorophyll-b (6.97 ± 0.422 and 8.58 ± 0.687 in green and 7.83 ± 0.557 and 9.74.41 ± 0.533 in blue light, respectively) values were similar (P>0.05). On the same last two days, total carotenoids (7.74 ± 0.475 and 9.11 ± 0.297 in green and 9.02 ± 0.220 and 10.24 ± 0.258 in blue light, respectively) were higher in blue light (P<0.05) and β-carotene while higher in blue light on 15th day (4.82 ± 0.201 vs 4.20 ± 0.081 in green light, P<0.05), on 18th day both colors had equal values (5.01 ± 0.124 in green and 5.05 ± 0.137 in blue, P>0.05).
3.2. Anabaena sp.
3.2.1. Effect of low (2000 lux) and high (8000 lux) white light illumination
The two sets of absorption spectra during the culture period of Anabaena sp. in both L-light and XL-light regimes were quite similar (Figure 9) in terms of recorded biomass (g d.w./L) of the spectra taken every 3 days starting from the 3rd and ending on the 15th day. The most remarkable difference between the two light intensities was the more prominent peak at 630 nm that characterizes phycocyanin in all spectra of L-light (Figure 9A) compared to the relevant ones of XL-light (Figure 9B) from the 9th till the 15th day
Biomass expessed as g d.w./L ± SE while presented significantly higher (P<0.05) values from the 3rd day till the 12th in XL-light compared to L, finally, on the 15th day, both recorded densities were equal (P>0.05) with 1.748 ± 0.101 in L and 1.727 ± 0.078 in XL.
Using the values of absorbance (OD) at 750 nm from the spectra of Figure 9 the regression line of cell density vs absorbance from both light regimes (L and XL) resulted in perfect fitness (Figure 10A) with equation of: g d.w./L = (1.2134 x OD 750 nm) + 0.0812 with
R² = 0.9974. Before using as above the corresponding values of OD at 750 nm for examining the correlation between the content of chlorophyll-a and total carotenoids with their spectrum’s value of OD at 750 nm, their OD values corresponding to the peak at the spectrum for chlor.-a (682 nm) and total carot. (490 nm) were examined (Figure 10B). A strong relation was recorded for both pigments: Chlor.-a (μg/mL) = (5.3105 x OD 682nm) - 1.0738 (R² = 0.9721) and Total carot. (μg/mL) = (2.6585 x OD 490nm) - 1.0684(R² = 0.9816). After the ascertainment of the above strong relation between the pigment content and their relevant OD of maximum absorbance, the use of OD at 750 nm was applied (Figure 10C), resulting in: Chlor.-a (μg/mL) = (7.9347 x OD 750 nm) - 1.3155 (R² = 0.9769) and Total carot. (μg/mL) = (4.3358 x OD 750nm) - 1.1666 (R² = 0.9907).
Applying the above described correlations of chlorophyll-a and total carotenoids concentrations to their OD value of maximum absorbance and to OD at 750 nm separately for each light regime (Figure 11), equally strong relations were recorded. In L-light (Figure 11A and C): Chlor.-a (μg/mL) = (4.9671 x OD 682nm) - 0.7367 (R² = 0.9938), Total carot. (μg/mL) = (2.5244 x OD 490nm) - 1.0189 (R² = 0.9772) and Chlor.-a (μg/mL) = (8.0337 x OD 750 nm) - 1.1314 (R² = 0.9905), Total carot. (μg/mL) = (4.2402 x OD 750nm) - 1.191 (R² = 0.9914). In XL-light (Figure 11B and D): Chlor.-a (μg/mL) = (5.8413 x OD 682nm) - 1.6415 (R² = 0.9614), Total carot. (μg/mL) = (2.7752 x OD 490nm) - 1.1191 (R² = 0.9966) and Chlor.-a (μg/mL) = (8.0234 x OD 750 nm) - 1.6417 (R² = 0.9758) and Total carot. (μg/mL) = (4.37 x OD 750nm) - 1.1026 (R² = 0.9959).
A similar to chlorophyll-a and total carotenoids procedure as above was applied to the correlations of phycocyanin concentrations to its OD value of maximum absorbance and to OD at 750 nm separately for each light regime (Figure 12). Using cumulatively values from both L and XL-light the relation between phycocyanin (in mg/mL ± SE) and its OD of its peak on the spectra (630 nm) resulted in (Figure 12A): Phycoc. L+XL (mg/mL) = (0.9178 x OD 630nm) – 0.1906, (R² = 0.8094) and using OD values of 750 nm (Figure 12B), in: Phycoc. L+XL (mg/mL) = (1.1724 x OD 750nm) – 0.056, (R² = 0.6389). Next, using separately the values from each light regime resulted in (Figure 12C): Phycoc. L (mg/mL) = (1.1176 x OD 630nm) – 0.2267, (R² = 0.985) and Phycoc. XL (mg/mL) = (0.5562 x OD 630nm) – 0.0253, (R² = 0.98) and using 750 nm (Figure 12D), in: Phycoc. L (mg/mL) = (1.7797 x OD 750nm) – 0.2299, (R² = 0.9687) and Phycoc. XL (mg/mL) = (0.6984 x OD 750nm) – 0.0765, (R² = 0.9717). So a much stronger relation is produced using OD values for each light regime separately than using values pooled from both light regimes.
In Figure 13 are depicted the measured concentrations of chlorophyll-a and total carotenoids in μg/mL ± SE, phycocyanin in mg/mL ± SE and phycocyanin yield in mg/g d.w. ± SE, for every light regime. Chlorophyll-a presented its highest concentration of 9.713 ± 0.533 on 15th day in L-light significantly higher (P<0.05) than the respective value in XL-light (8.750 ± 0.323). On the contrary, the previous days (6th, 9th and 12th) chlorophyll exhibited significantly higher values in XL-light. Almost the same pattern was found for total carotenoids with higher values in XL-light but finally on the 15th day the concentrations were statistically (P>0.05) equal (4.939 ± 0.411 in L-light, 4.792 ± 0.325 in XL-light).
Concerning phycocyanin a clear trend was found with equal concentrations (P>0.05) on 3rd, 6th and 9th days of culture, but significantly higher values in L-light (maximum 2.125 ± 0.078 on the 15th day) vs 0.943 ± 0.108 in XL-light for the same day. Similarly, the phycocyanin yield was higher (P<0.05) in L-light (Figure 13C) on the 15th day (29.785 ± 1.687) compared to 24.697 ± 0.366 in XL-light (Figure 13D) on the same day.
3.2.2. Effect of colored (green, blue and red) light illumination
In all three colors used the spectra (Figure 14) presented a remarkable similarity for the first 3 days of measurement (2nd, 3rd and 6th) with almost identical peaks for chlorophyll-a (682 and 440 nm), total carotenoids (490 nm) and phycocyanin (630 nm) between green and red. From the 10th day till the 16th day the spectra in green and red were more elevated compared to the respective ones in blue, but on 19th day the spectrum in red collapsed (Figure 14C), while in blue (Figure 14B) just barely raised from that of the previous measurement (16th day) and in green (Figure 14A) kept rising. Phycocyanin peaks (630 nm) became evident from the 6th day onwards in all colors with almost identical height till the 10th day. From the 12th day the phycocyanin peaks subsided in green till the last measurement of 19th day while the respective ones in blue and red (with the exception of the 19th day) kept rising even above the peak of chlorophyll-a (682 nm), especially in blue color.
At all days of the culture (2nd-3rd-6th-10th-12th-16th-19th) the recorded biomass densities were significantly higher (P<0.05) in green light compared to blue light, reaching on the 19th day 2.053 ± 0.056 (SE) g d.w./L in green vs 1.498 ± 0.137 (SE) g d.w./L in blue. The relevant values in red light were significantly higher (P<0.05) than their relevant ones of the same days in blue light and equal (P>0.05) to those of the green light but on the 19th day the culture obviously collapsed to 1.15 ± 0.07 (SE) g d.w./L from 1.737 ± 0.071 (SE) g d.w./L on its 16th day’s recording.
A perfect fit (R2 = 0.9948) of the regression line of the relation between the OD at 750 nm of the pooled data from all light colors and the culture density (in g d.w./L) was found described by the equation: Dry Weight = 1.2687 x OD 750nm + 0.0031 (Figure 15A). A very good fit was also found relating chlorophyll-a content from all colored lights and either OD at 682 or 750 nm (Figure 15B and Figure 15C with R2 = 0.9071 and 0.9214, respectively) and even better fit when considering the relevant relations of chlorophyll-a vs OD of 682 or 750 nm for each color separately. In that case (Figure 16), the first order equations for green, blue and red illumination gave R2 = 0.9411, R2 = 0.9816 and R2 = 0.9477, respectively using the OD of 682 nm (Figure 16A, B and C, respectively) and R2 = 0.9598, R2 = 0.9664 and R2 = 0.9757, respectively using the OD of 750 nm (Figure 16D, E and F, respectively).
Excellent fits were found considering total carotenoids vs OD of 490 nm (their peak wave length) or 750 nm (Figure 17) using either pooled data from all colors or using each color separately. Using pooled data correlation coefficients were: R2 = 0.9056 (Figure 17A) using 490 nm and R2 = 0.918 (Figure 17B) using 750 nm.
Same or even better fits were found when considering the relevant relations of total carotenoids vs OD of 490 or 750 nm for each color separately. In that case (Figure 18), the first order equations for green, blue and red illumination gave R2 = 0.944, R2 = 0.9863 and R2 = 0.9462, respectively using the OD of 490 nm (Figure 18A, B and C, respectively) and R2 = 0.9433, R2 = 0.9824 and R2 = 0.9577, respectively using the OD of 750 nm (Figure 18D, E and F, respectively).
Considering phycocyanin and in contrast to the case of using pooled data from both light intensities (Figure 12), the use of pooled data from all color lights using either the wave length of 630 nm (Figure 17C) or that of 750 nm (Figure 17D), gave very high correlation coefficients (R2 = 0.9332 and R2 = 0.9358, respectively). Alternatively, using data for each colored light separately (Figure 19), the first order equations for green, blue and red illumination gave R2 = 0.944, R2 = 0.9863 and R2 = 0.9462, respectively using the OD of 630 nm (Figure 19A, B and C, respectively) and R2 = 0.9433, R2 = 0.9824 and R2 = 0.9577, respectively using the OD of 750 nm (Figure 19D, E and F, respectively).
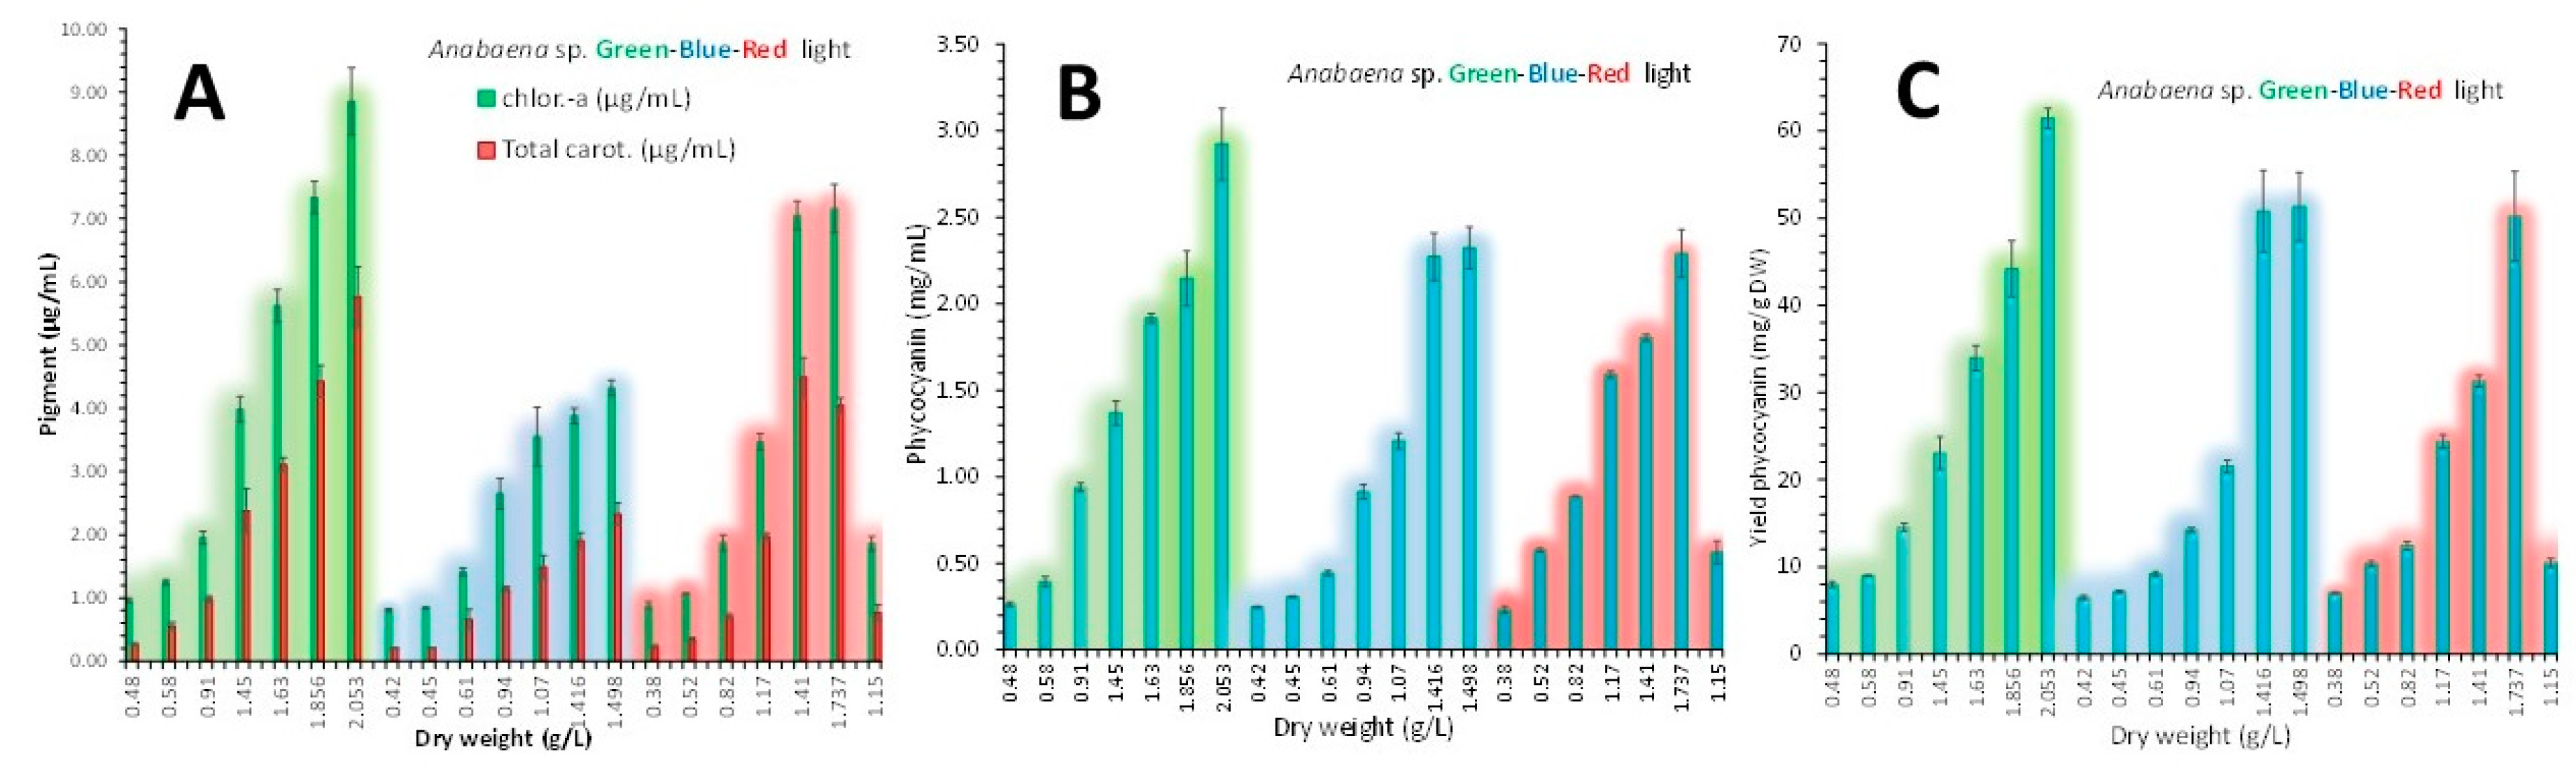
The overall picture of pigments content among the colors of illumination along the culture growth (Figure 20), revealed significant differences between colors and between stages of culture density. Green light induced significant higher (P<0.05) content of chlorophyll-a and total carotenoids after the 3rd day compared to either blue or red light. Its highest values of 8.859 μg/mL ± 0.532 for chlorophyll-a and 5.766 μg/mL ± 0.472 for total carotenoids on 19th day (Figure 20A), were significantly higher (P<0.05) than the relevant ones of blue light (4.301 μg/mL ± 0.122 and 2.322 μg/mL ± 0.176, respectively) and red light (7.16 μg/mL ± 0.383 and 4.04 μg/mL ± 0.122 on the 16th day, respectively and 1.862 μg/mL ± 0.112 and 0.765 μg/mL ± 0.123 on the 19th day, respectively when the culture obviously collapsed).
In green light phycocyanin also presented its highest values either as concentration (Figure 20B) or yield (Figure 20C) on the 19th day (2.922 mg/mL ± 0.207 and 61.467 mg/g d.w. ± 1.126, respectively) significantly higher than the relevant values of the same day in blue (2.323 mg/mL ± 0.122 and 51.294 mg/g d.w. ± 3.954, respectively) and red light (2.291 mg/mL ± 0.139 and 50.23 mg/g d.w. ± 5.19 on the 16th day, respectively and 0.565 mg/mL ± 0.065 and 10.458 mg/g d.w. ± 0.489 on the 19th day, respectively when the culture obviously collapsed).
4. Discussion
In the present study the influence of light intensity on one hand and the color of the light on the other, were studied in a well known eukaryotic microalga (Dunaliella sp.) and in an also well known cyanobacterium (Anabaena sp.). The first objective of the study was to investigate if the quantity and quality of light has a remarkable influence on the biomass growth and the content of the algal pigments and the second, if there is a simple and reliable method using absorption spectra to infer about the status of these variables. In a continuously growing industry of extracting valuable bioactive compounds from microalgae [27,28,29] every method facilitating the rapid estimation of their pigment content is welcomed. In this perspective and before anything else, it should be clarified that the present work aims to help growers estimate culture density and photosynthetic pigments, if not with the precision of an analytical method, but at least by establishing a clear trend in the development of a culture of a certain species of microalgae. As a tool for this purpose, it is shown that the absorption spectrum can give a reliable picture of the state of pigments from a qualitative and quantitative point of view on the one hand and, on the other hand, supply the observer with the values of the optical density of the peaks of the wavelengths that characterize each pigment type as well as the value at 750 nm where no algae pigment absorbs. Key to the applicability of the findings of the present study is the use of the 750 nm wavelength as a predictor of both algal density and photosynthetic pigments. It is well known that the optical density (OD), also known as absorbance or turbidity, of several unicellular algae species and other unicellular microbes, is widely employed as a quick and non-destructive assessment of biomass [30,31], as the relationship between the amount of light absorbed by a suspension of cells and their mass or number is dependent on the size, shape, and refractive index of the particles [32]. Thus, the mass or number of cells in a suspension can directly affect how much light is absorbed by the suspension but the relationship between particle number and OD in order to construct a standard curve is intricate. That is because microalgae have a disproportionately high pigment content, primarily made up of carotenoids and chlorophylls and additionally phycobiliproteins in cyanobacteria, that are subjected to variation not only among species but also depending on culture conditions [33,34,35]. Thus, constructing a calibration curve correlating algal biomass to a wave length at which a certain pigment peaks, can produce great error if the pigment content changes. Such wave lengths are those of 400-460 nm or 650-680 nm where absorbance of chlorophylls is maximized and are frequently encountered in the literature. Although these wave lengths can be used by means of standard curves as predictors of chlorophyll content and the same is true for other wave lengths assigned to other pigments peaks [36,37,38] they are not the best predictors of biomass as found in the present study. Instead the wavelength of 750 nm can reliably predict with sufficient accuracy algal density [39,40,41,42,43,44,45] because this wavelength avoids the light absorption by photosynthetic pigments which might affect its absorbance value created by turbidity alone [31,42,46]. In both species of microalgae studied, its correlation with the algal density gave very high correlation coefficients [42,47,48,49,50] so as to leave us with no doubt for its usefulness in the daily monitoring routine of an algal culture. Further on, when we correlated 750 nm with each pigment content, again, strong correlations ensued and strange as it may be, we found no mention of such a relation in the literature. But in this case (correlation of 750 nm with pigment content) some precautions must be taken. First, such a correlation should be assigned uniquely only for a certain species and for the set of culture conditions prevailing (light intensity, light color etc). Second, a lot of pigment measurements should have been made in advance and then a correlation analysis of them with their respective absorbance at the relevant wavelength peak for the examined pigment should lead to a calibration curve. Only if the correlation is strong, the next step, namely the correlation of the pigment with 750 nm, can be useful. In the present study having done all the above and using the 750 nm values from the series of absorption spectra during the course of each culture, it was found a very strong predictive ability for chlorophylls and carotenoids content using pooled data for both low (2000 lux) and high (8000 lux) illumination of white light in both microalgae, but not for phycocyanin in which case correlations are much stronger when examined separately for each light intensity.
Since light provides the energy source for autotrophic growth, it is essential for the majority of microalgae. Irradiance and light quality both influence the growth of cultured microalgae through photosynthesis [51,52,53]. From an ecological and physiological perspective, the various pigments found in microalgae show differences in the capacity of algae to use light with various spectral compositions for photosynthesis and to adapt to various lighting regimes [53,54,55,56,57,58]. As a result, the spectrum makeup of light is a crucial growth parameter for producing microalgae [59,60,61]. In the present study substantial differences were recorded in both maximum biomass, content of pigments and pigment ratios among the intensities of white light and among the three light colors used in both microalgae examined. In both microalgae the maximum biomass was induced by the higher intensity (8000 lux) of white light when compared to all other light regimes (white 2000 lux, or the 8000 lux of green, blue and red light). Considering that in the present study the range of illumination used of 2000-8000 lux (40 - 160 μmol photons/m2/s) is included within the range of 26 - 400 μmol photons/m2/s which according to [53] are the ideal light intensities at which the maximum growth rate is seen for various taxonomic groups and species of algae, we feel confident about our results.
The response of the two examined algae to the quantity and quality of light presented generally similarities and differences. This was of course to be expected as the composition of the photosynthetic pigments in their photosynthetic centers are different between eukaryotic and cyanobacterial microalgae and in addition, there are differences in their physiological mechanisms in response to various environmental conditions. In the present study as the temperature was similar (19-20 oC) for both species, we hypothesize that at other higher temperatures where according to other studies microalgae in general show faster growth and biomass yield [56,58,62], their response will be greater in terms of growth rate and density as well and as possibly in terms of their pigment content.
A common feature between both species is the much faster growth and higher density at the light intensity of 8000 lux compared to 2000 lux. This was more prominent in Dunaliella while in Anabaena the differences were minimal. No relevant references were found specifically on this, and presumably these differences arise from the amount of energy that the photosynthetic apparatus of each species can absorb to carry out photosynthesis. When the maximum rate of photosynthesis is attained, the extra light flux is still absorbed by the cell, which causes photosynthesis to reach a condition of light saturation. As a result, the rate of photosynthesis and algal growth both decline concurrently [63,64,65,66].
5. Conclusions
As a result of the calibration dependences we have discovered that it is possible to quickly, easily, and fairly accurate estimate biomass and pigment content in the species of microalgae with industrial importance Dunaliella sp. and Anabaena sp. using their absorption spectra. High correlation coefficients attest to this method's accuracy. Additionally, biomass production in both species is enhanced by white light of 8000 lux compared to 2000 lux, chlorophyll and carotenoids in Dunaliella sp. while 2000 lux enhances phycocyanin production over 8000 lux in Anabaena sp. Using colored light it was found that green light enhances phycocyanin in the cyanobacterium Anabaena sp. and carotenoids and chlorophyll in Dunaliella along with blue over red light.
Funding
This research was financially supported by the research program “ALGAVISION: Isolation and
culture of local phytoplankton species aiming to mass production of antibacterial substances, fatty acids,
pigments and antioxidants” (MIS 5048496), funded by the General Secretariat of Research and Technology of the
Greek Government.
Acknowledgments
The author thanks the technical staff of the laboratory Despoina Avramidou for her help in the experimentation.
Conflicts of Interest
The author declares no conflict of interest. The funders had no role in the design of the study; in the collection, analyses, or interpretation of the data; in the writing of the manuscript; nor in the decision to publish the results.
References
- Moreno-Garcia, L.; Adjallé, K.; Barnabé, S.; Raghavan, G.S.V. Microalgae Biomass Production for a Biorefinery System: Recent Advances and the Way towards Sustainability. Renewable and Sustainable Energy Reviews 2017, 76, 493–506. [Google Scholar] [CrossRef]
- Benedetti, M.; Vecchi, V.; Barera, S.; Dall’Osto, L. Biomass from Microalgae: The Potential of Domestication towards Sustainable Biofactories. Microb Cell Fact 2018, 17, 173. [Google Scholar] [CrossRef]
- Sun, H.; Zhao, W.; Mao, X.; Li, Y.; Wu, T.; Chen, F. High-Value Biomass from Microalgae Production Platforms: Strategies and Progress Based on Carbon Metabolism and Energy Conversion. Biotechnol Biofuels 2018, 11, 227. [Google Scholar] [CrossRef]
- Subramanian, S.; Sayre, R.T. The Right Stuff; Realizing the Potential for Enhanced Biomass Production in Microalgae. Front Energy Res 2022, 10. [Google Scholar] [CrossRef]
- Wang, B.; Li, Y.; Wu, N.; Lan, C.Q. CO2 Bio-Mitigation Using Microalgae. Appl Microbiol Biotechnol 2008, 79, 707–718. [Google Scholar] [CrossRef]
- Zhou, W.; Wang, J.; Chen, P.; Ji, C.; Kang, Q.; Lu, B.; Li, K.; Liu, J.; Ruan, R. Bio-Mitigation of Carbon Dioxide Using Microalgal Systems: Advances and Perspectives. Renewable and Sustainable Energy Reviews 2017, 76, 1163–1175. [Google Scholar] [CrossRef]
- Awal, S.; Christie, A. Suitability of Inland Saline Ground Water for the Growth of Marine Microalgae for Industrial Purposes. Journal of Aquaculture & Marine Biology 2015, 3. [Google Scholar] [CrossRef]
- Muhammad, G.; Alam, Md.A.; Xiong, W.; Lv, Y.; Xu, J.-L. Microalgae Biomass Production: An Overview of Dynamic Operational Methods. In Microalgae Biotechnology for Food, Health and High Value Products; Springer Singapore: Singapore, 2020; pp. 415–432. [Google Scholar]
- Farooq, W. Sustainable Production of Microalgae Biomass for Biofuel and Chemicals through Recycling of Water and Nutrient within the Biorefinery Context: A Review. GCB Bioenergy 2021, 13, 914–940. [Google Scholar] [CrossRef]
- Ahmad, A.; W. Hassan, S.; Banat, F. An Overview of Microalgae Biomass as a Sustainable Aquaculture Feed Ingredient: Food Security and Circular Economy. Bioengineered 2022, 13, 9521–9547. [Google Scholar] [CrossRef]
- Ummalyma, S.B.; Sirohi, R.; Udayan, A.; Yadav, P.; Raj, A.; Sim, S.J.; Pandey, A. Sustainable Microalgal Biomass Production in Food Industry Wastewater for Low-Cost Biorefinery Products: A Review. Phytochemistry Reviews 2022. [Google Scholar] [CrossRef]
- Yu, K.L.; Ong, H.C.; Zaman, H.B. Microalgae Biomass as Biofuel and the Green Applications. Energies (Basel) 2022, 15, 7280. [Google Scholar] [CrossRef]
- Maroneze, M.M.; Dias, R.R.; Severo, I.A.; Queiroz, M.I. Microalgae-Based Processes for Pigments Production. In Pigments from Microalgae Handbook; Springer International Publishing: Cham, 2020; pp. 241–264. [Google Scholar]
- Jeevanandam, J.; Choudhary, V.; Selvam, J.D.; Danquah, M.K. The Bioeconomy of Production of Microalgal Pigments. In Pigments from Microalgae Handbook; Springer International Publishing: Cham, 2020; pp. 325–362. [Google Scholar]
- Silva, S.C.; Ferreira, I.C.F.R.; Dias, M.M.; Barreiro, M.F. Microalgae-Derived Pigments: A 10-Year Bibliometric Review and Industry and Market Trend Analysis. Molecules 2020, 25, 3406. [Google Scholar] [CrossRef]
- Coulombier, N.; Jauffrais, T.; Lebouvier, N. Antioxidant Compounds from Microalgae: A Review. Mar Drugs 2021, 19, 549. [Google Scholar] [CrossRef] [PubMed]
- Pourkarimi, S.; Hallajisani, A.; Alizadehdakhel, A.; Nouralishahi, A.; Golzary, A. Factors Affecting Production of Beta-Carotene from Dunaliella Salina Microalgae. Biocatal Agric Biotechnol 2020, 29, 101771. [Google Scholar] [CrossRef]
- Wolf, L.; Cummings, T.; Müller, K.; Reppke, M.; Volkmar, M.; Weuster-Botz, D. Production of Β-carotene with Dunaliella Salina CCAP19/18 at Physically Simulated Outdoor Conditions. Eng Life Sci 2021, 21, 115–125. [Google Scholar] [CrossRef]
- Khandual, S.; Sanchez, E.O.L.; Andrews, H.E.; de la Rosa, J.D.P. Phycocyanin Content and Nutritional Profile of Arthrospira Platensis from Mexico: Efficient Extraction Process and Stability Evaluation of Phycocyanin. BMC Chem 2021, 15, 24. [Google Scholar] [CrossRef] [PubMed]
- Yao, T.; Huang, J.; Su, B.; Wei, L.; Zhang, A.-H.; Zhang, D.-F.; Zhou, Y.; Ma, G. Enhanced Phycocyanin Production of Arthrospira Maxima by Addition of Mineral Elements and Polypeptides Using Response Surface Methodology. Front Mar Sci 2022, 9. [Google Scholar] [CrossRef]
- Grant, C.; Louda, J. Microalgal Pigment Ratios in Relation to Light Intensity: Implications for Chemotaxonomy. Aquat Biol 2010, 11, 127–138. [Google Scholar] [CrossRef]
- Mohsenpour, S.F.; Richards, B.; Willoughby, N. Spectral Conversion of Light for Enhanced Microalgae Growth Rates and Photosynthetic Pigment Production. Bioresour Technol 2012, 125, 75–81. [Google Scholar] [CrossRef]
- Hotos, G.N. A Preliminary Survey on the Planktonic Biota in a Hypersaline Pond of Messolonghi Saltworks (W. Greece). Diversity (Basel) 2021, 13, 270. [Google Scholar] [CrossRef]
- Hotos, G.; Avramidou, D.; Mastropetros, S.G.; Tsigkou, K.; Kouvara, K.; Makridis, P.; Kornaros, M. Isolation, Identification, and Chemical Composition Analysis of Nine Microalgal and Cyanobacterial Species Isolated in Lagoons of Western Greece. Algal Res 2023, 69, 102935. [Google Scholar] [CrossRef]
- Markou, G. Effect of Various Colors of Light-Emitting Diodes (LEDs) on the Biomass Composition of Arthrospira Platensis Cultivated in Semi-Continuous Mode. Appl Biochem Biotechnol 2014, 172, 2758–2768. [Google Scholar] [CrossRef]
- Morowvat, M.H.; Ghasemi, Y. Culture Medium Optimization for Enhanced β-Carotene and Biomass Production by Dunaliella Salina in Mixotrophic Culture. Biocatal Agric Biotechnol 2016, 7, 217–223. [Google Scholar] [CrossRef]
- Novoveská, L.; Ross, M.E.; Stanley, M.S.; Pradelles, R.; Wasiolek, V.; Sassi, J.-F. Microalgal Carotenoids: A Review of Production, Current Markets, Regulations, and Future Direction. Mar Drugs 2019, 17, 640. [Google Scholar] [CrossRef] [PubMed]
- Patel, A.K.; Albarico, F.P.J.B.; Perumal, P.K.; Vadrale, A.P.; Nian, C.T.; Chau, H.T.B.; Anwar, C.; Wani, H.M. ud din; Pal, A.; Saini, R.; et al. Algae as an Emerging Source of Bioactive Pigments. Bioresour Technol 2022, 351, 126910. [Google Scholar] [CrossRef]
- Wan, X.; Zhou, X.-R.; Moncalian, G.; Su, L.; Chen, W.-C.; Zhu, H.-Z.; Chen, D.; Gong, Y.-M.; Huang, F.-H.; Deng, Q.-C. Reprogramming Microorganisms for the Biosynthesis of Astaxanthin via Metabolic Engineering. Prog Lipid Res 2021, 81, 101083. [Google Scholar] [CrossRef]
- TOENNIES, G.; GALLANT, D.L. The Relation between Photometric Turbidity and Bacterial Concentration. Growth 1949, 13, 7–20. [Google Scholar] [PubMed]
- Griffiths, M.J.; Garcin, C.; van Hille, R.P.; Harrison, S.T.L. Interference by Pigment in the Estimation of Microalgal Biomass Concentration by Optical Density. J Microbiol Methods 2011, 85, 119–123. [Google Scholar] [CrossRef]
- Clesceri, L.S.; Greenberg, A.E.; Eaton, A.D. Standard Methods for the Examination of Water and Wastewater, 20th ed.; American Public Health Association: Washington, DC, USA, 1998. [Google Scholar]
- Nicholls, K.H.; Dillon, P.J. An Evaluation of Phosphorus-Chlorophyll-Phytoplankton Relationships for Lakes. Internationale Revue der gesamten Hydrobiologie und Hydrographie 1978, 63, 141–154. [Google Scholar] [CrossRef]
- Begum, H.; Yusoff, F.MD.; Banerjee, S.; Khatoon, H.; Shariff, M. Availability and Utilization of Pigments from Microalgae. Crit Rev Food Sci Nutr 2016, 56, 2209–2222. [Google Scholar] [CrossRef]
- Pagels, F.; Salvaterra, D.; Amaro, H.M.; Guedes, A.C. Pigments from Microalgae. In Handbook of Microalgae-Based Processes and Products; Elsevier: Amsterdam, The Netherlands, 2020; pp. 465–492. [Google Scholar]
- An, J.-Y.; Sim, S.-J.; Lee, J.S.; Kim, B.W. Hydrocarbon Production from Secondarily Treated Piggery Wastewater by the Green Alga Botryococcus Braunii. J Appl Phycol 2003, 15, 185–191. [Google Scholar] [CrossRef]
- Chiu, S.-Y.; Kao, C.-Y.; Chen, C.-H.; Kuan, T.-C.; Ong, S.-C.; Lin, C.-S. Reduction of CO2 by a High-Density Culture of Chlorella Sp. in a Semicontinuous Photobioreactor. Bioresour Technol 2008, 99, 3389–3396. [Google Scholar] [CrossRef] [PubMed]
- Hsieh, C.-H.; Wu, W.-T. Cultivation of Microalgae for Oil Production with a Cultivation Strategy of Urea Limitation. Bioresour Technol 2009, 100, 3921–3926. [Google Scholar] [CrossRef] [PubMed]
- Detweiler, A.M.; Mioni, C.E.; Hellier, K.L.; Allen, J.J.; Carter, S.A.; Bebout, B.M.; Fleming, E.E.; Corrado, C.; Prufert-Bebout, L.E. Evaluation of Wavelength Selective Photovoltaic Panels on Microalgae Growth and Photosynthetic Efficiency. Algal Res 2015, 9, 170–177. [Google Scholar] [CrossRef]
- Gao, F.; Sá, M.; Teles (Cabanelas, I.I.; Wijffels, R.H.; Barbosa, M.J. Production and Monitoring of Biomass and Fucoxanthin with Brown Microalgae under Outdoor Conditions. Biotechnol Bioeng 2021, 118, 1355–1365. [Google Scholar] [CrossRef] [PubMed]
- Hirooka, S.; Tomita, R.; Fujiwara, T.; Ohnuma, M.; Kuroiwa, H.; Kuroiwa, T.; Miyagishima, S. Efficient Open Cultivation of Cyanidialean Red Algae in Acidified Seawater. Sci Rep 2020, 10, 13794. [Google Scholar] [CrossRef]
- Hotos, G.N.; Avramidou, D.; Bekiari, V. Calibration Curves of Culture Density Assessed by Spectrophotometer for Three Microalgae (Nephroselmis Sp., Amphidinium Carterae and Phormidium Sp.). European Journal of Biology and Biotechnology 2020, 1. [Google Scholar] [CrossRef]
- Plöhn, M.; Escudero-Oñate, C.; Funk, C. Biosorption of Cd(II) by Nordic Microalgae: Tolerance, Kinetics and Equilibrium Studies. Algal Res 2021, 59, 102471. [Google Scholar] [CrossRef]
- Yoshitomi, T.; Karita, H.; Mori-Moriyama, N.; Sato, N.; Yoshimoto, K. Reduced Cytotoxicity of Polyethyleneimine by Covalent Modification of Antioxidant and Its Application to Microalgal Transformation. Sci Technol Adv Mater 2021, 22, 864–874. [Google Scholar] [CrossRef]
- Markina, Zh. V.; Maslennikov, S.I.; Botsun, L.A. Application of the Spectrophotometric Method for Determination of the Cell Numbers of Microalgae in the Genus Tetraselmis (Chlorophyta): Calibration Curves and Equations for Calculation. Russ J Mar Biol 2022, 48, 525–528. [Google Scholar] [CrossRef]
- Chioccioli, M.; Hankamer, B.; Ross, I.L. Flow Cytometry Pulse Width Data Enables Rapid and Sensitive Estimation of Biomass Dry Weight in the Microalgae Chlamydomonas Reinhardtii and Chlorella Vulgaris. PLoS One 2014, 9, e97269. [Google Scholar] [CrossRef] [PubMed]
- Hotos, G.N. Culture Growth of the Cyanobacterium Phormidium Sp. in Various Salinity and Light Regimes and Their Influence on Its Phycocyanin and Other Pigments Content. J Mar Sci Eng 2021, 9, 798. [Google Scholar] [CrossRef]
- Hotos, G.N.; Avramidou, D. The Effect of Various Salinities and Light Intensities on the Growth Performance of Five Locally Isolated Microalgae [Amphidinium Carterae, Nephroselmis Sp., Tetraselmis Sp. (Var. Red Pappas), Asteromonas Gracilis and Dunaliella Sp.] in Laboratory Batch Cultures. J Mar Sci Eng 2021, 9, 1275. [Google Scholar] [CrossRef]
- Hotos, G.N.; Antoniadis, T.I. The Effect of Colored and White Light on Growth and Phycobiliproteins, Chlorophyll and Carotenoids Content of the Marine Cyanobacteria Phormidium Sp. and Cyanothece Sp. in Batch Cultures. Life 2022, 12, 837. [Google Scholar] [CrossRef]
- Hotos, G.N.; Avramidou, D.; Samara, A. The Effect of Salinity and Light Intensity on the Batch Cultured Cyanobacteria Anabaena Sp. and Cyanothece Sp. Hydrobiology 2022, 1, 278–287. [Google Scholar] [CrossRef]
- Wagner, I.; Steinweg, C.; Posten, C. Mono- and Dichromatic LED Illumination Leads to Enhanced Growth and Energy Conversion for High-Efficiency Cultivation of Microalgae for Application in Space. Biotechnol J 2016, 11, 1060–1071. [Google Scholar] [CrossRef]
- Li, Y.; Liu, J. Analysis of Light Absorption and Photosynthetic Activity by Isochrysis Galbana under Different Light Qualities. Aquac Res 2020, 51, 2893–2902. [Google Scholar] [CrossRef]
- Maltsev, Y.; Maltseva, K.; Kulikovskiy, M.; Maltseva, S. Influence of Light Conditions on Microalgae Growth and Content of Lipids, Carotenoids, and Fatty Acid Composition. Biology (Basel) 2021, 10, 1060. [Google Scholar] [CrossRef]
- Remias, D.; Lütz-Meindl, U.; Lütz, C. Photosynthesis, Pigments and Ultrastructure of the Alpine Snow Alga Chlamydomonas Nivalis. Eur J Phycol 2005, 40, 259–268. [Google Scholar] [CrossRef]
- Mayer, D.; Dubinsky, Z.; Iluz, D. Light as a Limiting Factor for Epilithic Algae in the Supralittoral Zone of Littoral Caves. Front Mar Sci 2016, 3. [Google Scholar] [CrossRef]
- Metsoviti, M.N.; Papapolymerou, G.; Karapanagiotidis, I.T.; Katsoulas, N. Effect of Light Intensity and Quality on Growth Rate and Composition of Chlorella Vulgaris. Plants 2019, 9, 31. [Google Scholar] [CrossRef]
- Fisher, N.L.; Campbell, D.A.; Hughes, D.J.; Kuzhiumparambil, U.; Halsey, K.H.; Ralph, P.J.; Suggett, D.J. Divergence of Photosynthetic Strategies amongst Marine Diatoms. PLoS One 2020, 15, e0244252. [Google Scholar] [CrossRef]
- Abiusi, F.; Sampietro, G.; Marturano, G.; Biondi, N.; Rodolfi, L.; D’Ottavio, M.; Tredici, M.R. Growth, Photosynthetic Efficiency, and Biochemical Composition of Tetraselmis Suecica F&M-M33 Grown with LEDs of Different Colors. Biotechnol Bioeng 2014, 111, 956–964. [Google Scholar] [CrossRef]
- Teo, C.L.; Atta, M.; Bukhari, A.; Taisir, M.; Yusuf, A.M.; Idris, A. Enhancing Growth and Lipid Production of Marine Microalgae for Biodiesel Production via the Use of Different LED Wavelengths. Bioresour Technol 2014, 162, 38–44. [Google Scholar] [CrossRef] [PubMed]
- Sharma, N.; Fleurent, G.; Awwad, F.; Cheng, M.; Meddeb-Mouelhi, F.; Budge, S.M.; Germain, H.; Desgagné-Penix, I. Red Light Variation an Effective Alternative to Regulate Biomass and Lipid Profiles in Phaeodactylum Tricornutum. Applied Sciences 2020, 10, 2531. [Google Scholar] [CrossRef]
- Diamantopoulou, C.; Christoforou, E.; Dominoni, D.M.; Kaiserli, E.; Czyzewski, J.; Mirzai, N.; Spatharis, S. Wavelength-Dependent Effects of Artificial Light at Night on Phytoplankton Growth and Community Structure. Proceedings of the Royal Society B: Biological Sciences 2021, 288, 20210525. [Google Scholar] [CrossRef]
- Lubián, L.M.; Montero, O.; Moreno-Garrido, I.; Huertas, I.E.; Sobrino, C.; González-del Valle, M.; Parés, G. Nannochloropsis (Eustigmatophyceae) as Source of Commercially Valuable Pigments. J Appl Phycol 2000, 12, 249–255. [Google Scholar] [CrossRef]
- Fan, J. ; Zheng, lvhong Acclimation to NaCl and Light Stress of Heterotrophic Chlamydomonas Reinhardtii for Lipid Accumulation. J Biosci Bioeng 2017, 124, 302–308. [Google Scholar] [CrossRef] [PubMed]
- Wu, M.; Zhu, R.; Lu, J.; Lei, A.; Zhu, H.; Hu, Z.; Wang, J. Effects of Different Abiotic Stresses on Carotenoid and Fatty Acid Metabolism in the Green Microalga Dunaliella Salina Y6. Ann Microbiol 2020, 70, 48. [Google Scholar] [CrossRef]
- Nzayisenga, J.C.; Farge, X.; Groll, S.L.; Sellstedt, A. Effects of Light Intensity on Growth and Lipid Production in Microalgae Grown in Wastewater. Biotechnol Biofuels 2020, 13, 4. [Google Scholar] [CrossRef]
- Cointet, E.; Wielgosz-Collin, G.; Bougaran, G.; Rabesaotra, V.; Gonçalves, O.; Méléder, V. Effects of Light and Nitrogen Availability on Photosynthetic Efficiency and Fatty Acid Content of Three Original Benthic Diatom Strains. PLoS One 2019, 14, e0224701. [Google Scholar] [CrossRef] [PubMed]
Figure 1.
A: Dunaliella sp. B: Anabaena sp. C: Bottles with Dunaliella on 5th day of culture at two different distances from light sources so as to create L-light (2000 lux) and XL-light (8000 lux). D: Bottles with Anabaena on 2nd day of culture at two different distances from light sources.
Figure 1.
A: Dunaliella sp. B: Anabaena sp. C: Bottles with Dunaliella on 5th day of culture at two different distances from light sources so as to create L-light (2000 lux) and XL-light (8000 lux). D: Bottles with Anabaena on 2nd day of culture at two different distances from light sources.
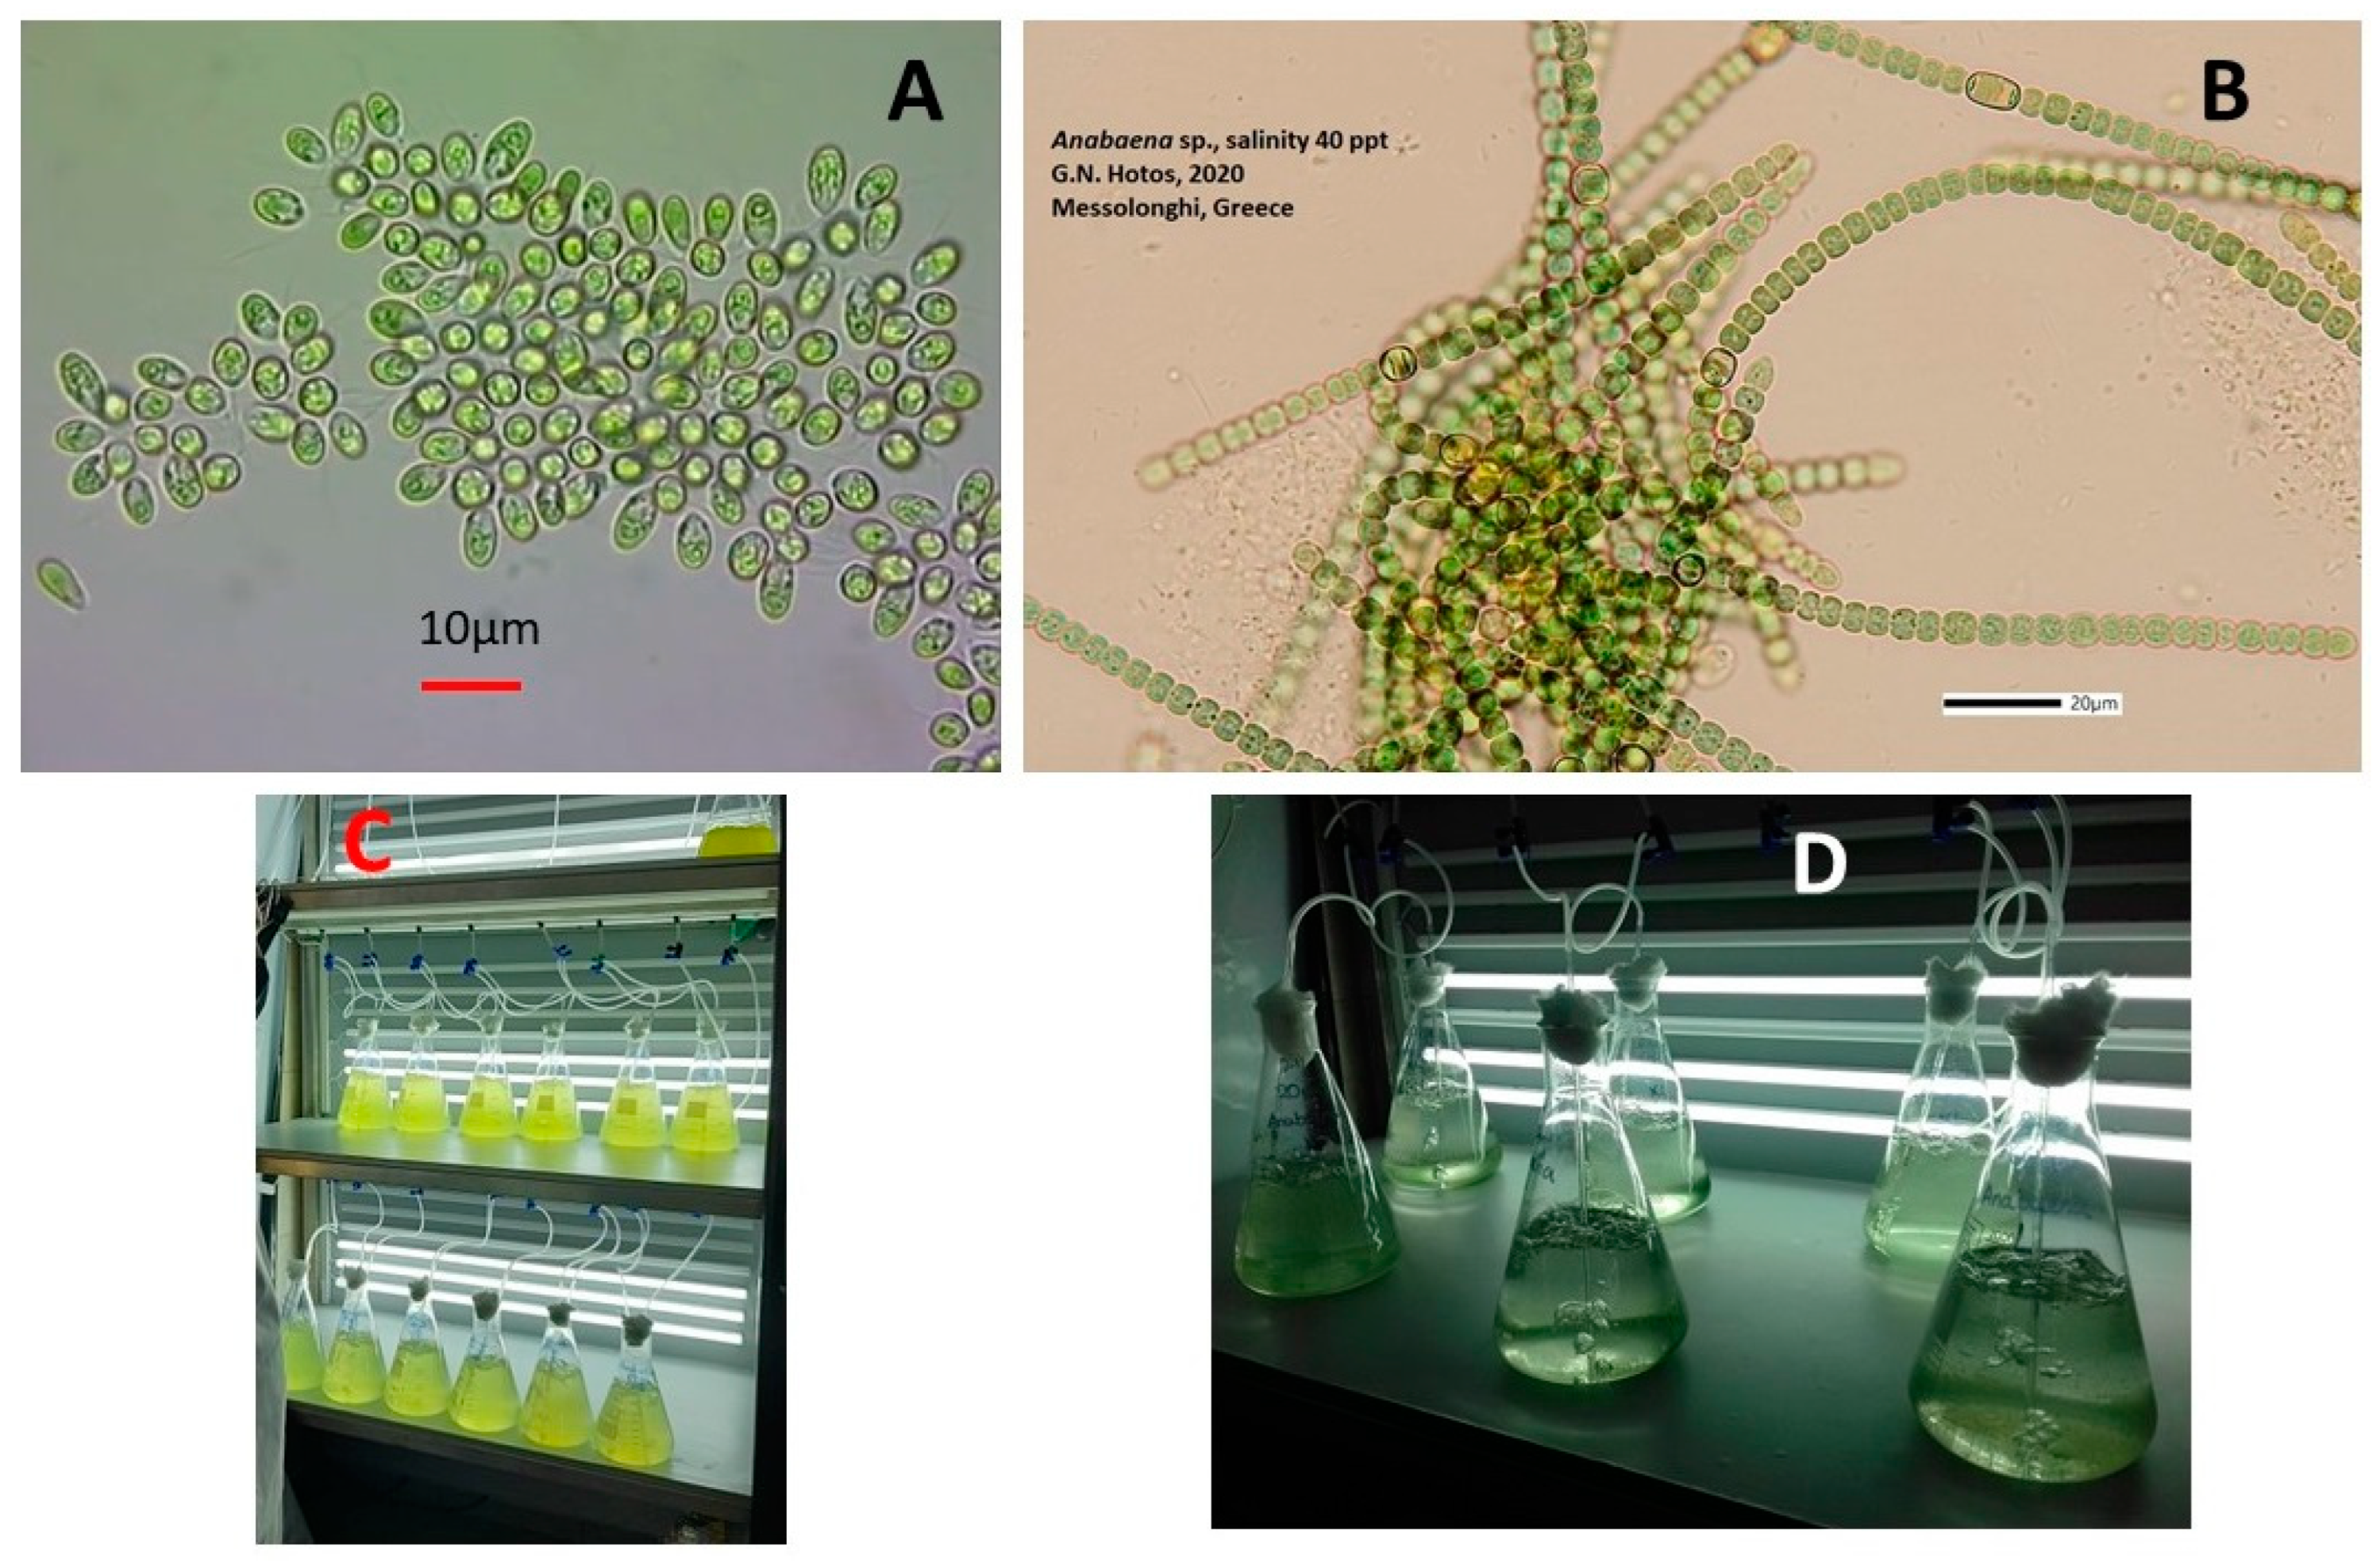
Figure 2.
The absorption spectra at 8 consecutive days (3rd to 17th) of the cultures of Dunaliella sp. exposed to low 2000 lux (A) and high illumination of 8000 lux (B).
Figure 2.
The absorption spectra at 8 consecutive days (3rd to 17th) of the cultures of Dunaliella sp. exposed to low 2000 lux (A) and high illumination of 8000 lux (B).
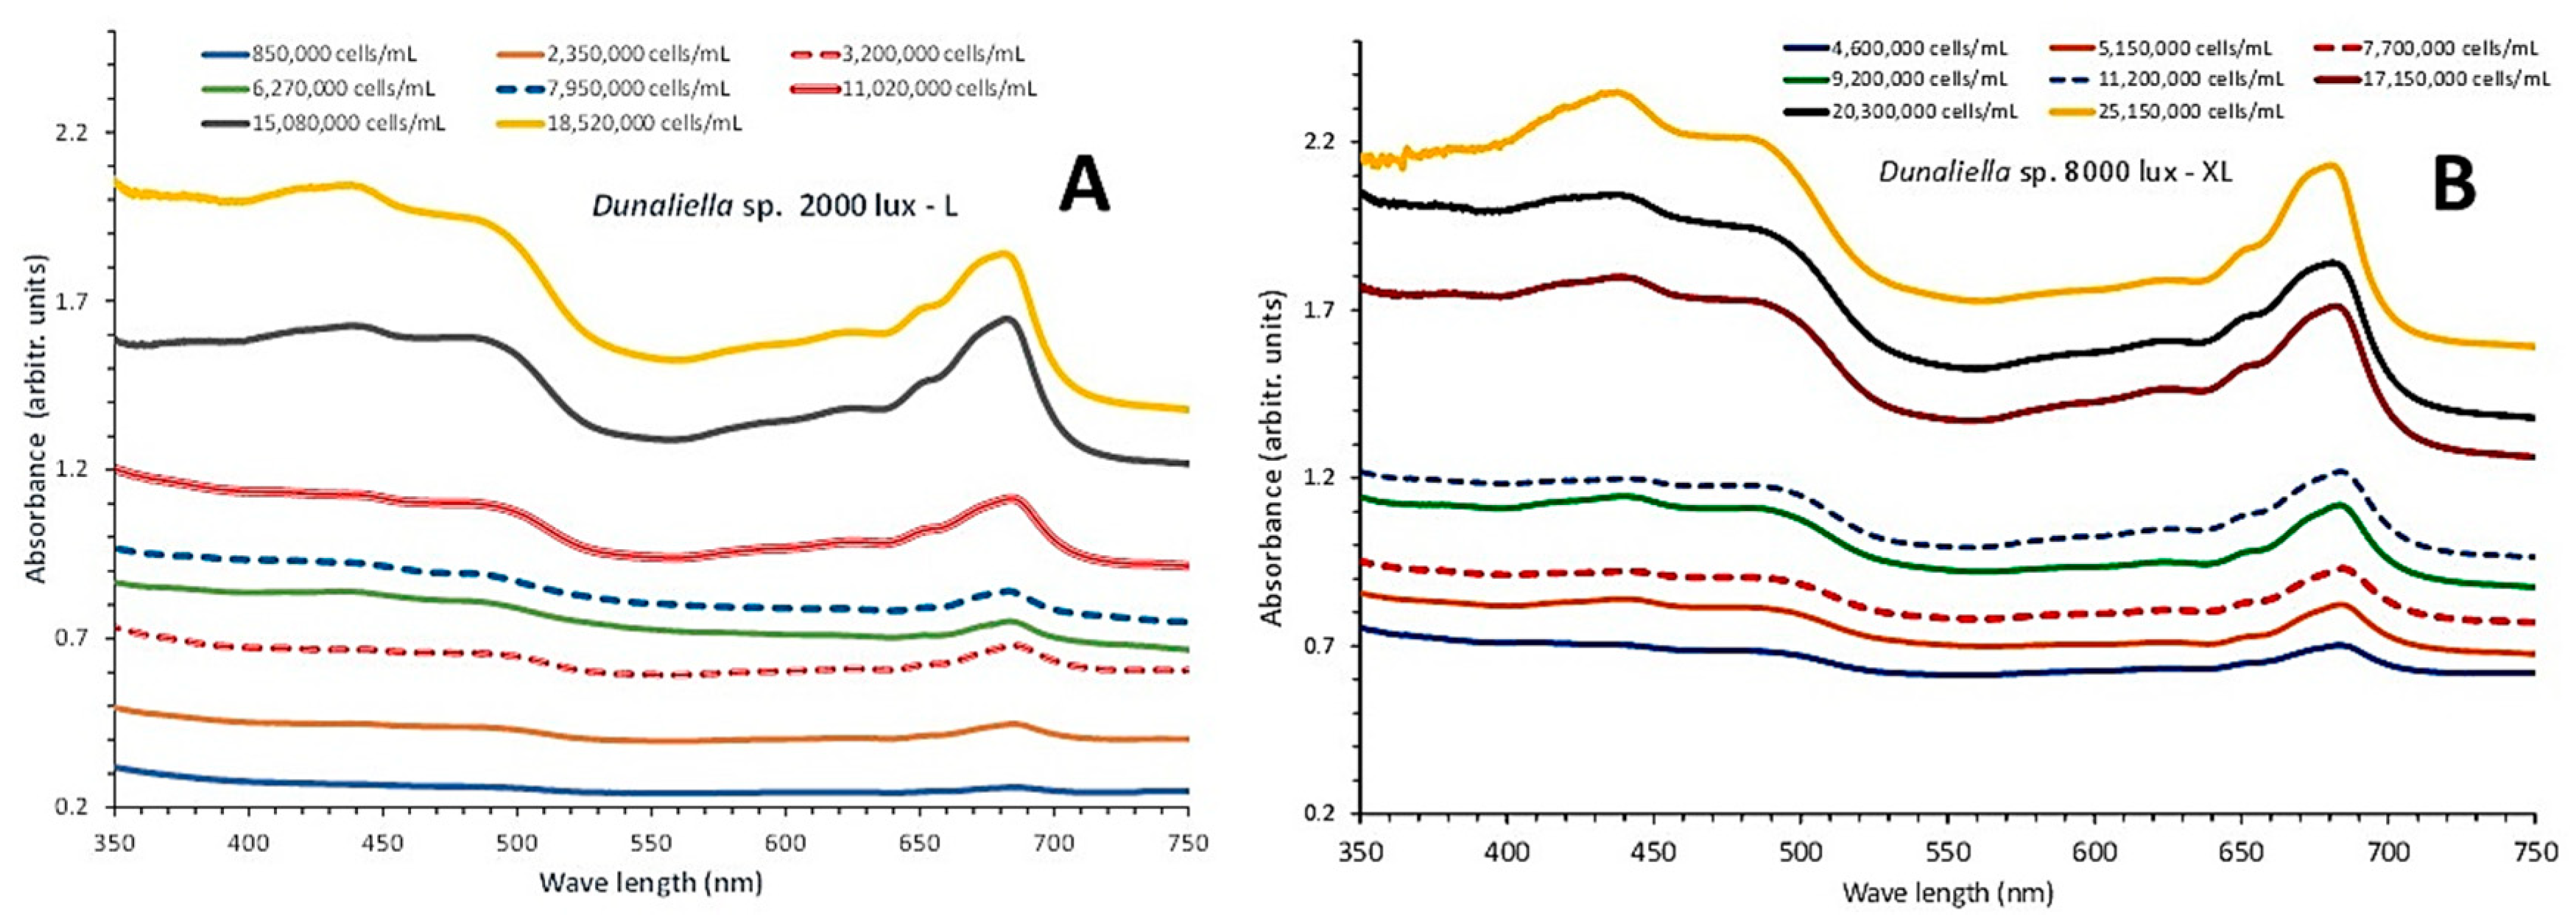
Figure 3.
A and D: Regression lines of cell density vs optical density (OD) at 750 nm for L-light and XL-light respectively. B and C: Regression lines of chlorophyll-a, chlorophyll-b and total carotenoids concentration as μg/mL ± SD vs OD at each wavelength exhibiting the maximum absorbance for each pigment (B) and versus the OD at the wave length of 750 nm (C) in Dunaliella culture under L-light. E and F: The same as in B and C correspondingly in Dunaliella culture under XL-light.
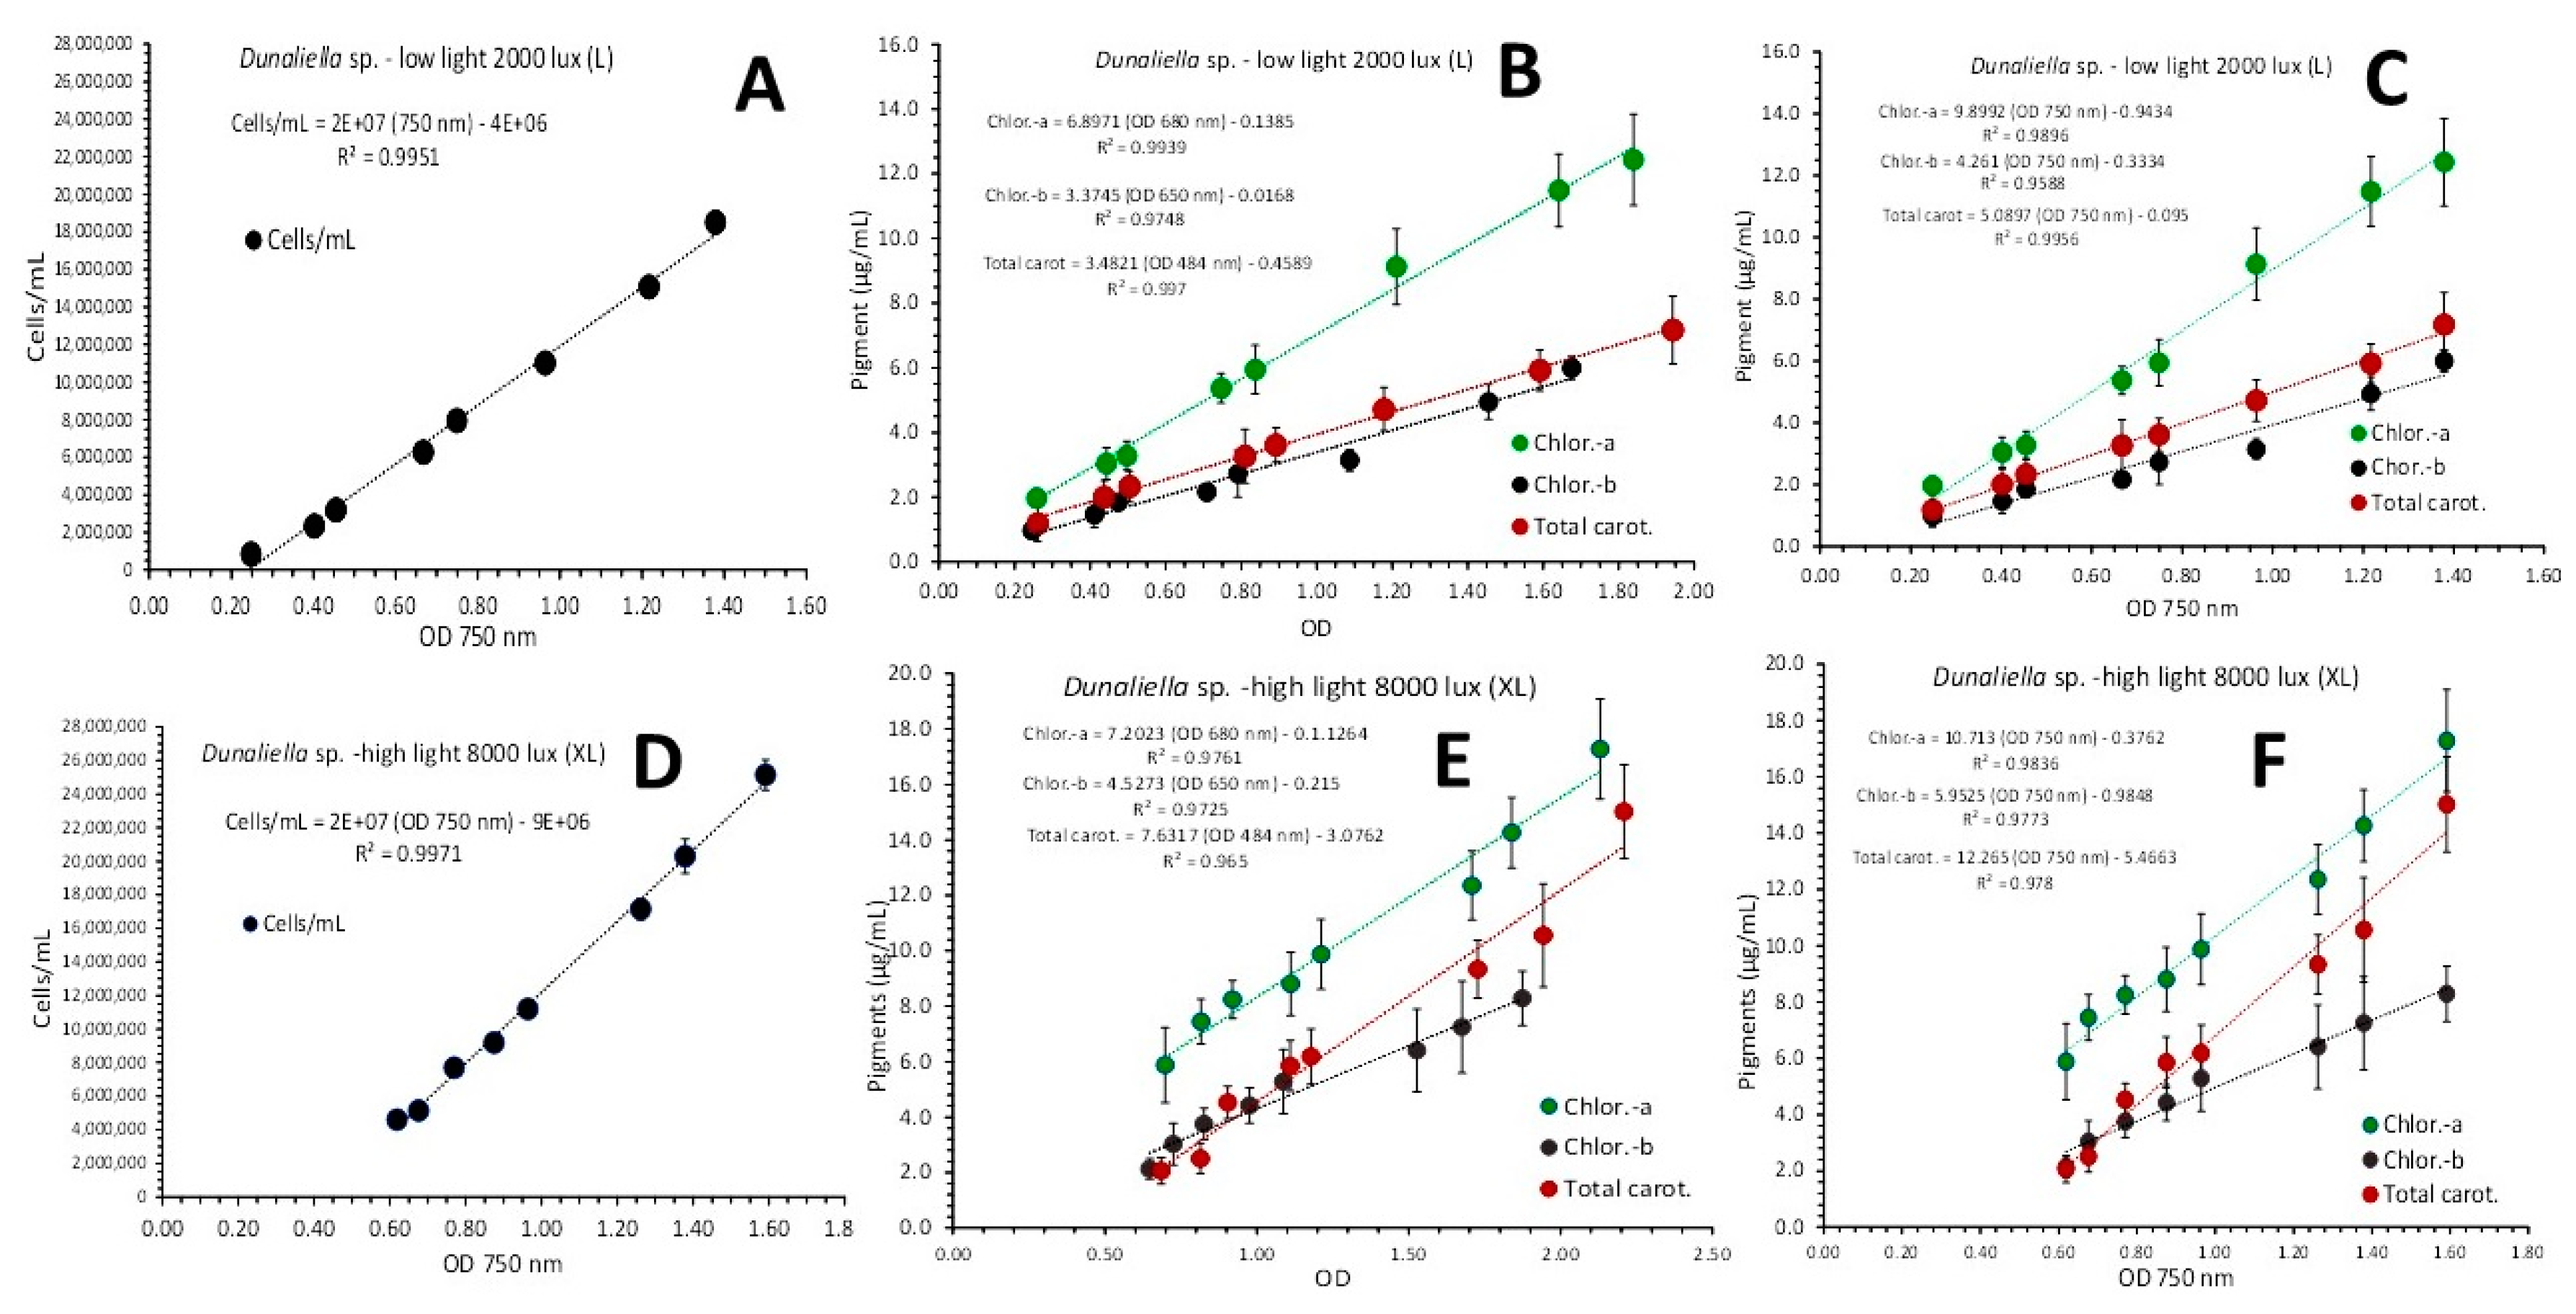
Figure 4.
Pigment content in μg/mL ± SE for chlorophyll-a, chlorophyll-b, total carotenoids and b-carotene at 8 different culture densities of Dunaliella sp. in L-light (A) and XL-light (B). Each successive culture density starting from the 3rd day of culture, represents measurements taken every 2 days.
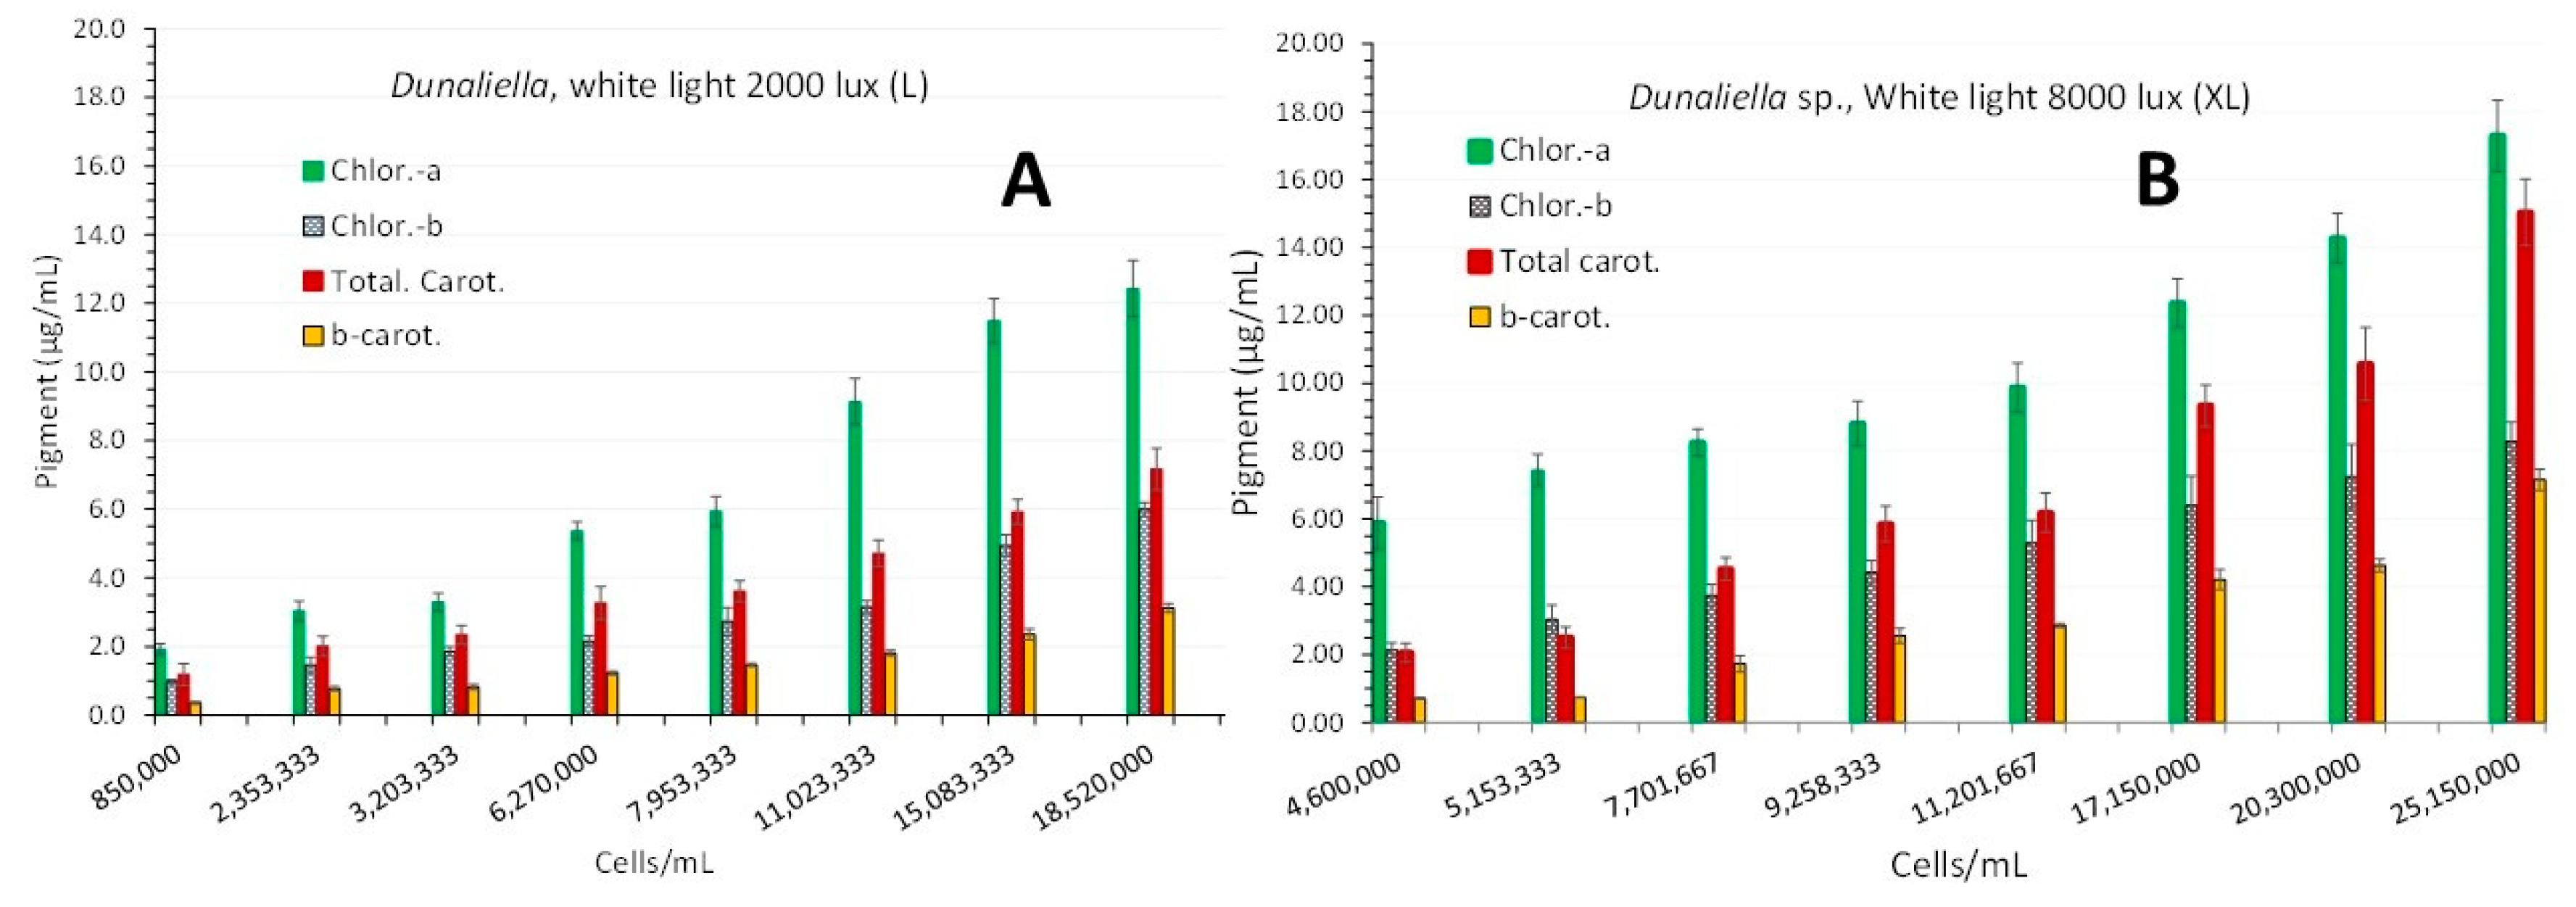
Figure 5.
The absorption spectra at 6 different days (2nd – 4th – 6th – 12th -15th -18th) of the cultures of Dunaliella sp. exposed to green (A), red (B) and blue (C) light.
Figure 5.
The absorption spectra at 6 different days (2nd – 4th – 6th – 12th -15th -18th) of the cultures of Dunaliella sp. exposed to green (A), red (B) and blue (C) light.
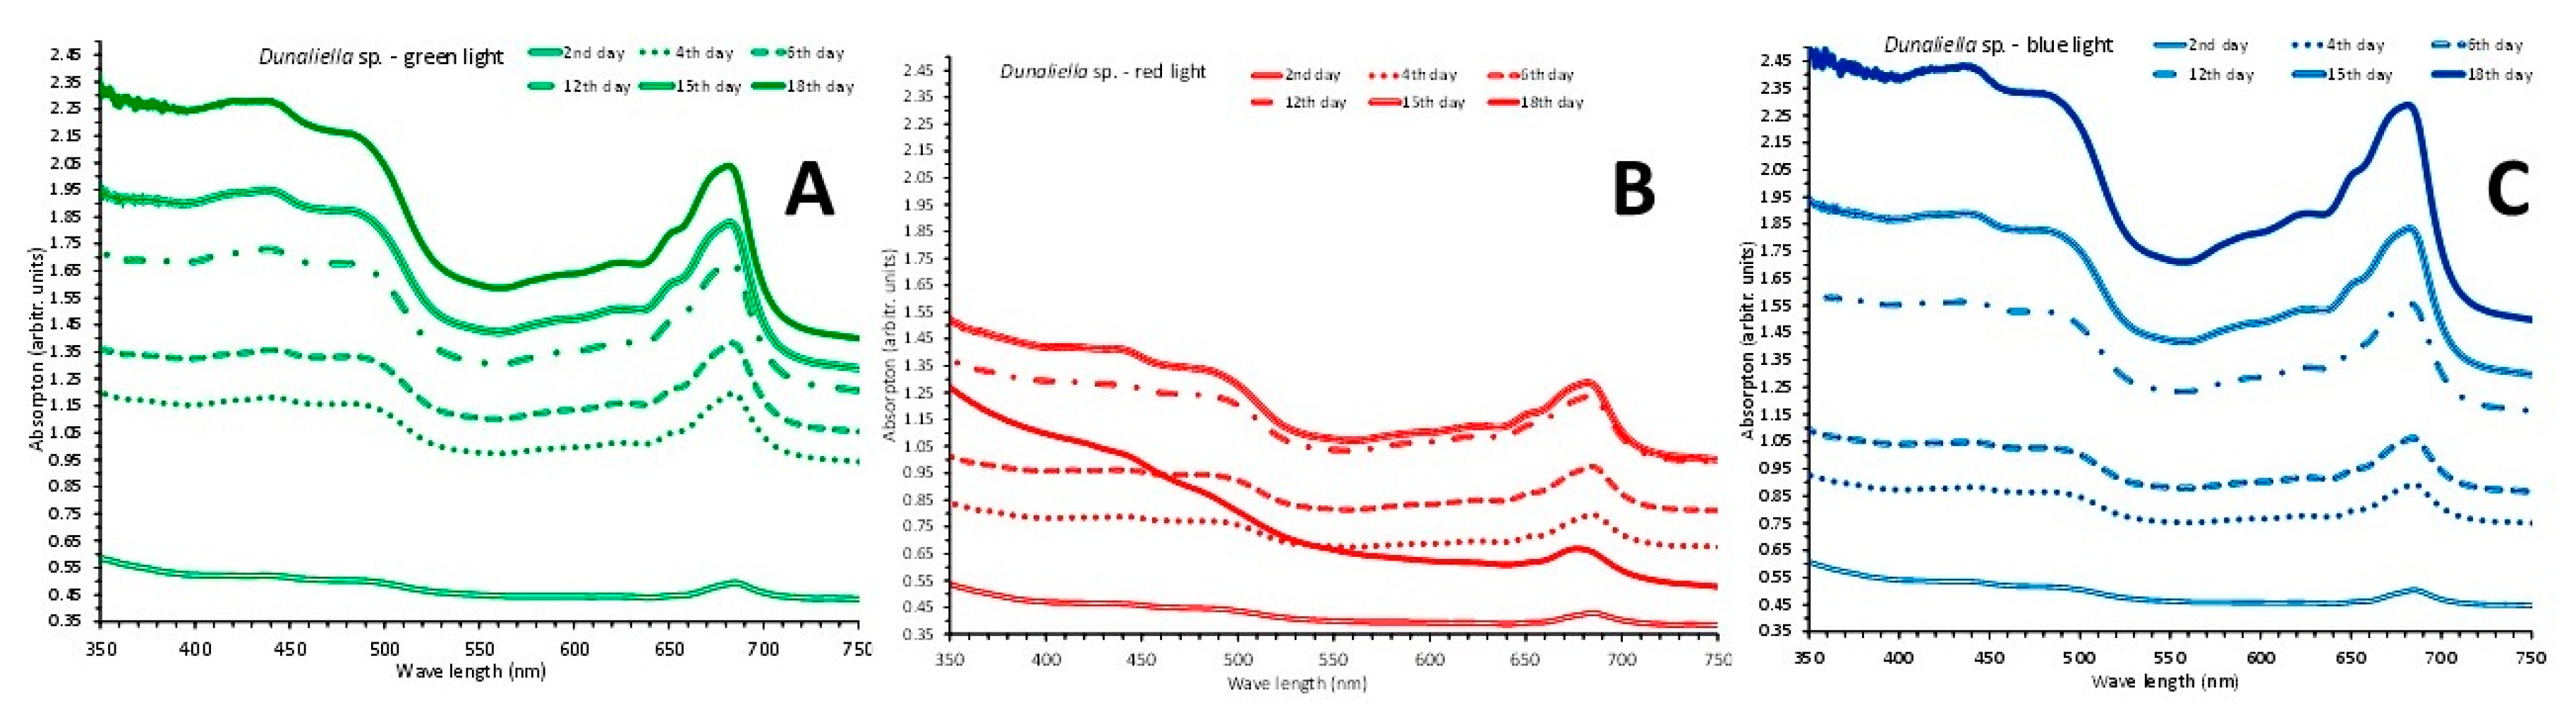
Figure 6.
A: Regression line of cell density (in cells/mL ± SD) vs optical density (OD) at 750 nm for all colors. B and C: Regression lines of chlorophyll-a, chlorophyll-b and total carotenoids concentration as μg/mL ± SD vs OD at each wavelength exhibiting the maximum absorbance for each pigment (B) and versus the OD at the wave length of 750 nm (C), in Dunaliella cultures, using data from all colors.
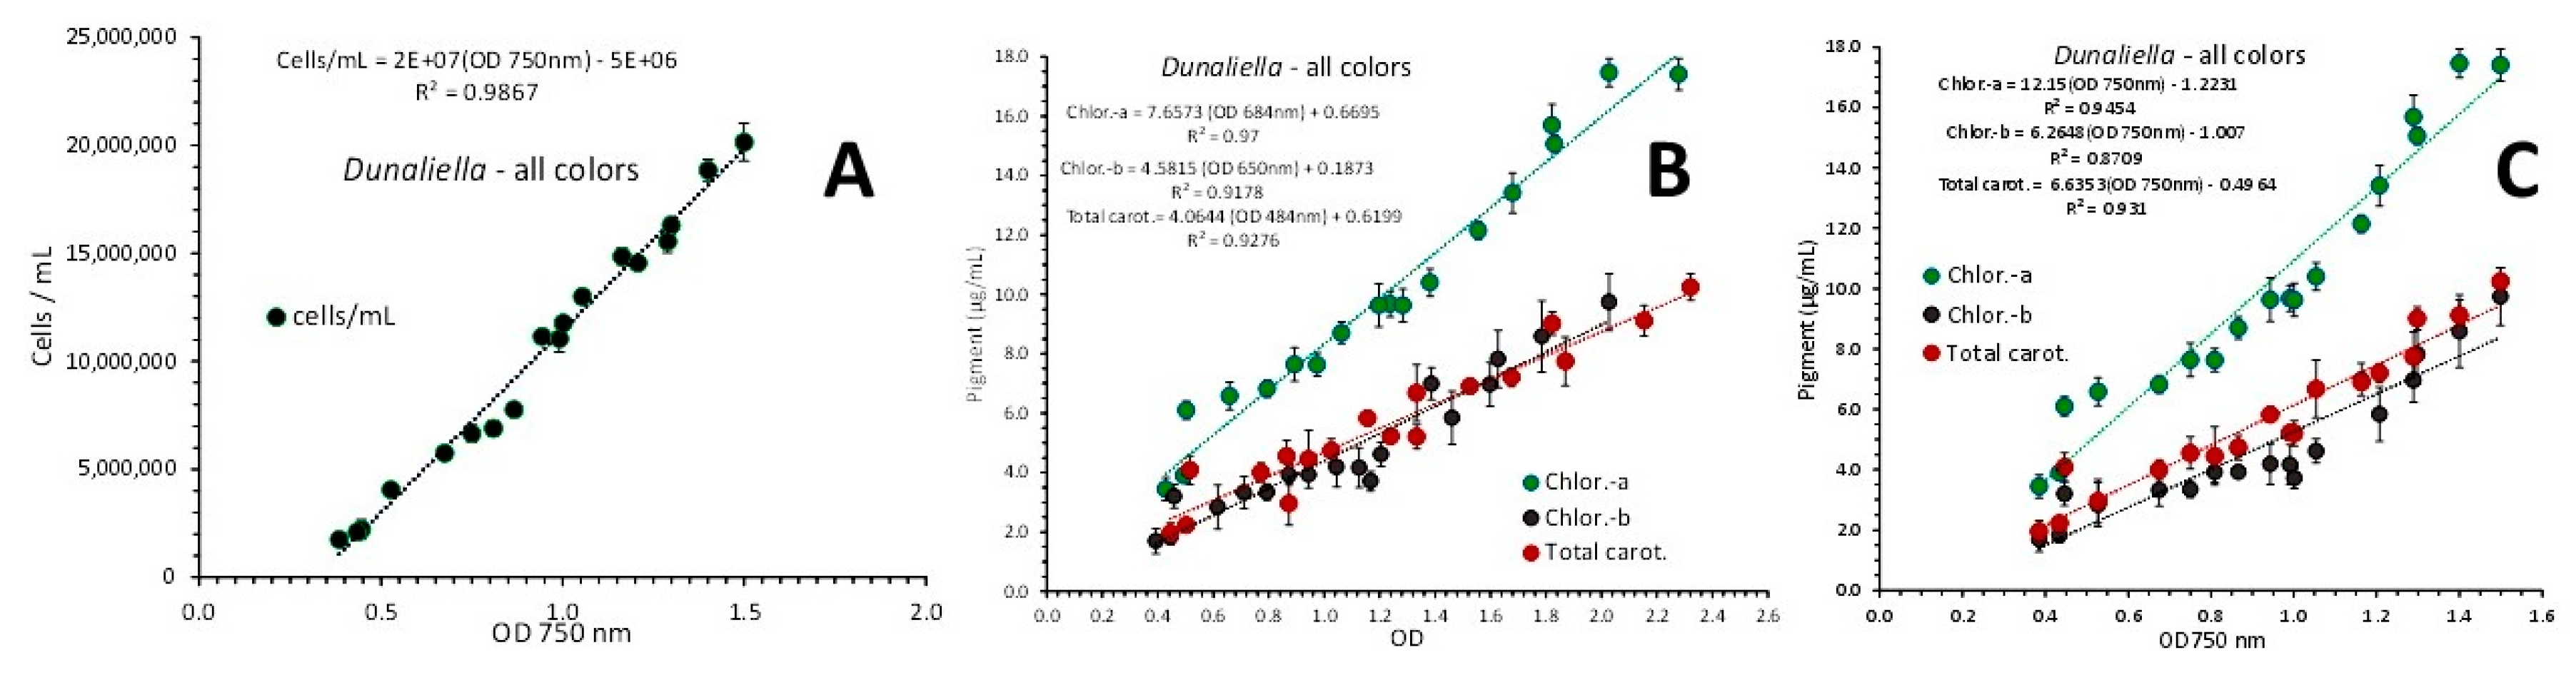
Figure 7.
Regression lines of chlorophyll-a, chlorophyll-b and total carotenoids concentration as μg/mL ± SD vs OD at each wavelength exhibiting the maximum absorbance for each pigment and versus the OD at the wave length of 750 nm (C), in Dunaliella cultures, using data from blue (A and D), red (B and E) and green light (C and F).
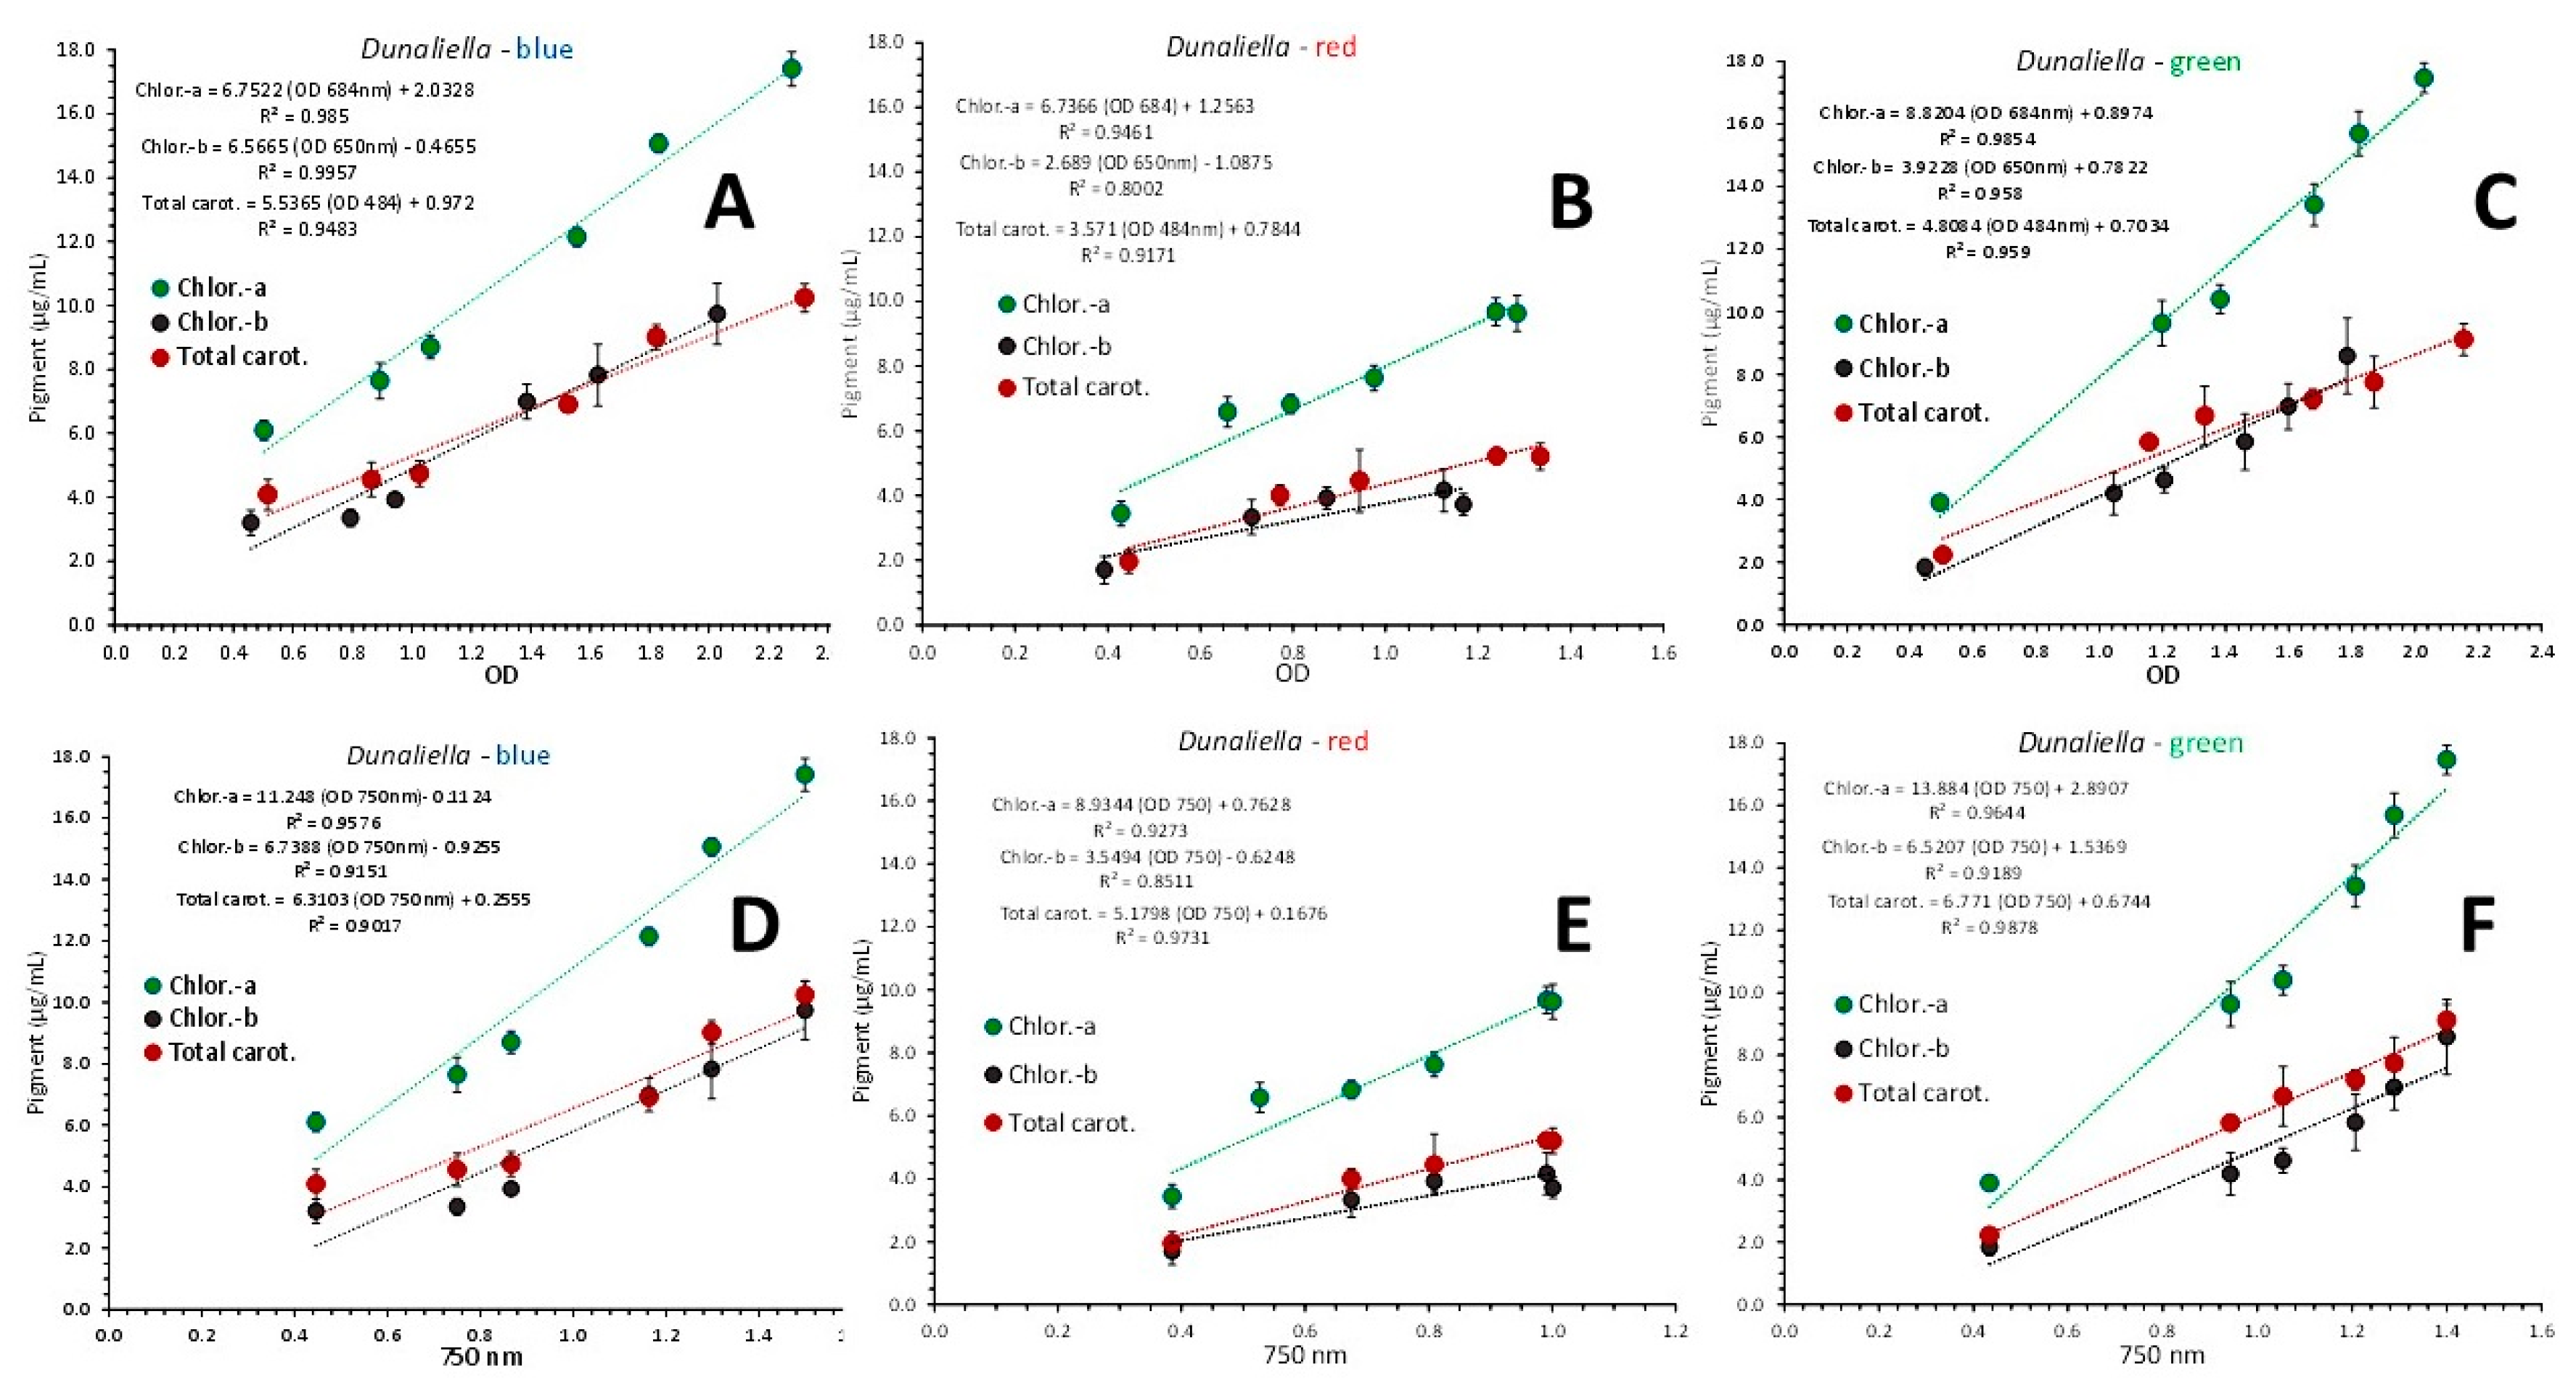
Figure 8.
Pigment content in μg/mL ± SE for chlorophyll-a, chlorophyll-b, total carotenoids and β-carotene at 6 different culture densities of Dunaliella sp. in each light color used at different cell densities along the culture period starting from the 3rd day and every 3 days till the 18th day. Each set of measurements for each light color is depicted by the appropriate coloration.
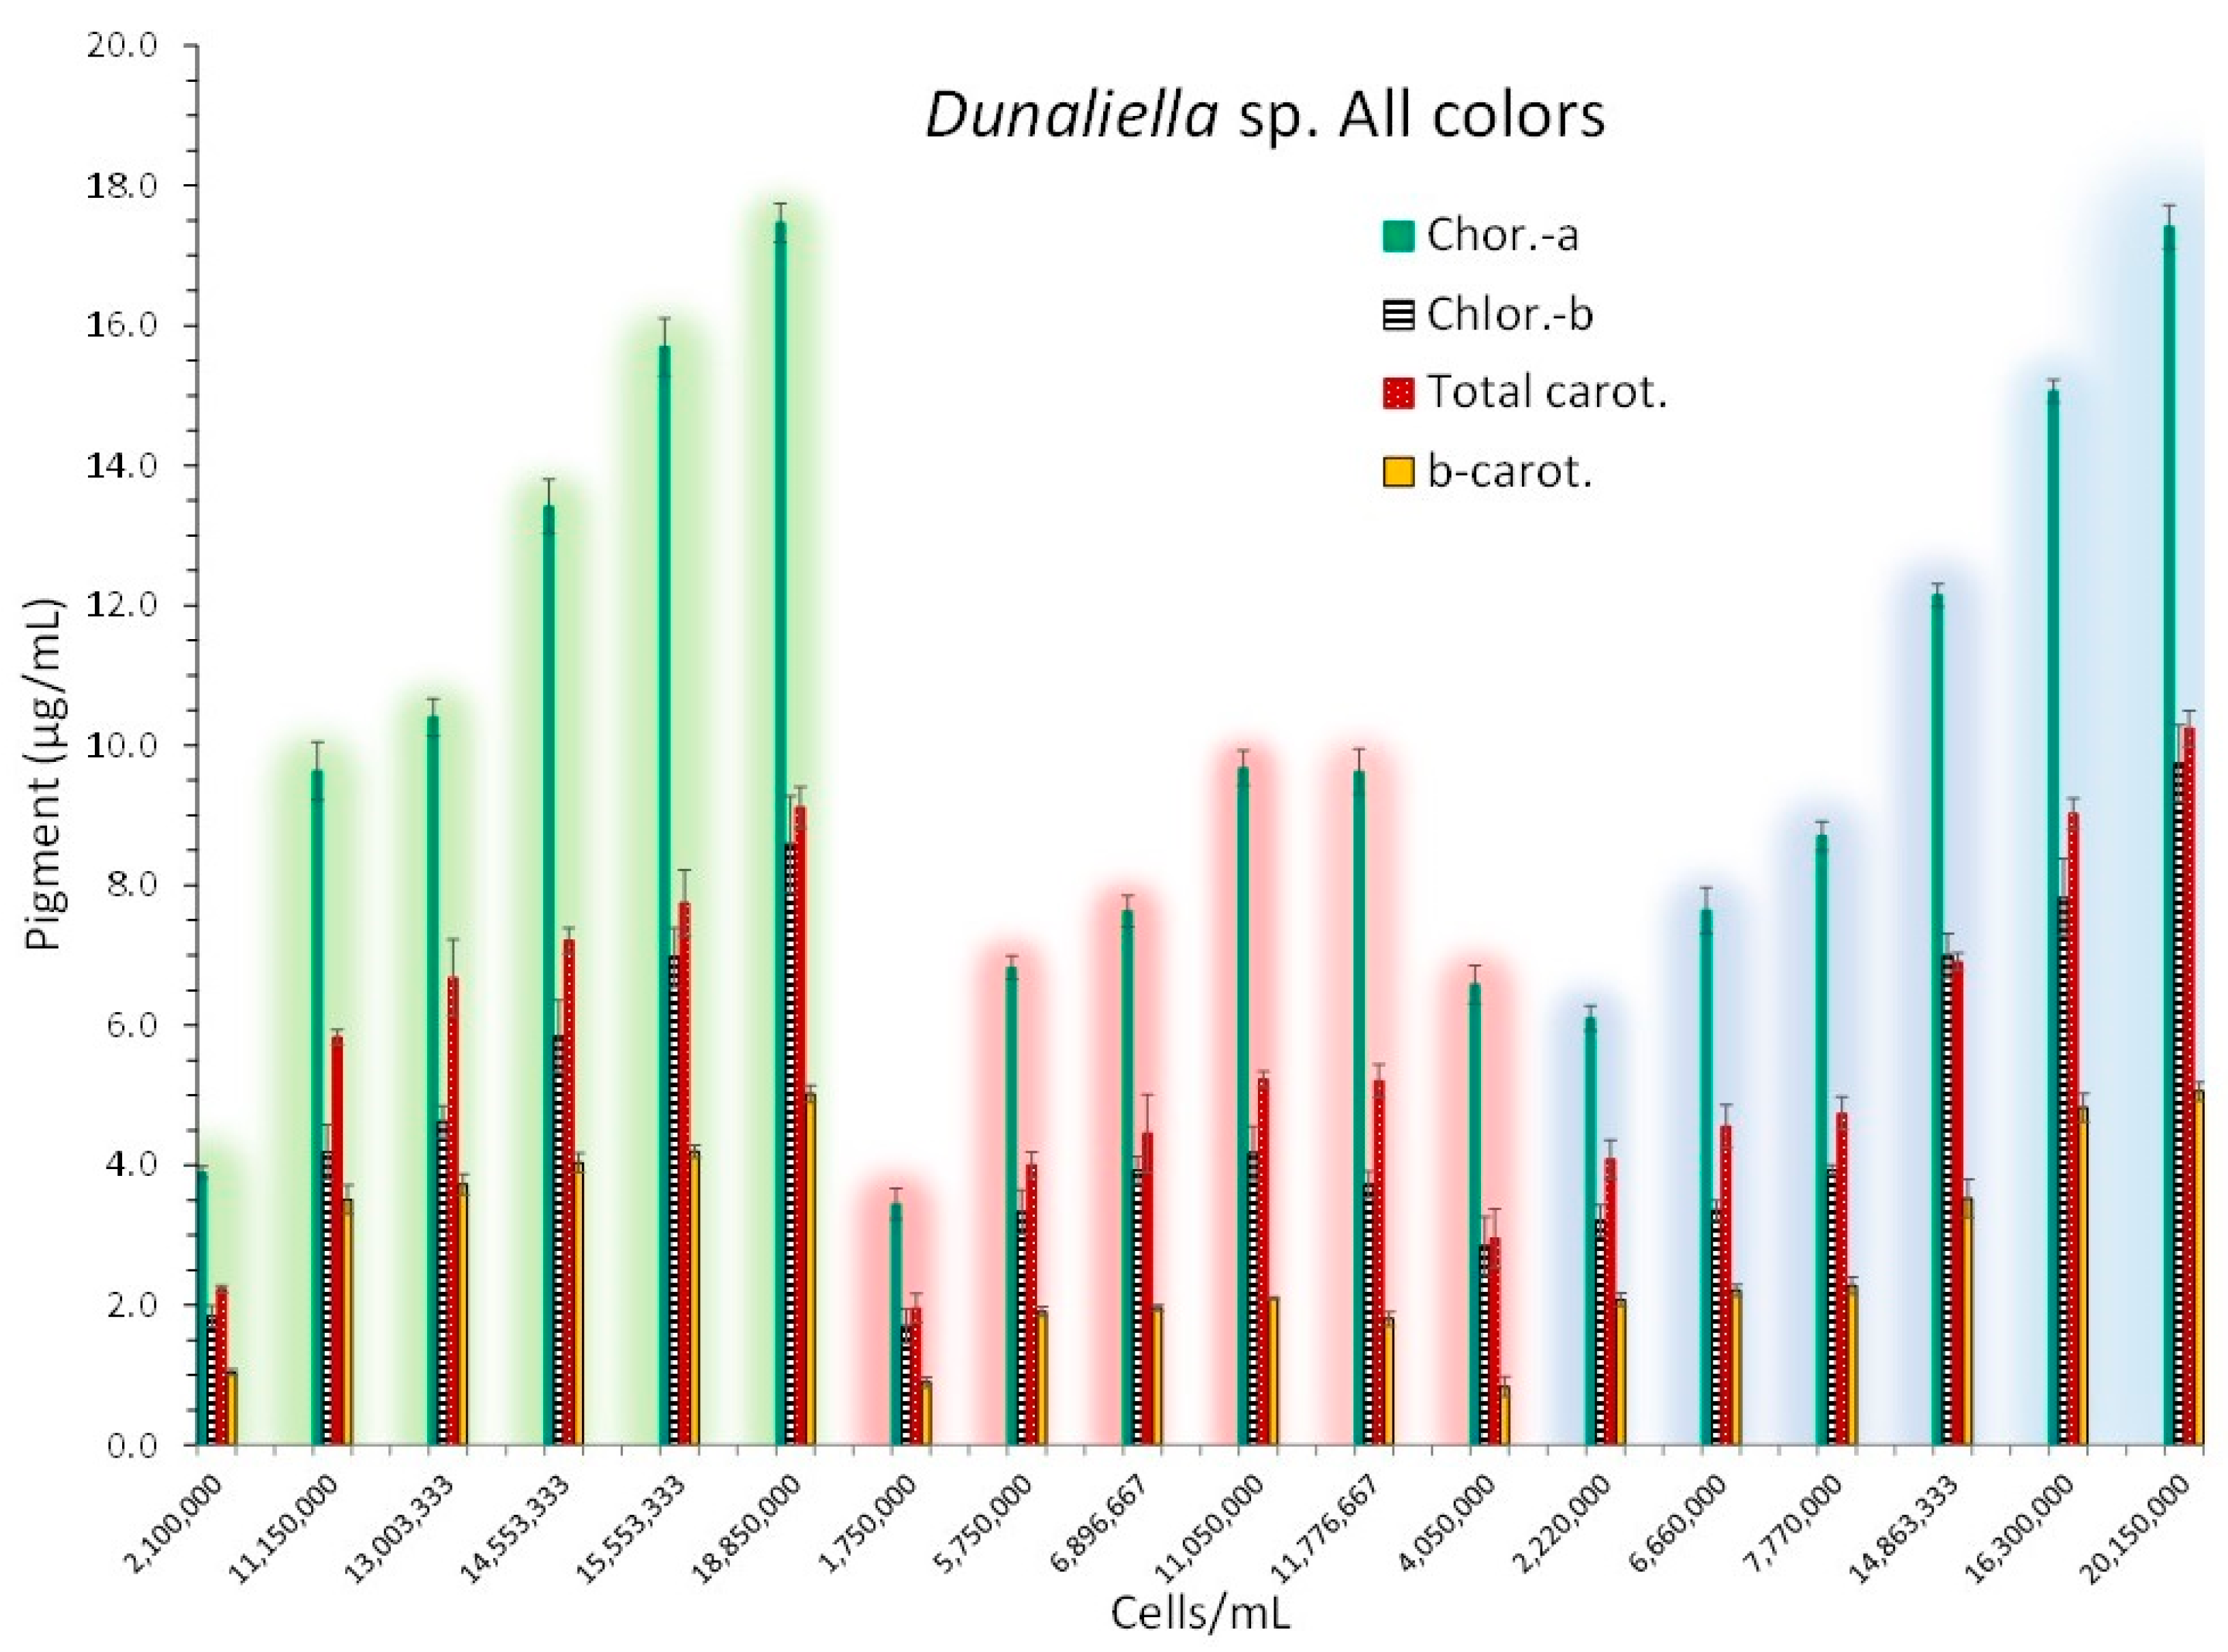
Figure 9.
The absorption spectra at 5 consecutive days (3rd to 15th) taken every 3 days with their respective culture density (in g d.w./L) of the cultures of Anabaena sp. exposed to low 2000 lux (A) and high illumination of 8000 lux (B).
Figure 9.
The absorption spectra at 5 consecutive days (3rd to 15th) taken every 3 days with their respective culture density (in g d.w./L) of the cultures of Anabaena sp. exposed to low 2000 lux (A) and high illumination of 8000 lux (B).
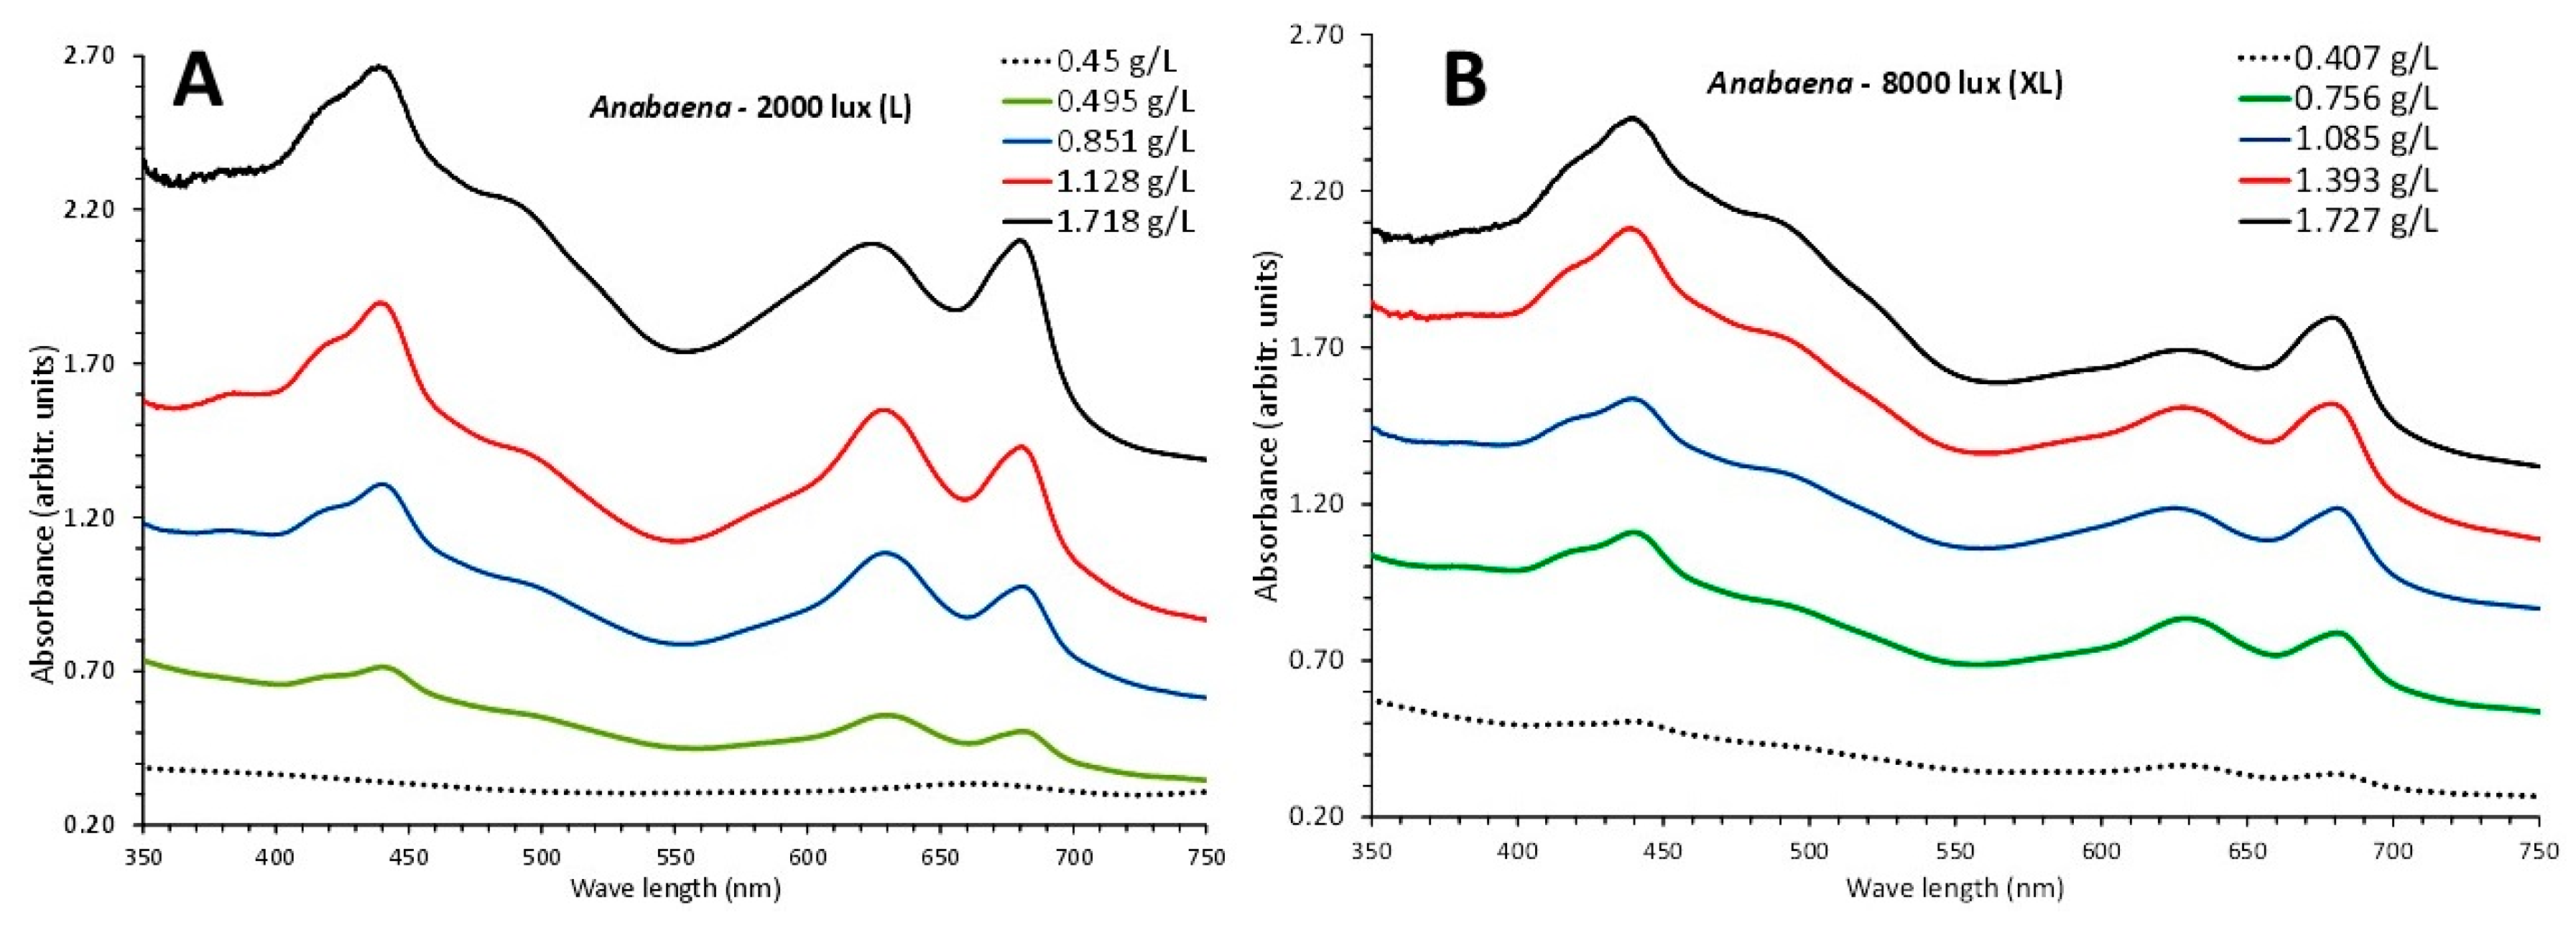
Figure 10.
A: Regression line of cell density (in g d.w./L ± SD) vs optical density (OD) at 750 nm using values from both light regimes. B and C: Regression lines of chlorophyll-a, and total carotenoids concentration as μg/mL ± SE vs OD at each wavelength exhibiting the maximum absorbance for each pigment (B) and versus the OD at the wave length of 750 nm (C) in Anabaena sp. culture using values from both light regimes.
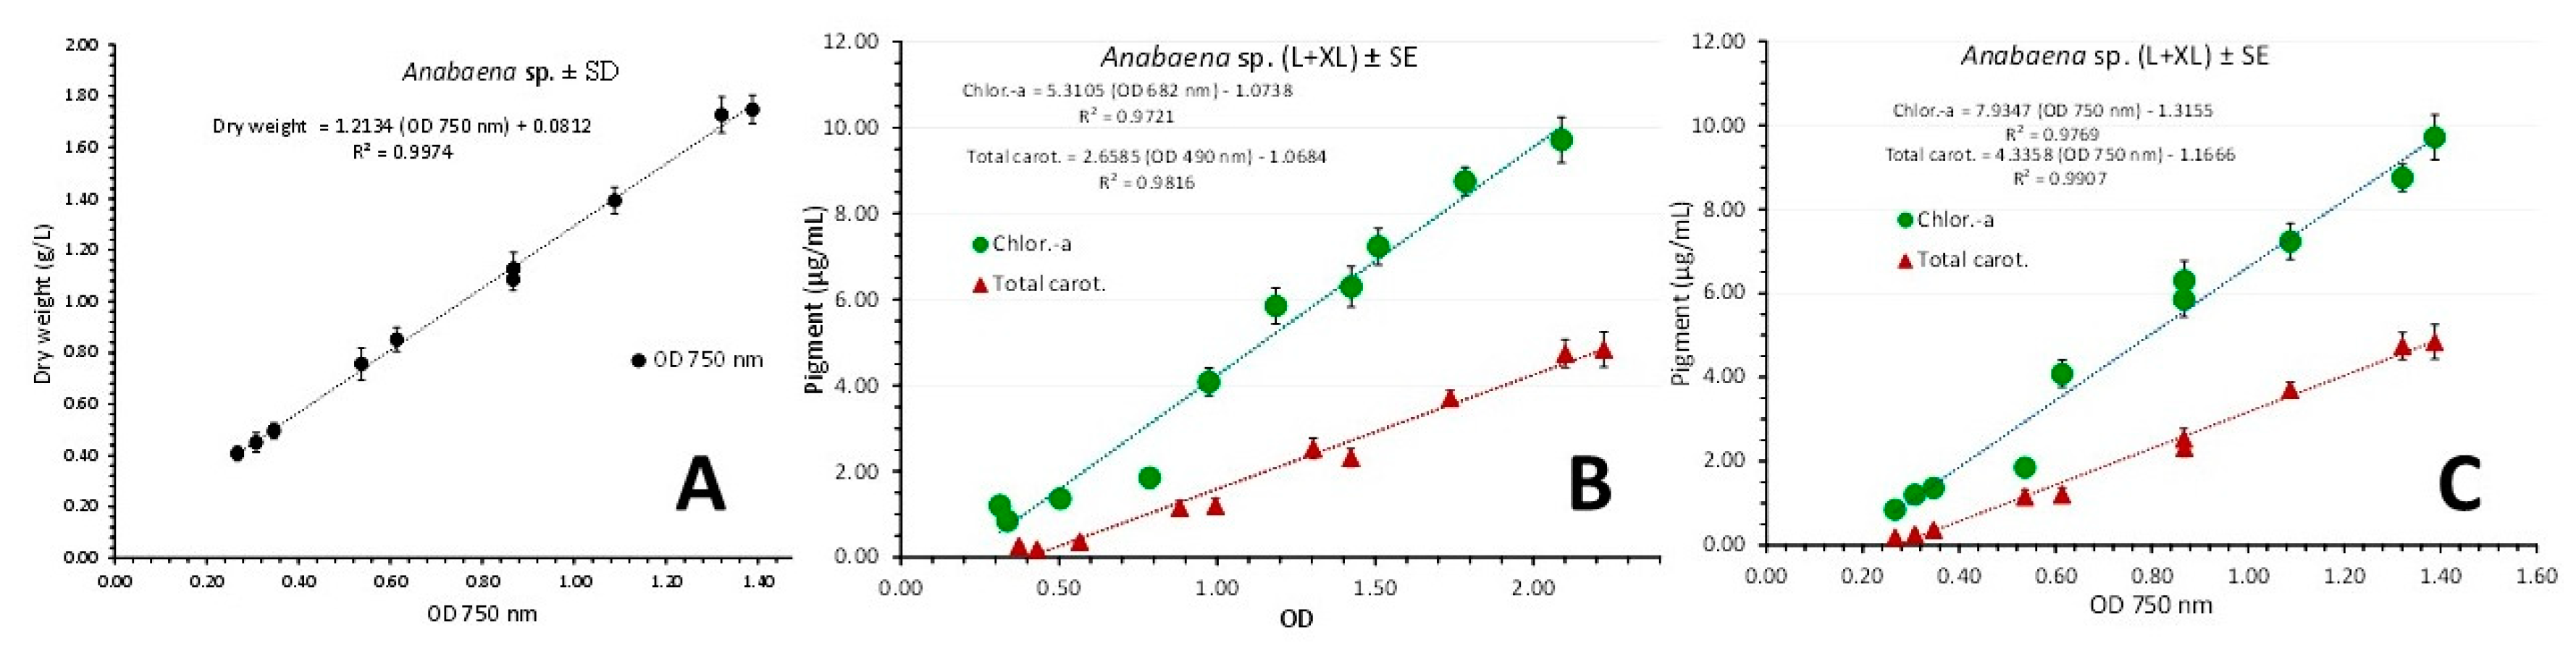
Figure 11.
Regression lines of chlorophyll-a and total carotenoids concentration as μg/mL ± SE vs OD at each wavelength exhibiting the maximum absorbance for each pigment in L=light (A) and XL-light (B) and versus the OD at the wave length of 750 nm in L and XL-light (C and D) respectively in Anabaena sp. culture.
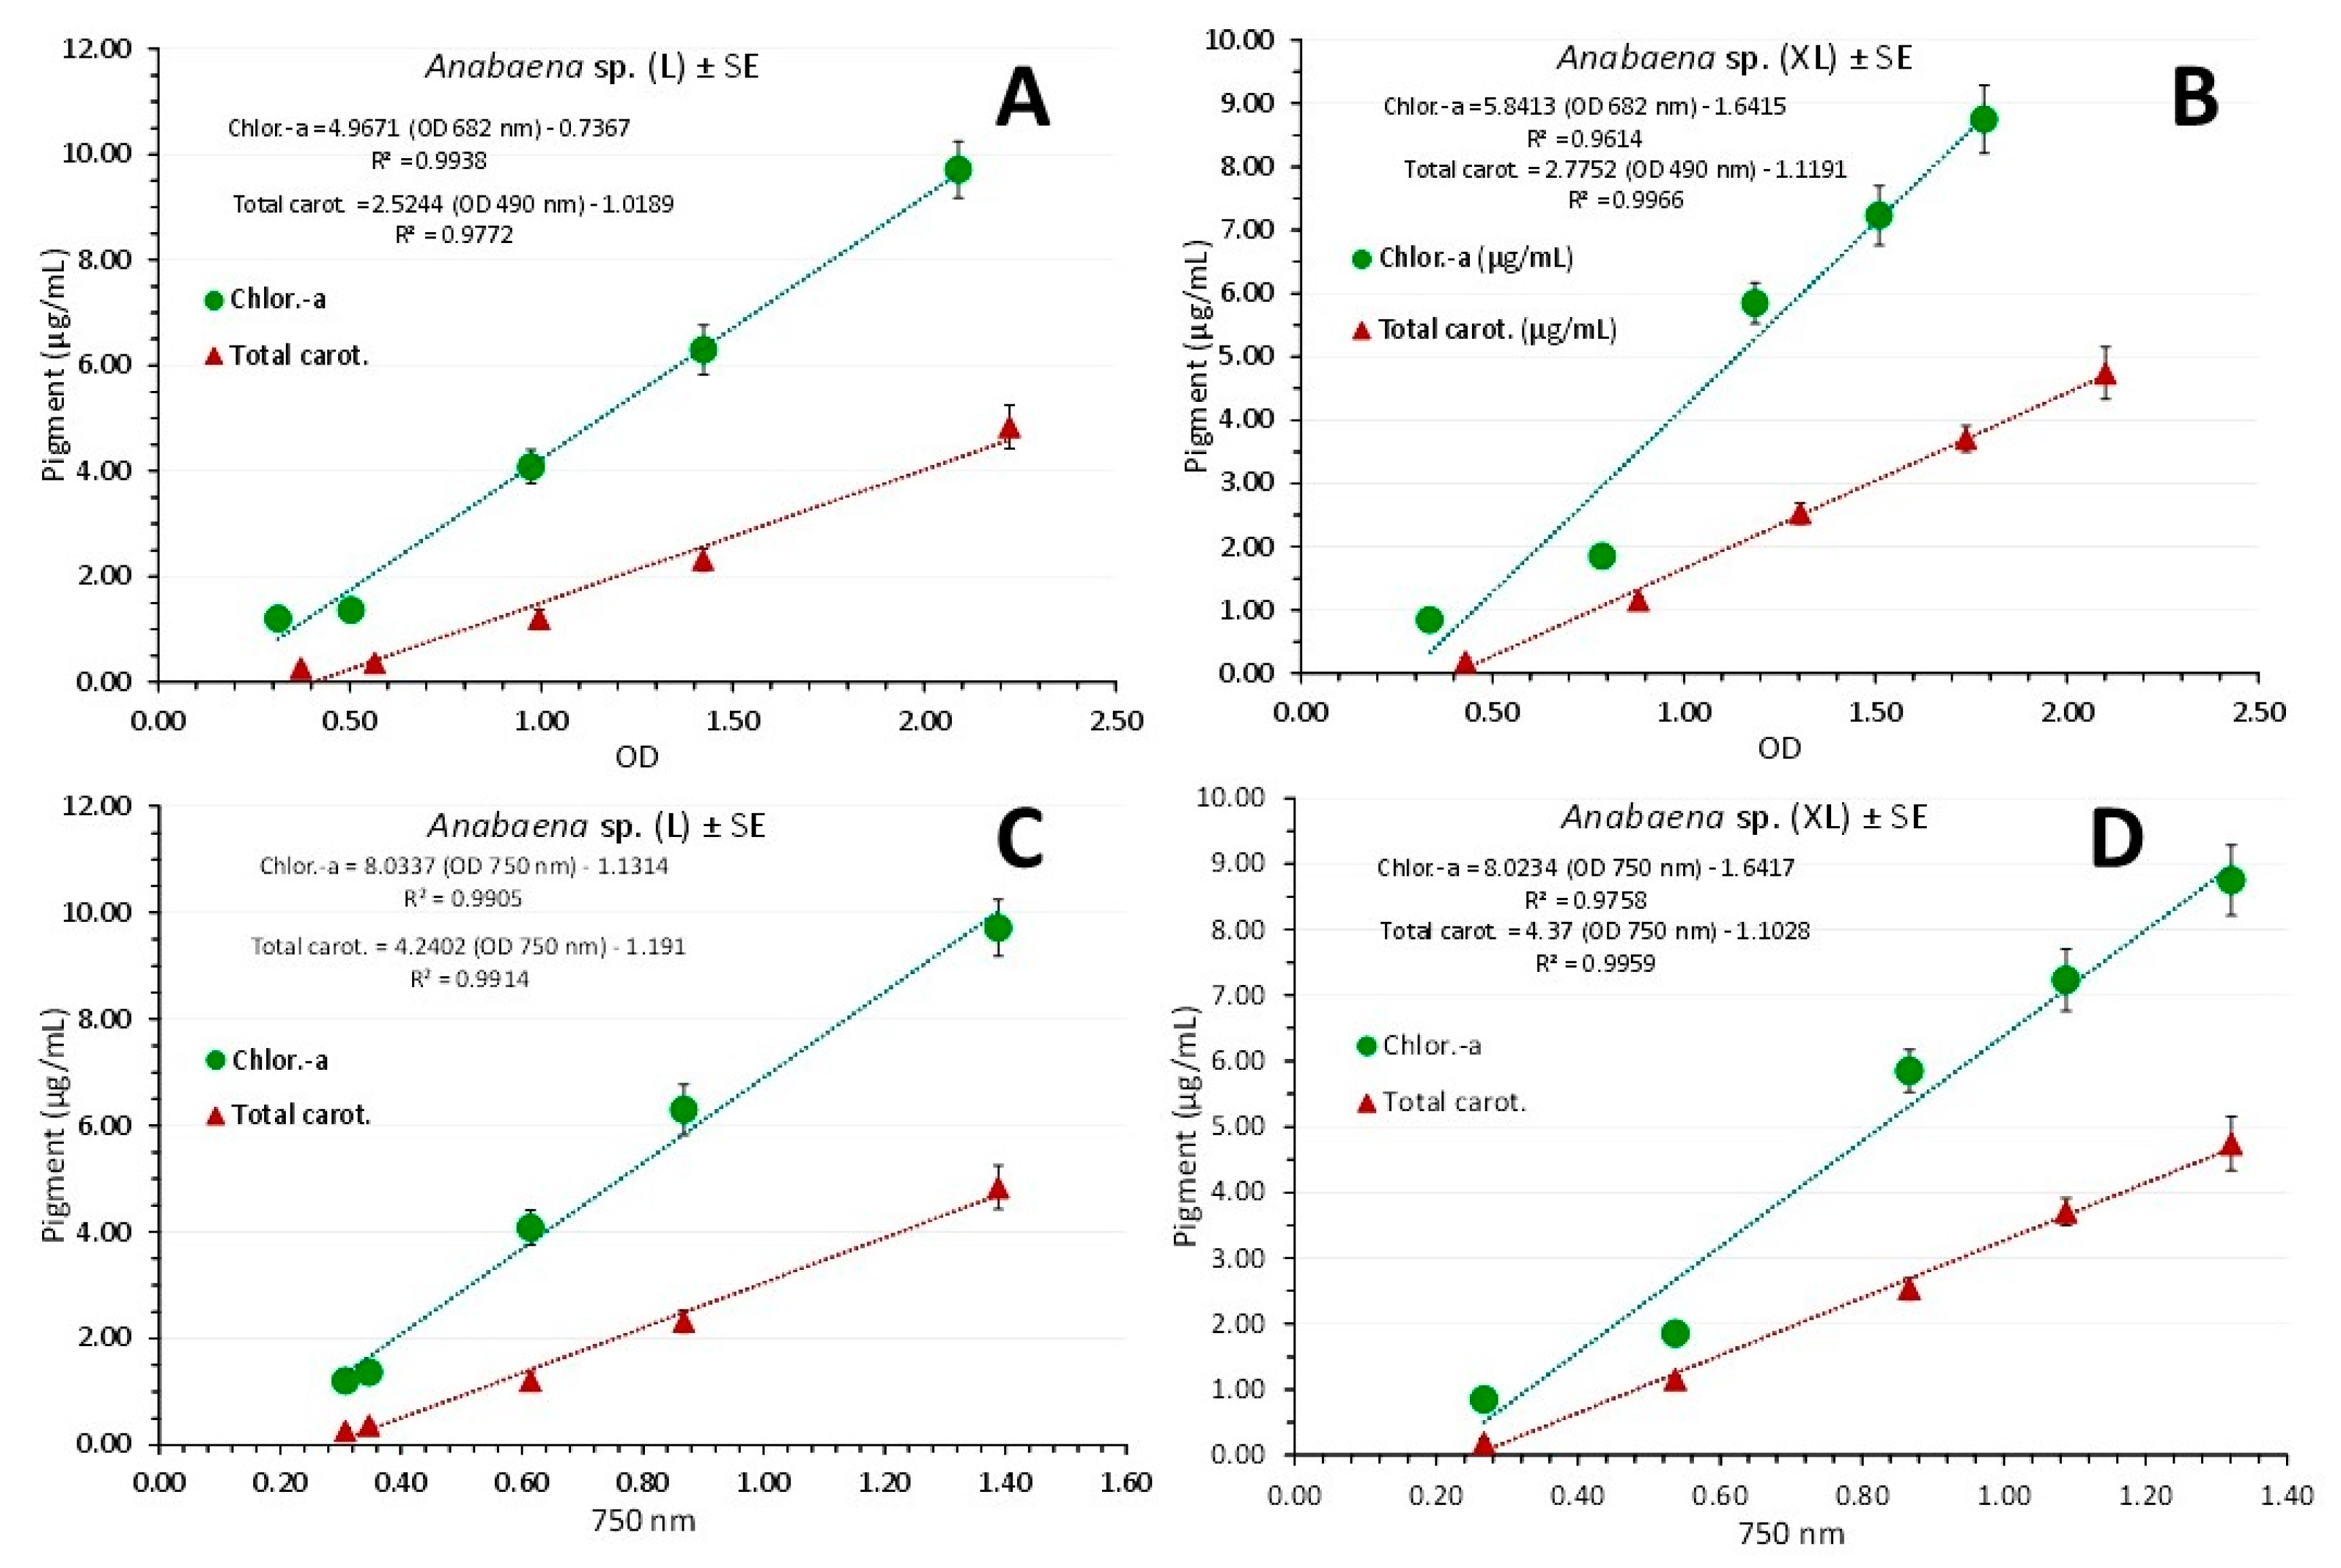
Figure 12.
Regression lines of phycocyanin concentration as mg/mL ± SE vs OD at its wavelength (630 nm) exhibiting the maximum absorbance in pooled data from L+XL-light (A) and versus the OD at the wave length of 750 nm (B). The same using data from each light regime for 630 nm (C) and 750 nm (D) in Anabaena sp. culture.
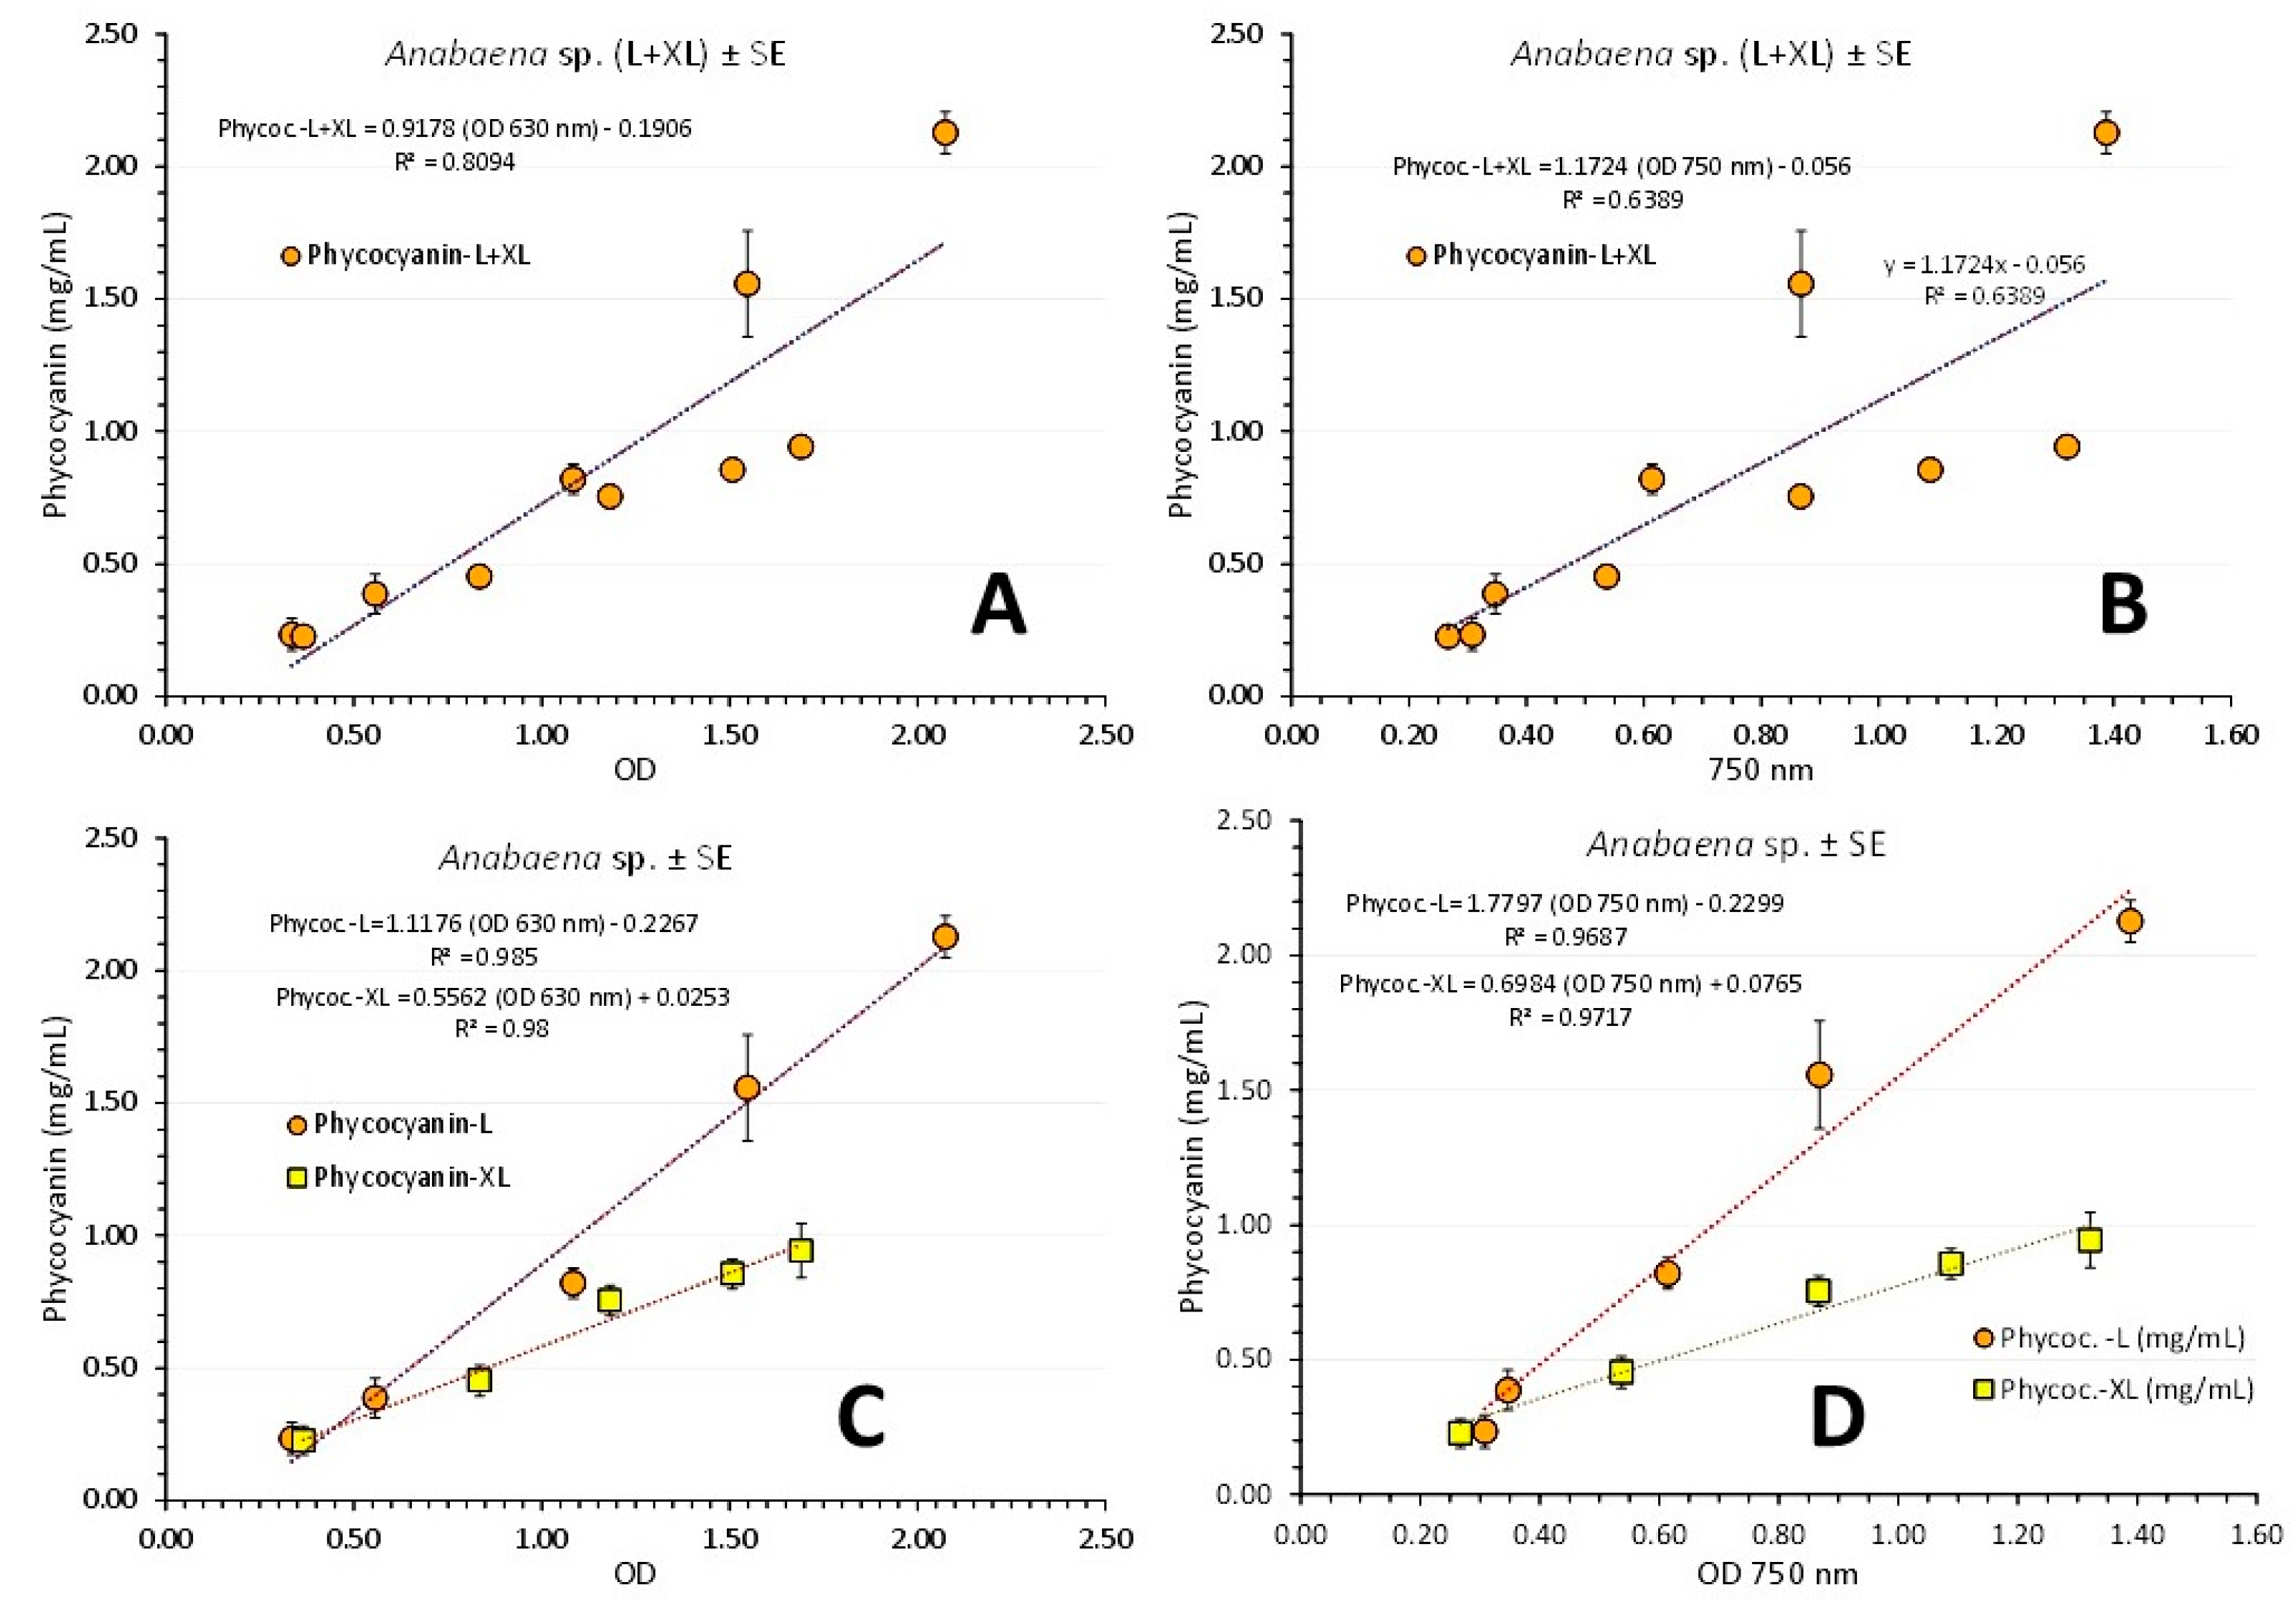
Figure 13.
Pigment content in μg/mL ± SE for chlorophyll-a and total carotenoids and in mg/mL ± SE for phycocyanin at 5 different culture densities of Anabaena sp. in L-light (A) and XL-light (B) and additionally for phycocyanin yield in mg/g d.w. ± SE for L-light (C) and XL-light (D). The five biomass densities on “X“ axis correspond to 3rd, 6th, 9th, 12th and 15th days of culture.
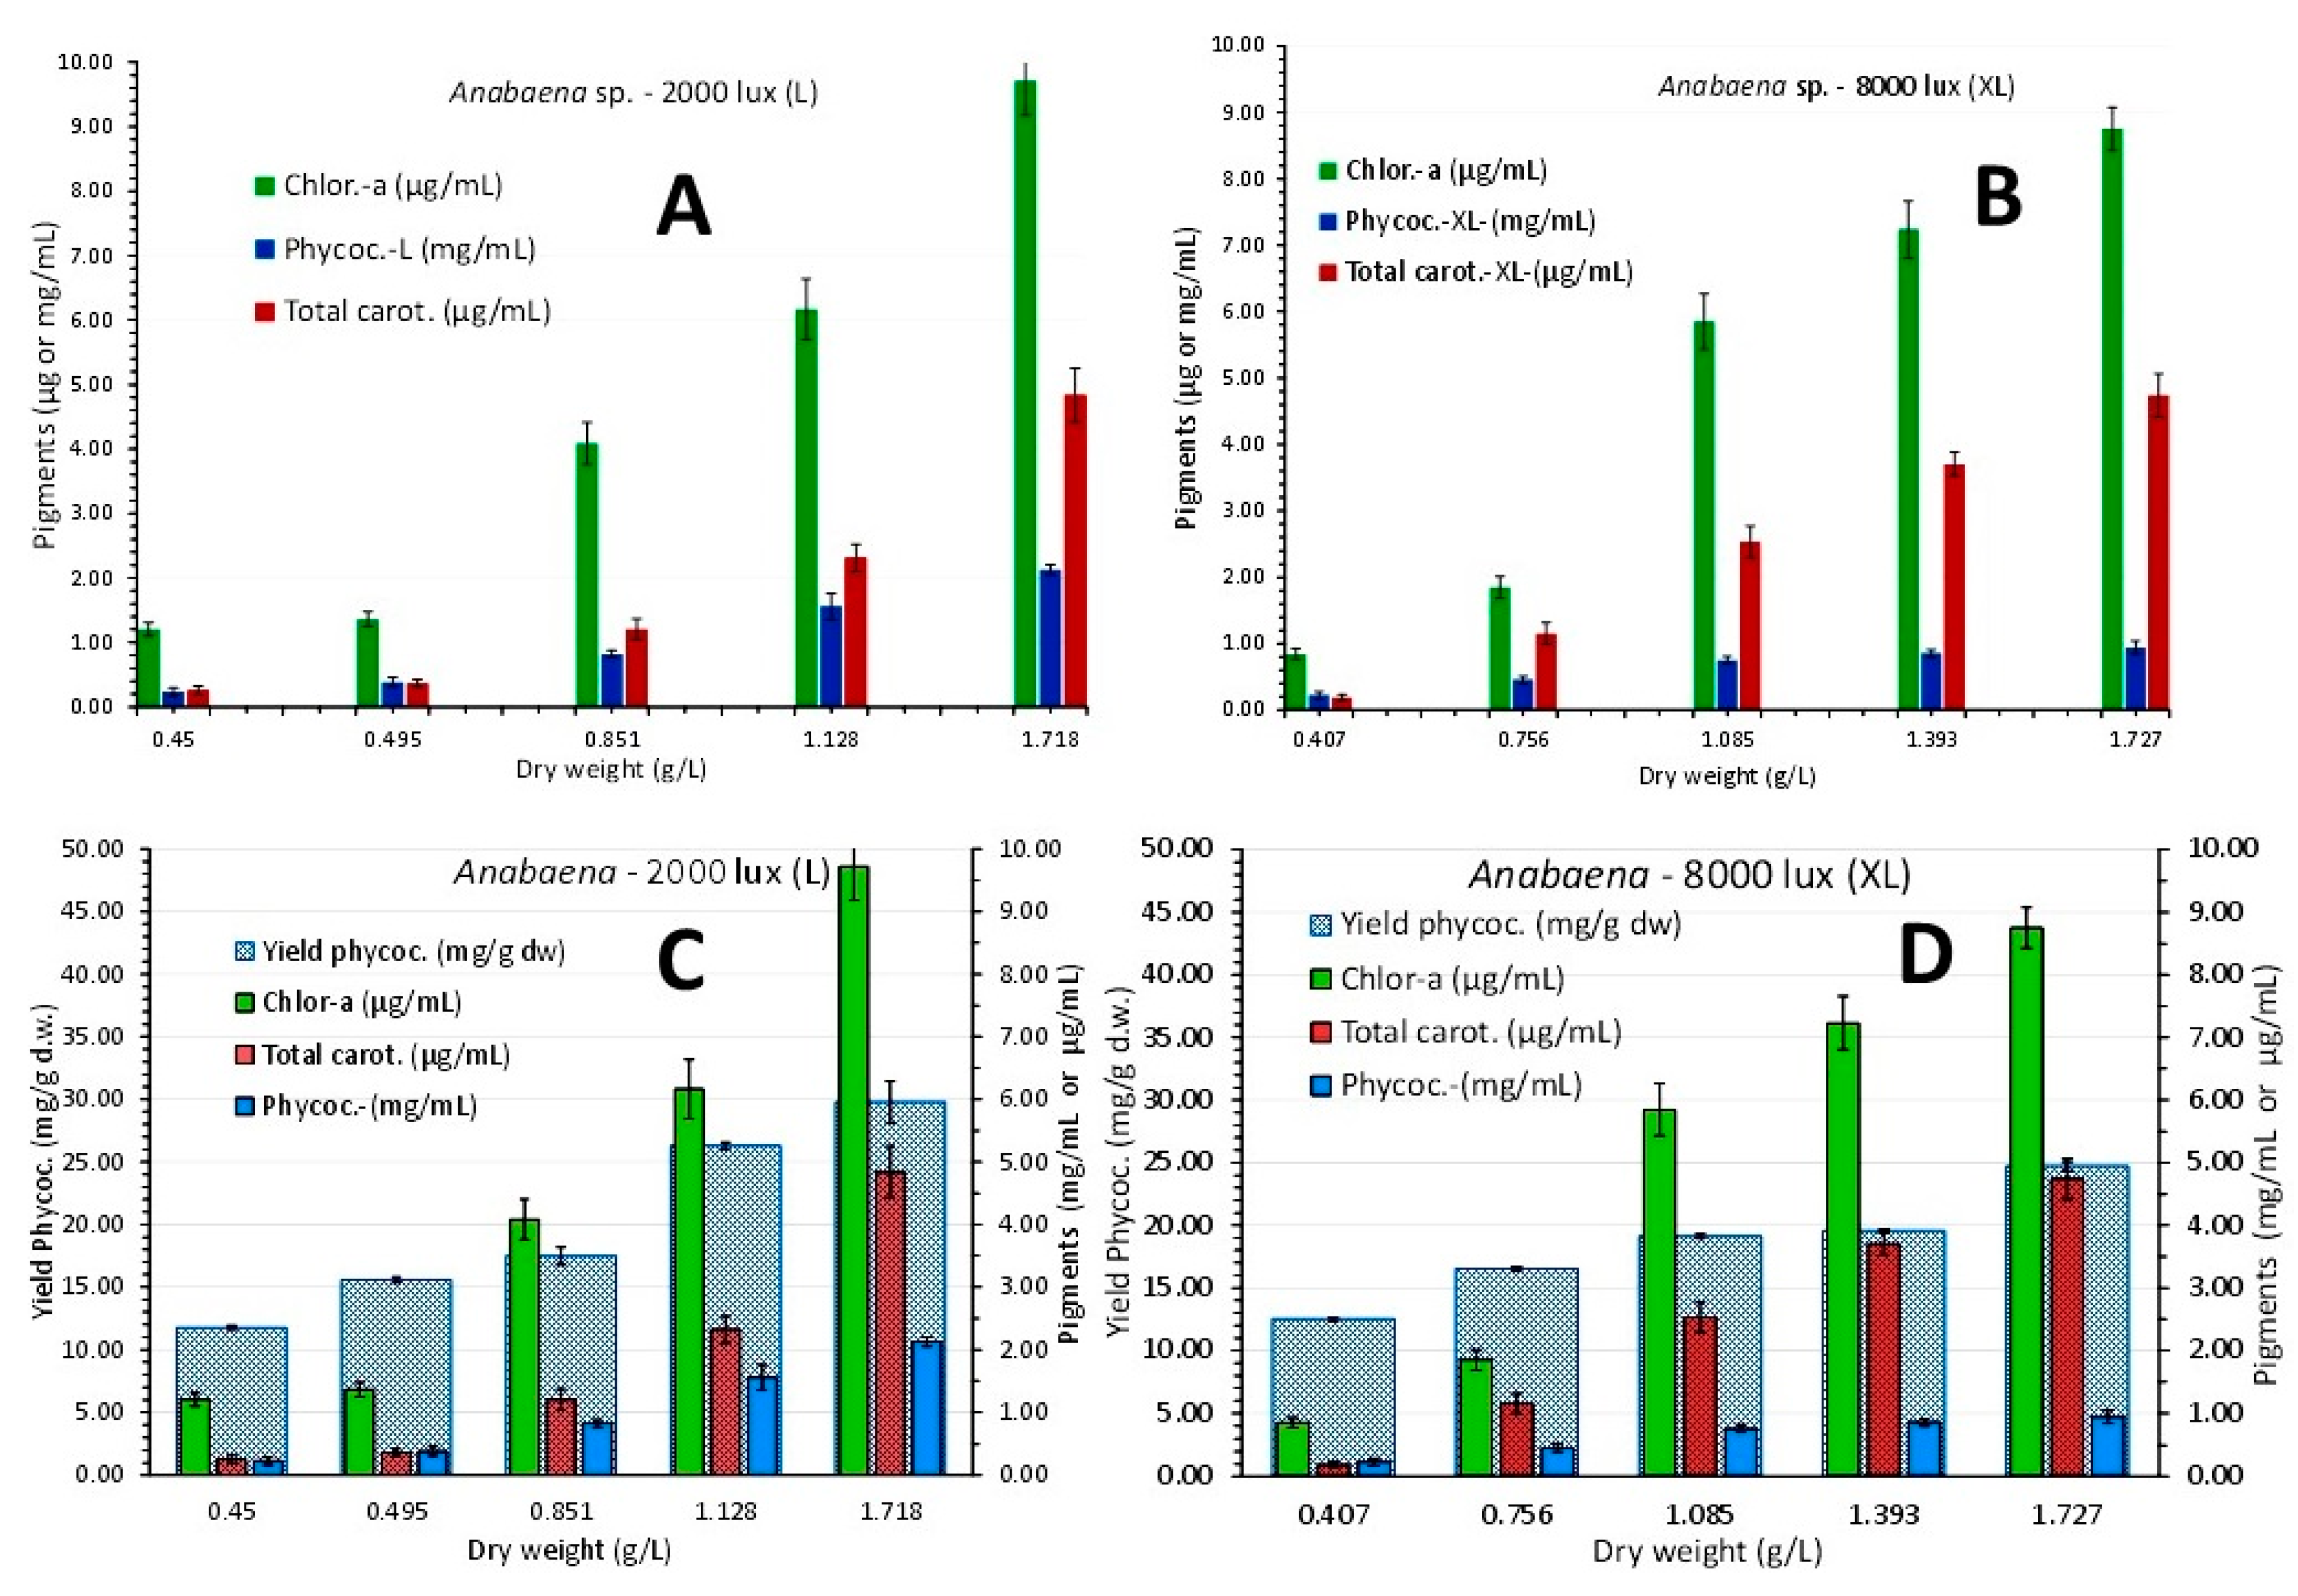
Figure 14.
The absorption spectra at 7 different days (2nd – 3rd – 6th – 10th - 12th -16th -19th) of the cultures of Anabaena sp. exposed to green (A), blue (B) and red (C) light.
Figure 14.
The absorption spectra at 7 different days (2nd – 3rd – 6th – 10th - 12th -16th -19th) of the cultures of Anabaena sp. exposed to green (A), blue (B) and red (C) light.
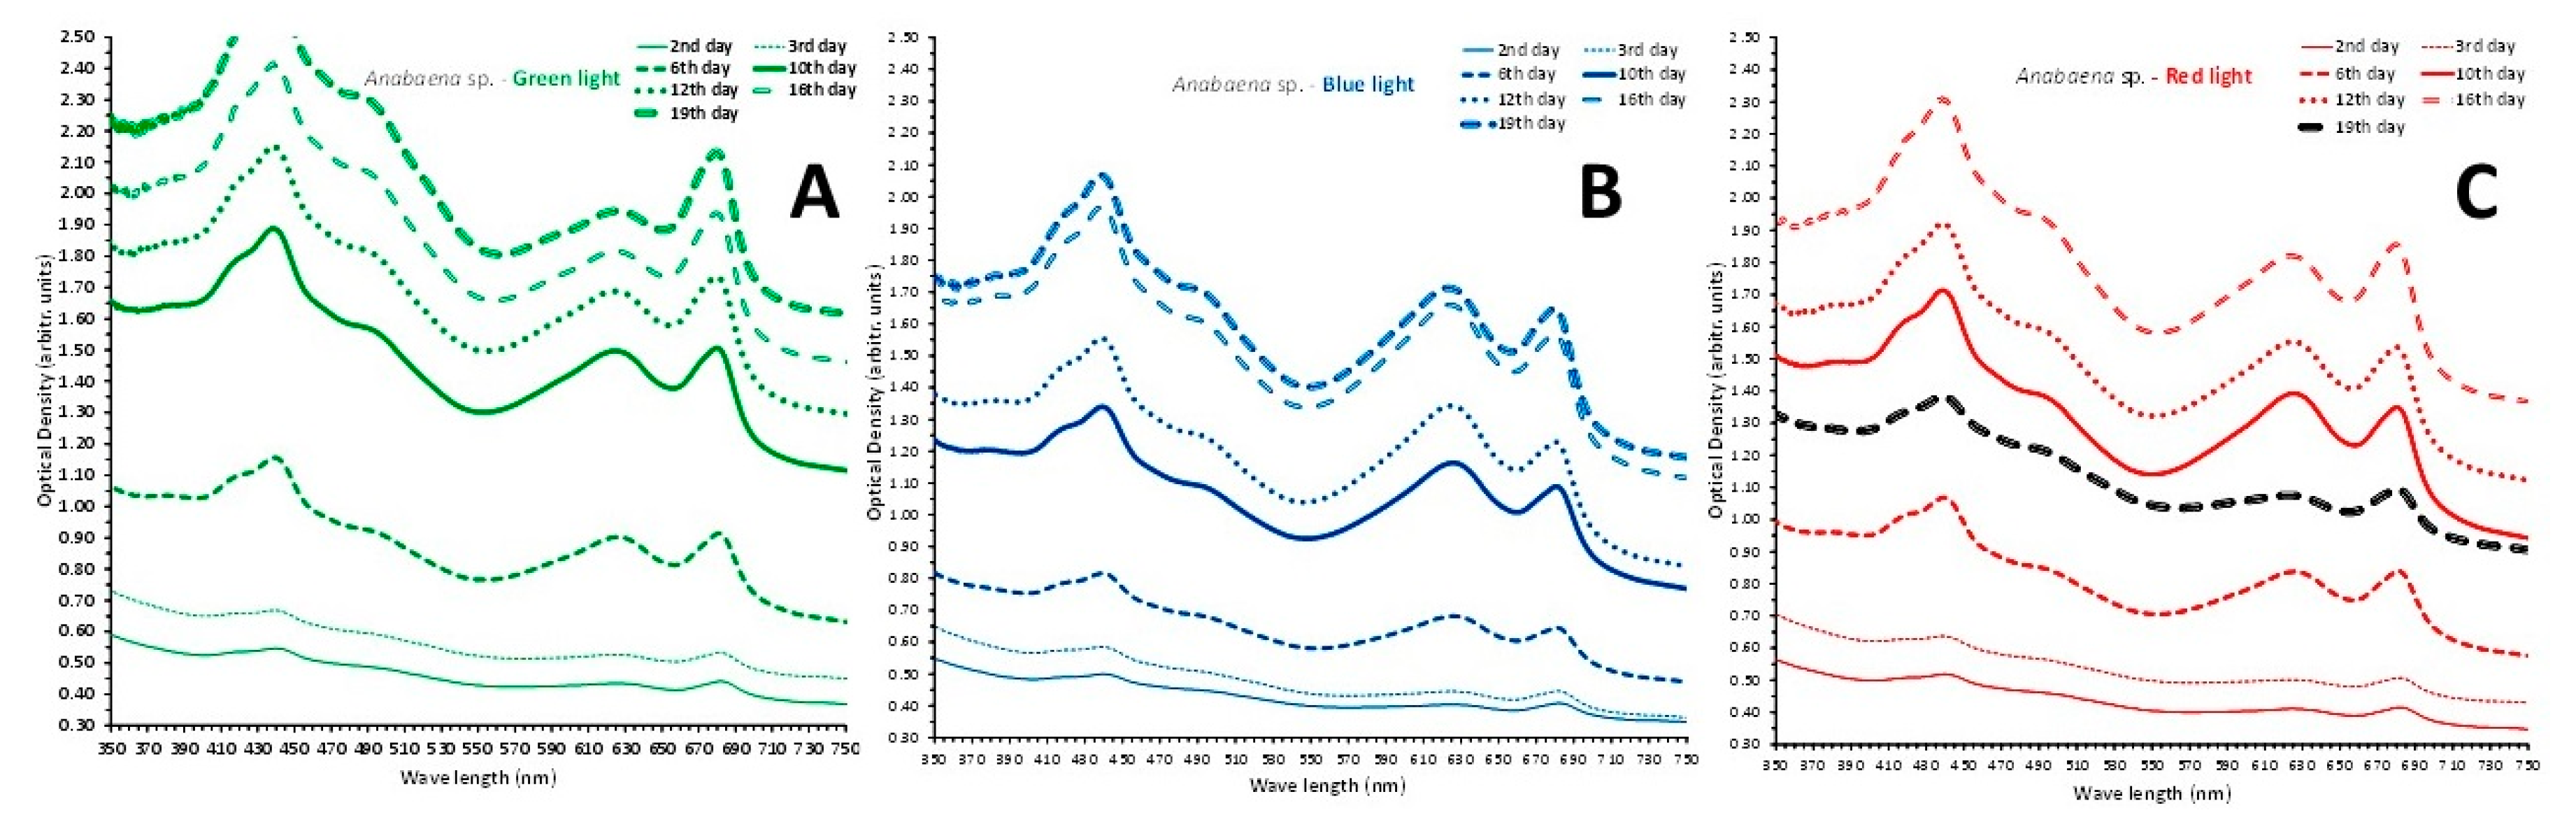
Figure 15.
A: Regression line of cell density (in g d.w./L) vs optical density (OD) at 750 nm using values from all colored light regimes. B and C: Regression lines of chlorophyll-a, as μg/mL ± SE vs OD at 682 nm (B) and versus the OD at the wave length of 750 nm (C) in Anabaena sp. culture using values from all colored light regimes.
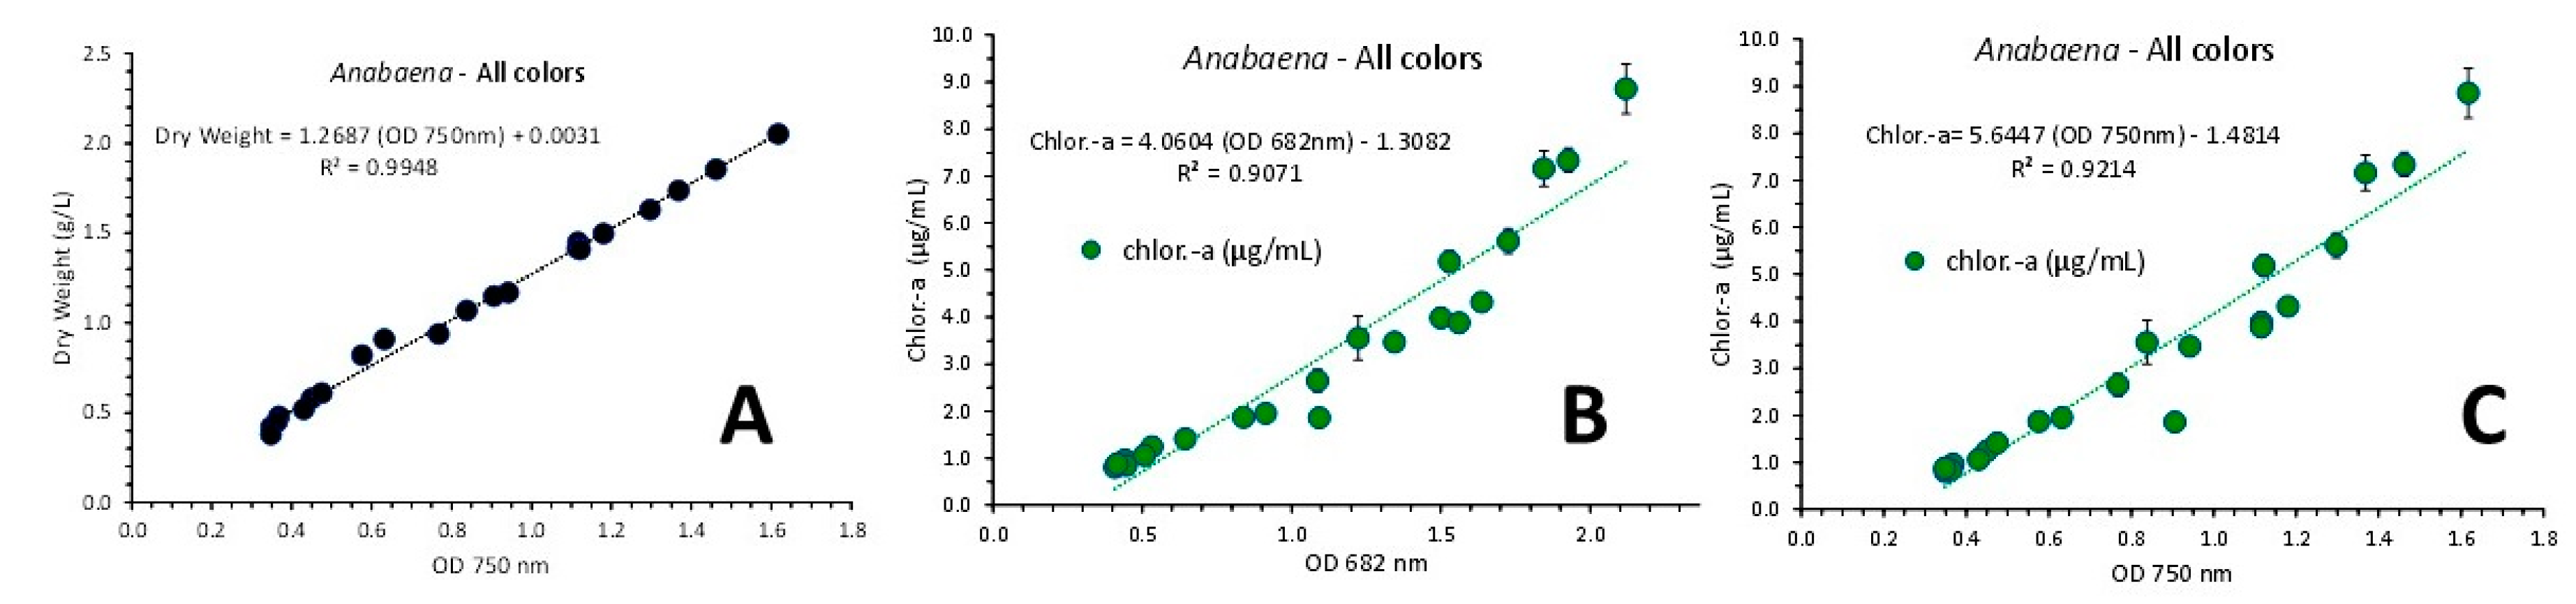
Figure 16.
Regression lines of chlorophyll-a, as μg/mL ± SE vs OD at 682 nm in green (A), blue (B) and red (C) light and versus the OD at the wave length of 750 nm (D, E and F for green, blue and red color, respectively) in Anabaena sp. culture.
Figure 16.
Regression lines of chlorophyll-a, as μg/mL ± SE vs OD at 682 nm in green (A), blue (B) and red (C) light and versus the OD at the wave length of 750 nm (D, E and F for green, blue and red color, respectively) in Anabaena sp. culture.
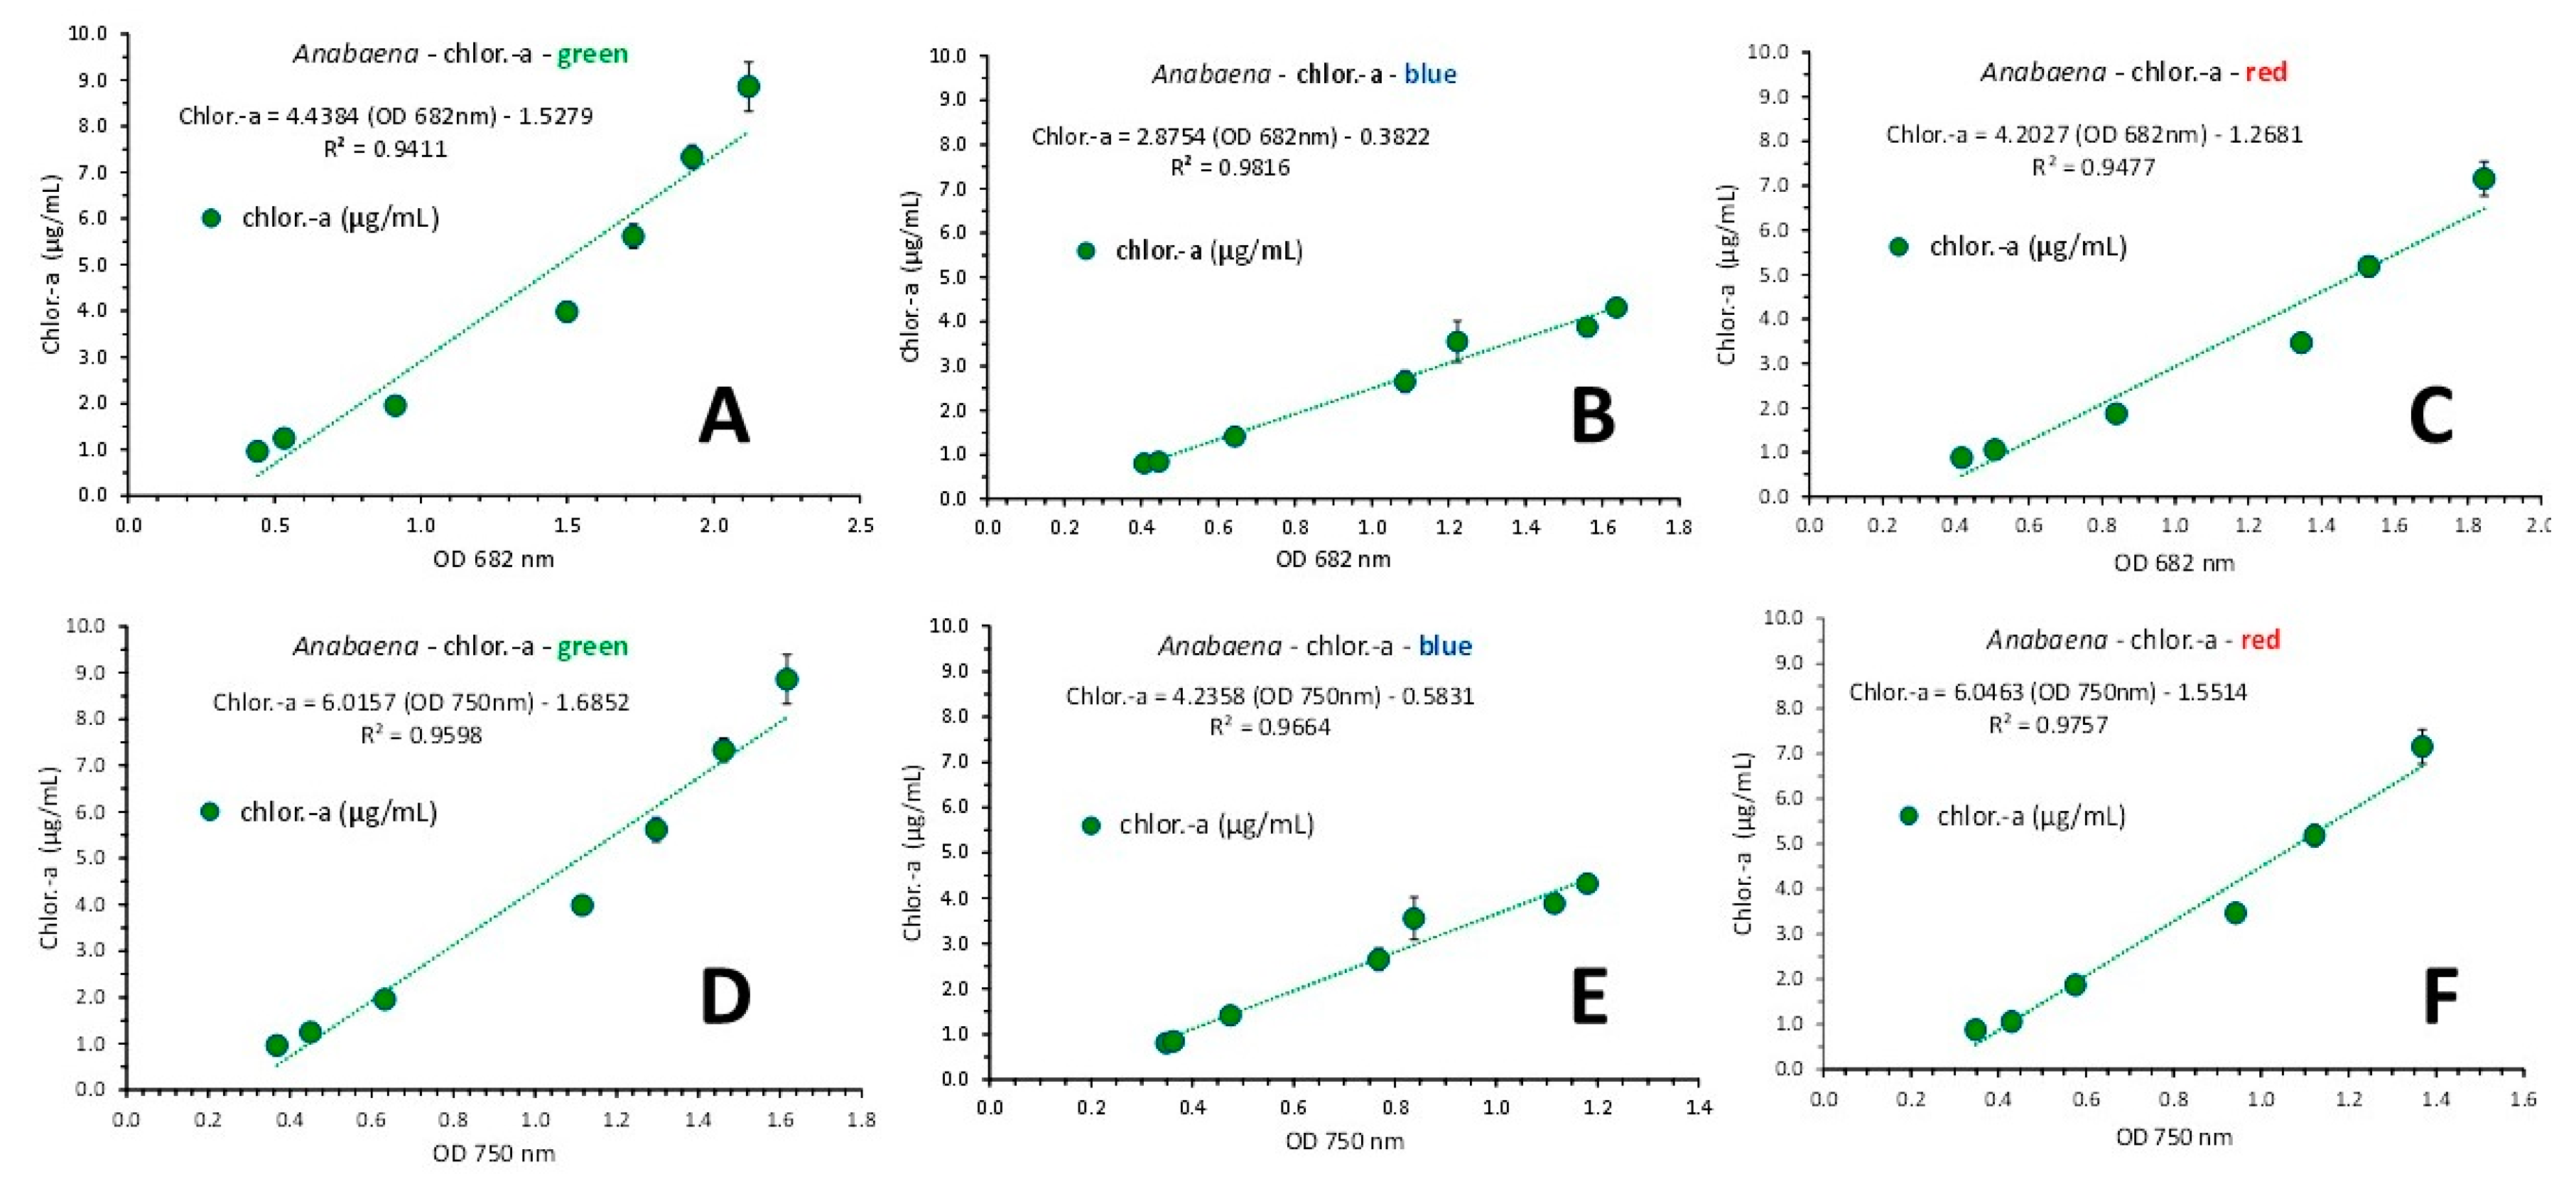
Figure 17.
Regression lines of total carotenoids, as μg/mL ± SE vs OD at 490 nm (A) and versus the OD at the wave length of 750 nm (B) and phycocyanin as mg/mL ± SE vs OD at 630 nm (C) and versus the OD at the wave length of 750 nm (D), in Anabaena sp. culture using values from all colored light regimes.
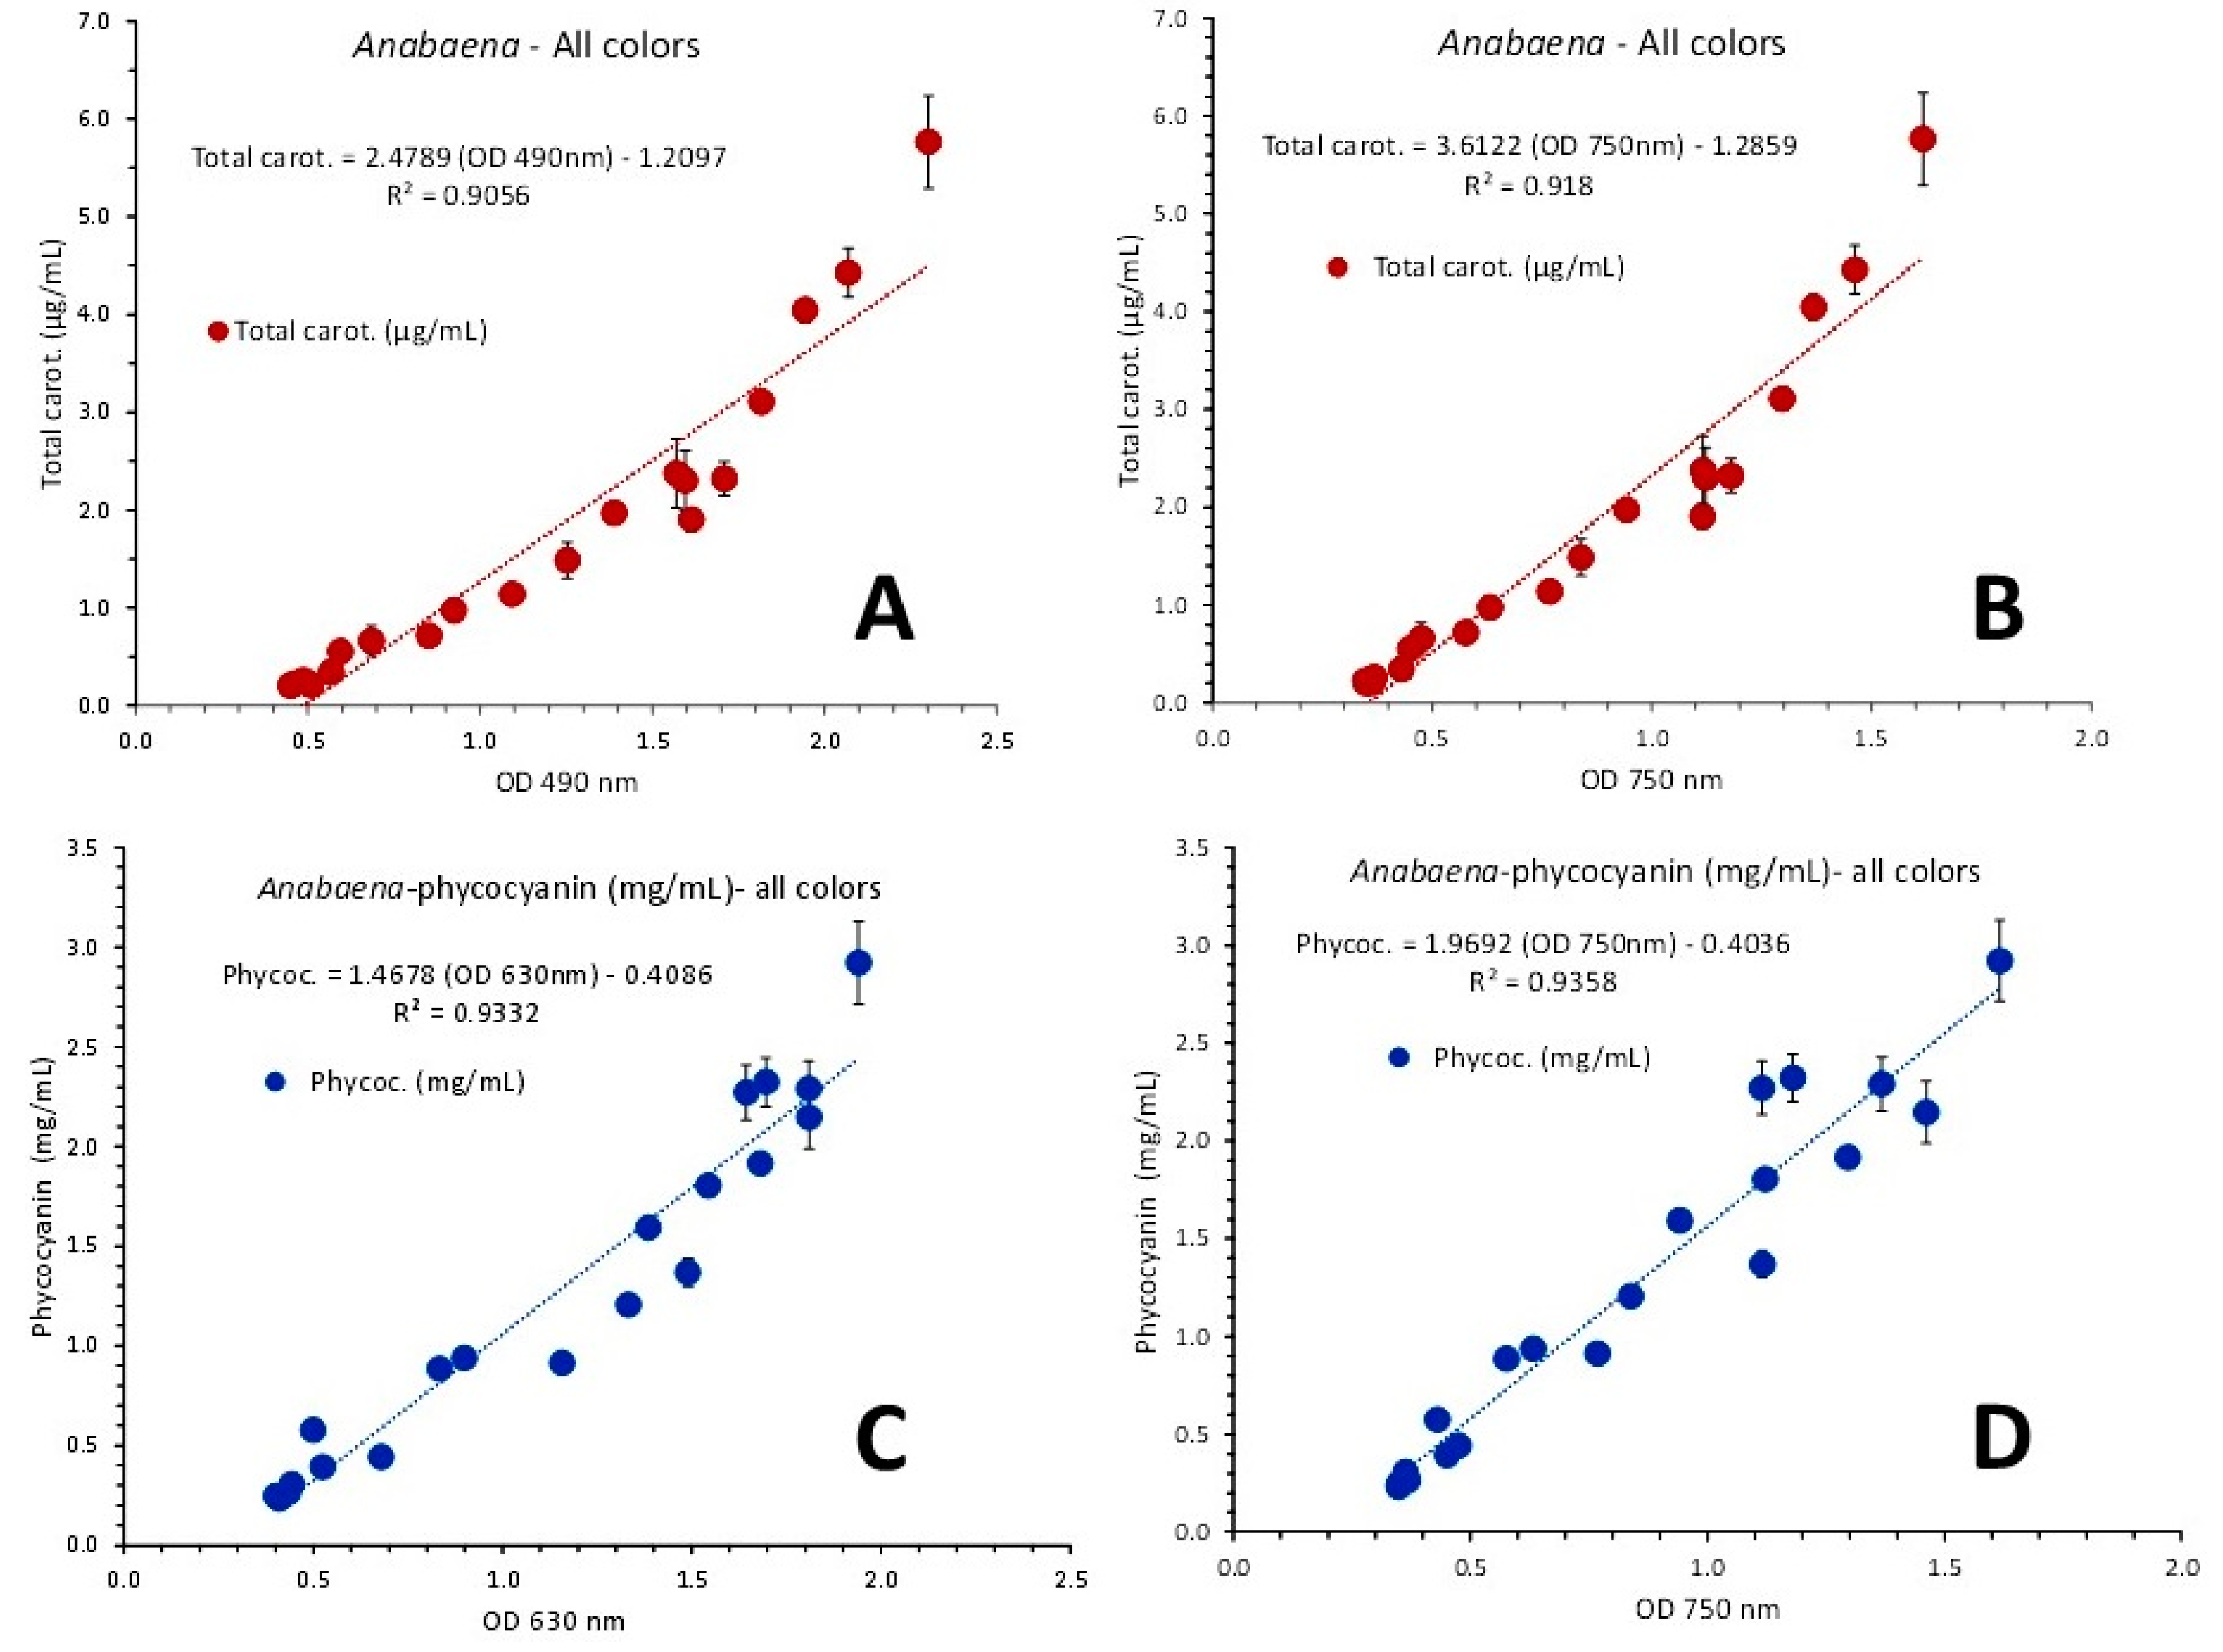
Figure 18.
Regression lines of total carotenoids as μg/mL ± SE vs OD at 490 nm in green (A), blue (B) and red (C) light and versus the OD at the wave length of 750 nm (D, E and F for green, blue and red light, respectively), in Anabaena sp. culture.
Figure 18.
Regression lines of total carotenoids as μg/mL ± SE vs OD at 490 nm in green (A), blue (B) and red (C) light and versus the OD at the wave length of 750 nm (D, E and F for green, blue and red light, respectively), in Anabaena sp. culture.
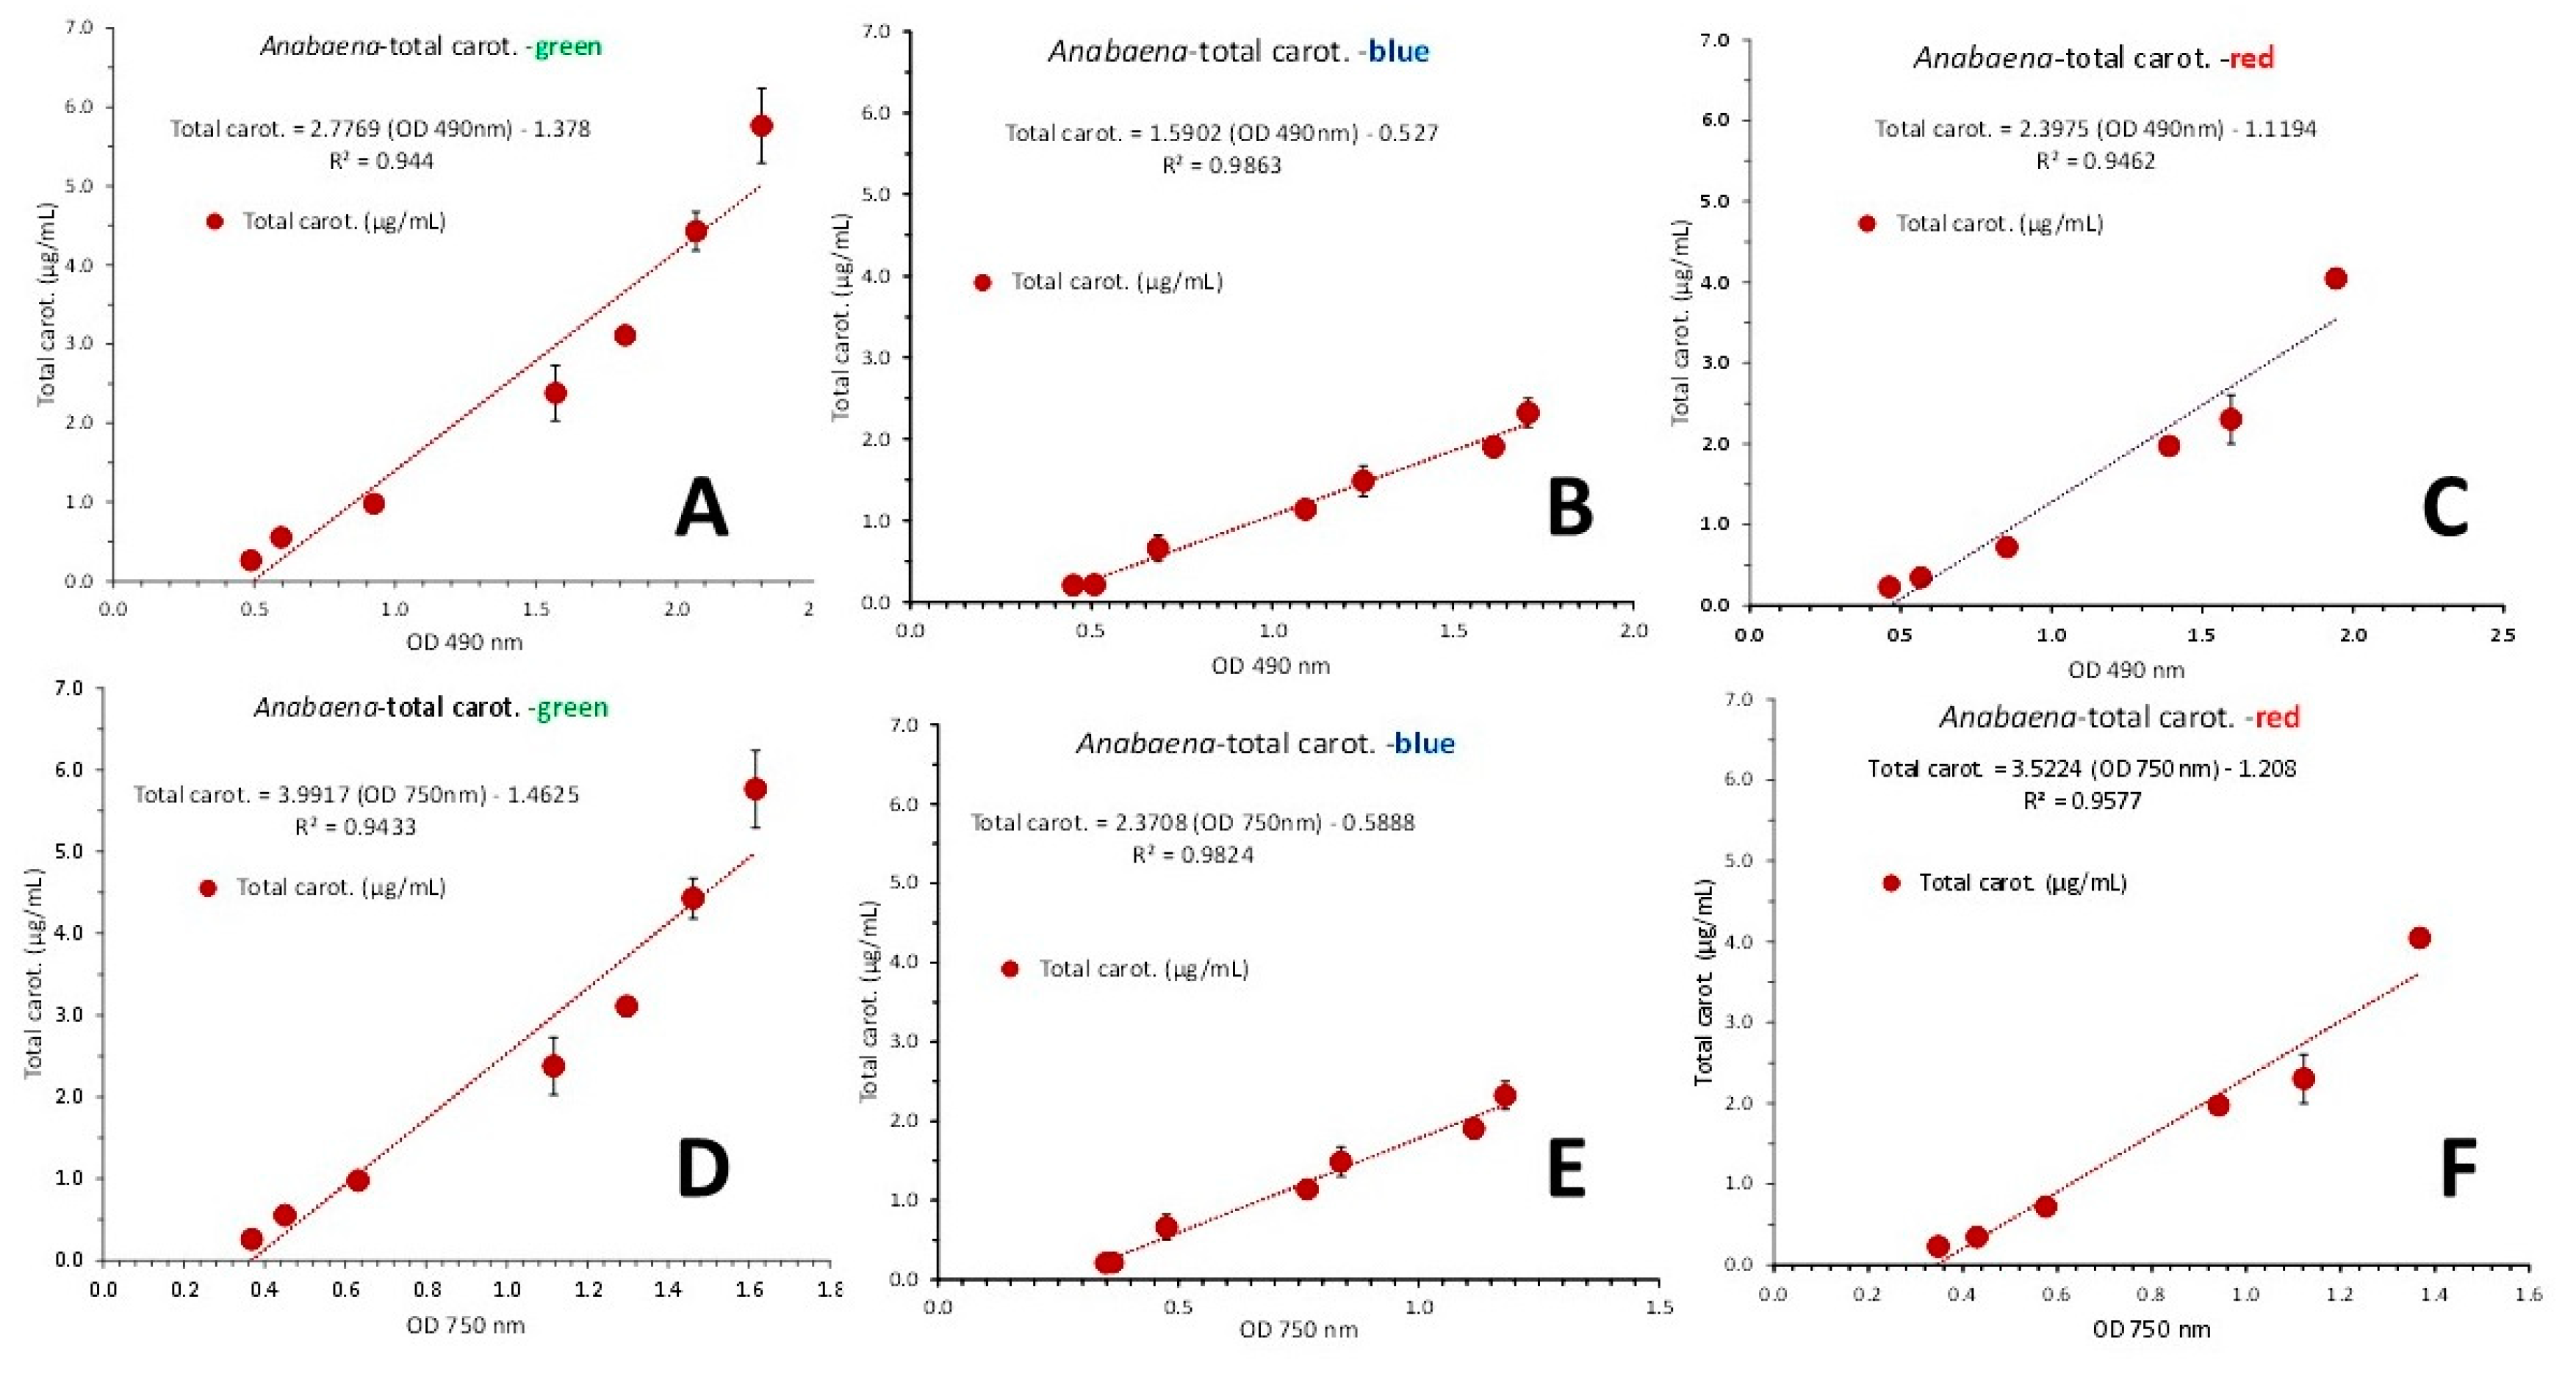
Figure 19.
Regression lines of phycocyanin as mg/mL ± SE vs OD at 630 nm in green (A), blue (B) and red (C) light and versus the OD at the wave length of 750 nm (D, E and F for green, blue and red light, respectively), in Anabaena sp. culture.
Figure 19.
Regression lines of phycocyanin as mg/mL ± SE vs OD at 630 nm in green (A), blue (B) and red (C) light and versus the OD at the wave length of 750 nm (D, E and F for green, blue and red light, respectively), in Anabaena sp. culture.
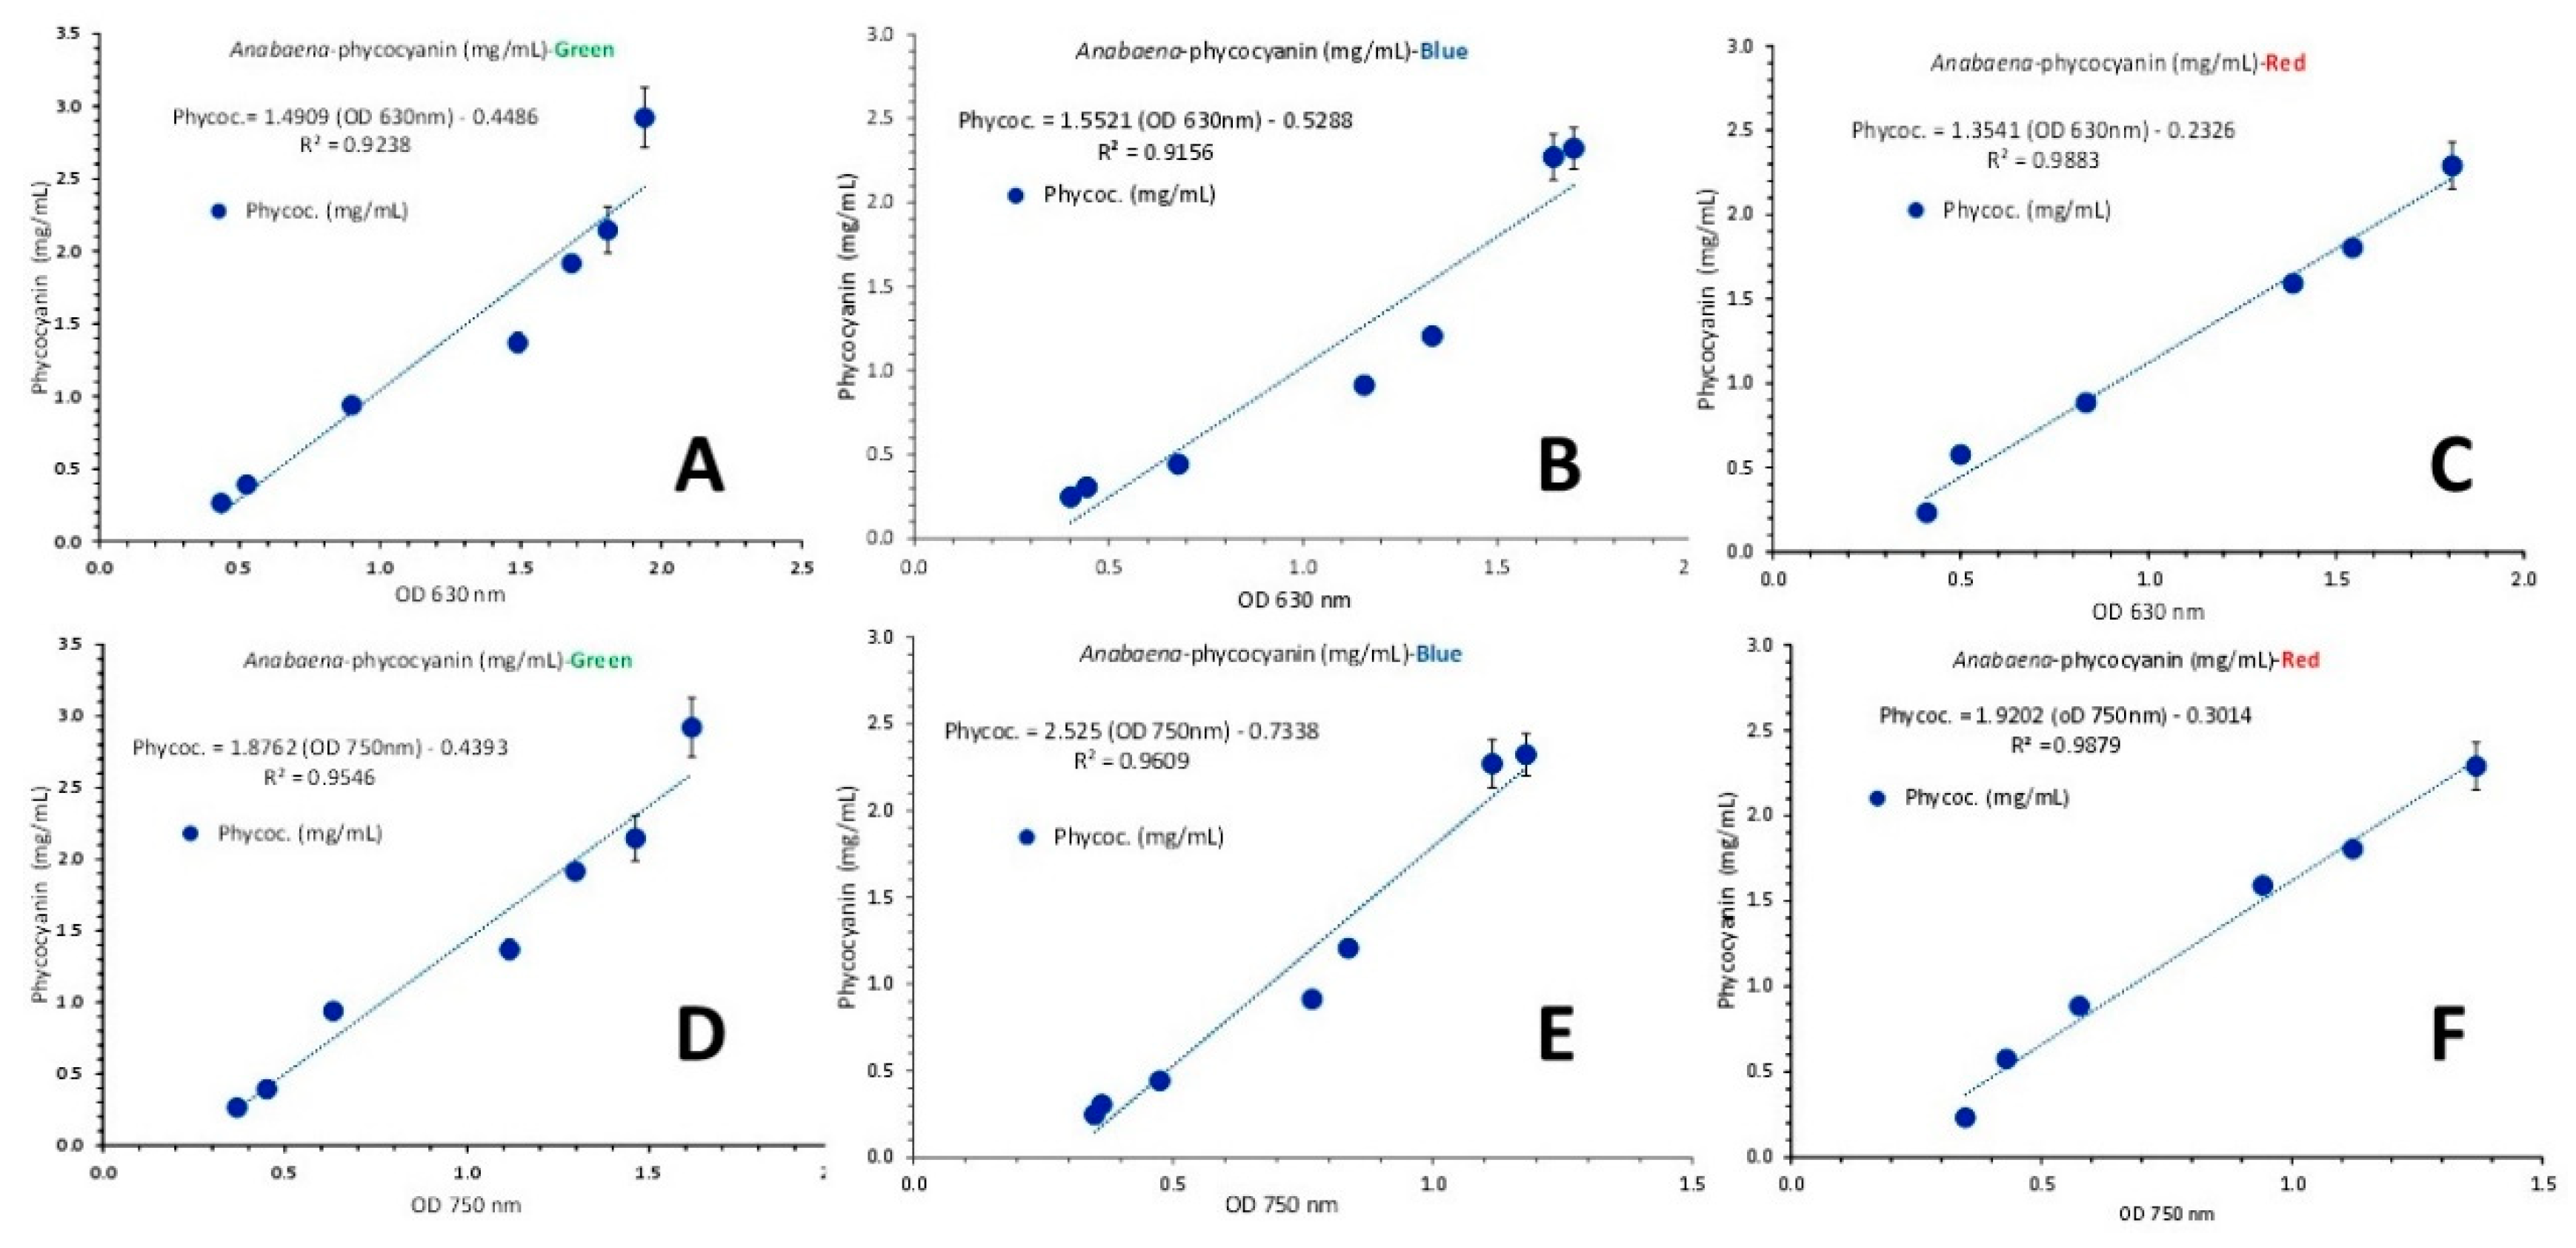
Figure 20.
A: Chlorophyll-a and total carotenoids as μg/mL ± SE at each culture density in each colored light regime (indicated by the proper coloration of each bar cluster). B: phycocyanin as mg/mL ± SE and C: phycocyanin yield as mg/g d.w. ± SE in each colored light regime (indicated by the proper coloration of each bar cluster), in Anabaena sp. culture.
Disclaimer/Publisher’s Note: The statements, opinions and data contained in all publications are solely those of the individual author(s) and contributor(s) and not of MDPI and/or the editor(s). MDPI and/or the editor(s) disclaim responsibility for any injury to people or property resulting from any ideas, methods, instructions or products referred to in the content. |
© 2023 by the authors. Licensee MDPI, Basel, Switzerland. This article is an open access article distributed under the terms and conditions of the Creative Commons Attribution (CC BY) license (http://creativecommons.org/licenses/by/4.0/).
Copyright: This open access article is published under a Creative Commons CC BY 4.0 license, which permit the free download, distribution, and reuse, provided that the author and preprint are cited in any reuse.


