Submitted:
15 June 2023
Posted:
16 June 2023
You are already at the latest version
Abstract
This article presents the results of research on the influence of polymetallic dust aerial emissions on the pollution levels in the soil and plants by heavy metals which have been under impact of the “Severonickel” smelter complex on the Kola peninsula (Russia) for many years. Research using soil- and bio-indicators was carried out at fixed measuring points in the years 1980-1999 (high aerotechnogenic emissions) and 2000-2019 (low aerotechnogenic emissions). The organic horizon (forest litter) of the Al-Fe-humus podzol, leaves of Vaccinium myrtillus L., V. vitis-idaea L., V. uliginosum L., Empetrum hermaphroditum Hagerup and one-year old Scots pine needles Pinus sylvestris L. as well as tree rings of Pinus sylvestris L. were used for bioindication research. The content of heavy metals was determined by the AAS method. During these time periods, the volume of atmospheric emissions of sulfur dioxide decreased 5 fold, polymetallic dust by 3.5 times, while the level of forest litter pollution by heavy metals in the buffer zone increased by 2 times, and did not change significantly in the impact zone. The decrease in atmospheric emissions of pollutants led to a 1.5- fold increase in the width of the annual rings of pine trunks in the impact zone, while in the buffer zone the differences were insignificant. At present, the content of Ni and Cu in the leaves of the wild dwarf-shrubs and pine needles in the impact zone has decreased by 5 times compared with 1980-1999 due to a decrease in polymetallic dust on the leaf surface.
Keywords:
environmental pollution
; biomonitoring
; heavy metals
1. Introduction
Aerotechnogenic pollution of the environment, its indication and control remains one of the most important problems of modern ecology [1,2,3,4,5,6,7,8,9,10]. Despite the efforts made by developed countries to reduce atmospheric emissions of pollutants, the relevance of monitoring terrestrial ecosystems exposed to technogenic pollution remains, requiring the development of new approaches and methods for monitoring and predicting the state of natural ecosystems [2,3,4,6,7,10,11,12,13,14,15]. Since the last third of the 20th century, boreal forests have been exposed to powerful gaseous and particulate pollutants, which have already led to the drying up of coniferous forests in Europe [16]. Coniferous forests of the northern taiga, which grow in harsh climatic conditions, need special attention and care, which makes them the most vulnerable and susceptible to stress factors, one of which is technogenic pollution [1,2,8,9].
The Murmansk region (Russia), which occupies almost the entire Kola Peninsula, is one of the most industrialized regions of Russia; numerous enterprises of non-ferrous and ferrous metallurgy, mineral fertilizers and building materials, as well as forestry, woodworking and fishing industries are located in this region. Gas and dust emissions from industrial enterprises are the largest sources of anthropogenic pollutants of the atmosphere, soil and surface water and have a negative impact on nature, which has been reflected in numerous publications [1,2,5,8,9,17,18,19,20,21,22,23,24]. Heavy metals, which are part of the polymetallic dust emitted into the atmosphere by industrial enterprises, are among the most dangerous and toxic environmental pollutants.
In forest ecosystems, trees are phytocenosis edificators and can be considered as ecosystem engineers [25]. The trees layer significantly changes the physical and chemical properties of the environment, which leads to the formation of a micromosaic of the ground cover. Tree crowns redistribute precipitation and change its chemical composition; they affect the light, heat and wind regimes of habitats, as well as the ground cover [24,26,27,28,29]. At the same time, due to competitive interactions between plants, trees are differentiated according to the degree of their development and the level of vitality, which leads to a predominance of weakened and severely weakened individuals in boreal forests [30,31,32,33,34,35,36,37]. In the northern taiga, the share of such individuals in the vitality spectra of Pinus sylvestris and Picea obovata stands is 50–70% [38,39,40,41].
In the forest communities of the boreal zone, the ground cover is one of the important components of the ecosystem, which regulates the water and thermal regime of the soil, and is also a source of food, medicinal and fodder raw materials. [42,43,44,45,46,47,48]. Berry dwarf-shrubs (common blueberry Vaccinium myrtillus L., common lingonberry V. vitis-idaea L., swamp blueberry V. uliginosum L., crowberry Empetrum hermaphroditum Hagerup) are widely represented in the boreal forests, where they are dominants or codominants of the ground cover [4,43,44,47,49,50]. They are used in the diet of the local population, and also serve as food for birds and animals [45,46,47,51,52]. Leaves and shoots of these dwarf-shrubs have antiviral, antioxidant and antihypoxic activity; they are used by the northern peoples for medicinal purposes, and are also sources of the mineral complex necessary for human health [50,53,54,55,56,57].
The main objectives of this work were: 1). Assess the current level of contamination of the organogenic horizon (forest litter) of Al-Fe-humus soils and compare it with that in the period of high aerotechnogenic emissions; 2). Conduct a comparative analysis of the content of heavy metals in indicator plant species during periods of high (1980–1999) and low (2000–2019) aerotechnogenic emissions; 3). Evaluate the response of the width of the annual rings of pine trunks to the reduction of aerotechnogenic emissions.
2. Material and Methods
2.1. Collection of Material
On the Kola Peninsula (Russia), the main source of environmental pollution is the “Severonickel” non-ferrous metallurgy plant, whose atmospheric emissions include sulfur dioxide (SO2) and polymetallic dust. The composition of fine polymetallic dust is dominated by metal sulfides and oxides: chalcocite Cu2S, chalcopyrite CuFeS2, pyrrhotite Fe7S8(Nix), pentlandite (Ni, Fe)9S8, covelline CuS, cuprite Cu2O, tenorite CuO, as well as Ni and Cu [59]. The maximum volumes of atmospheric emissions of polymetallic dust were emitted during the period from 1980 to the end of the 1990s. In the period 2000-2010 there has been a significant reduction in emissions of pollutants [5], and currently the volume of emissions does not exceed 3 thousand tons per year. Mass destruction of coniferous forests occurred in the vicinity of the plant in the mid-1980s, and the area of destruction of forest ecosystems continues to increase, despite a 3.5–5-fold reduction in pollutant emissions since the beginning of the 21st century.
The total period of monitoring studies in the Murmansk region (Russia) exceeds 40 years (1980–2022). The network of monitoring sample plots was established in lichen-green moss pine forests located within the background, buffer and impact zones, which are 65, 30 and 15 km away from the pollution source (“Severonickel” metallurgical plant), respectively.
At present, on all monitoring plots, the average age of Pinus sylvestris trees is 80 years, the average height is 8–14 m, and the average trunk diameter at a height of 1.3 m is 12.5–18 cm. The total projective cover of the grass-dwarf shrub layer averages 25%, 15%, 10% in the background, buffer, and in the impact zones; moss-lichen layer – 78%, 47% and 10%, respectively. In the impact zone the layer cover is represented by crustose lichens and primary thalli of species of the genus Cladonia [8].
At each monitoring plot, 50 stemwood cores were taken using a Pressler drill at a height of 1.3 m from the modeling trees (Table 1) that, according to their vital status, belong to the category of weakened and severely weakened, which are most common in the forests of the northern taiga [38,39,40,41].
On each monitoring plot, one average sample of the organogenic horizon (forest litter) of Al-Fe-humus podzol and indicator plant species of the ground cover and tree layer was selected. In accordance with generally accepted methods, at least 5 individual samples were used to compile the average litter sample. The dwarf-shrubs leaves (Vaccinium myrtillus, V. vitis-idaea, V. uliginosum, Empetrum hermaphroditum), and 1-year-old needles of Pinus sylvestris were collected from 20–30 individuals growing on each monitoring plot.
2.2. Determination of metal content
The total concentrations of Ni and Cu was determined in the plant material after dry incineration and dissolution of ash in HCl by atomic absorption spectrometry in 3-fold repetition. The content of acid soluble forms of Ni, Cu, and Co was determined in a 1.0 N HCl extract from the sampled forest litter using the same method. All data on the content of heavy metals in plants and forest litter are given in terms of air-dry weight.
To assess the potential risk to human health, the concentration coefficient (Cc) was calculated, i.e., the ratio of the concentration of an element in plants under aerotechnogenic pollution to its background content.
2.3. Determination of the width of the annual rings of pine trunks
2.4. Statistical data processing
Statistical data processing was carried out in the Statistica10 for Windows and R programs using linear regression analysis and ANOVA, and nonparametric Kruskal–Wallis (H) and Mann–Whitney (z) tests were used at a significance level of p<0.05.
3. Results
3.1. Soil properties
All the studied soils belong to Albic Rustic Podzols, according to the WRB [61] classification; according to the granulometric composition, these are sandy loamy loams. The main statistical characteristics of the content of acid-soluble forms Ni, Cu and Co, measured in the forest litter for 2 observation periods, are presented in Table 2. On the territory of the buffer and impact zones in the period 2002–2018 the content of acid-soluble forms of heavy metals increased 2–5-fold compared to the first observation period. All differences are significant z=–(2.46–4.37), p<0.05, except for the content of Ni in the impact zone. Particularly noteworthy is the increase in the level of contamination of forest litter in background pine forests, where the content of heavy metals increased by 1.5–2 times. The results of linear regression analysis also confirm an increase in the level of pollution of the forest litter, both in the background pine forests and in the territory of the buffer and impact zones (Table 3).
It should be specially noted that the content of acid-soluble forms of Cu exceeds the content of Ni in all contaminated forest litters, i.e., the Ni:Cu ratio is always less than 1. The concentrations of heavy metals are in the descending order Cu>Ni>Co.
3.2. Heavy Metal Contents in Forest Plants
When approaching the source of pollution, the content of heavy metals in all indicator plant species increases, and this pattern is preserved in both periods of the study (Table 4). The dependence of the content of Ni and Cu in 1-year-old needles of Pinus sylvestris on the distance to the “Severonickel” plant is shown in Figure 1. It is well approximated by the linear regression equation (R2Ni =0.610, p<0.001; R2Cu =0.692, p<0.001).
In the background region, in all studied plant species, the content of Ni and Cu varies in a narrow range from 1.5 to 16 mg kg−1, and the differences in their content over the two observation periods are insignificant in almost all cases, except for Empetrum hermaphroditum (Table 4). In the buffer zone, the range of variation in the content of heavy metals is more significant from 2.1 to 49 mg kg−1, but in most cases the differences in their content over the compared periods are insignificant. On the contrary, in the impact zone, a significant decrease in the content of heavy metals in all the studied plant species was revealed.
It is important to note that in the background pine forests, the concentrations of Ni and Cu in all studied plant species are approximately equal. Under conditions of aerotechnogenic pollution, the ratio of the concentrations of these metals shifts towards the predominance of Ni over Cu; this pattern is especially pronounced in the impact zone.
3.3. Growth Ring width of Pinus Sylvestris Trees
The dynamics of the radial growth of Pinus sylvestris trees from the background, buffer and the impact zones had both common features and its own characteristics (Figure 2). In the period 1950–1965 growth was characterized by a fairly high degree of annual fluctuations in all monitoring sample plots. Beginning in the 1980s, in all stands there was a gradual decrease in radial growth, and over the period 1966–1980 the values of radial increment were 1.92 ± 0.11 (background), 1.47 ± 0.08 (buffer zone), and 1.14 ± 0.01 mm yr-1 (impact zone), respectively. Between 1980 and 2020 the dynamics of the growth ring width of Scots pine trees differed fundamentally in the studied phytocenoses. In the background the radial increment continued to gradually decrease (Figure 2) and by the end of the observation period it was 0.66 ± 0.03 mm yr-1, then under the conditions of aerotechnogenic pollution, the dynamics of the radial increment differed significantly from that in the background. In the buffer zone for the period 1980–2021 the values of radial growth gradually decreased from 1.07 ± 0.06 mm yr-1 to 0.57 ± 0.04 mm yr-1. In the impact zone, a further decrease in the radial increment first occurred, and its minimum values (0.3 mm yr-1 on average) were recorded in the 1990s. Then, starting from 1999, the value of the radial growth began to increase, and in 2020 it was equal to 0.48 ± 0.01 mm yr-1.
A comparative analysis of data on the nonparametric Mann–Whitney criterion for periods with high (1980–1999) and reduced (2000–2019) intensity of atmospheric emissions showed that the direction of the dynamics of radial growth for the compared periods is fundamentally different (Table 5). In the background region in the second period there was a 2-fold decrease in radial growth. In the buffer zone, the value of the radial increment was the same for both periods, while in the impact zone, a 1.5-fold increase was revealed in the second period.
4. Discussion
4.1. Soil Phytotoxicity
The soils of the pine forests of the northern taiga are distinguished by a simple soil profile structure with a thin coarse humus litter (O horizon), a clearly expressed, but thin, podzolic horizon (E), and an intrusion horizon (BH). The forest litter is highly acidic (pHaq=3.9–4.5), with high hydrolytic acidity, low content of K, P, N [62]. It is well known that the forest litter in the northern taiga coniferous forests is the main source of mineral nutrition for plants; it contains the main part of the roots of both Pinus sylvestris trees and ground cover plants. At the same time, the upper organogenic horizon of the soil acts as a biogeochemical barrier for heavy metals coming from polluted air [21,22,62,63,64,65,66,67].
Long-term monitoring of Al–Fe–humus podzols on the Kola Peninsula has shown that a 1.5–2-fold increase in the content of acid-soluble forms of heavy metals in the forest litter is currently observed in the background. This indicates the transfer of fine polymetallic dust over long distances (over 60 km), which leads to the expansion of the zone of weak technogenic pollution. Despite a significant reduction in atmospheric emissions by the “Severonickel” plant, the content of heavy metals in the forest litter in the buffer zone continues to increase, and in the impact zone, a very high level of heavy metal contamination of the forest litter remains. Therefore, it can be stated that the balance between the influx of heavy metals from polluted air and their leaching into the mineral horizons of the soil has not been reached; the accumulation of technogenic Ni and Cu compounds continues. This indicates a high degree of soil conservation with respect to heavy metals, which is confirmed by the data of other researchers [21,22,64,65,66,67]. The constant additional precipitation of polymetallic dust from polluted air onto the soil surface prevents the process of self-purification of the upper soil horizon, which, according to various authors, can stretch for tens and hundreds of years [8,62,63,68].
4.2. Plants Are Bioindicators of Environmental Pollution
Various biological objects are used to indicate aerotechnogenic pollution of the environment, such as edible mushrooms [6,69,70,71,72,73,74,75], lichens [2,10,12,13], mosses [2,11,13,14], higher plants [2,7,17,48] and even tree rings [76,77]. The strategy of mineral nutrition is one of the main reasons for the differences in the bioindicative properties of various organisms. Mosses and lichens obtain water and minerals mainly from the air, which allows them to be classical bioindicators, with their bioaccumulation of metals being strongly correlated the content of metals in the environment [12,48]. Higher plants in terrestrial ecosystems receive mineral nutrition from the soil, mainly through the roots. In case of aerotechnogenic pollution of the environment, with the simultaneous intake of heavy metals from polluted air and from contaminated soil, the composition of atmospheric emissions becomes one of the main factors determining the level of their accumulation in plants and lichens. In the buffer zone, the dominant lichen and moss species accumulate 5–10 times more heavy metals compared to their content in the same species under experimental soil pollution [48,78]. For dwarf shrubs, these differences are not so pronounced. Cu concentrations in leaves do not differ significantly in the buffer zone and under soil contamination; the content of Ni is significantly higher (about 2 times) in the leaves of dwarf shrubs from the buffer zone compared to that in the leaves of the same species in the experimental plots.
The results of long-term monitoring of the content of heavy metals in higher plants showed that among the studied species, Empetrum hermaphroditum is the most informative for bioindication. The content of Ni and Cu and the concentration coefficients in the leaves of this species are the highest among the compared species (Table 4, Figure 3), which was also noted by other researchers [48,68,79,80]. One of the probable reasons for this phenomenon may be the morphological structure of the shoots of E. hermaphroditum: small leaves are densely located on the stem in the axils of opened buds, where polymetallic dust from the air can linger.
A comparative analysis of the content of heavy metals in the assimilation organs of higher plants over two periods of research showed that in the period 2002–2022 in the buffer zone, the average of Ni and Cu content decreased by 1.2–3.2 times, but this decrease is not always significant (Table 4). In the impact zone, during the same periods, there was a 2–8-fold decrease in the level of accumulation of heavy metals in the studied plant species. Therefore, we can conclude that the decrease in the content of heavy metals in the assimilation organs of studied plants is due to a decrease in atmospheric emissions of polymetallic dust by the “Severonickel” plant, since the level of heavy metal contamination of the forest litter increases in the buffer zone and remains very high in the impact zone. During the period of high emissions of pollutants, more than 80% of the total content of Ni and Cu in plant leaves was due to air intake or dust deposition on the leaf surface [8].
It is well known that microelements (including Ni and Cu) are necessary for the normal growth and development of plants, but the ratio of their concentrations is also important. For example, in the background the concentrations of Ni and Cu in the leaves (needles) of all the studied plants were comparable to each other. In case of aerotechnogenic pollution of the environment, the content of Ni in the assimilation organs of plants is always higher than the content of Cu (Table 4), in contrast to the ratio of these metals in the forest litter (Table 2). The increased accumulation of Ni by plants compared to Cu is due, on the one hand, to a higher rate of uptake and movement from the roots to the above-grown parts of plants [81,82], in other cases the differences can be due to antagonism in the uptake of elements [68,80,81].
4.3. Assessment of Potential Risks to Human Health
Many heavy metals pose a high potential risk to human health, which is why international legislation sets strict standards for the content of heavy metals in various foods, including those of plant origin [83,84,85]. World Health Organization (WHO), in cooperation with the Food and Agriculture Organization of the United Nations (FAO) (JECFA/73/SC), has set the limits for the permissible intake of some heavy metals and metalloids (As, Sb, Pb, Cd, Cr, Sn, Hg). However, the content of Ni and Cu in food products and herbal medicinal products is not regulated, but the high content of these metals can also have a negative impact on human health. To assess the potential risk to human health, we used the concentration coefficient.
In the uncontaminated pine forests of the Kola Peninsula, the intervals of variation in the concentrations of heavy metals in all studied species do not exceed their normal content, which is Ni 0.1–5, Cu 5–30 mg/kg, respectively [49,68]. The maximum values of the concentration coefficient were recorded in the impact zone during the period of high aerotechnogenic emission of pollutants (1980–1999), especially for Ni (Figure 3). Reducing the atmospheric emissions of pollutants by the “Severonickel” plant in the period 2000–2022 led to a 2–5-fold (Ni) and 2–3-fold (Cu) decrease in the concentration coefficient of heavy metals. In the buffer zone, the range of variation of the concentration coefficients is much smaller (1.3–7.8) for both study periods. Nevertheless, the increased content of heavy metals in plant materials can pose a threat to the health of the local population, so it is not recommended to collect medicinal plants, which include almost all of the studied species, in the impact zone.
4.4. The Reaction of the Growth Ring Width of Pinus Sylvestris Trees to a Decrease in the Intensity of Aerotechnogenic Emissions
Under natural growing conditions (background unpolluted areas), the radial growth of coniferous stem wood decreases with increasing tree age, which is explained by an increase in trunk diameter [37,39,41,86,87,88,89]. On the background territory of the Kola Peninsula, a general pattern of a decrease in the radial growth of pine trees with an increase in their age is recorded in pine forests of different typologies [39,40,41,88,89]. But the degree of its manifestation differs depending on the category of the vital state of the tree and the type of forest. The differences in the radial growth of Pinus sylvestris of different vitality are most pronounced in green moss pine forests [39]. In lichen pine forests, 30–85 years after the fire, in all categories of Pinus sylvestris individuals, a gradual decrease in radial growth occurs, against the background of which a significant stratification in growth rate is observed [41]. Our data generally coincide with the radial growth trends of weakened and severely weakened Pinus sylvestris individuals in lichen-green moss pine forests [39].
Aerotechnogenic pollution, as a rule, causes a decrease in the width of annual rings of woody plants, but the degree of its impact manifests itself in different ways [76,90]. In the zone of influence of aerotechnogenic emissions from metallurgical plants, when approaching the source of pollution, the radial growth of Pinus sylvestris stem wood significantly decreases in relation to the background values of this indicator [88,91,92]. The smallest values of the radial increment of Pinus sylvestris trunk were recorded in the impact zone compared to its trend in the background of the Kola Peninsula, especially during the period of high intensity of aerotechnogenic emission (1980–1995). With a sharp decrease in the atmospheric emissions of pollutants, starting from 2000, an increase in radial growth by 10–15% is noted, and in the period 2000–2014 its 2-fold increase is recorded [88,91]. For the period 2000–2019 we observe a 1.5-fold increase in the radial growth of weakened and severely weakened Scots pine trees in the impact zone of the “Severonickel” plant, compared with the period of 1980–1999 (Table 5, Figure 2). Similar information on the restoration of radial growth not only of Pinus sylvestris, but also of other woody plants in response to a decrease in the aerotechnogenic emissions of pollutants was obtained by other researchers [93,94,95,96,97,98,99].
5. Conclusions
The conducted studies show that despite a sharp reduction in aerotechnogenic emissions by the metallurgical plant, the phytotoxicity of the upper organic horizon (forest litter) of Al-Fe-humus podzols remains high in the buffer zone (30–40 km from the “Severonickel” plant) and very high in within the impact zone (less than 20 km from the pollution source). Due to the long-range transport of fine polymetallic dust, the area subject to contamination by heavy metals continues to expand. Elevated levels of heavy metals in the soil impair its quality as a habitat for plants, mycobiota and soil microorganisms, and can also be potentially harmful to the local population using non-timber forest resources. In this regard, it is not recommended to collect medicinal raw materials on the territory of the impact zone (within a radius of 15–20 km from the “Severonickel” plant) due to the increased accumulation of heavy metals, which poses a potential risk to public health. The decrease in aerotechnogenic emissions had a beneficial effect on the growth of Scots pine stemwood, which indicates the beginning of the process of restoring the productivity of northern taiga forest stands and improving their living condition.
Funding
This study was partly supported by the Russian Science Foundation (Project No23-26-00193).
Acknowledgments
The authors are grateful to the researcher A.I. Belyaeva of the Botanical Institute of RAS for help with chemical analysis; to Stephen M. Mayfield for valuable advice and assistance in preparing the manuscript; to anonymous reviewers for their comments and suggestions.
Conflicts of Interest
The authors declare the absence of any conflict of interest.
References
- Salemaa, M. , Vanha-Majamaa I., Derome J. 2001. Understory vegetation along a heavy-metal pollution gradient in SW Finland. Environmental Pollution. V. 112, N 3. P. 339.
- Salemaa, M.; Derome, J.; Helmisaari, H.-S.; Nieminen, T.; Vanhamajamaa, I. Element accumulation in boreal bryophytes, lichens and vascular plants exposed to heavy metal and sulfur deposition in Finland. Sci. Total. Environ. 2004, 324, 141–160. [Google Scholar] [CrossRef] [PubMed]
- Brekken, A.; Steinnes, E. Seasonal concentrations of cadmium and zinc in native pasture plants: consequences for grazing animals. Sci. Total. Environ. 2004, 326, 181–195. [Google Scholar] [CrossRef] [PubMed]
- Białońska, D.; Zobel, A.M.; Kuraś, M.; Tykarska, T.; Sawicka-Kapusta, K. Phenolic Compounds and Cell Structure in Bilberry Leaves Affected by Emissions from a Zn–Pb Smelter. Water, Air, Soil Pollut. 2007, 181, 123–133. [Google Scholar] [CrossRef]
- Kozlov, M.V. , Zvereva E.L., Zverev V.E. Impacts of point polluters on terrestrial biota. Dordrecht, Heidelberg, London, New-York, 2009. 466 р.
- Pająk, M.; Gąsiorek, M.; Jasik, M.; Halecki, W.; Otremba, K.; Pietrzykowski, M. Risk Assessment of Potential Food Chain Threats from Edible Wild Mushrooms Collected in Forest Ecosystems with Heavy Metal Pollution in Upper Silesia, Poland. Forests 2020, 11, 1240. [Google Scholar] [CrossRef]
- Wojtuń, B.; Samecka-Cymerman, A.; Żołnierz, L.; Rajsz, A.; Kempers, A.J. Vascular plants as ecological indicators of metals in alpine vegetation (Karkonosze, SW Poland). Environ. Sci. Pollut. Res. 2017, 24, 20093–20103. [Google Scholar] [CrossRef]
- Lyanguzova, I. , Yarmishko, V., Gorshkov, V., Stavrova, N., and Bakkal, I. 2018. Impact of heavy metals on forest ecosystems of the European North of Russia, in Heavy Metals, London: IntechOpen. p. 91.
- Myking, T. , Aarrestad P.A., Derome J. et al. 2009. Effects of air pollution from a nickel–copper industrial complex on boreal forest vegetation in the joint Russian–Norwegian–Finnish border area. Boreal Environ. Res. V. 14. P. 279.
- Conti, M.; Cecchetti, G. Biological monitoring: lichens as bioindicators of air pollution assessment — a review. Environ. Pollut. 2001, 114, 471–492. [Google Scholar] [CrossRef] [PubMed]
- Harmens, H.; Norris, D.A.; Steinnes, E.; Kubin, E.; Piispanen, J.; Alber, R.; Aleksiayenak, Y.; Blum, O.; Coşkun, M.; Dam, M.; et al. Mosses as biomonitors of atmospheric heavy metal deposition: Spatial patterns and temporal trends in Europe. Environ. Pollut. 2010, 158, 3144–3156. [Google Scholar] [CrossRef]
- Purvis, O.W.; Williamson, B.J.; Spiro, B.; Udachin, V.; Mikhailova, I.N.; Dolgopolova, A. Lichen monitoring as a potential tool in environmental forensics: case study of the Cu smelter and former mining town of Karabash, Russia. Geol. Soc. London, Spéc. Publ. 2013, 384, 133–146. [Google Scholar] [CrossRef]
- Pescott, O.L.; Simkin, J.M.; August, T.A.; Randle, Z.; Dore, A.J.; Botham, M.S. Air pollution and its effects on lichens, bryophytes, and lichen-feeding Lepidoptera: review and evidence from biological records. Biol. J. Linn. Soc. 2015, 115, 611–635. [Google Scholar] [CrossRef]
- Barkan V., Sh. , Lyanguzova I. V.2018. Concentration of Heavy Metals in Dominant Moss Species as an Indicator of Aerial Technogenic Load. Rus. J. of Ecology. V. 49, N2. P. 128.
- Rola, K.; Osyczka, P. Cryptogamic communities as a useful bioindication tool for estimating the degree of soil pollution with heavy metals. Ecol. Indic. 2018, 88, 454–464. [Google Scholar] [CrossRef]
- McLaughlin, S.B. 1985. Effects of air pollution on forests. J. APCA (Air Pollution Control Association). Vol. 35. P. 512–534.
- Zvereva E., Roitto M., Kozlov M. 2010. Growth and reproduction of vascular plants in polluted environments: a synthesis of existing knowledge // Environ. Rev. 18: 355–367.
- Ayras, M. , Kashulina G. 2000. Regional patterns of element contents in the organic horizon of podzols in the central part of the Barents region (Finland, Norway and Russia), with special reference to heavy metals (Co, Cr, Fe, Ni, Pb, V and Zn) and sulphur as indicators of airborne pollution. J. Exploration Geochem. V. 68. P. 127–144.
- Kozlov, M.V.; Zvereva, E.L. Industrial barrens: extreme habitats created by non-ferrous metallurgy. Rev. Environ. Sci. Bio/Technology 2007, 6, 231–259. [Google Scholar] [CrossRef]
- Kashulina, G. , de Caritat P., Reimann C. 2014. Snow and rain chemistry around the “Severonikel” industrial complex, NW Russia: Current status and retrospective analysis. Atmospheric Environ. V. 89. P. 672–682.
- Kashulina, G.M. Extreme pollution of soils by emissions of the copper–nickel industrial complex in the Kola Peninsula. Eurasian Soil Sci. 2017, 50, 837–849. [Google Scholar] [CrossRef]
- Kashulina, G.M. Monitoring of Soil Contamination by Heavy Metals in the Impact Zone of Copper-Nickel Smelter on the Kola Peninsula. Eurasian Soil Sci. 2018, 51, 467–478. [Google Scholar] [CrossRef]
- Lukina, N.V.; Orlova, M.A.; Steinnes, E.; Artemkina, N.A.; Gorbacheva, T.T.; Smirnov, V.E.; Belova, E.A. Mass-loss rates from decomposition of plant residues in spruce forests near the northern tree line subject to strong air pollution. Environ. Sci. Pollut. Res. 2017, 24, 19874–19887. [Google Scholar] [CrossRef] [PubMed]
- Ershov, V.V.; Lukina, N.V.; Danilova, M.A.; Isaeva, L.G.; Sukhareva, T.A.; Smirnov, V.E. Assessment of the Composition of Rain Deposition in Coniferous Forests at the Northern Tree Line Subject to Air Pollution. Russ. J. Ecol. 2020, 51, 319–328. [Google Scholar] [CrossRef]
- Jones, C.G.; Lawton, J.H.; Shachak, M. Organisms as Ecosystem Engineers. Oikos 1994, 69, 373. [Google Scholar] [CrossRef]
- Bialkowski, R.; Buttle, J.M. Stemflow and throughfall contributions to soil water recharge under trees with differing branch architectures. Hydrol. Process. 2015, 29, 4068–4082. [Google Scholar] [CrossRef]
- Frischbier, N. and Wagner, S. 2015. Detection, quantification and modelling of small-scale lateral translocation of throughfall in tree crowns of European beech (Fagus sylvatica L.) and Norway spruce (Picea abies (L.) Karst). J. Hydrol. vol. 522, pp. 228–238.
- Levia, D.F.; Germer, S. A review of stemflow generation dynamics and stemflow-environment interactions in forests and shrublands. Rev. Geophys. 2015, 53, 673–714. [Google Scholar] [CrossRef]
- Kozłowski, R.; Jóźwiak, M. 2017. The transformation of precipitation in the tree canopy in selected forest ecosystems of Poland’s Świętokrzyskie Mountains. Pol. Geograph. Rev. 89, 1, 133-153.
- Nilsson, U. , Gemmel P. 1993. Changes in growth and allocation of growth in young Pinus sylvestris and Picea abies due to competition. Scandinavian Journal of Forest Research 8: 213–222.
- Monserud, R.A.; Sterba, H. A basal area increment model for individual trees growing in even- and uneven-aged forest stands in Austria. For. Ecol. Manag. 1996, 80, 57–80. [Google Scholar] [CrossRef]
- Solberg, S. Crown Condition and Growth Relationships within Stands of Picea abies. Scand. J. For. Res. 1999, 14, 320–327. [Google Scholar] [CrossRef]
- Das, A. The effect of size and competition on tree growth rate in old-growth coniferous forests. Can. J. For. Res. 2012, 42, 1983–1995. [Google Scholar] [CrossRef]
- Demidko, D.A. , Krivets C.A., Bisirova E.M. 2010. Connection between radial increment and tree vitality of Siberian stone pine. Tomsk State University Journal. Biology. 4: 68–80.
- Bigler, C.; Bugmann, H. Growth-dependent tree mortality models based on tree rings. Can. J. For. Res. 2003, 33, 210–221. [Google Scholar] [CrossRef]
- Dobbertin, M. 2005. Forest growth as indicator of tree vitality and tree reaction to environmental stress: a review. European Journal of Forest Research 124(4): 319–333.
- Hereş, A.-M.; Kaye, M.W.; Granda, E.; Benavides, R.; Lázaro-Nogal, A.; Rubio-Casal, A.E.; Valladares, F.; Yuste, J.C. Tree vigour influences secondary growth but not responsiveness to climatic variability in Holm oak. Dendrochronologia 2018, 49, 68–76. [Google Scholar] [CrossRef]
- Ставрoва,..; Катютин,..; Stavrova, N.; Gorshkov, V.; Katyutin, P. 2016. Structure formation of forest tree species coenopopulations during post-fire recovery of northern taiga forest. Transactions of the Karelian Research Center of the Russian Academy of Science. Biogeography Series 3: 10–28. [CrossRef]
- Katjutin, P.N. , Stavrova N.I., Gorshkov V.V., Lyanguzov A.Yu., Bakkal I.Ju., Mikhailov S.A. 2020. Radial growth of trees differing in their vitality in the middle-aged Scots pine forests in the Kola peninsula. Silva Fennica. Vol. 54(3). article id 10263.
- Katyutin, P.N. , Gorshkov V.V. 2020. Vitality, Growth Speed and Aboveground Biomass of Pinus sylvestris (Pinaceae) in Middle-Aged North Taiga Forests. Rastitelnye resursy 56(2): 99–111.
- Gorshkov, V.V. , Stavrova N.I., Katjutin P.N., Lyanguzov A.Yu. 2021. Radial Increment of Scots Pine Pinus sylvestris L. in the Northern Taiga Lichen Pine Forests and Woodlands. Biology Bulletin. No2. P. 200–210.
- Atlegrim, O.; Sjöberg, K. Response of bilberry (Vaccinium myrtillus) to clear-cutting and single-tree selection harvests in uneven-aged boreal Picea abies forests. For. Ecol. Manag. 1996, 86, 39–50. [Google Scholar] [CrossRef]
- Uotila, A.; Kouki, J. Understorey vegetation in spruce-dominated forests in eastern Finland and Russian Karelia: Successional patterns after anthropogenic and natural disturbances. For. Ecol. Manag. 2005, 215, 113–137. [Google Scholar] [CrossRef]
- Uotila, A.; Hotanen, J.-P.; Kouki, J. Succession of understory vegetation in managed and seminatural Scots pine forests in eastern Finland and Russian Karelia. Can. J. For. Res. 2005, 35, 1422–1441. [Google Scholar] [CrossRef]
- Turtiainen, M. , Salo, K., Saastomoinen, O., 2011. Variation of yield and utilisation of bilberries (Vaccinium myrtillus L.) and cowberries (Vaccinium vitis-idaea L.) in Finland. Silva Fenn. 45 (2), 237–251.
- Turtiainen, M.; Miina, J.; Salo, K.; Hotanen, J.-P. Empirical prediction models for the coverage and yields of cowberry in Finland. Silva Fenn. 2013, 47. [Google Scholar] [CrossRef]
- Rodriguez, A. , Kouki J. 2015. Emulating natural disturbance in forest management enhances pollination services for dominant Vaccinium shrubs in boreal pine-dominated forests // Forest Ecology and Management. 350. 1–12.
- Lyanguzova, I.V. Airborne Heavy Metal Pollution and its Effects on Biomass of Ground Vegetation, Foliar Elemental Composition and Metabolic Profiling of Forest Plants in the Kola Peninsula (Russia). Russ. J. Plant Physiol. 2021, 68, S140–S149. [Google Scholar] [CrossRef]
- Uhlig, C. , Junttila J. 2001. Airborne heavy metal pollution and its effect on foliar elemental composition of Empetrum hermaphroditum and Vaccinium myrtillus in Sor-Varanger, northern Norway. Environmental Pollution. Vol. 114. P. 461–469.
- Martz, F.; Jaakola, L.; Julkunen-Tiitto, R.; Stark, S. Phenolic Composition and Antioxidant Capacity of Bilberry (Vaccinium myrtillus) Leaves in Northern Europe Following Foliar Development and Along Environmental Gradients. J. Chem. Ecol. 2010, 36, 1017–1028. [Google Scholar] [CrossRef]
- Lakka, J.; Kouki, J. Patterns of field layer invertebrates in successional stages of managed boreal forest: Implications for the declining Capercaillie Tetrao urogallus L. population. For. Ecol. Manag. 2009, 257, 600–607. [Google Scholar] [CrossRef]
- Ihalainen, M.; Alho, J.; Kolehmainen, O.; Pukkala, T. Expert models for bilberry and cowberry yields in Finnish forests. For. Ecol. Manag. 2002, 157, 15–22. [Google Scholar] [CrossRef]
- Mroz, L. and Demczuk, M. 2010. Contents of phenolics and chemical elements in bilberry (Vaccinium myrtillus L.) leaves from copper smelter area (SW Poland). Pol. J. Ecol. vol. 58, p. 475.
- Afanasyeva, L.V. and Kashin, V.K. 2016. Accumulation and distribution of microelements in above- and underground parts Vaccinium vitis-idaea (Ericaceae) in the Southern Pre-Baikal region, Plant Res. vol. 52, p. 434.
- Fursa, N.S. , Kruglov, D.S., and Belokurov, M.M. 2017. The element composition of the leaves of plants of the Vaccinium genus. Pharmaciya. vol. 66, p. 33.
- Kandziora-Ciupa, M.; Ciepał, R.; Nadgórska-Socha, A.; Barczyk, G. A comparative study of heavy metal accumulation and antioxidant responses in Vaccinium myrtillus L. leaves in polluted and non-polluted areas. Environ. Sci. Pollut. Res. 2013, 20, 4920–4932. [Google Scholar] [CrossRef]
- Kandziora-Ciupa, M.; Nadgórska-Socha, A.; Barczyk, G.; Ciepał, R. Bioaccumulation of heavy metals and ecophysiological responses to heavy metal stress in selected populations of Vaccinium myrtillus L. and Vaccinium vitis-idaea L. Ecotoxicology 2017, 26, 966–980. [Google Scholar] [CrossRef] [PubMed]
- Barcan, V. Leaching of nickel and copper from soil contaminated by metallurgical dust. Environ. Int. 2002, 28, 63–68. [Google Scholar] [CrossRef]
- Rinn, F. 2003. TSAP-Win: time series analysis and presentation for dendrochronology and related applications: User reference. RINNTECH, Heidelberg, 110 p.
- Guiterman, C.H.; Margolis, E.Q.; Swetnam, T.W. Dendroecological Methods For Reconstructing High-Severity Fire In Pine-Oak Forests. Tree-Ring Res. 2015, 71, 67–77. [Google Scholar] [CrossRef]
- World Reference Base for Soil Resources 2014, International Soil Classification System for Naming Soils and Creating Legends for Soil Maps; World Soil Resources Report No. 106; Food and Agriculture Organization: Rome, Italy, 2015. [Google Scholar]
- Lyanguzova I., V. , Goldvirt D. K., Fadeeva I. K. 2016. Spatiotemporal Dynamics of the Pollution of Al–Fe-Humus Podzolsin the Impact Zone of a Nonferrous Metallurgical Plant Eurasian Soil Science. Vol. 49, No. 10, pp. 1189–1203.
- Evdokimova, G.A. , Mozgova N.P. 1993. Soil contamination by heavy metals in surroundings of Monchegorsk and recovering after industrial impact. Aerial pollution in Kola peninsula: Proc. Intern. Workshop. Apatity. P. 148–152.
- Kopstik, G.N. 2014. Problems and prospects concerning the phytoremediation of heavy metal polluted soils: a review. Eurasian Soil Science. N 9. P. 923–939.
- Evdokimova, G.A. , Mozgova N.P., Korneikova M.V. 2015. The content and toxicity of heavy metals in soils affected by aerial emissions from the Pechenganickel plant. Eurasian Soil Science. N 5. P. 504–510.
- Vorobeichik, E.L.; Trubina, M.R.; Khantemirova, E.V.; Bergman, I.E. Long-term dynamic of forest vegetation after reduction of copper smelter emissions. Russ. J. Ecol. 2014, 45, 498–507. [Google Scholar] [CrossRef]
- Kadulin, M.S.; Koptsik, G.N. Carbon Dioxide Emission by Soils as a Criterion for Remediation Effectiveness of Industrial Barrens Near Copper-Nickel Plants in the Kola Subarctic. Russ. J. Ecol. 2019, 50, 535–542. [Google Scholar] [CrossRef]
- Kabata-Pendias, A. , Pendias H. 2001. Trace elements in soil and plants. London: CRC Press. 413 p.
- Kalač, P.; Svoboda, L. A review of trace element concentrations in edible mushrooms. Food Chem. 2000, 69, 273–281. [Google Scholar] [CrossRef]
- Alonso, J.; Melgar, M.J.; García, M.A.; Pérez-López, M. The Concentrations and Bioconcentration Factors of Copper and Zinc in Edible Mushrooms. Arch. Environ. Contam. Toxicol. 2003, 44, 180–188. [Google Scholar] [CrossRef] [PubMed]
- Garcia, M.A. , Alonso J., Melgar M.J. 2009. Lead in edible mushrooms. Levels and bioconcentration factors. Journal of Hazardous Materials, 167, pp. 777-783.
- Brzostowski, A.; Falandysz, J.; Jarzyńska, G.; Zhang, D. Bioconcentration potential of metallic elements by Poison Pax (Paxillus involutus) mushroom. J. Environ. Sci. Heal. Part A 2011, 46, 378–393. [Google Scholar] [CrossRef] [PubMed]
- Jarzyńska, G. , Gucia M., Kojta A.K., Rezulak K., Falandysz J. 2011. Profile of trace elements in Parasol Mushroom (Macrolepiota procera) from Tucholskie Forest Journal of Environmental Science and Health, Part B, 46, pp. 741–751.
- Falandysz, J.; Frankowska, A.; Jarzynska, G.; Dryzałowska, A.; Kojta, A.K.; Zhang, D. Survey on composition and bioconcentration potential of 12 metallic elements in King Bolete (Boletus edulis) mushroom that emerged at 11 spatially distant sites. J. Environ. Sci. Heal. Part B 2011, 46, 231–246. [Google Scholar] [CrossRef] [PubMed]
- Lipka, K. Falandysz J. 2017. Accumulation of metallic elements by Amanita muscaria from rural lowland and industrial upland regions. Journal of Environmental Science and Health, Part B, 52(3), pp. 184–190.
- Juknys, R.; Augustaitis, A.; Venclovienė, J.; Kliučius, A.; Vitas, A.; Bartkevičius, E.; Jurkonis, N. Dynamic response of tree growth to changing environmental pollution. Eur. J. For. Res. 2013, 133, 713–724. [Google Scholar] [CrossRef]
- Vacek, S.; Vacek, Z.; Bílek, L.; Simon, J.; Remeš, J.; Hůnová, I.; Král, J.; Putalová, T.; Mikeska, M. Structure, regeneration and growth of Scots pine (Pinus sylvestris L.) stands with respect to changing climate and environmental pollution. Silva Fenn. 2016, 50, 1–21. [Google Scholar] [CrossRef]
- Lyanguzova, I.V. , Bondarenko M.S., Belyaeva A.I., Kataeva M.N., Barkan V.Sh., Lyanguzov A.Yu. 2020. Migration of Heavy Metals from Contaminated Soil to Plants and Lichens under Conditions of Field Experiment on the Kola Peninsula. Rus. J. of Ecology. V. 51, N. 6. P. 527.
- Trubina, M.R. , Vorobeichik E.L., Khantemirova E.V., Bergman I.E., Kaigorodova S.Y. 2014. Dynamics of forest vegetation after the reduction of industrial emissions: fast recovery or continued degradation? Doklady Biological Sciences. V. 458. N 1. P. 302–305.
- Alexeeva-Popova, N.V.; Drozdova, I.V. Micronutrient composition of plants in the Polar Urals under contrasting geochemical conditions. Russ. J. Ecol. 2013, 44, 100–107. [Google Scholar] [CrossRef]
- Seregin, I.V. , Kozhevnikova A.D. 2006. Physiological Role of Ni and its Toxic Effects on Higher Plants. Russian Journal of Plant Physiology. V. 53. № 2. С. 257-277.
- White, P.J. , Brown P. H. 2010. Plant nutrition for sustainable development and global health Annals of Botany. V. 105. P. 1073–1080.
- Commission Regulation (EC) No 629/2008 of 2 July 2008 amending Regulation (EC) No 1881/2006 setting maximum levels for certain contaminants in foodstuffs // Official Journal of the European Union. 03.07. 2008.
- JJECFA/73/SC. Joint 2010. FAO/WHO Expert Committee on Food Additives. Seventy-third Meeting, Geneva, 8–17, June 2010.
- Choi Y., Y. Briefing on National and International Standards for Heavy Metals in Food. 18.10. 2012.
- Shchekalev, R.V. , Tarkhanov S.N. 2007. Radial growth of Scots pine under aerotechnogenic pollution in the Northern Dvina basin. Contemporary Problems of Ecology 2: 45–50.
- Ryabinina, Z.N.; Bastaeva, G.T.; A Lyavdanskaya, O.; Lebedev, S.V.; Kalyakina, R.G.; Ryabuhina, M.V. Radial growth of artificial forest stands under the aerotechnogenic impact of the Orenburg gas chemical complex. 2020, 579. 579. [CrossRef]
- Yarmishko, V.T. , Ignateva O.V. 2019. Impact Multi-year Monitoring of Pine Forests in the Central Part of the Kola Peninsula. Proceedings of the Russian academy of Sciences. Biological series. 6: 658–668.
- Yarmishko, V.T. , Ignatieva O.V. 2020. Growth Rate and Phytomass Structure of Pinus sylvestris (Pinaceae) in the Middle-Aged Scots Pine Forests of the Murmansk Region. Rastitelnye resursy 56(2): 314–325.
- Urazgildin, R.V. , Kulagin A.Yu. 2021. Structural and functional responses of arboreal plants to anthropogenic factors: Damages, adaptations and strategies. Part. III. Impact on the radial increment and on the rootage. Biosfera 13(4): 188–205.
- Yarmishko, V.T.; Ignat’eva, O.V. 2021. Communities of Pinus sylvestris L. in the technogenic environment in the European north of Russia: structure, features of growth, condition. Siberian Journal of Forestry Science. 3: 44–55.
- Kucherov, S.E. Muldashev A.A. 2003. Radial increment of Scots pine in the vicinity of the Karabash copper smelter. Contemporary Problems of Ecology 2: 43–49.
- Wertz, B. 2012. Dendrochronological evaluation of the impact of industrial emissions on main coniferous species in the Kielce Upland. Sylwan 156(5): 379–390.
- Stravinskiene, V.; Bartkevicius, E.; Plausinyte, E. Dendrochronological research of Scots pine (Pinus sylvestris L.) radial growth in vicinity of industrial pollution. Dendrochronologia 2013, 31, 179–186. [Google Scholar] [CrossRef]
- Sensuła, B.; Opała, M.; Wilczyński, S.; Pawełczyk, S. Long- and short-term incremental response of Pinus sylvestris L. from industrial area nearby steelworks in Silesian Upland, Poland. Dendrochronologia 2015, 36, 1–12. [Google Scholar] [CrossRef]
- Sensuła, B.; Wilczyński, S.; Monin, L.; Allan, M.; Pazdur, A.; Fagel, N. Variations of tree ring width and chemical composition of wood of pine growing in the area nearby chemical factories. Geochronometria 2017, 44, 226–239. [Google Scholar] [CrossRef]
- Barniak, J.; Krąpiec, M. The Tree-Ring Method of Estimation of the Effect of Industrial Pollution on Pine (Pinus sylvestris L.) Tree Stands in the Northern Part of the Sandomierz Basin (SE Poland). Water, Air, Soil Pollut. 2016, 227, 166. [Google Scholar] [CrossRef]
- uszczyńska, K. , Wistuba M., Malik I. 2018. Reductions in tree-ring widths of silver fir (Abies alba Mill.) as an indicator of air pollution in southern Poland // Environmental and Socio-Economic Studies. Vol. 6(3). P. 44-5.
- Rutkiewicz, P.; Malik, I. Spruce tree-ring reductions in relation to air pollution and human diseases a case study from Southern Poland. Environ. Socio-economic Stud. 2018, 6, 22–28. [Google Scholar] [CrossRef]
Figure 1.
Content (mg kg−1) of Ni and Cu in 1-year-old needles of Pinus sylvestris according to the distance from the source of aerotechnogenic pollution (2008 data).
Figure 1.
Content (mg kg−1) of Ni and Cu in 1-year-old needles of Pinus sylvestris according to the distance from the source of aerotechnogenic pollution (2008 data).
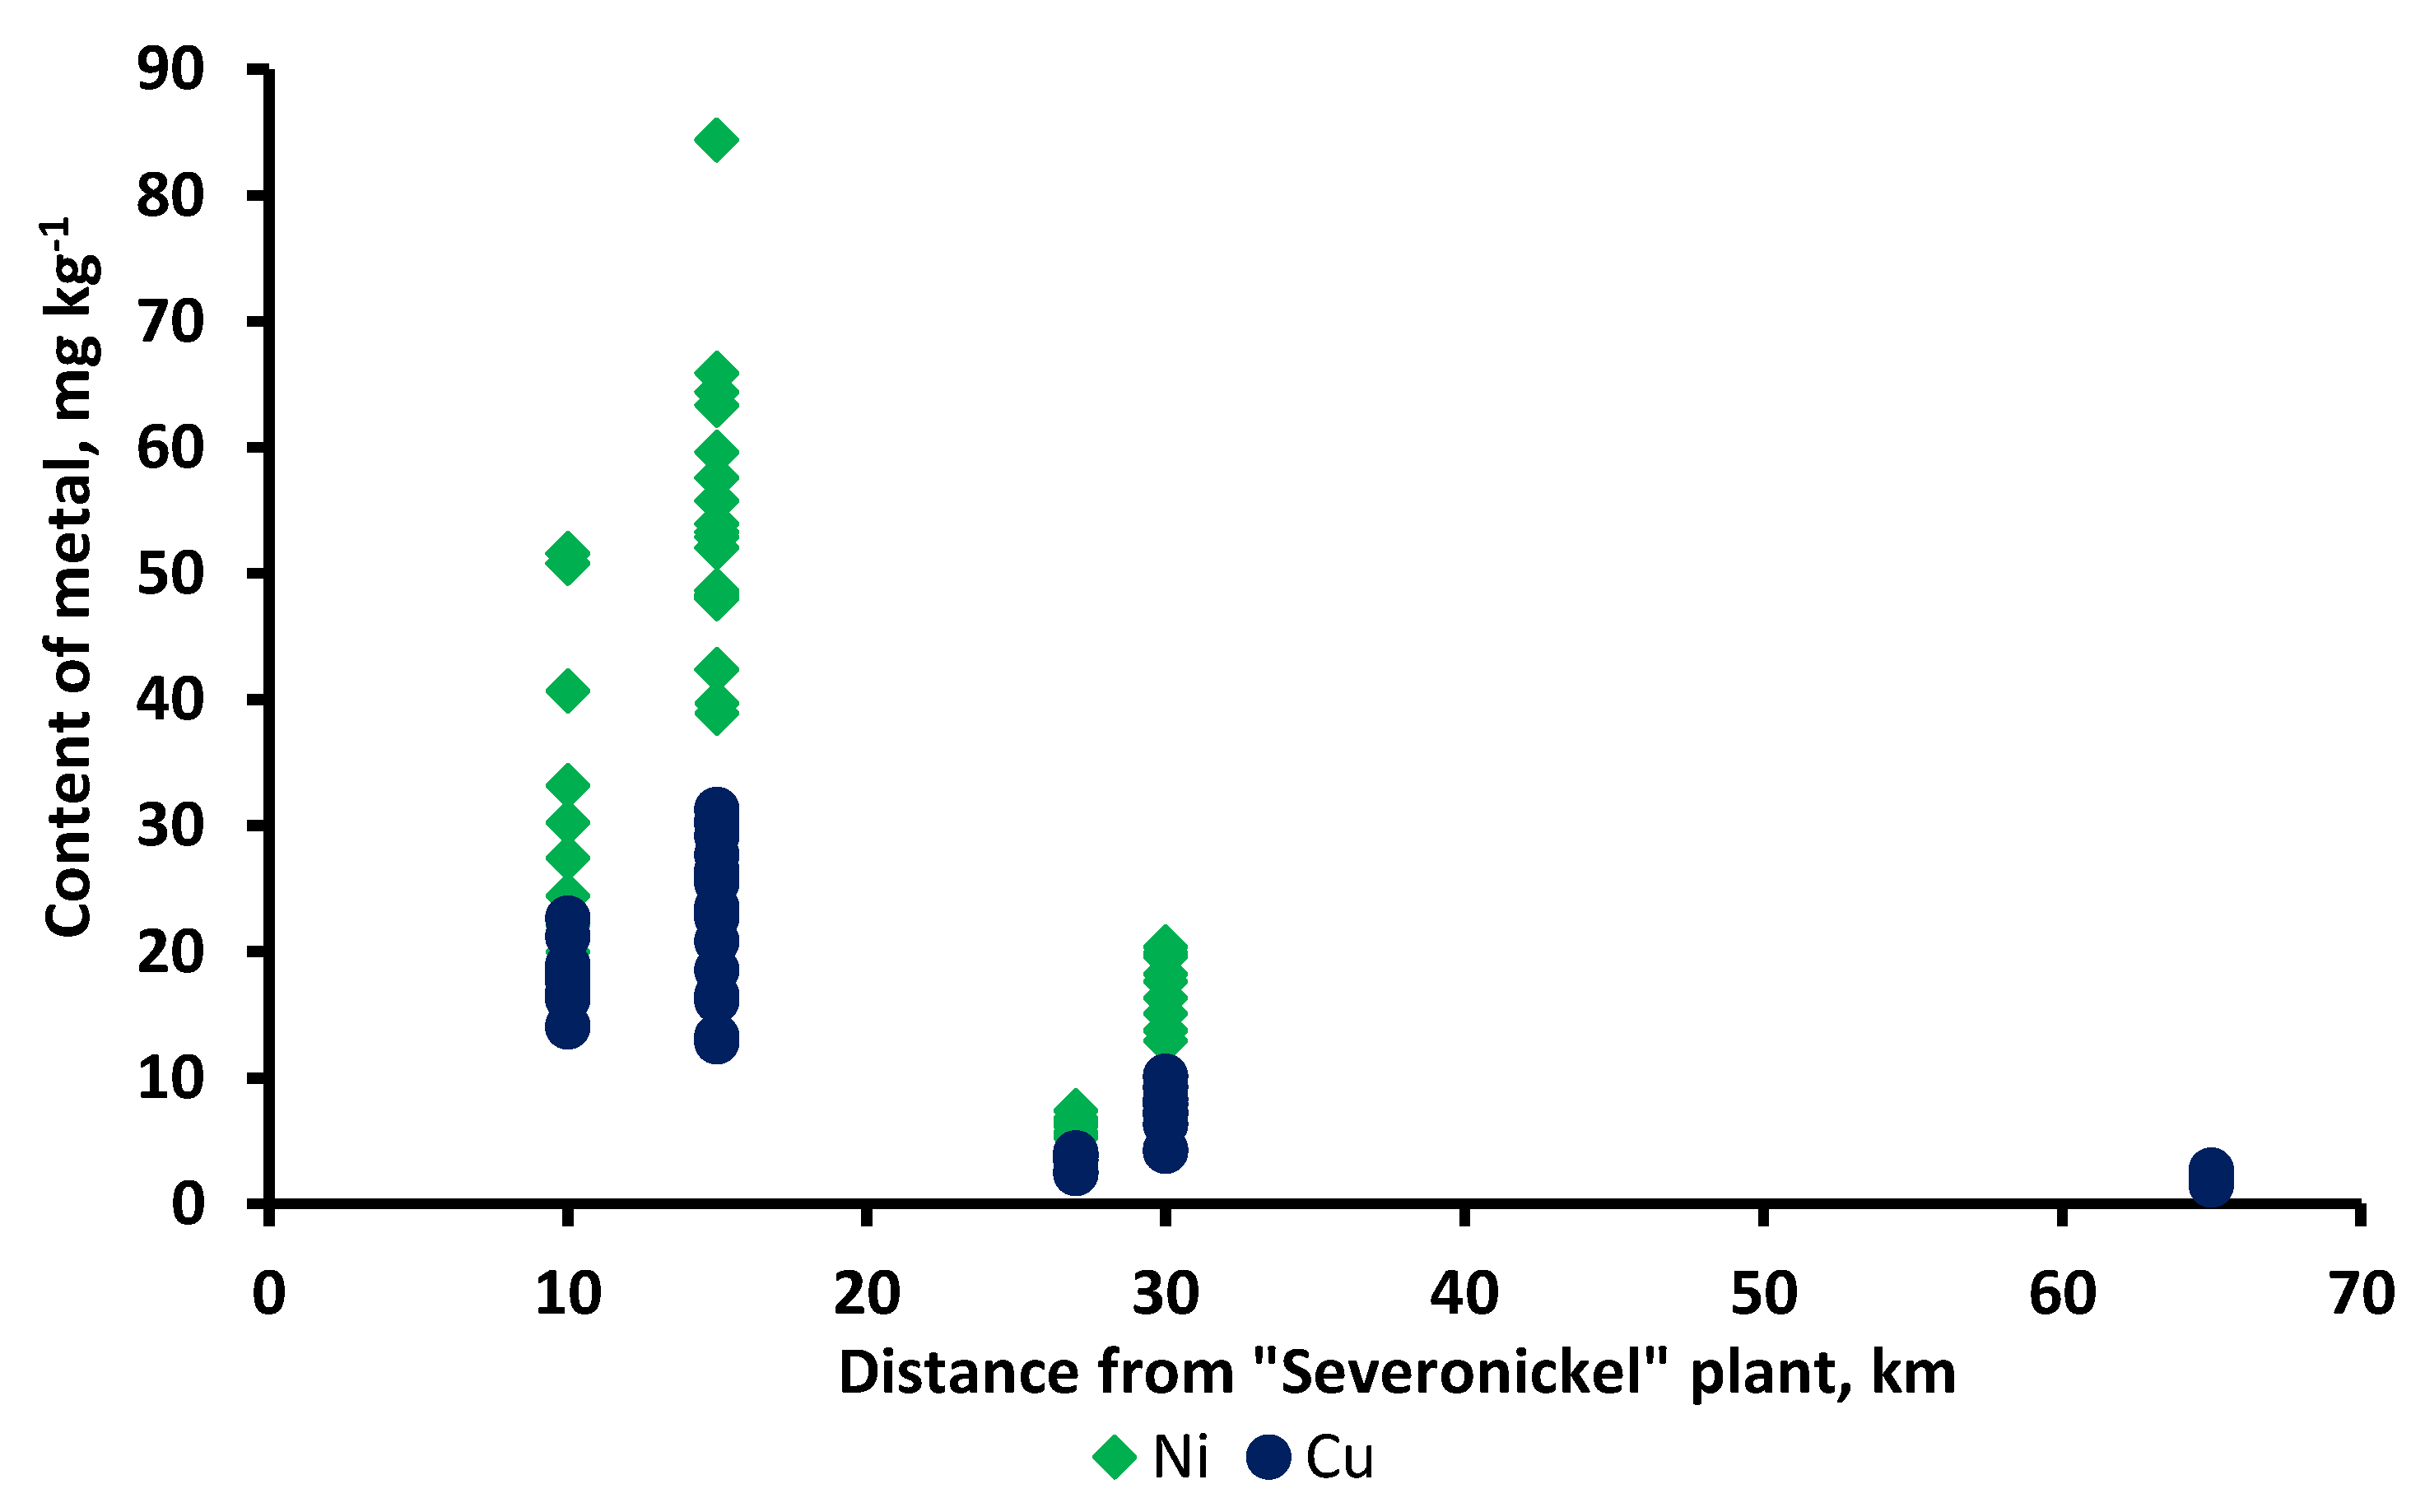
Figure 2.
Width of annual rings of Scots pine trees from the background, buffer and the impact zones.
Figure 2.
Width of annual rings of Scots pine trees from the background, buffer and the impact zones.
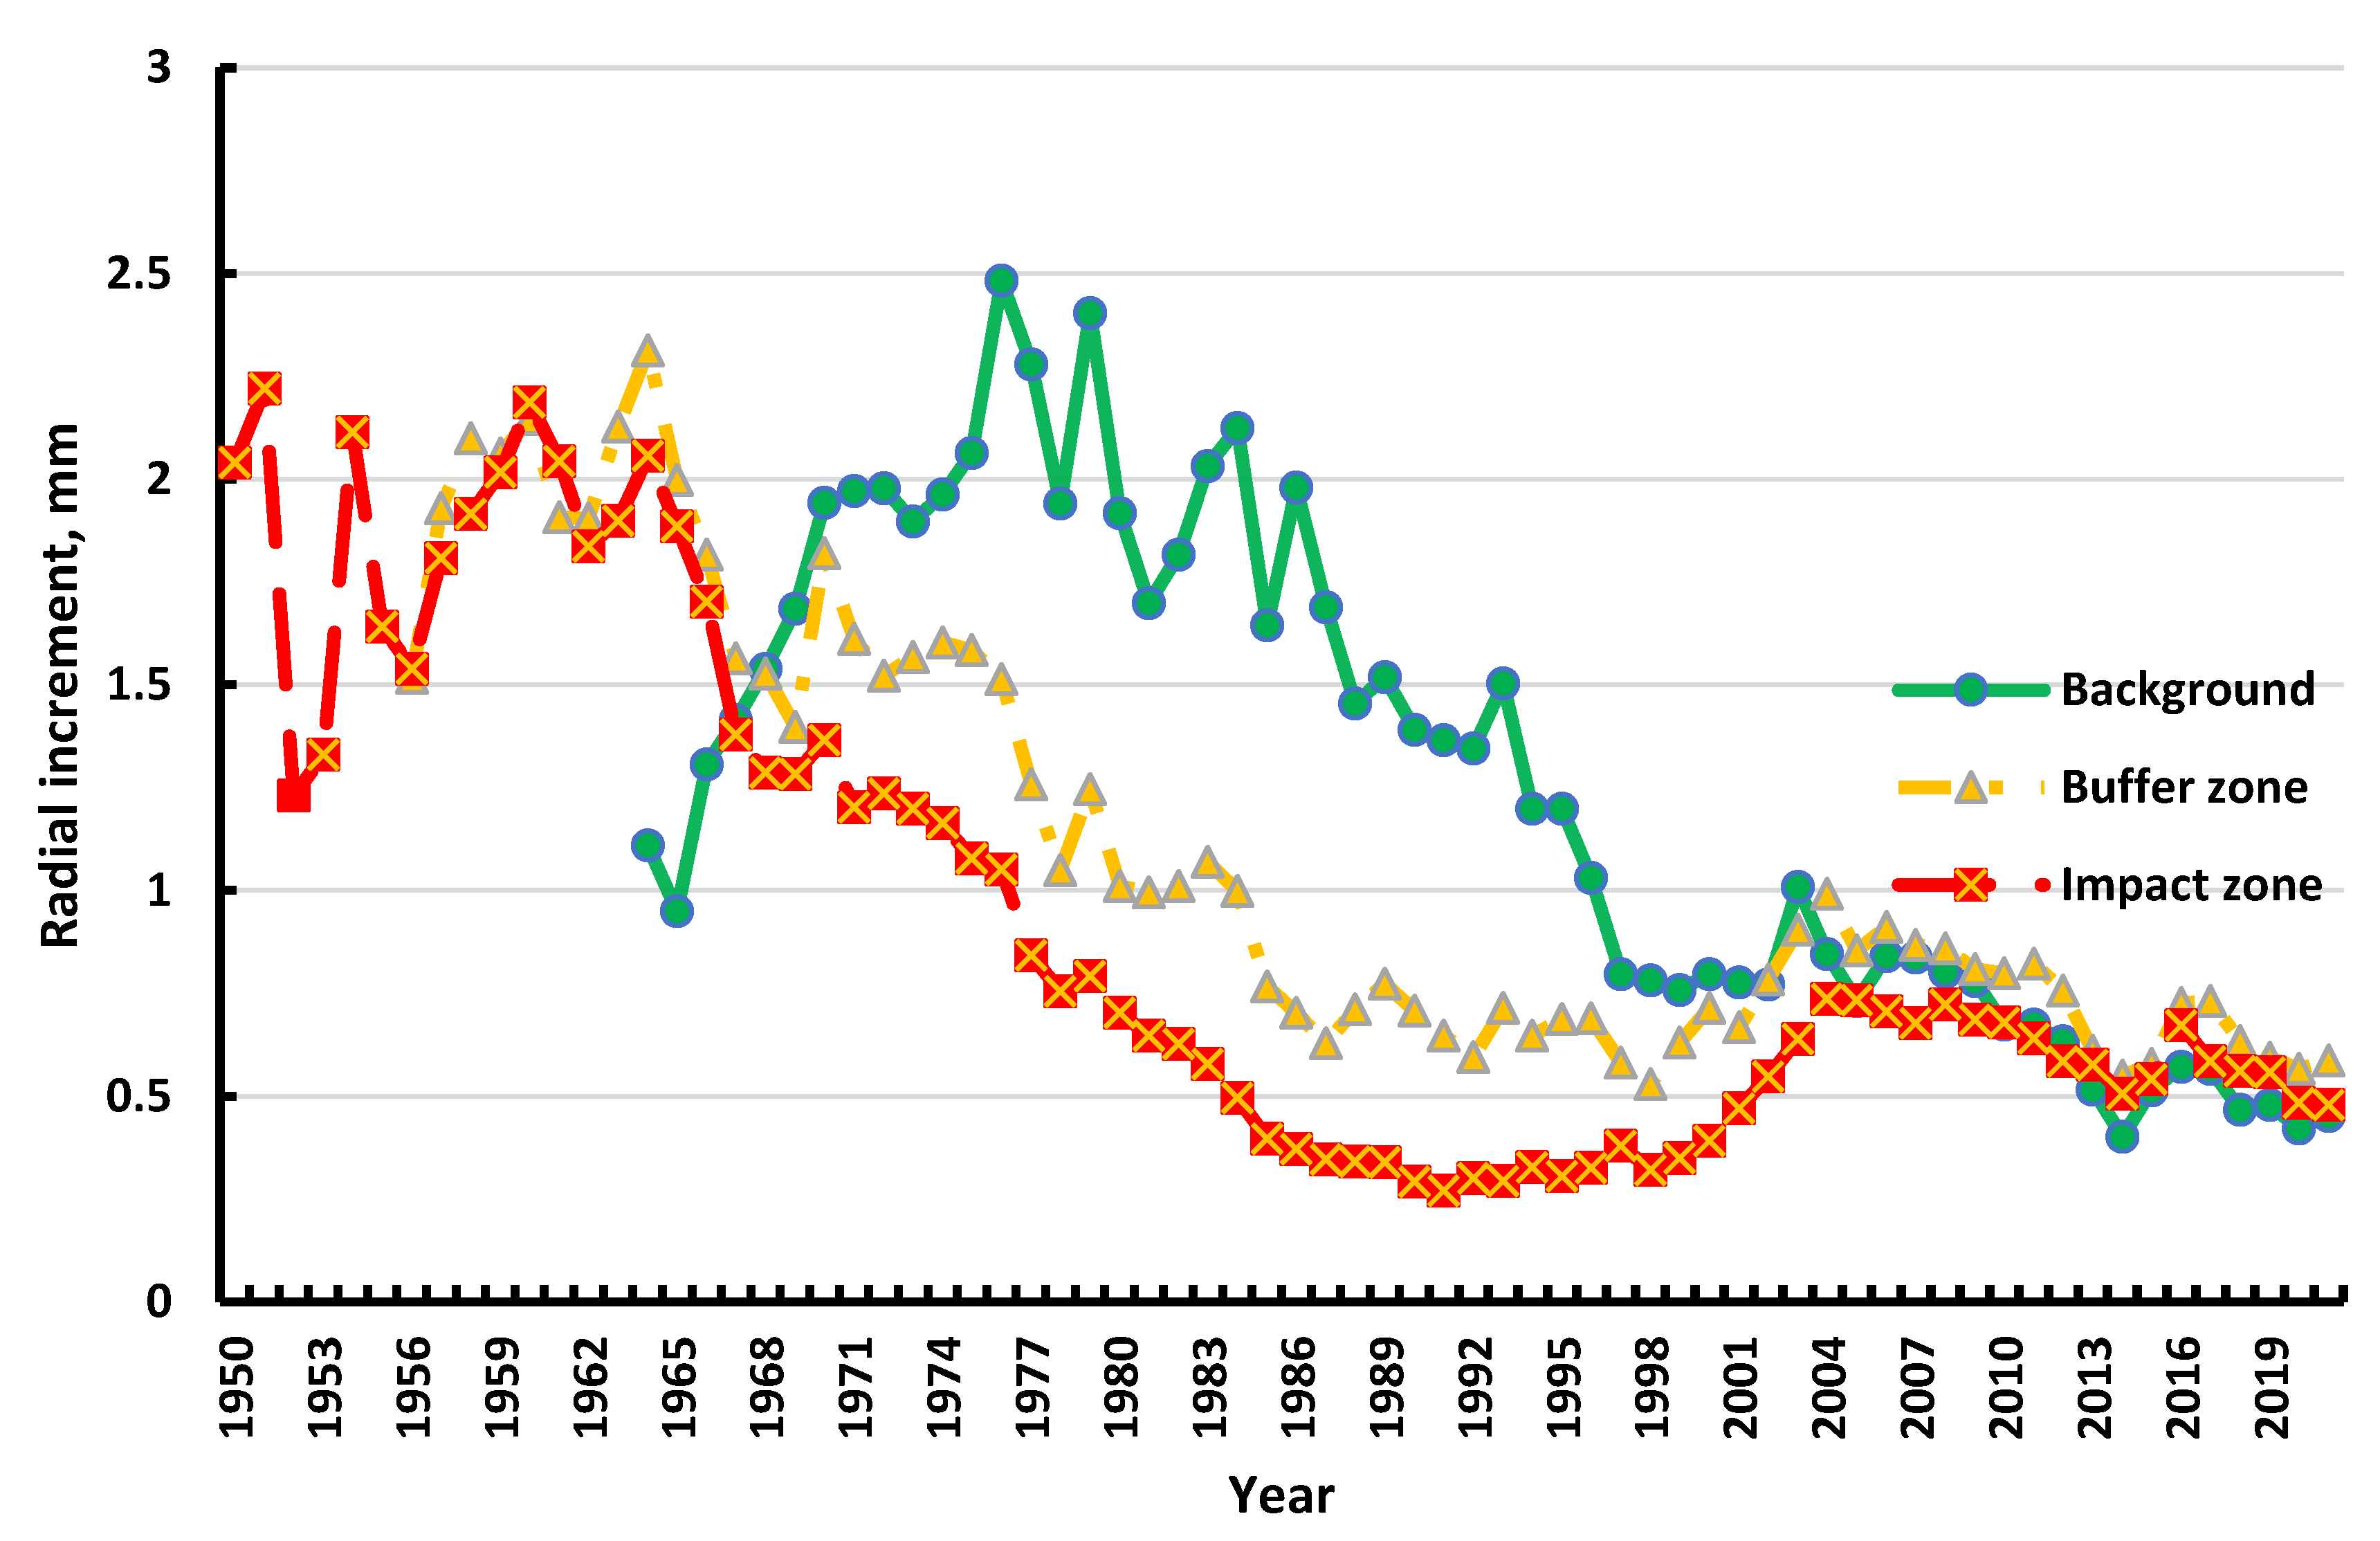
Figure 3.
Concentration coefficients of Ni and Cu in assimilation organs of plants from the impact zone in the period with high (1980–1999) and low (2002–2022) aerotechnogenic emissions.
Figure 3.
Concentration coefficients of Ni and Cu in assimilation organs of plants from the impact zone in the period with high (1980–1999) and low (2002–2022) aerotechnogenic emissions.
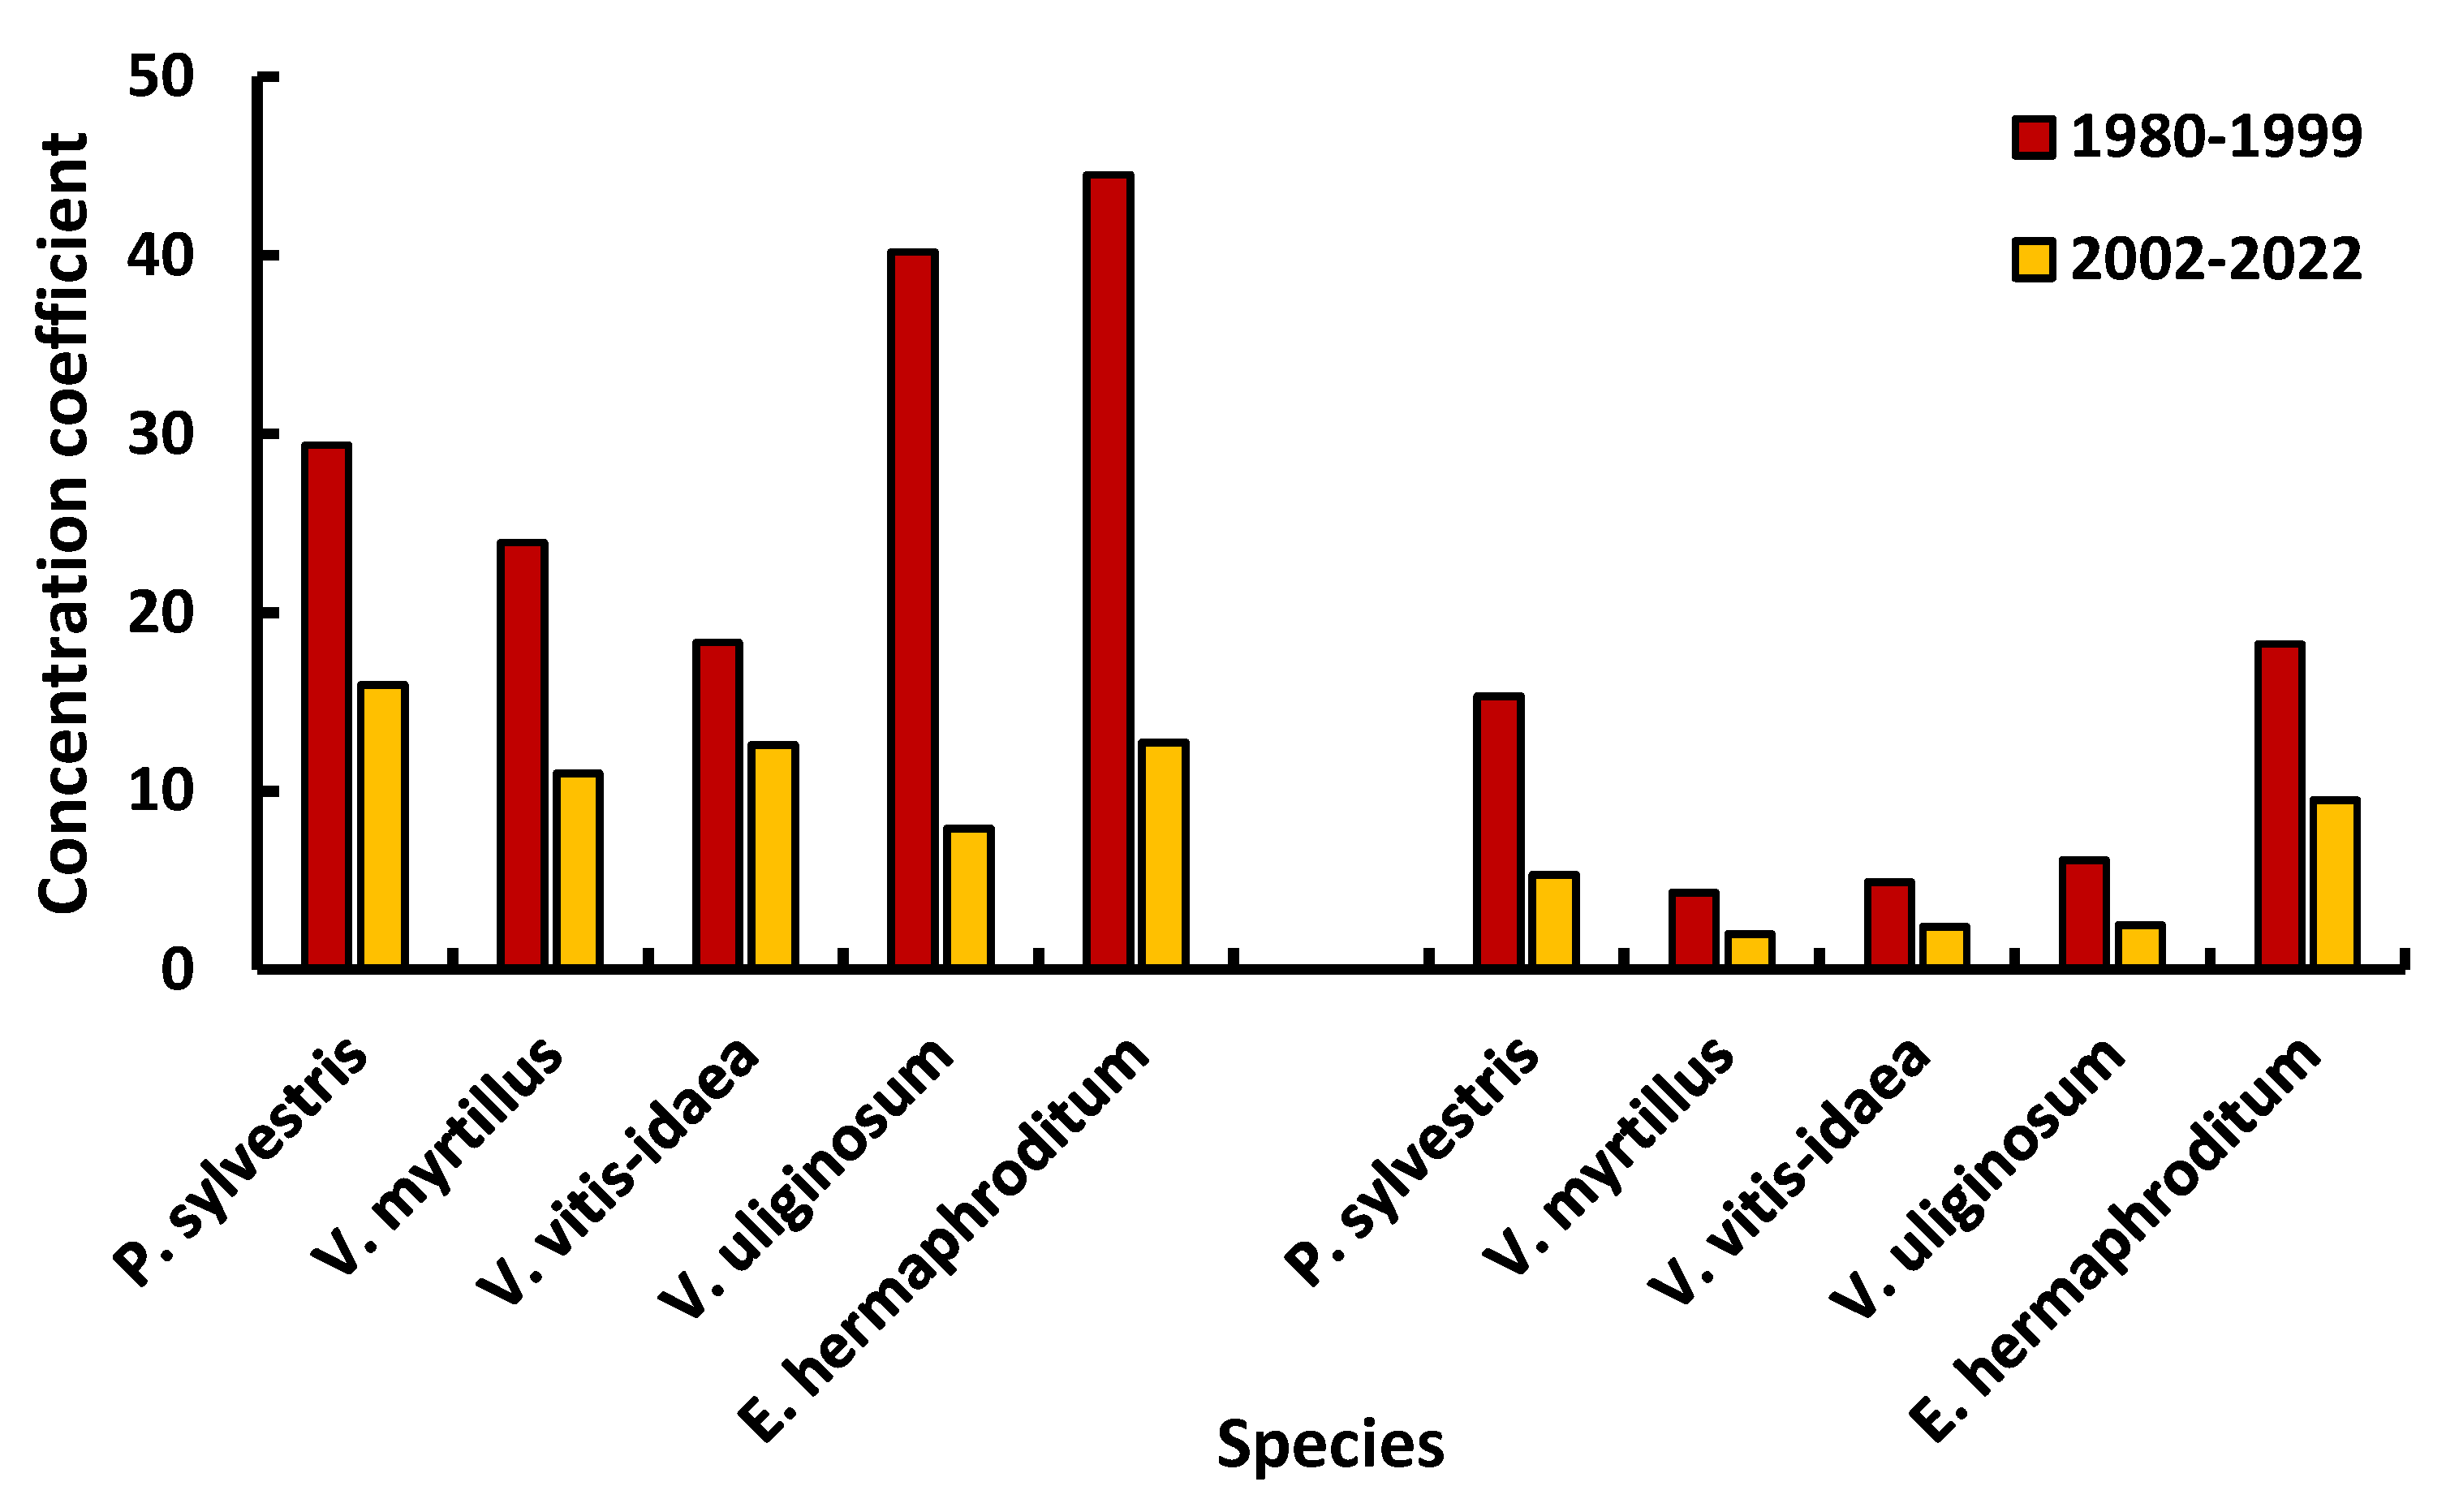

Table 1.
Characteristics of Pinus sylvestris model trees in the background, buffer and in the impact zones.
Table 1.
Characteristics of Pinus sylvestris model trees in the background, buffer and in the impact zones.
| Zone | Age (1.3 m), years | Diameter (1.3 m), cm | Height, m |
|---|---|---|---|
| Background | 52±4* (45–59) |
15.3±2.6 (11.0–21.2) |
10.6±1.0 (9.0–12.4) |
| Buffer | 59±6 (40–65) |
15.4±4.4 (8.4–24.6) |
11.4±2.5 (6.0–15.5) |
| Impact | 63±4 (45–72) |
12.5±2.8 (9.2–19.0) |
8.1±1.3 (6.0–10.5) |
Note: * – mean ± standard deviation, (min–max).
Table 2.
Basic statistics of the content (mg kg−1) of acid soluble forms of Ni, Cu, and Co in litter from the background, buffer and the impact zones.
Table 2.
Basic statistics of the content (mg kg−1) of acid soluble forms of Ni, Cu, and Co in litter from the background, buffer and the impact zones.
| Zone | Period | Metal | Mean | SD | Min | Max | CV [%] |
|---|---|---|---|---|---|---|---|
| Background | 1981–1997 | Ni | 9.1 | 3.8 | 3.4 | 16 | 42 |
| Cu | 9.2 | 4.6 | 2.8 | 18 | 49 | ||
| Co | 1.0 | 0 | 1.0 | 1.0 | 0 | ||
| 2002–2018 | Ni | 13.3 | 6.1 | 7.5 | 22 | 45 | |
| Cu | 17.9 | 4.8 | 13.1 | 27 | 27 | ||
| Co | 1.2 | 0.2 | 1.0 | 1.5 | 18 | ||
| Buffer | 1981–1997 | Ni | 49 | 17.3 | 17.8 | 68 | 35 |
| Cu | 54 | 31.4 | 13.7 | 110 | 58 | ||
| Co | 1.3 | 0.53 | 1.0 | 2.2 | 40 | ||
| 2002–2018 | Ni | 118 | 51.4 | 68 | 238 | 44 | |
| Cu | 264 | 123 | 174 | 547 | 46 | ||
| Co | 3.4 | 0.59 | 2.5 | 4.4 | 17 | ||
| Impact | 1981–1997 | Ni | 490 | 233 | 127 | 880 | 47 |
| Cu | 713 | 392 | 99 | 1200 | 55 | ||
| Co | 7.4 | 5.2 | 2.3 | 14.8 | 70 | ||
| 2002–2018 | Ni | 546 | 146 | 282 | 800 | 27 | |
| Cu | 1330 | 439 | 820 | 2180 | 33 | ||
| Co | 14.8 | 4.4 | 8.5 | 21.6 | 30 |
Note. Here and in Table 4: Mean is mean value, SD is standard deviation, Min and Max is minimum and maximum value, CV is coefficient of variation.
Table 3.
Results of linear regression analysis.
| Zone | Metal | N | a | b | R2 | p |
|---|---|---|---|---|---|---|
| Background | Ni | 27 | 0.212 | -412.2 | 0.2586 | 0.0157 |
| Cu | 27 | 0.399 | -783.8 | 0.6316 | 0.00001 | |
| Co | 15 | 0.007 | -13.7 | 0.3278 | 0.0324 | |
| Buffer | Ni | 27 | 2.587 | -5088 | 0.4333 | 0.0002 |
| Cu | 27 | 7.878 | -15589 | 0.5636 | 0.00001 | |
| Co | 17 | 0.068 | -134.0 | 0.7545 | 0.00001 | |
| Impact | Ni | 27 | 3.732 | -6945 | 0.0716 | 0.1772 |
| Cu | 27 | 23.21 | -45364 | 0.3641 | 0.0009 | |
| Co | 17 | 0.228 | -443.7 | 0.3344 | 0.0150 |
Note: N is number of samples; a, b are the coefficients of regression equations; R2 is coefficient of determination; p is significance level.
Table 4.
Basic statistics of Ni and Cu concentrations (mg kg−1) in the indicator species of plants from the background, buffer and the impact zones.
Table 4.
Basic statistics of Ni and Cu concentrations (mg kg−1) in the indicator species of plants from the background, buffer and the impact zones.
| Specie | Metal | Mean | SD | CV [%] | Min | Max | z (p) |
|---|---|---|---|---|---|---|---|
| Background | |||||||
| Pinus sylvestris | Ni |
5.0 2.3 |
2.5 0.6 |
50 26 |
2.0 | 7.8 | 2.143 (0.085) |
| Cu |
4.3 2.3 |
2.2 0.6 |
51 26 |
1.5 | 6.8 | 1.760 (0.139) |
|
| Vaccinium myrtillus | Ni |
5.0 3.8 |
2.6 0.4 |
52 11 |
3.3 | 8.0 | 1.069 (0.326) |
| Cu |
7.3 6.6 |
1.8 3.3 |
25 50 |
2.8 | 11.7 | 0.299 (0.775) |
|
| Vaccinium vitis-idaea | Ni |
5.0 2.3 |
2.6 0.4 |
52 17 |
2.0 | 7.8 | 2.316 (0.060) |
| Cu |
4.8 4.4 |
1.2 2.4 |
25 55 |
2.5 | 8.6 | 0.241 (0.818) |
|
| Vaccinium uliginosum | Ni |
2.8 3.0 |
0.5 0.9 |
18 30 |
2.0 | 4.2 | –0.276 (0.790) |
| Cu |
5.4 3.7 |
0.6 2.3 |
11 62 |
2.2 | 8.8 | 1.222 (0.257) |
|
| Empetrum hermaphroditum | Ni |
12.9 5.7 |
2.9 2.7 |
22 47 |
3.2 | 16.1 | 3.439 (0.018) |
| Cu |
9.3 3.1 |
1.6 0.5 |
17 16 |
2.7 | 10.5 | 7.532 (0.001) |
|
| Buffer zone | |||||||
| Pinus sylvestris | Ni |
39.0 12.0 |
10.6 2.6 |
27 22 |
8.4 | 49 | 5.037 (0.004) |
| Cu |
18.1 4.9 |
10.4 1.5 |
57 31 |
3.4 | 30 | 2.603 (0.048) |
|
| Vaccinium myrtillus | Ni |
24.1 18.9 |
6.8 5.6 |
28 30 |
8.0 | 31.8 | 1.221 (0.262) |
| Cu |
10.7 8.7 |
4.5 3.9 |
42 45 |
3.4 | 15.8 | 0.718 (0.496) |
|
| Vaccinium vitis-idaea | Ni |
24.2 11.0 |
4.2 4.1 |
17 37 |
7.5 | 28.3 | 4.550 (0.003) |
| Cu |
7.8 5.9 |
2.1 2.2 |
27 37 |
3.5 | 10.0 | 1.283 (0.240) |
|
| Vaccinium uliginosum | Ni |
11.7 8.2 |
2.0 3.2 |
17 39 |
2.8 | 11.8 | 1.462 (0.204) |
| Cu |
9.3 5.2 |
2.0 2.3 |
22 44 |
2.1 | 10.7 | 2.163 (0.083) |
|
| Empetrum hermaphroditum | Ni |
32.7 24.5 |
12.0 10.3 |
37 42 |
13.2 | 45.0 | 0.845 (0.446) |
| Cu |
11.7 7.5 |
3.6 1.6 |
31 21 |
6.0 | 15.5 | 1.816 (0.143) |
|
| Impact zone | |||||||
| Pinus sylvestris | Ni |
147 37.5 |
39.7 18.5 |
27 49 |
20.6 | 190 | 5.480 (0.002) |
| Cu |
65.5 12.3 |
32.7 5.7 |
50 46 |
4.8 | 103 | 3.755 (0.009) |
|
| Vaccinium myrtillus | Ni |
119 41.1 |
23.2 11.6 |
19 28 |
24.9 | 136 | 7.350 (0.001) |
| Cu |
31.2 13.2 |
8.1 5.6 |
26 42 |
6.3 | 40 | 4.123 (0.003) |
|
| Vaccinium vitis-idaea | Ni |
91 30 |
33.1 12.7 |
36 42 |
14.4 | 117 | 4.470 (0.002) |
| Cu |
23.5 10.7 |
5.7 6.2 |
24 58 |
4.2 | 25.1 | 3.416 (0.009) |
|
| Vaccinium uliginosum | Ni |
114 23.6 |
39.6 4.3 |
35 18 |
21.5 | 30.2 | 5.960 (0.002) |
| Cu |
33.2 9.2 |
6.3 4.7 |
19 51 |
5.9 | 34.8 | 6.650 (0.001) |
|
| Empetrum hermaphroditum | Ni |
576 72 |
220 38.5 |
38 53 |
36.5 | 1060 | 12.072 (0.000) |
| Cu |
169 30 |
74 9.4 |
44 31 |
12.4 | 315 | 5.866 (0.001) |
|
Note: above the line - the average content of metal in the leaves (needles) of plants for the period 1980-1999, below the line - the same for the period 2002-2022; z – Mann–Whitney test; p – significance level.
Table 5.
Basic statistics of the growth ring width (mm) of Pinus sylvestris at a height of 1.3 m in the background, buffer and the impact zones.
Table 5.
Basic statistics of the growth ring width (mm) of Pinus sylvestris at a height of 1.3 m in the background, buffer and the impact zones.
| Zone | Period | Mean | SD | Min | Max | CV [%] | z (p) |
|---|---|---|---|---|---|---|---|
| Background | 1980–1999 | 1.462 | 0.414 | 0.758 | 2.125 | 28 | 4.842 (<0.001) |
| 2000–2019 | 0.685 | 0.160 | 0.402 | 1.008 | 23 | ||
| Buffer zone | 1980–1999 | 0.755 | 0.166 | 0.530 | 0.549 | 22 | –0.555 (0.58) |
| 2000–2019 | 0.758 | 0.124 | 1.069 | 0.993 | 16 | ||
| Impact zone | 1980–1999 | 0.401 | 0.133 | 0.271 | 0.703 | 33 | –4.071 (<0.001) |
| 2000–2019 | 0.611 | 0.094 | 0.391 | 0.736 | 15 |
Disclaimer/Publisher’s Note: The statements, opinions and data contained in all publications are solely those of the individual author(s) and contributor(s) and not of MDPI and/or the editor(s). MDPI and/or the editor(s) disclaim responsibility for any injury to people or property resulting from any ideas, methods, instructions or products referred to in the content. |
© 2023 by the authors. Licensee MDPI, Basel, Switzerland. This article is an open access article distributed under the terms and conditions of the Creative Commons Attribution (CC BY) license (http://creativecommons.org/licenses/by/4.0/).
Copyright: This open access article is published under a Creative Commons CC BY 4.0 license, which permit the free download, distribution, and reuse, provided that the author and preprint are cited in any reuse.


