
Submitted:
30 October 2024
Posted:
31 October 2024
You are already at the latest version
Abstract
Sustainable soil resource management requires detailed knowledge of soil pollution sources and their share in total pollution level. Spatial pollution caused by the total cumulative atmospheric deposition remains largely unknown, as the biggest pollutant emissions occurred in XIX/XX centuries. The use of ombrotrophic peatlands that are specific isolated ecosystems fed only through atmospheric deposition may serve as its natural archives. Accumulation of Cd and Pb from atmospheric deposition in undisturbed soil layers in relation to their total deposited cumulative loads recorded in the ombrotrophic peat bog was exemplified in the Izera Mountains. area historically heavily affected with the transboundary long-range transmission of pollutants from Germany, Czech Republic and Poland. Balance of deposited Cd and Pb loads in soil in relation to the total cumulative deposition determined from peat records, showed 30% depletion of Cd load in the soil profile due to washout of mobile phases, while that of Pb practically did not decline. The deposited element accumulation and release/depletion in undisturbed soil profiles can thus be quantified in relation to the total cumulative load of atmospheric deposition. This shows a new prospective application of peat bog records as monitors of total cumulative loads of trace elements supplied to soils from atmospheric deposition.
Keywords:
priority pollutants
; atmospheric deposition
; Long-Range Transmission of Air Pollutants (LRTP)
; cumulative pollutant loads
; Cd/Pb deposition balance
; soil pollution
; Cd/Pb deposition share in soil pollution
; ombrotrophic peat bogs
; natural deposition repositories
1. Introduction
Spatial pollution caused by atmospheric deposition appeared to be one of the most important, and in many formerly anthropogenically weakly affected or pristine areas the predominant source of land pollution, such as in southern Norway [1,2,3,4,5,6,7,8]. Increasing evidence of the scale, range and extent of atmospheric transport and deposition of pollutants, and its role in local and transboundary transmission of pollutants and soil pollution, resulted in adoption of the Convention on Long-range Transboundary Air Pollution [9] and of the Protocol on the Cooperative Programme for Monitoring and Evaluation of the Long-Range Transmission of Air Pollutants in Europe (EMEP) [10]. Extensive efforts directed to combatting pollutant emission have led to substantial temporal and spatial reduction of wet and dry deposition. This contributed to the significant reduction of the current soil pollution from long-range transmission of pollutants (LRTP), and specifically from fugitive potentially toxic trace elements (PTEs), including priority pollutants Cd and Pb [e.g. [11,12,13]. Nevertheless, the total cumulative atmospheric deposition of PTEs in the area, its share in the total pollution with PTEs of different origin, and its fate in soils remain largely unknown. The biggest emission loads of PTEs, their transport and spatial deposition fall on pre-monitoring times. Information supplied by MCS-E/EMEP databases is relatively new (four decades back only) and covers a period of extensive efforts on emission reduction, while the rapid development of industry lasted nearly a quarter of the Millennium. The major part of it occurred in the nineteenth and early twentieth centuries, when not much attention was paid either to monitoring or control of metal emissions.
Under these circumstances, the use of ombrotrophic peat bogs as archives of total cumulative spatial pollution loads of airborne elements originating from atmospheric deposition appears to provide solution of this problem. Ombrotrophic peatlands are specific ecosystems isolated from ground and surface water and fed only through wet (rain, fog, snow) and dry (dust) deposition carried by air currents. This makes them ideal inventory objects accumulating persistent atmospheric contaminants in surface layers of organic matter.
For the first time the possibility of quantifying cumulative anthropogenic atmospheric lead deposition using peat cores from bogs was reported by Shotyk et al. [14]. However, much of the further research efforts of different authors were focused on the use of ombrotrophic peat bogs for paleoenvironmental studies that added much to the knowledge on peatbog geochemistry, however not considered deposited load balance [e.g. [15,16,17,18,19,20,21,22,23,24,25,26]. Our studies on ten peat bogs in Norway and Poland have confirmed that peat cores might at best serve as exact records of total cumulative spatial deposition of airborne elements from LRTP complementary to EMEP data [5,27].
The relation between deposited metal accumulation and behavior in ombrotrophic peat bog and undisturbed soil layer in the areas affected by PTE deposition from LRTP has not yet been studied and reported so far. Simultaneously, such comparative data could have provided information regarding fate of deposited pollutants in closed and open environmental systems such as ombrotrophic peat bogs and soil. This study on the hazardous priority pollutants Cd and Pb aimed at justifying the applicability and reliability of ombrotrophic peat bogs as inventories of total cumulative loads of pollutants from atmospheric dry and wet deposition complementing EMEP data (limited to four last decades only). Another major aim was to determine total balance and clarify fate of deposited trace metals Cd and Pb in soil in relation to the total cumulative deposited load, which has not been studied so far.
2. Materials and Methods
2.1. Site Description
For the study, the area heavily affected by LRTP was selected. The research site is located in the Izera Mountains in southwestern Poland, 50°49’ - 50°51’N and 15°18’-15°29’ E (Figure 1). The average annual precipitation is 1200 mm. The prevailing winds are from southwest direction, except for May, June and July, when mostly northerly winds prevail [28,29,30]. The site selected for the study is located in the 529.36 ha large Izera Valley Nature Reserve established in 2000. Historically, this area was relatively densely populated. The occurrence of rich quartz deposits resulted in the development of a settlement existing from the late 13th up to the 19th century. In 1754, a glassworks was built in Hala Izerska, which operated for almost 140 years and was closed down only in 1890. There are also deposits of tin, cobalt and copper ores in the Izera Mountains, whose mining began in the 16th century.
The research site lays within the so-called “Black Triangle” area, which besides the aforementioned local sources and an impact of LRTP since the beginning of industrial revolution at the end of 18th century, in the late 1960-80-ties of the 20th century was particularly strongly affected by the LRTP from Poland, Czech Republic and Germany (Figure 1). Severe air pollution originated mostly from the large lignite-fired power plants and chemical industries. Since 1989 it substantially declined due to strong reduction of emissions [28].
Within the Reserve borders, a large ombrotrophic peat bog surrounded with forest and natural meadows is located. The vegetation is typical for highland peat bogs. It comprises among others abundant various Sphagnum species [32]. The peatlands in the Izera Mountains are considered a specific type of mountain subarctic peat bogs and share many features with northernmost peat bogs, particularly with those in Scandinavia [30,33]. Peat thickness ranges from 1 to 4 m [33]. The soils in the Izera Mountains are represented mainly by acidic brown soils formed from weathered granite and granite gneisses [34,35].
2.2. Sample Collection
The soil and peat cores sampling were performed in October 2014. Three double peat cores 15x15 cm were cut off from a peat bog up to 50 cm down, and the undisturbed soil profile was sampled up to 20 cm down with the use of a ceramic knife. The locations of sampling points are shown in Table 2 and Figure 1. Undisturbed peat cores were wrapped in polyethylene cling foil, placed tightly into hard plastic containers with customized dimensions, and transported by a refrigerator van to the laboratory.
The undisturbed soil profiles S1-S5 were sampled 4-5 km from the peat core locations, S2 at the exposed space and other four profiles in the forest (Table 2; Figure 1). The general sampling procedure was in accordance with the ISO 18400 standards [36,37,38,39,40,41,42]. The collected samples were acid brown soil formed from weathered Izera granites. The soil was sampled at increments 0-5, 5-10, and 10-20 cm down, which represented A (topsoil) and B (subsoil) horizons.
Soil samples were treated similarly as peat samples. They were quantitatively transferred to hermetically closed polyethylene bags to prevent any moisture loss and other changes, labeled, and transported by a refrigerator van to the laboratory.
2.3. Sample Processing and Analysis
In the laboratory, three major peat cores were unpacked, cut at increments up to 3 cm and used for the analysis of deposited elements, and for isotope dating. The core doubles were used for assessment of basic peat properties and physico-chemical analysis. Laboratory samples of soil were prepared from the bigger samples according to ISO 23909 standard [43] and further pretreated for physico-chemical analysis [44]. Major physico-chemical properties of peat and soil (pH, moisture, ash, organic matter content, dry bulk density) were assessed by ASTM standard methods [45,46,47,48]. Soil pH and electric conductivity (EC) were determined using a multifunction meter according to ISO 10390 [49]. Carbon, nitrogen and hydrogen (CNH) in the samples were measured with a FLASH 2000 Elemental Analyzer. Other soil properties were assessed according to the general procedure [50]. The degree of peat decomposition was evaluated according to the von Post scale, which provides a semi-quantitative description of the extent of humification from 1 (poorly decomposed) to 10 (highly humified).
The peat age dating along the core P1 was accomplished by the 14C and 210Pb techniques at GADAM Centre of Excellence, Department of Radioisotopes, Institute of Physics at the Silesian University of Technology in Gliwice, Poland. The measurements of natural concentrations of 14C in samples were performed using liquid scintillation spectrometers Quantulus 1220 and ICELS. Concentrations of 210Pb were measured by alpha spectrometry. For alpha activity measurements, a Canberra model 7401 spectrometer with a surface-barrier Si semiconductor detector was used. For data interpretation, age-depth modeling was applied with the use of OxCal v 4.2.4. [51] calibration program. The 210Pb technique of peat dating was applied for the upper part of the core P1 up to 29 cm depth. The 14C dating [52,53] was performed along the core P1 from the layer 29 cm deep up to the core base at the depth of 44 cm according to the protocol developed by Piotrowska et al. [54].
For element concentrations, peat was analysed at the Department of Chemistry, Norwegian University of Science and Technology (NTNU), Trondheim in Norway. The weighed amounts of about 0.1-0.3 g of homogenized and sieved dry matter were digested in a microwave system, in 14 M HNO3 (Merck, Suprapure) and the clear solution was analyzed for 68 elements, among them for total Cd and Pb in peat using a Thermo Finnigan ELEMENT 2 high-resolution ICP-MS instrument. For QA/QC, the certified reference material Soil GBW 07408 and the reference material Humus H1 and H2 from a European intercomparison exercise [55] were used to validate the method for the mineral and surface soil samples, respectively. For both studied elements an accuracy better than 10% was obtained.
Based on the measured values of the studied metal concentrations in sampled peat and soil layers Cn (mg/kg), and their dry density ρdn (g cm-3), peat and soil dry mass Mn (kg/m2), incremental loads of pollutants Ln (mg m-2) in sampled layers of thickness n (cm), and total loads of pollutants retained in peat profiles ΣLn (mg m-2) were calculated as described by Miszczak et al. [5]:
- -
- Peat dry mass in a layer n: Mn = 103 ρdn n
- -
- Incremental loads of pollutants in a layer n: Ln= Cn Mn
- -
- Total cumulative load of a pollutant in a peat profile: ΣLn
The total cumulative load of the studied metals in peat profiles was assumed to constitute Pb and Cd atmospheric deposition in the area.
To differentiate between metal distribution in peat and soil resulting from lithological and environmental factors, chemical fractionation of Pb and Cd was further performed using three-step sequential extraction of BCR (Community Bureau of Reference) [56], which has shown high reproducibility in long-term studies on the association of trace metals with organogenic matters [56,57,58,59]. For QA/QC, CRM 601 (lake sediment) reference material certified for the BCR procedure was used.
3. Results and Discussion
3.1. Soil Physico-Chemical Properties
In the area, acid brown soils about 20 cm thick formed on weathered granite classified as Dystric Cambisols [60] prevail. The acidity level of soils varied spatially and in different soil horizons, showing the highest acidity in subsoil, and the lowest in the mineral C horizon. Strongly acid mean pH value of soils in the mineral horizon C confirms that acidity of parent rocks (granite) was a decisive factor in primarily acid pH level of soils in topsoil and subsoil. Higher acidity of the overlying humus layers pointed at organic acid decomposition and anthropogenic sources (acid deposition from LRTP) as major sources of very strongly acid mean pH 4.78 of subsoil and strongly acid mean pH 5.15 of topsoil) (Table 1). In turn, higher mean acidity of subsoil than that of topsoil horizon may be attributed to improved air quality due to drastic reduction of disastrous emissions from big lignite-fired power plants and related industries in Germany, Poland and Czech republic since 1990 and extensive weathering/ leaching processes in topsoil on the one hand, and by the shielding effect of the regenerating high vegetation in some parts of the area on the other hand (Table 1).
The Cd and Pb contents in five undisturbed soil profiles were conssiderably higher than the average abundance in unpolluted topsoil of this type (0.08-0.3 mg kg-1Cd, and mean 16.4 mg kg-1 Pb [61].
Contamination factor CF [62] indicates very high and considerable Cd pollution, and considerable and moderate Pb average pollution of topsiol (A-horizon) and subsoil (B-horizon), respectively. Distribution in soil profiles, and the highest enrihment in topsoil clearly points at atmospheric deposition as a major source of these metals in soil (Table 1).
For the comparative analysis, the undisturbed soil profile S2 was selected due to its location in the area most exposed to atmospheric deposition, in the highest part of the area (868 m asl). The profile S2, similarly to other soil profiles, represented a 20 cm thick acid brown soil layer formed on weathered granite. Of this, 0-10 cm was topsoil (A horizon) and 10-20 cm subsoil (B horizon) laying on poorly weathered granite bedrock. The pHH2O values (4.50 - 4.86) (Table 2B) classify soil profile as very strongly acid [63]. As in the whole area, a primary source of soil acidification is acid parent rock (granite) and weathering processes of soil minerals. However, the lowest pH values occurred in the uppermost humus layer, while a clearly higher pH (pHH2O 4.86, pHKCl 3.88) was observed in subsoil at the parent rock level. This confirms a dominance of external sources of acidity over the parent rock, which is justified by a long-term impact of LRTP from big lignite-fired power plants and associated industries within the “Black Triangle”.
The Eh values, similarly to those in peat (Table 2A), indicated oxic environment. In comparison with peat, topsoil contained much less moisture (at the level of 66%) and OM (47.8% - 57.9%) and displayed much greater ash content (42.1- 52.2%). The subsoil layer, besides being slightly less acidic, comprised mostly mineral matter (91.2%), was poor in OM (8.8%), and had low moisture content (28.4%) (Table 2B).
3.2. Peat Physico-Chemical Properties
Some physico-chemical properties of the studied peat are presented in Table 2A. Peat decomposition/humification degree according to the van Post scale ranged from H1 to H6 along all peat cores, with substantial differences between the profiles and a general increasing trend downward.
All peat samples were classified as very strongly or strongly acid (pHH2O 4.42 to 5.39) [63] characteristic for ombrotrophic bogs due to enrichment in carboxylic and phenolic functional groups. High moisture (86.8% - 93.3%) and organic matter (OM) contents (92.5- 97.8%), and low dry bulk density (0.060 – 0.132 g cm-3) and ash content (2.2-7.5%, average 5.9% DW) are also characteristic features of ombrotrophic peat bogs. By contrast, the layers 5-10 cm in all three peat cores stood out for unusually high ash content (10.9-19.3%, average 15.9%, DW). The increased ash contents in this layer along with the highest decomposition degree might be ascribed to the particularly intense technogenic particle deposition in 1970-1980-ties, when the layer was formed, or to the impact of river sediments possibly brought to the area during the so-called “Millennium Flood” in 1997. Dry bulk density of peat showed uneven distribution along all three studied cores (Table 2A). Similarly to the peat decomposition degree, its distribution pattern in all profiles substantially differed from each other.
3.2.1. Peat Age
Peat dating was performed for one core (P1), 44 cm deep (Figure 2 - Peat). The surface peat layer (0-3 cm) was formed in 2010 CE on average, while the deepest layer (41-44 cm) originated from 1530 CE on average. Therefore, the core represents about 500 years’ long history of Pb and Cd deposition and accumulation, partially from minor local sources but mostly from LRTP.

Table 2.
Physico-chemical properties of peat (A) and soil (B) in the studied profiles.
| Layer | Peat decomposition |
pH | pH | Eh | σ 1 | Moisture content |
Ash | OM |
| H2O | KCl | content | ||||||
| cm | mV | µS cm-1 | % | % | % | |||
| (A) PEAT | ||||||||
| P1 | (lat. 50.85114 N, long. 15.35466 E, 828 m), Ombrotrophic peat | |||||||
| 0-5 | H1 | 4.83±0.24 | 3.11±0.16 | 236±12 | 99±5 | 87.1±4.4 | 7.3±0.4 | 92.7±4.6 |
| 5-10 | H4 | 4.57±0.23 | 3.08±0.15 | 274±14 | 149±7 | 86.9±4.3 | 17.4±0.9 | 82.6±4.1 |
| 10-20 | H3 | 4.42±0.22 | 2.98±0.15 | 236±12 | 106±5 | 87.6±4.4 | 5.2±0.3 | 94.8±4.7 |
| 20-40 | H4 | 5.03±0.25 | 3.15±0.16 | 241±12 | 126±6 | 86.3±4.3 | 6.3±0.3 | 93.7±4.7 |
| P2 | (lat. 50.85175 N, long. 15.36155 E, 828 m), Ombrotrophic peat | |||||||
| 0-5 | H2 | 5.39±0.27 | 3.24±0.16 | 204±10 | 82±4 | 86.8±4.3 | 6.7±0.3 | 93.3±4.7 |
| 5-10 | H5 | 4.71±0.24 | 3.20±0.16 | 244±12 | 50±3 | 87.3±4.4 | 19.3±1.0 | 80.7±4.0 |
| 10-20 | H2 | 5.00±0.25 | 3.20±0.16 | 218±11 | 44±2 | 90.5±4.5 | 3.8±0.2 | 96.2±4.8 |
| 20-40 | H2 | 5.30±0.27 | 3.05±0.15 | 238±12 | 46±2 | 93.3±4.7 | 2.2±0.1 | 97.8±4.9 |
| P3 | (lat. 50.85208 N, long. 15.36105 E, 829 m), Ombrotrophic peat | |||||||
| 0-5 | H2 | 5.24±0.26 | 3.35±0.17 | 225±11 | 177±9 | 91.4±4.6 | 7.4±0.4 | 92.6±4.6 |
| 5-10 | H4 | 4.47±0.22 | 3.20±0.16 | 263±13 | 50±3 | 90.6±4.5 | 10.9±0.5 | 89.1±4.5 |
| 10-20 | H4 | 4.86±0.24 | 3.16±0.16 | 247±12 | 104±5 | 90.2±4.5 | 6.7±0.3 | 93.3±4.7 |
| 20-40 | H6 | 4.68±0.23 | 3.13±0.16 | 234±12 | 110±6 | 90.1±4.5 | 7.5±0.4 | 92.5±4.6 |
| (B) SOIL | ||||||||
| S2 | (lat. 50.81641 N, long. 15.37677 E, 868 m), Acid brown soil | |||||||
| 0-5 | 4.59 ± 0.23 | 3.20 ± 0.16 | 198 ± 20 | 168±8 | 66.4 ± 3.3 | 52.2 ± 2.6 | 47.8 ± 2.4 | |
| 5-10 | 4.50 ± 0.22 | 3.10 ± 0.15 | 235 ± 23 | 132±7 | 66.5 ± 3.3 | 42.1 ± 2.1 | 57.9 ± 2.9 | |
| 10-20 | 4.86 ± 0.24 | 3.88 ± 0.19 | 314 ± 31 | 72±4 | 28.4 ± 1.4 | 91.2 ± 4.6 | 8.8 ± 0.4 | |
1 σ – electrical conductivity; OM – organic matter
3.3. Contents and Distribution of Cd and Pb from Atmospheric Depositionin the Peat and Soil Profiles
3.3.1. Peat as a Repository of Cd and Pb Atmospheric Deposition
The downward distribution of Cd and Pb concentrations appeared to be different for all the studied peat profiles (Figure 2 – Peat). For P1 and P2 profiles, there is one distinct peak for Cd, but at different depths, at 3-6 cm (mean age 1999 CE) in P1 and at 13-15.5 cm in P2. In the P3 profile, there are two peaks for Cd in the layers 6-9 cm and 25-28 cm (Figure 2A – Peat).
Figure 2.
Distribution of Cd (A) and Pb (B) concentrations along the peat and soil profiles
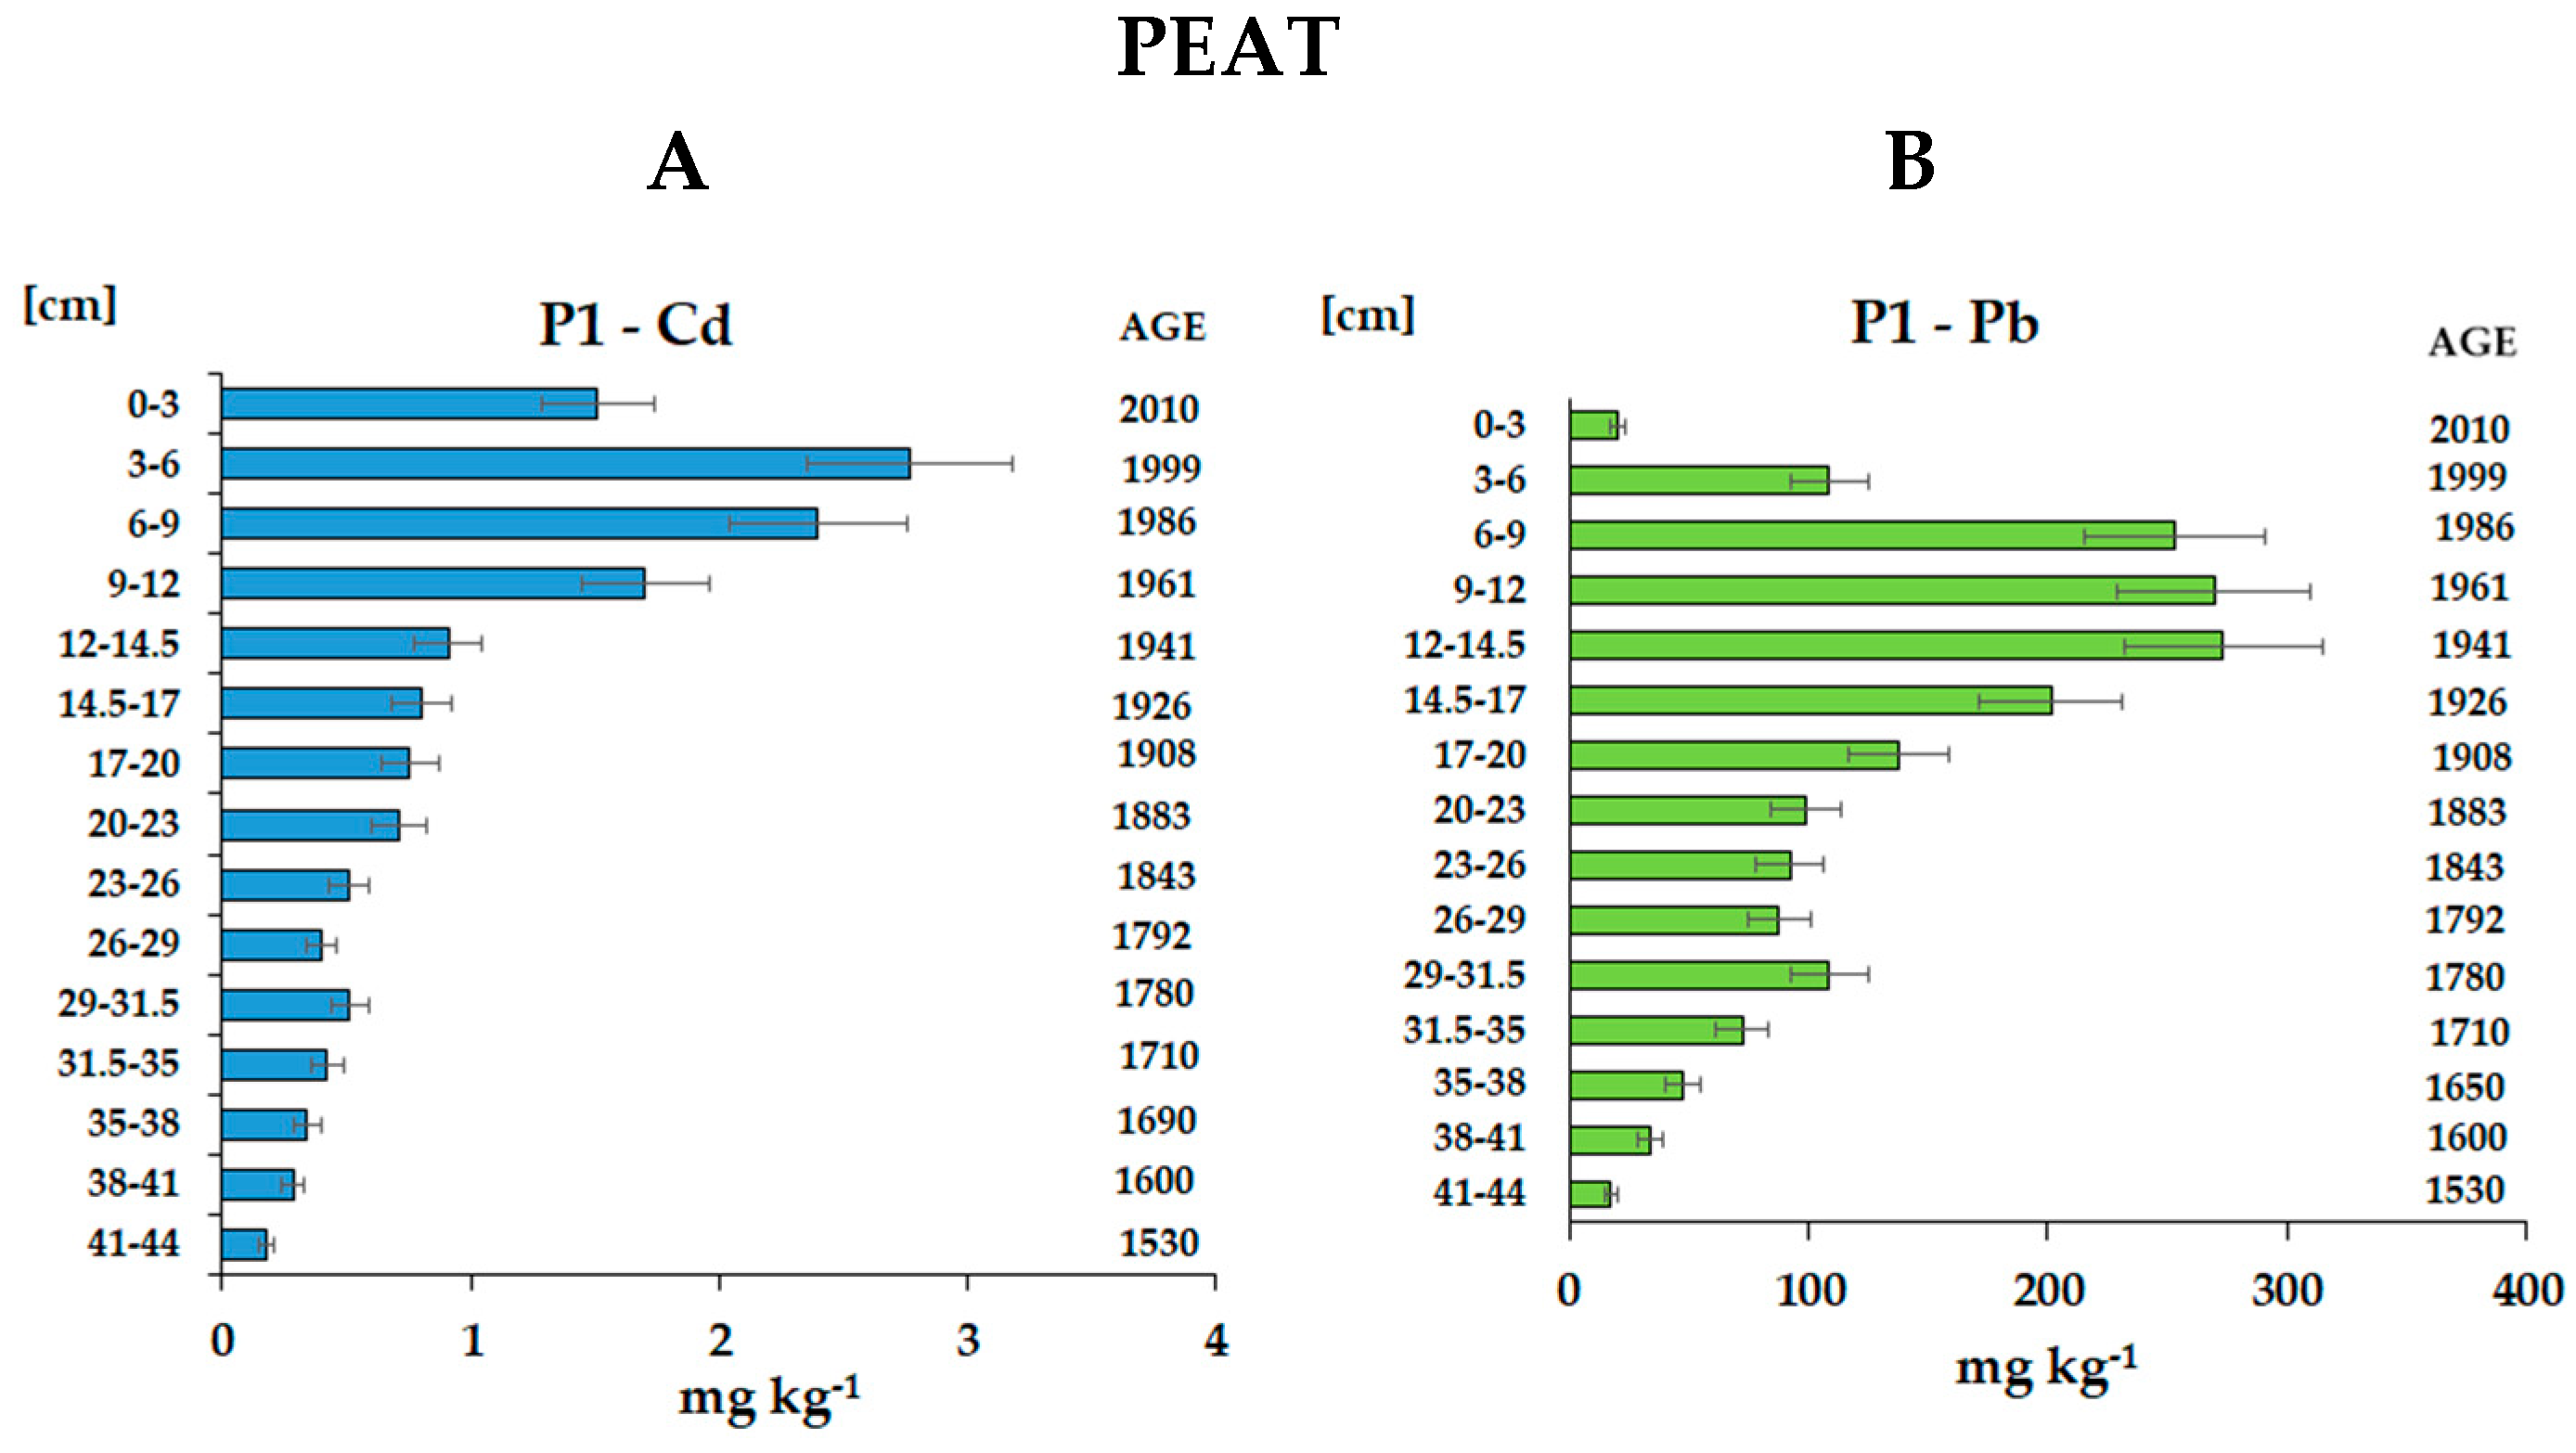
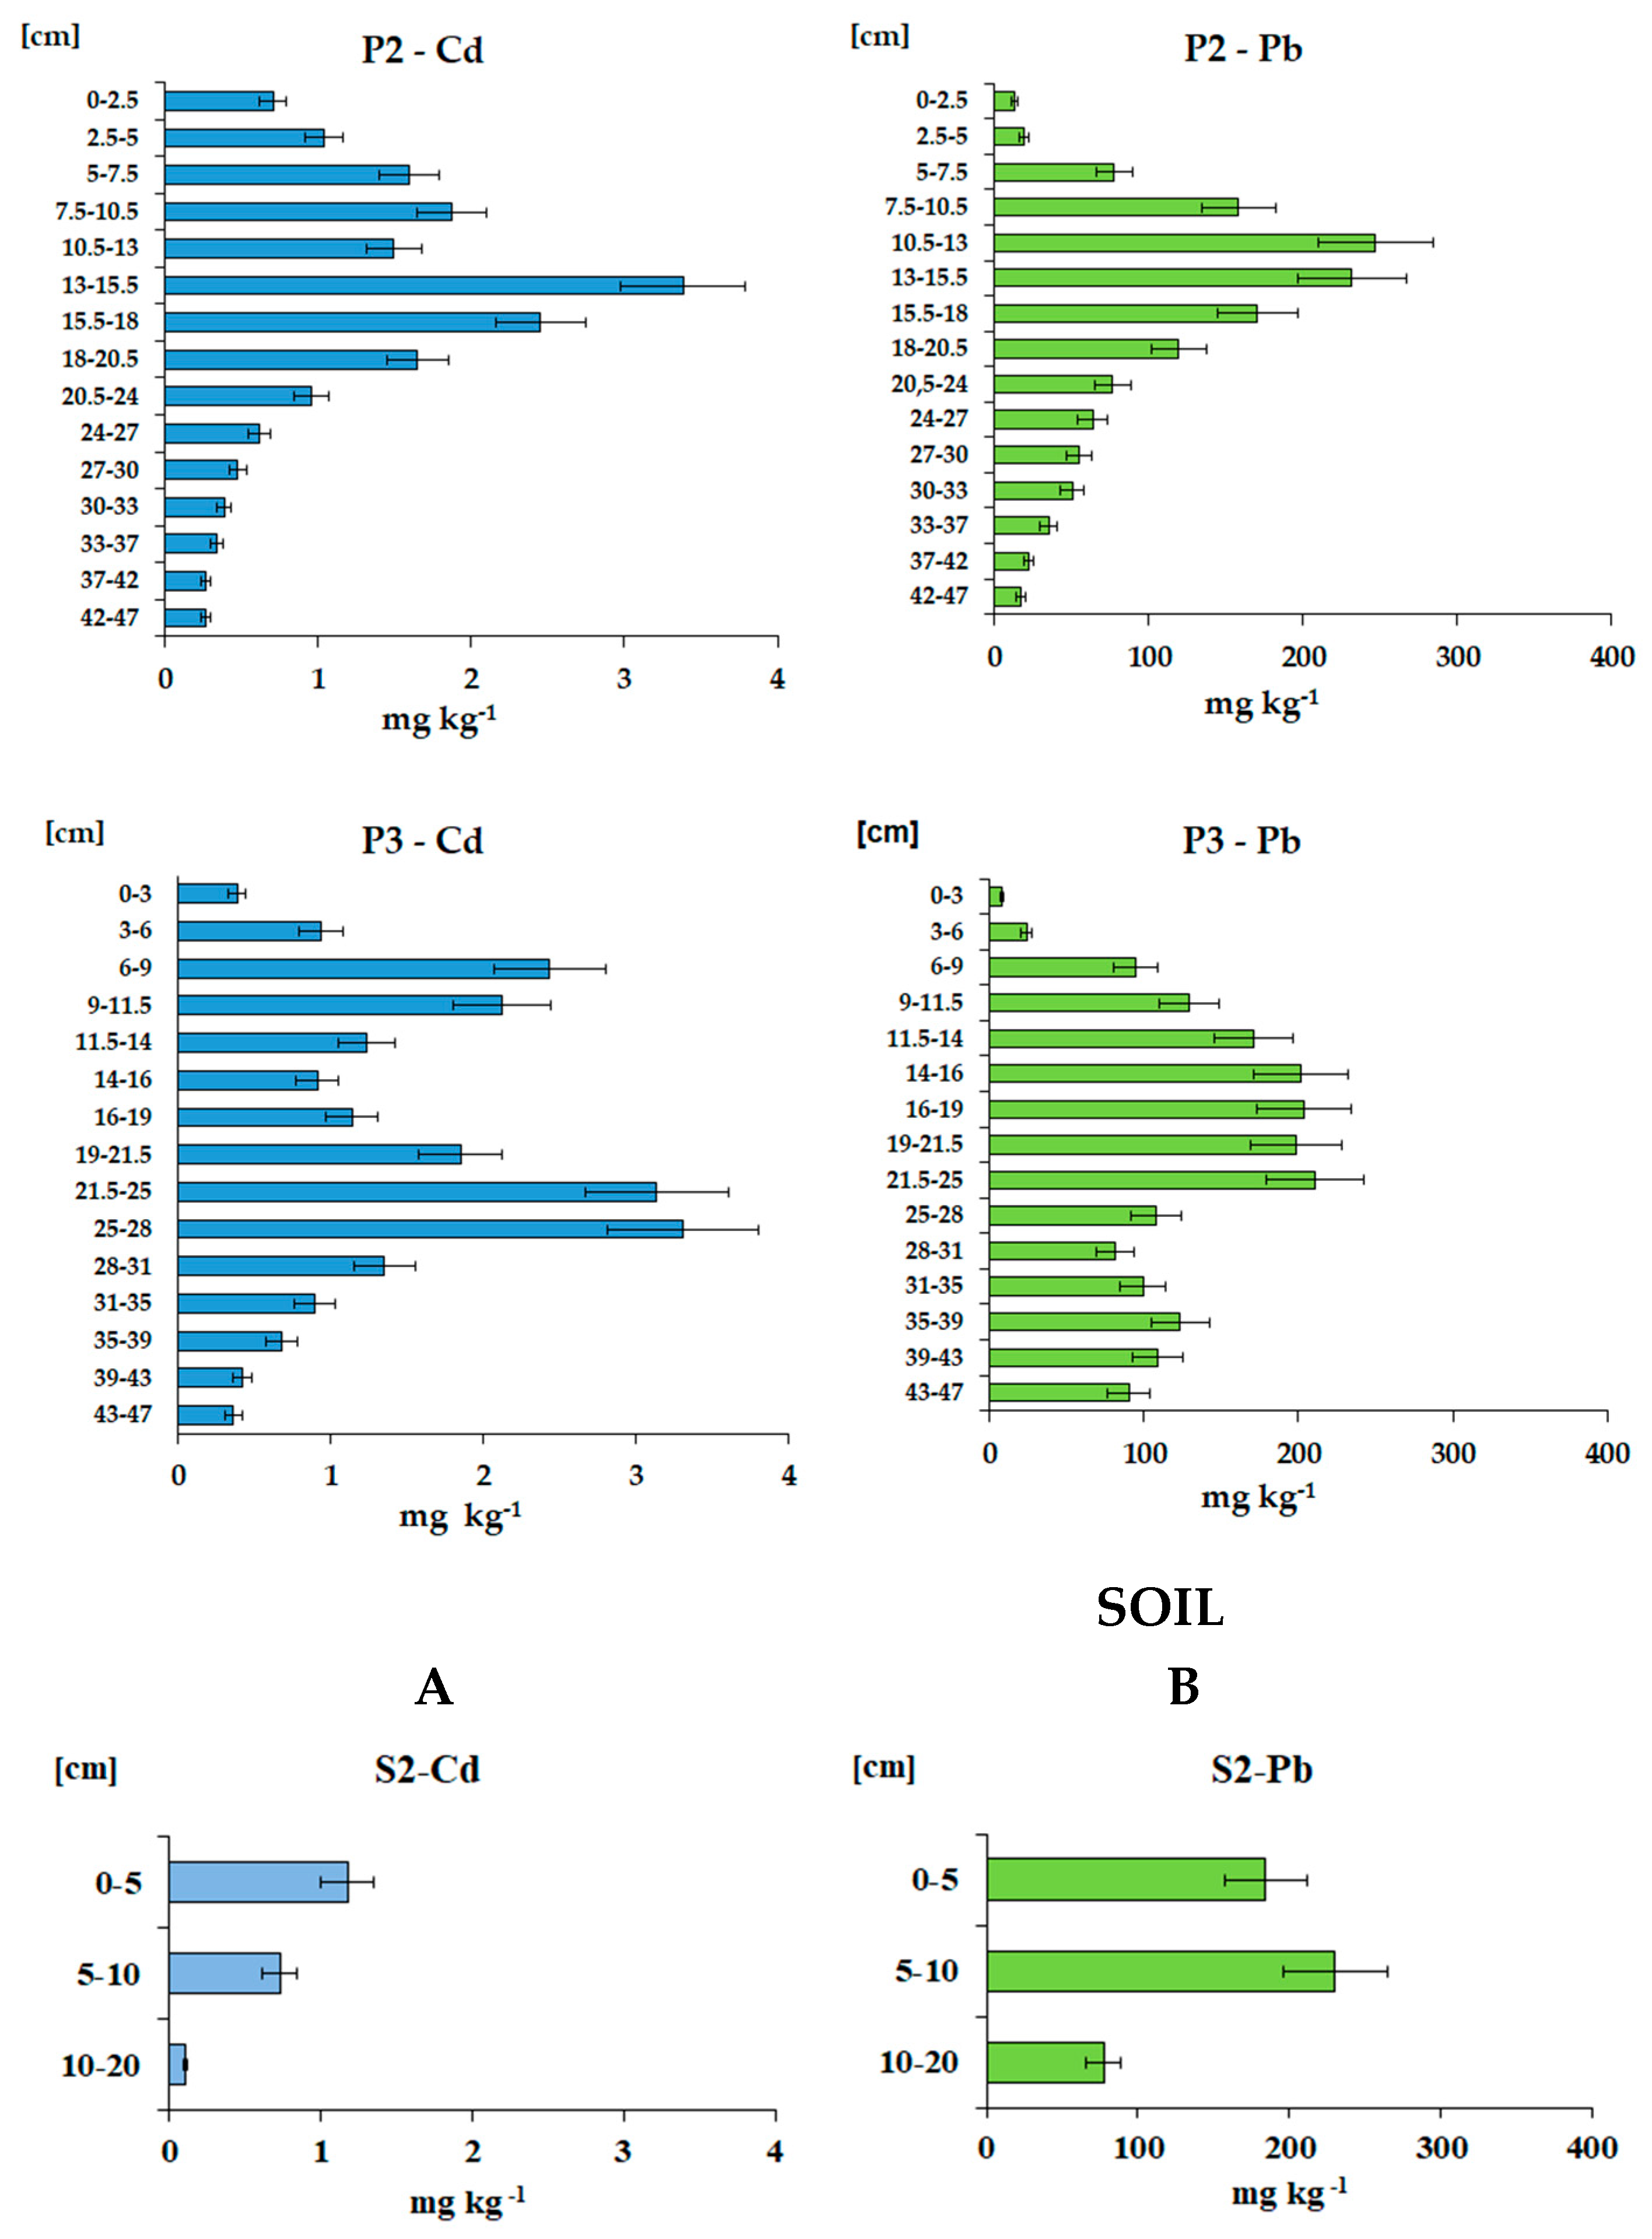
Vertical distribution pattern of Pb concentrations along the studied peat profiles was basically similar to that of Cd. Many times, greater deposition resulted in adequately high peak values of Pb (Figure 2B - Peat). However, Pb in the dated P1 profile showed the highest, gradually increasing concentrations in the layers 6-9 cm and 9-12 cm (mean age 1986 and 1961 CE, respectively), reaching maximum values in the deeper layer 12-14.5 cm (mean age 1941 CE, i.e. earlier than maximum emission occurred). In the P2 profile, maximum Pb concentrations were recorded in 10.5-13 cm layer. In the P3 profile, similarly to Cd, two concentration peaks occurred, however with the different broad hump in the layers 14-16 cm, 16-19 cm, 19-21.5 cm, with the maximum in the layer 21.5-25 cm, and the smaller peak in the layer 35-39 cm.
The Cd/Pb distribution along the peat profiles shows exponential patterns of concentration increase/decrease above and below the peaks. Such patterns, besides changes in deposition, may also be associated with vertical redistribution resulting from different mobility of elements, and with differences in the peat bulk density and open porosity influencing the pore solution flux rate [5].
Some role may also exert relatively thick historical population in the area since 13th century, and its second wave since 16th to 19th century related to the development of artisanal mining of quartz, and later on of tin, cobalt and copper ores in the Izera Mountains nearby, but mostly to the crystal glass production in 18th -19th centuries (see section 2.1). In 19th century, the population in the region significantly declined due to decline of mining and industrial activities.
Such local sources may contribute to uneven spatial pollution not observed in peat bogs located far away from the local sources [5]. In addition to the local sources of pollution resulting from the varied development of settlements during the 18th and their declining in 19th century (1754-1891), a more definite local source of atmospheric pollution was a glassworks producing leaded crystal glass. In 1970-1980s, besides already existing long-range transport of pollutants (LRTP) from more remote areas, a profound, dominating source of pollution from LRTP became the newly constructed big “Black triangle” power plants in Germany, Czech Republic and Poland and related industries. All these factors significantly influenced Cd/Pb concentration patterns in peat profiles, while vertical redistribution of these metals was further intensifying due to the differences in peat properties in the studied cores (extent of decomposition, bulk density) that affected the vertical flux rate of the pore solution.
3.3.2. Distribution and Cumulative Loads of Cd and Pb from Atmospheric Deposition in Peat Profiles
While concentration patterns are influenced by the uneven bulk density/pore structure of peat, Cd and Pb loads reflect actual deposited metal distribution along the peat profiles (Table 3A). In the dated profile P1, Cd shows a maximum deposition in the layers 6-9 cm and 3-6 cm formed during the period 1970-2000. In the layer 9-12 cm formed during the 1960-1970s, the deposited Cd load appears to be still high, while considerably lesser and exponentially decreasing Cd loads occurred downward up to the deepest layer 41-44 cm attributed to XVI century. Some irregularities in the exponential decrease in the layers between 17-20 cm (mean 1908 CE) and 29-31.5 cm (mean 1780 CE), and downward may be ascribed to the influence of local deposition from historical glassworks. The contemporary layer 0-3 cm (mean 2010 CE) accumulated considerably lesser Cd load than the deeper layers formed since 1940s, which may be due to the improvement of emission control within the “Black Triangle” area, and the low bulk density that promotes deposited trace metal migration downward both with solid particles and in solution.
The vertical distribution of Cd incremental loads in cores P1, P2 and P3 retained similar patterns as concentrations, substantially different from each other (Table 3A, Figure 2A - Peat). The lack of peat dating in P2 and P3 cores precludes intercomparison of Cd downward redistribution related to the layer age. However, it illustrates the diversity of deposited metal accumulation and behavior in the peat layers.
The same can be concluded with respect to accumulated Pb loads in the studied peat cores (Table 3A, Figure 2B - Peat). Both Cd and Pb loads accumulated in peat cores in principle demonstrated patterns similar to concentration patterns corrected for bulk density (Figure 2B - Peat vs Figure S1B - Peat). However, one observation seems to be puzzling. While Cd is commonly regarded as a labile element, also in ombrotrophic peat bogs [e.g. [64,65], Pb by most researchers, in particular by those involved in paleoenvironmental studies, is considered immobile [e.g. [25,26]. At the same time, comparison of Pb and Cd load distribution along the peat cores in this study shows temporal inconsistency of these elements accumulation, and occurrence of high Pb loads in layers deeper than that of Cd, and beyond the known history of “Black Triangle” maximum emissions related to big lignite-fired power plants construction and operation in Germany, Czech Republic and Poland. Fast increase of area pollution due to atmospheric deposition started in late 1960-ties, reached particularly high level in 1970-1980-ties, and declined due to hard control/closure measures in 1990-ties [28,66]. In P1 core maximum Cd deposition coincides with this chronology, falling on the layers 3-9 cm (1986-1999 CE on average), and exponentially declining in 9-12 cm layer (1961 on average) and downward in the older layers, suggesting vertical redistribution of this mobile metal.
Maximum deposited loads of Pb were detected in the layers 6-12 cm (1961-1986 CE on average that coincides with maximum LRTP), however gradually decreasing in 12-14.5 layer (1941 CE on average) and further downward. This exhibits a distinct gradual shift of accumulated Pb loads to the older layers formed in the time preceding the post-war development of the “Back Triangle” emission sources in Saxony (DDR, Germany). Czech Republic and Poland. The enrichment of older layers with Pb may partially originate also from other, but manyfold weaker LRTP and local emission sources, therefore the dramatic increase of Pb depositions should have displayed rather jumping (discrete) character, while actual pattern is clearly exponential. Small Cd and Pb accumulation peaks in the layer 29-31.5 cm (1780 CE on average that coincides with the leaded glass production) and elevated loads of both metals in the layers 20-29 cm reflecting deposition history from the local leaded crystal glassworks, also show distinct exponential extension to the older deeper layers suggesting vertical redistribution of both metals (Table 3A, Figure S1 - Peat P1). It is noteworthy that such inconsistency in Pb enrichment in the dated peat profile was already observed but rather ignored [25] that was the subject of a later heated dispute [5,26,27]. However, this sensitive topic that needs much more attention is not related to the major aim of this study and therefore will not be discussed further.
In the two other undated profiles, Cd and Pb load patterns, besides general similarity, also show distinct differences, even more pronounced than those of concentration patterns. In P2, a characteristic irregular hump with elevated Cd enrichment comprised the 2.5-24 cm depth of the profile, with the highest Cd loads in 7.5-18 cm layers and the maximum load in the 13-15.5 cm layer. The load pattern of Pb in this profile was more regularly shaped, showing the highest values in the 7.5-15.5 cm layers with the maximum in the 10.5-13 cm layer (Table 3A, Figure S1B – Peat P2).
In the profile P3, elevated Cd and Pb enrichment occurred practically within the whole profile, with two Cd load peaks, lower in 6-9 cm layer and the highest in 21.5-25 cm layer Elevated Pb loads in this profile occurred from 6 cm downwards with a maximum in the 21.5 – 25 cm layer and another peak in the 39-43 cm layer (Table 3A, Figure S1B - Peat P3) The lack of dating does not allow conclusions to be drawn regarding causes of such irregularities.
The total loads of metals accumulated in these 44-47 cm thick profiles show differences, ranging from 9.8 % to 26.1% for Cd and from 6.5 to 24.9% for Pb (Table 3A). In comparison with peat bogs located far from the local sources of pollution within the same pollutant flux and showing insignificant load variability (p<0.05) [5], such load differences within one peat bog should be regarded as considerable. This load diversity may be attributed to two basic factors: (1) influence of variable local factors such as uneven low emission from the local settlements and glassworks, which however was incomparably weaker than that of LRTP from “Black Triangle”; (2) variability in peat bulk density/pore structure, which results in visible differences in pollutant load vertical distribution at insufficient core depth taken for the study. As it was observed previously, the upper peat layer ~50 cm thick independently of its age does not yet collect total deposited element load [5]. The actual total deposited loads are therefore anticipated to be somewhat higher and more uniform in all peat profiles if metal distribution in deeper, e.g. 100 cm deep cores were measured. In a studied peat layer depth (~ 50 cm) the 70-80% of the total Cd and 80-90% of the total Pb deposition was found to be accumulated [5]. The differences between the deposited loads accumulated in the 1-m deep profiles, which are considered sufficient as anthropogenic deposition inventory, might thus be lesser. Nevertheless, the obtained data provide a clear picture of the cumulative spatial pollution originated from the atmospheric deposition that accounts 50.74 mg m2 Cd and 5018 mg m2 Pb on average (Table 3A) Such amounts appear to be extraordinary high and are about 5-fold higher for Cd and 7-fold higher for Pb than total cumulative deposition loads from LRTP assessed for NW Poland.
This confirms detrimental cumulative impact on the sustainability of LRTP from large remote emission sources, as it occurred in “Black Triangle” area in 60-ties-up to early 90-ties of 20th century. Very high pollution from LRTP, in particular with SO2 in this area resulted in severe ecological damage and deforestation that now successfully subsides.
3.4. Accumulation of Cd and Pb in Undisturbed Soil Layer
The concentration of Cd in the uppermost layer of topsoil (0-5 cm) 3-fold exceeded world soil average (0.41 mg kg-1 Cd) and was about 4-fold bigger than the mean for topsoil in Europe (0.28 mg kg-1 Cd) [61]. However, in the deeper 5-10 cm layer of topsoil, Cd content was considerably lower and exceeded the average world and Europe contents only 1.8- and 2.6-fold, respectively, while in subsoil it was at the level of world’s crust. The total Cd load accumulated in the soil profile (topsoil and subsoil) appeared to be scarcely 70% of the total average cumulative Cd deposition in the area recorded by the peat bog, of this in topsoil was accumulated 54% of the total cumulative Cd deposition (Table 3B). This can be explained by well-known Cd mobility in soil, particularly in acidic environment, and an open character of soil systems, both to vertical and horizontal element relocation with pore solution and run-off water.
Opposite to Cd, Pb accumulation in soil displayed much higher values than the total cumulative deposition recorded in the peat bog (Figure 2 - Soil, Table 3B). Pb concentrations in topsoil (185-230 mg kg-1 Pb) were comparable to levels in the peat bog, and 6-9-fold exceeded world and European soil average values (27 mg kg -1, and 32 mg kg-1, respectively) [61]. The highest Pb concentration (230 mg kg-1 Pb) occurred in the deeper topsoil layer (5-10 cm), while in the subsoil layer it declined 3-fold, proving the affinity of Pb from external sources to organic matter. These data in principle agree with other observations of Pb spatial distribution in the forest soils of the region that varied in soil layers 0-10 cm and 10-20 cm in the ranges 19-248 and 4-196 mg kg-1 [35]. However, due to the differences in the bulk density of topsoil and subsoil layers, the actual distribution of Pb loads in the soil profile displays almost equal Pb enrichment in topsoil and subsoil (5469 and 5641 mg m2, respectively). Total Pb load accumulated in the soil layer appeared to be over 2-fold bigger than Pb deposition in the area, which indicates prevalence of lithogenic Pb in soil over atmospheric deposition. This observation is also in agreement with those of Szopka et al. [35] indicating much higher Pb content in some areas than available present and previous data on Pb deposition rates. These authors ascribed this inconsistency to a seeder-feeder effect, horizontal transport of pollutants, and in part by meteorological factors and local pollution.
It can be added, that in the case of forest, or mountainous area, a screening effect of “tree wall” or mountainside can cause formation of “hot spots” with particularly high deposition rates. In this study, soil profile S2 was located 7 m below the top of the Granicznik Mountain, which may cause elevated deposition. However, the weathered granite bedrock at this site might be the most important source of trace metal enrichment in soil. Pb contents in the parent rock - local granites (the Karkonosze massif) - vary from 29 to 70 mg kg-1 (mean 49±11 mg kg-1 Pb) [67], which may substantially affect the total Pb concentration in soil. In turn, the parent rock seems to be actually depleted from Cd [68]. Therefore, Cd content in the undisturbed soil of the area seems to be dependent almost entirely on the atmospheric deposition. The differences in the deposited element accumulation and distribution in undisturbed soil profiles might be thus precisely assessed after identification and elimination of the element enrichment of geogenic origin in soil, by performing balance calculations in relation to the total cumulative load of atmospheric deposition. Peat bog records on the total cumulative loads of elements from the atmospheric deposition, allow thus to determine behavior and fate of deposited elements in soil.
3.5. Cd and Pb Chemical Fractionation in Peat and Soil
For estimation of deposited Cd and Pb chemical forms of binding in peat and soil and their binding strength, chemical fractionation of these metals by BCR method [56] was performed.
The mineralogical/chemical forms of metals transported with LRTP are determined by the processes of their formation. Emission sources of Cd appear to be extremely dispersed, and none of the registered sources can be considered dominating. Nevertheless, 80% of Cd emissions originated from fuel combustion activities. Of this, metal smelting, chemical production, and public electricity and heat production were responsible for about 50% of the emissions [11,13,69].
The major sources of Pb emission exerting the strongest impact on spatial pollution in Eastern Europe in seventies-nineties of the XXth century were, according to the national [11,13,69] emission inventories, combustion processes in manufacturing industries, and in the lesser amounts residential and public electrical and heat production. These processes emitted about 65% of the total lead in LRTP. In the “Black Triangle” area, the major sources of Cd and Pb emission in 1970-80s were mostly big lignite-fired power plants and public electrical/heat production, and for Cd, also chemical industries [28,66]. Despite high importance of leaded gasoline in Pb emissions throughout Europe, this source seems to be a minor issue in the Black Triangle area due to the limited car fleet and road transport in Eastern Europe during the 1960-1980s and its growth in parallel with phasing out the leaded gasoline.
The chemistry, mineralogy and chemical fractionation of technogenic particle emissions can be complex and variable, depending on the parameters of coal and combustion processes applied. The data on the chemical speciation of trace elements in alkaline coal- and specifically lignite fly ash [70,71,72,73] show considerable differences, but also some similarities in the trace element binding strength and susceptibility to release. The total contents of Cd and Pb in coal fly ash appear to increase with decrease of the particle size [73], resulting in generally high enrichment of these elements in LRTP. In general, Cd is bound in the immobile residual fraction FIV of fly ash, and to a variable extent (18-70%) dependent upon the outlet temperature. Along with the metastable oxidizable fraction FIII (30-10%), the fraction of strongly bound Cd in coal fly ash accounts for 50-85% of its total content. Mobile Cd comprise 15-50%, of which a major part is bound in the labile FI fraction (10-30%). In contrast, most of Pb in coal fly ash is reported to be stably bound in the residual FIV fraction (75-95%). Strongly bound Pb (FIV+FIII fractions) comprise 85-99%, while the share of mobile fractions is only 1-15%.
Specifically in lignite fly ash, mobile fractions of Cd (FI+ FII) were reported to amount at 25% of this 15% enriched the most labile FI fraction. The share of mobile Pb was estimated at 15%; of this 10% was bound in the most labile FI fraction [70]. This proves a relatively high mobility of these metals. The US-EPA 1313 [74] pH-dependent leaching test of Cd and Pb from power plant fly ash [75] showed affinity of both metals to be released in the acidic pH range.
Dust and aerosols, and associated elements from atmospheric deposition in the post-depositional environments, are subject to different processes specific to the environment in question. In ombrotrophic peat bogs, which are represented by almost pure natural organic matter (NOM) of the different degree of humification, these processes comprise washing down of dust particles with precipitation water, leaching under acidic conditions, and sorption/desorption onto organic matter [21,76,77]. In soil, deposited metal interactions include also its mineral fraction containing sorption centers of different affinity and binding strength such as clay minerals, carbonates, and Fe/Mn oxides [61].
Metal fractionation in peat cores and soils with respect to binding strength and major binding mechanisms according to the BCR procedure revealed similarity in Cd and Pb fractionations in peat and soil matrices on the one hand, and fundamental differences between both metal enrichment in fractions representing different chemical forms of different mobility, binding strength and mechanisms on the other hand (Figure 3).
Cd displayed predominant enrichment in the mobile pools of both peat and soil, of these binding to Mn-oxide/amorphous Fe-oxide reducible FII fraction prevailed almost in all peat profiles (56-68%) (Figure 3A). However, in the 5-10 cm layer of the P3 core, the percent Cd enrichment in FII fraction was considerably lower (30%) whereas more labile exchangeable/carbonate FI fraction clearly dominated in this layer (49%). Remarkably, in the 5-10 cm layers Cd enrichment in FII fraction was the lowest (30-60%) in all peat cores, and the share of the labile FI fraction was mostly elevated compared to other layers. This may be attributed to the higher ash content detected in these layers and their possible origin from the biggest industrial depositions of particles and aerosols in the region of the “Black Triangle” area in 1970 - 1980s with a peak in 1983-1984 [66], and to the river sediments during the “Millennium Flood” in 1997. The discrimination of share of these possible sources in Cd fractionation is difficult. In general, river sediments show higher or similar Cd enrichment in labile FI and reducible FII fractions, and FII fraction share is at the relatively high level of 20-30% [78]. Industrial emissions, and specifically coal fly ash, display poor Cd affinity to FII fraction and overall considerably bigger Cd enrichment in the labile exchangeable/carbonate FI fraction [70,73]. In this respect, Cd fractionation in river sediments shows higher similarity to that in peat, and specifically in the 5-10 cm layer, although such impact may have an accidental and very minor character due to the actual differences in deposited loads.
Post-depositional redistribution of a metal enrichment in the organic matter basically different from deposited inorganic particles, besides the metal natural affinity to the specific fractions, should be considered as the major factors governing its chemical fractionation and binding strength in this new environment. Overall, Cd in peat shows prevailing enrichment in mobile fractions: Mg/Fe oxide bound reducible FII fractions (30-65%) > exchangeable/carbonate acid extractable FI (8-49%) (Figure 3A). Total Cd enrichment in mobile fractions F0+FI+FII ranged in all studied peat profiles from 72 to 96% (Table 4). The share of Cd strongly bound in metastable organic FIII and stable residual FIV fractions was minor, 2-27% and <1-3%, respectively (Figure 5A - Peat, Table 5A).
Opposite to Cd, Pb showed strong affinity to binding onto organic matter (Figure 3B - Peat). In the peat cores (P1, P2, P3), the major part of Pb (67 to 86%) appeared to be associated with organic matter in the metastable FIII fraction. Smaller part of Pb was bound to Mn/Fe-oxides in the reducible FII fraction (11-27%). The most labile water soluble, exchangeable and carbonate-bound compounds (F0+FI fractions) occurred in amounts not exceeding 1-2%. The enrichment of Pb in the immobile residual FIV fraction was also very low (1-4%) The layer 5-10 cm did not show any particular difference in Pb fractionation with other peat layers, except a slightly bigger share of Pb bound in the residual fraction (2-4%) than in the layers above and below that fraction (1-2%) (Figure 3B - Peat, Table 4A).
Chemical fractionation of Cd in topsoil (0-10 cm) displayed a similar character to that in peat. The major differences are due to much higher content of mineral matter in the soil (Table 1, Table 2B). The prevalence of mineral matter in topsoil resulted in the somewhat higher than in peat binding of Cd in stable residual fraction (3-6%), and considerably bigger enrichment of Cd in the most mobile water soluble F0 (1%) and exchangeable/carbonate FI fraction (36-47%). Simultaneously, lower than in peat binding of Cd in reducible FII and metastable organic FIII fractions in the topsoil layers was observed. In subsoil (10-20 cm), the domination of mineral matter was manifested by the prevalence of a strong Cd binding in the stable residual fraction FIV (59%) and by the labile Cd enrichment mostly in the exchangeable/carbonate FI fraction (Figure 3A - Soil, Table 4B).
The OM-rich topsoil layer 0-10 cm showed chemical fractionation of Pb similar to that in peat (Figure 3B). Most of Pb there (76-86%) was also strongly bound onto organic matter. However, both Pb shares in the immobile residual FIV fraction (7%) and in the most labile water soluble, exchangeable/carbonate-bound (F0 + FI) fractions (2-3%), although also very low, were about twice as high as in peat. The share of Pb bound in the reducible (Mn/Fe oxide) FII fraction (5-13%) was distinctly less than in peat. In subsoil, increase of mineral and decrease of organic matter share compared to topsoil resulted in a higher Pb relative share both in the stable residual FIV (22%) and in the most labile (F0 + FI) fractions (3-6%), as well as in the reducible FII fraction (22%)
Comparison of Cd and Pb fractionation in peat and topsoil shows the similarity of both matters with respect to binding strength of each metal, and fundamental differences between chemical fractionation of both metals. While a major part of Cd in peat and topsoil enriched mobile fractions of low binding strength (72-96%), the predominant part of Pb was strongly bound in metastable (mobilizable) and residual fractions (71-92%). (Table 3). Considering a rather high vertical hydraulic conductivity of the studied brown soil and peat (k = 10-2 – 10-7 m s-1), assessed for this site and reported by other authors [e.g. [79,80,81], this suggests much higher mobility of Cd than of Pb both in peat and soil. However, the distribution patterns of the two metals in peat profiles do not show a much more intense vertical relocation of Cd than that of Pb (Figure 2, S1 - A vs B).
Simultaneously, the total load of Cd accumulated in the undisturbed soil profile appeared to be about 70% of that in the peat cores (Table 3, B vs A). It should be taken into account that Cd in soil originates both from anthropogenic (atmospheric deposition), and geogenic sources. Roughly, assuming that Cd bound in the residual fraction is mostly of geogenic origin, Cd from deposition in soil amounted to around 61% of the total deposition measured in peat cores, while about 39% of Cd load had been depleted. Distinct downward decrease of Cd concentrations in soil suggests rather slow vertical relocation of Cd in soil similarly to that in peat. Significant Cd reduction from soil can be attributed mostly to the horizontal washing out from topsoil by run-off, and to plant uptake.
By contrast, total Pb load in soil profile (topsoil and subsoil) appeared to be more than twice as high as the Pb deposition measured in peat cores (Table 3, B vs A). Chemical fractionation of Pb, as different to Cd, shows prevalence of strong binding in metastable organic and residual fractions (72-92%) (Table 4, B vs A). This is in conformity with data of other authors involved in the studies on the soils of this region [82,83]. The load of Pb occurring in the residual fraction can be attributed to geogenic origin. It ranged from 25% in the upper layer of topsoil to 60% in subsoil. The total Pb load of geogenic origin in soil profile was estimated for 5006 mg m-2, of this 3385 mg m-2 was accumulated in subsoil. The total Pb load in other fractions amounted at 6104 mg, i.e. was by about 22% on average bigger than the Pb load from deposition. This suggests that in addition to excessive Pb enrichment from atmospheric deposition, other fractions of different mobility may be of geogenic origin, which makes discrimination of contributions from each source to Pb bound in specific fractions of soil difficult. However, Pb from atmospheric deposition apparently predominates in topsoil. Higher concentration of Pb in the 5-10 cm layer next to the uppermost one suggests vertical redistribution as a major Pb migration mode. This seems to be in conformity with Pb distribution along peat profiles. The research data of different authors summarized by Kabata-Pendias [61] report low mobility of Pb in acid organic soil and estimated the time needed for a 10% decrease to be 90-200 years, and the period of decrease in soil by one half to range from 740 to 5400 years. However, in the light of these data, Pb in soil cannot be considered immobile. The mobility of Pb is attributed to formation of soluble chelated complexes with OM [61].
Overall, lesser enrichment of soil with Cd compared to peat suggests that, in principle, all Cd in soil originates from atmospheric deposition, and is susceptible to migration through surface washing-out by runoff, or uptake by plants. In contrast, Pb in soils appears to be equally of geogenic origin and from atmospheric deposition, while its immobile and stable it chemical forms prevail.in Pb of geogenic origin. High share of both priority pollutants originating from atmospheric deposition in their total contents in soil confirms significance of this source of pollution control, while ombrotrophic peat bog records appear to be the only reliable source of information on the total cumulative atmospheric deposition in the area.
4. Conclusions
The study revealed close linkage in accumulation of Cd and Pb from atmospheric deposition in the ombrotrophic peat bogs and undisturbed soil, and between these elements in both matters. This can be attributed to fundamental differences in the matter composition. Peat is almost pure NOM (natural organic matter), whereas in topsoil the share of mineral fraction reaches around 50%, and in subsoil over 90%.
Distribution of Cd and Pb along the three investigated peat profiles indicated uneven vertical relocation of Pb and Cd and downward shift of Pb loads with respect to the deposition chronology. This contests the trend to use dated peat cores in paleoenvironmental studies for restoring chronology of Pb deposition based on the premise of its vertical immobility. By contrast, a considerable retardation of Cd vertical relocation, and similarity of the patterns and relocation rates of both elements in peat profiles were observed, contradicting their known extremely different mobility in the environment, in particular in soils.
The balance of deposited Cd and Pb loads in soil in relation to the total cumulative deposited loads determined from peat records, showed 30% depletion of the cumulative load of Cd in the soil profile, while that of Pb practically did not decline.
To summarize the observations regarding Cd and Pb binding in peat and topsoil, it appears that these metals in both matters display very similar affinity to fractions of different binding strength. While Cd was predominantly (72-97%) bound in the mobile F0-FIII fractions, Pb was mostly enriched fractions of a high binding strength metastable organic and immobile residuum (71-92%). The difference between soil and peat in this respect consist in the considerably bigger share of immobile residual fraction, depletion of about 40% of Cd of anthropogenic origin probably due to the horizontal wash-out, and over 2-fold bigger enrichment of Pb in soil due to its occurrence in weathered parent rocks mostly in the residual fraction. The processes occurring in soil make it difficult to estimate the cumulative load from the atmospheric deposition, while peat cores provide exact information in this respect.
The deposited element accumulation and release/depletion in undisturbed soil profiles might be quantified in relation to the total cumulative load of atmospheric deposition, after identification and exclusion of the element enrichment of geogenic origin in soil, mostly bound in stable residual fraction. Peat bog records of the total cumulative loads of elements from the atmospheric deposition, besides being the only complete and precise inventory of such loads, allow thus to quantitative determination of accumulation and release balance of total cumulative deposited element loads in soil. This shows a new application area of ombrotrophic peat bogs as reliable inventories of atmospheric deposition, thus making them a unique tool in the sustainable management of the environment
Supplementary Materials
The following are available online: at preprints.org. Figure S1: Distribution of Cd (A) and Pb (B) loads along the peat and soil.
Author Contributions
Conceptualization, Irena Twardowska; methodology, Irena Twardowska, Eiliv Steinnes, Ewa Miszczak.; software, Sebastian Stefaniak, , Ewa Miszczak ; validation, Irena Twardowska, Eiliv Steinnes; formal analysis, Sebastian Stefaniak, Ewa Miszczak ; investigation, Ewa Miszczak, Sebastian Stefaniak; resources, Ewa Miszczak, Eiliv Steinnes ; data curation, Irena Twardowska, Ewa Miszczak, Eiliv Steinnes.; writing—Irena Twardowska, Ewa Miszczak; writing—review and editing, Irena Twardowska.; visualization, Ewa Miszczak.; supervision, Irena Twardowska.; project administration, Irena Twardowska.; funding acquisition, Irena Twardowska. All authors have read and agreed to the published version of the manuscript.
Funding
This research was funded by the Polish-Norwegian Research Programme operated by the National Centre for R&D under the Norwegian financial mechanism 2009-2014 in the framework of Project Contract No. Pol-Nor/199338/45/2013. The research received no other external funding.
Institutional Review Board Statement
Not applicable.
Informed Consent Statement
Not applicable.
Data Availability Statement
Data available on request
Acknowledgments
The elemental analyses of peat and soils were performed by Syverin Lierhagen at NTNU, Trondheim.
Conflicts of Interest
The authors declare no conflicts of interest
References
- Amundsen, C.E.; Hanssen, J.E.; Semb, A.; Steinnes, E. Long-range atmospheric transport of trace elements in southern Norway. Atmospheric Environment, Part A, General Topics, 1992, 26, 1309–1324. [Google Scholar] [CrossRef]
- Steinnes, E.; Allen, R.O.; Petersen, H.M.; Rambæk, J.P.; Varskog, P. Evidence of large scale heavy-metal contamination of natural surface soils in Norway from long-range atmospheric transport. Science of The Total Environment 1997, 205, 255–266. [Google Scholar] [CrossRef]
- Steinnes, E.; Berg, T.; Uggerud, H.T. Three decades of atmospheric metal deposition in Norway as evident from analysis of moss samples. Science of The Total Environment 2011, 412-413, 351–358. [Google Scholar] [CrossRef] [PubMed]
- Nickel, S.; Hertel, A.; Pesch, R.; Schröder, W.; Steinnes, E.; Uggerud, H.T. Modelling and mapping spatio-temporal trends of heavy metal accumulation in moss and natural surface soil monitored 1990-2010 throughout Norway by multivariate generalized linear models and geostatistics. Atmos. Environ. 2014, 99, 85–97. [Google Scholar] [CrossRef]
- Miszczak, E.; Stefaniak, S.; Michczyński, A.; Steinnes, E.; Twarowska, I. A novel approach to peatlands as archives of total spatial pollution loads from atmospheric deposition of airborne elements complementary to EMEP data: priority pollutants (Pb, Cd, Hg). Sci. Total Environ. 2020, 703, 135776. [Google Scholar] [CrossRef]
- Zhang, Z.; Zheng, D.; Xue, Z.; Wu, H.; Jiang, M. Identification of anthropogenic contributions to heavy metals in wetland soils of the Karuola Glacier in the Qinghai-Tibetan Plateau. Ecological Indicators 2019, 98, 678–685. [Google Scholar] [CrossRef]
- Barrie, L.A.; Gregor, D.; Hargrave, B.; Lake, R.; Muir, D.; Shearer, R.; Tracey, B.; Bidleman, T. Arctic contaminants: sources, occurrence and pathways. Science of The Total Environment 1992, 22, 1–74. [Google Scholar] [CrossRef]
- Chu, W.-L; Dang, N.-L.; Kok, Y.-Y.; Yap, K.-S.I.; Phang, S.-M.; Convey, P. Heavy metal pollution in Antarctica and its potential impacts on algae. Polar Science 2019, 20, Part–1. [Google Scholar] [CrossRef]
- CLRTAP, 1979. Convention on Long-range Transboundary Air Pollution. Geneve, November 13th, 1979.
- EMEP, 1984. The Protocol on Long-term Financing of the Cooperative Programme for Monitoring and Evaluation of the Long-range Transmission of Air Pollutants in Europe, Geneva (Switzerland), 28 September 1984.
- EEA (European Environment Agency). European Union emission inventory report 1990-2022 - Under the UNECE convention on Long-range Transboundary Air Pollution (Air Convention). EEA Technical Report No. 8/2024. EPA: Copenhagen, 2024. Available online: https://www.eea.europa.eu/publications/european-union-emissions-inventory-report-1990-2022 (accessed on 25 September 2024).
- Aas, W.; Halvorsen, H. L.; Pfaffhuber, K. A. Heavy metals and POP measurements 2022. EMEP/CCC report 3/2024. Kjeller: NILU. Available online: https://projects.nilu.no/ccc/reports/EMEP_CCC-Report_3_2024_HMandPOP_09-09-2024_FINAL.pdf (accessed on 23 October 2024).
- Ilyin, I.; Batrakova, N.; Gusev, A.; Rozovskaya, O.; Shatalov, V.; Strizhkina, I.; Vulykh, N.; Travnikov, O. Status Report 2/2023. Heavy metals and POPs: Pollution assessment of toxic substances on regional and global scales; Meteorological Synthesizing Centre – East: Ljubljana, Slovenia, 2023; Available online: http://msceast.org/reports/2_2023.pdf.
- Shotyk, W.; Blaser, P.; Grünig, A.; Cheburkin, A.K. A new approach for quantifying cumulative, anthropogenic, atmospheric lead deposition using peat cores from bogs: Pb in eight Swiss peat bog profiles. Sci.Total Environ. 2000, 249, 281–295. [Google Scholar] [CrossRef]
- El-Daoushy, F.; Tolonen, K. Lead-210 and heavy metal contents in dated ombrotrophic peat hummocks from Finland. Nucl. Instrum. Methods Phys. Res. 1984, 223, 392–399. [Google Scholar] [CrossRef]
- Urban, N.R.; Eisenreich, S.J.; Grigal, D.F.; Schurr, K.T. Mobility and diagenesis of Pb and 210Pb in peat. Geochimica et Cosmochimica Acta 1990, 54, 3329–3346. [Google Scholar] [CrossRef]
- Deiss, J.; Byers, C.; Clover, D.; D’Amore, D.; Love, A.; Menzies, M.A.; Powell, J.; Todd, W. Transport of lead and diesel fuel through a peat soil near Juneau, AK: a pilot study. J. Contamin. Hydrol. 2004, 74, 1–18. [Google Scholar] [CrossRef] [PubMed]
- Le Roux, G. Fate of Natural and Anthropogenic Particles in Peat Bogs. Inaudgural-Dissertation zur Erlangung der Doktorwürde, Ruprecht-Karls-Universitãt, Heidelberg (Germany). 2005. [Google Scholar]
- Novak, M.; Erel, Y.; Zemanova, L.; Bottrell, S.H.; Adamova, M. A comparison of lead pollution record in Sphagnum peat with known historical Pb emission rates in the British Isles and in the Czech Republic. Atmos. Environ. 2008, 42, 8997–9006. [Google Scholar] [CrossRef]
- Novak, M.; Pacherova, P. Mobility of trace metals in pore waters of two Central European peat bogs. Sci. Total Environ. 2008, 394, 331–337. [Google Scholar] [CrossRef]
- Smieja-Król, B.; Fiałkiewicz-Kozieł, B. , Sikorski J.; Palowski B. Heavy metal behaviour in peat - a mineralogical perspective. Sci. Total Environ. 2010, 408, 5924–5931. [Google Scholar] [CrossRef]
- Hansson, S.V.; Tolu, J.; Bindler, R. Downwash of atmospherically deposited trace metals in peat and the influence of rainfall intensity: An experimental test. Sci. Total Environ. 2015, 506-507, 95–101. [Google Scholar] [CrossRef]
- Jeremiason, J.D.; Baumann, E.I.; Sebestyen, S.D.; Agther, A.M.; Seelen, E.A.; Carlson-Stehlin, B.J.; Funke, M.M.; Cotner, J.B. Contemporary mobilization of legacy Pb stores by DOM in a boreal peatland. Environ. Sci. Technol. 2018, 52, 3375–3383. [Google Scholar] [CrossRef]
- Griffiths, N.A.; Sebestyen, S.; Oleheiser, K.C. Variation in peatland porewater chemistry over time a space along a bog to fen gradient. Sci. Total Environ. 2019, 697, 134252. [Google Scholar] [CrossRef]
- De Vleeschouwer, F.; Fagel, N.; Cheburkin, A.; Pazdur, A.; Sikorski, J.; Mattielli, N.; Renson, V.; Fiałkiewicz, B.; Piotrowska, N.; Le Roux, G. Anthropogenic impacts in North Poland over the last 1300 years - A record of Pb, Zn, Cu, Ni and S in an ombrotrophic peat bog. Sci. Total Environ. 2009, 407, 5674–5684. [Google Scholar] [CrossRef]
- De Vleeschouwer, F.; Baron, S.; Cloy, J.M.; Enrico, M.; Ettler, V.; Fagel, N.; Kylander, M. (….); Le Roux, G. Comment on: “A novel approach to peatlands as archives of total cumulative spatial pollution loads from atmospheric deposition of airborne elements complementary to EMEP data: priority pollutants (Pb, Cd, Hg)” by Ewa Miszczak, Sebastian Stefaniak, Adam Michczyński, Eiliv Steinnes and Irena Twardowska. Sci. Total Environ. 2020, 138699. [Google Scholar] [CrossRef]
- Twardowska, I.; Steinnes, E.; Miszczak, E. Reply to the comments on “A novel approach to peatlands as archives of total cumulative spatial pollution loads from atmospheric deposition of airborne elements complementary to EMEP data: Priority pollutants (Pb, Cd, Hg)” by V. De Vleeschouwer et al. Science of The Total Environment 2020, 139153. [Google Scholar] [CrossRef] [PubMed]
- Abraham, J.; Berger, F.; Ciechanowicz-Kusztal, R.; Jodłowska-Opyd, G.; Kallweit, D.; Keder, J.; Kulaszka, W.; Novák, J. Common Report on Air Quality in the Black Triangle Region 2002, ČHMU, WIOŚ, LfUG, UBA. 2003. Available online: www.env.cz (accessed on 25 September 2024). www.chmi.cz; www.umweltbundesamt.de; www.umwelt.sachsen.de/lfug; www.jgora.pios.gov.pl/wwm/index.htm.
- Migoń, P. Geomorphological evolution of the Polish part of the Sudetes - A review of results of recent research. Geografie-Sbornik ČGS, 2003, 108, 191–201. [Google Scholar] [CrossRef]
- Glina, B.; Bogacz, A. Concentration and pools of trace elements in organic soils in the Izera Mountains. J. Elem. 2013, 18, 199–209. [Google Scholar] [CrossRef]
- Available online: https://www.meteoblue.
- Popowski, B. Results of a palynological analysis of peat sediments from Izerskie Bagno (Izerskie Mts). Acta Botanica Silesiana 2005, 2, 95–106. [Google Scholar]
- Matula, J.; Wojtun, B.; Tomaszewska, K.; Zolnierz, L. Peatlands of Polish part of Karkonosze and Izera Mountains. Ann. Silesiae 1997, 27, 123–140. [Google Scholar]
- Brogowski, Z.; Borzyszkowski, J.; Gworek, B.; Ostrowska, A.; Porębska, G.; Sienkiewicz, J. Charakterystyka gleb wylesionych obszarów Gór Izerskich (Soil characteristics of deforested areas in the Izera Mountains). Roczniki Gleboznawcze XLVIII (in Polish). 1997, 111–124. [Google Scholar]
- Szopka, K.; Karczewska, A.; Kabała, C. Spatial distribution of lead in the surface layers of mountain forest soils, an example from Karkonosze National Park, Poland. Geoderma 2013, 192, 259–268. [Google Scholar] [CrossRef]
- ISO 18400-100:2017; Soil quality, Sampling, Part 100: Guidance on the selection of sampling standards (Edition 1, 2017).
- ISO 18400-101:2017; Soil quality, Sampling, Part 101: Soil quality, Sampling, Part 101: Framework for the preparation and application of a sampling plan (Edition 1, 2017).
- ISO 18400-102:2017; Soil quality, Sampling, Part 102: Soil quality, Sampling, Part 102: Selection and application of sampling techniques (Edition 1, 2017).
- ISO 18400-103:2017; Soil quality, Sampling, Part 103: Soil quality, Sampling, Part 103: Safety (Edition 1, 2017).
- ISO 18400-104:2018; Soil quality, Sampling, Part 104: Soil quality, Sampling, Part 104: Strategies (Edition 1, 2018).
- ISO 18400-105:2017; Soil quality, Sampling, Part 105: Soil quality, Sampling, Part 105: Packaging, transport, storage and preservation of samples (Edition 1, 2017).
- ISO 18400-106:2017; Soil quality, Sampling, Part 106: Soil quality, Sampling, Part 106: Quality control and quality assurance (Edition 1, 2017).
- ISO 23909:2008; Soil quality — Preparation of laboratory samples from large samples, Published (Edition 1, 2008).
- ISO 11464:2006; Soil quality — Pretreatment of samples for physico-chemical analysis, Published (Edition 2, 2006).
- ASTM D2976 -15; Standard Test Method for pH of Peat Materials. Book of Standards Volume 04.08.
- ASTM D2216 - 19; Standard Test Methods for Laboratory Determination of Water (Moisture) Content of Soil and Rock by Mass.| Developed by Subcommittee: D18.03. Book of Standards Volume: 04.08.
- ASTM D2974 – 14; Standard Test Methods for Moisture, Ash and Organic Matter in Peat and Other Organic Soils. Book of Standards Volume 04.08’.
- ASTM D4531-86; International. Standard Test Methods for Bulk Density of Peat and Peat products. Designation: D 4531-86 (Reapproved 2008).
- ISO 10390:2021; Soil, treated biowaste and sludge, Determination of pH, Published (Edition 3, 2021).
- Bleam, W. Soil and Environmental Chemistry, 2nd edition; Elsevier Inc.; Academic Pres, 2017. [Google Scholar] [CrossRef]
- Bronk, R.C.; Lee, S. Recent and planned developments of the Program Ox Cal. Radiocarbon 2013, 55, 720–730. [Google Scholar] [CrossRef]
- Pazdur, A.; Fogtman, M.; Michczyński, A.; Pawlyta, J. Precision of 14C dating in Gliwice radiocarbon laboratory. FIRI Programme. Geochronometria 2003, 22, 27–40. [Google Scholar]
- Tudyka, K.; Pazdur, A.; Theodórsson, P.; Michczyński, A.; Pawlyta, J. The application of ICELS system for radiocarbon dating. Radiocarbon 2010, 52, 1661–1666. [Google Scholar] [CrossRef]
- Piotrowska, N.; Blaauw, M.; Mauquoy, D.; Chambers, F.M. 2010/2011. Constructing deposition chronologies for peat deposits using radiocarbon dating. Mires Peat 2010/2011, 7(Art. 10), 1–14. [Google Scholar]
- Steinnes, E.; Rühling, Å.; Lippo, H.; Mäkinen, A. Reference materials for large-scale metal deposition surveys. Accreditation and Quality Assurance 1997, 2, 243–249. [Google Scholar] [CrossRef]
- Ure, A.M.; Quevauviller, P.; Muntau, H.; Griepink, B. Speciation of heavy metals in soils and sediments. An account of the improvement and harmonization of extraction techniques undertaken under the auspices of the BCR of the Commission of the European Communities. J. Environ. Anal. Chem. 2006, 51, 135–151. [Google Scholar] [CrossRef]
- Rauret, G.; López-Sánchez, J.F.; Sahuquillo, A.; Rubio, R.; Davidson, C.M.; Ure, A.; Quevauviller, P. J. Improvement of the BCR three step sequential extraction procedure prior to the certification of new sediment and soil reference materials. J. Environ. Monit. 1999, 1, 57–61. [Google Scholar] [CrossRef]
- Zemberyová, M.; Barteková, J.; Hagarová, I. The utilization of modified BCR three-step sequential extraction procedure for the fractionation of Cd, Cr, Cu, Ni, Pb and Zn in soil reference materials of different origins. Talanta 2006, 70, 973–978. [Google Scholar] [CrossRef]
- Horváth, M.; Boková, V.; Heltai, G.; Flórián, K.; Fekete, I. Study of application of BCR sequential extraction procedure for fractionation of heavy metal content of soils, sediments, and gravitation dusts. Toxicol. Environ. Chem 2010, 92, 429–441. [Google Scholar] [CrossRef]
- IUSS Working Group WRB. World Reference Base for Soil Resources. In International Soil Classification System for Naming Soils and Creating Legends for Soil Maps, 4th ed.; International Union of Soil Sciences: Vienna, Austria, 2022. [Google Scholar]
- Kabata-Pendias, A. Trace Elements in Soils and Plants, 4th ed.; CRC Press: Boca Raton, FL, 2011; p. 266. [Google Scholar]
- Håkanson, L. An ecological risk index for Aquatic pollution control. A Sedimentological Approach. Water Research 1980, 14, 975–1001. [Google Scholar] [CrossRef]
- USDA. Soil Quality Indicators: pH. 1998. [Google Scholar]
- Rausch, N.; Ukonmaanaho, L.; Nieminen, T.; Krachler, M.; Shotyk, W. Porewater evidence of metal (Cu, Ni, Co, Zn, Cd) mobilization in an acidic, ombrotrophic bog impacted by a smelter, Harjavalta, Finland and comparison with reference sites. Environ. Sci. Technol. 2005, 39, 8207–8213. [Google Scholar] [CrossRef]
- Rausch, N.; Nieminen, T.; Ukonmaanaho, L.; Le Roux, G.; Krachler, M.; Cheburkin, A.K.; Bonani, G.; Shotyk, W. Comparison of atmospheric deposition of copper, nickel, cobalt, zinc and cadmium recorded by Finnish peat cores with monitoring data and emission records. Environ. Sci.Technol. 2005, 39, 5989–5998. [Google Scholar] [CrossRef]
- Kopáček, J.; Veselý, J. Sulfur and nitrogen emissions in the Czech Republic and Slovakia from 1850 till 2000. Atmos. Environ. 2005, 39, 2179–2188. [Google Scholar] [CrossRef]
- Mikulski, S.Z. Metal ore potential of the parent magma of granite –the Karkonosze massif example. In Granitoids in Poland; AM Monograph No. 1, PIG and UW: Warsaw (Poland); pp. 123-125–125.
- Mochnacka, K.; Oberc-Dziedzic, T.; Mayer, W.; Pieczka, A.; Góralski, M. Occurrence of sulphides in Sowia Dolina near Karpacz (SW Poland) – an example of ore mineralization in the contact aureole of the Karkonosze granite. Mineralogia Polonica 2007, 38, 185–207. [Google Scholar] [CrossRef]
- National Centre for Emissions Management (KOBiZE) at the Institute of Environmental Protection – National Research Institute. Poland’s Informative Inventory Report 2024, Air pollutant emissions in Poland 1990 – 2022. Submission under the UN ECE Convention on Long-range Transboundary Air Pollution and Directive (EU) 2016/2284. Ministry of Climate and Environment, Warsaw 2024.
- Bódog, I.; Csikós-Hartyányi, Z.; Hlavay, J. Sequential extraction procedure for the speciation of elements in fly ash samples. Microchemical Journal 1996, 54, 320–330. [Google Scholar] [CrossRef]
- Petit, D.M.; Rucandio, M.I. Sequenial extractions for determination of cadmium distribution in coal fly ash, soil and sediment samples. Anal. Chem. Acta 1999, 401, 283–291. [Google Scholar] [CrossRef]
- Zhao, S.; Duan, Y.; Lu, J.; Gupta, R.; Pudasainee, D.; Liu, S.; Liu, M.; Lu, J. Chemical speciation and leaching characteristics of hazardous trace elements in coal and fly ash from coal-fired power plants. Fuel 2018, 232, 463–469. [Google Scholar] [CrossRef]
- Wu, J.; Wu, X.; Wang, J.; Wang, T.; Zhang, Y.; Pan, W.-P. Speciation analysis of Hg, As, Pb, Cd, and Cr in fly ash at different ESP’s hoppers. Fuel 2020, 280, 118688. [Google Scholar] [CrossRef]
- US-EPA. SW-846 Test Method 1313: Liquid-Solid Partitioning as a Function of Extract pH Using a Parallel Batch Extraction Procedure (Last updated on May 9, 2024).
- Stefaniak, S.; Kmiecik, E.; Miszczak, E.; Szczepańska-Plewa, J. Leaching behavior of fly ash from co-firing of coal with alternative off gas fuel in powerplant boilers. Appl. Geochem. 2018, 93, 129–144. [Google Scholar] [CrossRef]
- Zaccone, C.; Miano, T.M.; Shotyk, W. Qualitative comparison between raw peat and related humic acids in an ombrotrophic bog profile. Org. Geochem. 2007, 38, 151–160. [Google Scholar] [CrossRef]
- Zaccone, C.; Cocozza, C.; Cheburkin, A.K.; Shotyk, W.; Miani, T.M. Distribution of As, Cr, Ni, Ti, and Zr between peat and its humic fraction along an undisturbed ombrotrophic bog profile (NW Switzerland). Appl. Geochem. 2008, 23, 25–33. [Google Scholar] [CrossRef]
- Wijaya, A.R.; Ohde, S.; Shinjo, R.; Ganmanee, M.; Cohen, M.D. Geochemical fractions and modeling adsorption of heavy metals into contaminated river sediments in Japan and Thailand determined by sequential leaching technique using ICP-MS. Arab. J. Chem 2019, 12, 780–799. [Google Scholar] [CrossRef]
- Grover, S.P.P.; Baldock, J.A. The link between peat hydrology and decomposition: Beyond von Post. J. Hydrol. 2013, 479, 130–138. [Google Scholar] [CrossRef]
- Rezanezhad, F.; Price, J.S.; Quinton, W.L.; Lennartz, B.; Milojevic, T.; Van Cappelen, P. Structure of peat soils and implications for water storage, flow and solute transport: a review update for geochemists. Chem. Geol. 2016, 429, 75–84. [Google Scholar] [CrossRef]
- Golubev, V.; Whittington, P. Effect of volume change on the unsaturated hydraulic conductivity of Sphagnum moss. J. Hydrol. 2018, 559, 884–894. [Google Scholar] [CrossRef]
- Kabała, C. Pierwiastki śladowe w glebach Gór Izerskich. Zesz. Nauk. Akademii Rolniczej we Wrocławiu (in Polish). 1998, 347, 95–106. [Google Scholar]
- Kabała, C.; Szerszeń, L. Profile distribution of lead, zinc and copper in Dystric Cambisols developed from granite and gneiss of the Sudetes Mountains, Poland. Water Air Soil Pollut. 2002, 138, 307–317. [Google Scholar] [CrossRef]
Figure 1.
Location of the studied site and sampling points P1- P3 – locations of peat cores; S1-S5 – location of the soil profile. The wind rose for Izera Stóg (source: [31]). directions of LRTP.
Figure 1.
Location of the studied site and sampling points P1- P3 – locations of peat cores; S1-S5 – location of the soil profile. The wind rose for Izera Stóg (source: [31]). directions of LRTP.
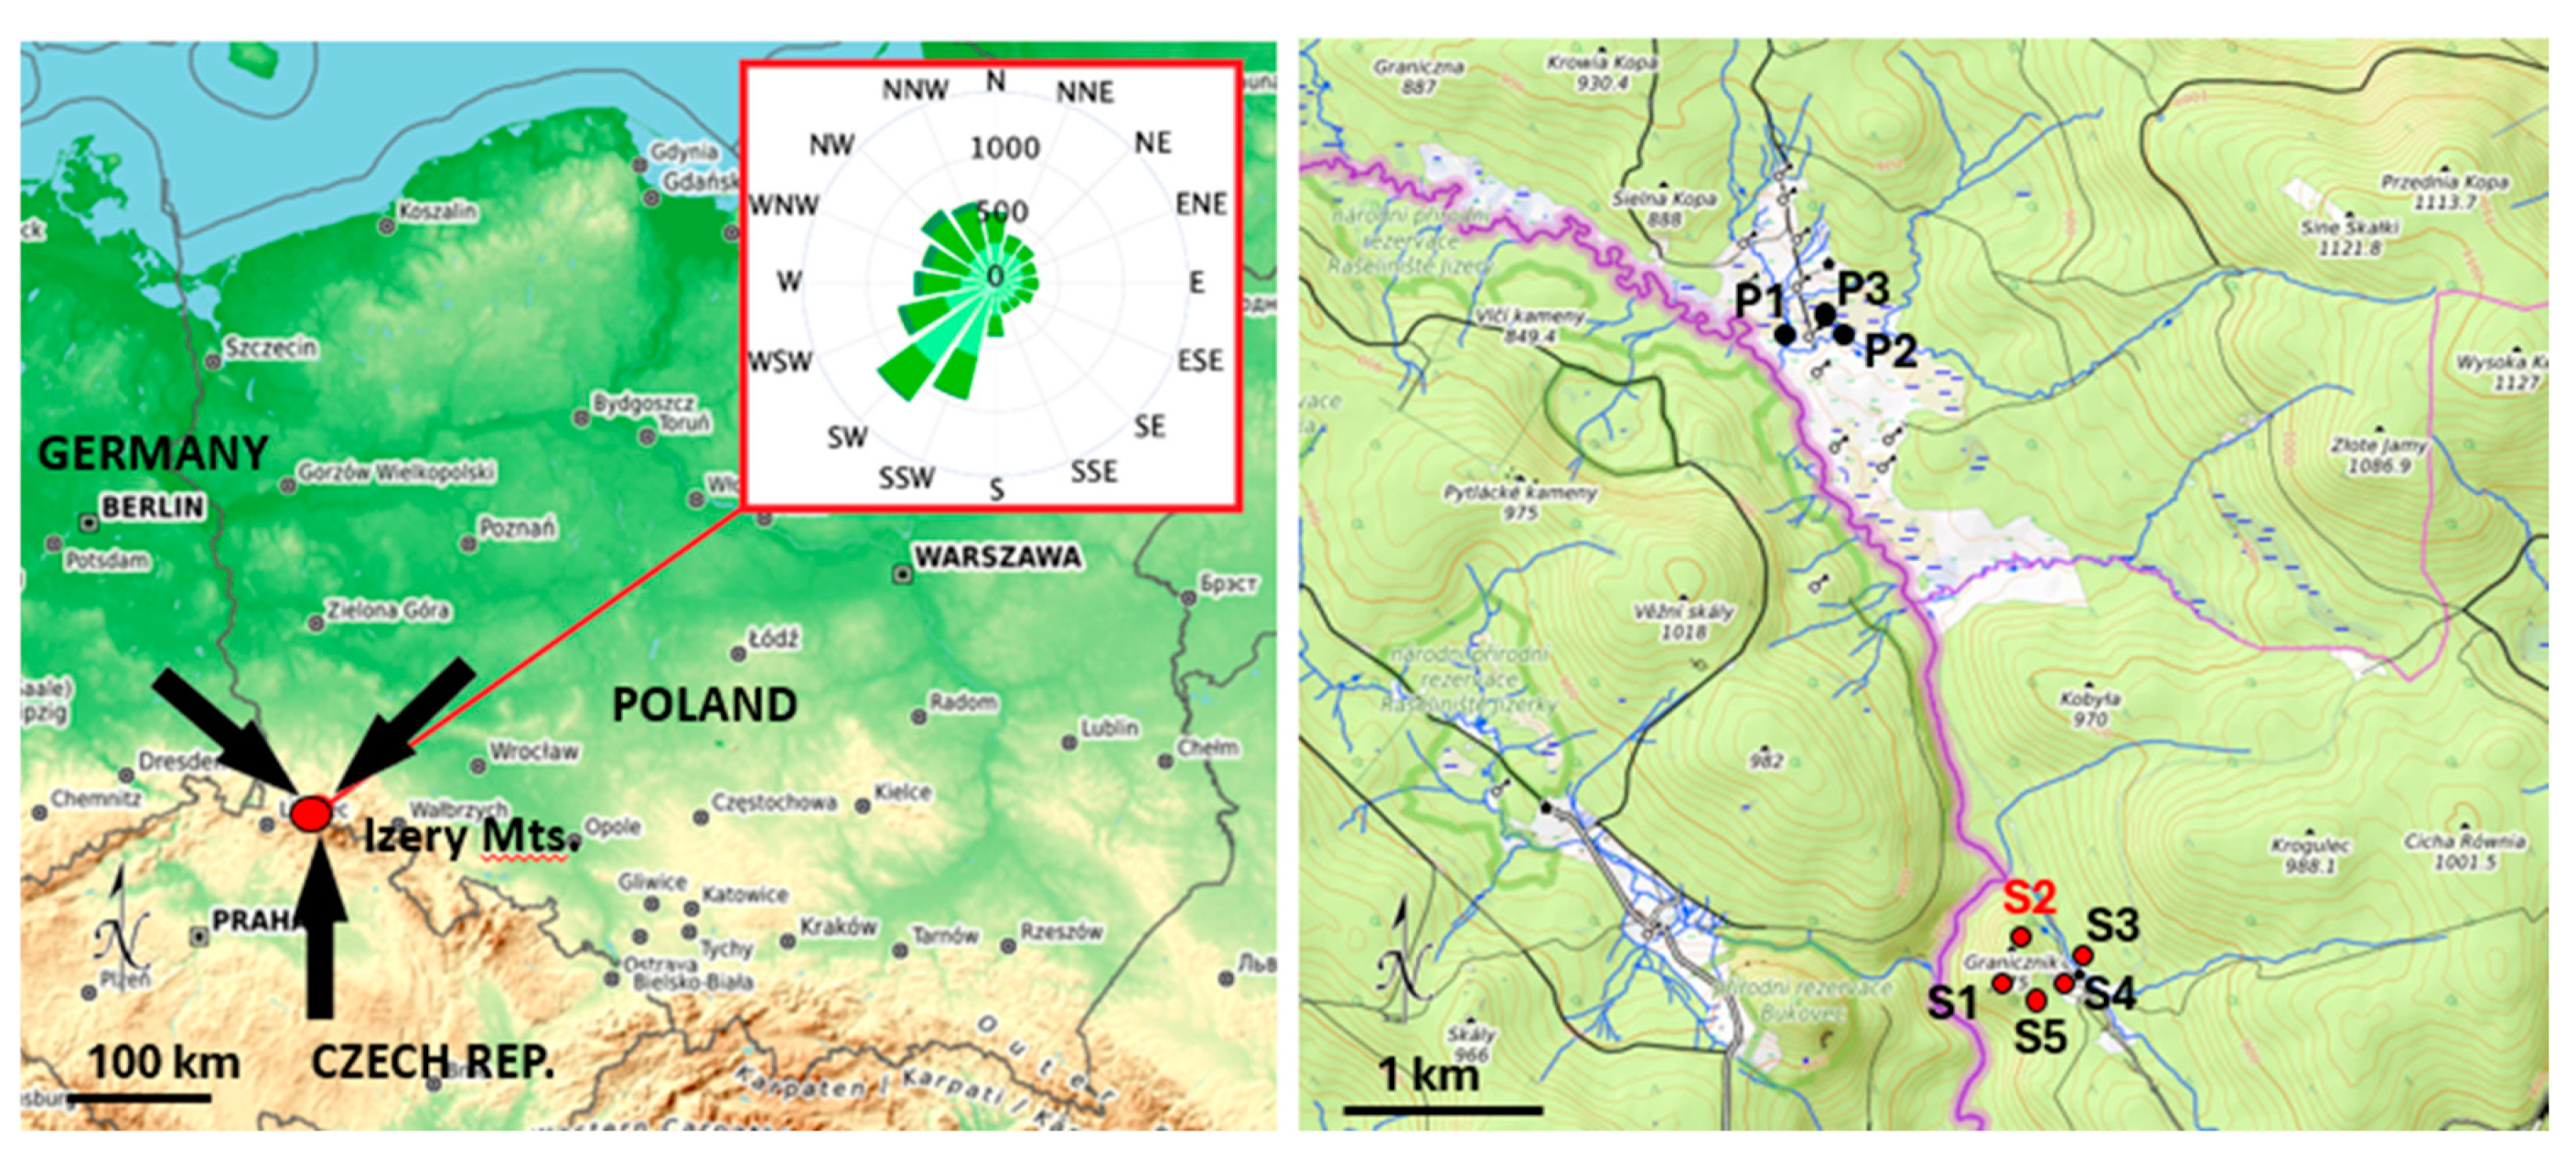
Figure 3.
Chemical fractionation of cadmium (A) and lead (B) in peat and soil profiles. Fractions: F0 – water soluble; FI – exchangeable+carbonate; FII – reducible (Mn-oxides and amorphous Fe-oxides); FIII – metastable/ mobilizable organic; FIV – stable residual (lithogenic crystallites).
Figure 3.
Chemical fractionation of cadmium (A) and lead (B) in peat and soil profiles. Fractions: F0 – water soluble; FI – exchangeable+carbonate; FII – reducible (Mn-oxides and amorphous Fe-oxides); FIII – metastable/ mobilizable organic; FIV – stable residual (lithogenic crystallites).
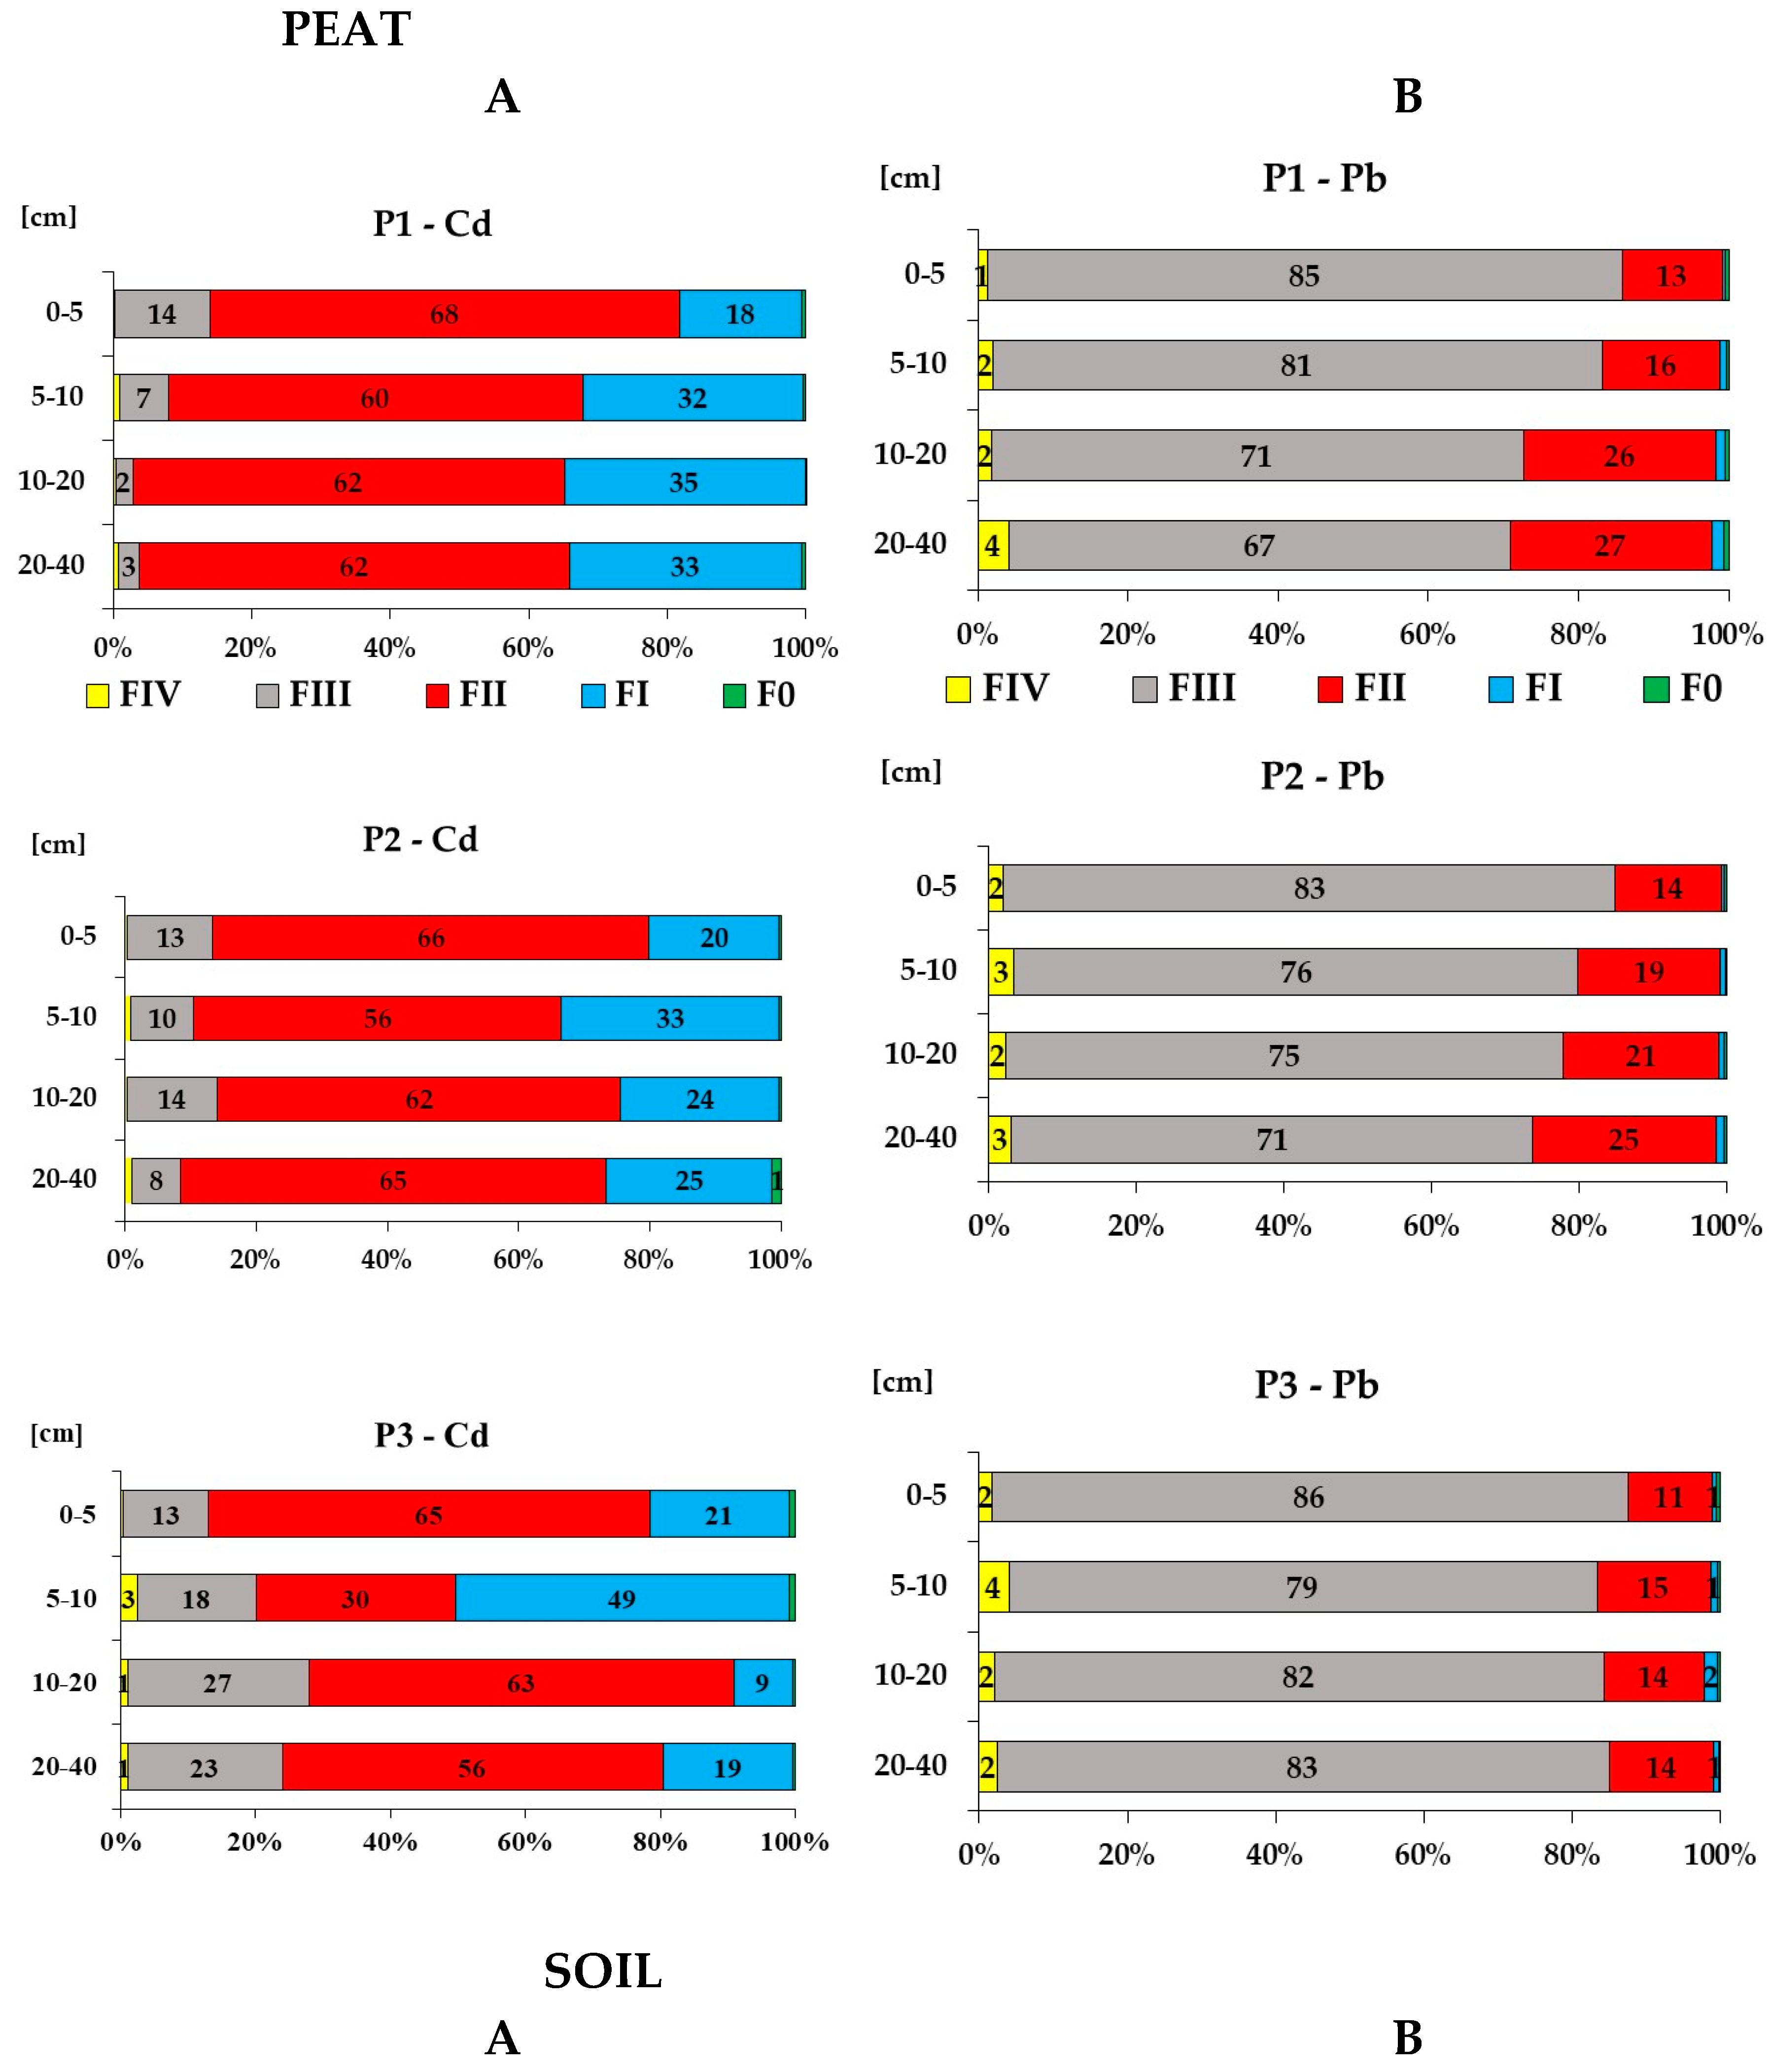
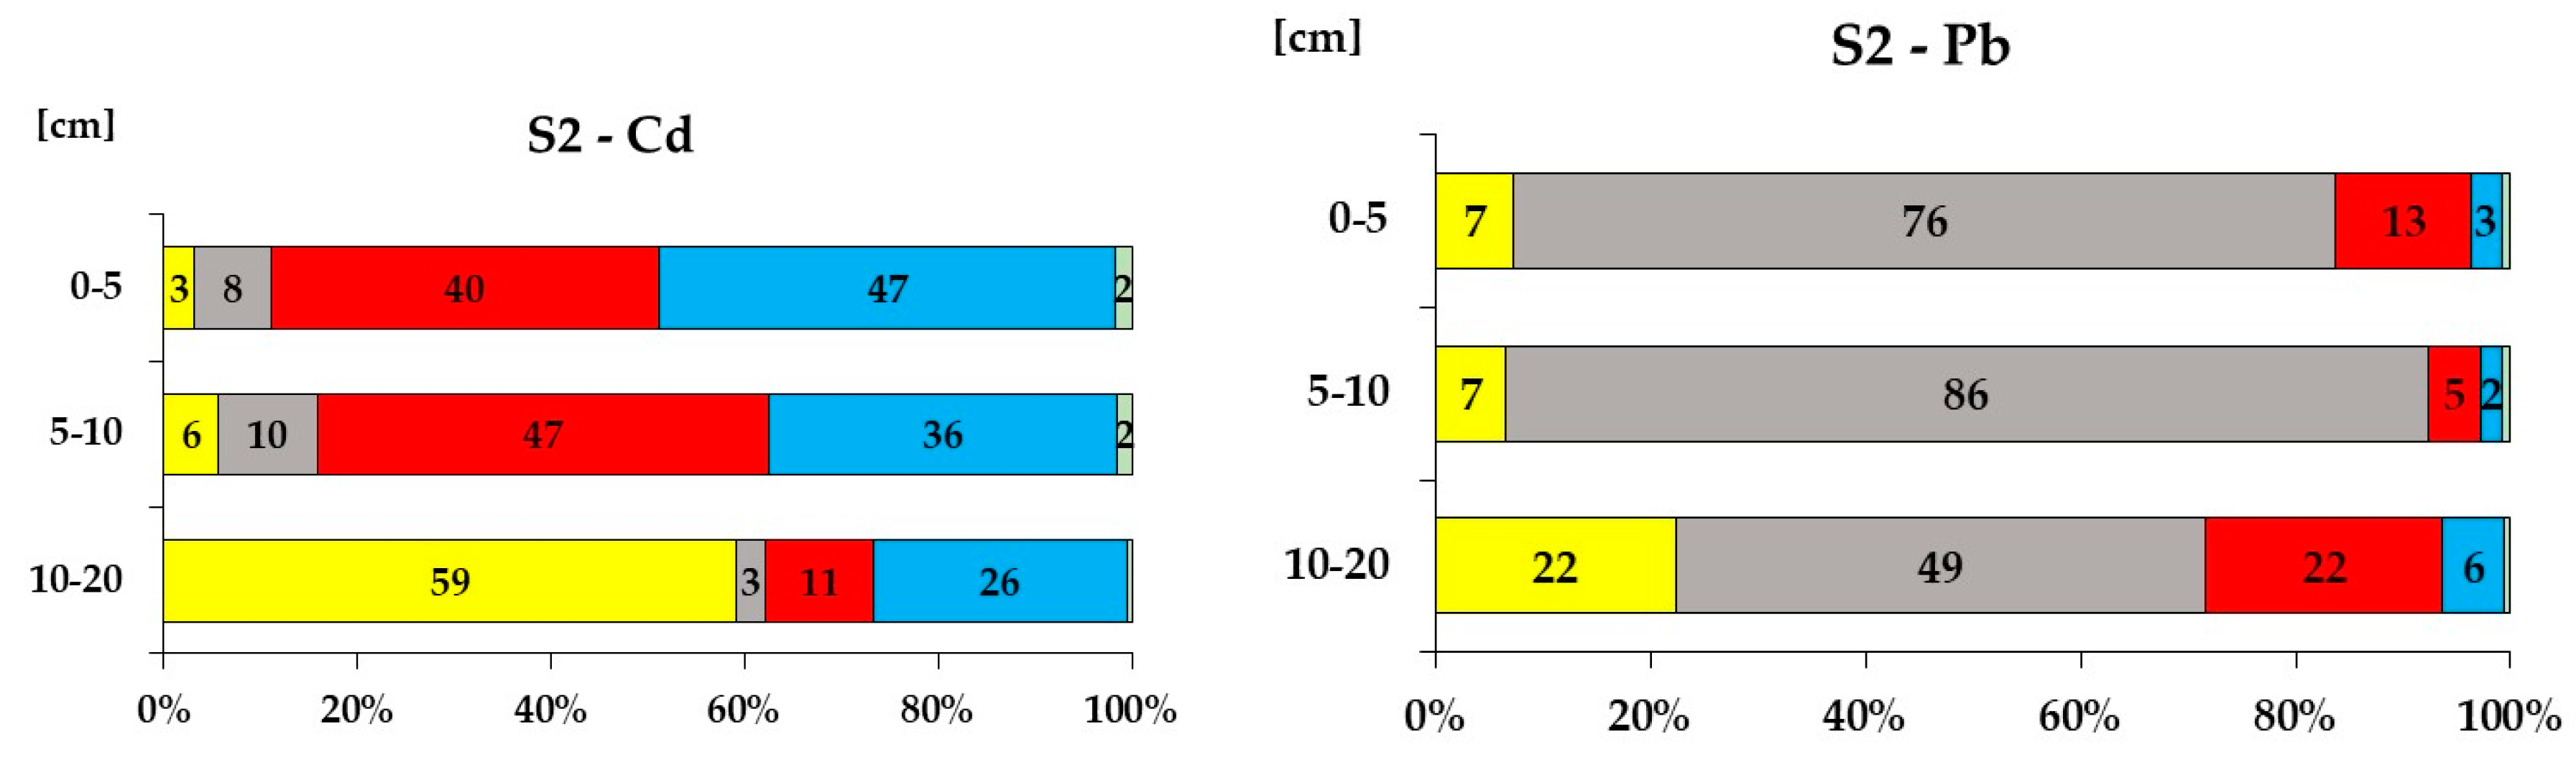
Table 1.
Physico-chemical properties of soil.
| Parameter | Unit | A horizon (n=5) Topsoil | B horizon (n=5) Subsoil | C horizon (n=5) backround |
|
|---|---|---|---|---|---|
| pH | Mean±SD | 5.15±0.66 | 4.78±0.64 | 5.53±0.77 | |
| Min.-Max. | 4.43-6.04 | 4.27-5.75 | 4.72-6.34 | ||
| ρ | Mean±SD | µS cm-1 | 162.4±5.9 | 125.5±6.6 | 78.33±12.9 |
| Min.-Max | 156.6-168.5 | 118.7-131.9 | 69.5-93.1 | ||
| Eh | Mean±SD | mV | 286.5±42.3 | 291.5±50.2 | 332.1±24.9 |
| Min.-Max. | 237.8-313.1 | 235.5-332.5 | 314.0-360.5 | ||
| Water content | Mean±SD | % | 58.2±8.7 | 49.4±16.2 | 23.0±5.5 |
| Min.-Max | 49.1-66.5 | 34.2-66.6 | 17.4-28.4 | ||
| Ash content | Mean±SD | % | 58.6±22.3 | 64.5±22.9 | 93.5±2.5 |
| Min.-Max. | 40.2-83.4 | 42.1-88.0 | 91.2-96.2 | ||
| OM | Mean±SD | % | 41.4±22.3 | 35.5±22.9 | 0.70±0.30 |
| Min.-Max. | 16.6-59.8 | 12.0-57.9 | 0.30-1.10 | ||
| Cd | Mean±SD | mg kg-1 | 0.77±0.30 | 0.43±0.18 | 0.12±0.06 |
| Min.-Max. | 0.46-1.18 | 0.12-0.99 | 0.02-0.19 | ||
| Pb | Mean±SD | mg kg-1 | 128.61±40.03 | 75.20±52.30 | 27.00±25.28 |
| Min.-Max. | 64.42-184.60 | 19.25-153.70 | 14.40-68.87 | ||
| CF | Cd | 7.7 (very high) | 4.3 (considerable) | ||
| CF | Pb | 4.5 (considerable) | 2.8 (moderate) |
n –number of soil profiles.
Table 3.
Distribution and cumulative loads of Cd and Pb along the (A) peat and (B) soil profiles
| Layer, cm |
Age | Bulk density g cm-3 |
Concentration Cn mg kg-1 |
Incremental loads Ln mg m-2 |
Total loads ∑Ln mg m-2 |
|||
|---|---|---|---|---|---|---|---|---|
| Cd | Pb | Cd | Pb | Cd | Pb | |||
| (A) Peat | ||||||||
| P1 | (lat. 50.85114 N, long. 15.35466 E, 828 m) | |||||||
| 0-3 | 2010 | 0.067 | 1.51 | 20.8 | 3.04 | 41.8 | 3.04 | 41.8 |
| 3-6 | 1999 | 0.096 | 2.77 | 108.8 | 7.97 | 313.4 | 11.00 | 355.2 |
| 6-9 | 1986 | 0.115 | 2.40 | 253.0 | 8.27 | 872.8 | 19.28 | 1 228 |
| 9-12 | 1961 | 0.119 | 1.70 | 269.4 | 6.08 | 961.7 | 25.35 | 2 190 |
| 12-14.5 | 1941 | 0.099 | 0.91 | 273.2 | 2.25 | 676.2 | 27.61 | 2 866 |
| 14.5-17 | 1926 | 0.097 | 0.81 | 201.2 | 1.96 | 487.9 | 29.56 | 3 354 |
| 17-20 | 1908 | 0.109 | 0.75 | 137.6 | 2.47 | 449.8 | 32.03 | 3 804 |
| 20-23 | 1883 | 0.097 | 0.71 | 98.9 | 2.07 | 287.8 | 34.10 | 4 091 |
| 23-26 | 1843 | 0.119 | 0.51 | 92.4 | 1.82 | 329.7 | 35.93 | 4 421 |
| 26-29 | 1792 | 0.113 | 0.40 | 87.5 | 1.34 | 296.5 | 37.27 | 4 718 |
| 29-31.5 | 1780 | 0.132 | 0.51 | 108.9 | 1.69 | 359.3 | 38.96 | 5 077 |
| 31.5-35 | 1710 | 0.105 | 0.42 | 72.4 | 1.55 | 266.2 | 40.51 | 5 343 |
| 35-38 | 1690 | 0.090 | 0.34 | 47.9 | 0.93 | 129.4 | 41.44 | 5 473 |
| 38-41 | 1600 | 0.080 | 0.28 | 34.1 | 0.68 | 82.0 | 42.12 | 5 554 |
| 41-44 | 1530 | 0.090 | 0.18 | 17.7 | 0.48 | 47.8 | 42.60 | 5 602 |
| P2 | (lat. 50.85175 N, long. 15.36155 E, 828 m) | |||||||
| 0-2.5 | 0.065 | 0.71 | 13.3 | 1.15 | 21.6 | 1.15 | 21.6 | |
| 2.5-5 | 0.085 | 1.04 | 19.6 | 2.20 | 41.6 | 3.35 | 63.2 | |
| 5-7.5 | 0.090 | 1.59 | 77.8 | 3.59 | 175.1 | 6.94 | 238.3 | |
| 7.5-10.5 | 0.136 | 1.87 | 158.2 | 7.62 | 645.0 | 14.56 | 883.3 | |
| 10.5-13 | 0.137 | 1.50 | 246.9 | 5.13 | 845.7 | 19.68 | 1 729 | |
| 13-15.5 | 0.134 | 3.38 | 231.8 | 11.29 | 773.9 | 30.97 | 2 503 | |
| 15.5-18 | 0.121 | 2.45 | 170.7 | 7.42 | 516.5 | 38.39 | 3 019 | |
| 18-20.5 | 0.101 | 1.65 | 119.7 | 4.18 | 303.3 | 42.57 | 3 323 | |
| 20.5-24 | 0.108 | 0.95 | 76.9 | 3.59 | 290.1 | 46.17 | 3 613 | |
| 24-27 | 0.077 | 0.62 | 63.8 | 1.42 | 146.8 | 47.59 | 3 760 | |
| 27-30 | 0.074 | 0.47 | 55.1 | 1.06 | 123.0 | 48.65 | 3 883 | |
| 30-33 | 0.073 | 0.39 | 50.8 | 0.85 | 111.7 | 49.50 | 3 994 | |
| 33-37 | 0.062 | 0.34 | 35.4 | 0.84 | 88.2 | 50.34 | 4 083 | |
| 37-42 | 0.061 | 0.27 | 22.3 | 0.82 | 68.5 | 51.16 | 4 151 | |
| 42-47 | 0.062 | 0.27 | 17.3 | 0.83 | 53.8 | 51.99 | 4 205 | |
| P3 | (lat. 50.85208 N, long. 15.36105 E, 829 m) | |||||||
| 0-3 | 0.060 | 0.39 | 8.6 | 0.70 | 15.4 | 0.70 | 15.4 | |
| 3-6 | 0.066 | 0.94 | 24.3 | 1.86 | 48.1 | 2.56 | 63.5 | |
| 6-9 | 0.071 | 2.44 | 94.9 | 5.16 | 200.9 | 7.72 | 264.4 | |
| 9-11.5 | 0.072 | 2.12 | 129.4 | 3.85 | 234.4 | 11.57 | 498.8 | |
| 11.5-14 | 0.093 | 1.24 | 171.4 | 2.88 | 398.3 | 14.45 | 897.1 | |
| 14-16 | 0.097 | 0.91 | 201.7 | 1.77 | 391.3 | 16.22 | 1288 | |
| 16-19 | 0.080 | 1.14 | 203.4 | 2.73 | 488.3 | 18.96 | 1777 | |
| 19-21.5 | 0.101 | 1.85 | 198.6 | 4.68 | 501.4 | 23.63 | 2278 | |
| 21.5-25 | 0.106 | 3.14 | 211.2 | 11.64 | 783.6 | 35.27 | 3062 | |
| 25-28 | 0.090 | 3.31 | 108.5 | 8.94 | 292.9 | 44.21 | 3355 | |
| 28-31 | 0.091 | 1.35 | 81.2 | 3.69 | 221.5 | 47.90 | 3576 | |
| 31-35 | 0.111 | 0.90 | 99.5 | 4.00 | 442.0 | 51.90 | 4018 | |
| 35-39 | 0.116 | 0.68 | 123.7 | 3.14 | 573.5 | 55.04 | 4592 | |
| 39-43 | 0.086 | 0.42 | 109.4 | 1.46 | 377.8 | 56.50 | 4970 | |
| 43-47 | 0.077 | 0.36 | 90.3 | 1.12 | 276.5 | 57.62 | 5246 | |
| Mean | 50.74±7.59 | 5018±726 | ||||||
| (B) Soil | ||||||||
| S2 | (lat. 50.81641 N, long. 15.37677 E, 868 m) | |||||||
| 0-5 | 0.342 | 1.18 | 184.6 | 20.18 | 3157 | 20.18 | 3157 | |
| 5-10 | 0.201 | 0.73 | 230.1 | 7.35 | 2313 | 27.52 | 5469 | |
| 10-20 | 0.730 | 0.11 | 77.3 | 7.88 | 5641 | 35.41 | 11110 | |
Table 4.
Binding strength of Cd and Pb in peat (A) and soil (B).
| Profile | Cd | Pb | |||||
|---|---|---|---|---|---|---|---|
| Layer cm |
Mobile fractions (F0+FI+FII) [%] | Mobilizable fraction (FIII) [%] |
Immobile fraction (FIV) [%] |
Mobile fractions (F0+FI+FII) [%] | Mobilizable fraction (FIII) [%] |
Immobile fraction (FIV) [%] |
|
| (A) Peat | |||||||
| P1 | (lat. 50.85114 N, long. 15.35466 E, 828 m) | ||||||
| 0-5 | 85.9 | 13.9 | 0.2 | 14.1 | 84.6 | 1.3 | |
| 5-10 | 92.1 | 6.9 | 1.0 | 16.9 | 81.2 | 2.0 | |
| 10-20 | 97.2 | 2.5 | 0.4 | 27.2 | 71.0 | 1.8 | |
| 20-40 | 96.1 | 3.0 | 0.8 | 29.1 | 66.8 | 4.1 | |
| P2 | (lat. 50.85175 N, long. 15.36155 E, 828 m) | ||||||
| 0-5 | 86.6 | 13.1 | 0.3 | 15.2 | 82.8 | 2.0 | |
| 5-10 | 89.5 | 9.6 | 0.9 | 20.2 | 76.4 | 3.4 | |
| 10-20 | 86.0 | 13.7 | 0.3 | 22.3 | 75.4 | 2.3 | |
| 20-40 | 91.5 | 7.5 | 1.0 | 26.4 | 70.5 | 3.1 | |
| P3 | (lat. 50.85208 N, long. 15.36105 E, 829 m) | ||||||
| 0-5 | 86.9 | 12.6 | 0.5 | 12.4 | 85.8 | 1.7 | |
| 5-10 | 79.9 | 17.5 | 2.6 | 16.7 | 79.3 | 4.0 | |
| 10-20 | 72.1 | 26.8 | 1.1 | 15.8 | 82.2 | 2.0 | |
| 20-40 | 75.9 | 22.9 | 1.1 | 14.9 | 82.7 | 2.4 | |
| (B) Soil | |||||||
| S2 | (lat. 50.81641 N, long. 15.37677 E, 868 m) | ||||||
| 0-5 | 89.0 | 7.9 | 3.2 | 16.2 | 76.5 | 7.3 | |
| 5-10 | 84.2 | 10.2 | 5.6 | 7.7 | 85.8 | 6.5 | |
| 10-20 | 37.8 | 3.2 | 59.1 | 28.3 | 49.4 | 22.3 | |
Disclaimer/Publisher’s Note: The statements, opinions and data contained in all publications are solely those of the individual author(s) and contributor(s) and not of MDPI and/or the editor(s). MDPI and/or the editor(s) disclaim responsibility for any injury to people or property resulting from any ideas, methods, instructions or products referred to in the content. |
© 2024 by the authors. Licensee MDPI, Basel, Switzerland. This article is an open access article distributed under the terms and conditions of the Creative Commons Attribution (CC BY) license (http://creativecommons.org/licenses/by/4.0/).
Copyright: This open access article is published under a Creative Commons CC BY 4.0 license, which permit the free download, distribution, and reuse, provided that the author and preprint are cited in any reuse.


