Submitted:
15 June 2023
Posted:
15 June 2023
You are already at the latest version
Abstract
This work discusses the relationship between foreign direct investment (FDI) and pollution in Spain using an autoregressive distributed lag regression model (ARDL) from 1961 to 2018. The authors apply the theoretical context of pollution haven/halo and conclude that FDI in Spain does not contribute to the transfer of green technologies for cleaner production, despite being included within the European environmental regulatory framework. The authors also verify the adequacy of the environmental Kuznets curve (EKC) and the Load Capacity Curve hypothesis (LCC) in the Spanish environmental context and find that income per capita has a positive effect on environmental sustainability and quality. In this sense, the further development of an efficient renewable energy infrastructure could efficiently drive to a better standards all pollution indexes in Spain, including nuclear energy production, contributing the emissions neutrality aimed by the EU by 2050.
Keywords:
Pollution
; Load Capacity Hypothesis (LCC)
; Sustainability
; Pollution Haven Hypothesis
1. Introduction
Environmental sustainability has taken the spotlight over the past decade, both in the academic and social debate. The relevance of this debate is due to the numerous harmful effects on health derived from environmental degradation that has been exposed in many publications to date. In order to address all problematics attached to pollution, traditionally polluting countries like China have pledged to drastically reduce their emissions of polluting gases, while the international community tries to promote global commitment to fight climate change through international agreements, as environmental degradation has shown to care no borders.
In the same way as China, the European Union (EU) has committed to achieving emission neutrality by 2050, a fact ratified in the European Green Deal. From the implications for the region of achieving this objective, the EU affirms that it will have a positive impact on economic growth, jobs and markets opportunities and technological development (European Commission, 2023a). In that same sense, In March 2023, the European Parliament and the Council of Europe reached a provisional agreement to raise the binding renewable energy target to at least 42.5% by 2030, with a potential top-up to 45% (European Commission, 2023b). The EU got 22% of its energy from renewable sources in 2021, but the level varied significantly between countries, with Sweden leading the 27 EU countries with its 63% renewable energy share, while in Luxembourg, Malta, the Netherlands, and Ireland, renewable sources make up less than 13% of total energy use.
As such, all EU member states are obliged to comply with EU´s binding climate and energy legislation by 2030 (European Commission, 2020). The framework for energy and climate policy in Spain is determined by the EU, which acts in line with its own climate and energy objectives. Spain has placed the energy transition at the forefront of its energy and climate change policies and has set its own objectives and ambitions that align with EU targets (IEA, 2021). The current Spanish framework for energy and climate is based on the 2050 targets of national climate neutrality, 100% renewable energy in the electricity mix and 97% renewable energy in the total energy mix (Morgado & Victoria, 2021).
The relevance of Spain as the object of study in this work is not due to its relevance within the European panorama against climate change, since its commitment to this purpose is given, to a greater extent, by its membership in the EU. According to the Climate Change Performance Index, which evaluates the efforts of countries in the fight against climate change, Spain was ranked 23 out of a total of 63 countries around the world, rated as a medium commitment along with countries such as France, Italy and Mexico.
To represent this commitment to the fight against climate change, new research is using new variables to denote the environmental quality of these countries. One of these variables is the Load Capacity Factor, which studies the production of national natural resources based on the consumption of these resources, i.e., ecological footprint. The higher the load capacity factor, the more natural resources a country produces than it consumes, ensuring greater environmental sustainability. Most of the work to date on the load Capacity factor has tended to select those countries that stand out in the production of green energy, such as Korea (Pata & Kartal, 2023). The selection of Spain allows us to study the performance of the average countries in the fight against climate change, being able to obtain results more easily standardized to the European countries.
Thus, the following paper is divided into the following sections: the second section provides the theoretical context and formulates the hypotheses to be studied; section 3 contains the data used, the model studied, and the methodology used in the study of the hypotheses; section 4 contains the results of the model studied, and section 5 contains the conclusions we reached to.
2. Theoretical Framework and Hypothesis
The debate on economic development to date has placed special interest in Foreign Direct Investment (FDI), as one of the promoters of economic growth, since it does not generate debt for the country that receives the investment, it contributes to job creation, and facilitates the transfer of knowledge and technology, known as spillovers effects (OECD, 2002). Traditionally, developed countries have been suspected of relocating the most polluting production processes to developing countries (De Beule et al., 2022; Wang et al., 2019), a fact that gave rise to hypotheses such as the pollution haven hypothesis. These off-shoring dynamics continue to be taking place based on FDI empirical literature in certain countries, while the opposite effect has also been studied, in which the transfer of more modern technologies as part of FDI spillovers contribute to environmentally sustainable economic practices in the host country, a dynamic that is understood as the pollution halo hypothesis (Fu, 2012; Kokko, 1994; Orlic et al., 2018).
Both the pollution haven and the pollution halo hypotheses are based on the theory of location advantages that was developed within the framework of Dunning's OLI paradigm (Ownership, Location and Internalization advantages), whereby companies tend to seek competitive advantages by, among others, relocating their production processes (Dunning, 1979, 1981). In this way, companies, usually multinational enterprises (MNEs), tend to maximize returns on their investments, considering factors such as the tax burden of the invested country. According to this, the growing debate on environmental protection has led countries to approve measures to discourage engagement in polluting activities, one of the most popular mechanisms being the imposition of taxes for polluting discharges, a fact that could contribute to disincentivize FDI inflows since implies an increase in the tax burden of local companies (Driffield et al., 2021; He et al., 2019; Jones et al., 2023; Ullah et al., 2023; Yang & Tang, 2023).
Having established the FDI framework, the Pollution Haven Hypothesis is based on the fact that countries with little environmental protection encourage the attraction of polluting FDI (Apergis et al., 2022; Esmaeili et al., 2023). In this way, these countries prioritize economic growth derived from the positive effects of FDI over environmental protection. At the other end of the debate is the pollution halo hypothesis, which states that the FDI does not contribute to the degradation of the environment, but rather, this FDI transfers green technology that contributes to a greener productivity of the host country (Jiang et al., 2022; Singhania & Saini, 2021). In this sense, it has been accepted that the pollution Halo hypothesis tends to occur in developed countries, the opposite being the case of the pollution haven hypothesis, having the level of income per capita a relevant significance to determine the level of environmental degradation (H. Huang et al., 2023). This income-pollution relationship gave rise to one of the hypotheses studied in this paper, the Environmental Kuznet's Curve hypothesis (EKC).
This hypothesis is based on the idea that the income-pollution relationship follows a non-linear trend, being U-shaped (Grossman & Krueger, 1991). This implies that for low levels of development, countries incur more pollution, while after a certain threshold in their development, pollution is reduced, and environmental quality is improved at higher levels of income. This relationship is one of the most popular in the environmental literature, and its adequacy has generated a general consensus in the academic community (Amri, 2018; Bozoklu et al., 2020; Destek & Sarkodie, 2019; Dong et al., 2018; Majeed, 2020).
Due to the popularity of the EKC hypothesis, other theories have been appearing within the academic debate, one of them, the recent Load Capacity Curve hypothesis, LCC for short (Pata & Kartal, 2023). This hypothesis is based on the sustainability capacity of the countries measured based on the load capacity factor, LCF, which is the proportion of biodiversity to ecological footprint in said country (Awosusi et al., 2022; Pata & Balsalobre-Lorente, 2022; Pata & Isik, 2021; Shang et al., 2022). At higher values of the LCF, said country has a better relationship between the natural resources it produces, biodiversity, and those it consumes, ecological footprint, improving the sustainability of the national environment. In this way, the LCC estimates that at higher levels of income per capita, the environmental quality of the country increases, following a non-linear relationship, in this case U-shaped, the inverse of the EKC hypothesis.
A representation of this hypothesis can be seen in Figure 1. Although a good part of the studies to date use linear models to study this relationship (Fareed et al., 2021; Pata & Samour, 2022), more recent studies affirm that there is a non-linear relationship between both variables (Pata & Kartal, 2023), a dynamic that we will put into test for the case of Spain in this research.
According to the LCC theory, anthropogenic activities and the use of fossil fuels seriously harm the environment during the early phases of economic development. However, after a certain inflection point in per capita income, denoted in Figure 1 by the red vertical line, higher income per capita converges to use renewable energy sources and consume more sustainable goods. As a result, by lowering EF and raising biocapacity, environmental quality can be enhanced (Pata & Kartal, 2023).
One of the factors likely to contribute to the European goal of achieving emission neutrality by 2050 is the production of renewable energy, since many of the studies in this area have identified the production of green energy as one of the determinants of better environmental quality (Adebayo et al., 2022; Pata, 2021; Pata & Caglar, 2021; Shan et al., 2021; Sharif et al., 2021), a fact that justifies the inclusion of this variable in our model. The same relationship applies to the production of nuclear energy, which is an alternative to polluting energy and which is especially relevant within the environmental debate (Danish et al., 2022; Menyah & Wolde-Rufael, 2010; Nathaniel et al., 2021; Saidi & Ben Mbarek, 2016).
Based on the relationships specified above, the objectives of this paper will be the following:
H1. Since Spain involvement in the EU, European environmental commitment to achieve neutral CO2 emissions might have influence FDI flows to incur greener technologies in order to minimize environmental tax burden and maximize returns on investments in Spain. In within this framework, we expect FDI to Spain to fall in the pollution halo hypothesis due to the EU environmental regulation.
H2. If the EKC curve relationship were to hold true for Spain, we could infer that at lower levels of income per capita, pollution increases up to a certain threshold. The reasons for this relationship could be due to the prioritization of economic growth to environmental protection, as well as the lack of social awareness on the impact of pollution on society.
H3. We could infer, in the same sense as the EKC hypothesis, that higher levels of income per capita contribute to the biodiversity/ecological footprint relationships, contributing to the sustainability of the Spanish economy. Establish the validity of the LCC in the case of Spain could contribute to a better environmental sustainability condition, hoping to identify the determinants of sustainable energy consumption in Spain.
H4. Considering that renewable energies contribute to less environmental degradation, the same is expected, based on previous literature, of nuclear production, however, this is only valid if nuclear energy is well implemented among society, otherwise, a negative or insignificant relationship might be expected.
H5. It may be the case that the green energy consumption network is not sufficiently consolidated in Spain so that this consumption does not have an impact on improving the environment quality. Considering the rise of solar energy production in Spain, we assume that this renewable energy is well utilized and spread among all sectors of society, estimating a positive and significant relationship.
3. Data, Model and Methodology
3.1. Data and Model
This study has been developed with annual data for the case of Spain from 1961 to 2018, with a total of 57 observations for each variable. The variables selected here are shown in Table 1, with an expression of their metric and source. The dependent variables are CO2, measured as annual emissions per capita (Danish et al., 2022; Lin & Li, 2011; Menyah & Wolde-Rufael, 2010); EF, the ecological footprint measured in global hectares per capita (gha per capita) (Ahmed et al., 2020); and LCF, Load Capacity Factor, calculated as biocapacity divided by Ecological footprint, measured in gha per capita (Fareed et al., 2021; Pata, 2021).
Regarding our variables of interest, FDI represents the stock of Inward Foreign Direct Investment in Spain in current US$; GDP is the gross domestic product in current US$; NUC is the nuclear energy production in terawatts per hour (TWh), and REC represents the consumption of renewable energies as the sum of marine, wind, solar and geological energy, all measured in TWh.
The LCF enables concurrent environmental assessment on the supply and demand sides since it includes EF in the denominator and biocapacity in the numerator. A better environment is indicated by a greater LCF. In other words, values less than one represent an overconsumption of the country's own natural resources above its capacity, incurring environmental degradation. The time series of the examined variables is depicted in logarithmic form in Figure 2.
In the upper line, the first graph of Figure 2, it can be seen how the ecological footprint has been growing steadily since 1961, while the country's biocapacity has remained constant. From the increase of one with respect to the other, we can intuit that the LCF is negative, as represented by the second graph. We conclude that Spain has been below the sustainability threshold for a 50 years period. In the lower row, the first graph shows the production of renewable energy in Spain with the expression of its source, solar energy being the most popular of the three since the beginning of the 2000s, together with the total of them called REC. The last graph shows the trend of all the variables in logarithms, where we see that all of them follow a relatively constant and increasing trend for the entire time series, except for the LCF variable, which follows a negative trend.
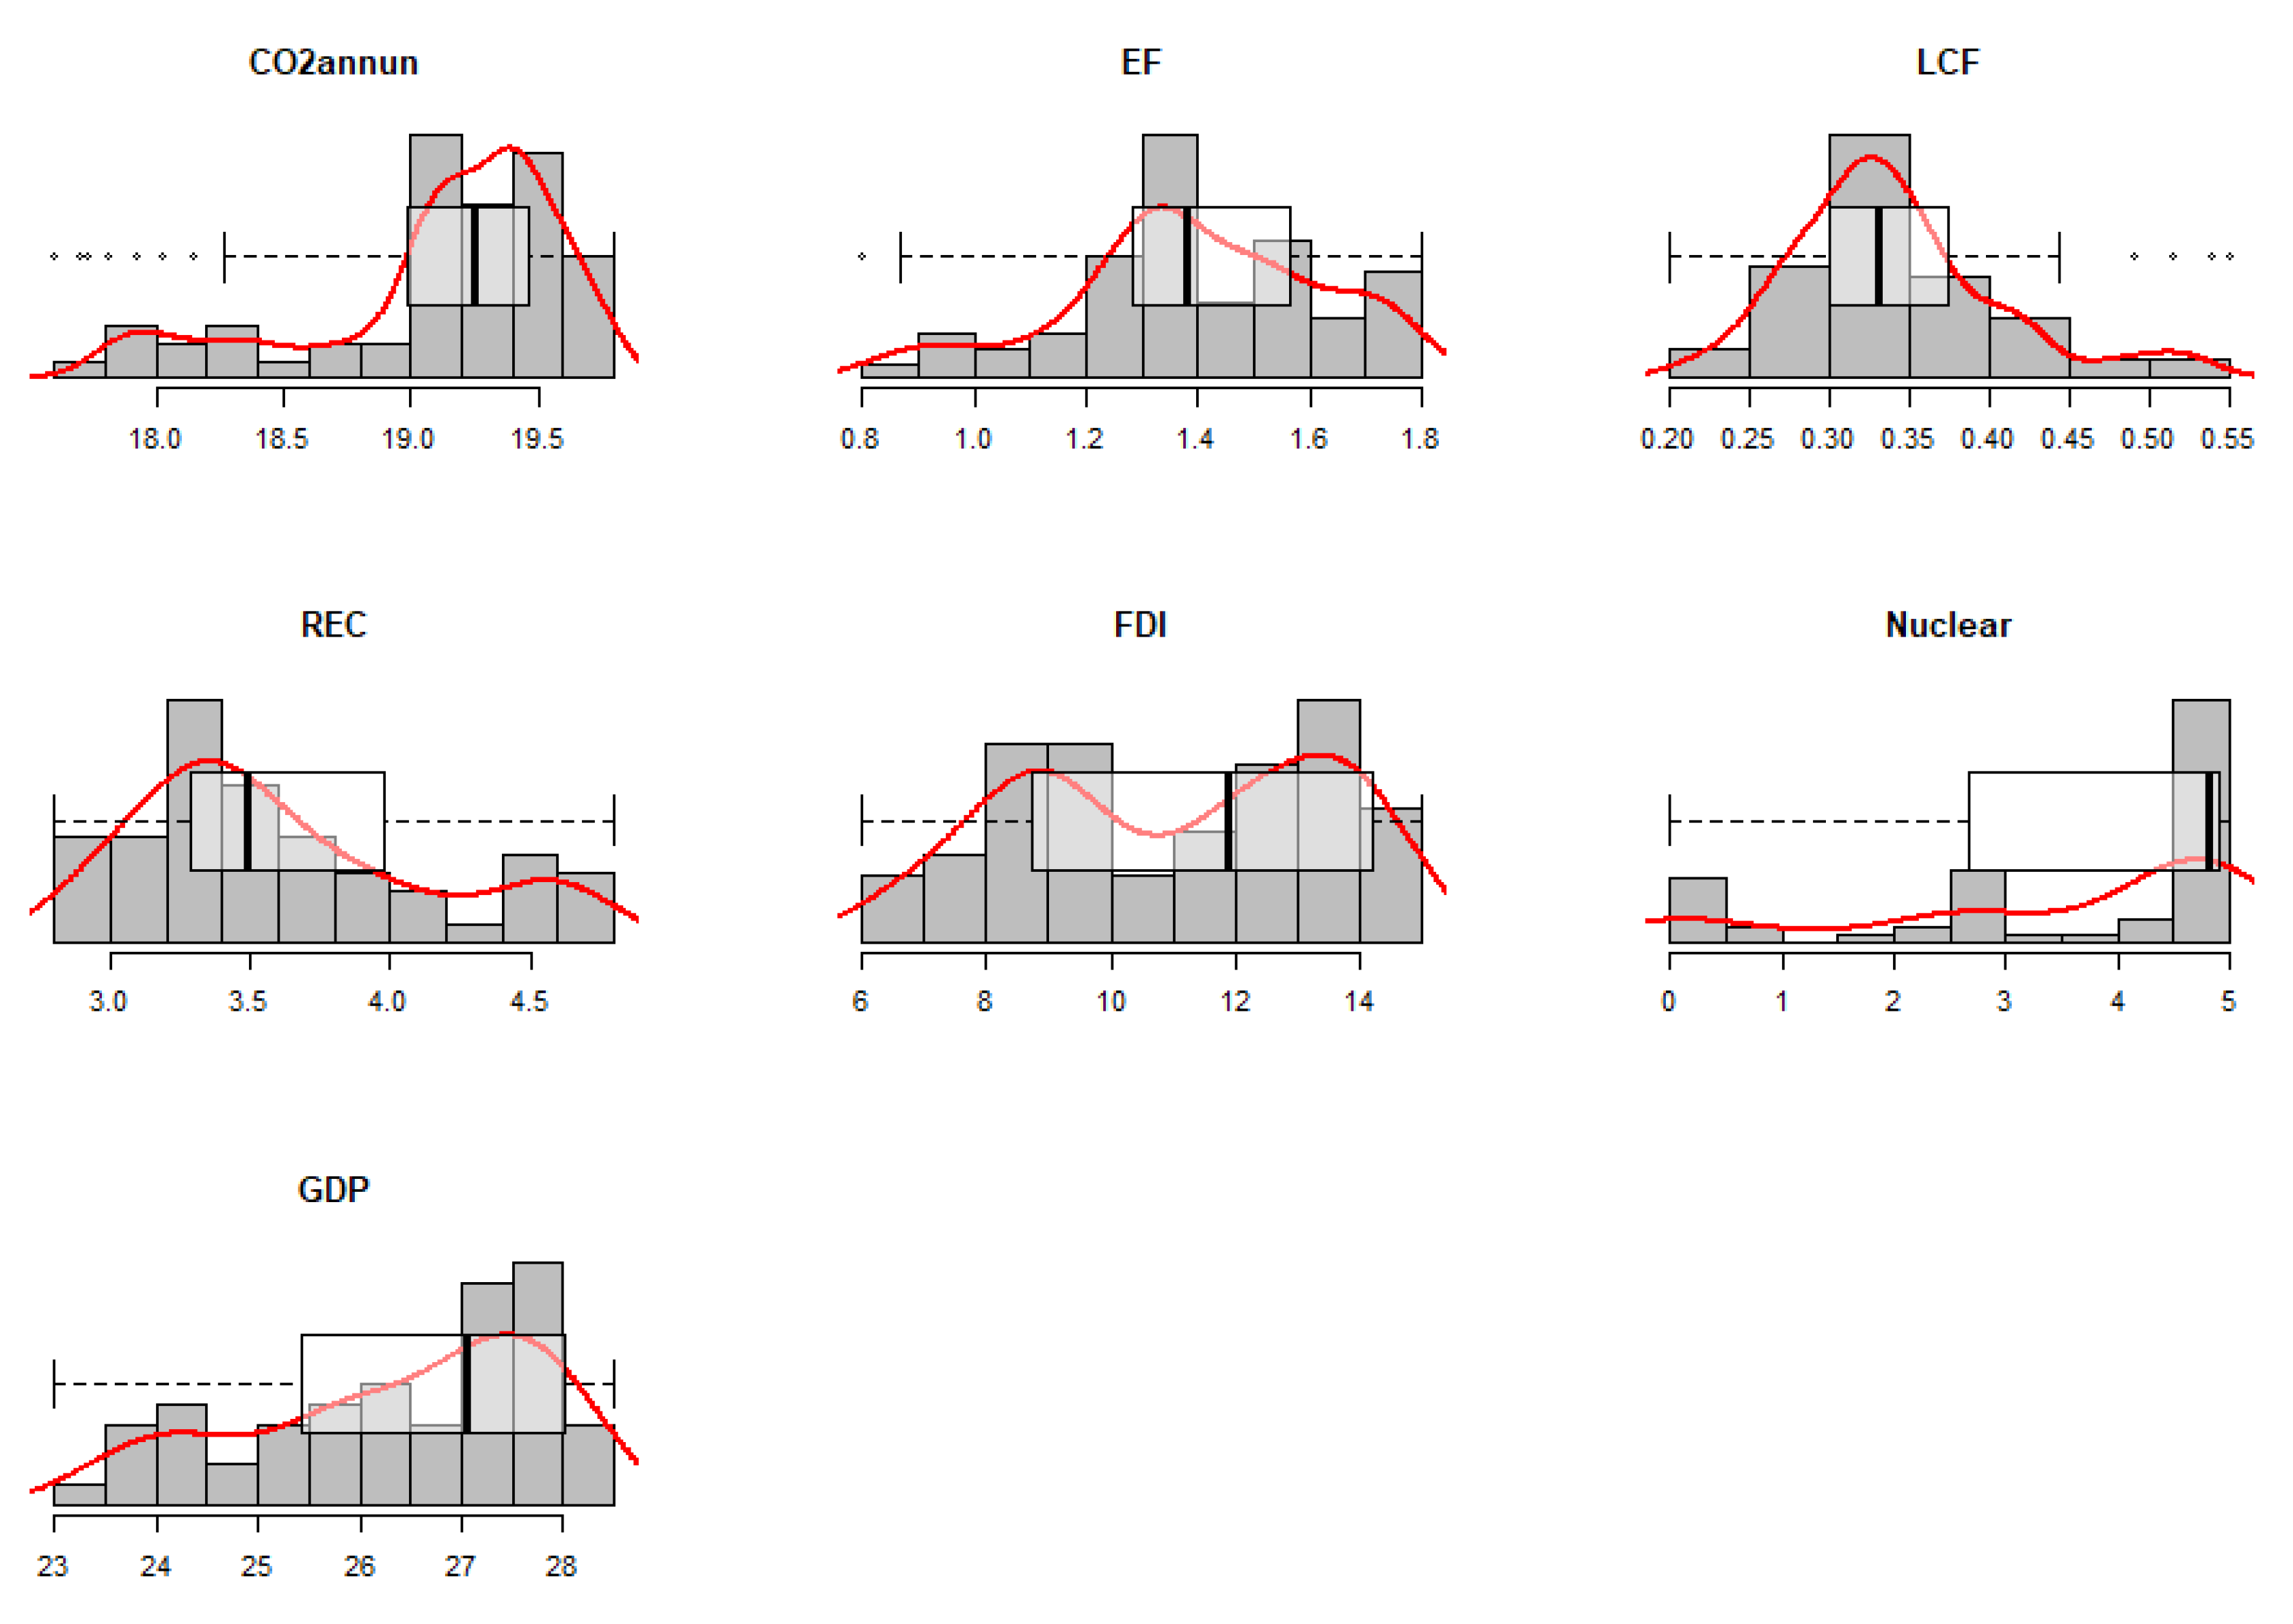
Table 2 and Figure 3 of the annexes represent the descriptive statistics of the variables studied. It is worth noting that for the study of the descriptive statistics only GDP was transformed into logarithms.
In order to guarantee greater robustness when studying the hypotheses of our interest, we consider the three models listed below (1), (2) and (3), with all the variables transformed into logarithms for the calculation of elasticities and for avoid heteroscedasticity problems.
In these equations, the , and represent constant terms, while the rest of the coefficients, , and represent the elasticities corresponding to each one of the environmental indicators. the , and represent the error terms. According to the hypothesis tested, these results are the expected:
- Pollution Haven/ Halo Hypothesis: and have to bear a positive sign as it might imply that FDI contributes to air quality degradation and to increase the ecological footprint respectively, while has to be negative. For the pollution Halo the opposite is expected.
- EKC hypothesis: is positive while is negative; same relationship holds for and . The previously stated coefficients would imply an inverted U-shape relationship, as higher values of GDP contribute to a decrease in environmental degradation.
- LCC hypothesis: has to be negative while is expected to be positive. This is the inverse of the EKC hypothesis, following a U-shaped relationship between income and environmental sustainability.
For the NUC and REC coefficients, previous literature has denoted the capacity of nuclear power to combat environmental degradation (Danish et al., 2021; Dong et al., 2018; Murshed et al., 2022; Pata & Samour, 2022), thus the coefficients , are expected to be positive, and is expected to be negative. In the same way that with nuclear energy, the production and consumption of renewable energy is considered positive for the environmental sustainability, expecting and to be positive, and should be negative (Kartal, 2023; Qashou et al., 2022; Samour et al., 2022). However, this relationship has not been ratified in all cases since the consumption of renewable energy has to be used sparingly and effectively in the country's economic and social processes (Pata & Kartal, 2023). In order to achieve this effect, a period of time can be estimated for the energy supply facilities to adapt these new energies to society as a whole, so that, in this case, the consumption of renewable energy may not give the expected results.
3.2. Methodology
To study the relationships described in the previous equations, we used an autoregressive distributive lag (ARDL) model. In this sense, the ARDL bounds test introduced by Pesaran allows the simultaneous estimation of the long-run and short-run elasticities of the variables of interest as long as they are I(1) or I(0) (Menegaki, 2019; Pesaran et al., 2001). The appropriateness of this model is even more convenient for this study because it produces good results with few observations. In relation to the Bounds test, the unrestricted error correction model (UECM) is set up in Equation (4), and the cointegration analysis is performed by applying the Wald test to the long-run coefficients.
where Y is a vector of environmental indicators, CO2, EF and LCF, and X is a vector of explanatory variables, named FDI, GDP, GDPSQ, NUC and REC. From the specification of the model in Equation (4), the cointegration equation provides the elasticities in the short run, being these the coefficients of the differenced variables, and , while the elasticities in the long run are presented by the coefficients and . is a drift component, while is white noise.
To affirm the presence of cointegration, we performed an F-bounds test on the above ECM model. The bounds test asserts the validity of the null hypothesis that coefficients in previously stated equation (4) are 0. If the null is rejected, ARDL regression should be performed. The null is represented as follows:
H0 :
H1 :
If the F-test rejects the null hypothesis, then the studied variables are cointegrated, allowing us to estimate the coefficients of the long-run and short-run relationships in the ARDL model.
4. Empirical Results
In order to satisfy the bounds test assumption of the ARDL model, all variables must be stationary I(0) or I(1). Various methods and specifications for each test are listed in Table 3.
Table 3 shows the unit root analysis of the variables studied. This analysis was carried out using three methods, the first, Augmented Dickey Fuller, being the most widely used analysis in the literature. To ensure greater robustness of our conclusions, we used the Philipps-Perron stationarity test, PP (Phillips & Perron, 1988), and the Dickey Fuller Generalized Least Squares, DF-GLS (Elliott et al., 1996), the former being more suitable for long time series and the latter for shorter time series. Likewise, for each test, it has been tested with intercept in the first column, and with intercept and trend in the second column. All results affirm that all our variables are I(1), so we can proceed with the cointegration analysis.
Table 4 gathers the ARDL bounds test to assert the presence of cointegration in the Equations (1), (2) and (3). The bounds test reports an F statistic that is compared with the asymptotic critical values (Narayan, 2005), with the F value for each of the models being higher than the critical values, rejecting the null hypothesis for each model, and determining that cointegration exists, making the ARDL analysis appropriate.
Table 5 presents the estimated coefficients and their standard errors for the long-term and short-term relationships for the dependent variables CO2 (1), EF (2) and LCF (3), using the error correction model (ECM). The upper part of the table shows the long-term relationships between the dependent and explanatory variables, while the lower part shows the ECM, where the variables are differentiated for the calculation of the short-term relationship.
4.1. Carbon Emissions
Regarding the long-term relationships with the CO2 variable (1), the coefficients of FDI and GDP are positive, suggesting that an increase in these factors is associated with an increase in CO2 in the long run. This relationship has been extensively explained in the literature in the case of the pollution haven hypothesis (Apergis et al., 2022; Y. Huang et al., 2019; Pao & Tsai, 2011; Yilanci et al., 2023), so that we intuit that the total FDI in Spain is likely to incur pollution. On the other hand, the coefficient of GDPSQ is negative, suggesting that an increase in the square of the GDP variable is associated with a decrease in CO2 in the long run. This relationship reaffirms the EKC hypothesis for the case of Spain and the emission of polluting gases, whereby it follows an inverse U-shaped relationship. In other words, the higher the income, the lower the CO2 emissions into the environment (Awosusi et al., 2022; Y. Huang et al., 2019). The NUC and REC variables do not show significant results, but they do have the expected sign, which implies that an increase in nuclear or renewable energy consumption would imply a decrease in CO2 emissions. However, the lack of statistical significance in the long term may imply that the consumption of renewable and nuclear energies may not yet be sufficiently representative to imply a decrease in emissions in the long term in Spain until 2018.
As for the short-term relationships, it is observed that the coefficient of FDI is not statistically significant, suggesting that this variable does not have a significant relationship with CO2 in the short term. However, the relationship in the short term of GDP with air quality seems to be given by its lags, both GDP t-1 and GDPSQ t-1, being the first of positive sign and the second negative, both significant at 1%. This conclusion reaffirms again the EKC hypothesis, where the relationship of GDP with CO2 emission follows an inverted U-Shape in its one-year lags. On the other hand, the variable denoting nuclear energy production only shows significant results in its two-year lag. This result suggests that the effect of nuclear energy production on CO2 emissions is not immediate and may take some time to materialize. This could be due to various factors, such as the time it takes for new nuclear power plants to become operational or for changes in nuclear energy production to have a significant impact on the overall energy mix of a country (Murshed et al., 2022; Nathaniel et al., 2021; Saidi & Ben Mbarek, 2016). In the same way, the consumption of renewable energies has a significant short-term relationship with CO2 emissions, where a higher consumption of this energy contributes to the detriment of the presence of this gas in the environment. In addition, it is observed that the error correction term (ECT) is negative and statistically significant, suggesting that there is a significant long-term adjustment relationship between the variables.
4.2. Ecological Footprint
For the relationship with the Ecological footprint (2), it is observed that all independent variables are statistically significant at the 1% level in the long run. The coefficient of FDI is positive and significant, suggesting that an increase in foreign direct investment is associated with an improvement in air quality in the long run. The coefficient of GDP is also positive and significant, suggesting that an increase in gross domestic product is associated with greater degradation of environmental quality in the long run. This relationship again verifies the EKC hypothesis as the variable GDPSQ is significant and negative at 1% , and the coefficient of GDPSQ is negative and significant, suggesting that an increase in GDP growth rate is associated with less degradation of the ecological footprint. The coefficients of NUC and REC are also negative and significant, suggesting that an increase in nuclear power and renewable energy consumption is associated with an improvement of the ecological footprint, being that a better environmental quality.
In the "Short run" section, it is observed that the coefficient of the error correction variable (ECT) is negative and significant, suggesting again that there is a significant long-term adjustment relationship between the variables. In relation to the short-term variables, the FDI variable has the expected value, indicating that there is a short-term relationship in which FDI detriments the quality of the local environment; however, this effect tends to be offset by its lagged values over time. This relationship, again, can be placed within the pollution haven hypothesis, whereby FDI tends to be located in countries with relatively low pollution tax burdens, implying an improvement in the relative location advantages of their production to other countries, improving the returns of their investments (Batschauer da Cruz et al., 2022; Luo et al., 2022). However, the significance and sign of its lagged values could exemplify that companies tend to modify their production in the short run to be less environment detrimental. The GDP variable and its exponential term do not show significant results except for the third lag of GDPSQ. On the other hand, the consumption of renewable energy does present the expected results as it is significant at 1% and has a negative sign. This implies that renewable energy consumption does reduce environmental degradation and contributes to improving the country's sustainability.
4.3. Environmental Load Capacity Factor
For the variable Load Capacity Factor (LCF) in column (3), in the long run all the values are significant at 1% and all have the expected sign. When dealing with the LCF, the expected relationships are the inverse of the previous dependent variables, since LCF denotes the sustainability of the environment, that is, with high values, better environmental quality. In this way, the FDI variable contributes to the deterioration of the LCF, in the same way as the GDP, while the square term of the GDP produces positive results. This relationship allows us, for the FDI, to verify the veracity once again of the pollution haven hypothesis in the case of Spain, and in the same way, the LCC hypothesis, by which high increases in income improve the quality of the environment, following a U -shape trend (Pata & Kartal, 2023). Finally, both the production of nuclear energy and the consumption of renewable energies imply an increase in the LCF, a fact that we have already seen in regressions (1) and (2).
In relation to short-term coefficients, all the variables are significant and verify the previously determined relationships. The one period lag FDI variable produces a negative and significant coefficient. The GDP and the GDPSQ produce significant results, the first being a negative sign, and the second a positive sign, indicating that these relationships follow a u-shape trend, as indicated in the long run section, corroborating the short term LCC hypothesis in the case of Spain. Finally, the consumption of renewable energy means an increase in the values of the LCF, which has a positive impact on environmental quality. Finally, the error correction term of the model has a negative and significant result, which again implies a long-term equilibrium relationship between the dependent and independent variables of the model, concluding that the independent ones have a significant effect in both time horizons.
5. Conclusions
During the previous sections we have shown the relevance of the FDI with respect to pollution in Spain using an ADLR model during the period 1961-2018. Using the theoretical context of the pollution haven/halo hypothesis, we conclude that FDI in Spain does not contribute to the transfer of green technologies that make a cleaner production as justified by the halo theory, while we have stated the opposite. The low environmental fiscal pressure in Spain means that the territory remains attractive for companies wishing to relocate their production for the benefit of any of the competences associated with the OLI model mentioned above, with Spanish environmental control not being a disincentive for polluting production processes or motivating the adaptation of FDI production processes to be more environmentally sustainable. In this way, Spain is more closely linked to the characteristics of the pollution haven, despite being included within the European environmental regulatory framework.
In the same way, we conclude the adequacy of the ECK hypothesis, and as a novel point, we verify the adequacy of the LCC hypothesis to the Spanish environmental context. Based on this theoretical framework, we can affirm that income per capita has a positive effect in favor of the environmental sustainability of the country based on the LCC hypothesis, and in favor of environmental quality based on the EKC. Both hypotheses yield the expected results based on previous literature.
Finally, the production and consumption of nuclear energy has the expected effect for all the variables studied, whether it is the presence of CO2 emissions in the air, the consumption of natural resources or the load capacity factor, as well as the consumption and production of renewable energy. We affirm that the effect of renewable energy is similar to that of the rest of renewable energies in Spain, these being all the energy produced by solar, hydraulic, geological or wind means.
Based on our estimates, there are both short and long-term relationships between the variables, which indicates that the environmental quality in Spain can benefit exponentially over time from past and present investments in the development of a network of renewable energy production and consumption that is efficiently implemented across all social areas of the country. While Spain has made significant progress in the adoption of renewable energy sources, there is still room for improvement in the implementation and development of these sources. To achieve a social transformation towards a more sustainable energy system, Spain must renew its national productive fabric and promote green foreign direct investment. As such, it is important to offer tax incentives to companies that consider Spain as a destination for investment, especially those seeking to expand their production into new markets. These incentives should be discriminatory in favor of companies that contribute to the inflow of efficient and green technologies while hindering the inflow of foreign direct investment that is not aligned with the country's environmental and social sustainability goals.
However, to achieve a sustainable and green transition, Spain must also address the challenges associated with the implementation of renewable energy sources. One of the main challenges is the need to develop a comprehensive and integrated regulatory framework that encourages the deployment of renewable energy projects while ensuring their environmental and social sustainability. Such a framework must provide incentives and support to promote the adoption of renewable energy technologies by households, businesses, and public institutions, especially in sectors that are still heavily reliant on fossil fuels. Additionally, investment in research and development can improve the efficiency and performance of renewable energy technologies, as well as the development of energy storage systems to balance the intermittency of renewable energy sources. By addressing these challenges, Spain can position itself as a leader in the transition towards a more sustainable and green energy system, creating new opportunities for growth and job creation while contributing to global efforts to combat climate change. Ultimately, achieving a sustainable and green transition will require a concerted effort from all stakeholders, including the government, businesses, and civil society, to accelerate the deployment of renewable energy sources and promote sustainable practices across all sectors of the economy.
Appendix

Table 2.
Descriptive statistics.
| Min | Mean | Max | Standard Deviation | Jarque-Bera |
|
|---|---|---|---|---|---|
| CO2 | 5.36 | 2.20 | 3.70 | 8.60 | 1.98 (0.37) |
| EF | 2.30 | 4.12 | 5.86 | 0.90 | 1.03 (0.59) |
| LCF | 0.21 | 0.33 | 0.52 | 0.065 | 9.52 (0.00) |
| FDI | 3.36 | 1.87 | 7.51 | 2.50 | 11.36 (0.00) |
| Ln GDP | 2.33 | 2.63 | 2.81 | 1.43 | 5.21 (0.07) |
| NUC | 0.00 | 34.74 | 63.71 | 26.17 | 8.47 (0.01) |
| REC | 16.52 | 43.17 | 110.94 | 26.69 | 18.97 (0.00) |
| Note: | |||||
| 1. In brackets is the p-value for the Jarque-Bera test, representing the null hypothesis of normality of the series. | |||||
Figure 3.
Synopsis statistics of boxplots and histogram of the logged variables.
References
- Adebayo, T.S.; Oladipupo, S.D.; Adeshola, I.; Rjoub, H. (2022). Wavelet analysis of impact of renewable energy consumption and technological innovation on CO2 emissions: Evidence from Portugal. Environmental Science and Pollution Research, 2388. [Google Scholar] [CrossRef]
- Ahmed, Z.; Zafar, M.W.; Ali, S. ; Danish. (2020). Linking urbanization, human capital, and the ecological footprint in G7 countries: An empirical analysis. Sustainable Cities and Society, 0206. [Google Scholar] [CrossRef]
- Amri, F. (2018). Carbon dioxide emissions, total factor productivity, ICT, trade, financial development, and energy consumption: Testing environmental Kuznets curve hypothesis for Tunisia. Environmental Science and Pollution Research, 3369. [Google Scholar] [CrossRef]
- Apergis, N.; Pinar, M.; Unlu, E. (2022). How do foreign direct investment flows affect carbon emissions in BRICS countries? Revisiting the pollution haven hypothesis using bilateral FDI flows from OECD to BRICS countries. Environmental Science and Pollution Research, 1468. [Google Scholar] [CrossRef]
- Awosusi, A.A.; Kutlay, K.; Altuntaş, M.; Khodjiev, B.; Agyekum, E.B.; Shouran, M.; Elgbaily, M.; Kamel, S. (2022). A Roadmap toward Achieving Sustainable Environment: Evaluating the Impact of Technological Innovation and Globalization on Load Capacity Factor. International Journal of Environmental Research and Public Health, 3288. [Google Scholar] [CrossRef]
- Batschauer da Cruz, C.B.; Eliete Floriani, D.; Amal, M. (2022). The OLI Paradigm as a comprehensive model of FDI determinants: A sub-national approach. International Journal of Emerging Markets. [CrossRef]
- Bozoklu, S.; Demir, A.O.; Ataer, S. (2020). Reassessing the environmental Kuznets curve: A summability approach for emerging market economies. Eurasian Economic Review. [CrossRef]
- 8. Danish, Ozcan, B.; Ulucak, R. (2021). An empirical investigation of nuclear energy consumption and carbon dioxide (CO2) emission in India: Bridging IPAT and EKC hypotheses. Nuclear Engineering and Technology. [CrossRef]
- 9. Danish, Ulucak, R.; Erdogan, S. (2022). The effect of nuclear energy on the environment in the context of globalization: Consumption vs production-based CO2 emissions. Nuclear Engineering and Technology. [CrossRef]
- De Beule, F.; Schoubben, F.; Struyfs, K. (2022). The pollution haven effect and investment leakage: The case of the EU-ETS. Economics Letters, 1105. [Google Scholar] [CrossRef]
- Destek, M.A.; Sarkodie, S.A. (2019). Investigation of environmental Kuznets curve for ecological footprint: The role of energy and financial development. Science of The Total Environment, 2483. [Google Scholar] [CrossRef]
- Dong, K.; Sun, R.; Jiang, H.; Zeng, X. (2018). CO2 emissions, economic growth, and the environmental Kuznets curve in China: What roles can nuclear energy and renewable energy play? Journal of Cleaner Production. [CrossRef]
- Driffield, N.; Jones, C.; Kim, J.-Y.; Temouri, Y. (2021). FDI motives and the use of tax havens: Evidence from South Korea. Journal of Business Research. [CrossRef]
- Dunning, J.H. (1979). Explaining Changing patterns of international production: In defence of eclectic theory. Oxford Bulletin of Economics and Statistics. [CrossRef]
- Dunning, J.H. (1981). Explaining the international direct investment position of countries: Towards a dynamic or developmental approach. Weltwirtschaftliches Archiv. [CrossRef]
- Elliott, G.; Rothenberg, T.J.; Stock, J.H. (1996). Efficient Tests for an Autoregressive Unit Root. Econometrica. [CrossRef]
- Esmaeili, P.; Balsalobre Lorente, D.; Anwar, A. (2023). Revisiting the environmental Kuznetz curve and pollution haven hypothesis in N-11 economies: Fresh evidence from panel quantile regression. Environmental Research, 1158. [Google Scholar] [CrossRef]
- 18. European Commission. (2020). Integrated National Energy And Climate Plan. 2021-2030, 2020.
- 19. European Commission. (2023a). A green deal Industrial Plan for the Net-Zero Age.
- 20. European Commission. (2023b, March 21). Commission welcomes new IPCC climate change report highlighting the urgency of more ambitious climate action, 21 March.
- Fareed, Z.; Salem, S.; Adebayo, T.S.; Pata, U.K.; Shahzad, F. (2021). Role of Export Diversification and Renewable Energy on the Load Capacity Factor in Indonesia: A Fourier Quantile Causality Approach. Frontiers in Environmental Science, 0152. [Google Scholar] [CrossRef]
- Friedlingstein, P.; O’Sullivan, M.; Jones, M.W.; Andrew, R.M.; Gregor, L.; Hauck, J.; Le Quéré, C.; Luijkx, I.T.; Olsen, A.; Peters, G.P.; Peters, W.; Pongratz, J.; Schwingshackl, C.; Sitch, S.; Canadell, J.G.; Ciais, P.; Jackson, R.B.; Alin, S.R.; Alkama, R. , … Zheng, B. (2022). Global Carbon Budget 2022. ( 14(11), 4811–4900. [CrossRef]
- Fu, X. (2012). Foreign Direct Investment and Managerial Knowledge Spillovers through the Diffusion of Management Practices. Journal of Management Studies. [CrossRef]
- Grossman, G.; Krueger, A. (1991). Environmental Impacts of a North American Free Trade Agreement, 3914. [Google Scholar] [CrossRef]
- He, P.; Ning, J.; Yu, Z.; Xiong, H.; Shen, H.; Jin, H. (2019). Can Environmental Tax Policy Really Help to Reduce Pollutant Emissions? An Empirical Study of a Panel ARDL Model Based on OECD Countries and China. Sustainability, 4384. [Google Scholar] [CrossRef]
- Huang, H.; Ali, S.; Solangi, Y.A. (2023). Analysis of the Impact of Economic Policy Uncertainty on Environmental Sustainability in Developed and Developing Economies. Sustainability, 5860. [Google Scholar] [CrossRef]
- Huang, Y.; Chen, X.; Zhu, H.; Huang, C.; Tian, Z. (2019). The Heterogeneous Effects of FDI and Foreign Trade on CO2 Emissions: Evidence from China. Mathematical Problems in Engineering. [CrossRef]
- IEA, I.E.A. (2021). Spain 2021, Energy Policy Review.
- Jiang, W.; Cole, M.; Sun, J.; Wang, S. (2022). Innovation, carbon emissions and the pollution haven hypothesis: Climate capitalism and global re-interpretations. Journal of Environmental Management, 1144. [Google Scholar] [CrossRef]
- Jones, C.; Temouri, Y.; Kirollos, K.; Du, J. (2023). Tax havens and emerging market multinationals: The role of property rights protection and economic freedom. Journal of Business Research, 1133. [Google Scholar] [CrossRef]
- Kartal, M.T. (2023). Production-based disaggregated analysis of energy consumption and CO2 emission nexus: Evidence from the USA by novel dynamic ARDL simulation approach. Environmental Science and Pollution Research, 6864. [Google Scholar] [CrossRef]
- Kokko, A. (1994). Technology, market characteristics, and spillovers. Journal of Development Economics. [CrossRef]
- Lin, B.; Li, X. (2011). The effect of carbon tax on per capita CO2 emissions. Energy Policy, 5137. [Google Scholar] [CrossRef]
- Luo, C.; Luo, Q.; Zeng, S. (2022). Bilateral tax agreement and FDI inflows: Evidence from Hong Kong investment in the Mainland China. China Economic Review, 0178. [Google Scholar] [CrossRef]
- Majeed, M. (2020). Reexamination of Environmental Kuznets Curve for Ecological Footprint: The Role of Biocapacity, Human Capital, and Trade. SSRN Electronic Journal. [CrossRef]
- Menegaki, A.N. (2019). The ARDL Method in the Energy-Growth Nexus Field; Best Implementation Strategies. Economies. [CrossRef]
- Menyah, K.; Wolde-Rufael, Y. (2010). CO2 emissions, nuclear energy, renewable energy and economic growth in the US. Energy Policy, 2911. [Google Scholar] [CrossRef]
- Morgado, E.; Victoriai, G.A. (2021). Climate Action in Spain, 2021. [Google Scholar]
- Murshed, M.; Saboori, B.; Madaleno, M.; Wang, H.; Doğan, B. (2022). Exploring the nexuses between nuclear energy, renewable energy, and carbon dioxide emissions: The role of economic complexity in the G7 countries. Renewable Energy. [CrossRef]
- Nathaniel, S.P.; Alam, Md. S.; Murshed, M.; Mahmood, H.; Ahmad, P. (2021). The roles of nuclear energy, renewable energy, and economic growth in the abatement of carbon dioxide emissions in the G7 countries. Environmental Science and Pollution Research, 4795. [Google Scholar] [CrossRef]
- 41. OECD. (2002). New Horizons for Foreign Direct Investment. [CrossRef]
- Orlic, E.; Hashi, I.; Hisarciklilar, M. (2018). Cross sectoral FDI spillovers and their impact on manufacturing productivity. International Business Review. [CrossRef]
- Pao, H.-T.; Tsai, C.-M. (2011). Multivariate Granger causality between CO2 emissions, energy consumption, FDI (foreign direct investment) and GDP (gross domestic product): Evidence from a panel of BRIC (Brazil, Russian Federation, India, and China) countries. Energy. [CrossRef]
- Pata, U.K. (2021). Do renewable energy and health expenditures improve load capacity factor in the USA and Japan? A new approach to environmental issues. The European Journal of Health Economics, 1427. [Google Scholar] [CrossRef]
- Pata, U.K.; Balsalobre-Lorente, D. (2022). Exploring the impact of tourism and energy consumption on the load capacity factor in Turkey: A novel dynamic ARDL approach. Environmental Science and Pollution Research, 1349. [Google Scholar] [CrossRef]
- Pata, U.K.; Caglar, A.E. (2021). Investigating the EKC hypothesis with renewable energy consumption, human capital, globalization and trade openness for China: Evidence from augmented ARDL approach with a structural break. Energy, 1192. [Google Scholar] [CrossRef]
- Pata, U.K.; Isik, C. (2021). Determinants of the load capacity factor in China: A novel dynamic ARDL approach for ecological footprint accounting. Resources Policy, 0231. [Google Scholar] [CrossRef]
- Pata, U.K.; Kartal, M.T. (2023). Impact of nuclear and renewable energy sources on environment quality: Testing the EKC and LCC hypotheses for South Korea. Nuclear Engineering and Technology. [CrossRef]
- Pata, U.K.; Samour, A. (2022). Do renewable and nuclear energy enhance environmental quality in France? A new EKC approach with the load capacity factor. Progress in Nuclear Energy, 1042. [Google Scholar] [CrossRef]
- Pesaran, M.H.; Shin, Y.; Smith, R.J. (2001). Bounds testing approaches to the analysis of level relationships. Journal of Applied Econometrics. [CrossRef]
- Phillips, P.C.B.; Perron, P. (1988). Testing for a unit root in time series regression. Biometrika. [CrossRef]
- Qashou, Y.; Samour, A.; Abumunshar, M. (2022). Does the Real Estate Market and Renewable Energy Induce Carbon Dioxide Emissions? Novel Evidence from Turkey. Energies. [CrossRef]
- Saidi, K.; Ben Mbarek, M. (2016). Nuclear energy, renewable energy, CO 2 emissions, and economic growth for nine developed countries: Evidence from panel Granger causality tests. Progress in Nuclear Energy. [CrossRef]
- Samour, A.; Moyo, D.; Tursoy, T. (2022). Renewable energy, banking sector development, and carbon dioxide emissions nexus: A path toward sustainable development in South Africa. Renewable Energy, 1032. [Google Scholar] [CrossRef]
- Shan, S.; Genç, S.Y.; Kamran, H.W.; Dinca, G. (2021). Role of green technology innovation and renewable energy in carbon neutrality: A sustainable investigation from Turkey. Journal of Environmental Management, 1130. [Google Scholar] [CrossRef]
- Shang, Y.; Razzaq, A.; Chupradit, S.; Binh An, N.; Abdul-Samad, Z. (2022). The role of renewable energy consumption and health expenditures in improving load capacity factor in ASEAN countries: Exploring new paradigm using advance panel models. Renewable Energy. [CrossRef]
- Sharif, A.; Bhattacharya, M.; Afshan, S.; Shahbaz, M. (2021). Disaggregated renewable energy sources in mitigating CO2 emissions: New evidence from the USA using quantile regressions. Environmental Science and Pollution Research, 5758. [Google Scholar] [CrossRef]
- Singhania, M.; Saini, N. (2021). Demystifying pollution haven hypothesis: Role of FDI. Journal of Business Research. [CrossRef]
- Ullah, S.; Luo, R.; Adebayo, T.S.; Kartal, M.T. (2023). Dynamics between environmental taxes and ecological sustainability: Evidence from top-seven green economies by novel quantile approaches. Sustainable Development. [CrossRef]
- Wang, H.; Dong, C.; Liu, Y. (2019). Beijing direct investment to its neighbors: A pollution haven or pollution halo effect? Journal of Cleaner Production, 1180. [Google Scholar] [CrossRef]
- Yang, X.; Tang, W. (2023). Additional social welfare of environmental regulation: The effect of environmental taxes on income inequality. Journal of Environmental Management, 1170. [Google Scholar] [CrossRef]
- Yilanci, V.; Cutcu, I.; Cayir, B.; Saglam, M.S. (2023). Pollution haven or pollution halo in the fishing footprint: Evidence from Indonesia. Marine Pollution Bulletin, 1146. [Google Scholar] [CrossRef]
Figure 1.
LCC hypothesis representation (Pata and Kartal, 2023).

Figure 2.
Time series plots of the studied variables.
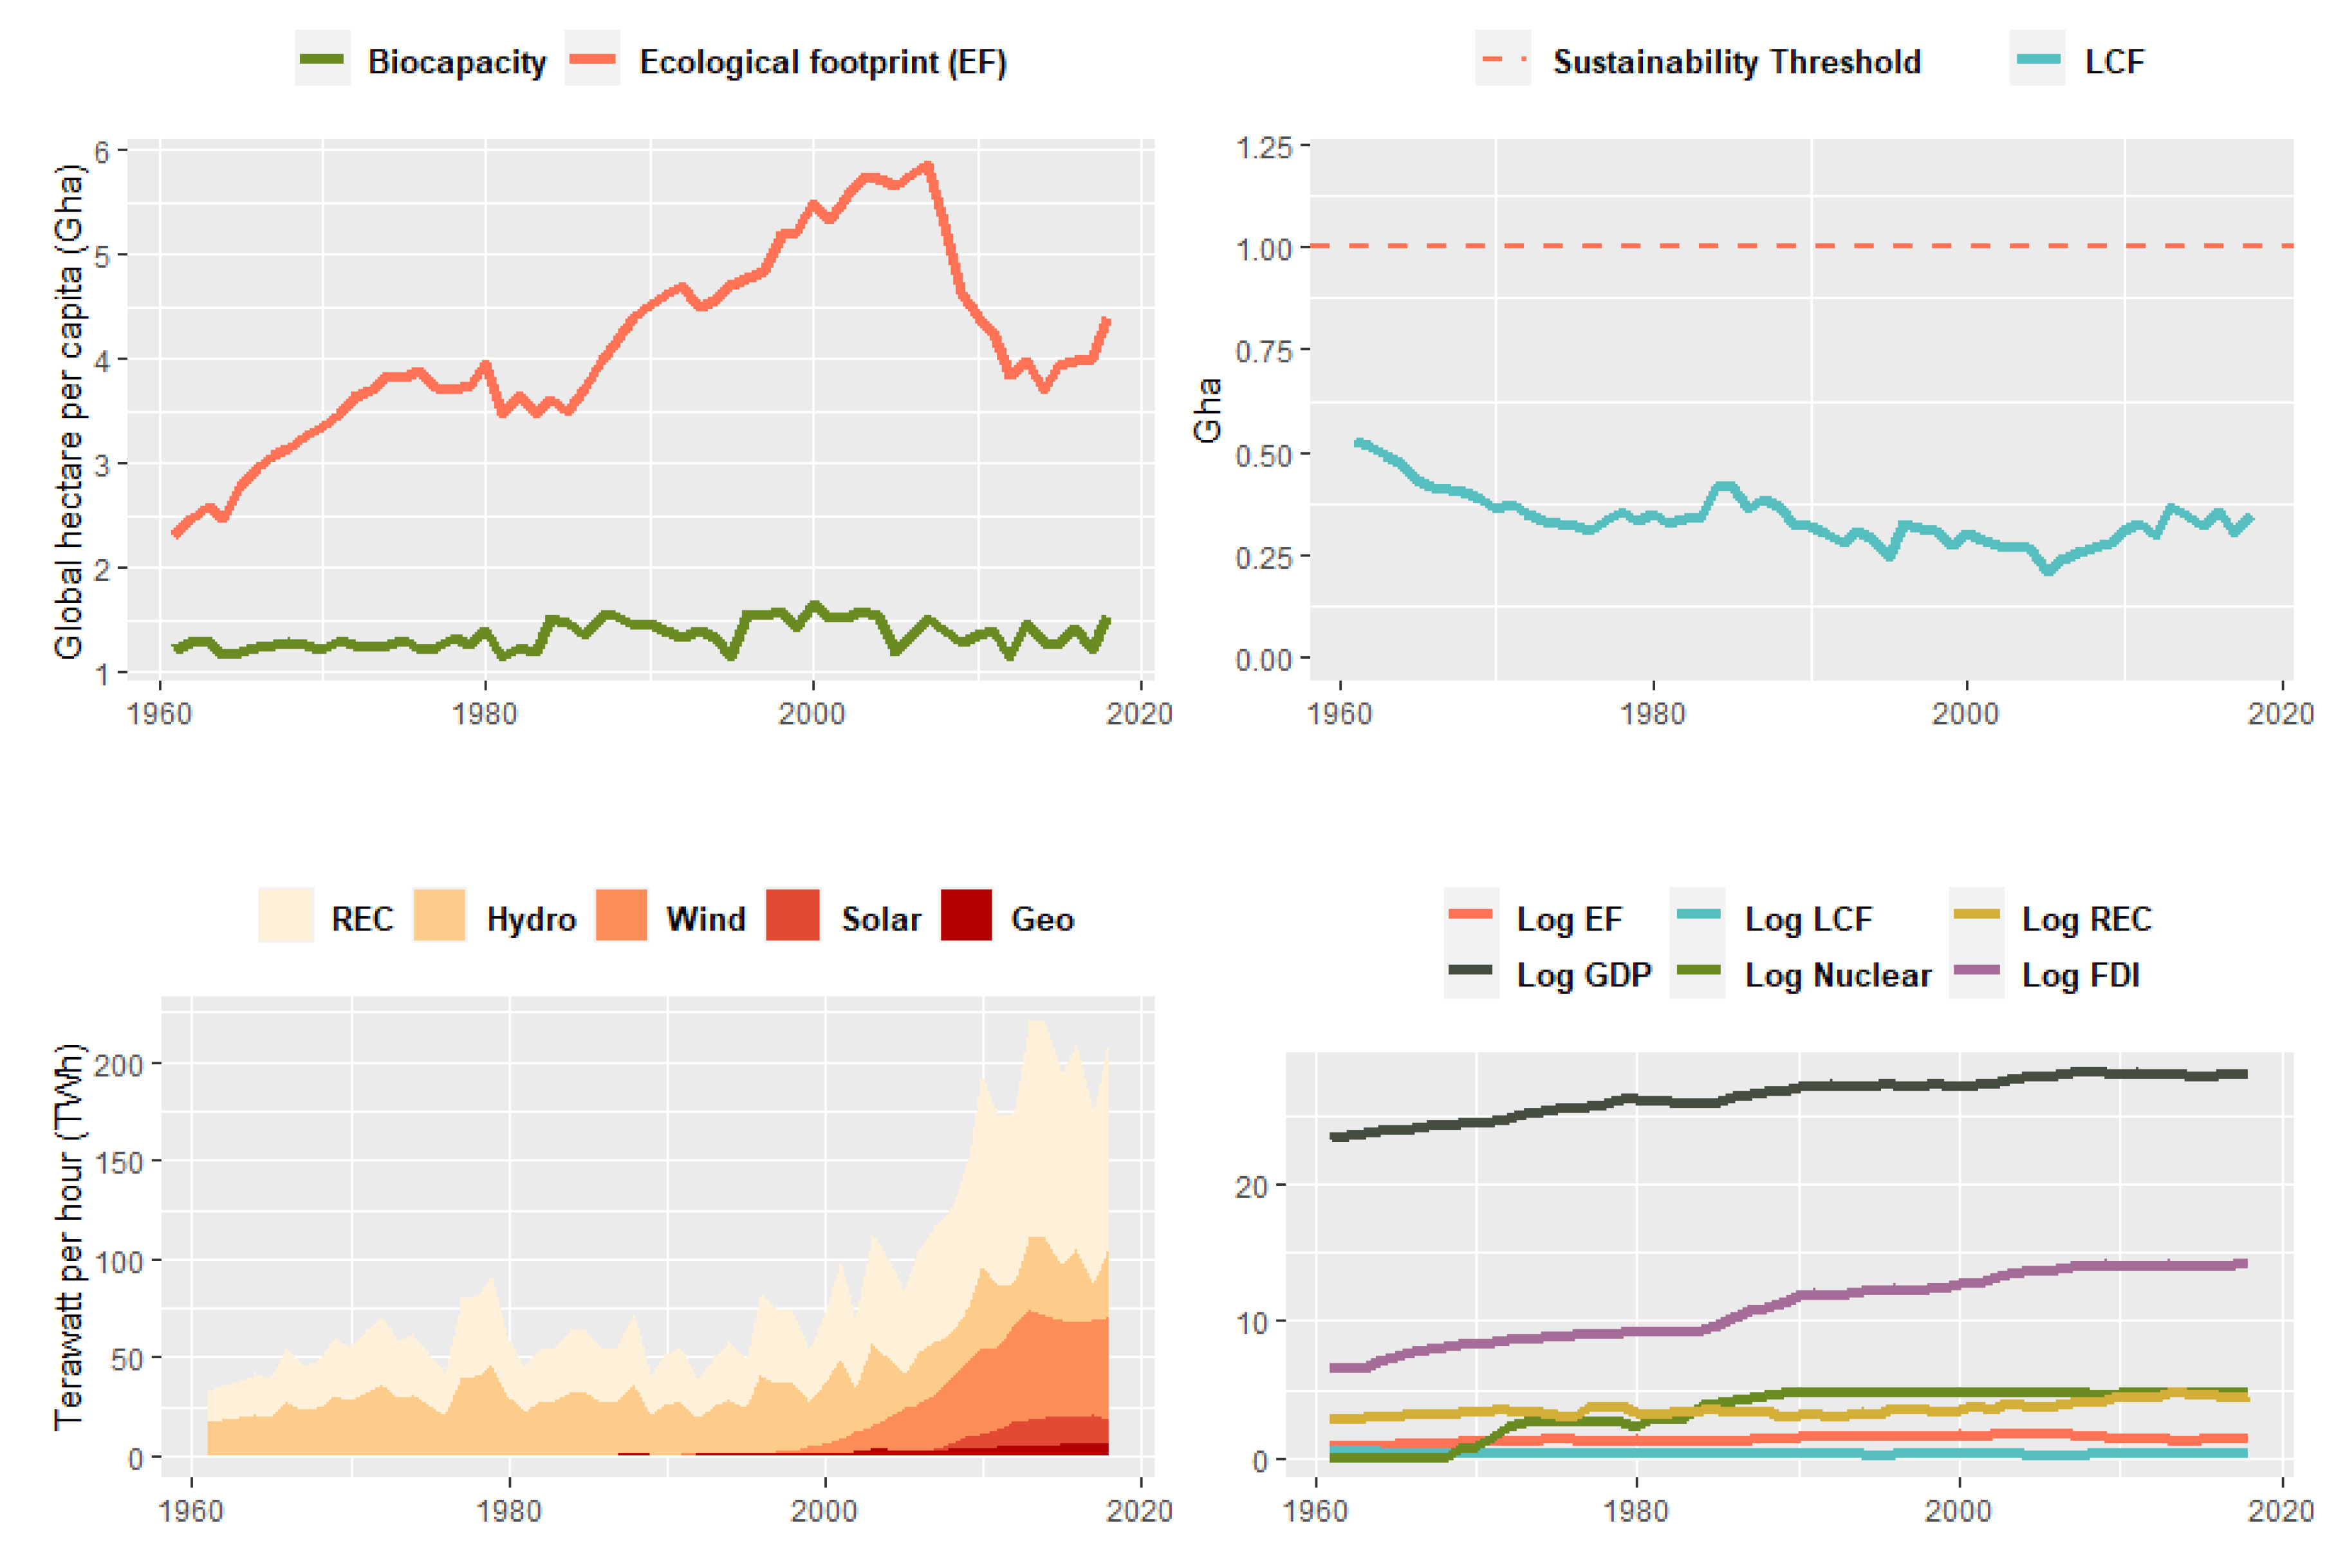
Table 1.
Variables description and sources.
| Sign | Variables | Metric | Source |
|---|---|---|---|
| CO2 | Carbon dioxide emissions | Annual CO₂ emissions (per capita) | Friedlingstein et al., 2022 |
| EF | Ecological footprint | Global hectare per capita (gha per capita) | Footprint Network (https://data.footprintnetwork.org) |
| LCF | Load Capacity factor | Biocapacity / Ecological footprint (gha per capita) | Footprint Network (https://data.footprintnetwork.org) |
| FDI | Foreign Direct Investment | Stock of FDI in current US$ | UNCTAD database (https://unctadstat.unctad.org/) |
| GDP | Economic growth | Gross Domestic Product in current US$ | World Bank database (https://data.worldbank.org/) |
| NUC | Nuclear Energy | Terawatt per hour (TWh) | BP Statistical Review of World Energy (https://www.bp.com/en/global/corporate/energy-economics/) |
| REC | Renewable energy consumption | Terawatt per hour (TWh) | BP Statistical Review of World Energy (https://www.bp.com/en/global/corporate/energy-economics/) |
Table 3.
Unit root test.
| Levels | ||||||
| ADF | DF-GLS | PP | ||||
| Intr. | Intr. +Trend | Intr. | Intr. + Trend | Intr. | Intr. + Trend | |
| t-stat | t-stat | t-stat | t-stat | t-stat | t-stat | |
| CO2 | -4.64* | -1.53 | -0.46 | -1.34 | -3.80* | -1.57 |
| EF | -2.05 | -1.99 | -0.50 | -1.75 | -2.53 | -1.78 |
| LCF | -2.89*** | -2.78 | -0.93 | -2.35 | -2.81*** | -2.65 |
| FDI | -1.79 | -1.85 | 0.35 | -1.95 | -1.53 | -1.37 |
| GDP | -2.08 | -1.74 | 0.36 | -1.46 | -2.74*** | -1.28 |
| NUC | -2.12 | -0.35 | -0.81 | -2.05 | -1.84 | -0.79 |
| REC | 0.02 | -1.98 | 0.48 | -2.03 | 0.03 | -1.62 |
| DIFF | ||||||
| -5.28* | -6.50* | -2.16** | -6.48* | -5.59* | -6.70* | |
| 𝚫 EF | -3.37** | -3.40*** | -2.45** | -3.35** | -7.01* | -7.33* |
| 𝚫 LCF | -9.96* | -10.21* | -10.05* | -10.15* | -10.03* | -10.47* |
| 𝚫 FDI | -4.41* | -4.68* | -3.88* | -4.32* | -4.39* | -4.67* |
| 𝚫 GDP | -4.36* | -4.73* | -4.12* | -4.81* | -4.32* | -4.54* |
| 𝚫 NUC | -2.25 | -6.42* | -2.13** | -6.20* | -6.28* | -6.56* |
| 𝚫 REC | -10.18* | -10.24* | -10.15* | -10.18* | -10.30* | -10.40* |
| Notes: | ||||||
|
||||||
Table 4.
F-bounds test.
| K = 4 | CO2 | EF | LCF |
| ARDL (1,1,2,2,3,1) | ARDL (1,4,1,3,0,2) | ARDL (3,2,1,4,0,2) | |
| F-statistic | 6.51* | 5.86* | 5.27* |
| Narayan (2005) Asymptotic critical values | |||
| CV | 1 | 5 | 10 |
| I(0) | 3.06 | 2.39 | 2.08 |
| I(1) | 4.15 | 3.38 | 3.00 |
| Diagnostic check | |||
| Jarque-Bera | 2.93 (0.23) | 0.94 (0.62) | 0.46 (0.79) |
| White | 1.44 (0.17) | 3.55 (0.00) | 1.70 (0.08) |
| ARCH | 0.81 (0.36) | 0.96 (0.33) | 1.21 (0.27) |
| BG-LM | 0.19 (0.66) | 0.06 (0.93) | 0.41 (0.66) |
| Notes: | |||
| 1. *, ** and *** denote 1, 5 and 10% significance level respectively.Values in parenthesis () represent probability values | |||
Table 5.
Coefficients based on ARDL models.
| CO2 | EF | LCF | |||||||
| (1) | (2) | (3) | |||||||
| Long run | |||||||||
| (Levels) | Coef. | St. Er. | Prob. | Coef. | St. Er. | Prob. | Coef. | St. Er. | Prob. |
| FDI | 0.080*** | 0.042 | 0.05 | 0.266* | 0.042 | 0.00 | -0.043* | 0.011 | 0.00 |
| GDP | 5.262* | 0.807 | 0.00 | 3.078* | 1.167 | 0.01 | -1.161* | 0.208 | 0.00 |
| GDPSQ | -0.096* | 0.016 | 0.00 | -0.062* | 0.022 | 0.00 | 0.022* | 0.004 | 0.00 |
| NUC | -0.057 | 0.041 | 0.17 | -0.087** | 0.046 | 0.04 | 0.044* | 0.011 | 0.00 |
| REC | -0.051 | 0.052 | 0.32 | -0.005* | 0.000 | 0.00 | 0.056* | 0.013 | 0.00 |
| Constant | -53.144* | 10.445 | 0.00 | -38.28* | 15.210 | 0.01 | 15.82* | 2.687 | 0.00 |
| Short run (Error Correction Model) | |||||||||
| (Differences) | Coef. | St. Er. | Prob. | Coef. | St. Er. | Prob. | Coef. | St. Er. | Prob. |
| FDI | -0.012 | 0.029 | 0.66 | 0.134* | 0.039 | 0.00 | 0.094 | 0.058 | 0.11 |
| - | - | - | -0.141* | 0.044 | 0.00 | -0.361* | 0.057 | 0.00 | |
| - | - | - | -0.029 | 0.040 | 0.48 | - | - | - | |
| - | - | - | -0.108* | 0.034 | 0.00 | - | - | - | |
| GDP | -1.820 | 1.121 | 0.11 | -0.876 | 0.767 | 0.26 | -9.081* | 1.471 | 0.00 |
| 3.228* | 1.043 | 0.00 | - | - | - | - | - | - | |
| GDPSQ | 0.032 | 0.020 | 0.12 | 0.019 | 0.014 | 0.19 | 0.168* | 0.028 | 0.00 |
| -0.058* | 0.019 | 0.00 | 0.001 | 0.001 | 0.21 | 0.002*** | 0.001 | 0.05 | |
| - | - | - | 0.003* | 0.001 | 0.00 | 0.001 | 0.001 | 0.28 | |
| - | - | - | - | - | - | -0.005* | 0.001 | 0.00 | |
| NUC | -0.037 | 0.026 | 0.15 | - | - | - | - | - | - |
| 0.035 | 0.026 | 0.18 | - | - | - | - | - | - | |
| -0.063* | 0.026 | 0.02 | - | - | - | - | - | - | |
| REC | -0.002* | 0.0004 | 0.00 | -0.001* | 0.0004 | 0.00 | 0.006* | 0.0007 | 0.00 |
| - | - | - | 0.0008 | 0.0005 | 0.15 | 0.004* | 0.0008 | 0.00 | |
| -0.051* | 0.007 | 0.00 | -0.532* | 0.077 | 0.00 | -0.152* | 0.023 | 0.00 | |
| Notes | |||||||||
| 1. *, ** and *** denote 1, 5 and 10% significance level respectively. | |||||||||
Disclaimer/Publisher’s Note: The statements, opinions and data contained in all publications are solely those of the individual author(s) and contributor(s) and not of MDPI and/or the editor(s). MDPI and/or the editor(s) disclaim responsibility for any injury to people or property resulting from any ideas, methods, instructions or products referred to in the content. |
© 2023 by the authors. Licensee MDPI, Basel, Switzerland. This article is an open access article distributed under the terms and conditions of the Creative Commons Attribution (CC BY) license (http://creativecommons.org/licenses/by/4.0/).
Copyright: This open access article is published under a Creative Commons CC BY 4.0 license, which permit the free download, distribution, and reuse, provided that the author and preprint are cited in any reuse.


