
Submitted:
07 June 2023
Posted:
08 June 2023
You are already at the latest version
Abstract
Redundancy in ship systems is provided to ensure operational resilience through equipment backups which ensures system availability and offline repairs of machinery. The electric power generation system of ships provides the most utility of all systems, hence is provided with good level of standby units to ensure reliable operations. Nonetheless, the occurrence of undesired black outs are common onboard ships and portends a serious danger to ship security and safety. Therefore, understanding the contributing factors affecting system reliability through component criticality analysis is essential to ensure a more robust maintenance and support platform for efficient ship operations. In this regard hybrid reliability and fault detection analysis were conducted to establish component criticality and related fault conditions. A case study was conducted on a ship power generation system consisting of 4 marine diesel power generation plants onboard an Offshore Patrol Vessel (OPV). Results from the reliability analysis indicate overall low system reliability of less than 70 per cent within the first 24 months of the 78 operational months. Component criticality using reliability importance measures was used to identify all components with more than 40 per cent contribution to sub systems failure. Additionally, machine learning was used to aid the reliability analysis through feature engineering and fault identification using Artificial Neural Networks classification. The ANN has identified failure patten threshold at about 200kva which can be attributed to overheating, hence establishing link between component failure and generator performance.
Keywords:
Marine Diesel Generator
; reliability importance measures
; fault identification
; critical compo-nents
; performance
1. Introduction
Marine facilities such as offshore platforms and ships rely on marine diesel engines for power and propulsion, which most often rely on fossil fuels. Currently fossils fuels make about 80 % of global energy mix and are believed to contribute greatly to climate change due to green gas house (GHG) emissions especially in major economic sectors [1,2]. Given that the use of fossil fuel for heating in major industrial sectors such as power generation, steel, cement and transportation account for about 73 % of global GHG emissions [3]. The United Nations (UN) as well as most developed nations have set ambitious goals for a net zero target by 2050 [4]. According to the UN, net zero means cutting greenhouse gas emissions to as close to zero as possible, with any remaining emissions re-absorbed from the atmosphere, by oceans and forests [4]. In this regard all major sectors are making efforts to reduce their overall GHG emission to net zero by 2050 in line with UN climate action. Overall, the transport sector contributes about 24-30 % of global CO2 emission out of which the shipping industry makes about 3% and 11% of global sectorial respectively. Figure 1 provides a summary of emissions by transport sector. Accordingly, the International Maritime Organisation (IMO) in line with the UN net-zero targets has put in place measures to reduce shipping emission by 50% by 2030 compared to the 2008 baseline emissions level and net-zero carbon emissions by 2050 [5,6].
Therefore, considering that the majority of motor driven ships are propelled and powered by diesel engines, the IMO has put in place regulations and guidelines to address emissions generated by Marine diesel engines [7]. In this regard sulphur oxides and particulate matter cap of 2010 and the 2050 GHG emissions target imply the world’s future fleet will have to rely on a broader range of fuels and adopt novel propulsion solutions to efficiently operate [5,8]. Measures in place by the IMO to help ship operators includes the Energy Efficiency ship design index (EEXI) and the Ship Energy Efficiency Management plan (SEEMP) as provided in Marine environment protection committee guidelines [5].The provisions of these guidelines and regulations such as the Energy Efficiency Existing Ship Index (EEXI) and the Carbon Intensity Index (CII) can only be achieved through more efficient on board machinery systems operations and technology upgrade through retrofits for existing ships. Moreover, there is greater interest in the adaptation of new fuels such as ammonia, biofuels blends, methanol, methane etc [9,10]. Based on the foregoing, reducing GHG emissions can be achieved through several means such as using low carbon fuels, hybrid power & propulsion systems, reducing fuel consumption, carbon capture, and host of other technologies.
Adopting to these new fuels, retrofits and new technologies will introduce additional reliability challenges for existing or even new systems installed onboard ships. In this regard, to ensure that the systems onboard will continue to operate with similar or high levels of reliability, there is a need to understand how these new fuels and their enabling technologies fit into existing maintenance practices onboard. The reliability of systems and failure modes of components to identify which components and failures are critical to ship availability will be required going forward. Moreover, machinery failures have been identified to be among the major course of maritime incidents [11]. Degraded machinery health can be a serious burden on the vessels owner and operator due to frequent failures and increased consumption of fuel and lubricant [12]. However, most of these challenges can be avoided or mitigated with right understanding of component criticality; as it enables a more targeted maintenance strategy adoption [13,14].
Therefore, in order to ensure availability of equipment and systems reliability , operators require an efficient maintenance approach that can minimise failures and reduce downtime through the life cycle of the asset or machinery (Rec, 2018). In general ships are supplied with maintenance plans-based schedules drawn from original equipment manufacturers (OEM) operating manual. These initial documents can help with routine checks and maintenance especially when most system are new. However, operating conditions such as climate, operating profile, technical capacity and availability of genuine spare parts and other consumables such as fuel and lubricating oil could invalidate the initial as supplied maintenance plan or approach [15]. In this regard, there are different approaches to establish components reliability for towards enabling a maintenance that can provide various features to ensure efficient life cycle management while respecting all climate regulations [16]. Existing traditional maintenance approach and flexibility afforded by the development of sensor technology as well as insight through data analysis can provide an efficient solution to challenges in ship maintenance [17]. Similarly, the combined use of reliability analysis tool and machinery health monitoring data would help with early detection of failure in equipment [18,19]. Accordingly, this research paper will consider the component criticality as it impacts on maintenance and emissions control. Therefore, the paper will be presented in 5 sections; section 1 includes the introduction to the topic while the critical literature review focusing on component criticality analysis is presented in section 2. The paper methodology on developing a novel hybrid framework is presented in section 3, while section 4 presents the case study. Finally, section 5 includes the results and discussion, which are followed by the conclusions in section 6.
2. Critical Literature Review on Component Criticality Analysis
The reliability of a system is equal to the product of the reliabilities of the individual components which make the system [20]; thus the higher the number of components in a system the more complicated it is to ensure its reliability. Marvin [20] defines a system as a collection of components that interact with each other to achieve a common goal; hence any dysfunction in one or more components could impact the ability of an equipment or system to operate properly. In early maintenance planning simple methods that were used to calculate equipment reliability or availability such as mean time to failure (MTTF), mean time between failure (MTBF) failure rates(λ) [21,22,23]. These measures help maintenance planners with some estimate on machinery reliability, but not enough information to understand courses of failure and related impacts [24]. In this regard additional tools using failure probability analysis or statistical measurements are employed such that failure and courses of failure can be attributed to particular component in machinery [14,21,25,26].
System Reliability analysis have historically aided maintenance planning since the advent of organised maintenance approaches that evolved from breakdown of simple machines to condition monitoring based predictive analysis [27,28]. In this regard, the evolution of maintenance strategy to prioritised certain maintenance action can partly be attributed to advances reliability analysis that enable the understanding on how component failure contributes to equipment availability [29,30]. On the other hand, risk and criticality are increasingly taking centre stage in equipment maintenance especially in industries where human casualty or environmental pollution are priorities; hence more focus is on safety of operations and system reliability [31,32]. In this regards authors have provided in depth research in the application of reliability analysis tools in the various industries. A criticality-based maintenance for coal power plant used FMECA to drive Risk Priority Number (RPN) aimed at identifying critical components in the plant. System reliability analysis using tools such as FTA and FMECA have found wide application in the nuclear industry especially in the energy sector (Volkanovski et al., 2009). A great deal of research has been made in the maritime sector on the use of reliability tools to improve safety, risk reduction and achieving reliability for ships and offshore wind turbines (Lazakis et al., 2016,Lazakis et al., 2018,Leimeister & Kolios, 2018).
Ship operators are adopting new technologies in maintenance which do not only allow for reduced crew but enables more cost effective and environmentally friendly ship operations [33]. Moreover, the ISM code as contained in IMO [34] mandate operators on the development of process to identify ship equipment whose sudden failure could lead to hazardous situations. Furthermore, industry regulations push for the adoption of advance technologies that would require ship operators to adopt additional reliability majors [35,36]. Likewise, Classification societies require ship’s to have a standard maintenance documentation and strategy prior to certifying Class qualification [37,38]. Hence, adoption of tools such as fault tree analysis (FTA), reliability block diagrams, (RBD), event tree analysis (ETA), failure mode effect analysis (FMEA) and other variants to ensure the emplacement of robust maintenance regimes.
Therefore, to enable more depth in analysis more researchers adopt a method that combines 2 or more reliability tools in order to overcome some the deficiencies or take advantage of the other tool as shown [21,39,40]. Establishing component criticality to aid maintenance planning is a key aspect of maintenance strategy implementation, for instance FMECA for critical component identification in coal fire power plant for maintenance planning was presented by [41], while (Lazakis et al., 2010) presented a combination of FMEA and FTA in order to increase ship machinery availability. A combination of reliability tools and ANN was to develop a predictive condition monitoring by (Lazakis et al., 2018) which show the competitive flexibility that can be driven to the use of reliability tools and numerical methods in system reliability analysis. The criticality of system, component or event in FMEA is derived by the use of risk priority number (RPN) [20,42]. Reliability analysis tools examine risk of failure by considering quantitative and qualitative aspects. In any case, the selection of tools for reliability analysis depends on factors such as depth of analysis intended, system to be analysed, type of data (qualitative or quantitative), objective of the analysis, tool availability, availability of computing resources and interaction between system or component. Other factors includes tool characteristics ie inductive or deductive based analysis [20,43]. Additionally, research gaps in literature provide another important factor in the choice of tools for reliability analysis, therefore researcher work to identify a better or more efficient way of conducting similar analysis. In doing this tool are assed based on their strength or compatibility with the research at hand. Some of the notable reliability analysis tools includes, Event Tree Analysis (ETA), Fault Tree Analysis (FTA), Dynamic Fault Tree Analysis (modified FTA), Failure Mode and Effect Analysis (FMEA) and Failure Mode Effect and Criticality Analysis (FMECA), Markov Analysis (MA) and Bayes’ Theorem presenting the Bayesian Belief Networks (BBNs) [21]. The strength and weakness of these tools are presented in Table 1.
In the table above, the tools presented share several futures that are important for reliability or risk analysis, some these similarities includes visualisation of components or events interaction in a system, use of failure rates or probability as inputs data, reliance on expert knowledge for model quality and prediction of system reliability [44]. In this regard, the choice of tools by authors in reliability analysis can be influence by the strength and weakness of the a available tools, as well as gap in research methodology or application in certain field [43].Nonetheless, the motivation is not only to fill research gap, as authors must provide the level of scrutiny required to meet certain standards in addition to the fact that the methodology can be replicated using different set of data or systems.
2.1. Dynamic Fault Tree Analysis
Dynamic fault trees used all the structure and logic of the static fault tree except for the addition of gates, Priority And Gate(PAND), Functional Dependency Gate (FDEP), Sequence Enforcing Gate(SEQ) and Spare Gate [45,46]. The PAND gate model’s a system failure or an undesired event in order of occurrence from left to right, such that the left most event occur before the next event can take place. An example can be in the series of fuel filters in that a secondary filter downstream of the primary filter gets clogged only when the primary filter malfunctions. The SEQ gate as the name suggest model’s events in constrained manner from left to right such that event occurs only if the event before it has occurred. In this regard the SEQ differs from the PAND gate due to constrained nature of failure occurrence and can be especially useful for modelling close loop system with feedback failure such as in bilge educator system, whereby pressure drop at any point in the system is affect the entire piping network. The FDEP behave in slightly different manner compared to PAND and SEQ get in that it takes into consideration the function of the system or component and resulting failure, for instance the failure of a thermostatic valve which results to overheating in a heat exchanger that can a well be caused by a leakage in the system.
The Spare gate has some special futures unlike the other gates, especially in modelling redundancy in system reliability or failed standby equipment. Spare gates takes only spare events as inputs, with the left most events being the active or primary event [30]. All other spare events after the primary events are alternative inputs and have varying degree of influence based on the dormancy factor which is between 0 and 1 [45]. The dormancy factor indicates how active the spare event is; with 0 being cold spare and 0.1 to 0.9 being warm. In this regard, a failed spare is replaced by the next most active spare from left to right, a spare gate fail’s only when all the spare events have occurred i.e., failed. Therefore this makes it very relevant in analysing system improvements as presented in [15,47]. Therefore these additional gates has provided more scope in DFT analysis [46,48] which can be used to factor repair or improvements due to routine maintenance. Moreover, additional outputs such as reliability importance measures and minimal cuts sets in the DFTA are equally influenced by the logic structure such of the model, meaning that the output of static FT and a dynamic in those output will be significantly different and reflective of the whatever dependencies exist in the model.
2.2. Reliability Importance Measures
Reliability Importance measurers assist in identifying the event that, if improved, is most likely to produce significant improvement in equipment or system performance [23,49]. In essence the IM helps the operators, maintenance crew, administrators including regulatory agency in prioritisation of actions that could improvement in equipment/system reliability. Among the commonly used IM are Birnbaum (Bir), Fussell-Vesely(F-V) and Criticality (Cri). The Bir IM evaluates the occurrence of the top events based the probability of basic event occurring or not occurring, hence the higher the probability basic events the high chances of top event occurring [50]. Criticality (Cri) IM is calculated in a similar way to Bir IM except that it considers the probability in the occurrence of the basic event to the occurrences of the top event. On the other hand, the F-V calculation adopts an entirely different approach in that; it uses the minimal cut set summation i.e., the minimum number of basic events that contribute to the top event. Therefore, the F-V consider the contribution of the basic event to occurrence of the top event irrespective of how it contributes to the failure. The Bir IM and Cri IM were considered in this research however comparing the two measures; Bir IM is more reflective of the component’s criticality as modelled.
Lazakis, Turan [51] presented a DFTA analysis on MDG where the reliability IM were used to identified critical components on marine DG. Reliability importance measures are equally used for analysis especially on safety critical system where component critically is key to the safe operation of such system [52,53]. Using the risk achievement worth (RAW) and risk reduction worth(RRW) [54] introduced a methodology that can be applied to measure power distribution network criticality. Similarly, the importance measure can be used to help improving overall understanding of either weakest component or the most reliable component in system such that maintenance planners are able to balance their effort. Moreover, when components have been identified as critical or related failure can be a high risk maintenance planners are able to provide remedial plans against sudden failure or ensure sufficient quantities of a parts are held in stock ([55]. The Bir IM as highlighted earlier measures the contribution of the most critical component to the occurrence of the top event, hence helping to clearly identify what component need improvement. In this regard, researchers have adopted Bir IM to enable identification critical system failures to avoid catastrophic failures like crank case explosion in diesel engines [56,57]. DFTA has equally been combined with other tools to achieve additional research goals such as decision support or analysis requiring some level of subjective inputs [58,59]. Moreover, scrutiny in machinery health condition monitoring due to emission regulations, improved sensor capability including autonomous shipping has led to application of machine learning based tools for diagnostics and prognosis analysis [17,60] in some case with DFTA and other tools [15,18].
2.3. Artificial Neural Networks
In general, there are two types of machine learning namely supervised and unsupervised learning (Mahantesh Nadakatti, 2008, Cipollini et al., 2018). The supervised machine learning is used to train a labelled model using a labelled that, that is the features to be looked out are already know there the algorithm is trained to look out those features in the input data(C. Gkerekos et al., 2017). On the other hand, unsupervised learning deals with unlabelled data which means the algorithm will identify the unique features in the data and partition it accordingly (Coraddu et al., 2016)(Vanem & Brandsæter, 2019). Unsupervised learning is useful for exploring data in order to understand the natural patten of the data especially when there is no specific information about significant incidents in the data that can easily point to some fault indicators(Cipollini et al., 2018).
Artificial Neural Network (ANN) have been applied in the field of maintenance for machinery health analysis and prediction of machinery condition by various authors. Therefore, riding on the existing success and procedures in the use of ANN for machinery data analysis, this research will employ ANN for fault classification and detection, fault/condition prediction and machinery remaining useful life analysis(Wu et al., 2007). ANN approach for fault detection was applied with FTA to identify critical component of a diesel generators in a research presented by (Y. Raptodimos & Lazakis, 2017). In some cases, machinery fault data are recorded without identifying the fault signals, therefore this requires the data clustering. Clustering is form of unclassified machine learning which is applied of machinery diagnostics (Christos Gkerekos et al., 2019). The advantages of using clustering models help identify possible clusters as well as the most influential clusters in the data. In research ANN Self Organising Map were used for clustering of machinery log data of DG. SOM consists of competitive layer which can classify a dataset of vectors with any number of dimensions as the number neurons in the layer and are good for dimensionality reduction as presented in (Yiannis Raptodimos & Lazakis, 2018) (Ponmalai & Kamath, 2019).
Accordingly, ANN are widely employed for multiple tasks such as clustering, forecasting, prediction, pattern recognition, classification, and feature engineering [61]. The use of ANN and Regression technics was employed to estimated vessel power and fuel consumption where the model was able predict to predict actual vessel fuel consumption in real time [62]. The use of ANN for fault classification has been employed by [63,64,65] using self-organising map an ANN clustering algorithm analyses the health parameter of a marine diesel engine looking at exhaust gas temperature, piston cooling outlet temperature and piston cooling inlet pressure. Therefore, the performance of ANN in prediction and classification as reviewed in [66,67,68] was presented to be good in handling nonlinear high dimensional data having fewer data set [68]. In this regard building the success of ANN this work will apply the use of ANN on a labelled data for diagnostic analysis on 4 set of marine diesel generator [64,69]. Therefore, the feedback from the ANN is used in combination with the reliability analysis output to identify the dominant faults and most affected components [64,70].
In view of the foregoing, several author’s and researchers have made efforts in application of DFTA, ANN and other data driven approaches for reliability and fault identification [17,63,71]. Nonetheless, there still exist some gaps in application of DFTA for criticality analysis especially using the Bir IM in identifying critical component failures. On the other hand, ANN and other machine learning approach have been widely used in system diagnostics and fault identification [65,68,72]; however its combination with DFTA criticality analysis with a view to identify faults related component failures requires further investigation. Moreover, in this research a methodology was developed to apply the combination of DFTA and ANN fault identification on MDG based on component criticality to ship operational availability. Furthermore, future engineering based on correlation analysis using power output as independent variable to identify most sensitive variables to performance alterations was presented. Therefore, this methodology present and efficient approach to system reliability and fault detection analysis with the potential to application to individual ship or fleet of ships.
3. Methodology
The presented methodology provides a holistic hybrid maintenance strategy to cover the entire ship system in a manner that enables flexibility in assigning component maintenance priority or scheduling. In this regard, this research methodology is utilising the combined strength of reliability analysis tools for system reliability and criticality, while using artificial neural network for diagnosis and fault prediction. The combination of systems onboard ships makes it unsuitable to have single approach to maintenances. This is more so when additional consideration is giving to ship operators in developing countries where access to technology and original equipment manufacturers is limited and, in some cases, restricted. Often leading to extended downtime for some critical on-board equipment usually ignored in most analysis. In this regard, the methodology provides an efficient approach to component/equipment failure and degradation analysis. This is because the nature of failure and equipment performance degradation varies a lot from component, equipment, or sub-system as such the need to consider multiple analysis tools to enable a more efficient and flexible methodology. Figure 2 above shows the overall methodology of the research.
Therefore, data collection campaign was conducted in order access, maintenance, repair, overhaul, and machinery log data for onboard machineries from a case study ship. Using this data, the failure in diesel generators system and subsystem machinery were analysed to understand the courses of failure identify most critical component and to provide possible ways to improve onboard maintenance. The process of the research involves collection of machinery data from an Offshore Patrol Vessel (OPV) which was then analysed to generate outputs relevant to machinery health performance indicators. The research has 3 broad areas which are used as inputs or in combination to analyse the condition of machinery health as shown in the Figure 2 above; the 3 broad areas in the methodology are data collection and processing are the System reliability analysis using DFTA, fault detection using ANNs.
3.1. DFTA Analysis
Static Fault Tree Analysis (FTA) procedure is based on Boolean law by applying gates and events to describe faulty components and possible event(s) that could develop a fault [46]. FTA is an important tool for reliability and risk analysis as it provides critical information used to prioritize the importance of the contributors to the undesired event i.e., fault or failure. However, static FTA has some short comings to do with sequence dependencies, temporal order of occurrence and redundancies due to standby systems. Therefore, DFTA with addition of 4 gates and 1 basic event has provided a much flexible way of modelling faults/failures in complex systems with respect to sequence and dependencies, which means the temporal order of the occurrence of events is important to analysis. The DFTA analysis in addition to the system reliability it also provides additional outputs that namely, the reliability importance measures and minimal set.
The reliability importance measures (IM) are used identify the most critical component/situation that contributes to the occurrence of the low/ basic event leading up to equipment failure or top event occurrence [45],while the minimal cut set are set of events that cause the top event to occur. A minimal cut set (MCS) is the smallest set of events, which, if they all occur, cause the top event to occur [45]. Moreover, IM provides more details on component i.e. parts failure criticality while the MCS are provide more details on faults that could impact on a component. The Bir IM measures the rate of the system reliability due to upset in the eligibility of single component, sub-system, or system. Therefore, the Bir IM is define as the partial derivative of the system reliability with respect to the component reliability, multiplied by the reliability of the component Equation (1) [20]. Similar Relex [45] described the Br IM as the measure in the increase in probability of the top event due to the occurrence of event A, Equation (2). Equation (1) is relevant for in analysing a system or global criticality while Equation (2) solves for local or sub-system level component criticality.
Where:
IB(i|t) = Birnbaum criticality at time t
h (1i, p(t)) = system reliability when system is functioning
h (0i, p(t)) = system reliability when system has failed
Where:
= Birnbaum importance measures of for event A
A = the event whose importance is being measured
= the event did occur
X = top event
3.2. ANN Fault Identification
Artificial Neural Network (ANN) have been applied in the field of maintenance for machinery health analysis and prediction of machinery condition by various authors. Therefore, riding on the existing success and procedures in the use of ANN for machinery data analysis, this research will employ ANN for fault classification and detection. The analysis involves recognising patterns in the data that indicates the presence of variations pointing to a change in the normal health parameters of the system or machinery of interest. A supervised ANN feedforward neural network was implemented for the classification analysis. Feedforward ANN is a time series algorithm that can be used for both function fitting and pattern recognition [73]. The Feedforward networks usually have single or multilayer hidden sigmoid neurons followed by a series of output neurons. Multiple layers of neurons with nonlinear transfer functions enable the network to learn nonlinear relationships between input and output vectors [74].
3.3. Data Labelling
Following the above analysis, the data was labelled to identify the faults and operating condition for machine learning purpose. Therefore, considering that there was no actual indication of faulty data from the operators’ log, the research relied on expert knowledge and operators’ recommendation on data alarm limits to form the bases of fault identification, also provides the lower and upper acceptable operating limits for the diesel generator.
The fault class label for the diagnostic analysis was derived based on the labels as well as additional information from the failure data. The failure data was used to compare start- stops times and corresponding incident reports, which sometimes gives some valuable information regarding log readings. In this regard, a nested IF – ELSE analysis was conducted to get the fault class and operating temperature condition, the process is illustrated in Figure 3.
A two-layer feedforward network with sigmoid activation and SoftMax output neurons were adopted for the study based on Equation (3). The sigmoid activation function, Equation (4), helps to improve the prediction capability of the neurons by adding bias and non-linearity while the SoftMax activation function, Equation (5), is a probability function with values between 0 and 1. The most likely probability being 1 and vice-versa. Both sigmoid and SoftMax are used for classification problems, and they help improve the model’s capability [61].
The above methodology while focused on component criticality provides a viable pathway that can be used to address carbon emission due to shipping. This having in mind that the existing ship using Marine Gas Oil(MGO) or Low Sulphur Fuel Oil (LSFO) will continue to participate in the trade. Furthermore regional marine areas with low income are likely to continue using engines that do not fully comply with MEPC76 regulations [5]. Hence, the approach in the research can help bring awareness as regards maintenance actions that are vital to engine emissions, on the other hand the aspect of spare parts procurement and maintenance contract management all have additional factors to ship emissions. Therefore, the criticality analysis will identify path ways to which failures or partial failures that contribute to emission while ANN fault identification will help link the failures to the wider subsystem beyond the components . Moreover, not only that common cause failures are not strong point of DFTA, the data requirement of DFTA only needs reliability indicators while the ANN utilises’ machinery health indicators. This way the methodology will provide much needed insight on how to use MDG component criticality and health parameter to address aspect of ship emissions.
4. Case Study
In order to apply the methodology presented above, a case study is conducted using data from the power generation system (PGS) of an OPV, which is mainly engage in patrol duties typically lasting 3-4 weeks at sea and 2 weeks at harbour. The PGS is equipped with 4xMDGs rated at 440Volts, 60Htz 3phase, 400kW, hence no provision for emergency MDG. All MDGs can operate individually and in parallel during high load demands or as required. These MDGs are the primary source of power to the ship both at harbour and at sea except occasionally when the ship is at her home port where she receives shore power supply. Therefore, considering that the MDGs are always in use with average monthly usage exceeding 100 hrs per generator it therefore becomes important to ensure their availability while efficiently putting in place a maintenance strategy the considers the environment. In this regard, failure rate data over a period of 6 calendar years obtained from the maintenance records and was used as input for the DFTA analysis, summary of the failure rates for 4 MDGs is shown Table 2.
Therefore, using the failure rate data, a DTFA model was built to represent all 4 MDGs in the PGS as shown in Figure 4. A detail sub-subsystem DFTA for one of the MDGs is presented in Figure 5.
An ANN fault detection model using a feedforward neural net was built to provide further details as regard the major courses of failure and they can be related to increase in emissions. Moreover, one of the goals of maintenance planning is improve efficiency both in spare parts holding, procurement process and task. Therefore, using the ANN would help identify fault that can be linked to the identified critical components. The available data obtained from the 4 diesel generators comprised of 8 headings. (1) Generator Speed, (2) Lubricating Oil Pressure, (3) Fresh water temperature bank A (4) Fresh water temperature bank B, (5) Fresh Water Pressure (6) Lubricating oil temperature, (7) Exhaust gas temperature bank A, (8) Exhaust gas temperature bank B, (9) Generator running hours (10) Generator Power Output and (11) datetime as shown in Table 3 is a list of diesel generator parameters and their limits. In all there are 9 parameters collected for analysis however based on preliminary analysis just about 5 parameters have shown strong correlation in the data. The application of ANN in the research is mainly fault (anomaly) classification.
5. Results and Discussion
Maintenance onboard ships is influence by important factors such as MTTF, MTBF, MTTR, as well as failure rate data. These factors have been used in literature to help shape maintenance planning and scheduling [75]. However, additional factors such as man hours required to carry out the task, level of qualification needed for certain task are important considerations. No doubt these factors are universally applicable in all areas of maintenance planning irrespective of industry or geographical location. Some factors which are common in developing countries and usually do not future in other developed area literature or challenges are issue to do with delays in spare parts availability, OEM warranty restriction, OEM technology control. These factors play very key role in maintenance constraints in countries with low technology penetration, which makes it difficult for the major OEMs to establish strong representation.
5.1. Subsystem Analysis
Dynamic Fault Tree Analysis (DFTA) was conducted on the Power generation system consisting of 4 x 400 Kilowatt (KW) marine diesel generators (MDGs) of an Offshore Patrol Vessel (OPV). The NN’s Fleet maintenance Regulation (FMR02) envisioned a maintenance strategy that would ensure a minimum ship availability level of 80 %. This is to be achieved through routine first line onboard maintenance using PMS and in some case 2nd line/depot and OEM support and the dockyard level usually after every 4 years as provide in the ship maintenance and operating cycle (SMOC). However, this is not always possible due to several reasons such as deployments levels, maintenance implementation level, age of machinery, skills of personnel onboard and spare parts availability among other reasons. Therefore, DFTA analysis would provide the reliability analysis of the Power Generation System of the OPV in line with the expected reliability of the vessels as expected by the navy.
The analysis was conducted on systems, sub-system up to component level of individual engines. An overview on the reliability of the PGS and the MDGs is presented in Figure 6 and Figure 7 respectively. Figure 7 provides an overview on individual MDG reliability against the overall PGS reliability which is the cumulative reliability of all MDGs. Therefore, going by the operational requirements, the PGS reliability (Figure 6) begins a steady decline from the 7th month, similarly Figure 7 shows very low reliability especially for MDG 1. The reliability curve MDG1 reflects some earlier repair challenges faced by the maintenance crew due to faulty injector pump defects resulting to over delivery of fuel to some cylinders, causing frequent overheating and power load balancing. Moreover, the remaining 3 MDGs also show low reliability except for MDG 3 that presents a about 80 % reliability for up to 20 months. Overall, the results indicate a high level of unreliability in all the MDGs which explains the low reliability of the PGS in line with the operators’ requirements.
The analysis conducted on the other subsystem helped to provide further insight on the overall reliability of individual DGs and most importantly it identified where the major challenge is regarding all the 4 DGs. Therefore, the component criticality will shade light on the high level of unreliability displayed by the MDGs. Multiple components have been identified as critical though with varying degrees of priority of contribution to failures. Components in the power take off system and cylinder heads make greater number critical parts.
5.2. Component Criticality Analysis
Component criticality for individual components was obtained from the DFTA analysis. The Bir IM was used to present the most critical components this is mainly because of its ability to identify the most critical component once the top event is said to have occurred. Moreover, readings for Cri and FV IM were obtained, but all appear to have the same values and were low, such that the system may not require any significant improvements, hence not a good representation of the case study maintenance and failure reports. The IM for the MDG1 is presented in Table 4, which gives an overview of most critical components in the various sub-systems including other auxiliary connections, like the sea chest.
The Bir IM values were used for the component criticality analysis, in this regard, components that contribute up to 40% to system unreliability were established. The reason for Keeping the component criticality at 40 % was necessary to have a manageable size of components while maintaining the integrity of the system.
The reliability importance measures (IM) for the DGs are presented in Figure 8, the individual bar charts give the overview on most critical components in the various sub-systems including other auxiliary connections, like the sea chest. The Bir IM was used to present the most critical components being that it is the most responsive to the DFTA structure as well as the number of components to analysed. The IMs here represent components which have at least contributed more than 50 % of all failures within the period analysed. Interestingly, there are components that tend to appear in all the MDGs, of particular interest are components related to cooling and air intake systems. These are of great concern due to their influence on combustion process. Hence, this an area of high importance and must be noted by both the operators and the manufacturers especially within the warranty period. Furthermore, if this is regarded as some kind of challenge due to fuel quality and operator skills, then the OEM could provide an alternative way to address this shot comings on the MDGs.
Overall, all the MDGs didn’t show good reliability even going by the OEM recommendations on checks and calibration of components such as the tappet which require to be checked every 200 operating hours. Notwithstanding, that the OEM’s maintenance is mainly to serve as guidance to the operator; the equipment should not deviate much from the manufacturer’s initial maintenance projections especially within the first 5 years. Table 5 presents most critical components in all the 4 MDGs, the per centage criticality is an indication of how a component can affect an MDG when it fails or is degraded.
Gleaning from the above component criticality could be as a result of inappropriate maintenance, low manufacturing standards, sub-standard consumables, or induced faults as a result shared environment. For instance, the problem with cylinder head bolt getting loose could be attributed to high vibration and can cause significant damage to the MDG that potentially leads to other hazards within the engine room. On the other hand, there are significant failures involving the freshwater heat exchanger, air filter and the turbo charger. Faults on these components are particularly significant because they all add to increased fuel consumption and reduced output on the MDGs hence leading to load shading or tripping. Therefore, to explore how these faults occur additional analysis to evaluate the MDGs health parameter to check for faults was conducted using ANN.
5.3. Fault Identification
The hourly generator log data covering more than about 3000 operating hours over a duration of about 12 calendar months was collected. The pre-processing and labelling of the data were conducted using the data cleaning app and classification learner of the MATLAB software respectively. The data cleaning was necessary to remove outliers and invalid entries as well as gain more understanding of the data generally, a summary of the data is presented in Table 6.
In this regard an anomaly detection label was used for fault detection which was then used to carry out diagnostic to identify the prevalent failures in the data. Using this information, the analysis was also able to establish that most faults are related to overheating and occur when the ships is at harbour, Table 7 is a summary of the label data.
A feed forward ANN with 2 layers based on sigmoid and SoftMax activation function using the MATLAB pattern recognition app was used for the classification analysis. Analysis of Variance (ANOVA) was used to conduct feature importance, where 7 data features were found to be important for the analysis. These includes Power output(kw), Exhaust gas temperature (ET)A and B, Fresh Water temperature (FWT) A and B, Lubricating Oil Pressure (LoP) and location data, data as shown in Table 8. The time series data of about 3000 data points was used, the data was divided in 3, 70 % percent for training, 15% validation and 15% testing. The model was then applied on the reset of the for fault finding as shown the figures bellow the training model accuracy is as shown in Figure 9.
On completing the training, the model was evaluated using the True Positive Rate (TPR) and False Negative rate (FNR) approach shows that the model has performed well for the diagnostics and can be deployed or adopted for the set of generators. Although considering the datapoints it is believed that the model might behave slightly different with larger data set. Nonetheless in all the classes the has model has achieved more than 84 % accuracy between the true and predicted class Figure 9 shows the performance of the model in identifying the 3 classis namely Fault, Normal and Shutdown (SD). In this regard the features for the fault identification model where maintained from [76]. Consequently, power output (KW) was used independent variable while lubricating oil temperature 5 features were used were used as predictors. Therefore, MDG 2 data was used for the first training data set using the Exhaust Gas Temperature (EGTA) as predictor variable and while maintaining power output as the independent variable. In addition to the ANOVA score of 8.9 EGT was used due to its relevance to emission detection and can also indicate other faults such turbo charge and/or air filter degradation.
Accordingly, the selection of the EGT as predictor is premised on its fidelity to indicate performance degradation and as well as overall health of air breathing engines. The results of the training model using MDG 2 is shown in figure 10. The fault identification plot in Figure 10 indicates the zone between 2500C and 3500C as the most critical area of most fault occurring in the data set.
Following from the original data set example prediction test was done using MDG4 data, as shown in Figure 11 and test model accuracy is shown in Figure 12. The test model also follows a similar patten as in the MDG2 original data set. It suggests that most faults occur at EGT above 2500C corresponding to power output range between 80kw-120kw. These findings are very significant going by the operating records of MDGs. Moreover, actual operation the MDGs hardly go beyond 50% of rated output (400kw), so having the faults occurring at that power output suggest a greater problem. The test prediction model using MDG4 also shows very similar patten with additional points occurring at lower EGT of above 2000C.
The model was deployed on the combine data of MDGs and good enough the result remains consistent with the both the validation and test data results earlier presented. The prediction model shows more fault detections with improved accuracy, mainly because of improved data. The result of the analysis is presented in Figure 13, as can be seen the fault concentration zone is still representative of the original training data. Overall, the diagnostic model has attained a good fitness level to be deployed for fault detection on the case study MDGs. Therefore, with is analysis, the predicted model provides important insight that can be used alongside the component criticality results. The relevance is that with further training and improvements on the machinery health data it would be possible to clearly identify some causal factors to component failure. Although additional data labels such vibration and oil analysis could improve the overall analysis by providing more specific details on faults especially in combination with the EGT. Nonetheless the EGT diagnostic model as presented in this research has a good fitness for fault detection.
In this regard, going by the results already presented it is possible to establish the link between component reliability and emissions. The component reliability analysis has identified components such as sea chest, FW heat exchanger, tappet clearance and turbo charger among the most critical to MDG reliability. All the stated components can be associated with temperature increase and performance degradation in the MDG. On the other hand, location data also suggest that significant number of faults occur when the ship is at the harbour, presented in Table 9. Hence in perspective, the MDGs are run majority of the time when the ship is alongside at the harbour this could explain the issue reliability issues with sea chest and air filter due to objects in the water air quality around the port. In this regard running of the MDGs at the harbour could be an additional factor impacting on their overall reliability as well as failures that are related to the cooling and air intake systems. The challenge of running the MDGs at harbour can be addressed by providing shore power supply which can help improve the MDGS reliability as well provide opportunity of maintenance to be carried out in a more conducive environment.
On the other hand, ship maintenance has evolved beyond system reliability as regards cost and availability. Increased advocacy by IMO, regulatory agencies, interest groups as well as classification societies has helped to make shipping companies become more aware about the environmental impact of their operations. Therefore, in line with IMO’s regulation with respect to EEDI and SEEMP efficient maintenance will go beyond onboard maintenance task, other aspect that contribute to the successful implementation of the maintenance will play vital role. Accordingly, emission from MDGs could be classified broadly into 2, i.e., direct emission due to the operations of the MDG and indirect due to associated maintenance and repair activities.
Direct emission as result of component failures such as turbo charger, tappet/valve spring fault, air filter, injector nozzles, heat exchanger faults, piston rings etc could rise the possibility of emission due to overheating or incomplete combustion. Many OEMs have incorporated diagnostic systems that can provide information on fuel flow, air flow rate and many other parameters so to protect the engine. However inefficient combustion due to fuel quality and valve timing are not adequately addressed. In this regard placing a carbon metre along the exhaust gas path to alert of any fluctuation or count for carbon emission threshold would provide much needed information and help to improve efficiency in maintenance to ensure component reliability reflects ship emission reduction goal.
On the other hand, indirect emission are those emissions associated with activities such spares parts supply process, maintenance or repairs that require external support such as OEM or equipment specialist. These activities require additional travel to the location of the ship as well as other logistics regarding transfer onboard. Beyond the issue of travel is that of plan and ensuring that those critical components that can be held onboard are sufficiently stocked while those that cannot, are adequately provided either at the deport or a vendor is arranged. Therefore, the component criticality analysis will help the ship operator understand the most critical components based on usage failure or degradation in performance and this can be used to prioritise spare parts holding onboard or schedule a specialist intervention. Additional spares that could be difficult or expensive to source could be adequately catered for within the service plan or budget. Periodic maintenance or inspection that require OEM or specialists can be planned in a way that journeys are made in more efficient manner or adoption of video calls to conduct remote servicing by competent personnel onboard.
6. Conclusion and Future Work
The reliability of diesel-powered engines on board ships is increasingly taking stage in both the ships operational availability and its compliance to emission control regulations diesel due additional scrutiny put in place by IMO to address emissions generated by Marine diesel engines. Accordingly, to ensure compliance ship operators are adopting to more efficient maintenance approaches that ensure availability of equipment and systems reliability while minimising overall emissions. Nonetheless, operators face challenges relating to operating conditions such as climate, operating profile, technical capacity and availability of genuine spare parts and other consumables such as fuel and lubricating oil. These issues add huge constraints of ship operator to abide some the emission reduction regulations. Existing traditional maintenance approach and flexibility afforded by development of sensor technology as well as insight through data analysis can provide an efficient solution to challenges in ship maintenance. Similarly, the combined use of reliability analysis tool and machinery health monitoring data would help with early detection of failure in equipment.
Therefore, a hybrid methodology using DFTA Bir IM and ANN feedforward neural net was developed for component criticality and fault identification respectively. Using the methodology, a case study was conducted on power generation system of an OPV consisting of 4xMDG. Accordingly, the criticality analysis came up many components such as the freshwater heat exchanger, sea chest, air filter, turbo charger, valve/tappet, piston crown etc. Majority of the critical components leads to faults that are particularly significant to increasing fuel consumption and reduced output on the MDGs hence leading to load shading or tripping. Accordingly, ANN feedforward neural net was developed for fault identification and EGT was used as the predictor based on the ANOVA score of 8.9. while power output in kw was independent variable. Model was train using aggregated data from MDG 1 and 2, thereafter tested on MDG 2. Model validation was done using new data from MDGs 3 and 4. Overall, the model performance was above 83 % TPR with less than 15 % FNR. Major finding suggests that most faults occur at EGT above 2500C corresponding to power output range between 80kw-120kw. These findings are very significant going by the operating records of MDGs. In actual operation the MDGs hardly go beyond 50% of rated output (400kw), so having the faults occurring at that power output suggest a greater problem. The test prediction model using MDG4 also shows very similar patten with additional points occurring at lower EGT of above 2000C. On the other hand, location data also suggest that significant number of faults occur when the ship is at the harbour, suggesting that MDG are run majority of the time when the ship is alongside at the harbour this could explain the issue reliability issues with sea chest and air filter due to objects in the water air quality around the port.
In this paper effort has been made to present a novel methodology based on hybrid reliability and diagnostics analysis using a combination of reliability analysis tools and ANN classification. The methodology has identified component critical to maintenance and related faults due to degraded component or sub-system performance. Therefore, future research direction could look into fault classification and mapping to component failure. Similarly, investigating the impact of component failure to ships emission using reliability analysis and machinery health data towards improving maintenance planning is recommended.
Author Contributions
Abdullahi Daya: Conceptualization, A.D. and I.L.; methodology, A.D.; software, A.D; validation, A.D.; formal analysis, A.D.; investigation, A.D.; resources, A.D.; data curation, A.D.; writing—original draft preparation, A.D.; writing—review and editing, A.D and I.L.; visualization, A.D.; supervision, I.L.; project administration, A.D.; funding acquisition, A.D. All authors have read and agreed to the published version of the manuscript.
Funding
This research was funded by the Petroleum Technology Development Fund (PTDF) Nigeria, grant number 17PHD178.
Data Availability Statement
The data presented in this study are available on request from the corresponding author.
Acknowledgments
The author wants to acknowledge and appreciate the support and scholarship funding received from the Federal Government of Nigeria via the Petroleum Technology Development Fund (PTDF) and the Nigerian Navy for providing access to ship data used in the research.
Conflicts of Interest
The funders as well as the data providers had no role in the design of the study; in the collection, analyses, or interpretation of data; in the writing of the manuscript; or in the decision to publish the results.
Abbreviations
| ABS(NS) | American Bureau of Shipping (Nautical System) | ISM code | International Safety Management |
| ANN | Artificial Neural Network | MCS | Minimal Cut Set |
| BBN | Bayesian Belief Network | MTTF | Mean Time to Failure |
| BE | Basic Event | MTBF | Mean Time Between Failure |
| BSI | British Standards Institution | MDT | Mean Down Time |
| CBM | Condition Based Maintenance | MRO | Maintenance Repair and Overhaul |
| CMMS | Computerised Maintenance Management System | NASA | National Aeronautics and Space Administration |
| CPT | Conditional Probability Table | NPRD | Non-Electronic Reliability Data |
| RPN | Risk Priority Number | OEM | Original Equipment Manufacturer |
| OREDA | Offshore and Onshore Reliability Data | OPV | Offshore Patrol Vessel |
| MDG | Marine Diesel Generator | PAND | Priority- AND |
| ETA | Event Tree Analysis | DFTA | Dynamic Fault Tree |
| DSS | Decision Support System | PMS | Planned Maintenance System |
| GHG | Green House Gas | RCM | Reliability Centred Maintenance |
| CII | Carbon Intensity Index | UN | United nations |
| EEXI | Energy Efficiency Existing Ship Index | RPM | Revolution Per Minute |
| SEEMP | Ship Energy Efficiency Management plan | LoP | Lubricating Oil Pressure |
| EEDI | Energy Efficiency Ship Design Index | FWT(A/B) | Fresh Water Temperature (Bank A/B) |
| FDEP | Functional Dependency | LoT | Lubricating Oil Temperature |
| FMEA | Failure Mode and Effect Analysis | FWP | Fresh Water Pressure |
| FMECA | Failure Mode Effect and Criticality Analysis | EGTA(A/B) | Exhaust Gas Temperature (Bank A/B) |
| FTA | Fault Tree Analysis | RH | Running Hours |
| IM | Importance Measure | KW | Kilo Watt |
| IMO | International Maritime Organisation | HRS | Hours |
References
- Mazzucato, M., The Entrepreneurial State. 2018, UK: Penguin. 260.
- IEA. Green Gas Emissions from Energy Data. 2021 10 Nov 2021 [cited 2023 13/03/23]; Available from: www.iea.org/data-and-statistics/data-tools/greenhouse-gas-emissions-from-energy-data-explorer.
- Ritche, H.R., Max. & Rosado, Pablo. CO2 and Green Gas House Emissions. 2020 [cited 2023 13/03/23]; Available from: https://ourworldindata.org/co2-and-greenhouse-gas-emissions.
- UN. Climate Actions 2023 [cited 2023 13/03]; Available from: https://www.un.org/en/climatechange/net-zero-coalition.
- IMO, 2021 Revised MARPOL Annex VI, in MEPC.328(76). 2021.
- Nuchturee, C., T. Li, and H. Xia, Design of Cost-Effective and Emission-Aware Power Plant System for Integrated Electric Propulsion Ships. Journal of Marine Science and Engineering, 2021. 9(7). [CrossRef]
- Wan, Z., et al., Decarbonizing the international shipping industry: Solutions and policy recommendations. Mar Pollut Bull, 2018. 126: p. 428-435. [CrossRef]
- IMO, Prohibition on the Carriege of non-compliant oil for combustion onboard a ship, in MEPC.305(73). 2018.
- Balcombe, P., et al., How to decarbonise international shipping: Options for fuels, technologies and policies. Energy Conversion and Management, 2019. 182: p. 72-88. [CrossRef]
- Ren, J. and H. Liang, Measuring the sustainability of marine fuels: A fuzzy group multi-criteria decision making approach. Transportation Research Part D: Transport and Environment, 2017. 54: p. 12-29. [CrossRef]
- Specialty, A.G.C.a., Shipping loss and accident locations and common causes. 2019.
- Gkerekos, C., I. Lazakis, and G. Theotokatos, Machine learning models for predicting ship main engine Fuel Oil Consumption: A comparative study. Ocean Engineering, 2019. 188. [CrossRef]
- Iheukwumere-Esotu, L.O. and A. Yunusa-Kaltungo, Knowledge Criticality Assessment and Codification Framework for Major Maintenance Activities: A Case Study of Cement Rotary Kiln Plant. Sustainability, 2021. 13(9). [CrossRef]
- Daya, A.A. and I. Lazakis, Investigating ship system performance degradation and failure criticality using FMECA and Artificial Neural Networks, in Trends in Maritime Technology and Engineering Volume 2. 2022. p. 185-195.
- Daya, A.A. and I. Lazakis, Application of Artifical Neural Network and Dynamic Fault Tree Analysis to Enhance Reliability in Predicitive Ship Machinery Health Condintion Monitoring, in GMO-SHIPMAR. 2021: Istanbul.
- Kim, G.S. and Y.H. Lee, Transformation towards a Smart Maintenance Factory: The Case of a Vessel Maintenance Depot. Machines, 2021. 9(11). [CrossRef]
- Cheliotis, M., I. Lazakis, and G. Theotokatos, Machine learning and data-driven fault detection for ship systems operations. Ocean Engineering, 2020. 216. [CrossRef]
- Karatuğ, Ç. and Y. Arslanoğlu, Development of condition-based maintenance strategy for fault diagnosis for ship engine systems. Ocean Engineering, 2022. 256. [CrossRef]
- Zhang, P., et al., Marine Systems and Equipment Prognostics and Health Management: A Systematic Review from Health Condition Monitoring to Maintenance Strategy. Machines, 2022. 10(2). [CrossRef]
- Marvin, R.A., Barros. Arnljot, Hoyland., System Reliability Theory Models,Statistical Methods and application. Probabilit and Statistics. 2021: Wiley.
- Lazakis, I. and A. Ölçer, Selection of the best maintenance approach in the maritime industry under fuzzy multiple attributive group decision-making environment. Proceedings of the Institution of Mechanical Engineers, Part M: Journal of Engineering for the Maritime Environment, 2015. 230(2): p. 297-309. [CrossRef]
- Kiran, S., et al., Reliability Evaluation and Risk Based Maintenance in a Process Plant. Procedia Technology, 2016. 24: p. 576-583. [CrossRef]
- Lazakis, I., Y. Raptodimos, and T. Varelas, Predicting ship machinery system condition through analytical reliability tools and artificial neural networks. Ocean Engineering, 2018. 152: p. 404-415. [CrossRef]
- Ben-Daya, M.D., S.O. Raouf, A. Knezevic, J. Ait-Kadi, D., ed. Handbook of Maintenance Management and Engineering. 2009.
- Lazakis, I., et al., Advanced Ship Systems Condition Monitoring for Enhanced Inspection, Maintenance and Decision Making in Ship Operations. Transportation Research Procedia, 2016. 14: p. 1679-1688. [CrossRef]
- Dao, P.B., et al., Condition monitoring and fault detection in wind turbines based on cointegration analysis of SCADA data. Renewable Energy, 2018. 116: p. 107-122. [CrossRef]
- Soliman, M.H., Machine Reliability and Condition Monitoring A comprehensive Guide to Predictive Maintenance Planing. 2020, Cairo.
- Bousdekis, A., et al., Enabling condition-based maintenance decisions with proactive event-driven computing. Computers in Industry, 2018. 100: p. 173-183. [CrossRef]
- Martin-del-Campo, S. and F. Sandin, Online feature learning for condition monitoring of rotating machinery. Engineering Applications of Artificial Intelligence, 2017. 64: p. 187-196. [CrossRef]
- NASA, Fault Tree handbook with Aerospace Applications. 2002.
- Chojnacki, E., W. Plumecocq, and L. Audouin, An expert system based on a Bayesian network for fire safety analysis in nuclear area. Fire Safety Journal, 2019. 105: p. 28-40. [CrossRef]
- de Jonge, B., R. Teunter, and T. Tinga, The influence of practical factors on the benefits of condition-based maintenance over time-based maintenance. Reliability Engineering & System Safety, 2017. 158: p. 21-30. [CrossRef]
- Stopford, M., Maritime Economics, ed. 3. 2009, London: Routledge.
- IMO, International Safety Management Code with Guidance for its Implementation, I.M. Organistaion, Editor. 2018.
- IACS, A Guide to Managing Maintenance in Accordance with the Requirements of the ISM Code, in 74, I.A.o.C. Societies, Editor. 2018.
- ISO, Condition monitoring and diagnostics of machines - General guidelines. 2018.
- ClassNK, Good maintenance onboard ships, ClassNK, Editor. 2017.
- ABS, Equipment Condition Monitoring. 2016.
- Raptodimos, Y., et al., Ship Sensors Data Collection & Analysis for Condition Monitoring of Ship Structures & Machinery Systems, in Smart Ships Technology 2016. 2016. p. 77-86.
- Emovon, I., R.A. Norman, and A.J. Murphy, Hybrid MCDM based methodology for selecting the optimum maintenance strategy for ship machinery systems. Journal of Intelligent Manufacturing, 2015. 29(3): p. 519-531. [CrossRef]
- Melani, A.H.A., et al., Criticality-based maintenance of a coal-fired power plant. Energy, 2018. 147: p. 767-781. [CrossRef]
- Cicek, K. and M. Celik, Application of failure modes and effects analysis to main engine crankcase explosion failure on-board ship. Safety Science, 2013. 51(1): p. 6-10. [CrossRef]
- Hirzinger, B. and U. Nackenhorst, Efficient model-correction-based reliability analysis of uncertain dynamical systems. Acta Mechanica, 2023.
- Byun, S., et al., Fault-Tree-Analysis-Based Health Monitoring for Autonomous Underwater Vehicle. Journal of Marine Science and Engineering, 2022. 10(12): p. 1855. [CrossRef]
- Relex, Reliability: Practitioner's Guide. 2003, Greensburg: Relex Software Corpoaration. 350.
- Kabir, S., An overview of fault tree analysis and its application in model based dependability analysis. Expert Systems with Applications, 2017. 77: p. 114-135. [CrossRef]
- Turan, O., I. Lazakis, and S. Judah, Establishing the Optimum Vessel Maintenance Approach Based on System Reliability and Criticality Analysis, in Managing Reliability & Maintainability in the Maritime Industry. 2012. p. 59-70.
- Ruijters, E. and M. Stoelinga, Fault tree analysis: A survey of the state-of-the-art in modeling, analysis and tools. Computer Science Review, 2015. 15-16: p. 29-62. [CrossRef]
- Raptodimos, Y., Combination of Reliability Tools and Artificial Intelligence for Ship Machinery Systems. 2018, University of Strathclyde.
- Konstantinos, D.L., Iraklis. Taheri, Atabak. Theotokatos,Gerasimos., Risk and Reliability Analysis Tool Development for Ship Machinery. 2010.
- Lazakis, I., O. Turan, and S. Aksu, Increasing ship operational reliability through the implementation of a holistic maintenance management strategy. Ships and Offshore Structures, 2010. 5(4): p. 337-357. [CrossRef]
- Ayo-Imoru, R.M. and A.C. Cilliers, A survey of the state of condition-based maintenance (CBM) in the nuclear power industry. Annals of Nuclear Energy, 2018. 112: p. 177-188. [CrossRef]
- Fu, S., et al., Towards a probabilistic approach for risk analysis of nuclear-powered icebreakers using FMEA and FRAM. Ocean Engineering, 2022. 260. [CrossRef]
- Volkanovski, A., M. Čepin, and B. Mavko, Application of the fault tree analysis for assessment of power system reliability. Reliability Engineering & System Safety, 2009. 94(6): p. 1116-1127. [CrossRef]
- Liang, X., et al., Reliability and safety analysis of an Underwater Dry Maintenance Cabin. Ocean Engineering, 2010. 37(2-3): p. 268-276. [CrossRef]
- Zhang, Y., et al., Performance Degradation Based on Importance Change and Application in Dissimilar Redundancy Actuation System. Mathematics, 2022. 10(5). [CrossRef]
- Chen, R., et al., Importance measures for critical components in complex system based on Copula Hierarchical Bayesian Network. Reliability Engineering & System Safety, 2023. 230. [CrossRef]
- Zhou, S., et al., Reliability analysis of dynamic fault trees with Priority-AND gates based on irrelevance coverage model. Reliability Engineering & System Safety, 2022. 224. [CrossRef]
- Codetta-Raiteri, D. and L. Portinale, Generalized Continuous Time Bayesian Networks as a modelling and analysis formalism for dependable systems. Reliability Engineering & System Safety, 2017. 167: p. 639-651. [CrossRef]
- Eriksen, S., I.B. Utne, and M. Lützen, An RCM approach for assessing reliability challenges and maintenance needs of unmanned cargo ships. Reliability Engineering & System Safety, 2021. 210. [CrossRef]
- Gurney, K., An Introduction to Neural Networks. 1997, London: Taylor and Francis Group.
- Farag, Y.B.A. and A.I. Ölçer, The development of a ship performance model in varying operating conditions based on ANN and regression techniques. Ocean Engineering, 2020. 198. [CrossRef]
- Raptodimos, Y. and I. Lazakis, Using artificial neural network-self-organising map for data clustering of marine engine condition monitoring applications. Ships and Offshore Structures, 2018. 13(6): p. 649-656. [CrossRef]
- Kang, Y.-J., et al., Hierarchical level fault detection and diagnosis of ship engine systems. Expert Systems with Applications, 2023. 213. [CrossRef]
- Karatuğ, Ç., Y. Arslanoğlu, and C. Guedes Soares, Design of a decision support system to achieve condition-based maintenance in ship machinery systems. Ocean Engineering, 2023. 281. [CrossRef]
- Stetco, A., et al., Machine learning methods for wind turbine condition monitoring: A review. Renewable Energy, 2019. 133: p. 620-635. [CrossRef]
- Velasco-Gallego, C. and I. Lazakis, Real-time data-driven missing data imputation for short-term sensor data of marine systems. A comparative study. Ocean Engineering, 2020. 218. [CrossRef]
- Wang, R., H. Chen, and C. Guan, A self-supervised contrastive learning framework with the nearest neighbors matching for the fault diagnosis of marine machinery. Ocean Engineering, 2023. 270. [CrossRef]
- Velasco-Gallego, C. and I. Lazakis, A real-time data-driven framework for the identification of steady states of marine machinery. Applied Ocean Research, 2022. 121. [CrossRef]
- Pla, B., et al., Model-based simultaneous diagnosis of ammonia injection failure and catalyst ageing in deNOx engine after-treatment systems. Fuel, 2023. 343.
- Velasco-Gallego, C. and I. Lazakis, RADIS: A real-time anomaly detection intelligent system for fault diagnosis of marine machinery. Expert Systems with Applications, 2022. 204. [CrossRef]
- Aizpurua, J.I., et al., Integrated machine learning and probabilistic degradation approach for vessel electric motor prognostics. Ocean Engineering, 2023. 275. [CrossRef]
- Sazli, M.H., A brief review of feed-forward neural networks. Communications, Faculty Of Science, University of Ankara, 2006: p. 11-17. [CrossRef]
- Umair Sarwar, M.M., Zainal Ambri Abdulkarim, Time Series Method for Machine Performance Prediction Using Condition Monitoring Data. 2014.
- OREDA, OREDA Offshore Reliability Data Handbook-4th Ed. 2002.
- Daya A.A , I.L., A Semi Automated Model for Improving Vessel System Reliability and Maintenance Management, in RINA Autonomos ships. 2022, RINA: London.
Figure 1.
CO2 Emissions by Transport sector (adapted from IEA:2020).
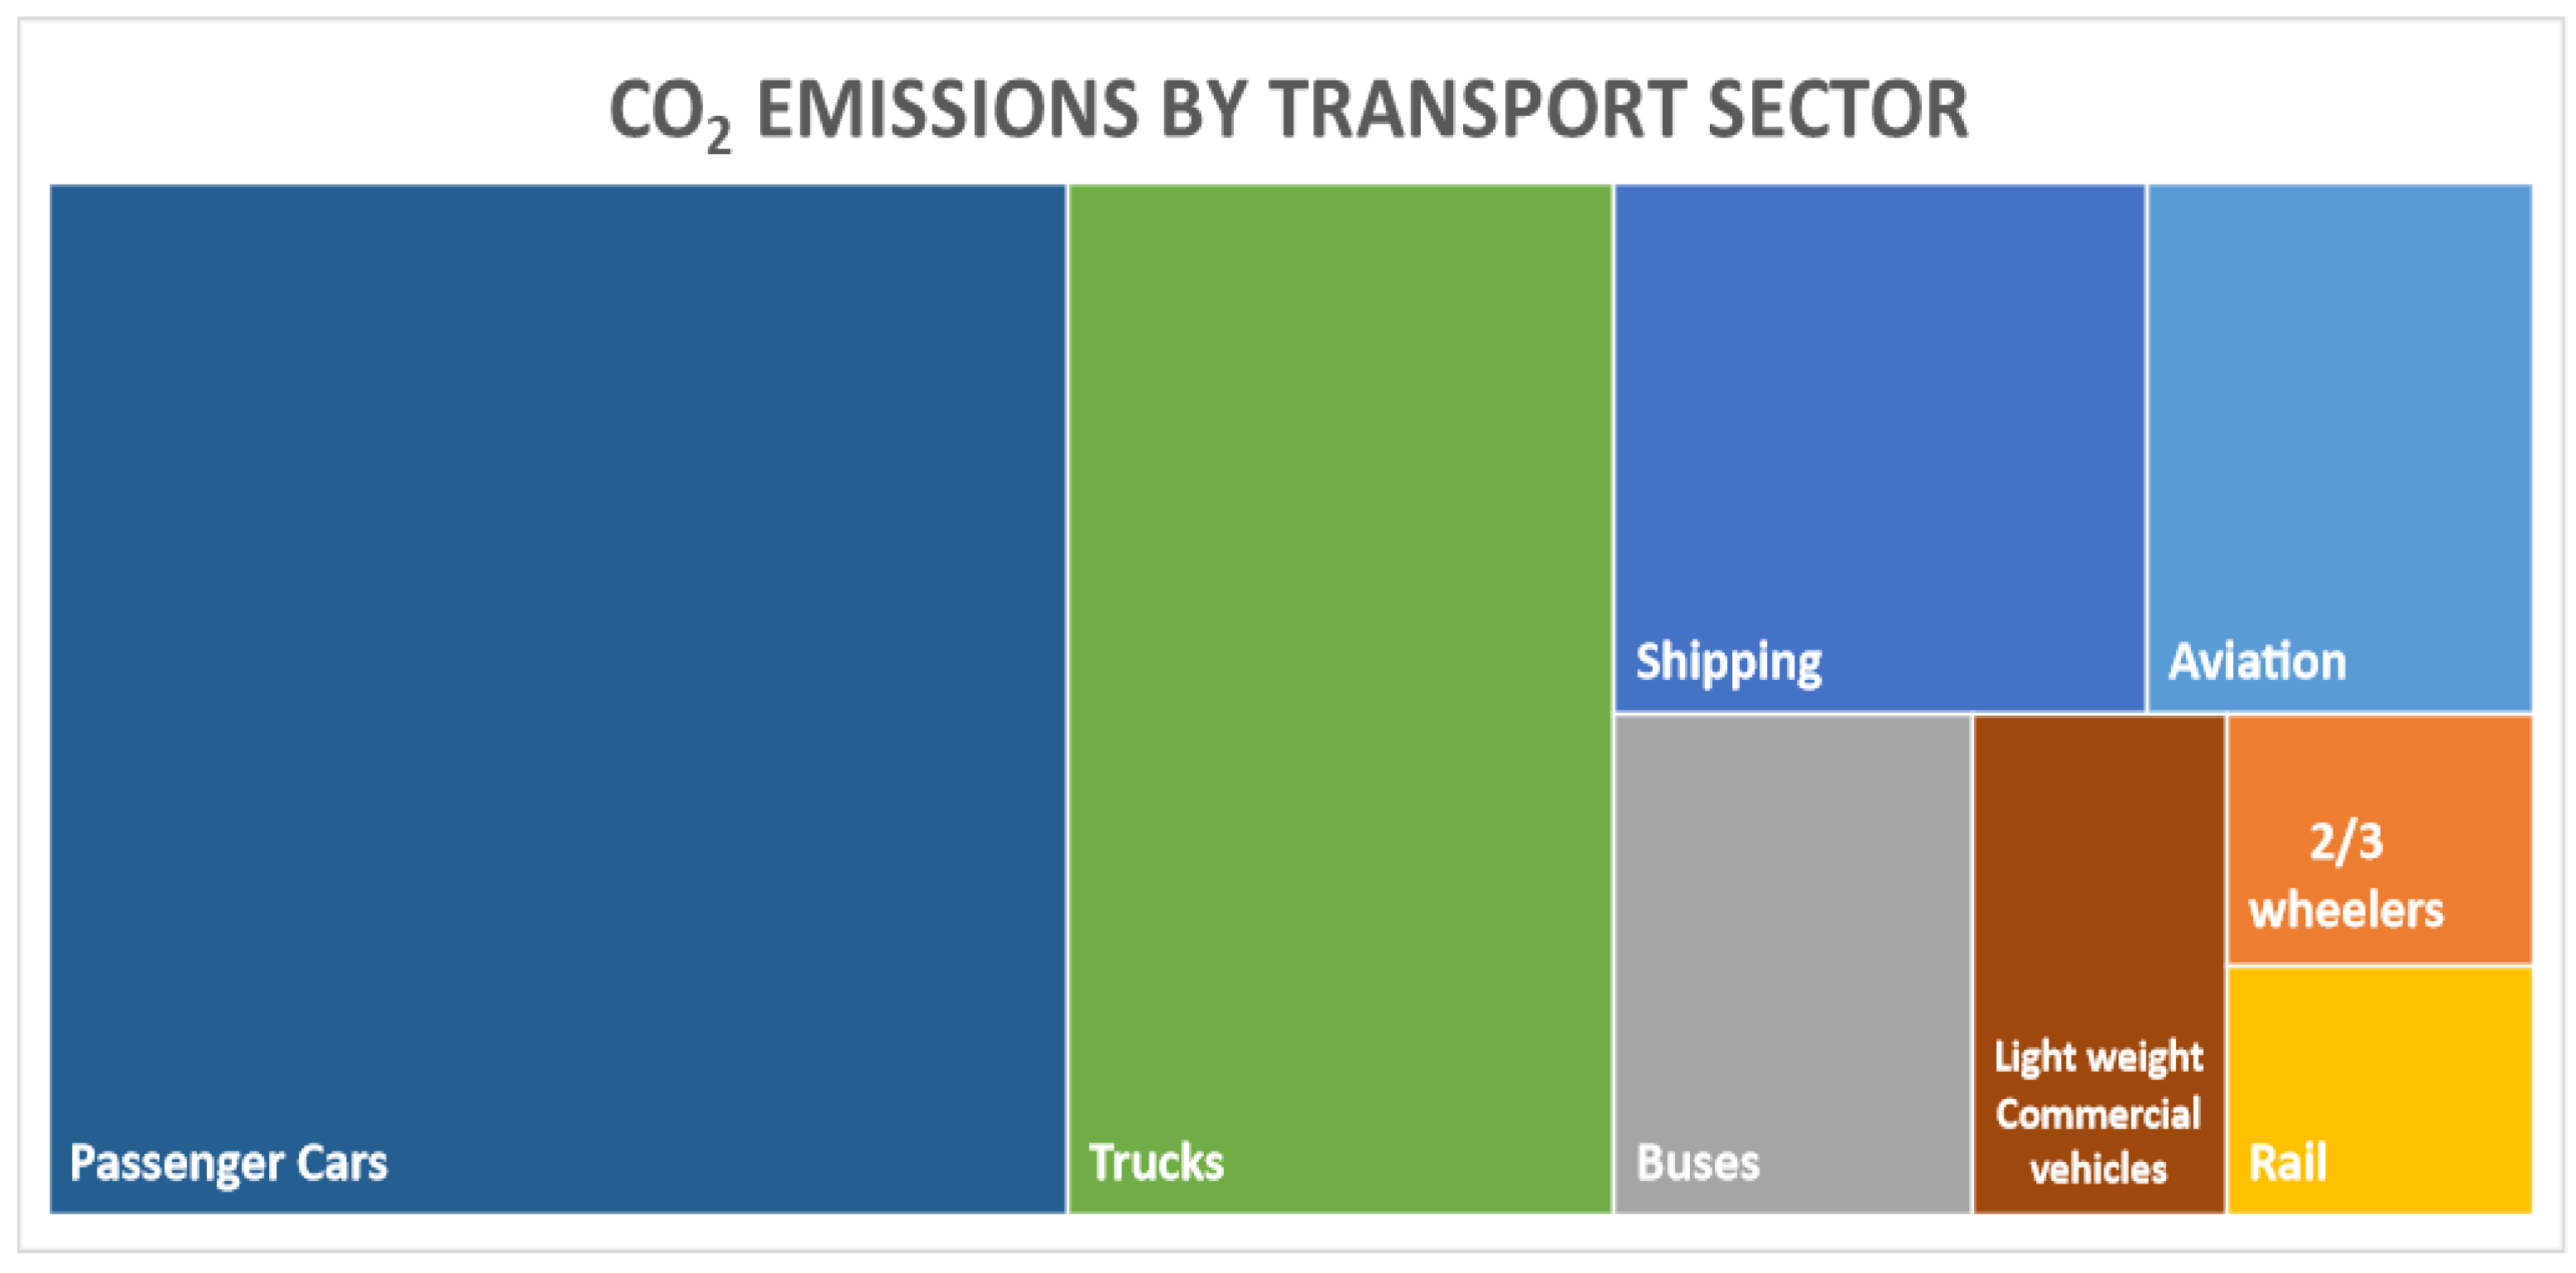
Figure 2.
Hybrid Methodology framework.
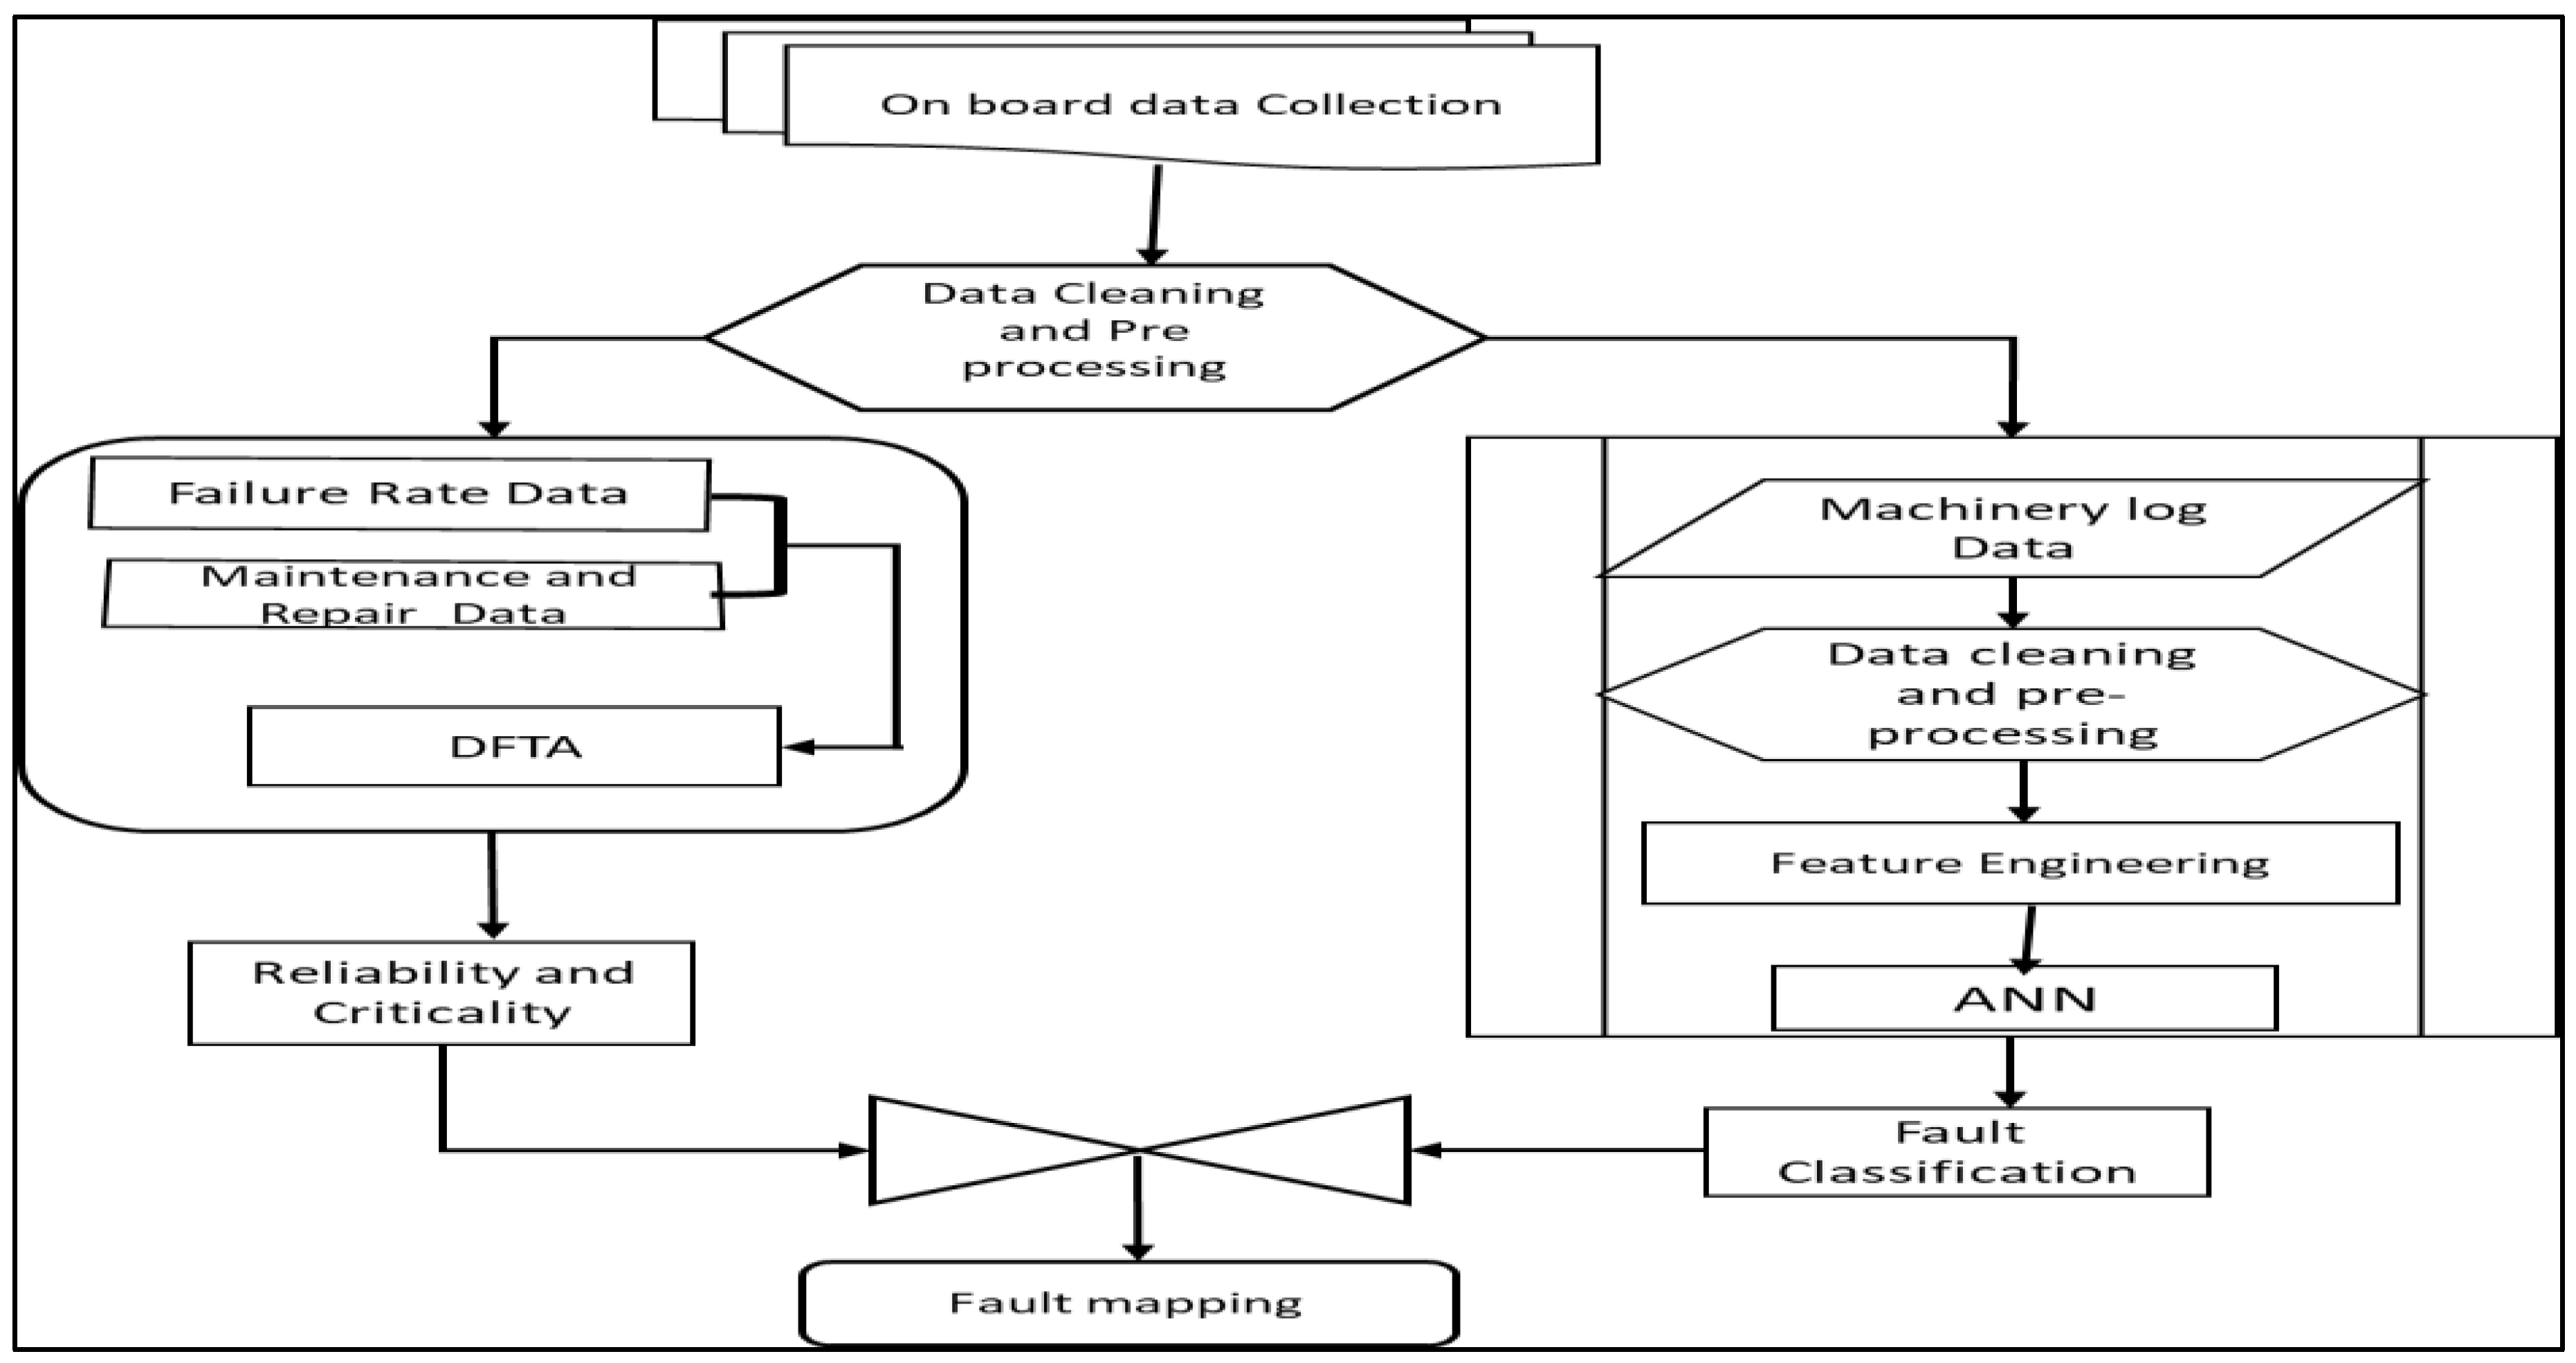
Figure 3.
Data labelling process.
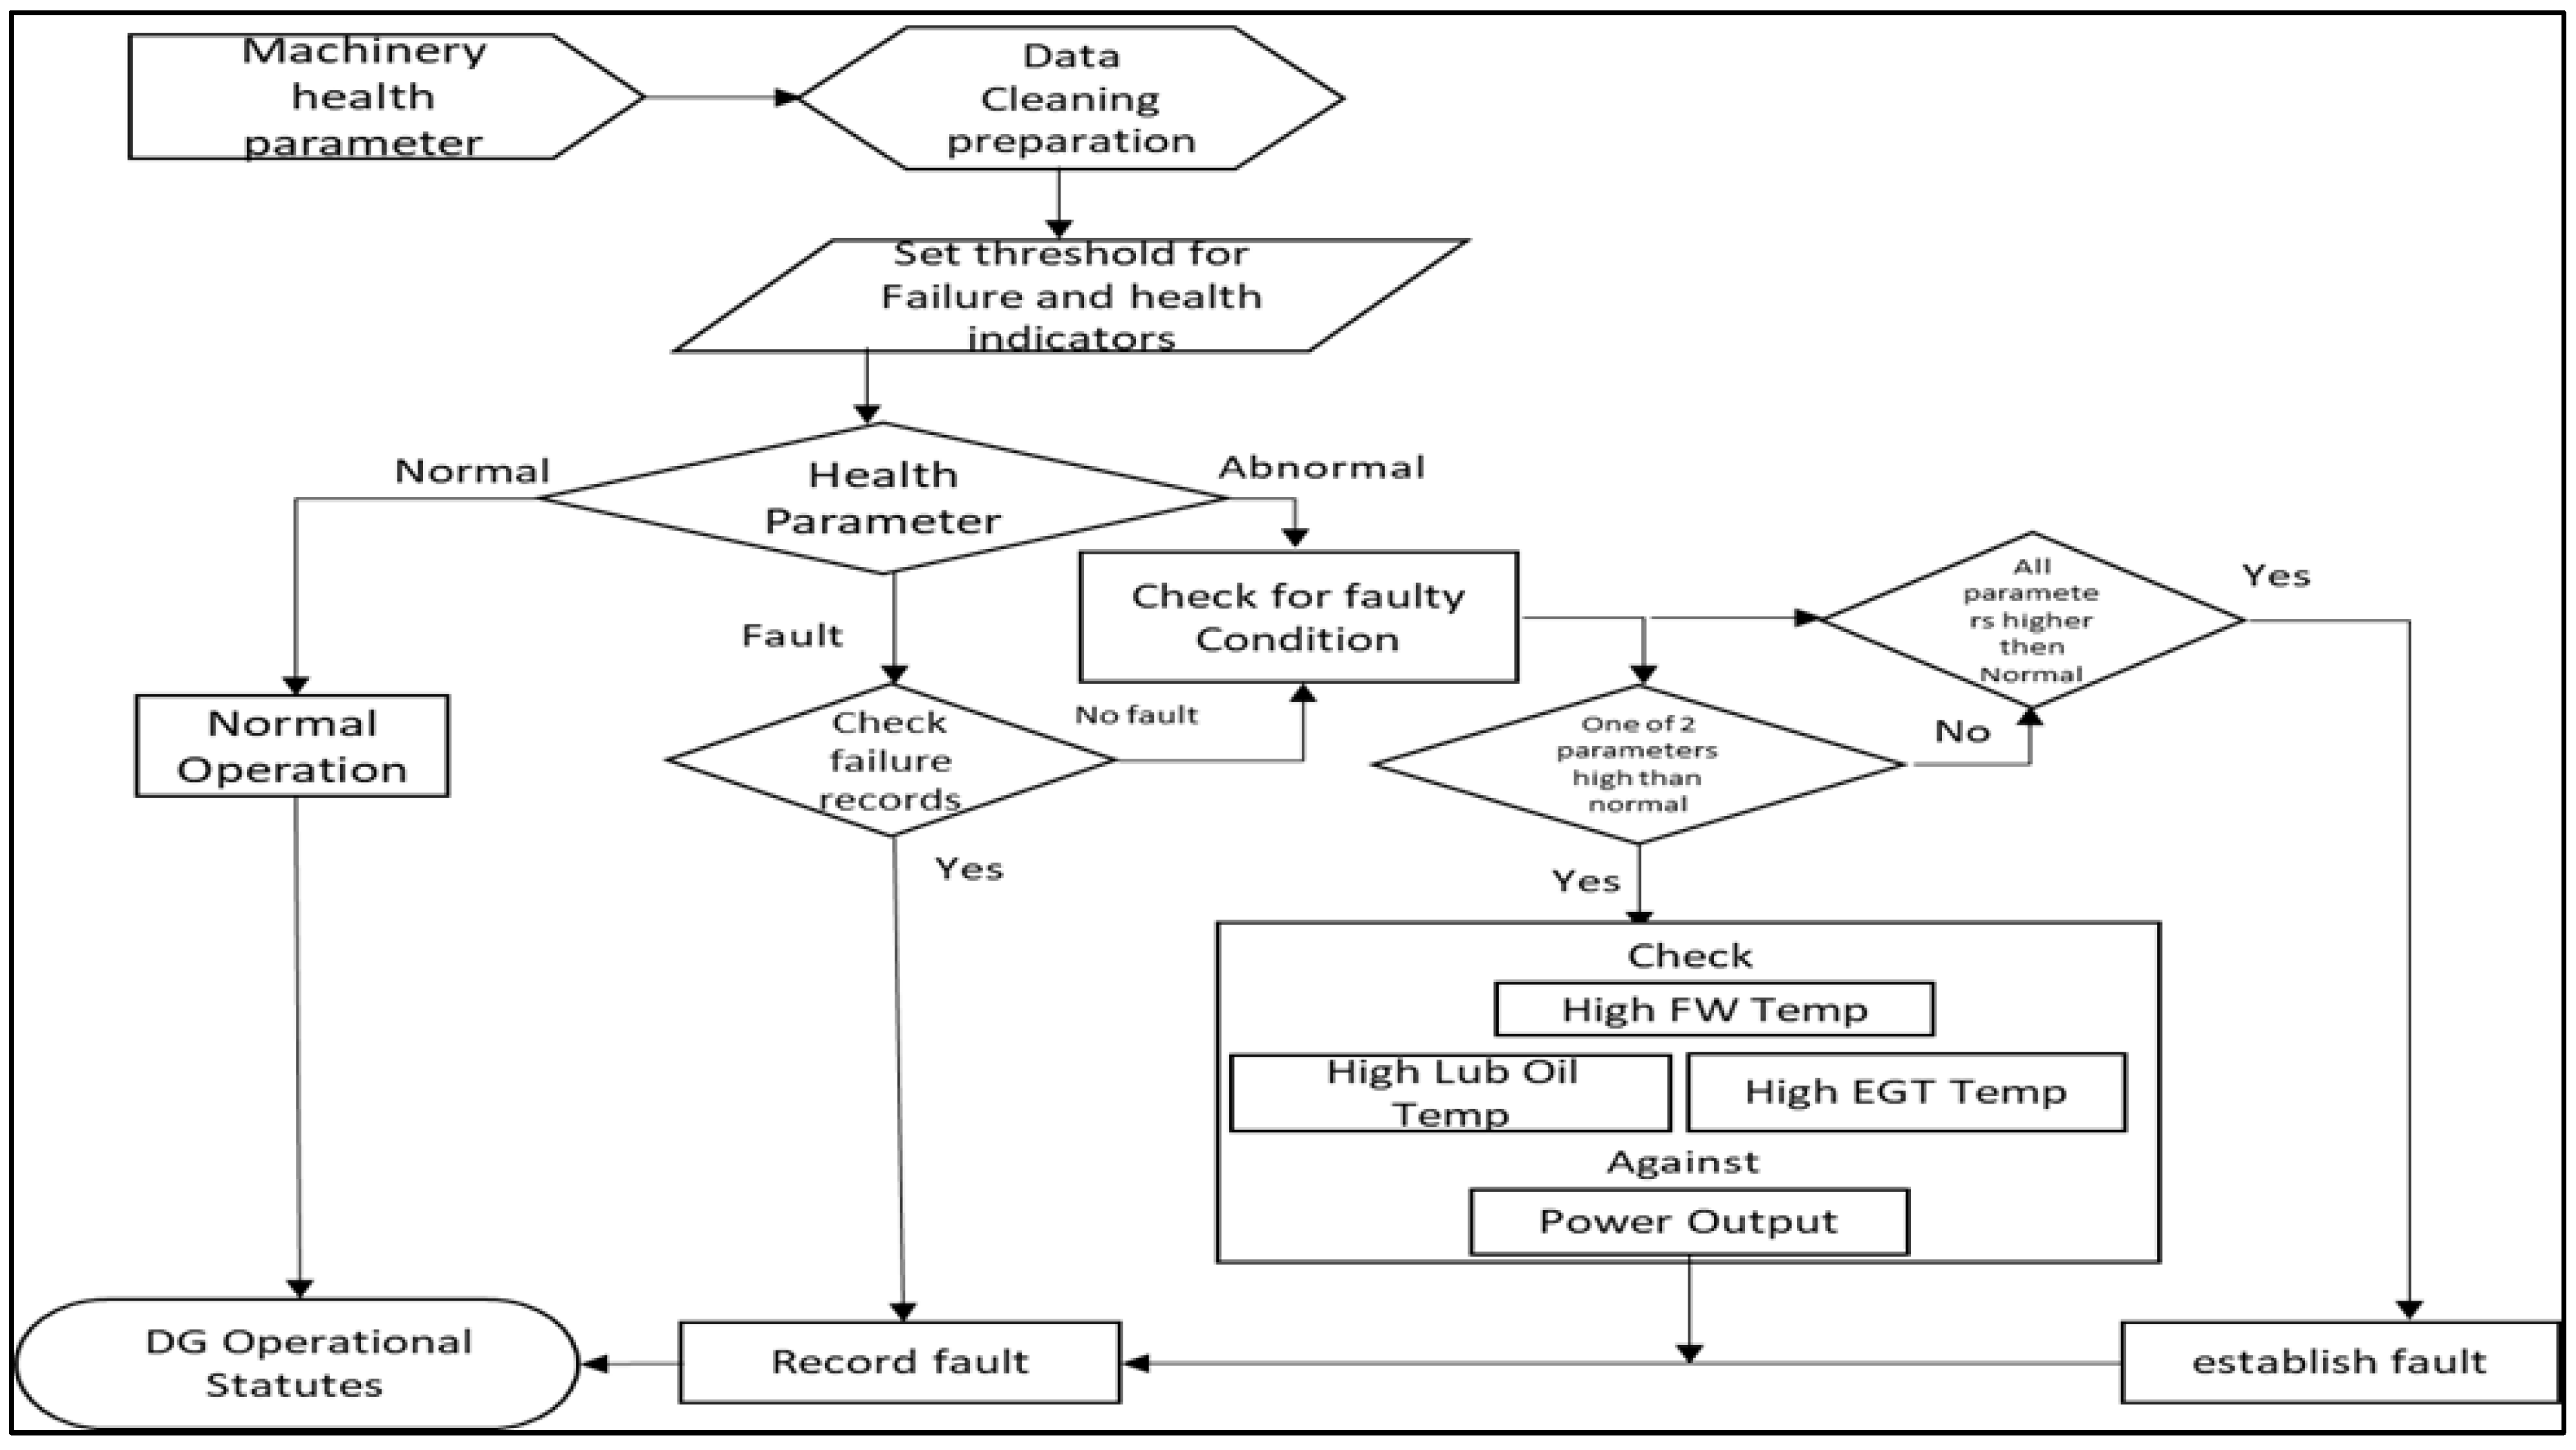
Figure 4.
DFTA model of the PGS.
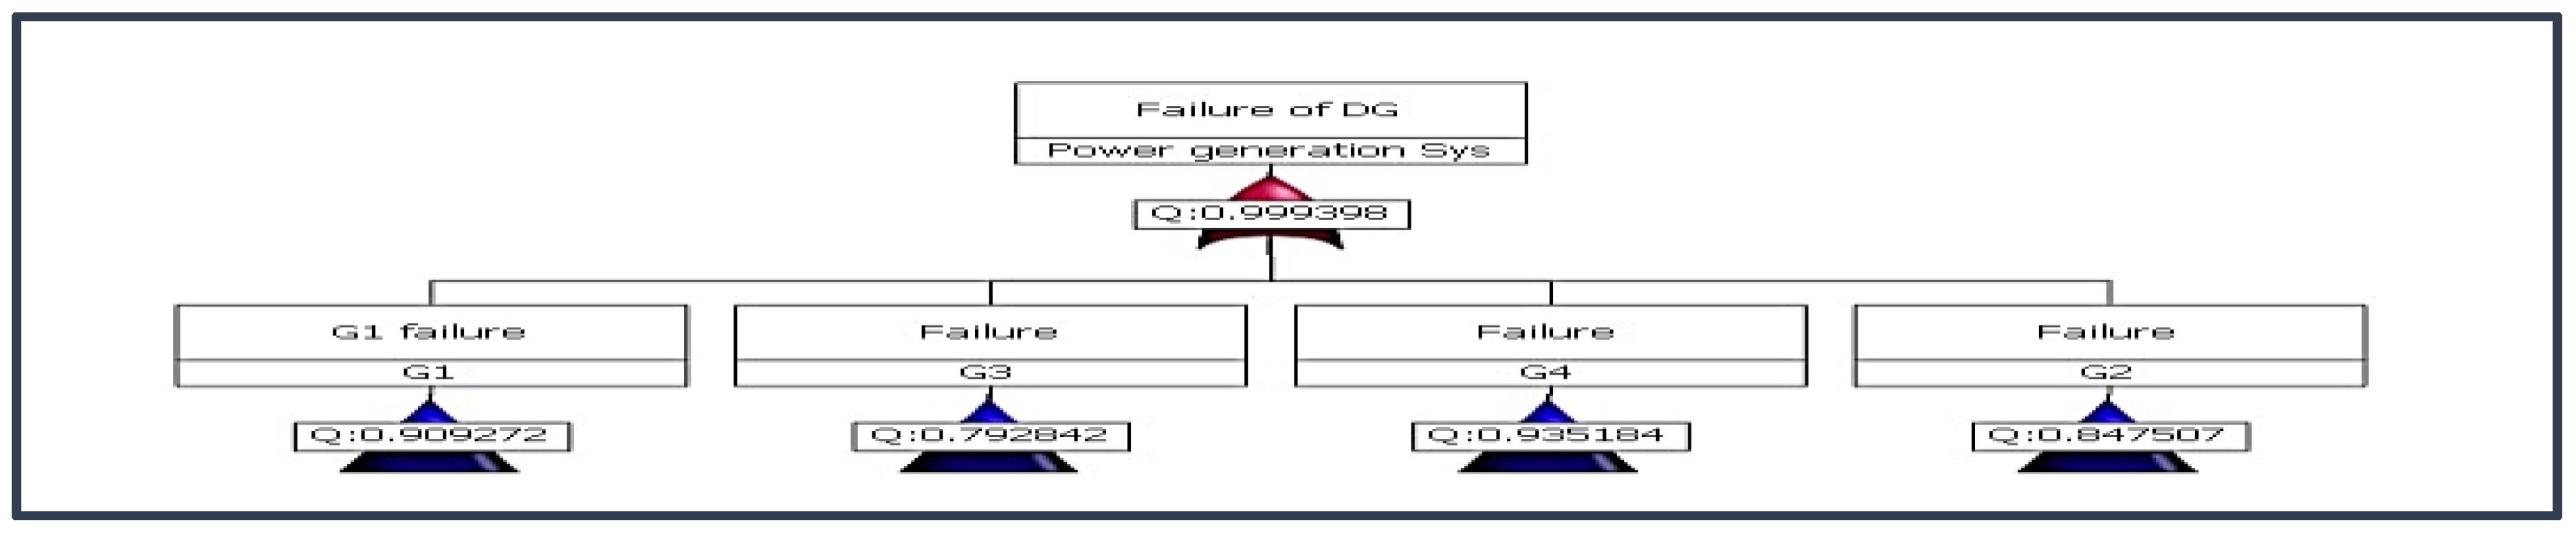
Figure 5.
Subsystem DFTA model for MDG.
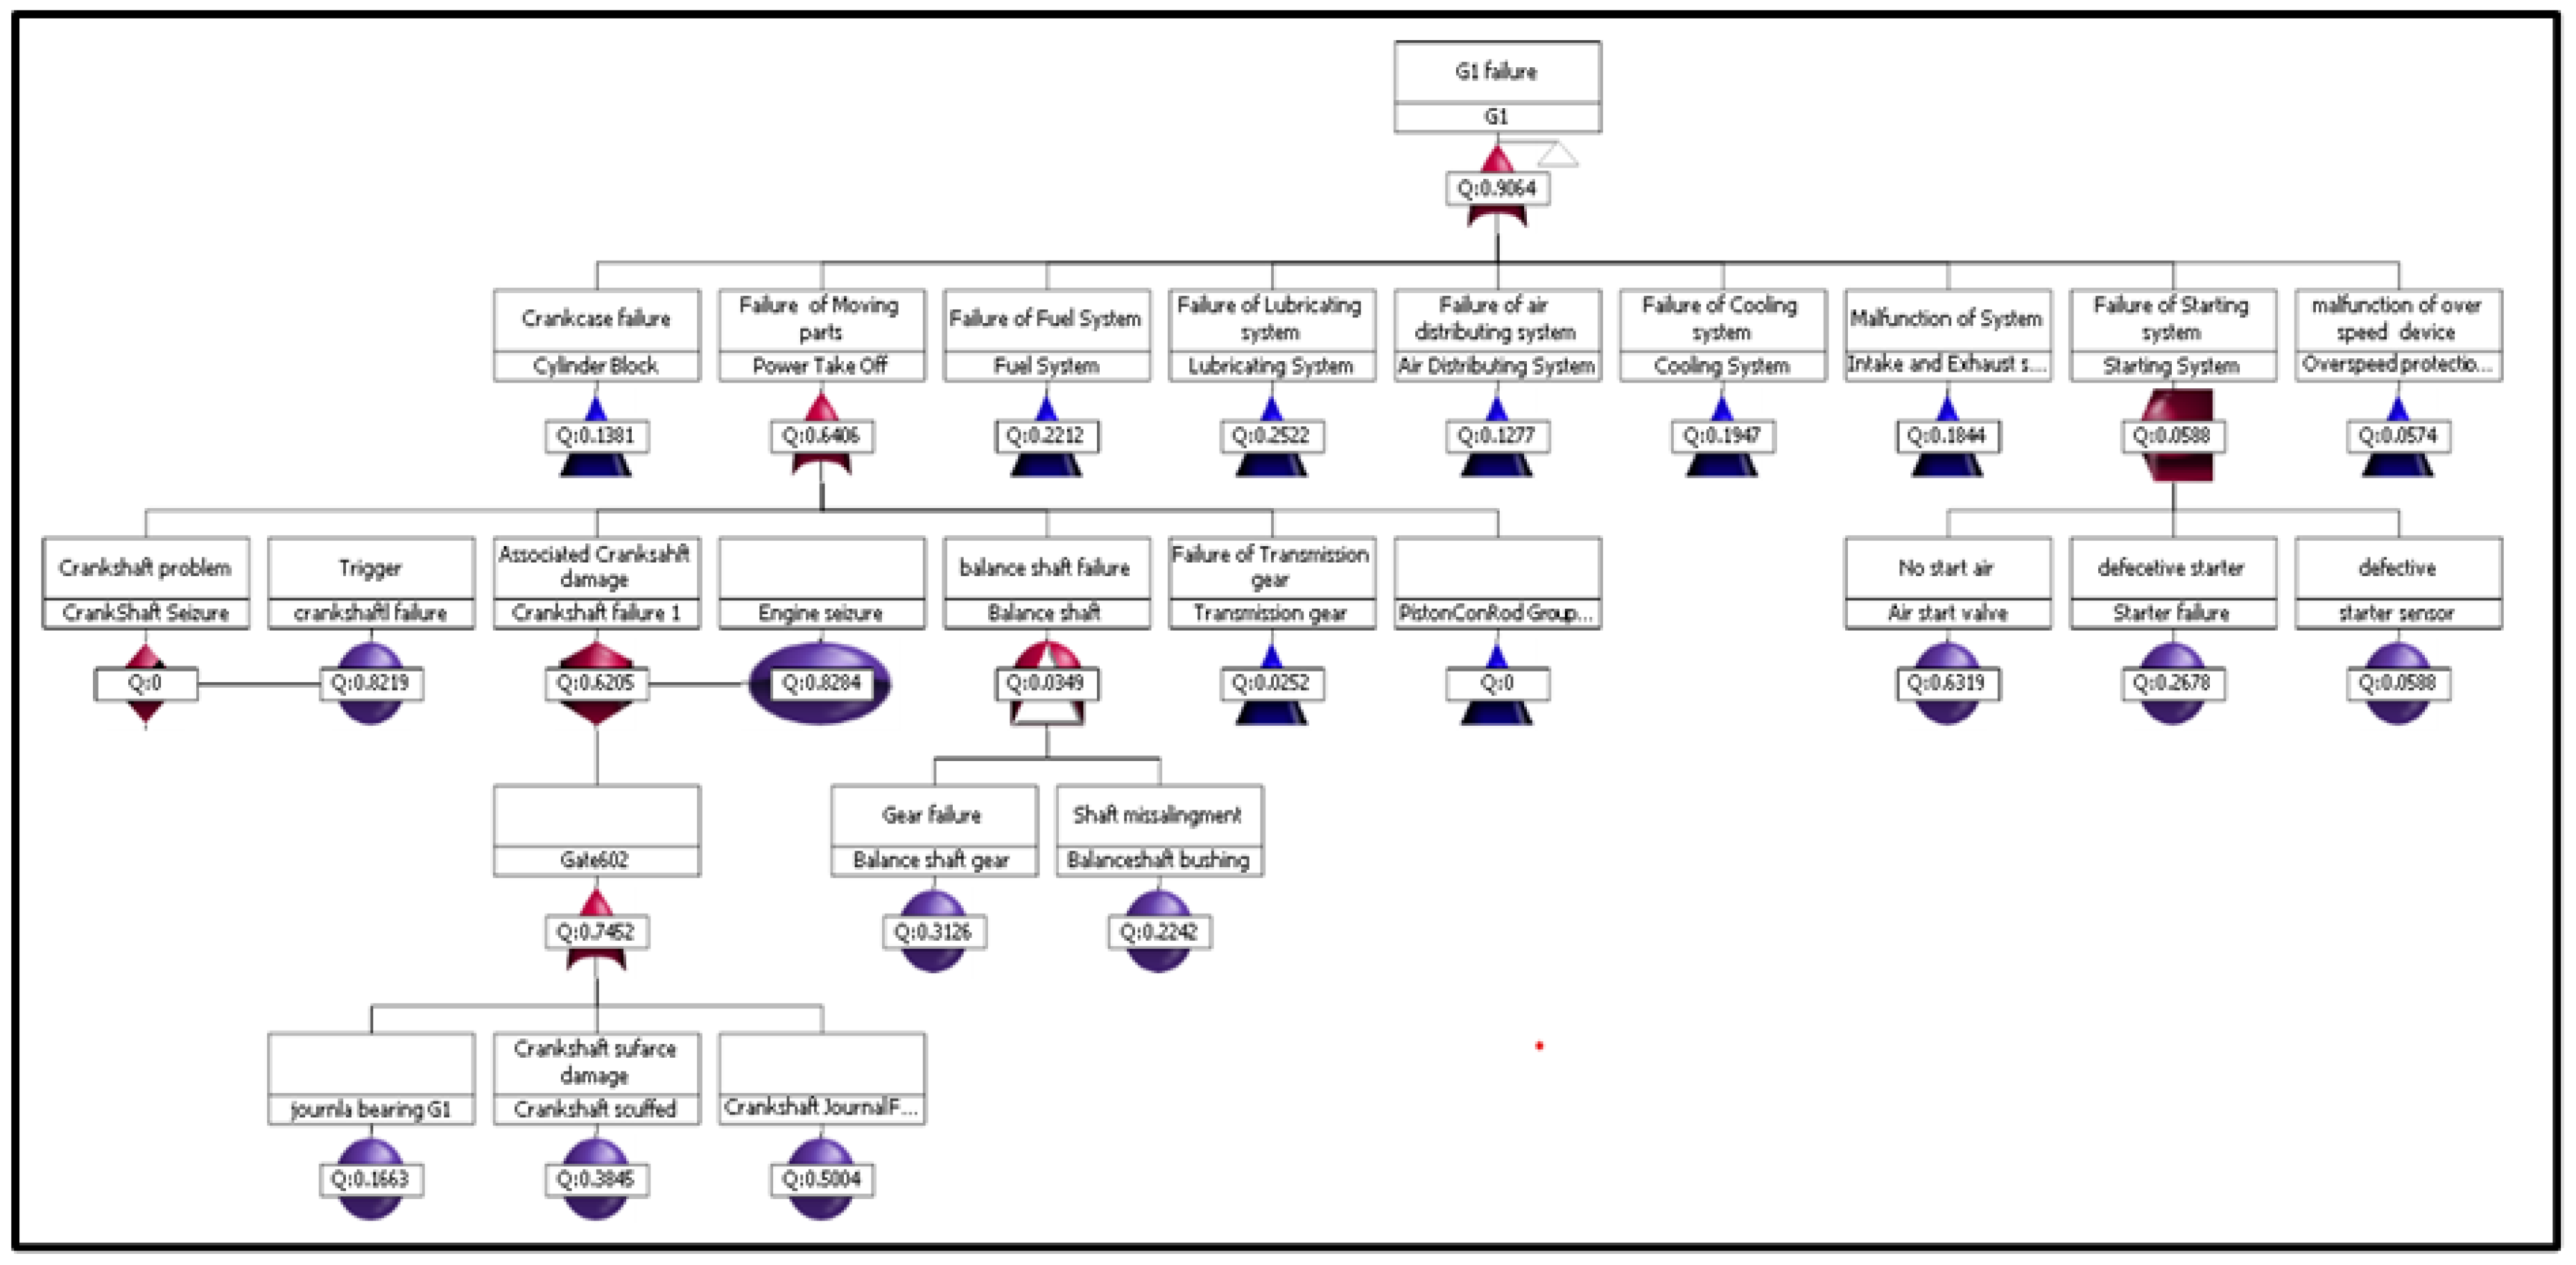
Figure 6.
Overall Reliability of Power Generation System.
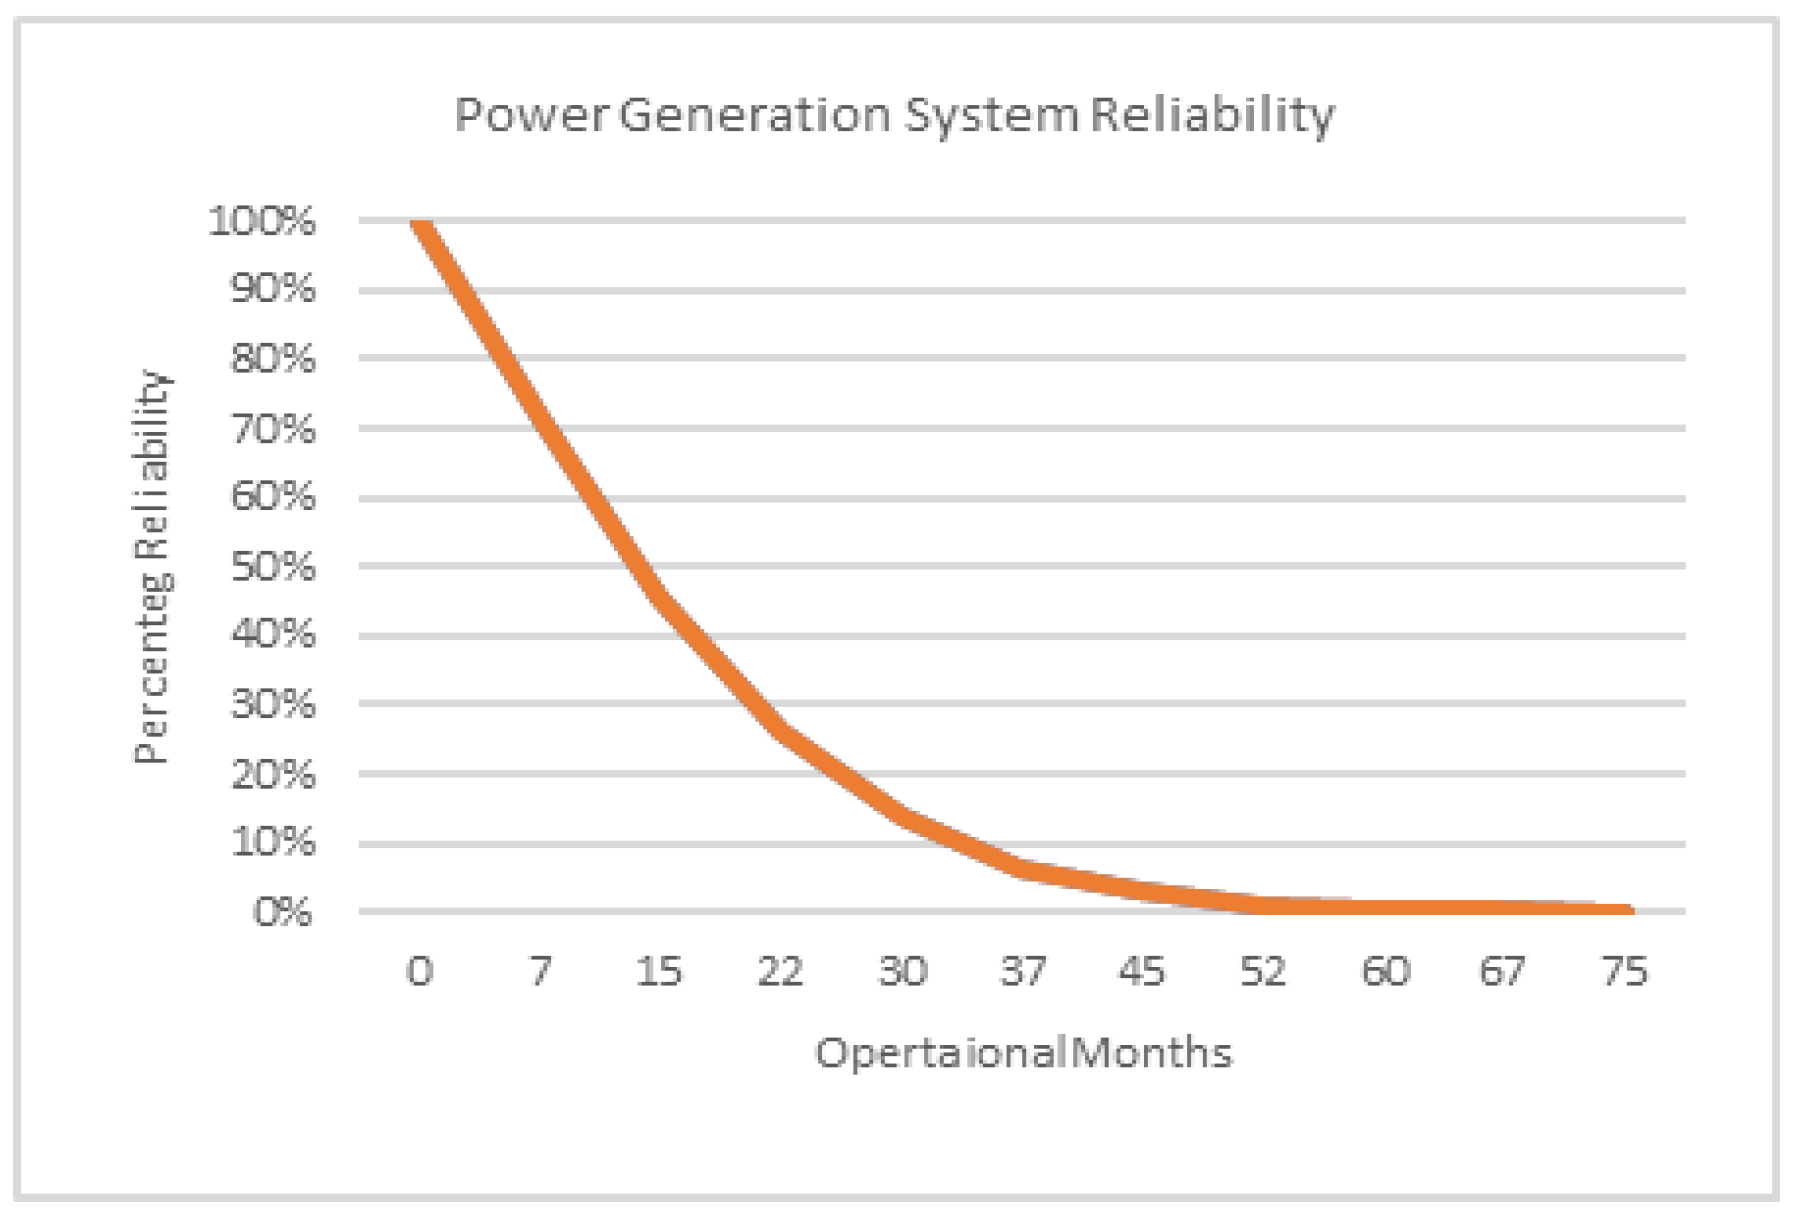
Figure 7.
Summary of individual MDG Reliability.
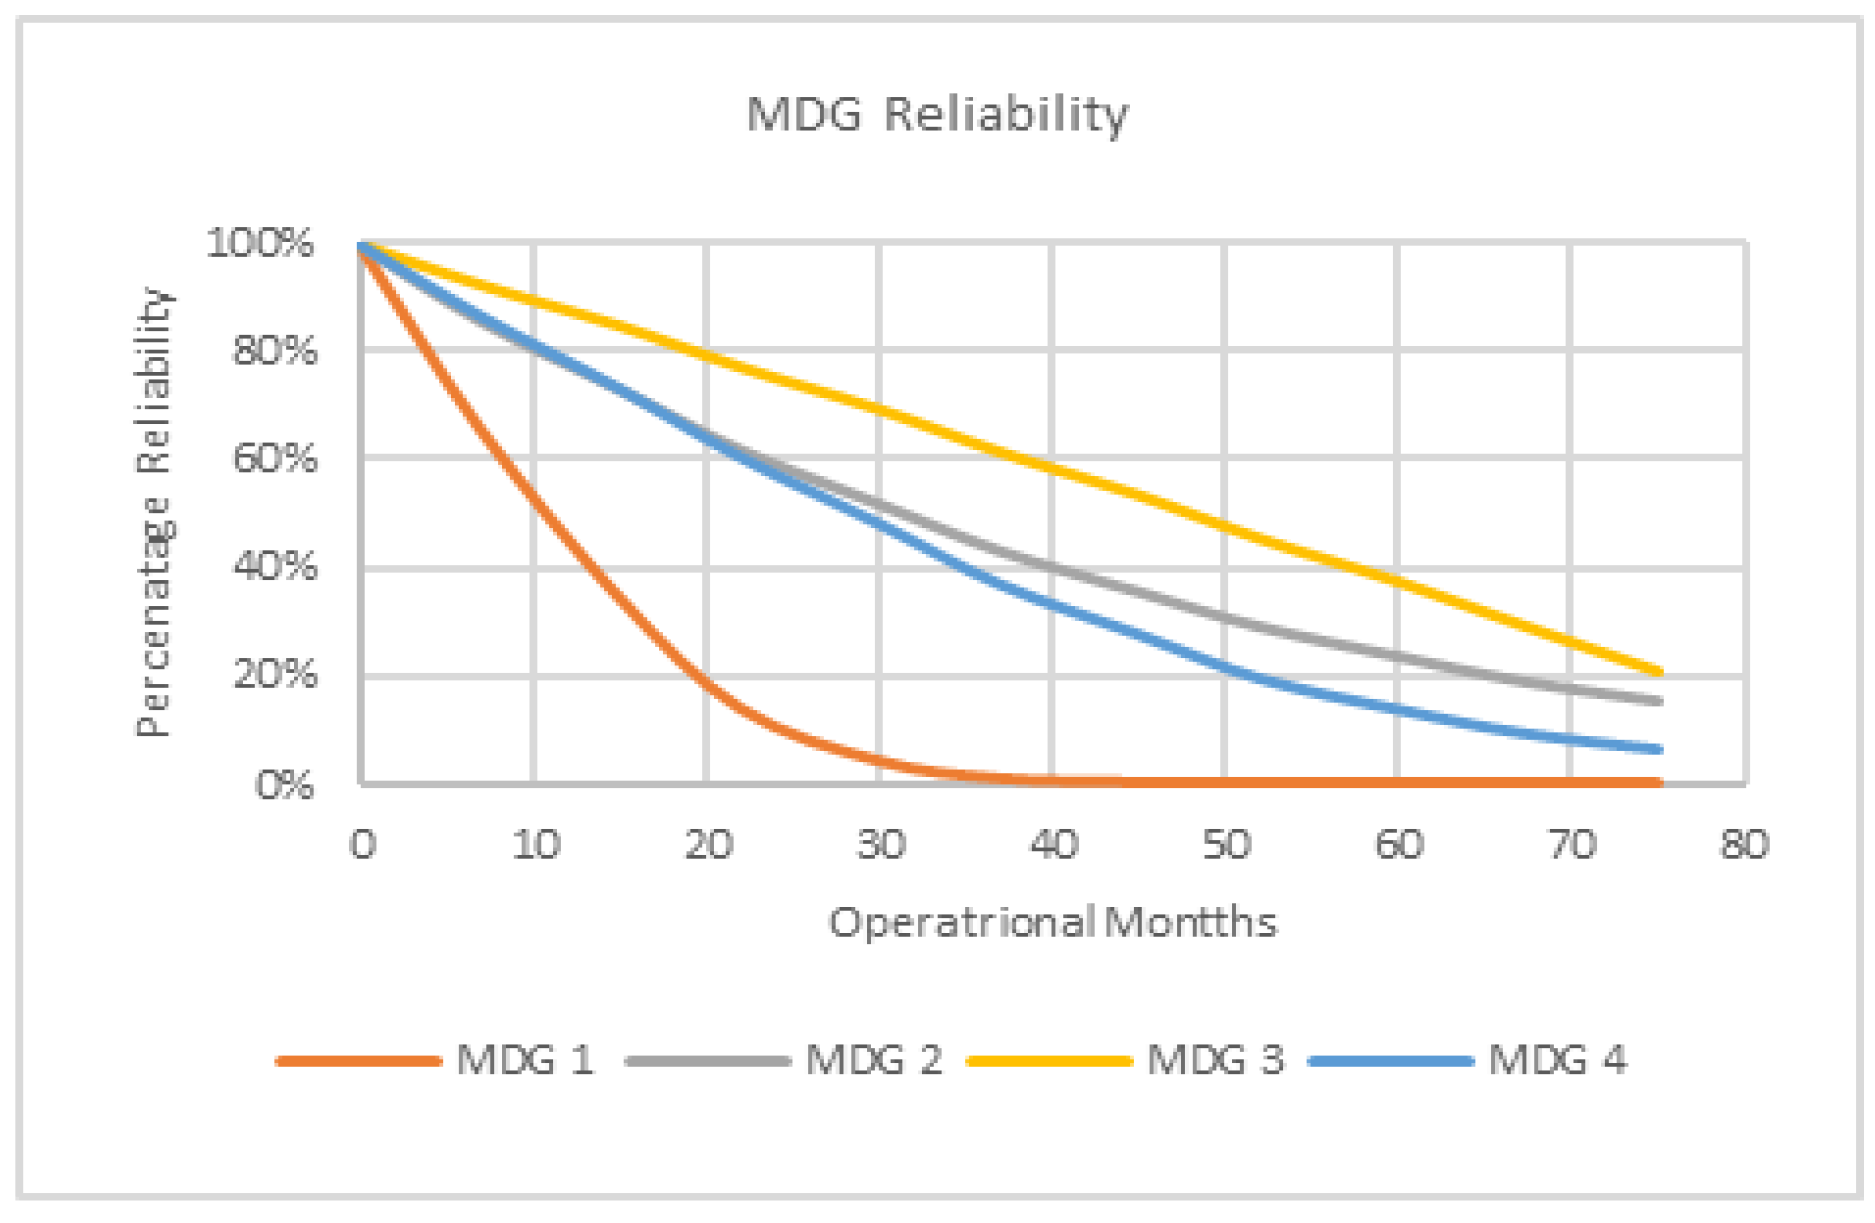
Figure 8.
Critical Components common to all MGDs.
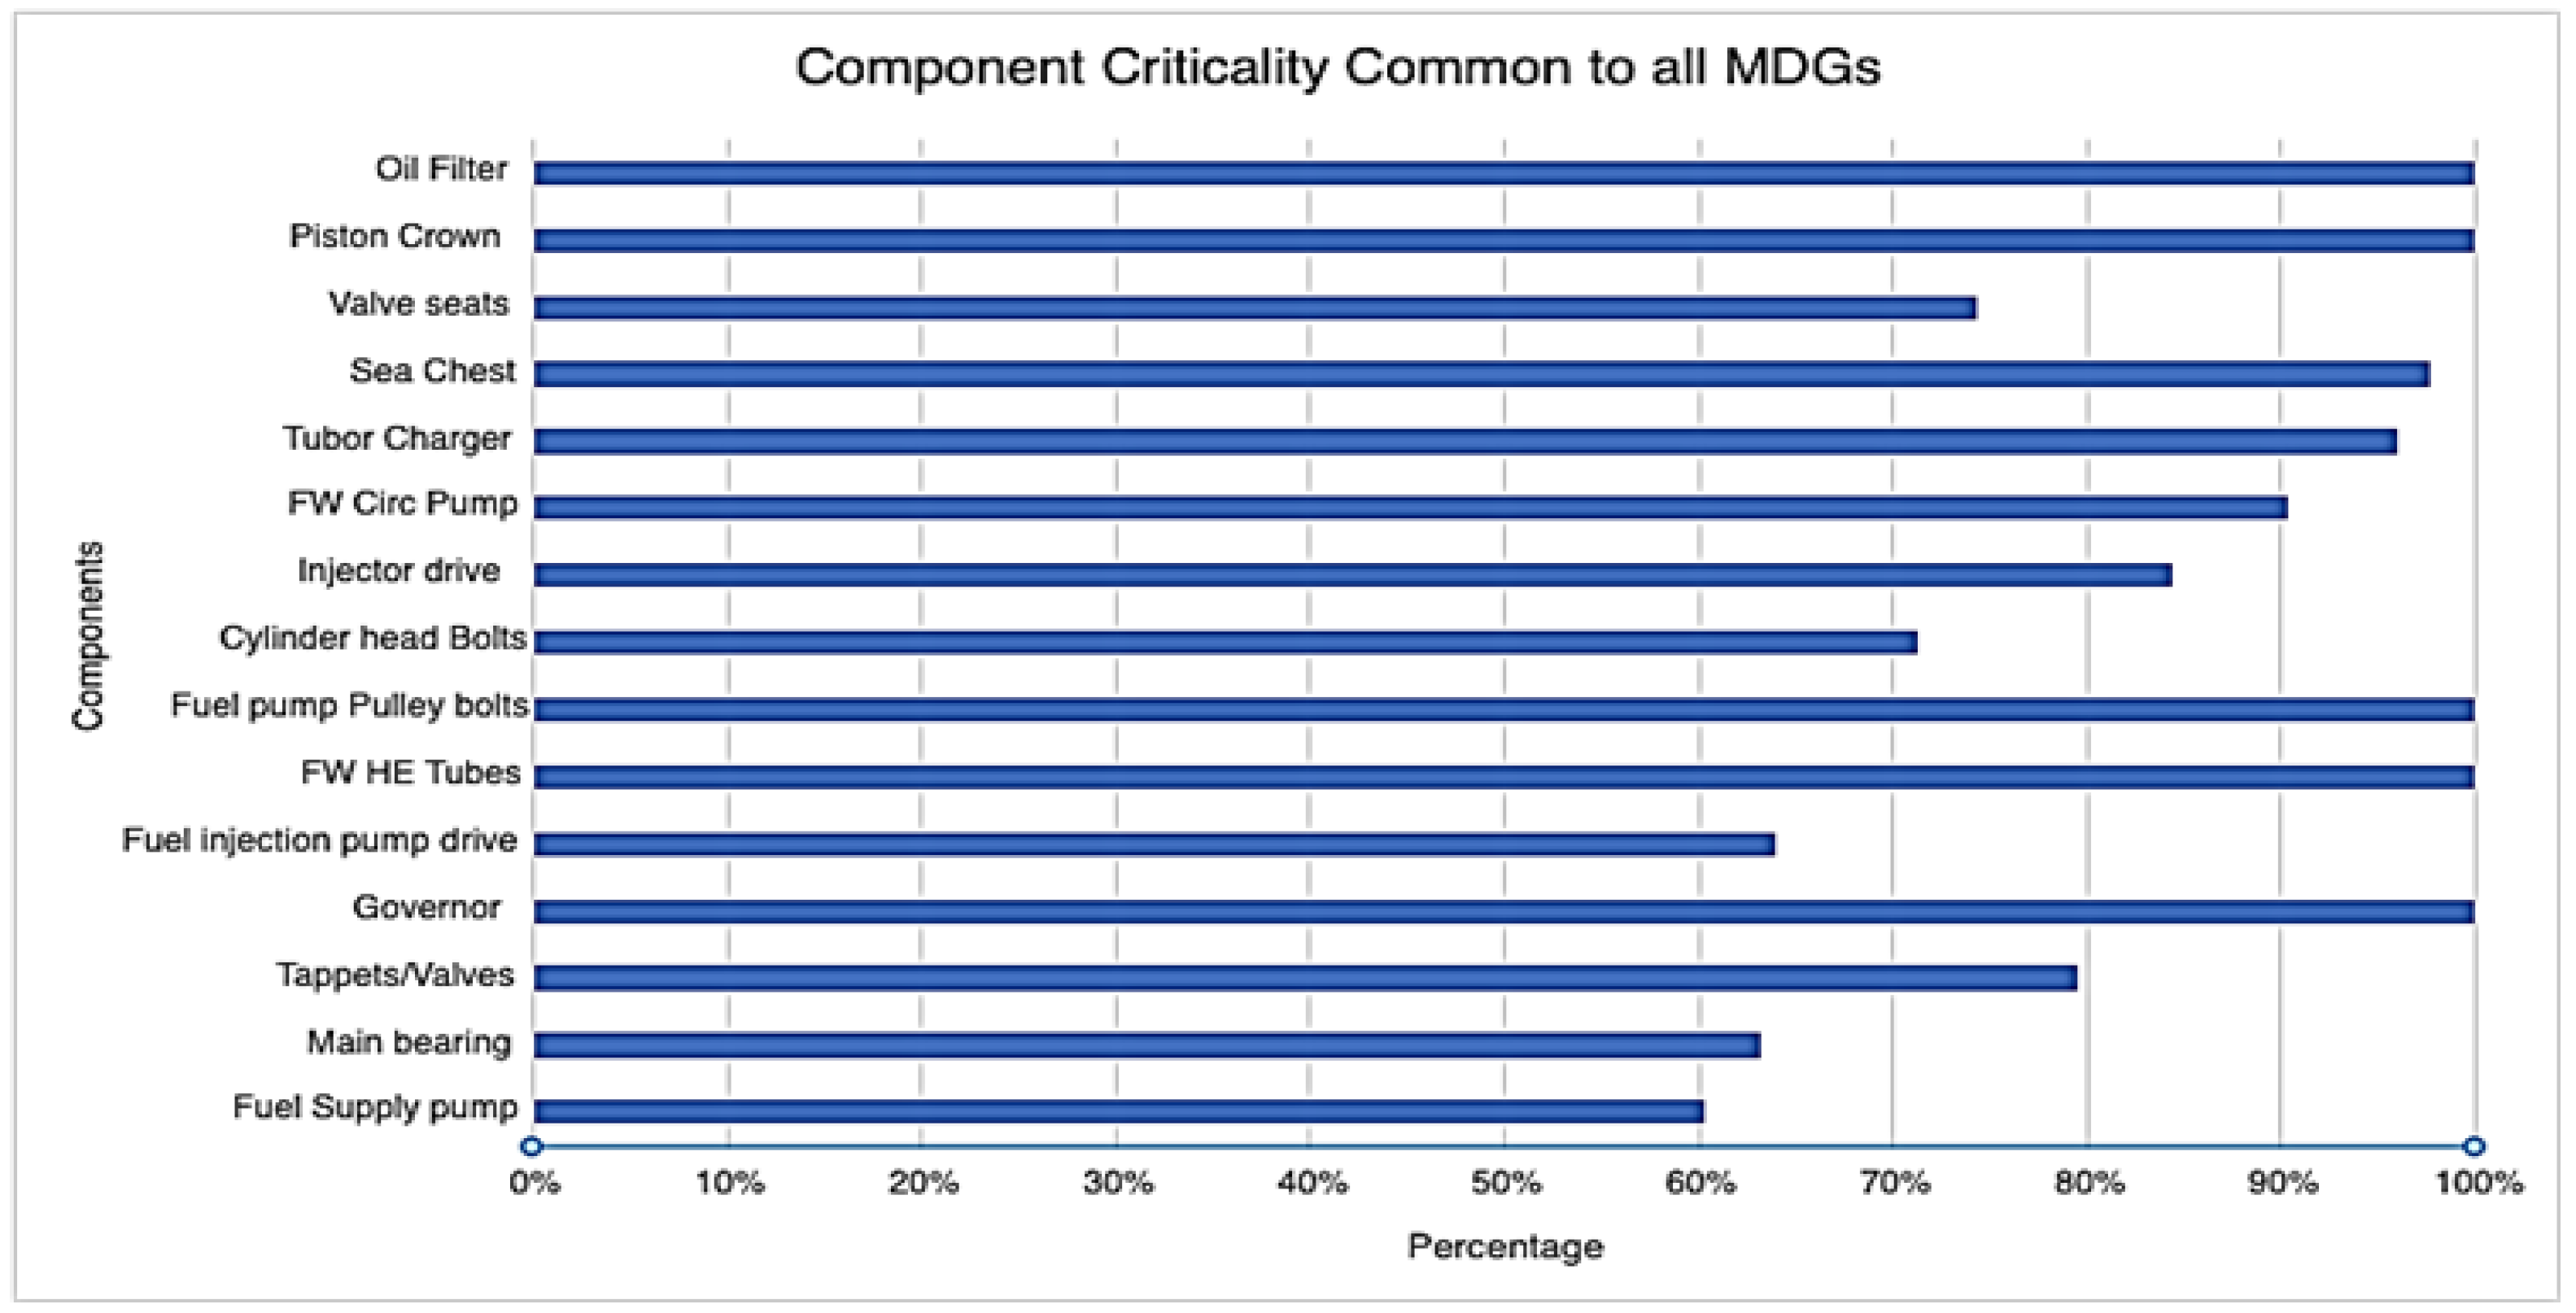
Figure 9.
Trained model performance.
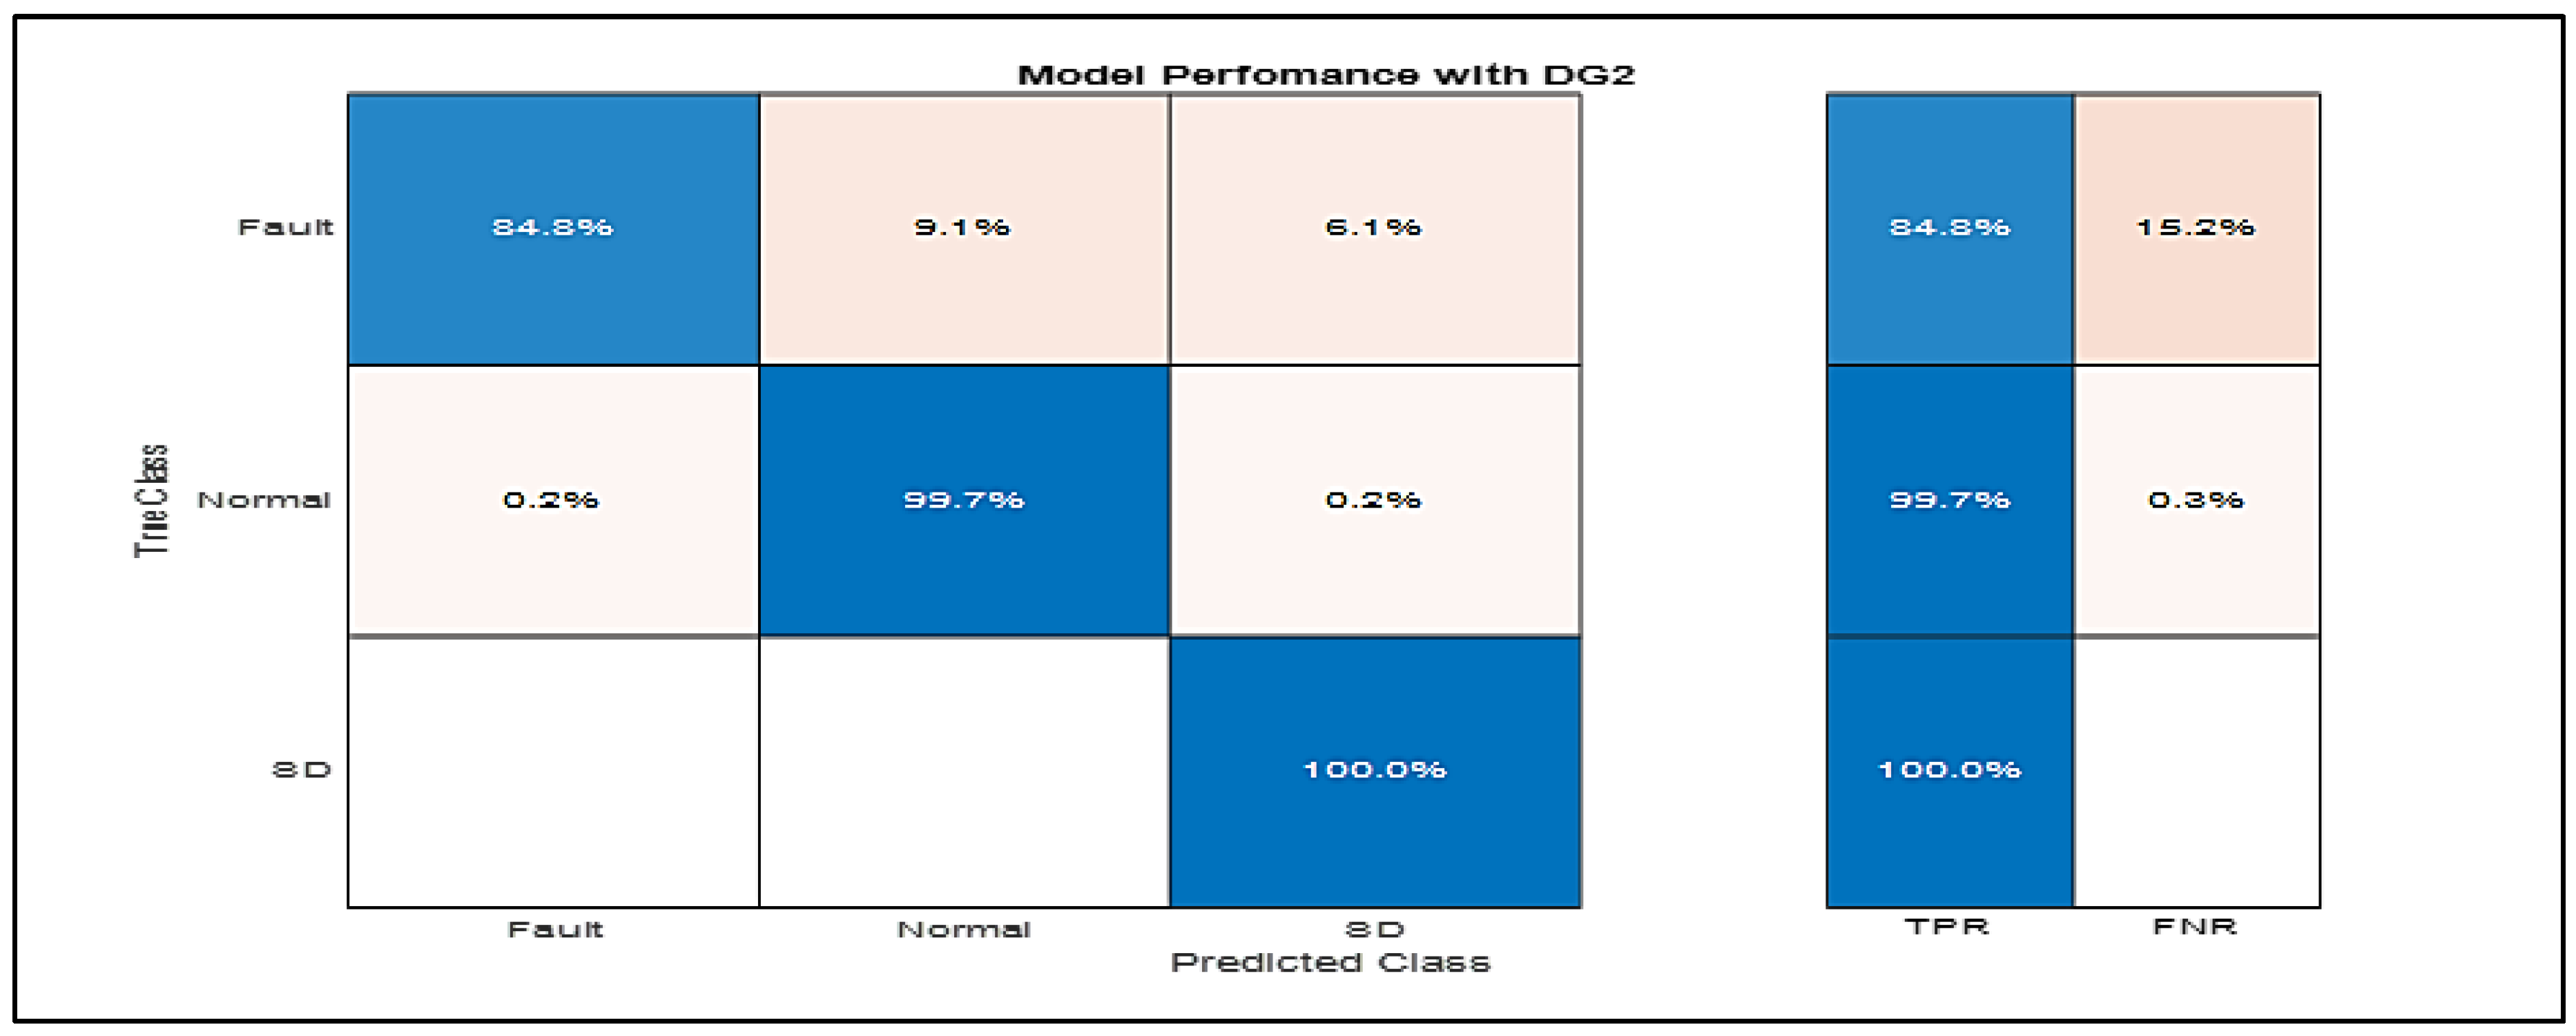
Figure 10.
Training Model.
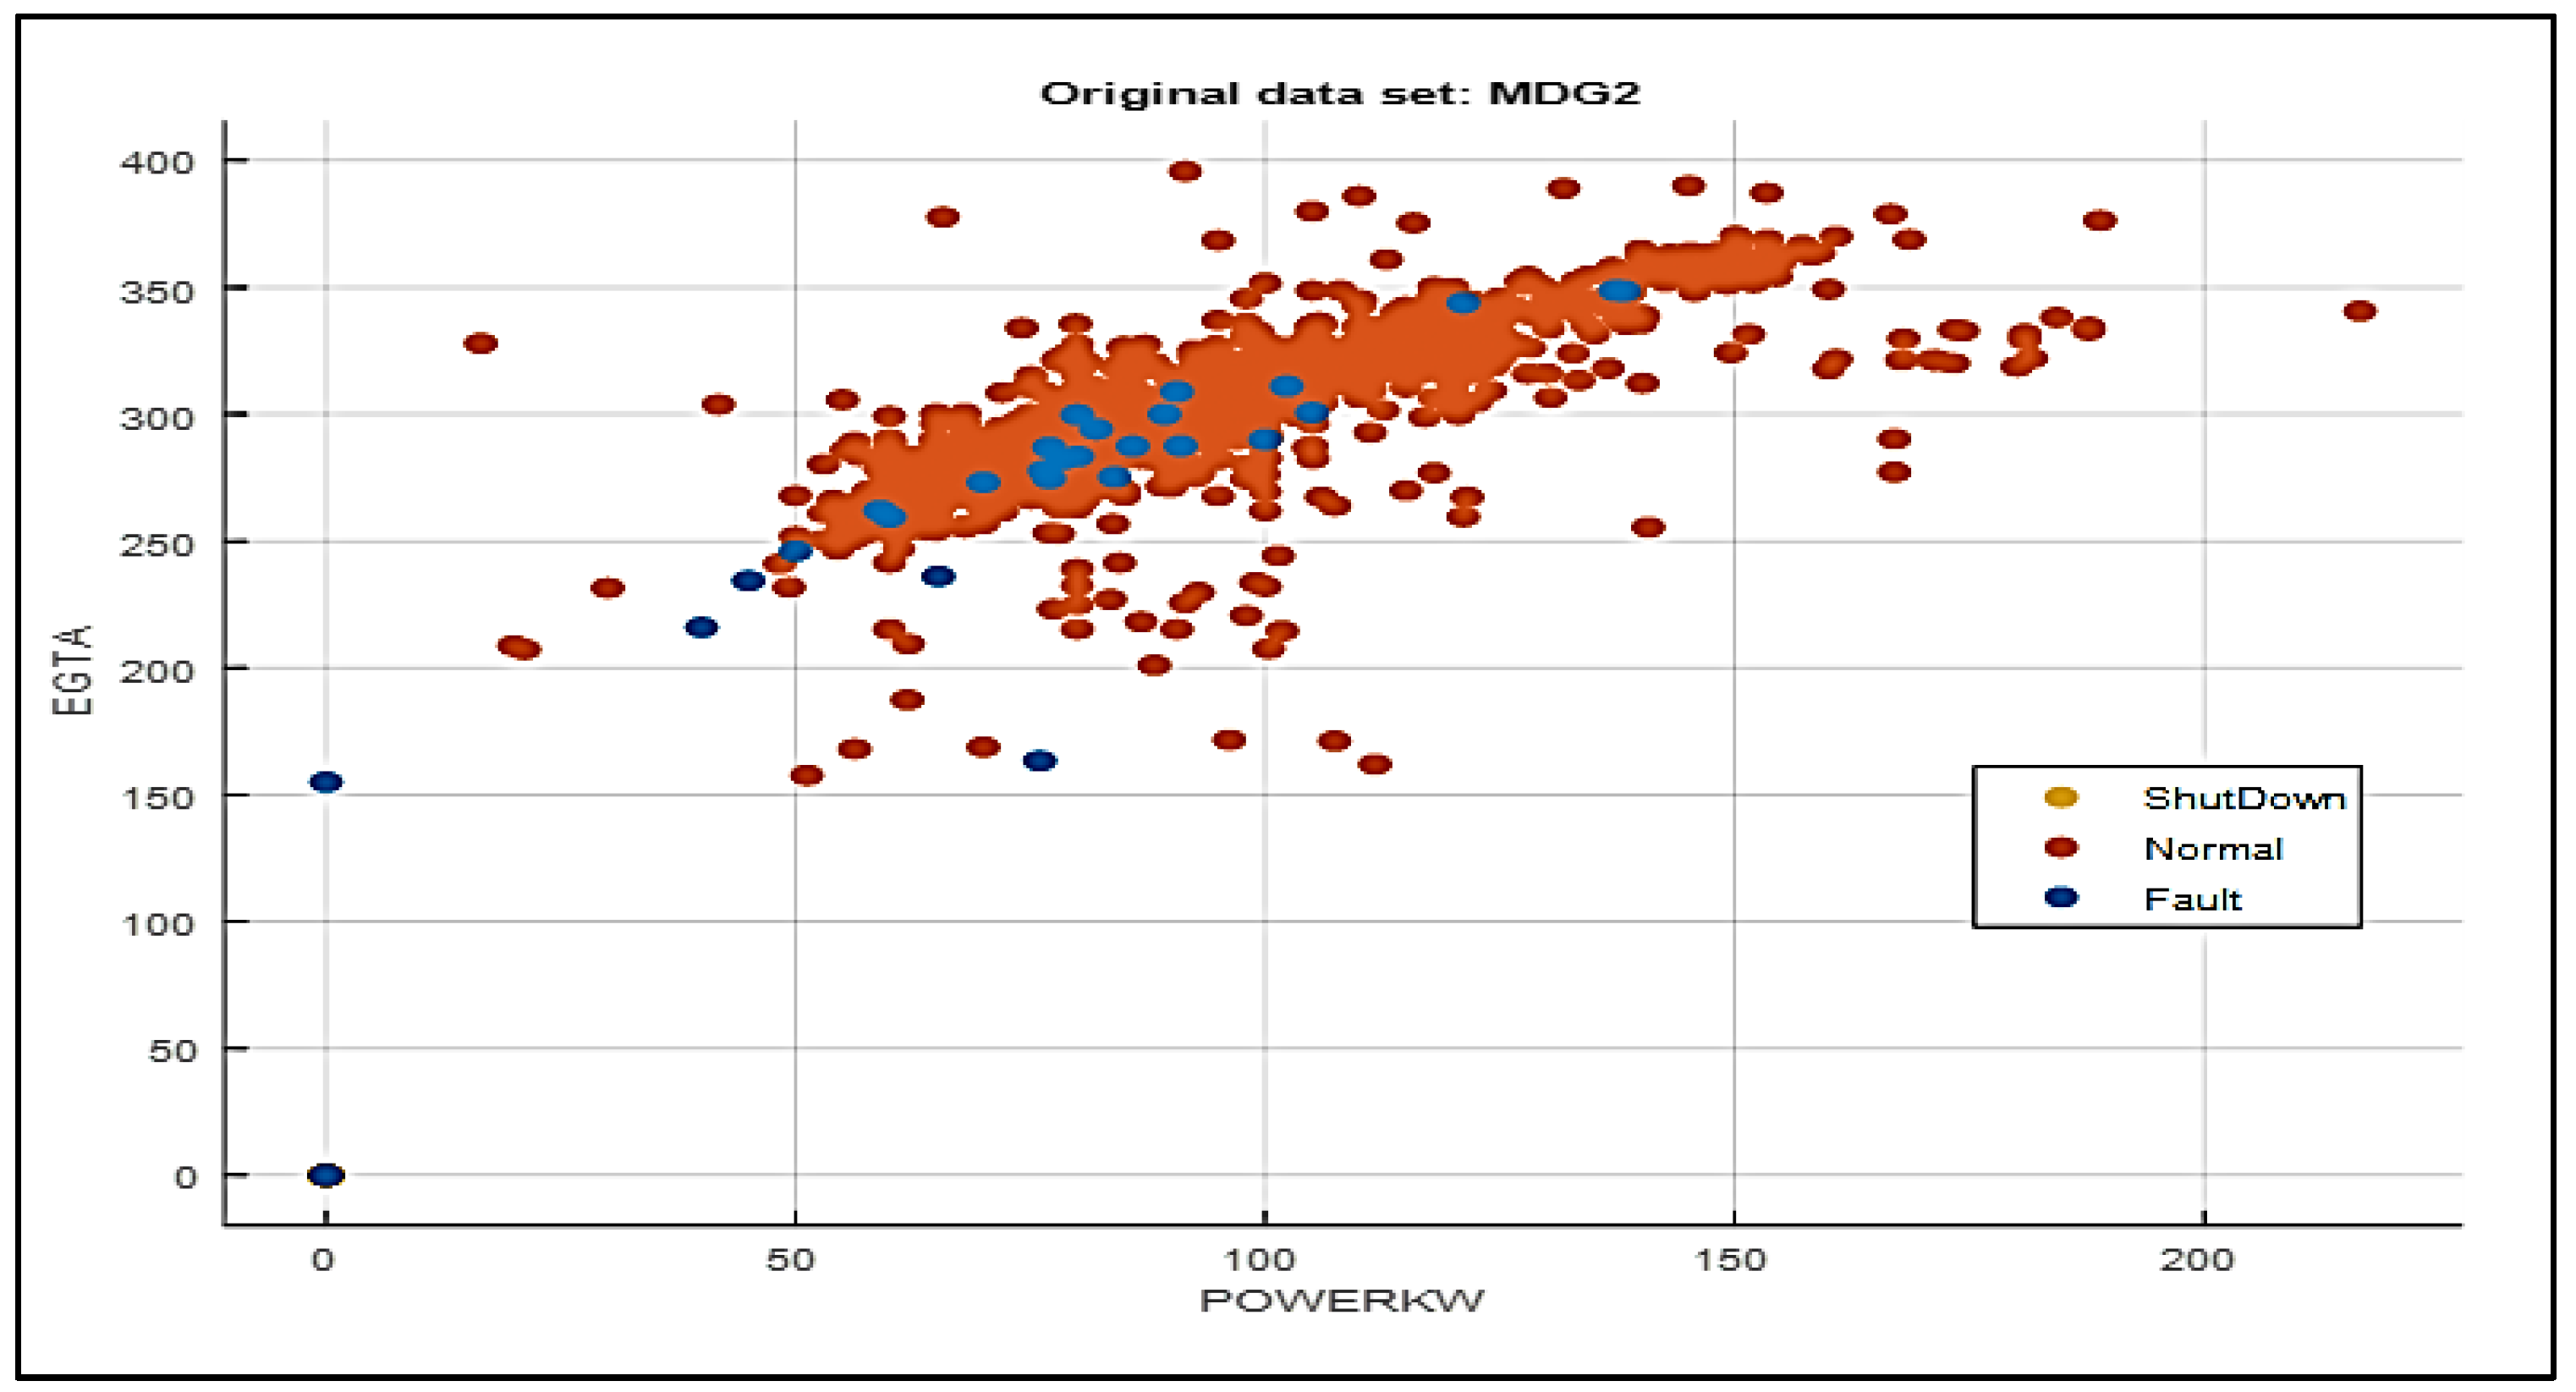
Figure 11.
Trained fault identification model with MDG4 data.
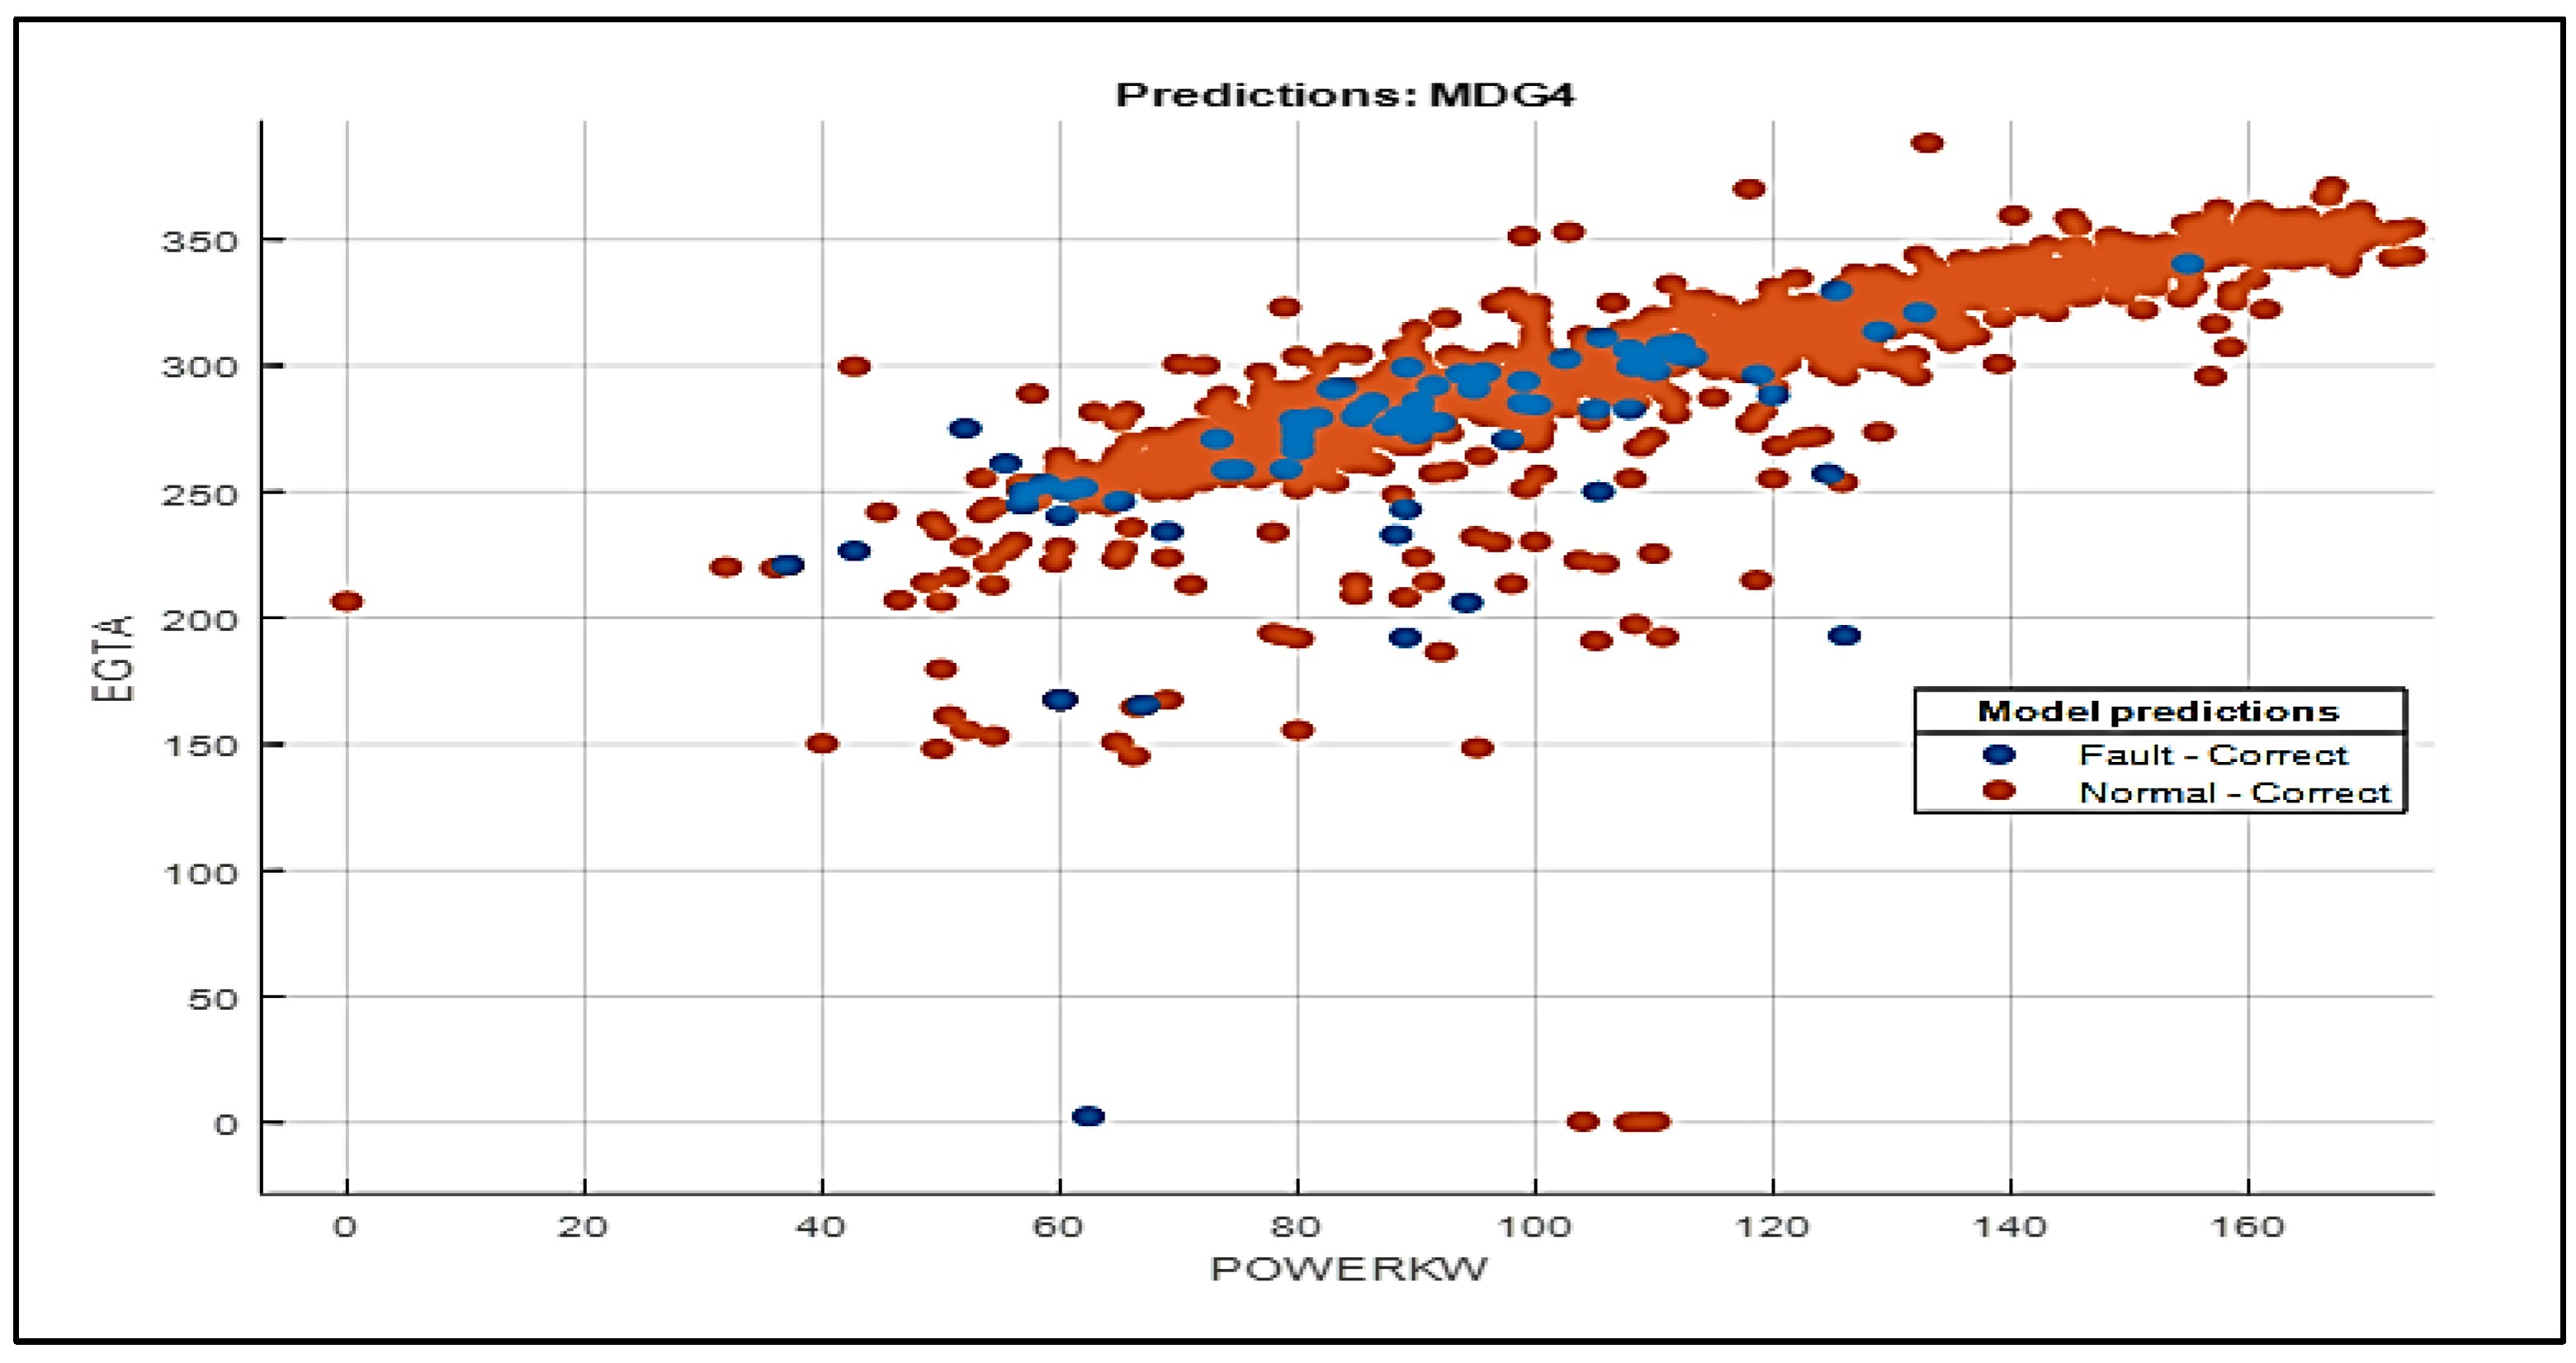
Figure 12.
Test Model accuracy.
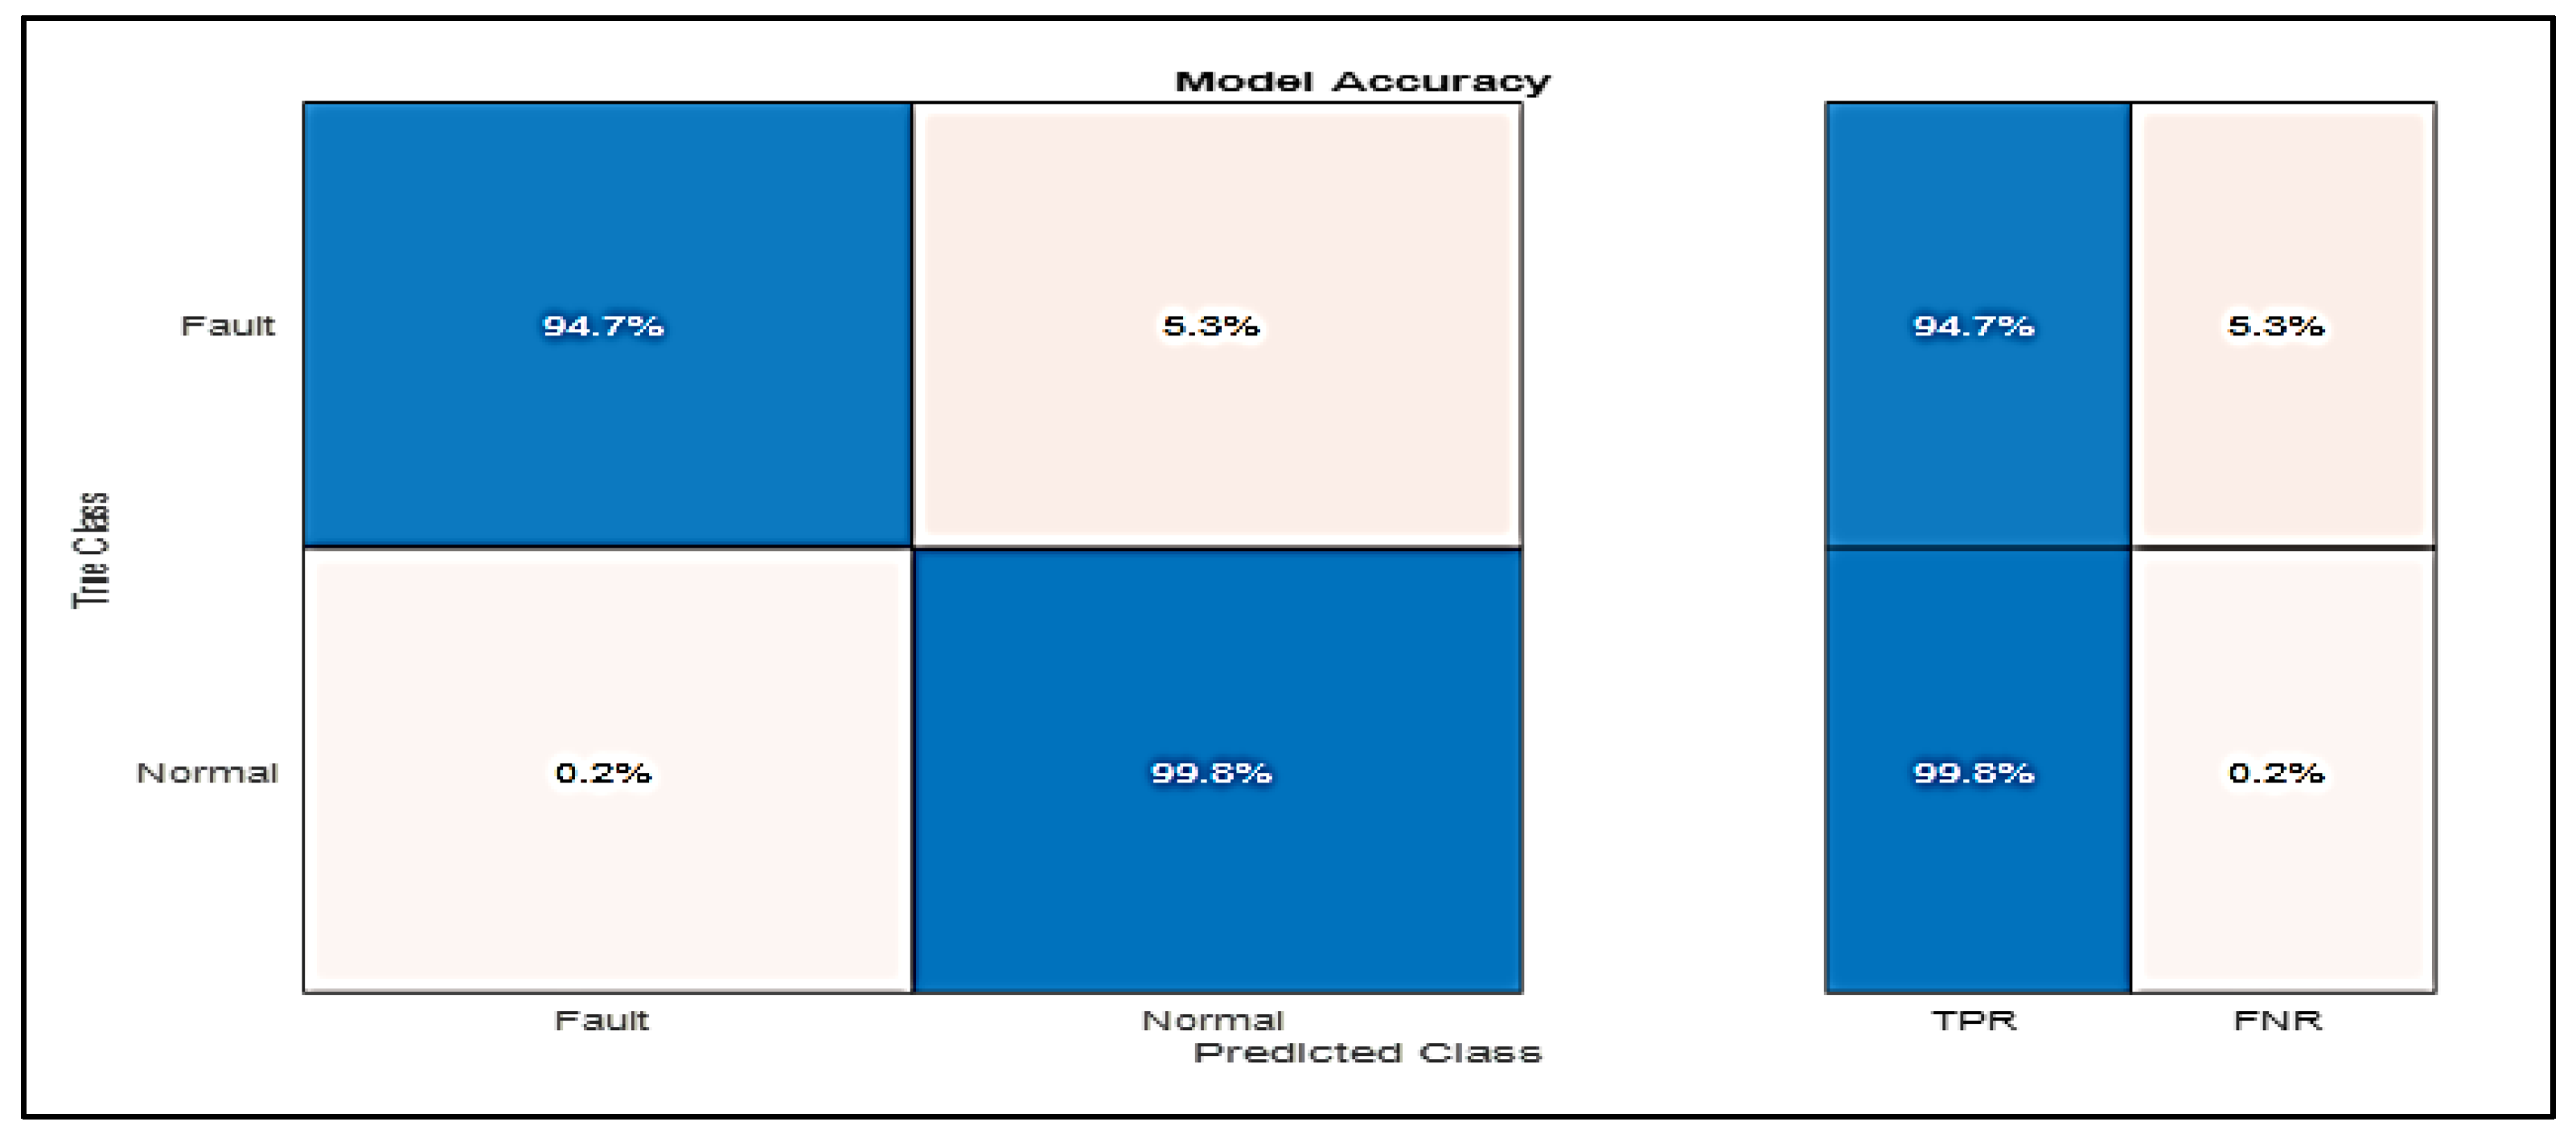
Figure 13.
Prediction using sample dataset of all MDGs.
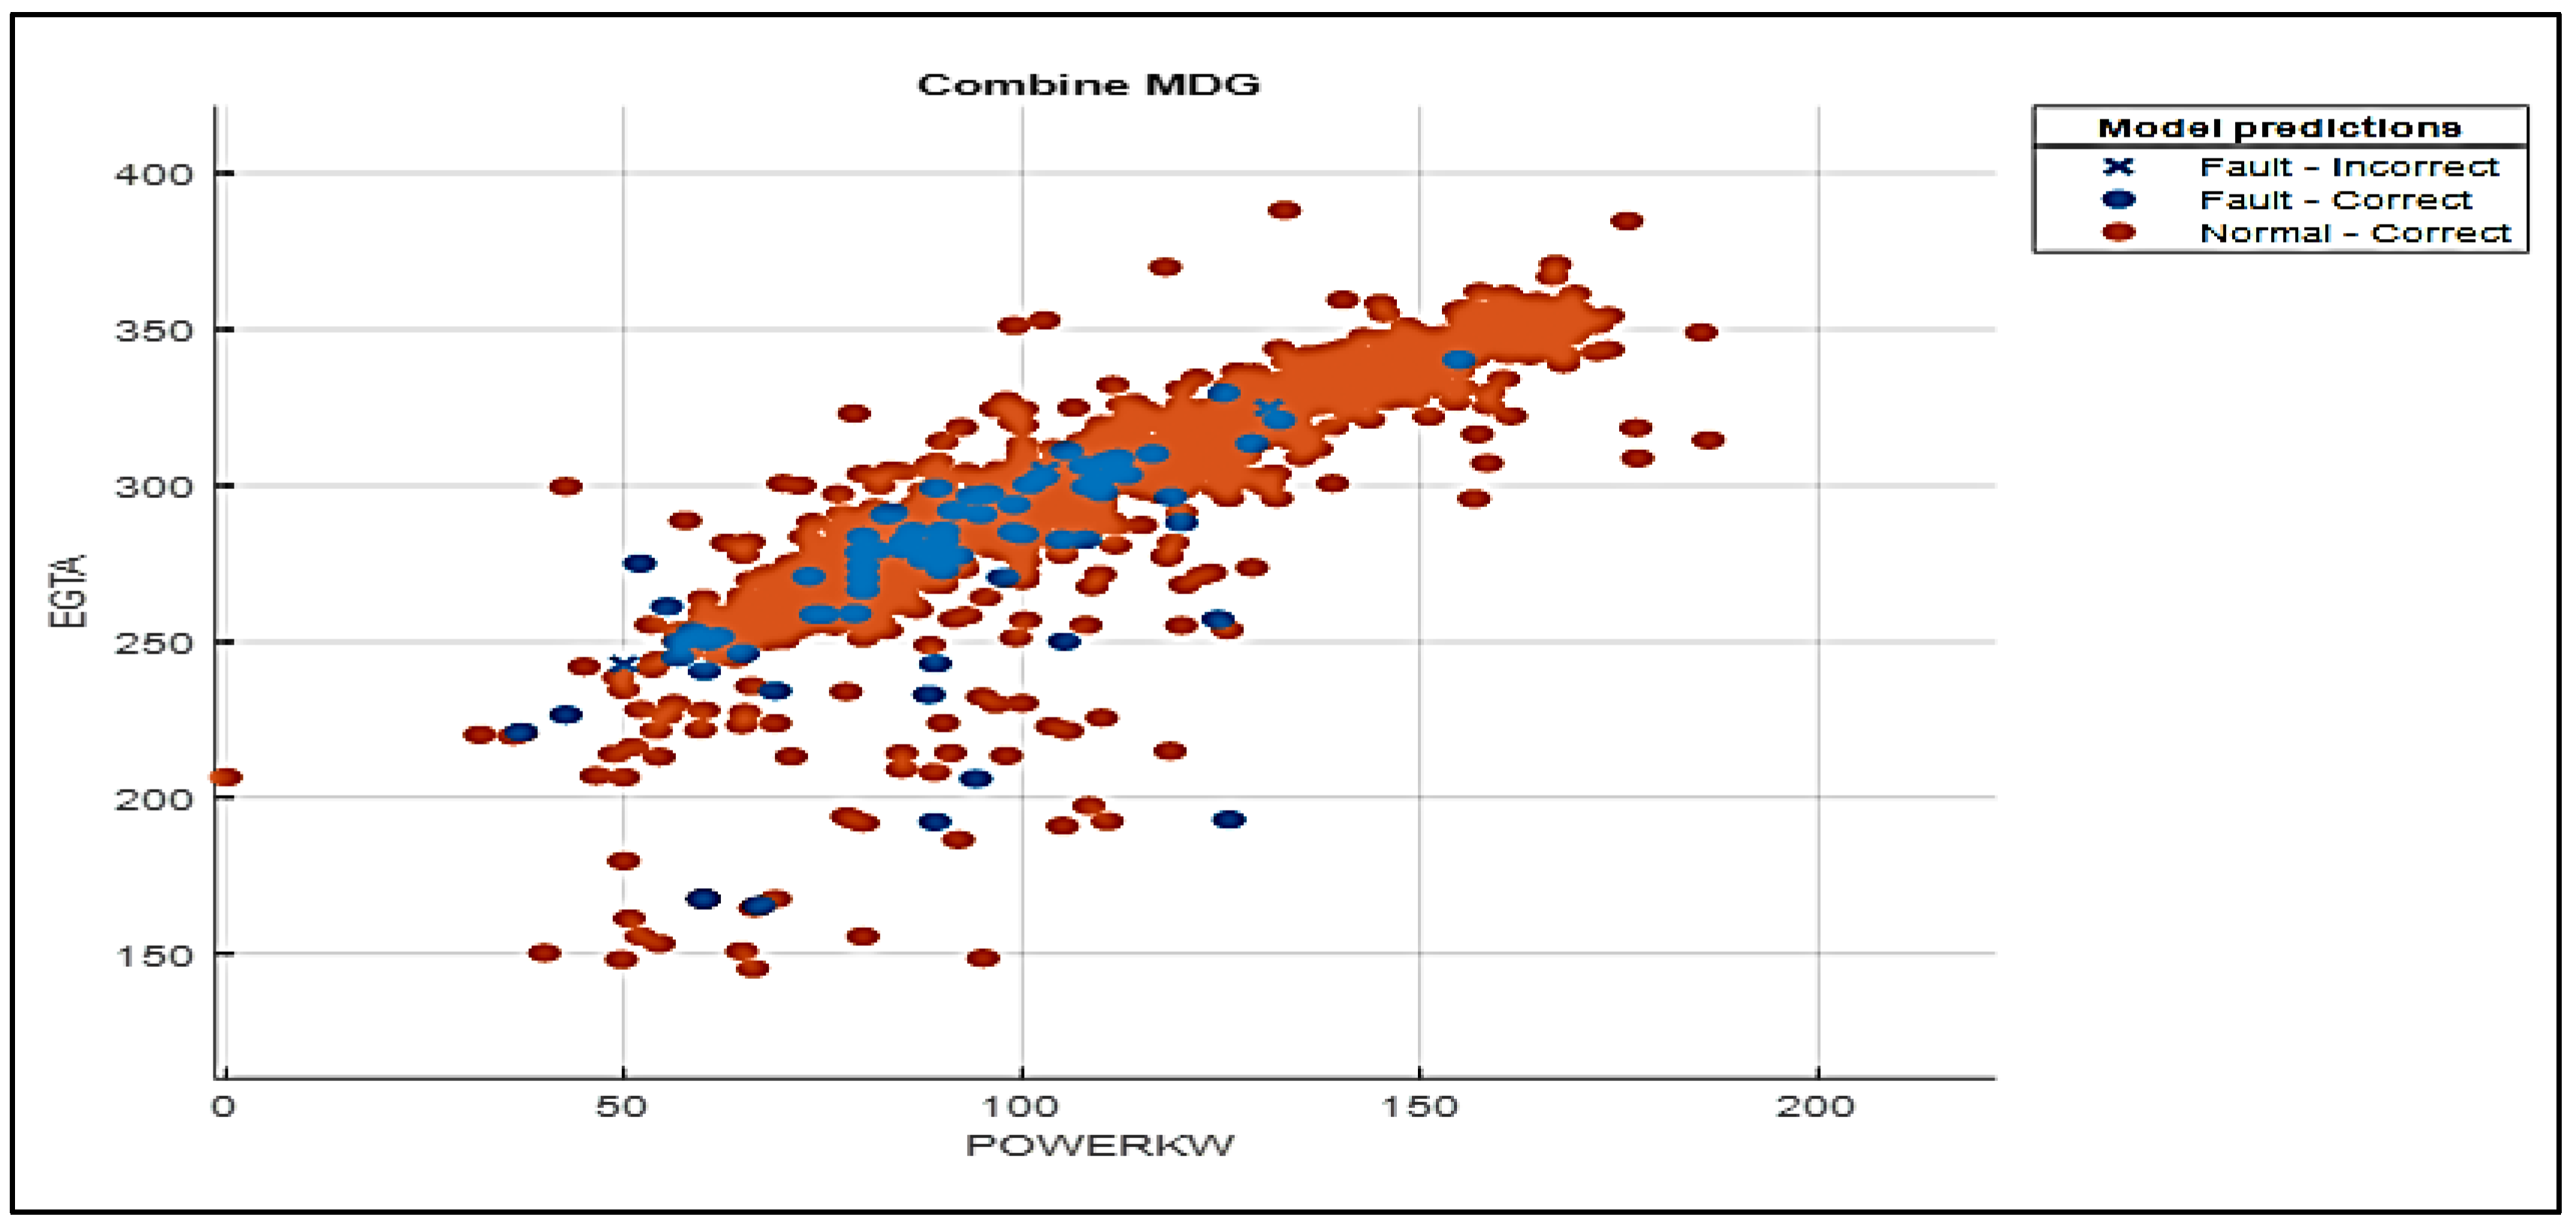

Table 1.
Strength and Weakness of Some selected tools.
| Tool | Strength | Weakness |
| BBN |
|
|
| DFTA |
|
|
| ETA |
|
|
| FTA |
|
|
| RBD |
|
|
| ANN |
|
|
Table 2.
Component failure rate per 10000 hours samples.
| Components | Frequency | |||||
| Failure type | Action taken | MDG1 | MDG2 | MDG3 | MDG4 | |
| Turbo charger | black smoke | replaced, repaired | 8 | 10 | 12 | 12 |
| Lub oil cooler | oil leakage | 1. replaced 2. cleaned and zinc anode replaced* |
16 | 18 | 15 | 16 |
| external leakage | 10 | 8 | 8 | 12 | ||
| Oil cooler valve | failed | remove/repaired | 1 | 1 | 2 | 1 |
| Cylinder head | 1. oil leakage 2.Fresh water leakage from A2 exhaust 3. Unable to start |
1.Liner, O-ring replaced (G1, G3) 2. Cylinder replaced (G3, G2) replaced gasket (G3) |
20 | 19 | 1 x (A1, A2) 3x (A2, liner) 2x (A2 head ) 1x(A3,B2 gskt) | 21 |
| Guide bushing | 20 | 14 | 20 | 20 | ||
| O-ring | 28 | 32 | 23 | 23 | ||
| Holding bolts | 18 | 17 | 17 | 16 | ||
| Cylinder jacket/sleeve | 1.Scuffed x 4 2. Cracked x 2 |
replaced | 11 | 12 | 11 | 12 |
| Piston | Rings | Replaced | 12 | 13 | 13 | 14 |
| cooling/crown | 8 | 13 | 15 | 14 | ||
| ConRod | bent | 7 | 9 | 8 | 9 | |
| Gudgeon pin | 8 | 6 | 8 | 6 | ||
| Drive belt | failed | replaced | 8 | 8 | 9 | 11 |
| Torn(wear) | replace | 11 | 5 | 9 | 3 | |
| Mech Injector pump | 1. Cracked bolts 2. Broken bolts 3. Broken shims |
1. Replace bolt and drive (G1, G3) 2. Replace bolt, pulley, and set injector timing (G1,2) 3. Replaced shims |
16 | 12 | 12 | 13 |
| Drive | defects | 22 | 20 | 21 | 24 | |
Table 3.
Diesel Generator Operating Parameters.
| No | Parameter | Operating Ranges | Alarm | |
| Min | Max | |||
| 1 | Engine Speed | 1789 RPM | 1850 RPM | 2052 RPM |
| 2 | Lubricating Oil Pressure | 0.4 Mpa | 0.55 Mpa | >0.6 |
| 3 | Cooling Fresh Water Temperature banks, A/B | 75 OC | 80 OC | >85 OC |
| 4 | Fresh water pressure | 0.02 Mpa | 0.25Mpa | >0.3 |
| 5 | Lubricating Oil Temperature | 30 OC | 110 OC | > 120 OC |
| 6 | Exhaust Gas temperature banks A/B | 220 OC | 400 OC | >520 |
| 7 | Generator running hours | ≥ 2000hours | N/A | N/A |
| 8 | Power Out Put | 0 | 350Kww | 350Kw |
| 9 | Date/time | Jan 2019 | Dec 2019 | N/A |
Table 4.
Comparison of the 3 IM values.
| Event | Birnbaum | Criticality | Fussell-Vesely |
| Sea Chest | 0.497018 | 0.497018 | 0.013959 |
| Intercooler | 0.497018 | 0.013959 | 0.013959 |
| Heat exchanger | 0.527822 | 0.024646 | 0.024646 |
| Fuel Supply pump | 0.604233 | 0.023861 | 0.023861 |
| Journal bearing | 0.632121 | 0.022580 | 0.022580 |
| Main bearing | 0.632121 | 0.022580 | 0.022580 |
| Cylinder head O-ring | 0.634048 | 0.062717 | 0.062717 |
| Tappets/Valves | 0.795919 | 0.027337 | 0.027337 |
| Heat Exchanger tubes | 0.826296 | 0.024646 | 0.024646 |
| Guide Bushing | 0.887586 | 0.062717 | 0.062717 |
| Crankshaft | 1.000000 | 0.046463 | 0.046463 |
| Governor | 1.00000 | 0.043901 | 0.043901 |
| Cylinder head Bolts | 1.0000 | 0.062942 | 0.062942 |
| Injection nozzles | 1.0000 | 0.073272 | 0.073272 |
Table 5.
MDG Component Criticality.
| MDG1 | Probability | MDG3 | Probability |
| Sea Chest | 0.50 | Fuel return line | 0.61 |
| Intercooler | 0.50 | Gasket | 0.67 |
| Heat exchanger | 0.53 | Cylinder head bolt | 0.71 |
| Fuel Supply pump | 0.60 | Injector Camshaft | 0.84 |
| Journal bearing | 0.63 | Injector drive | 0.84 |
| Main bearing | 0.63 | Injector Plunger | 0.84 |
| Cylinder head O-ring | 0.63 | FW Circulation Pump | 0.90 |
| Tappets/Valves | 0.80 | Air Filter | 0.91 |
| Heat Exchanger tubes | 0.83 | Heat Ex SW Thermostat | 0.94 |
| Guide Bushing | 0.89 | Primary fuel lift pump | 0.95 |
| Crankshaft | 1.00 | Turbo Charger | 0.96 |
| Governor | 1.00 | FW Thermostat | 0.97 |
| Cylinder head Bolts | 1.00 | Sea Chest | 0.98 |
| Injection nozzles | 1.00 | Fuel Filter | 1.00 |
| MDGG2 | MDG4 | ||
| Fuel Supply pump | 0.44 | Oil inlet hose | 0.53 |
| Fuel injection pump drive | 0.64 | Air Filter | 0.55 |
| Cylinder block damage | 0.89 | Pulley | 0.56 |
| Cylinder damage | 1.00 | Valve seats | 0.74 |
| FW HE Tubes | 1.00 | Water HE tubes | 0.79 |
| FW Thermostat | 1.00 | Piston Crown | 1.00 |
| Fuel pump Pulley bolts | 1.00 | FW Circulation Pump | 1.00 |
| Sea Chest | 0.70 | Oil Filter | 1.00 |
Table 6.
Summary of MDG hourly log data.
| RPM | LoP | FWTA | FWTB | LoT | FWP | EGTA | EGTB | HRS | KW | |
| count | 150 | 150 | 150 | 150 | 150 | 150 | 150 | 150 | 150 | 150 |
| mean | 1800 | 0.5 | 66.1 | 68.8 | 84.4 | 0.08 | 334.7 | 317.6 | 2527 | 128 |
| std | 2.9 | 0.1 | 3.4 | 3.8 | 4.7 | 0.01 | 39.3 | 38.9 | 2703 | 34.7 |
| min | 1783 | 0.33 | 40.7 | 42.7 | 41.6 | 0.05 | 161.2 | 146.9 | 523 | 65 |
| 25% | 1799 | 0.38 | 65.2 | 67.7 | 82.4 | 0.07 | 310.2 | 287.5 | 603.3 | 100 |
| 50% | 1800 | 0.56 | 66.2 | 68.8 | 84.6 | 0.07 | 339.5 | 325.8 | 636.5 | 130 |
| 75% | 1801 | 0.57 | 67.4 | 70.3 | 86.4 | 0.08 | 352 | 337.5 | 6341 | 140 |
| max | 1812 | 0.86 | 74.1 | 77.1 | 94 | 0.12 | 426.8 | 408.1 | 6379 | 240 |
Table 7.
Sample fault identification data labels.
| RPM | LoP | FWTA | FWTB | LoT | FWP | EGTA | EGTB | RH | KW | Fault | Temp |
|---|---|---|---|---|---|---|---|---|---|---|---|
| 1800 | 0.458 | 72.9 | 75.4 | 90 | 0.067 | 332.1 | 319.5 | 5234 | 115 | Normal | NML |
| 1800 | 0.465 | 72.8 | 75.3 | 89.9 | 0.068 | 335.3 | 323.9 | 5235 | 120 | Normal | NML |
| 1800 | 0.59 | 72.01 | 74.06 | 89.3 | 0.068 | 329.5 | 316.7 | 5236 | 115 | Fault | HTM |
| 1800 | 0.53 | 70.7 | 73.2 | 87.6 | 0.068 | 310.2 | 29.4 | 5262 | 100 | Normal | NML |
| 1800 | 0.58 | 78 | 80.68 | 96.2 | 0.066 | 366.1 | 355.9 | 5294 | 150 | Abnormal | OVH |
| 1801 | 0.58 | 75.8 | 78.6 | 94.6 | 0.067 | 360.4 | 351.7 | 5298 | 140 | Abnormal | HTM |
| 1800 | 0.504 | 76.2 | 79.1 | 95 | 0.067 | 361.2 | 353.1 | 5299 | 140 | Normal | HTM |
| 1800 | 0.58 | 78.6 | 78.7 | 94.5 | 0.067 | 359.1 | 350.1 | 5300 | 140 | Abnormal | HTM |
| 1800 | 0.502 | 76.2 | 79.1 | 94.8 | 0.067 | 358.3 | 351 | 5201 | 140 | Normal | HTM |
| 1800 | 0.499 | 75.8 | 78.8 | 95.6 | 0.067 | 360.1 | 353.7 | 5302 | 150 | Normal | NML |
| 1800 | 0.488 | 77.8 | 80.5 | 96.1 | 0.066 | 374.2 | 363.3 | 5203 | 140 | Normal | OVH |
| 1800 | 0.498 | 77.3 | 80 | 95.8 | 0.066 | 364.3 | 354.3 | 5204 | 150 | Normal | HTM |
Table 8.
ANOVA feature Score.
| Features | ANOVA ranking |
| EGTA | 8.9 |
| EGTB | 8.5 |
| Lube Oil Pressure | 1.3 |
| FWTEMPA | 0.6 |
| FWTEMPB | 1.0 |
| Location | 4.2 |
| Power Output | 6.7 |
Table 9.
MDG failure count by location.
| Location | Period | Count | |
| Jan-Dec 2019 | Normal | Fault | |
| Harbour | 1043 | 17 | |
| Sea | 822 | 14 | |
Disclaimer/Publisher’s Note: The statements, opinions and data contained in all publications are solely those of the individual author(s) and contributor(s) and not of MDPI and/or the editor(s). MDPI and/or the editor(s) disclaim responsibility for any injury to people or property resulting from any ideas, methods, instructions or products referred to in the content. |
© 2023 by the authors. Licensee MDPI, Basel, Switzerland. This article is an open access article distributed under the terms and conditions of the Creative Commons Attribution (CC BY) license (http://creativecommons.org/licenses/by/4.0/).
Copyright: This open access article is published under a Creative Commons CC BY 4.0 license, which permit the free download, distribution, and reuse, provided that the author and preprint are cited in any reuse.


