
Submitted:
06 June 2023
Posted:
07 June 2023
You are already at the latest version
Preprints on COVID-19 and SARS-CoV-2
Abstract
The objective of the present study is to analyze COVID-19 transmission in specific dampest regions with excess rainfall and recurring fogs. The working hypothesis is that widespread transmission of SARS CoV 2 (leading to COVID-19) and similar viral agents can be explained by specific climate factors having high air humidity. The main case study of the Turkish Black Sea region is investigated. Results reveal that the provinces in region under study have some climate factors and geographical features that foster the accelerated transmission of viral agents, such as SARS-CoV-2, and consequential negative impact on society. In particular, Spearman's Correlation Coefficient shows a statistically significant positive association between the average atmospheric pressure and the spread of the COVID-19 confirmed cases in Samsun province (Spearman’s correlation coefficient rs =0.86, p-value 0.05). A statistically significant positive association between the average precipitation and the spread of COVID-19 confirmed cases in Sinop province (Spearman’s correlation coefficient rs =0.79, p-value 0.05), and finally, a statistically significant negative association between the average sun hour and the spread of the COVID-19 confirmed cases in Samsun province (Spearman’s correlation coefficient rs = 0.89, p-value 0.01). These findings suggest that regions' geographical characteristics, demographic structure, climate and environmental parameters must be considered in the national scale epidemic management plans to design effective anti-pandemic health policies to cope with future waves of the COVID-19 and new airborne diseases and to reduce negative effects on health, social and economic systems.
Keywords:
COVID-19
; Coronavirus Disease
; SARS-CoV-2
; Humidity
; Rainfall
; Coastal regions
; Pandemic plans
; Health Policy
1. Introduction
In 2023, the negative effects of the Coronavirus Disease 2019 (COVID-19) pandemic are considerably reduced, unlike the early period in 2020, though many people still have to cope with COVID-19 illness driven by new variants (Akan and Coccia, 2022; Bontempi and Coccia, 2021; Bontempi et al., 2021; Coccia, 2021, 2021a, 2022, 2022a, 2023; WHO 2021). Numerous studies have focused on identifying the factors determining the spread of COVID-19 (Coccia, 2020; 2023a). Studies show that transmission of COVID-19 can be due to direct contact (droplet with person-to-person interaction) or indirect transmission (contaminated objects or airborne; Akan 2022; Domingo et al. 2020; Núñez-Delgado et al., 2021; Rahimi et al. 2021). Studies show that climate significantly affects airborne diseases, such as SARS-Cov1, COVID-19, etc. (Bashir et al. 2020; Bolaňo-Ortiz et al. 2020; Iha et al. 2016; Lin et al. 2013; Şahin 2020; Tosepu et al. 2020; Srivastava 2021). Cai et al. (2007) investigated the correlations between Severe Acute Respiratory Syndrome (SARS, is a viral respiratory disease similar to COVID-19) and manifold meteorological factors including daily average temperature (DAT), daily average air pressure (DAAP), daily average relative humidity (DARH), daily hours of sunshine (DHS), daily average wind velocity (DAWV). They found that the SARS outbreak was significantly associated with DAWV. Moreover, DAT, DAAP, DARH, and DHS also impact the transmission of the SARS. Yuan et al. (2006) also suggested that temperature, relative humidity, and wind velocity were associated with SARS transmission. Bashir et al. (2020) examined the impact of several meteorological parameters (e.g., average temperature, minimum temperature, maximum temperature, rainfall, average humidity, wind speed, and air quality) on the transmission of COVID-19 in New York, USA. They showed that average temperature and minimum temperature were significantly associated with the COVID-19 diffusion. Tosepu et al. (2020) investigated the relationship between climate and the spread of COVID-19 in Jakarta (Indonesia) and suggested that only average temperature was significantly associated with the COVID-19. Instead, Bolaňo-Ortiz et al. (2020) investigated the association between climate factors and COVID-19 daily new cases and deaths in Latin America and the Caribbean (LAC). They found that average temperature, minimum temperature, humidity, wind speed, and rainfall were significantly associated with the spread of COVID-19 confirmed cases in LAC. Guo et al. (2021) also investigated the associations between COVID-19 incidence and meteorological factors showing that COVID-19 incidence has a stronger and inverse association with temperature rather than relative humidity or wind speed. An increase in temperature from 5 °C to 11 °C was associated with a decrease of 28% in the cumulative risk of COVID-19 over 14 days. This result suggests a decrease of COVID-19 cases in the Northern hemisphere countries during the summer months when temperature is hot. Islam et al. (2021) investigated the associations between meteorological variables and COVID-19 cases in Bangladesh. The results showed that all meteorological factors examined had a significant positive correlation with the number of COVID-19 confirmed cases. Moreover, other studies showed that high levels of air pollution and low wind speed that prevents the dispersion of air pollutants remaining stagnant in the air containing viruses and bacteria, increased confirmed cases and fatality rates of COVID-19 (Coccia 2020a; Coccia 2021b, 2021c). In addition, high population density is also a risk factor for the transmission of COVID-19 and related viral agents (Coccia, 2020a; Coccia, 2021c). Table 1 summarizes the main studies about the relationship between climate factors and COVID-19 transmission in the environment and society.
In this context, the objective of the present study is to analyze COVID-19 transmission in specific dampest regions with excess rainfall and recurring fogs. The main case study of the Turkish Black Sea region is investigated because it has specific characteristics of climate: high level of rainfall and average temperature of 19°C with many cold and wet months (Coskun et al. 2021). Previous studies by Aral and Bakır (2022) examined Turkish regions and revealed that the diffusion of COVID-19 has heterogeneity in the transmission dynamics also associated with different weather trend given by Black Sea, Mediterranean, and terrestrial climate (Coskun et al. 2021). However, a hypothesis of whether widespread transmission of SARS-CoV-2 and similar viral agents can be explained by a specific climate factor given by high air humidity has not been clearly verified. In the present study, the correlation analyses between different weather factors and COVID-19 cases per 100,000 people are analyzed. The goal is to explain basic climate factors of the spread of COVID-19 in dampest regions with excess rainfall, moderate temperatures, and fog even in summer to improve epidemic plans and design effective anti-pandemic health policies to cope with future waves of new variants of SARS-CoV-2 and new vital agents and to reduce negative effects on health, social and economic systems.
2. Materials and Methods
The current study seeks answers to the following questions:
- Can the transmission of COVID-19 and other viral agents be explained by a specific climate factor given by high air humidity?
- Does the interaction of climate parameters contribute to the accelerate diffusion of COVID-19?
The working hypothesis here is that widespread transmission of COVID-19 in specific regions can be explained by a climate having high air humidity
2.1. Sample and data
This study investigates the Black Sea region because it has provinces with the highest number of COVID-19 cases per 100,000 people. In particular, six cities from west to east located in the Black Sea region, including Sinop, Samsun, Ordu, Giresun, Trabzon, and Rize, were selected to evaluate the associations between COVID-19 cases and climate parameters between February and September 2021 (see Figure 1). The information required to calculate the population densities of the provinces in the study is presented in Supplementary Material (Table SM-1). Data about the COVID-19 confirmed cases from February 08, 2021 to September 03, 2021, for the provinces just mentioned were obtained from the COVID-19 information webpage of the Ministry of Health of the Republic of Turkey (COVID-19 2021). Monthly cases of COVID-19 per 100,000 people from February to September 2021 and weekly cases of COVID-19 per 100,000 from February 08, 2021 to September 03, 2021 for all provinces are presented in Supplementary Material (Tables SM-2 and SM-3, respectively). To compare the number of COVID-19 cases in these provinces with the general situation in Turkey at that period, the number of COVID-19 cases in the three most populated cities of Turkey (i.e., Istanbul, Ankara, and Izmir) are also presented in is presented in Supplementary Material (cf., Tables SM-2 and SM-3). The meteorological parameters were obtained from the webpage of the Meteorological Department of the Ministry of Agriculture and Forestry of the Republic of Turkey, and other meteorological parameters were obtained from the webpage of World Weather Online (WWO 2021). Data used in this study are freely available from these websites.
2.2. Measures of variables
This study focuses on the following measures:
- COVID-19 confirmed cases: Number of infected individuals from February 08, 2021 to May 03, 2021, based on people that are positive for COVID-19 test.
- Meteorological parameters: Average ambient temperature in °C, average wind speed in kmph, average gust in kmph, average precipitation in mm, average relative humidity %, average cloud %, average atmospheric pressure in mbar, and average sun hour from February 08, 2021 to September 03, 2021.
2.3. Data analysis procedure
To statistically verify the working hypothesis, the associations between the COVID-19 confirmed cases in the Black Sea region of Turkey and meteorological variables, between six Turkish provincial capitals under study, are analyzed with a non-parametric approach given by Spearman's and Kendall's rank correlation tests. These two tests are applied because the six cities are a small sample and the distributions of the COVID-19 cases and meteorological parameters do not have normality. The Statistics Software IBM SPSS® version 23 is applied.
3. Results
3.1. Overview of the climate in the Turkish Black Sea region
The highest number of COVID-19 cases per 100,000 people in the provinces of the Black Sea region in Turkey between February and September 2021 can be affected by climatic conditions and population density of the region. A general overview of the climate can clarify the results. The variation and values of the average climate parameters including temperature, wind speed, gust, precipitation, humidity, cloud, pressure, and sun hour in the provinces in the investigated months are presented in Figure 2 and Supplementary Material (cf., Table SM-4), respectively. Among the Black Sea region provinces, the one exposed to the most wind speed was Sinop city. Other provinces are under the influence of almost similar wind speeds. While the highest average wind speeds were observed for Sinop and Ordu cities in April and July, respectively, the highest wind speeds were recorded in Samsun and Giresun cities in February and Trabzon and Rize cities in March. Similarly to the wind speed, the highest average gust was also observed in Sinop (Figure 2). While the highest average gust was observed for Sinop in April, it was recorded in February for the remaining cities. As expected, the maximum amounts of rain were recorded in March and February; but for rain trends occurring in the summer, the remarkable amount of precipitation in the recorded in August, especially in Sinop province, may be due to effects of global climate change. Based on all provinces, the lowest average relative humidity values were observed in February, while the highest ones were recorded in April (Figure 2). The highest average relative humidity was recorded in Sinop city at 86% level and the lowest one in Samsun at 69% level. Average atmospheric pressure values were recorded at almost the same values in all provinces of the Black Sea region from February to August. The highest average atmospheric pressures were recorded in the winter months, while the opposite was observed in summer. As expected, the change in average sun hour is the opposite of the change in cloud rate (Figure 2). Previous studies have proved that these weather conditions, including monthly average temperature, wind speed, gust, precipitation, relative humidity, cloud atmospheric pressure, and sun hour, significantly affect the spread of new viral agents leading to respiratory disease of COVID-19 (Haque and Rahman 2020; Rosario et al. 2020; Sarkodie and Owusu 2020; Srivastava 2021).
3.2. Relations between COVID-19 confirmed cases and climate factors in the Turkish Black Sea region
The monthly logarithmic variations in terms of the COVID-19 confirmed cases/100,000 people and meteorological parameters concerning provinces located in the Black Sea region of Turkey from February to September 2021 were presented in Figure 3: sections A - H show that the number of COVID-19 cases decreases as the temperature increases in all provinces. All climatic parameters, except precipitation, show similar patterns throughout the investigated period. Heavy rains observed in Sinop province in August resulted in the loss of human life and socioeconomic damages, including the devastation of homes, of industrial facilities and bridge collapses. Results in Figure 3 suggest a decreasing trend in the number of COVID-19 cases in May, with the lowest values are in June during the period under study. This reduction in the confirmed COVID-19 cases can be also due to a two-and-a-half-week nationwide full lockdown from April 29 to May 17 enforced by the Turkish government to mitigate, whenever possible, the country's COVID-19 infection rate. In the scope of this continuous lockdown, all workplaces suspended their activities, except for firms of manufacturing, food, cleaning, and health (Coccia, 2022c). Moreover, all households remained in their homes except to perform essential work. This decreasing trend shows that person-to-person transmission, one of the routes for COVID-19 diffusion, plays a critical role in rapid spreading the SARS-CoV-2 across cities and countries (Bontempi and Coccia, 2021; Domingo et al. 2020; Rahimi et al. 2021; Yao et al. 2020).
To determine how the climate parameters, just represented in Figure 3, affect the spread of COVID-19 morbidity in the Black Sea region, where the maximum number of COVID-19 cases per 100,000 people in Turkey is observed in the months under study, Kendal's and Spearman's correlation tests are in Table 2.
The coefficient of Kendall's and Spearman's correlation shows that many relations are not statistically significant, except in some provinces the climate factors of precipitation, pressure, and sun hour. In particular, Spearman's Correlation Coefficient shows a statistically significant positive association between the average atmospheric pressure and the spread of the COVID-19 confirmed cases in Samsun province (Spearman’s correlation coefficient rs =0.86, p-value 0.05), Kendall's Correlation Coefficient confirms the positive association. A statistically significant positive association between the average precipitation and the spread of COVID-19 confirmed cases in Sinop province (Spearman’s correlation coefficient rs =0.79, p-value 0.05), and finally, a statistically significant negative association between the average sun hour and the spread of the COVID-19 confirmed cases in Samsun province (Spearman’s correlation coefficient rs = −0.89, p-value 0.01). Kendall's Correlation Coefficient confirms the negative association.
In contrast to these statistically significant strong associations, Table 2 suggests that some climate parameters have not a significant effect on the diffusion of COVID-19 in the provinces under study, likely due to manifold confounding factors associated with differences in demographic and social aspects in cities. Thus, solar radiation and atmospheric pressure were the most critical weather parameters on the impact of diffusion of COVID-19, while the remaining parameters, except for precipitation, generally suggest a not significant correlation for most examined cities.
4. Discussions
These results are consistent with other studies. Iha et al. (2016) suggested that ambient temperature and relative humidity were inversely associated with influenza A infection, while high relative humidity was directly associated with influenza B infection. Şahin (2020) investigated the correlation between weather parameters including temperature, dew point, humidity, and wind speed, and COVID-19 in nine cities of Turkey considering Spearman's correlation coefficients. Results show the highest correlations for wind speed and temperature on the day, respectively. Xie and Zhu (2020) investigated whether average temperature plays a critical role in the spread of COVID-19 in 122 cities of China from January 23 to February 29, 2020, using a generalized additive model. They found that mean temperature has a positive linear relationship with the number of COVID-19 cases when its value is below 3 °C; if the temperature exceeds 3 °C, it does not affect the spread of COVID-19 cases. Following their results, higher temperatures may not limit the transmission of this novel coronavirus. Srivastava (2021) suggested that local meteorological parameters severely impact the rate of COVID-19 mortality and morbidity. The results of the study were consistent with the outcomes of the current study, emphasizing that the increase in temperature and solar radiation caused a decreasing trend in the cases of COVID-19. Rosario et al. (2020) conducted a study exploring the role of weather parameters (e.g., temperature, humidity, solar radiation, wind speed, and rainfall) on the spread of COVID-19 infection in the state of Rio de Janeiro (Brazil). Their findings suggest that solar radiation was the most significant weather factor, showing a significantly strong correlation, while average temperature and wind speed had a moderate correlation with the COVID-19 confirmed cases, similarly to the results of our analysis here. Haque and Rahman (2020) and Sarkodie and Owusu (2020) found similar results in their investigations regarding temperature and relative humidity. They suggested that increases in temperature and relative humidity decrease the viability, stability, survival, and transmission of COVID-19.
Contrary to the correlation results based on relative humidity, the relationship between temperature and COVID-19 cases is similar to the present study. It is well-known that enveloped viruses in droplets survive well when the relative humidity levels are below approximately 50 % (Akan, 2022; Cai et al. 2007; Zoran et al. 2020). The results of this study can be explained as follows: since the Black Sea region has very high relative humidity due to the geographical location and characteristics of the region, relative humidity showed a positive association but insignificant statistically. Sarkodie and Owusu (2020) also suggested that reductions in wind speed, dew/frost point, precipitation, and surface pressure provide atmospheric stability and stagnant air that can accelerate diffusion and infectivity of viral agents similar to SARS-CoV-2 (cf., Coccia, 2021b).
Schuit et al. (2020) investigated the effect of meteorological factors including sunlight, suspension matrix, and relative humidity on the stability of COVID-19 in aerosols. The findings revealed that simulated sunlight and matrix impact the decay of the new viral agent, but relative humidity alone did not affect the decay rate. Referring to the results of this study, it was examined how the interactions of the parameters among themselves can affect the spread of COVID-19 cases in environment. In this regard, the empirical results are based on Kendal and Spearman correlation coefficients concerning the associations between meteorological parameters in the provinces of the Black Sea region from February to September 2021 (Table 3).

Table 3.
Kendal and Spearman correlation coefficients based on the associations between meteorological parameters in the provinces of the Black Sea region from February to September 2021.
Table 3.
Kendal and Spearman correlation coefficients based on the associations between meteorological parameters in the provinces of the Black Sea region from February to September 2021.
| SAMSUN city | ||||||||
| Kendall’s Correlation Coefficients, rk | ||||||||
| Temperature | Wind Speed | Gust | Precipitation | Relative Humidity | Cloud | Pressure | Sun Hour | |
| Temperature | 1.00 | -0.19 | -0.195 | -0.78* | -0.15 | -0.78* | -0.98** | 0.78* |
| Wind Speed | -0.19 | 1.00 | 1.00** | -0.05 | -0.59 | 0.05 | 0.14 | 0.05 |
| Gust | -0.19 | 1.00** | 1.00 | -0.05 | -0.59 | 0.05 | 0.14 | 0.05 |
| Precipitation | -0.78* | -0.05 | -0.05 | 1.00 | 0.09 | 0.71* | 0.81* | -0.81* |
| Relative Humidity | -0.15 | -0.59 | -0.59 | 0.09 | 1.00 | 0.39 | 0.09 | -0.29 |
| Cloud | -0.78* | 0.05 | 0.05 | 0.71* | 0.39 | 1.00 | 0.71* | -0.91** |
| Pressure | -0.98** | 0.14 | 0.14 | 0.81* | 0.09 | 0.71* | 1.00 | -0.81* |
| Sun Hour | 0.78* | 0.05 | 0.05 | -0.81 | -0.29 | -0.91** | -0.81* | 1.00 |
| Spearman’s Correlation Coefficients, rs | ||||||||
| Temperature | Wind Speed | Gust | Precipitation | Relative Humidity | Cloud | Pressure | Sun Hour | |
| Temperature | 1.00 | -0.13 | -0.13 | -0.92** | -0.11 | -0.88** | -0.99** | 0.88** |
| Wind Speed | -0.13 | 1.00 | 1.00** | -0.04 | -0.74 | -0.11 | 0.11 | 0.14 |
| Gust | -0.13 | 1.00** | 1.00 | -0.04 | -0.74 | -0.11 | 0.11 | 0.14 |
| Precipitation | -0.92** | -0.04 | -0.04 | 1.00 | 0.14 | 0.86* | 0.93** | -0.89** |
| Relative Humidity | -0.11 | -0.74 | -0.74 | 0.14 | 1.00 | 0.39 | 0.09 | -0.29 |
| Cloud | -0.88** | -0.11 | -0.11 | 0.86* | 0.39 | 1.00 | ||
| Pressure | -0.99** | 0.11 | 0.11 | 0.93** | 0.09 | 0.86* | 1.00 | -0.89** |
| Sun Hour | 0.88** | 0.14 | 0.14 | -0.89** | -0.29 | -0.96** | -0.89** | 1.00 |
| SİNOP city | ||||||||
| Kendall’s Correlation Coefficients, rk | ||||||||
| Temperature | Wind Speed | Gust | Precipitation | Relative Humidity | Cloud | Pressure | Sun Hour | |
| Temperature | 1.00 | 0.25 | 1.00 | -0.19 | -0.15 | -0.78* | -0.88* | 0.78* |
| Wind Speed | 0.25 | 1.00 | 0.49 | 0.29 | -0.05 | -0.29 | -0.19 | 0.29 |
| Gust | 1.00 | 0.61 | 1.00 | 0.14 | 0.29 | -0.05 | 0.05 | 0.24 |
| Precipitation | -0.19 | 0.29 | 0.14 | 1.00 | -0.09 | 0.24 | 0.33 | -0.24 |
| Relative Humidity | -0.15 | -0.05 | 0.29 | -0.09 | 1.00 | 0.09 | 1.00 | 0.09 |
| Cloud | -0.78* | -0.29 | -0.05 | 0.24 | 0.09 | 1.00 | 0.71* | -0.81* |
| Pressure | -0.88** | -0.19 | 0.05 | 0.33 | 1.00 | 0.71* | 1.00 | -0.71* |
| Sun Hour | 0.78* | 0.29 | 0.24 | -0.24 | -0.24 | 0.09 | -0.81* | 1.00 |
| Spearman’s Correlation Coefficients, rs | ||||||||
| Temperature | Wind Speed | Gust | Precipitation | Relative Humidity | Cloud | Pressure | Sun Hour | |
| Temperature | 1.00 | 0.35 | 1.00 | -0.22 | -0.03 | -0.92** | -0.96** | 0.87* |
| Wind Speed | 0.35 | 1.00 | 0.61 | 0.19 | -0.10 | -0.36 | -0.32 | 0.34 |
| Gust | 1.00 | 0.61 | 1.00 | 0.14 | 0.45 | -0.11 | 0.04 | 0.32 |
| Precipitation | -0.22 | 0.19 | 0.14 | 1.00 | -0.19 | 0.32 | 0.36 | -0.43 |
| Relative Humidity | -0.03 | -0.10 | 0.45 | -0.19 | 1.00 | 0.18 | 1.00 | 0.18 |
| Cloud | -0.92** | -0.36 | -0.11 | 0.32 | 0.18 | 1.00 | 0.86 | -0.93** |
| Pressure | -0.96** | -0.32 | 0.04 | 0.36 | 1.00 | 0.86* | 1.00 | -0.86 |
| Sun Hour | 0.86* | 0.34 | 0.32 | -0.43 | -0.43 | 0.18 | -0.93** | 1.00 |
*Indicates that correlation is significant at 0.05 level (2-tailed); **Indicates that correlation is significant at 0.01 level (2-tailed).
Table 3.
(continue). Kendal and Spearman correlation coefficients based on the associations between meteorological parameters in the provinces of the Black Sea region from February to September 2021.
Table 3.
(continue). Kendal and Spearman correlation coefficients based on the associations between meteorological parameters in the provinces of the Black Sea region from February to September 2021.
| ORDU city | ||||||||
| Kendall’s Correlation Coefficients, rk | ||||||||
| Temperature | Wind Speed | Gust | Precipitation | Relative Humidity | Cloud | Pressure | Sun Hour | |
| Temperature | 1.00 | -0.05 | -0.10 | -0.55 | -0.21 | -0.62 | -0.95** | -0.65* |
| Wind Speed | -0.05 | 1.00 | 0.88** | 0.24 | -0.55 | 0.00 | 0.05 | 0.24 |
| Gust | -0.10 | 0.88** | 1.00 | 0.29 | -0.62 | 1.00 | 0.09 | 0.09 |
| Precipitation | -0.55 | 0.24 | 0.29 | 1.00 | -0.15 | 0.39 | 0.43 | -0.33 |
| Relative Humidity | -0.21 | -0.55 | -0.62 | -0.15 | 1.00 | 0.31 | 0.15 | -0.55 |
| Cloud | -0.62 | 0.00 | 1.00 | 0.39 | 0.31 | 1.00 | 0.49 | -0.78* |
| Pressure | -0.95** | 0.048 | 0.098 | 0.43 | 0.15 | 0.49 | 1.00 | -0.52 |
| Sun Hour | -0.65* | 0.24 | 0.09 | -0.33 | -0.55 | -0.78* | -0.52 | 1.00 |
| Spearman’s Correlation Coefficients, rs | ||||||||
| Temperature | Wind Speed | Gust | Precipitation | Relative Humidity | Cloud | Pressure | Sun Hour | |
| Temperature | 1.00 | 0.11 | -0.05 | -0.71 | -0.19 | -0.78* | -0.98** | 0.84* |
| Wind Speed | 0.11 | 1.00 | 0.96** | 0.36 | -0.71 | 0.04 | -0.11 | 0.29 |
| Gust | -0.05 | 0.96** | 1.00 | 0.36 | -0.74 | 0.07 | 0.09 | 0.16 |
| Precipitation | -0.71 | 0.36 | 0.36 | 1.00 | -0.22 | 0.52 | 0.64 | -0.36 |
| Relative Humidity | -0.19 | -0.71 | -0.74 | -0.22 | 1.00 | 0.44 | 0.11 | -0.60 |
| Cloud | -0.78* | 0.04 | 0.07 | 0.52 | 0.44 | 1.00 | 0.69 | -0.90** |
| Pressure | -0.98** | -0.11 | 0.09 | 0.64 | 0.11 | 0.69 | 1.00 | -0.79* |
| Sun Hour | 0.84* | 0.29 | 0.16 | -0.36 | -0.60 | -0.90** | -0.79* | 1.00 |
| GİRESUN city | ||||||||
| Kendall’s Correlation Coefficients, rk | ||||||||
| Temperature | Wind Speed | Gust | Precipitation | Relative Humidity | Cloud | Pressure | Sun Hour | |
| Temperature | 1.00 | -0.41 | -0.45 | -0.35 | -0.11 | -0.62 | -0.95** | 0.65* |
| Wind Speed | -0.41 | 1.00 | 0.98** | 0.59 | -0.51 | 0.30 | 0.39 | -0.09 |
| Gust | -0.45 | 0.98** | 1.00 | 0.62 | -0.45 | 0.29 | 0.43 | -0.14 |
| Precipitation | -0.35 | 0.59 | 0.62 | 1.00 | -0.45 | 0.29 | 0.24 | -0.14 |
| Relative Humidity | -0.11 | -0.51 | -0.45 | -0.45 | 1.00 | 0.21 | 0.05 | -0.45 |
| Cloud | -0.62 | 0.30 | 0.29 | 0.29 | 0.21 | 1.00 | 0.49 | -0.78* |
| Pressure | -0.95** | 0.39 | 0.43 | 0.24 | 0.05 | 0.49 | 1.00 | -0.52 |
| Sun Hour | 0.65* | -0.09 | -0.14 | -0.14 | -0.45 | -0.78* | -0.52 | 1.00 |
| Spearman’s Correlation Coefficients, rs | ||||||||
| Temperature | Wind Speed | Gust | Precipitation | Relative Humidity | Cloud | Pressure | Sun Hour | |
| Temperature | 1.00 | -0.43 | -0.47 | -0.49 | -0.08 | -0.76* | -0.98** | 0.84* |
| Wind Speed | -0.43 | 1.00 | 0.99** | 0.78* | -0.59 | 0.42 | 0.40 | -0.25 |
| Gust | -0.47 | 0.99** | 1.00 | 0.79* | -0.55 | 0.41 | 0.43 | -0.29 |
| Precipitation | -0.49 | 0.78* | 0.79* | 1.00 | -0.60 | 0.31 | 0.43 | -0.11 |
| Relative Humidity | -0.08 | -0.59 | -0.55 | -0.60 | 1.00 | 0.31 | 0.02 | -0.51 |
| Cloud | -0.76* | 0.42 | 0.41 | 0.31 | 0.31 | 1.00 | 0.69 | -0.90* |
| Pressure | -0.98** | 0.39 | 0.43 | 0.43 | 0.02 | 0.69 | 1.00 | -0.79* |
| Sun Hour | 0.84* | -0.25 | -0.29 | -0.11 | -0.51 | -0.90* | -0.79* | 1.00 |
*Indicates that correlation is significant at 0.05 level (2-tailed). **Indicates that correlation is significant at 0.01 level (2-tailed).
Table 3.
(continue). Kendal and Spearman correlation coefficients based on the associations between meteorological parameters in the provinces of the Black Sea region from February to September 2021.
Table 3.
(continue). Kendal and Spearman correlation coefficients based on the associations between meteorological parameters in the provinces of the Black Sea region from February to September 2021.
| TRABZON city | ||||||||
| Kendall’s Correlation Coefficients, rk | ||||||||
| Temperature | Wind Speed | Gust | Precipitation | Relative Humidity | Cloud | Pressure | Sun Hour | |
| Temperature | 1.00 | -0.75* | -0.75* | -0.45 | 0.10 | -0.41 | -0.95* | 0.45 |
| Wind Speed | -0.75* | 1.00 | 0.91** | 0.71* | -0.29 | 0.39 | 0.62 | -0.24 |
| Gust | -0.75* | 0.91** | 1.00 | 0.62 | -0.39 | 0.29 | 0.71* | -0.14 |
| Precipitation | -0.45 | 0.71* | 0.62 | 1.00 | -0.49 | 0.49 | 0.33 | -0.33 |
| Relative Humidity | 0.10 | -0.29 | -0.39 | -0.49 | 1.00 | 0.05 | -0.09 | -0.19 |
| Cloud | -0.41 | 0.39 | 0.29 | 0.49 | 0.05 | 1.00 | 0.39 | -0.88** |
| Pressure | -0.95** | 0.62 | 0.71* | 0.33 | -0.09 | 0.39 | 1.00 | -0.43 |
| Sun Hour | 0.45 | -0.24 | -0.14 | -0.33 | -0.19 | -0.88** | -0.43 | 1.00 |
| Spearman’s Correlation Coefficients, rs | ||||||||
| Temperature | Wind Speed | Gust | Precipitation | Relative Humidity | Cloud | Pressure | Sun Hour | |
| Temperature | 1.00 | -0.84* | -0.83* | -0.56 | 0.19 | -0.63 | -0.98** | 0.69 |
| Wind Speed | -0.84* | 1.00 | 0.96** | 0.86* | -0.43 | 0.61 | 0.75 | -0.54 |
| Gust | -0.84* | 0.96** | 1.00 | 0.82* | -0.51 | 0.56 | 0.79* | -0.50 |
| Precipitation | -0.56 | 0.86* | 0.82* | 1.00 | -0.67 | 0.59 | 0.50 | -0.43 |
| Relative Humidity | 0.19 | -0.43 | -0.51 | -0.67 | 1.00 | 0.09 | -0.18 | -0.25 |
| Cloud | -0.63 | 0.61 | 0.56 | 0.59 | 0.09 | 1.00 | 0.63 | -0.96** |
| Pressure | -0.98** | 0.75 | 0.79* | 0.50 | -0.18 | 0.63 | 1.00 | -0.71 |
| Sun Hour | 0.69 | -0.54 | -0.50 | -0.43 | -0.25 | -0.96** | -0.71 | 1.00 |
| RİZE city | ||||||||
| Kendall’s Correlation Coefficients, rk | ||||||||
| Temperature | Wind Speed | Gust | Precipitation | Relative Humidity | Cloud | Pressure | Sun Hour | |
| Temperature | 1.00 | -0.65* | -0.75* | -0.45 | 0.25 | -0.45 | -0.68* | 0.68* |
| Wind Speed | -0.65* | 1.00 | 0.85** | 0.35 | -0.15 | 0.55 | 0.29 | -0.49 |
| Gust | -0.75* | 0.85** | 1.00 | 0.45 | -0.35 | 0.45 | 0.49 | -0.59 |
| Precipitation | -0.45 | 0.35 | 0.45 | 1.00 | -0.55 | 0.15 | 0.09 | -0.49 |
| Relative Humidity | 0.25 | -0.15 | -0.35 | -0.55 | 1.00 | 0.25 | -0.29 | 0.09 |
| Cloud | -0.45 | 0.55 | 0.45 | 0.15 | 0.25 | 1.00 | 0.19 | -0.68* |
| Pressure | -0.68* | 0.29 | 0.49 | 0.09 | -0.29 | 0.19 | 1.00 | -0.43 |
| Sun Hour | 0.68* | -0.49 | -0.59 | -0.49 | 0.09 | -0.68* | -0.43 | 1.00 |
| Spearman’s Correlation Coefficients, rs | ||||||||
| Temperature | Wind Speed | Gust | Precipitation | Relative Humidity | Cloud | Pressure | Sun Hour | |
| Temperature | 1.00 | -0.74* | -0.84* | -0.56 | 0.30 | -0.66 | -0.78* | 0.79* |
| Wind Speed | -0.74* | 1.00 | 0.90** | 0.44 | -0.16 | 0.68 | 0.39 | -0.65 |
| Gust | -0.84* | 0.90** | 1.00 | 0.61 | -0.46 | 0.66 | 0.60 | -0.74 |
| Precipitation | -0.56 | 0.44 | 0.61 | 1.00 | -0.70 | 0.24 | 0.23 | -0.61 |
| Relative Humidity | 0.30 | -0.16 | -0.46 | -0.70 | 1.00 | 0.29 | -0.32 | 0.09 |
| Cloud | -0.66 | 0.68 | 0.66 | 0.24 | 0.29 | 1.00 | 0.36 | -0.85* |
| Pressure | -0.78* | 0.39 | 0.60 | 0.23 | -0.32 | 0.36 | 1.00 | -0.57 |
| Sun Hour | 0.79* | -0.65 | -0.74 | -0.61 | 0.09 | -0.85* | -0.57 | 1.00 |
*Indicates that correlation is significant at 0.05 level (2-tailed); **Indicates that correlation is significant at 0.01 level (2-tailed).
In Samsun city, the temperature was negatively correlated with precipitation, cloud, and atmospheric pressure, while positively associated with sun hour. Precipitation was positively correlated with cloud and pressure while negatively associated with sun hour (Table 3). The strongest correlation was observed between gust and wind speed (Table 3).
In Sinop city, the strongest correlation was observed between temperature and pressure in both Kendall's correlation and Spearman's correlation (Table 3). In Ordu city, the temperature was negatively correlated with pressure and sun hour. Moreover, the strongest correlation was observed between temperature and pressure (Table 3). In Giresun city, the temperature was negatively correlated with pressure and positively correlated with sun hour. The strongest correlation was observed between gust and wind speed (Table 3). In Trabzon city, the temperature was negatively correlated with wind speed, gust and pressure. Moreover, the gust was also positively correlated with wind speed and pressure. Furthermore, the strongest correlation was observed between temperature and pressure (Table 3). Finally in Rize city, the temperature was negatively correlated with pressure, gust, and pressure. Moreover, the gust was also positively correlated with wind speed. The strongest correlation was observed between gust and wind speed (Table 3).
Although the relationships between meteorological parameters based on the provinces of the Black Sea Region showed diversities, statistically positive or negative significant relationships suggest a synergistic effect on the spread of the COVID-19 confirmed cases. Different synergistic effects observed in the provinces under study can be due to demographic differences based on the diverse population density of the cities and the role of air pollutants observed in examined regions. These results can be supported by other empirical analyses in literature. Coccia (2021d) investigated the associations between the infected people of COVID-19 and environmental, demographic, and geographical variables in Italy. The results of the study suggested a positive correlation between people infected by COVID-19 and the average density of people per km2. In light of these scientific results, the increase in the number of COVID-19 cases especially in Trabzon, Samsun, and Ordu provinces can be attributed to the higher population densities of these regions compared to other cities. In another study, Coccia (2021b) suggested that regions with high levels of air pollutants and atmospheric stability (with low wind speed) may support longer permeance of viral agents in the air, such as the SARS-CoV-2 virus, fostering the diffusion of COVID-19 and impact in society. In the present work, the increase of COVID-19 confirmed cases in Giresun and Rize provinces, having low average wind speeds (8.41 km/h and 7.14 km/h, respectively) compared to average wind speed levels of other cities, is consistent with these results. In this context, these findings can support governments to prevent the diffusion of new variants of SARS-CoV-2 (leading to new effects of COVID-19) and similar viral agents in society by designing effective health policies also based on climate and environmental factors (COP26, Caliskan et al. 2020; Coccia 2021e; Coccia 2021f, g; Sarkodie and Owusu 2020).
5. Conclusions and limitations
The present work aimed to explain the relationship between the spread of COVID-19 and climate and geographic factors, analyzing COVID-19 confirmed cases of provinces located in the Black Sea region of Turkey from February to September 2021 having a high humidity. Results with Spearman's Correlation Coefficient suggests a statistically significant positive association between the average atmospheric pressure and the spread of the COVID-19 in Samsun province (Spearman’s correlation coefficient rs =0.86, p-value 0.05). A statistically significant positive association between the average precipitation and the spread of COVID-19 in Sinop province (Spearman’s correlation coefficient rs =0.79, p-value 0.05), and finally, a statistically significant negative association between the average sun hour and the spread of the COVID-19 in Samsun province (Spearman’s correlation coefficient rs = −0.89, p-value 0.01). When the interactions between parameters are analyzed, results seem to suggest synergistic effects.
The statistical evidence above seems in general to support weakly the hypothesis stated that the accelerated transmission of COVID-19 can be explained by high level of humidity because other climate factors play a critical role in region under study. In this study, the most important evidence is that COVID-19 cases in the Black Sea Region having the highest number of cases between February and August in Turkey can be explained by levels of pressure, sun hours, and precipitations. Since the Black Sea region is in a geographical area where the precipitation has a very high level, this climate factor may explain the number of COVID-19 confirmed cases. Therefore, the geographical conditions of the regions can be considered an effective factor in the spread of airborne viral agents that deserve to be considered to design effective health policies to face next pandemics.
Although this study shows interesting lessons and insights that can support effective mitigation policies for future epidemics or pandemics of respiratory diseases, the results are, of course, tentative. One of the problems is the difficulty of an accurate prediction of the number of reported and unreported cases of the COVID-19 cases in the region. Moreover, sources and data analyzed may only capture certain aspects of the ongoing relations under study between climate factors and COVID-19 diffusion. Another limitation is that confounding and situational factors could have an essential role in the transmission dynamics of COVID-19 and similar viral agents.
In future studies, in addition to the climate factors, aspects based on the socio-economic structures of regions and the behavioral characteristics of people have to be considered (Aykaç and Etiler 2021). As well as other factors to consider for supporting the robustness of factors determining transmission dynamics of new mutant coronaviruses should be age, gender, welfare level, quality, medical technologies and access to health services which play a vital role to clarify overall determinants of diffusion of airborne viral agents and fatality in society.
Despite these limitations, the results here clearly illustrate the vital role of some climate factors in viral transmission in specific regions that policymakers should consider designing effective control measures and health policies to minimize the effects of future variants of SARS-CoV-2 and/or new viral agents (Benati and Coccia, 2022, 2022a; Coccia and Benati, 2018). In short, countries should evaluate all environmental and socioeconomic parameters that affect the transmission of viral agents to improve pandemic plans to cope with unknown infectious diseases similar to COVID-19. Finally, in this prevention strategy is basic to support investments in personal protective equipment, new technologies based on high-tech non-invasive medical ventilators (Coccia 2022b; Coccia 2023b) and effective vaccination plans (Magazzino et al., 2023) that can mitigate mortality in regions at high risk of an outbreak.
Supplementary Materials
The following supporting information can be downloaded at the website of this paper posted on Preprints.org.
Author Contributions
Aytac Perihan Akan (APA), Mario Coccia (MC): “Conceptualization, APA; methodology, APA; validation, APA and MC; formal analysis, APA.; investigation, APA and MC; data curation, APA; writing—original draft preparation, APA; writing—review and editing, APA and MC.; visualization, APA and MC.; supervision, MC. All authors have read and agreed to the published version of the manuscript.”.
Funding
This research received no external funding.
Institutional Review Board Statement
Not applicable for studies not involving humans or animals.
Informed Consent Statement
Not applicable for studies not involving humans.
Data Availability Statement
The datasets used and analyzed during the current study are available from the corresponding author on reasonable request.
Conflicts of Interest
The authors declare no conflict of interest.
References
- Akan, A.P. 2022. Transmission of COVID-19 pandemic (Turkey) associated with short-term exposure of air quality and climatological parameters. Environ. Sci. Pollut. Res. [CrossRef]
- Akan, A.P.; Coccia, M. 2022. Changes of Air Pollution between Countries Because of Lockdowns to Face COVID-19 Pandemic. Applied Sciences 12, no. 24: 12806. [CrossRef]
- Aral, N., Bakır, H., 2022. Spatiotemporal Analysis of Covid-19 in Turkey. Sustain. Cities Soc. 76:103421. [CrossRef]
- Aykaç, N., Etiler, N., 2021. COVID-19 mortality in Istanbul in association with air pollution and socioeconomic status: an ecological study. Environ. Sci. Pollut. Res. [CrossRef]
- Bashir, M. F., Ma, B., Bilal, Komal, B., Bashir, M.A., Tan, D., Bashir, M., 2020. Correlation between climate indicators and COVID-19 pandemic in New York, USA. Sci. Total Environ. 728:138835. [CrossRef]
- Bolaño-Ortiz, T. R., Camargo-Caicedo, Y., Puliafito, S. E., Ruggeri, M.F., Bolaño-Diaz, S., Pascual-Flores, R., Saturno, J., Ibarra-Espinosa, S., Mayol-Bracero, O.L., Torres-Delgado, E., Cereceda-Balic, F., 2020. Spread of SARS-CoV-2 through Latin America and the Caribbean region: A look from its economic conditions, climate and the air pollution indicators. Environ. Res. 191:109938. [CrossRef]
- Benati I.,Coccia M. 2022. Global analysis of timely COVID-19 vaccinations: improving governance to reinforce response policies for pandemic crises. International Journal of Health Governance, vol. 27, No. 3, pp. 240-253. [CrossRef]
- Benati I.,Coccia M. 2022a. Effective Contact Tracing System Minimizes COVID-19 Related Infections and Deaths: Policy Lessons to Reduce the Impact of Future Pandemic Diseases. Journal of Public Administration and Governance, vol. 12, n. 3, pp. 19-33. https://doi.org/.
- Bontempi E., Coccia M., 2021. International trade as critical parameter of COVID-19 spread that outclasses demographic, economic, environmental, and pollution factors, Environmental Research, vol. 201, number 111514. [CrossRef]
- Bontempi E., Coccia M., Vergalli S., Zanoletti A. 2021. Can commercial trade represent the main indicator of the COVID-19 diffusion due to human-to-human interactions? A comparative analysis between Italy, France, and Spain, Environmental Research, vol. 201, Article number 111529. [CrossRef]
- Cai, Q.C., Lu, J., Xu, Q.F., Guo, Q., Xu, D.Z., Sun, Q.W., Yang, H., Zhao, G.M., Jiang, Q.W., 2007. Influence of meteorological factors and air pollution on the outbreak of severe acute respiratory syndrome. Public Health. 121:258-265. https://doi:10.1016/j.puhe.2006.09.023.
- Caliskan, B, Özengin N, Cindoruk SS (2020) Air quality level, emission sources and control strategies in Bursa/Turkey. Atmos. Pollut. Res. 11:2182-2189. [CrossRef]
- Coccia M. 2020. Effects of Air Pollution on COVID-19 and Public Health, Research Article-Environmental Economics-Environmental Policy, ResearchSquare,. https://www.researchsquare.com/article/rs-41354/v1.
- Coccia, M., 2020a. An index to quantify environmental risk of exposure to future epidemics of the COVID-19 and similar viral agents: Theory and practice. Environ. Res. 191:110155. [CrossRef]
- Coccia M. 2021. Recurring waves of Covid-19 pandemic with different effects in public health, Journal of Economics Bibliography - J. Econ. Bib. – JEB, vol. 8, n. 1, pp. 28-45. http://dx.doi.org/10.1453/jeb.v8i1.2184.
- Coccia, M. 2021a. Pandemic Prevention: Lessons from COVID-19. Encyclopedia, vol. 1, n. 2, pp. 433-444. [CrossRef]
- Coccia, M., 2021b. The effects of atmospheric stability with low wind speed and of air pollution on the accelerated transmission dynamics of COVID-19. Int. J. Environ. Sci. 78(1):1-27. [CrossRef]
- Coccia, M., 2021c. How do low wind speeds and high levels of air pollution support the spread of COVID-19? Atmos. Pol. Res. 12:437-445. [CrossRef]
- Coccia, M., 2021d. Effects of the spread of COVID-19 on public health of polluted cities: results of the first wave for explaining the dejà vu in the second wave of COVID-19 pandemic and epidemics of future vital agents. Environ. Sci. Pollut. Res. 28:19147–19154. [CrossRef]
- Coccia, M., 2021e. Comparative Critical Decisions in Management. In: Farazmand A. (eds), Global Encyclopedia of Public Administration, Public Policy, and Governance. Springer Nature, Cham. [CrossRef]
- Coccia, M., 2021f. The relation between length of lockdown, numbers of infected people and deaths of Covid-19, and economic growth of countries: Lessons learned to cope with future pandemics similar to Covid-19 and to constrain the deterioration of economic system. Sci. Total Environ. 775:145801. [CrossRef]
- Coccia, M., 2021g. Pandemic Prevention: Lessons from COVID-19. Encyclopedia. 1:433-444. [CrossRef]
- Coccia M. 2022. Optimal levels of vaccination to reduce COVID-19 infected individuals and deaths: A global analysis. Environmental Research, vol. 204, Part C, March 2022, Article number 112314. [CrossRef]
- Coccia M. 2022a. The Spread of the Novel Coronavirus Disease-2019 in Polluted Cities: Environmental and Demographic Factors to Control for the Prevention of Future Pandemic Diseases. In: Faghih, N., Forouharfar, A. (eds) Socioeconomic Dynamics of the COVID-19 Crisis. Contributions to Economics: 351-369. Springer, Cham. [CrossRef]
- Coccia, M., 2022b. Preparedness of countries to face COVID-19 pandemic crisis: Strategic positioning and factors supporting effective strategies of prevention of pandemic threats. Environ. Res. 203:111678. [CrossRef]
- Coccia M. 2022c. COVID-19 pandemic over 2020 (with lockdowns) and 2021 (with vaccinations): similar effects for seasonality and environmental factors. Environmental Research, vol. 208, n. 112711. [CrossRef]
- Coccia M. 2023. Effects of strict containment policies on COVID-19 pandemic crisis: lessons to cope with next pandemic impacts. Environmental science and pollution research international, 30(1), 2020–2028. [CrossRef]
- Coccia M. 2023a. High potential of technology to face new respiratory viruses: mechanical ventilation devices for effective healthcare to next pandemic emergencies, Technology in Society, vol. 73, May 2023, n. 102233. [CrossRef]
- Coccia M. 2023b. Sources, diffusion and prediction in COVID-19 pandemic: lessons learned to face next health emergency[J]. AIMS Public Health, 2023, 10(1): 145-168. doi: 10.3934/publichealth.2023012. [CrossRef]
- Coccia M., Benati I. 2018. Comparative Evaluation Systems, A. Farazmand (ed.), Global Encyclopedia of Public Administration, Public Policy, and Governance, Springer Nature. [CrossRef]
- COP26, 2021. 26th Conference of Parties, United Nations Framework Convention on Climate Change. https://unfccc.int/conference/glasgow-climate-change-conference-october-november-2021 (accessed: December 2021).
- Coşkun, H., Yıldırım, N., Gündüz, S., 2021. The spread of COVID-19 virus through population density and wind in Turkey cities. Sci. Total Environ. 751:141663. [CrossRef]
- COVID-19, 2021. Information about COVID-19 cases from the Republic of Turkey Ministry of Health. https://covid19.saglik.gov.tr/?_Dil=2 (accessed: September 2021).
- Doğan, B., Jebli, M. B., Shahzad, K. Farooq, T. H., Shahzad, U., 2020. Investigating the Effects of Meteorological Parameters on COVID-19: Case Study of New Jersey, United States. Environ. Res. 191:110148. [CrossRef]
- Domingo, J.L., Marquès, M., Rovira, J., 2020. Influence of airborne transmission of SARS-CoV-2 on COVID-19 pandemic. A review. Environ. Res.188:109861. [CrossRef]
- Guo, C., Bo, Y., Lin, C., Li, H. B., Zeng, Y., Zhang, Y., Hossain, M. S., Chan, J. W. M., Yeung, D. W., Kwok, K.-on, Wong, S. Y. S., Lau, A. K. H., Lao, X. Q., 2021. Meteorological factors and COVID-19 incidence in 190 countries: An observational study. Sci. Total Environ. 757:143783. [CrossRef]
- Haque, S.E., Rahman, M., 2020. Association between temperature, humidity, and COVID-19 outbreaks in Bangladesh. Environ Sci Policy. 114:253-255. [CrossRef]
- Hoang, T., Tran, T. T. A., 2021. Ambient air pollution, meteorology, and COVID-19 infection in Korea. J. Med. Virol. 93:878–885. [CrossRef]
- Iha, Y., Kinjo, T., Parrott, G., Higa, F., Mori, H., Fujita, J., 2016. Comparative epidemiology of influenza A and B viral infection in a subtropical region: a 7-year surveillance in Okinawa, Japan. BMC Infect. Dis.16(1), 650:1-8. [CrossRef]
- Islam, A. R. Md. T., Hasanuzzaman, Md., Azad, Md. A. K., Salam, R., Toshi, F. Z., Khan, Md. S. I., Alam, G. M. M., Ibrahim, S. M., 2021. Effect of meteorological factors on COVID-19 cases in Bangladesh. Environ. Dev. Sustain. 23:9139-9162. [CrossRef]
- Kolluru, S. S. R., Patra, A. K., Nazneen, Nagendra, S. M. S., 2021. Association of air pollution and meteorological variables with COVID-19 incidence: Evidence from five megacities in India. Environ. Res. 195:110854. [CrossRef]
- Lin, Y., Chang, C., Chang, S., Chen, P., Lin, C., Wang, Y., 2013. Temperature, nitrogen dioxide, circulating respiratory viruses and acute upper respiratory infections among children in Taipei, Taiwan: a population-based study. Environ. Res.120:109–118. [CrossRef]
- Maatoug, A. B., Triki, M. B., Fazel, H., 2021. How do air pollution and meteorological parameters contribute to the spread of COVID-19 in Saudi Arabia? Environ. Sci. Pollut. Res. 28:44132-44139. [CrossRef]
- Magazzino C., Mele M., Coccia M. 2022. A machine learning algorithm to analyze the effects of vaccination on COVID-19 mortality. Epidemiology and infection, 1–24. Advance online publication. [CrossRef]
- Núñez-Delgado A., Bontempi E., Coccia M., Kumar M., Farkas K., Domingo, J. L. 2021. SARS-CoV-2 and other pathogenic microorganisms in the environment, Environmental Research, Volume 201, n. 111606. [CrossRef]
- Olak, A. S., Santos, W. S., Susuki, A. M., Pott-Junior, H., Skalny, A. V., Tinkov, A. A., Aschner, M., Pinese, J. P. P., Urbano, M. R., Paoliello, M. M. B., 2021. Meteorological parameters and cases of COVID-19 in Brazilian cities: an observational study. J. Toxicol. Environ. Health A. 1-15. [CrossRef]
- Pal, S. K., Masum, M. H., 2021. Effects of meteorological parameters on COVID-19 transmission trends in Bangladesh. Environ. Sustain. [CrossRef]
- Rahimi, N.R., Fouladi-Fard, R., Aali, R., Shahryari, A., Rezaali, M., Ghafouri, Y., Ghalhari, M.R., Asadi-Ghalhari, M., Farzinnia, B., Gea, O.C., Fiore, M., 2021. Bidirectional association between COVID-19 and the environment: A systematic review. Environ. Res. 194:110692. [CrossRef]
- Rosario, D.K.A., Mutz, Y.S., Bernardes, P.C., Conte-Junior, C.A., 2020. Relationship between COVID-19 and weather: Case study in a tropical country. Int. J. Hyg. Environ. Health. 229:113587. [CrossRef]
- Şahin, M., 2020. Impact of weather on COVID-19 pandemic in Turkey. Sci. Total Environ. 728:138810. [CrossRef]
- Sanchez-Piedra, C., Cruz-Cruz, C., Gamiño-Arroyo, A. E., Prado-Galbarro, F. J., 2021. Effects of air pollution and climatology on COVID-19 mortality in Spain. Air Qual. Atmos. Health. 14:1869-1875. [CrossRef]
- Sarkodie, S.A., Owusu, P.A., 2020. Impact of meteorological factors on COVID-19 pandemic: Evidence from top 20 countries with confirmed cases. Environ. Res. 191:110101. [CrossRef]
- Sarwar, S., Shahzad, K., Fareed, Z., Shahzad, U., 2021. A study on the effects of meteorological and climatic factors on the COVID-19 spread in Canada during 2020. J. Environ. Health Sci. Eng. [CrossRef]
- Schuit, M., Ratnesar-Shumate, S., Yolitz, J., Williams, G., Weaver, W., Green, B., Miller, D., Krause, M., Beck, K., Wood, S., Holland, B., Bohannon, J., Freeburger, D., Hooper, I., Biryukov, J., Altamura, L.A., Wahl, V., Hevey, M., Dabisch, P., 2020. Airborne SARS-COV-2 is rapidly inactivated by simulated sunlight. J. Infect. Dis. 222:564-571. https://doi:10.1093/infdis/jiaa334.
- Srivastava, A. 2021. COVID-19 and air pollution and meteorology-an intricate relationship: A review. Chemosphere. 263:128297. [CrossRef]
- Tosepu, R., Gunawan, J., Effendy, D.S., Ahmad, L.O.A.I., Lestari, H., Bahar, H., Asfian, P., 2020. Correlation between weather and covid-19 pandemic in Jakarta, Indonesia. Sci. Total Environ. 725:138436. [CrossRef]
- TUIK, 2021. The population of provinces in 2021. https://cip.tuik.gov.tr/# (accessed: September 2021).
- WHO, World Health Organization, 2021. https://covid19.who.int/ (accessed: 27 September 2021).
- Wu, Y., Jing, W., Liu, J., Ma, Q., Yuan, J., Wang, Y., Du, M., Liu, M., 2020. Effects of temperature and humidity on the daily new cases and new deaths of COVID-19 in 166 countries. Sci. Total Environ. 729: 139051. [CrossRef]
- WWO, World Weather Online, 2021. https://www.worldweatheronline.com (accessed: September 2021).
- Xie, J., Zhu, Y., 2020. Association between ambient temperature and COVID-19 infection in122 cities from China. Sci. Total Environ. 724:138201. [CrossRef]
- Yao, Y., Pan, J., Wang, W., Liu, Z., Kan, H., Qui, Y., Meng, X., Wang, W., 2020. Association of particular matter pollution and case fatality rate of COVID-19 in 49 Chinese cities. Sci. Total Environ. 741:140396. [CrossRef]
- Yuan, J., Yun, H., Lan, W., Wang, W., Sullivan, S.G., Jia, S., Bittles, A.H., 2006. A climatologic investigation of the SARS-CoV outbreak in Beijing, China. Am. J. Infect. Control. 34(4):234-236. https://doi:10.1016/j.ajic.2005.12.006.
- Zoran, M.A., Savastru, R.S., Savastru, D.M., Tautan, M.N., 2020. Assessing the relationship between surface levels of PM2.5and PM10 particulate matter impact on COVID-19 in Milan, Italy. Sci. Total Environ. 738:139825. [CrossRef]
Figure 1.
Locations of examined provinces in Turkey including Samsun (41°15'25.2''N, 36°4'42.6''E), Sinop (41°39'3.6''N, 34°51'19.8''E), Ordu (40°46'28.2''N, 37°26'52.8''E), Giresun (40°33'59.4''N, 38°35'56.4''E), Trabzon (40°49'6.6''N, 39°47'27.6''E), Rize (40°54'59.4''N, 40°51'16.2''E). Adopted from Google MapsTM(2023).
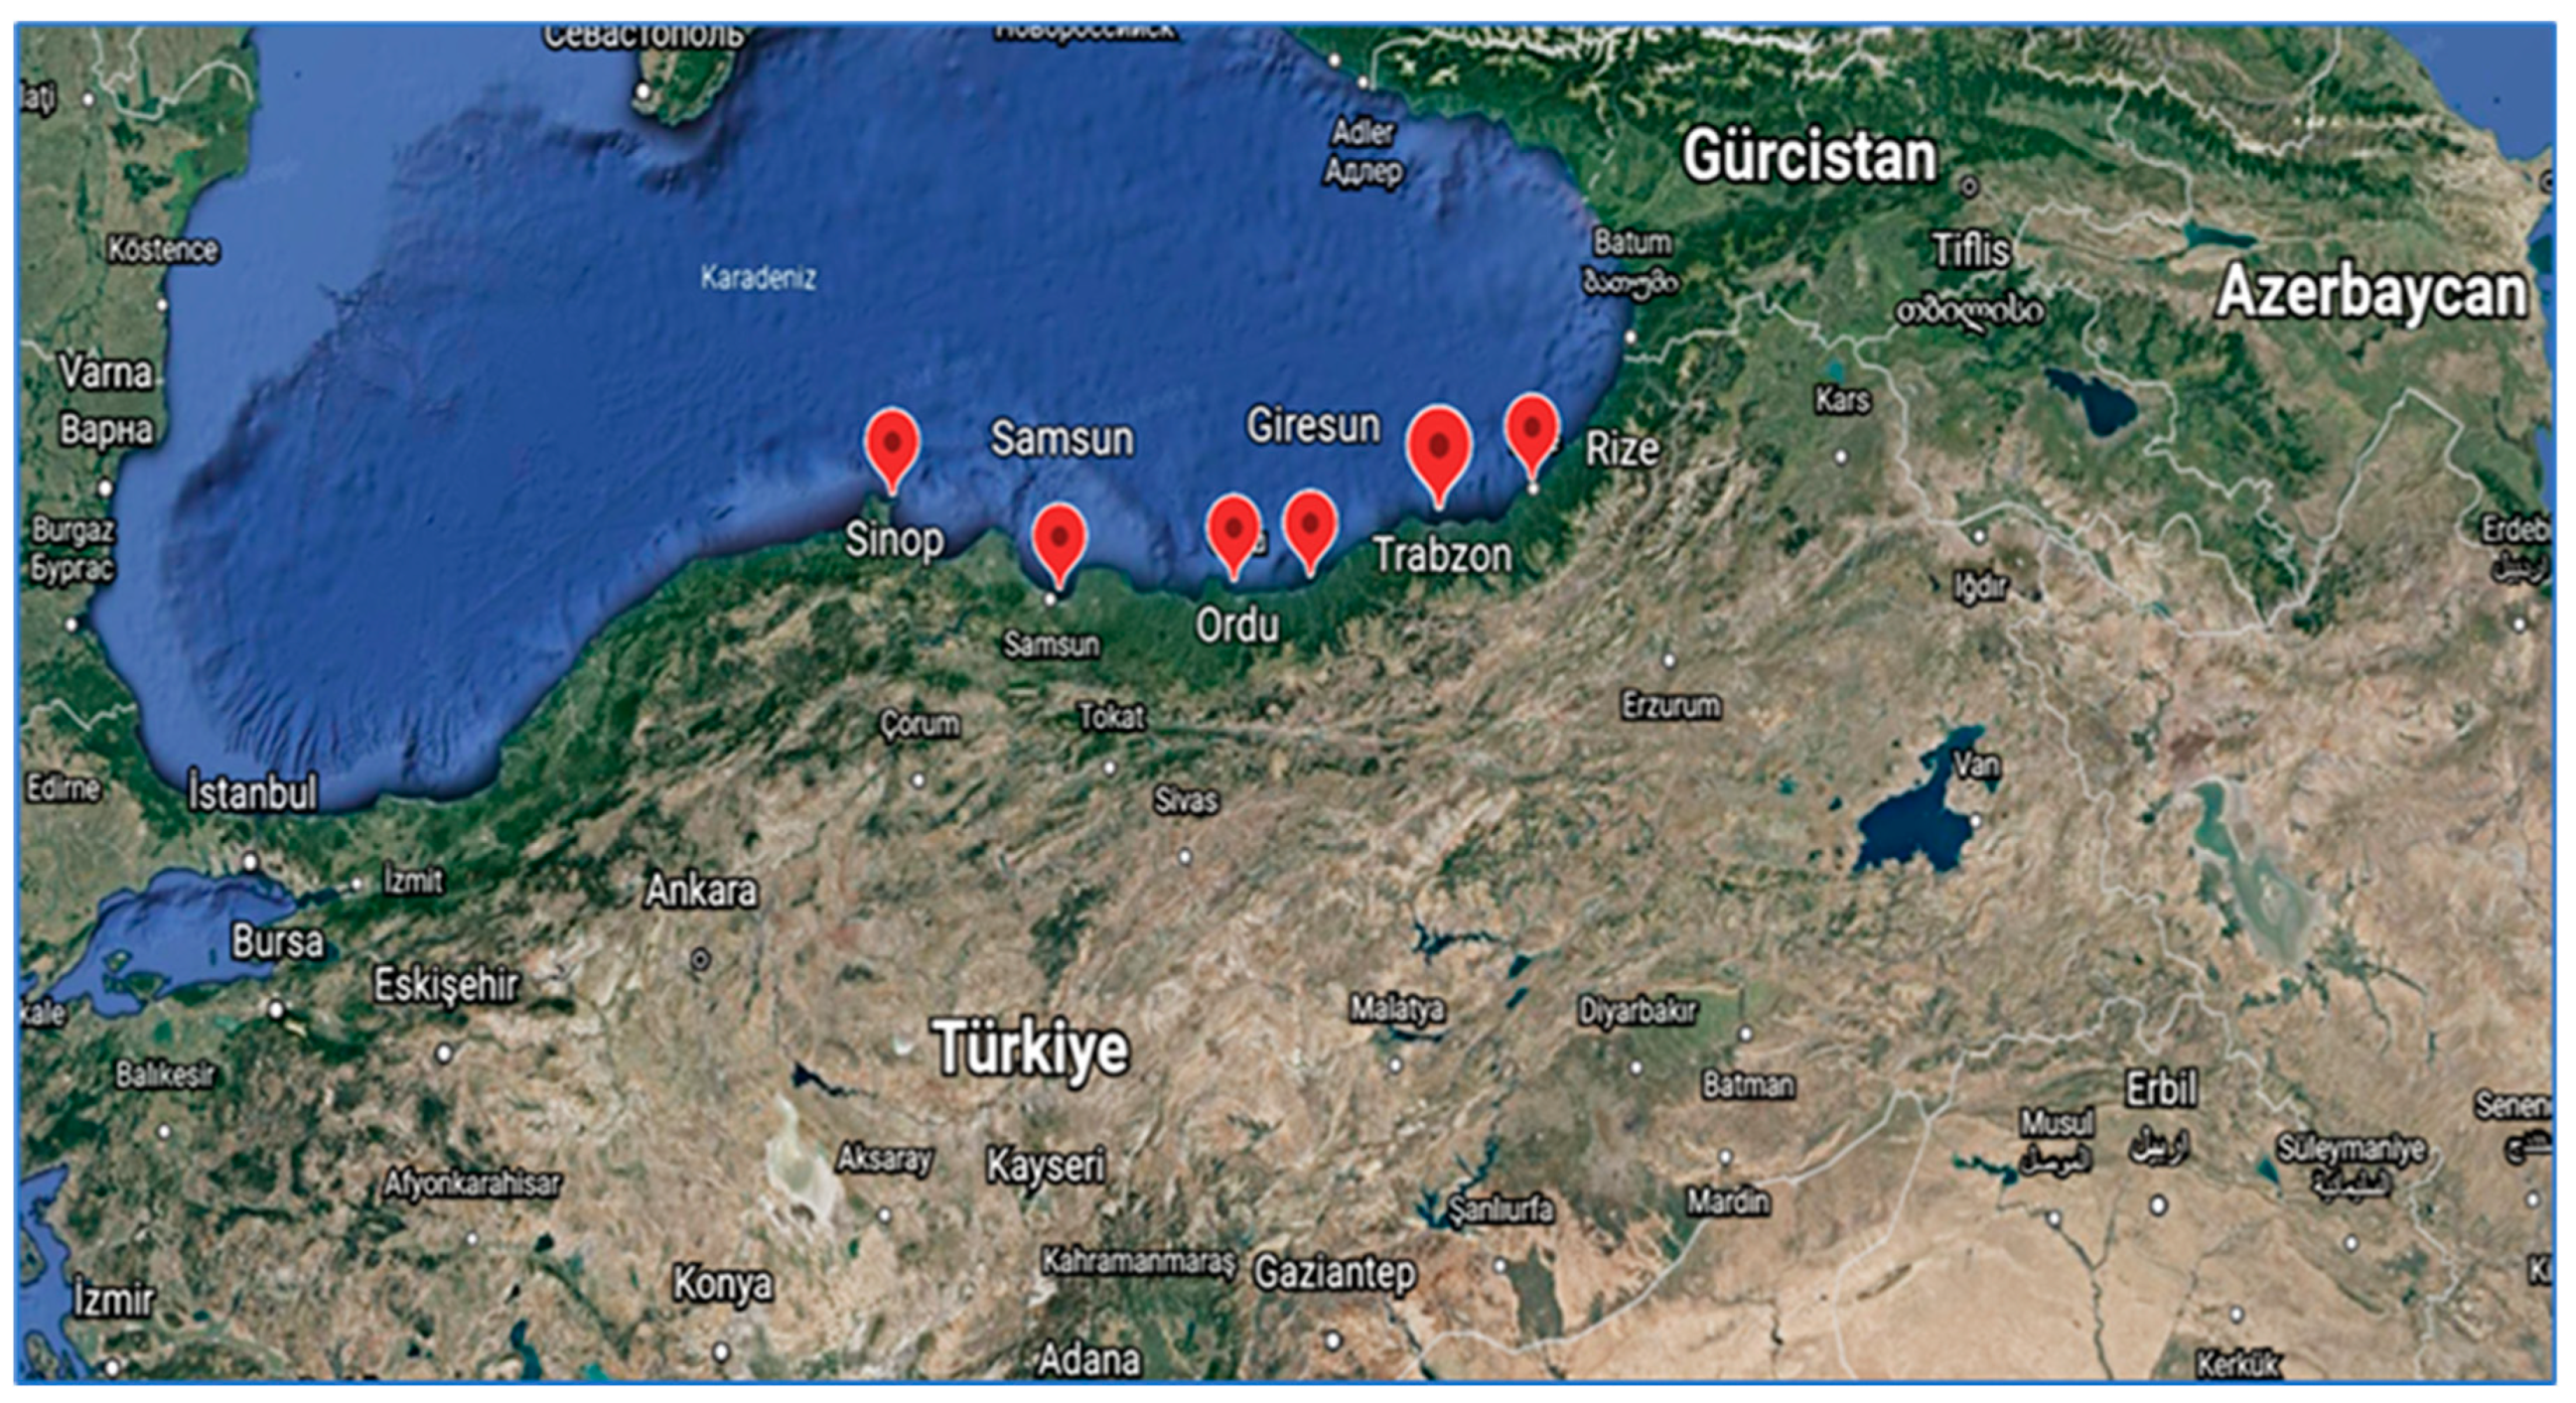
Figure 2.
Change of average climate parameters of cities under study from February 08, 2021 to May 03, 2021: (A)= temperature, (B)= wind speed, (C)= gust, (D)= precipitation, (E)= humidity, (F)= cloud, (G)= pressure and (H)= sun hour, respectively.
Figure 2.
Change of average climate parameters of cities under study from February 08, 2021 to May 03, 2021: (A)= temperature, (B)= wind speed, (C)= gust, (D)= precipitation, (E)= humidity, (F)= cloud, (G)= pressure and (H)= sun hour, respectively.
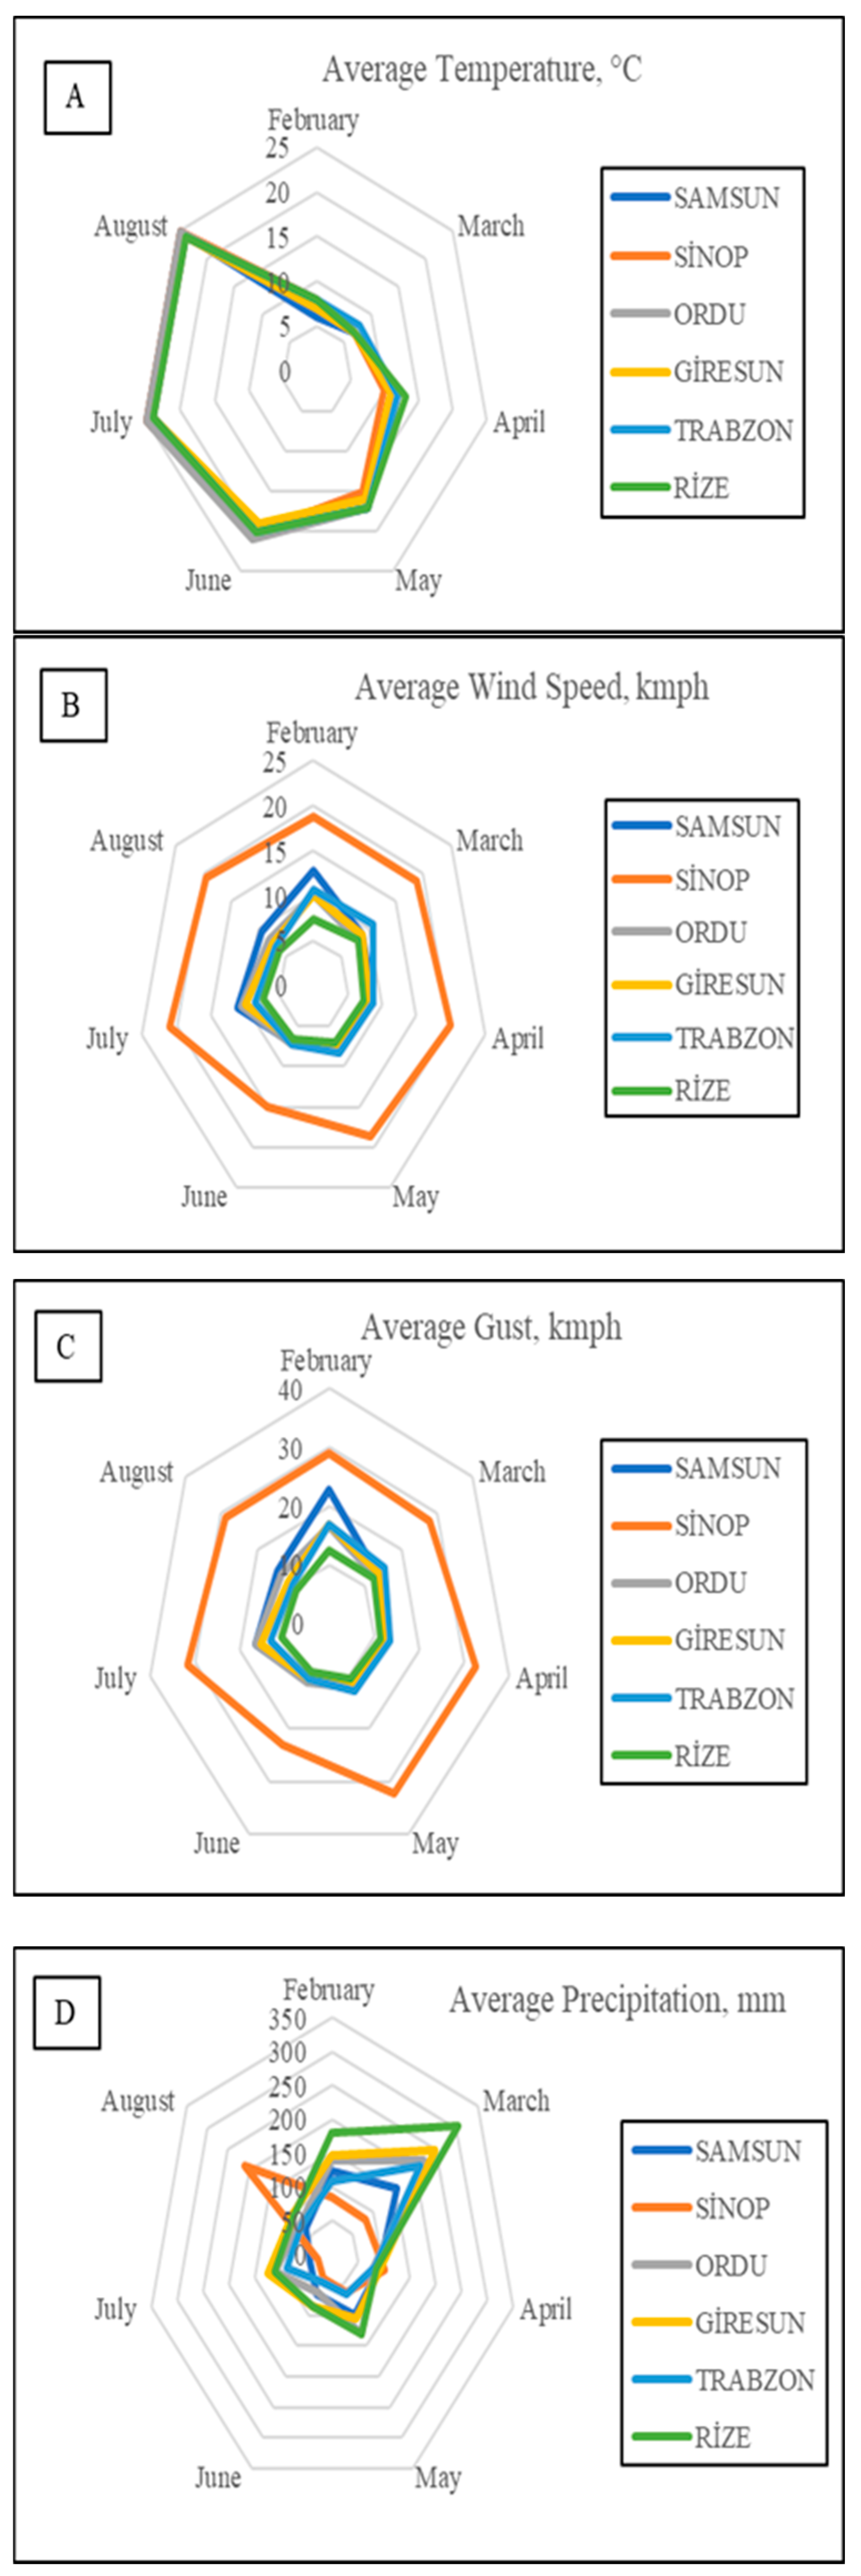
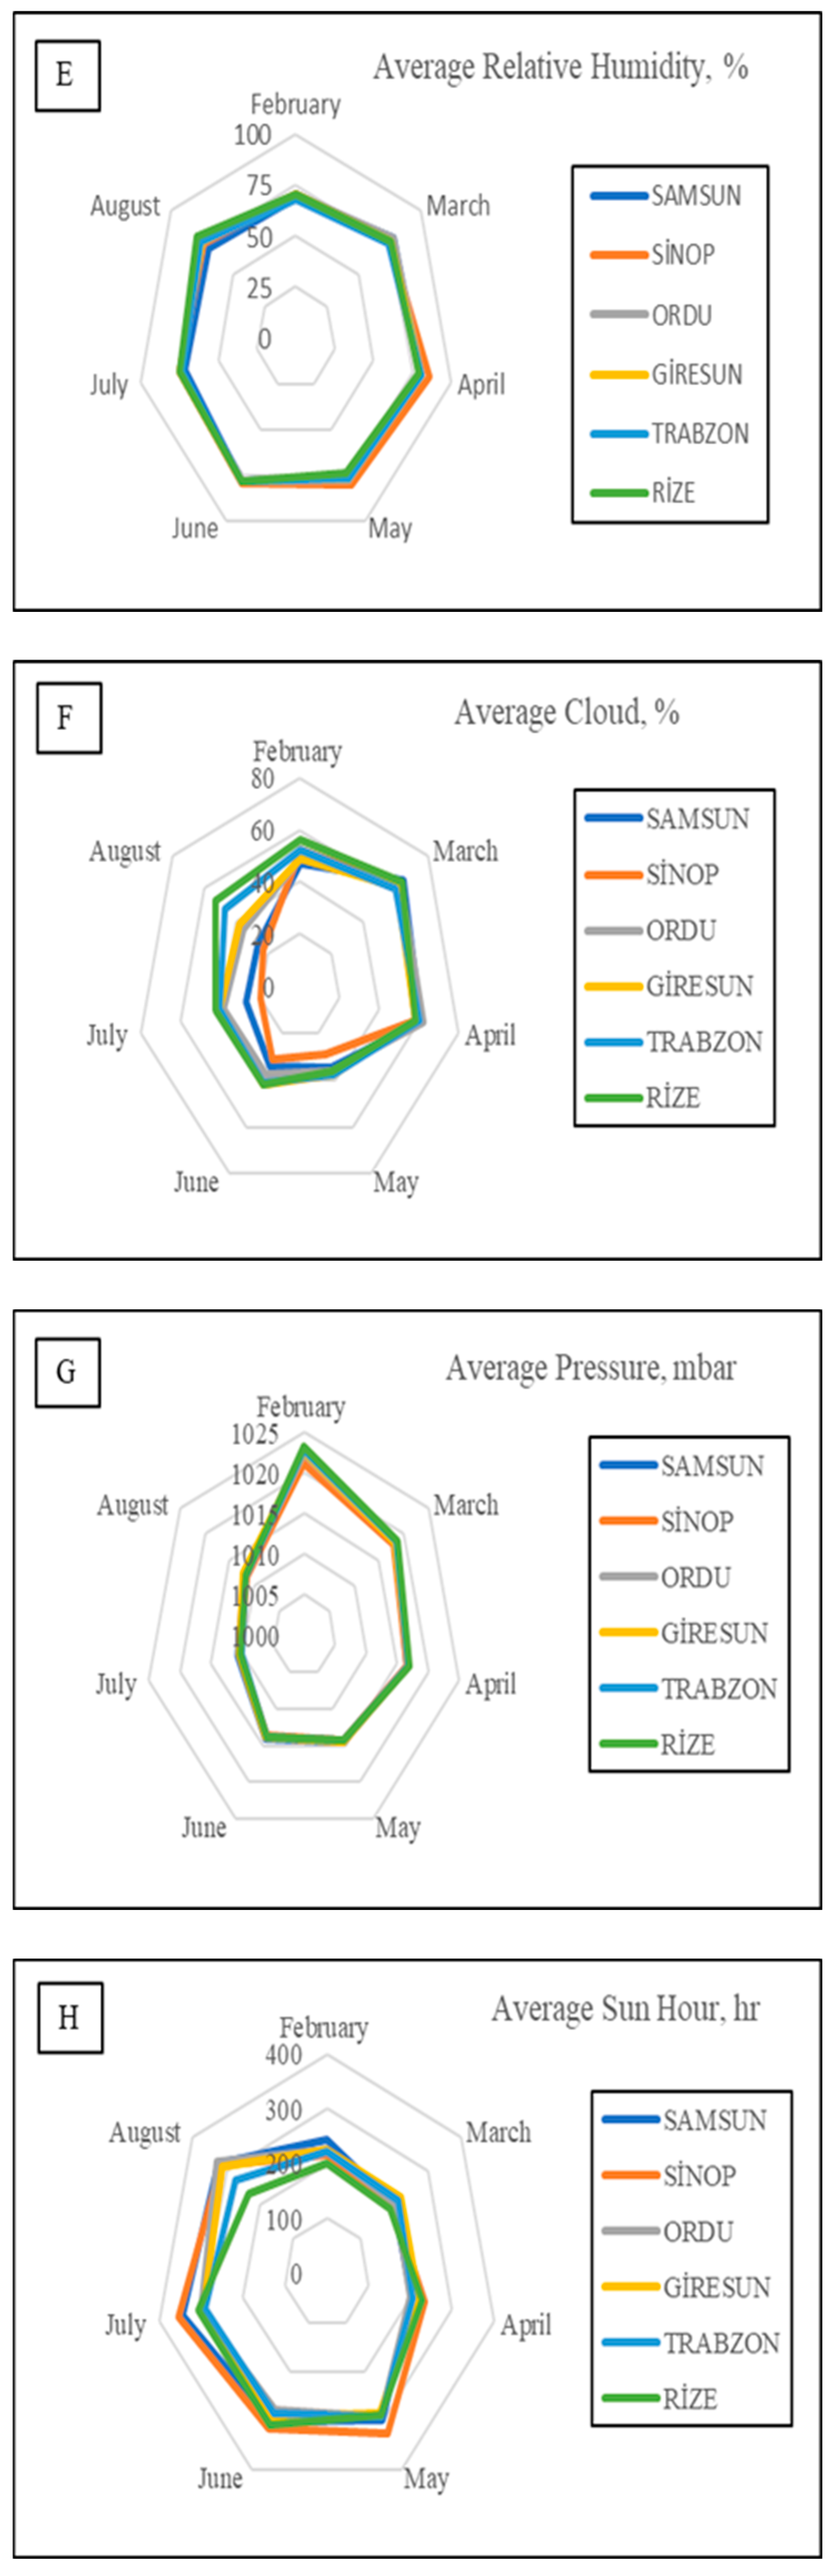
Figure 3.
Logarithmic variations in both COVID-19 confirmed cases/100,000 people and meteorological parameters with respect to provinces under study including (A) Sinop, (B) Samsun, (C) Ordu, (D) Giresun, (E) Trabzon, (F) Rize.
Figure 3.
Logarithmic variations in both COVID-19 confirmed cases/100,000 people and meteorological parameters with respect to provinces under study including (A) Sinop, (B) Samsun, (C) Ordu, (D) Giresun, (E) Trabzon, (F) Rize.
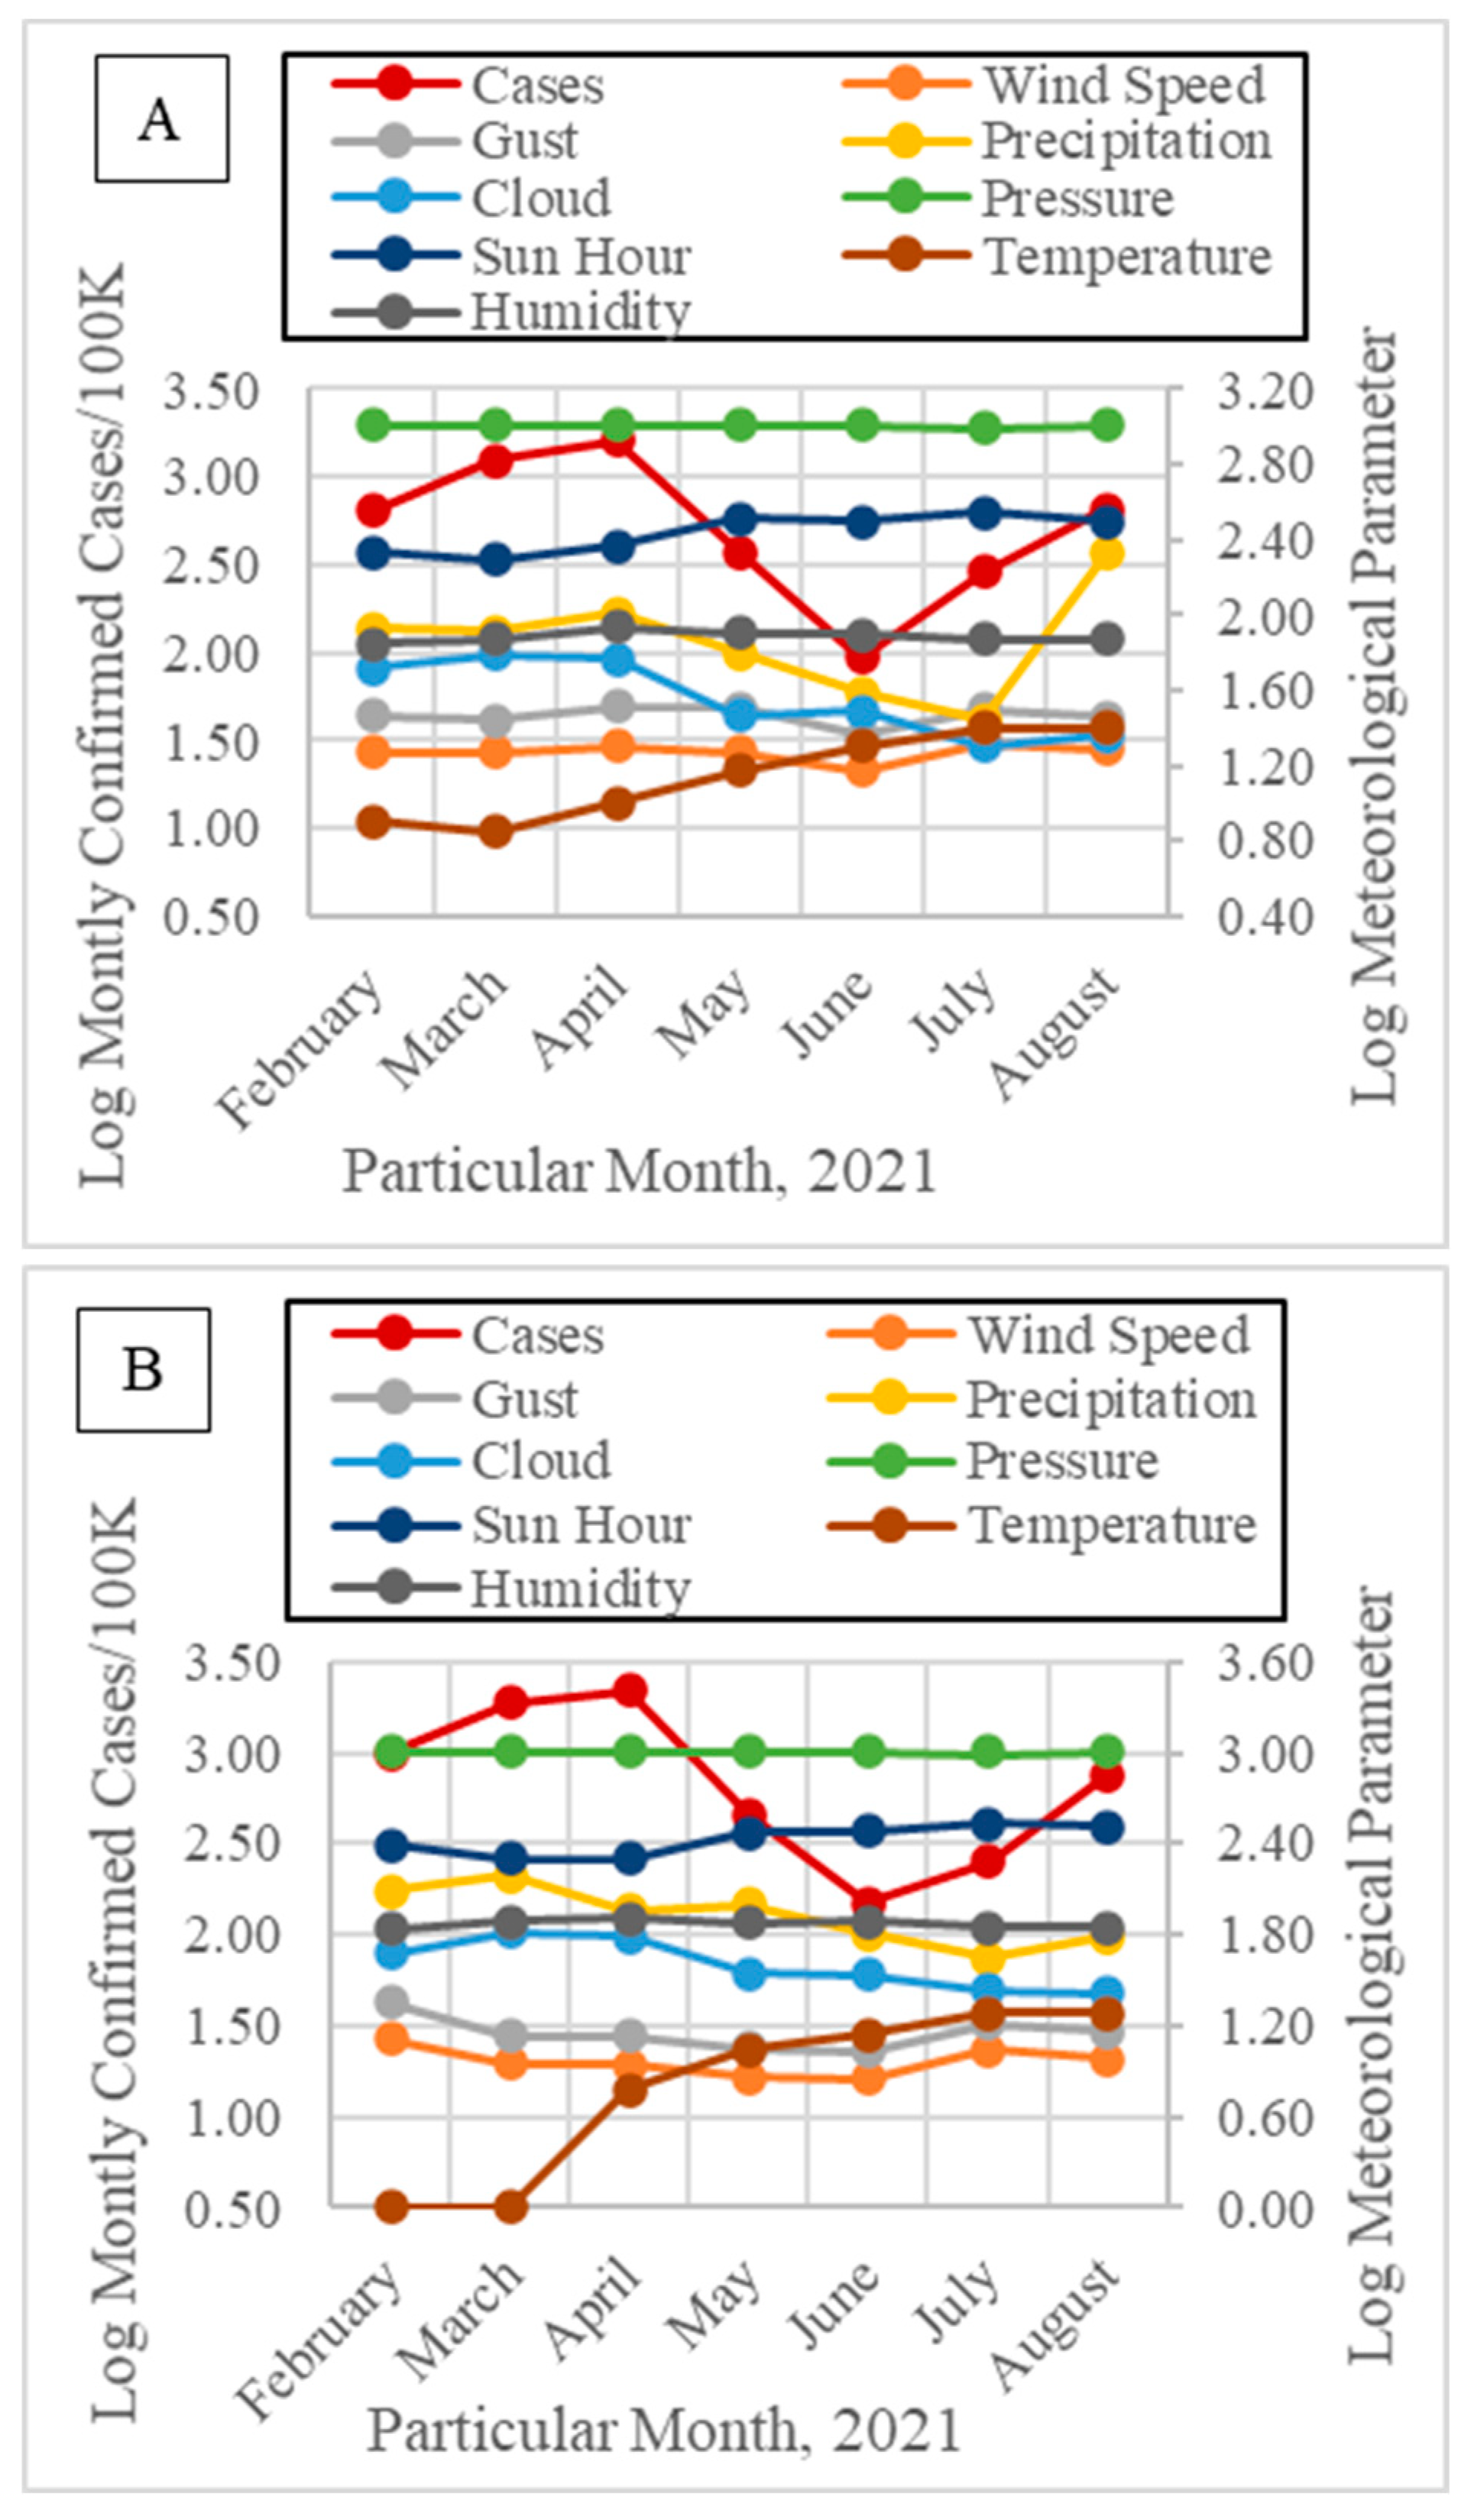
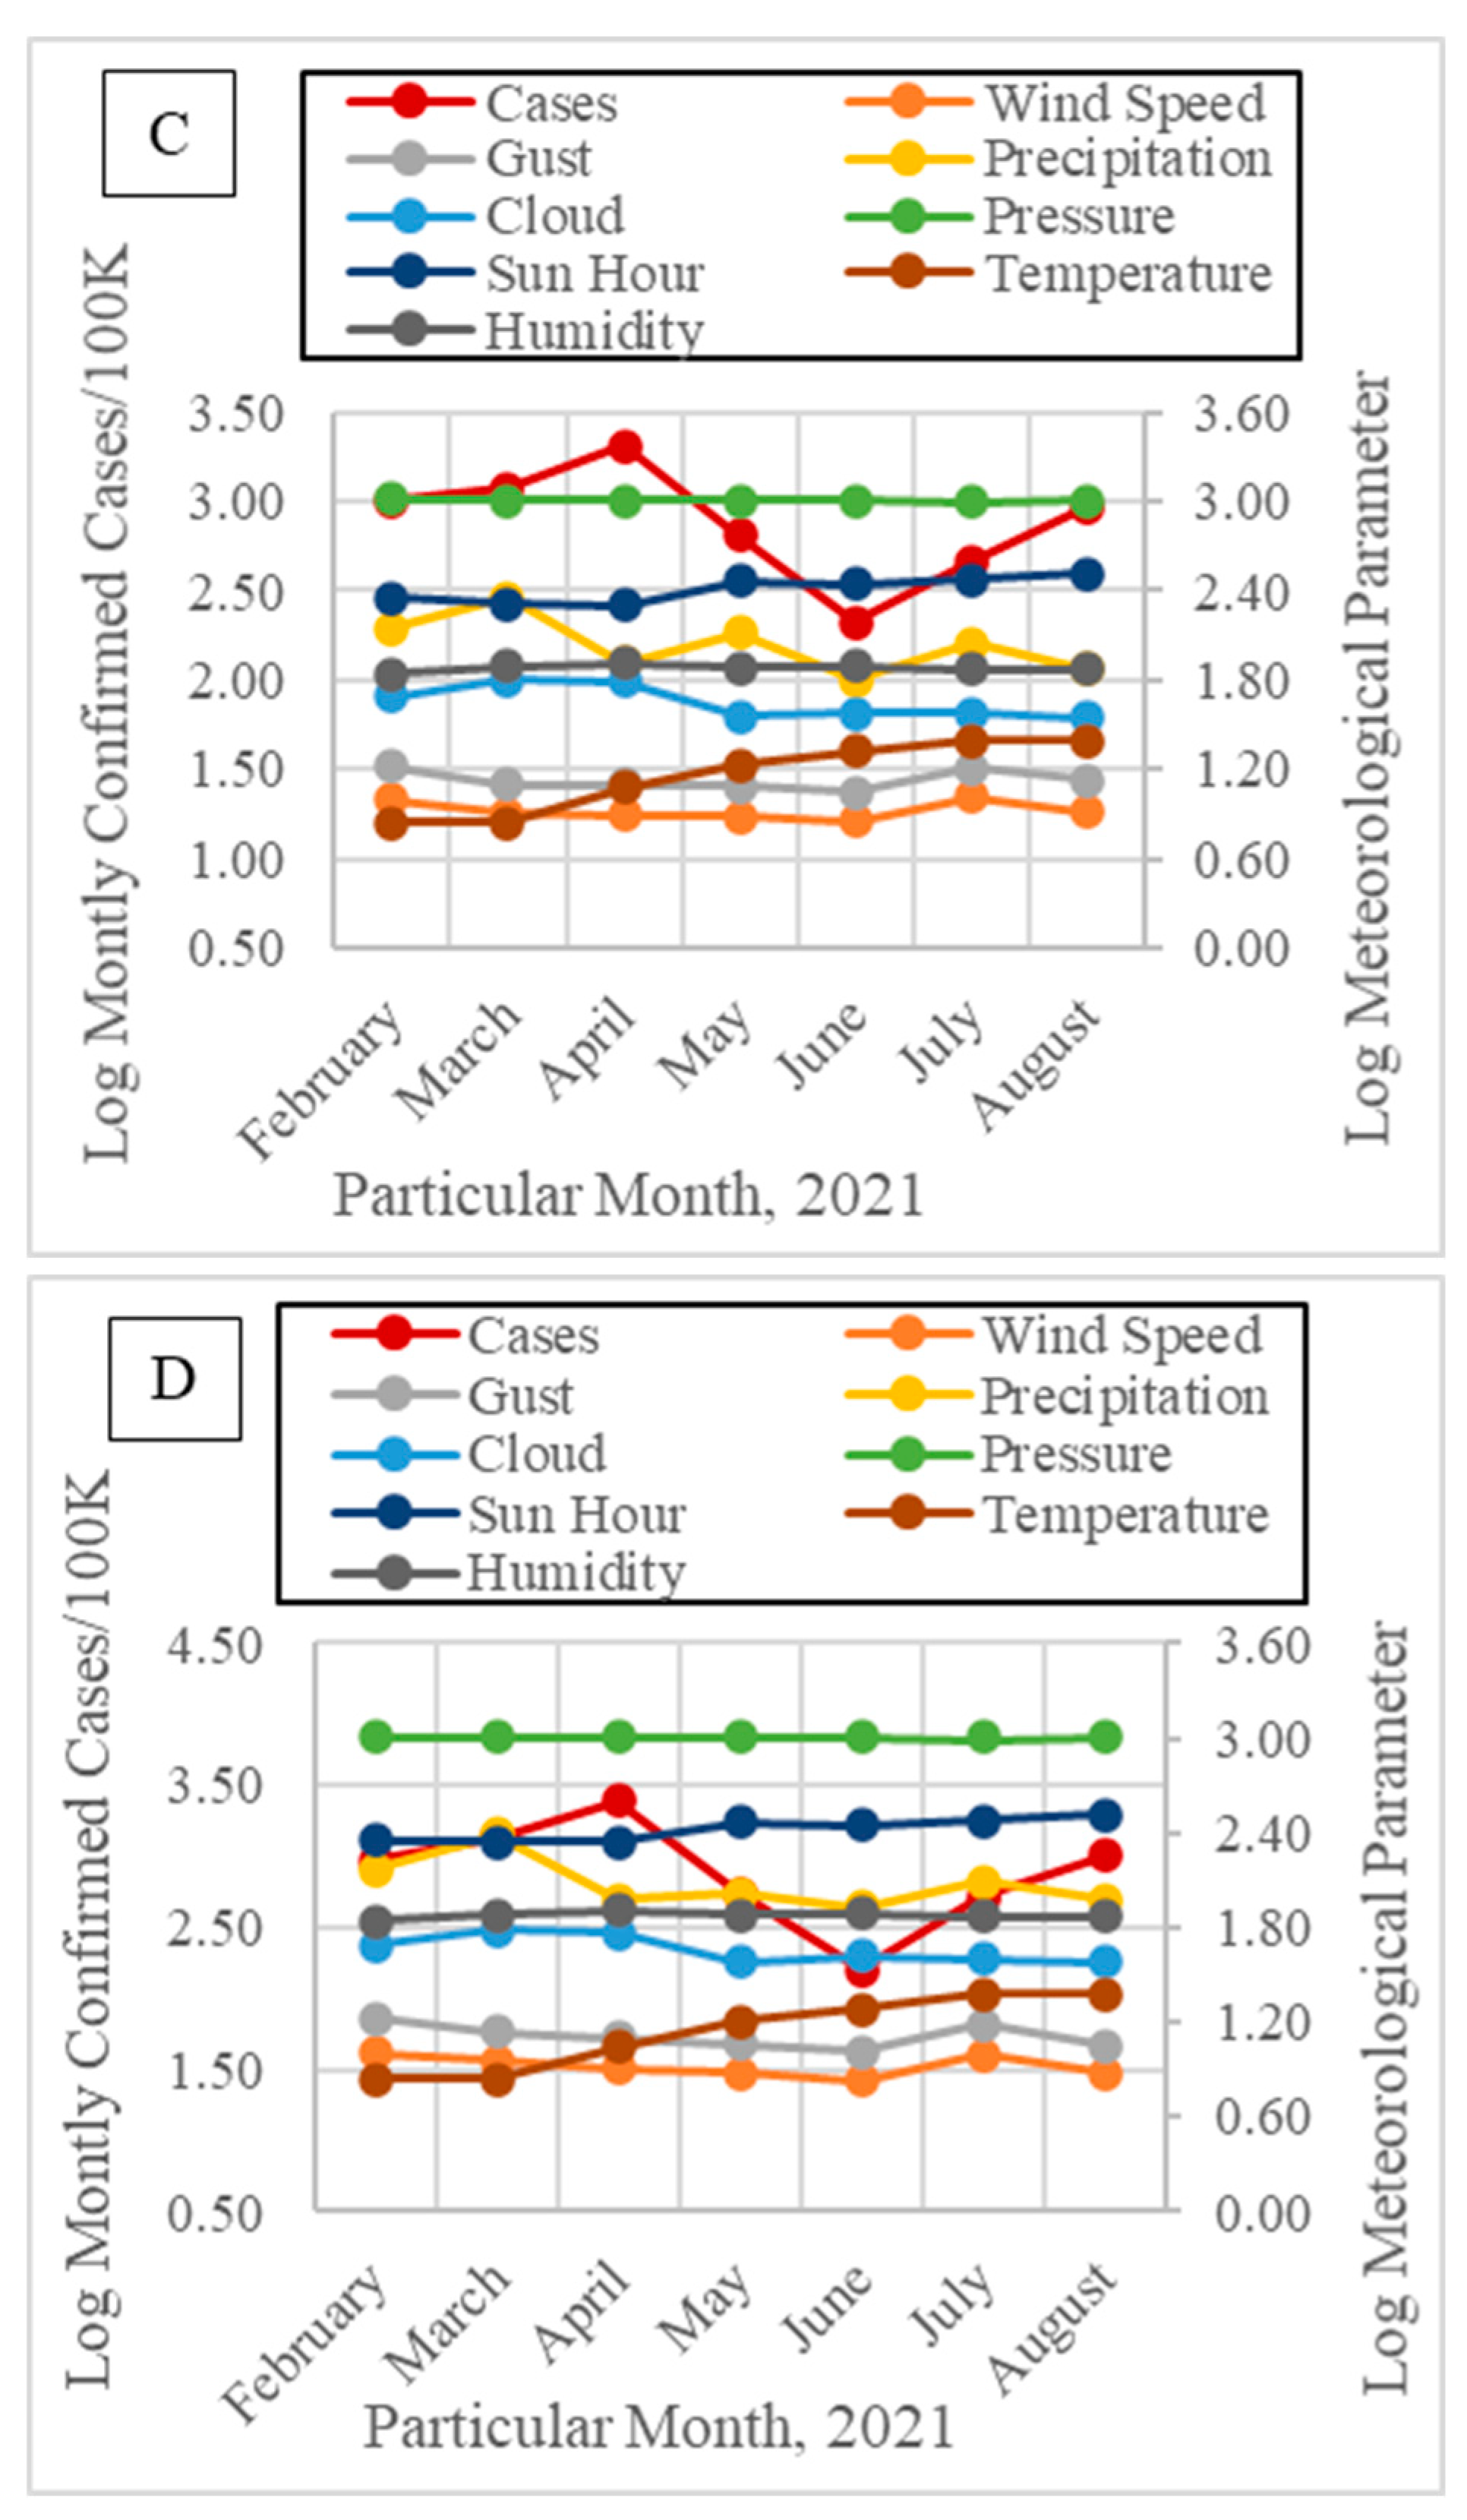
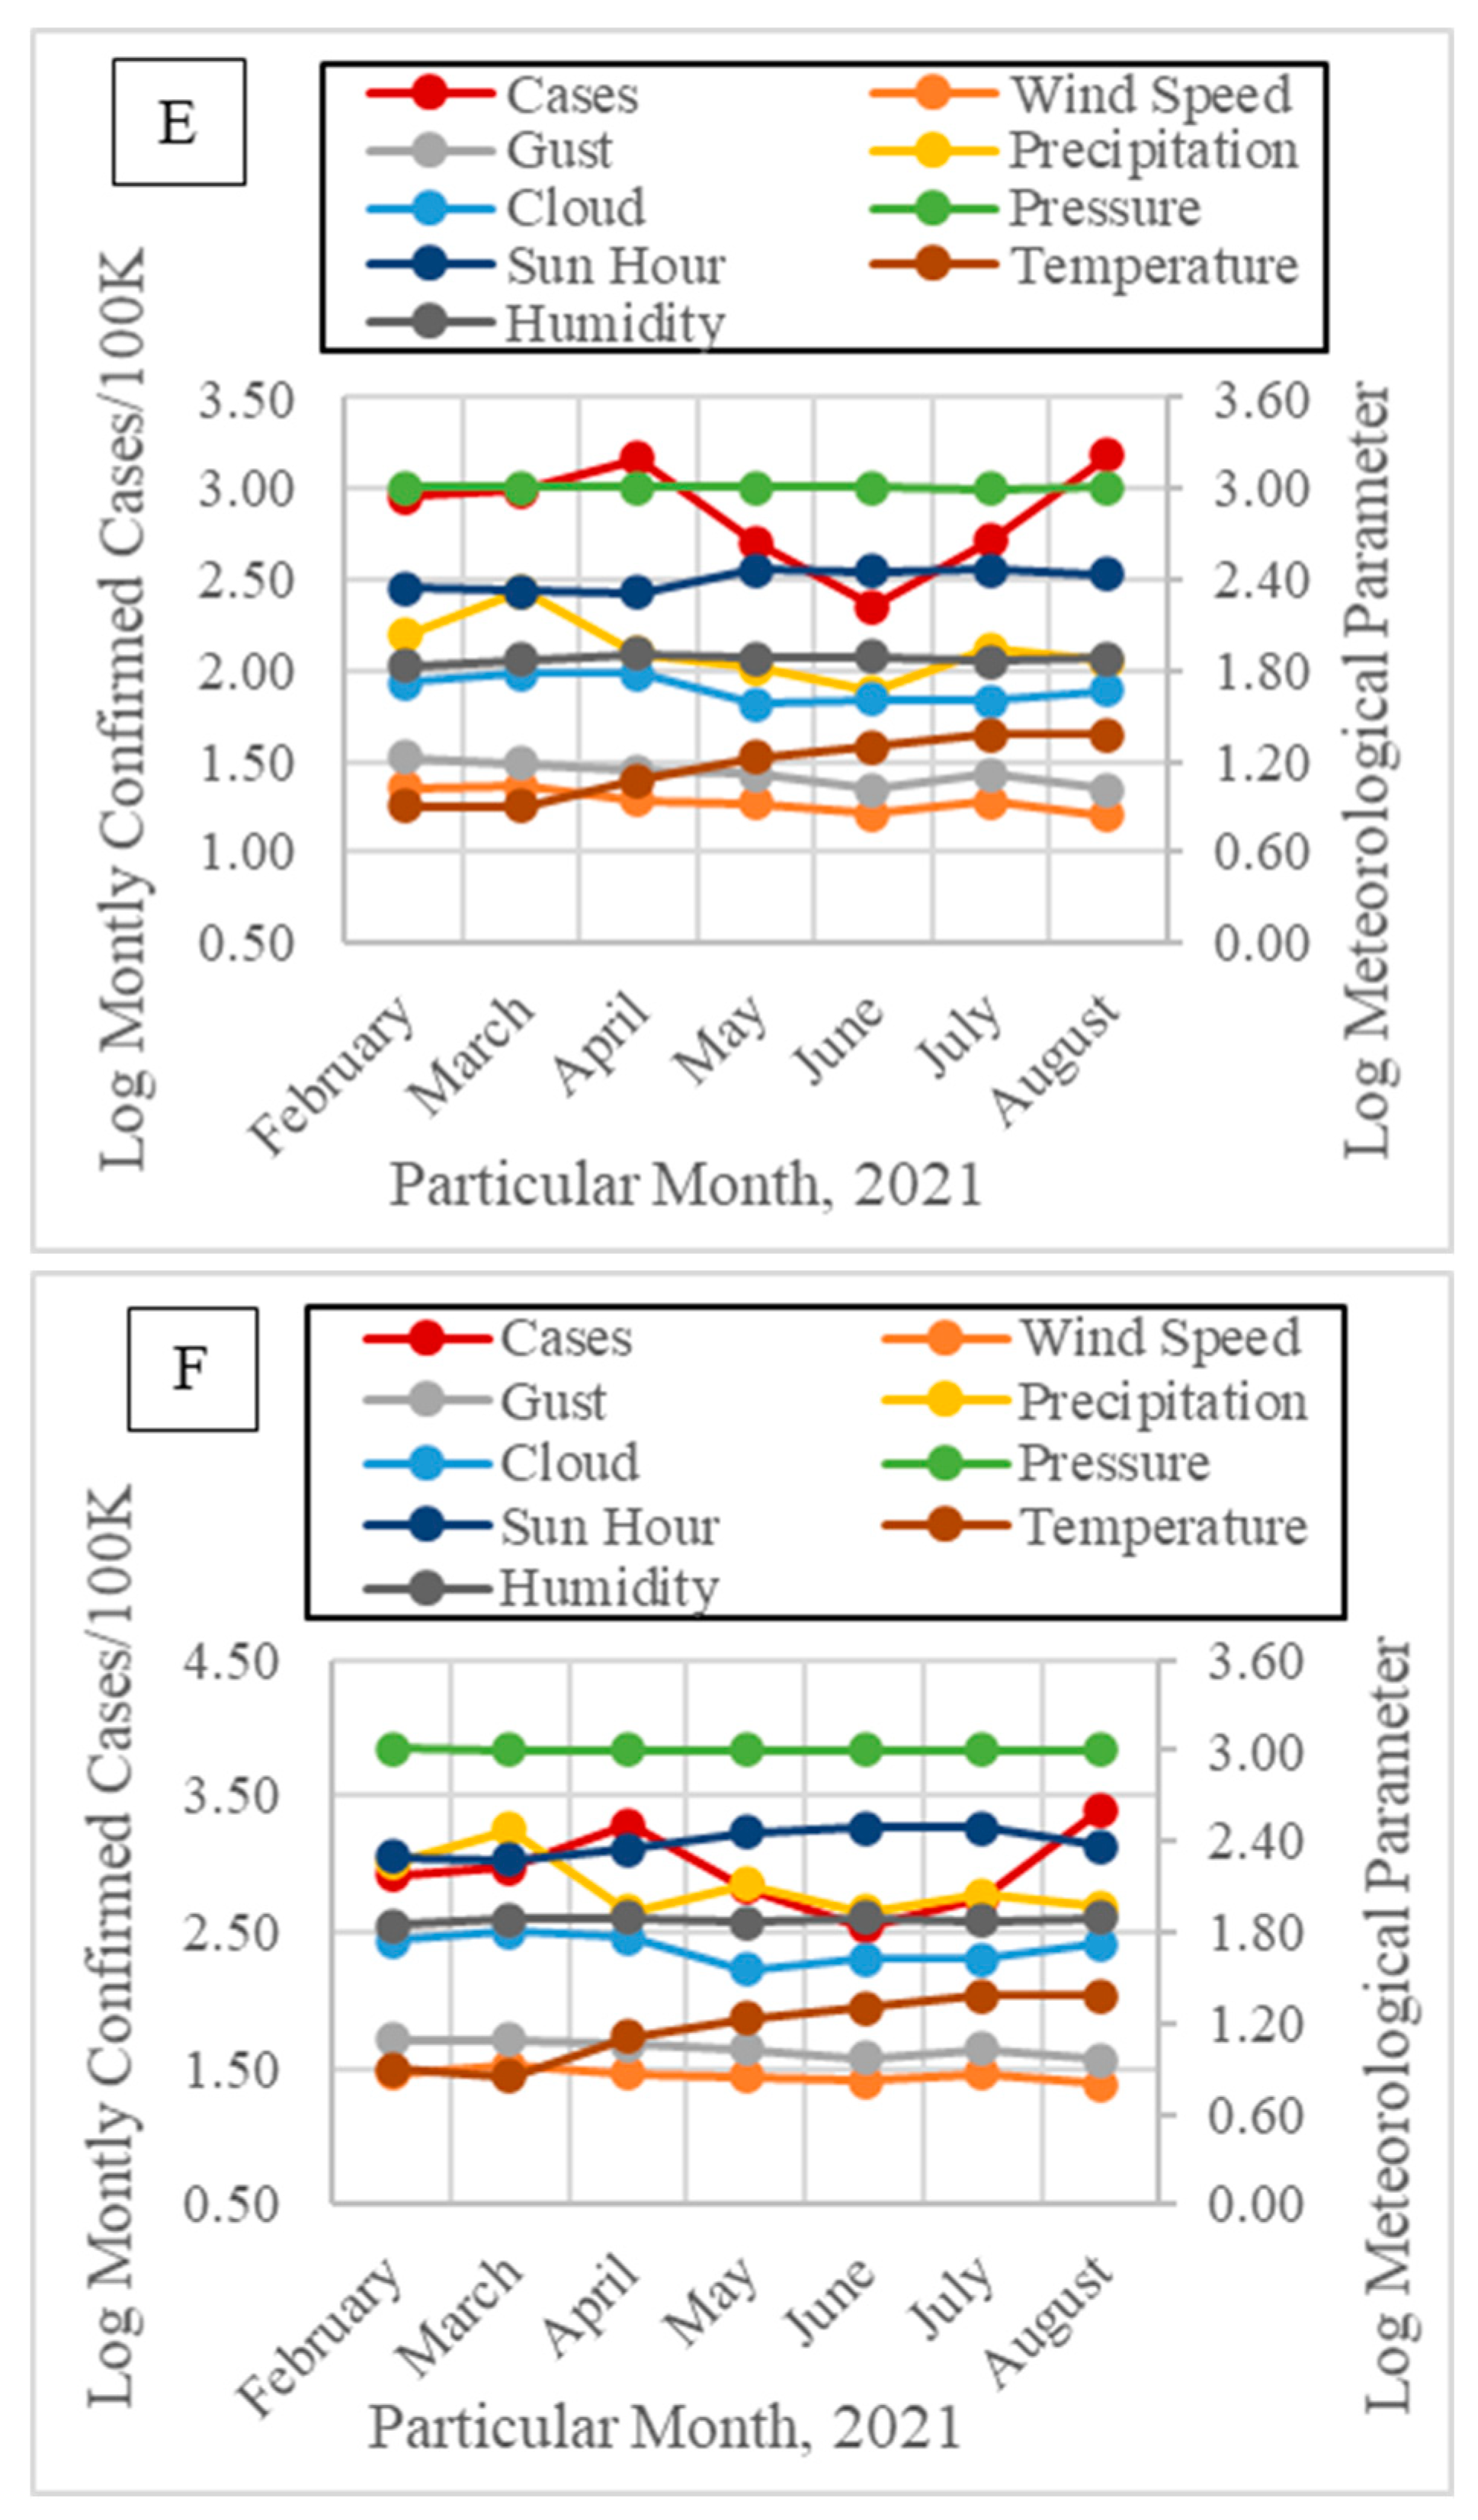
Table 1.
Summary of the recent studies regarding the impact of meteorological parameters on the transmission of the COVID-19 pandemic.
Table 1.
Summary of the recent studies regarding the impact of meteorological parameters on the transmission of the COVID-19 pandemic.
| Study period | Study region (Country) |
Parameters | Analyses | Results/Suggestions | References |
| February 3, 2020 - July 14, 2020 | Spain | Solar radiation, precipitation, daily temperature, and wind speed | Multilevel Poisson regression | Air pollution can be a key factor in understanding the mortality rate for COVID-19 in Spain. | Sanchez-Piedra et al. 2021 |
| July 1 to October 31, 2020 | Brazil | Atmospheric pressure, temperature, relative humidity, wind speed, solar irradiation, sunlight, dew point temperature, and total precipitation | Pearson's correlation test and Regression tree analysis | The results encourage meteorological information as critical in future risk assessment models. | Olak et al. 2021 |
| March 9 to November 19, 2020 | Saudi Arabia | Wind speed and temperature | Poisson regression | Air pollution could be a significant risk factor for respiratory infections and virus transmission. | Maatoug et al. 2021 |
| February to April 10, 2020 | Canada | Temperature and humidity | The quantile-on-quantile (QQR) approach | Temperature and humidity have a direct negative relationship with COVID-19 infections. | Sarwar et al. 2021 |
| April to May 2020 | Bangladesh | Rainfall, temperature, relative humidity, and wind speed | Spearman's rank correlation | Significant positive associations between relative humidity and COVID-19 cases, while with temperature both positive and negative associations |
Pal and Masum, 2021 |
| February to June 2020 | India | Temperature, relative humidity, wind speed | Pearson correlation | Meteorological parameters may have promoted COVID-19 incidences, especially the confirmed cases. | Kolluru et al. 2021 |
| February 3 to May 5, 2020 | Korea | Temperature, wind speed, humidity, and air pressure |
Generalized Additive Model (GAM) | There was a significant nonlinear relationship between daily temperature, humidity and COVID-19 confirmed cases. | Hoang and Tran, 2021 |
| March 01 to July 07, 2020 | United States | Temperature and humidity | Pearson, Spearman, and Kendall rank correlations | The temperature was found to have a negative correlation, while humidity highlighted a positive correlation with daily new cases of COVID-19 in New Jersey. | Doğan et al. 2020 |
| As of March 27, 2020 | 166 countries excluding China | Temperature and humidity | A log-linear Generalized Additive Model (GAM) | The COVID-19 pandemic may be partially suppressed with temperature and humidity increases | Wu et al. 2020 |
Table 2.
Kendal and Spearman correlation coefficients based on the associations between the COVID-19 confirmed cases and meteorological parameters in the Black Sea region provinces from February to September 2021.
Table 2.
Kendal and Spearman correlation coefficients based on the associations between the COVID-19 confirmed cases and meteorological parameters in the Black Sea region provinces from February to September 2021.
| Kendall's Correlation Coefficients, rk | ||||||
| Provinces of the Black Sea Region, a geographical region of Turkey | ||||||
| Parameters | Samsun | Sinop | Ordu | Giresun | Trabzon | Rize |
| Minimum Temperature | -0.451 | -0.350 | -0.488 | -0.350 | -0.050 | -0.150 |
| Maximum Temperature | -0.333 | -0.350 | -0.451 | -0.350 | -0.143 | -0.150 |
| Average Temperature | -0.390 | -0.390 | -0.451 | -0.350 | -0.050 | -0.195 |
| Average Wind Speed | 0.143 | 0.321 | 0.195 | 0.143 | 0.143 | 0.098 |
| Average Gust | 0.143 | 0.321 | 0.195 | 0.143 | 0.143 | 0.098 |
| Average Precipitation | 0.429 | 0.619 | 0.429 | 0.143 | 0.333 | 0.195 |
| Average Relative Humidity | 0.098 | 0.098 | 0.150 | 0.150 | 0.000 | 0.293 |
| Average Cloud | 0.524 | 0.429 | 0.390 | 0.293 | 0.488 | 0.390 |
| Average Pressure | 0.714* | 0.333 | 0.429 | 0.333 | 0.048 | 0.143 |
| Average Sun Hour | -0.810* | -0.429 | -0.524 | -0.429 | -0.429 | -0.524 |
| Spearman's Correlation Coefficients, rs | ||||||
| Provinces of the Black Sea Region, a geographical region of Turkey | ||||||
| Parameters | Samsun | Sinop | Ordu | Giresun | Trabzon | Rize |
| Minimum Temperature | -0.673 | -0.491 | -0.703 | -0.491 | -0.910 | -0.182 |
| Maximum Temperature | -0.607 | -0.491 | -0.673 | -0.491 | -0.179 | -0.182 |
| Average Temperature | -0.649 | -0.523 | -0.673 | -0.491 | -0.091 | -0.198 |
| Average Wind Speed | 0.250 | 0.306 | 0.143 | 0.252 | 0.143 | 0.144 |
| Average Gust | 0.250 | 0.321 | 0.558 | 0.214 | 0.107 | 0.900 |
| Average Precipitation | 0.571 | 0.786* | 0.464 | 0.214 | 0.429 | 0.054 |
| Average Relative Humidity | 0.234 | 0.072 | 0.273 | 0.182 | 0.054 | 0.487 |
| Average Cloud | 0.714 | 0.607 | 0.631 | 0.505 | 0.667 | 0.631 |
| Average Pressure | 0.857* | 0.500 | 0.679 | 0.500 | 0.143 | 0.214 |
| Average Sun Hour | -0.893** | -0.571 | -0.679 | -0.536 | -0.643 | -0.679 |
*Indicates that correlation is significant at 0.05 level (2-tailed); **Indicates that correlation is significant at 0.01 level (2-tailed).
Disclaimer/Publisher’s Note: The statements, opinions and data contained in all publications are solely those of the individual author(s) and contributor(s) and not of MDPI and/or the editor(s). MDPI and/or the editor(s) disclaim responsibility for any injury to people or property resulting from any ideas, methods, instructions or products referred to in the content. |
© 2023 by the authors. Licensee MDPI, Basel, Switzerland. This article is an open access article distributed under the terms and conditions of the Creative Commons Attribution (CC BY) license (http://creativecommons.org/licenses/by/4.0/).
Copyright: This open access article is published under a Creative Commons CC BY 4.0 license, which permit the free download, distribution, and reuse, provided that the author and preprint are cited in any reuse.


