Submitted:
02 June 2023
Posted:
05 June 2023
You are already at the latest version
Abstract
We investigated the influence of the fuel change, from pure hydrogen to hydrogen-ammonia mixture at different percentage, on the electrochemical behaviour of 50 mm in diameter Solid Oxide Fuel Cells (SOFC) with sputtered thin buffer layers of Gd doped Ceria, varying the working temperatures from 800°C to 650°C. The results show that the performances of the cells are not affected by the fuel change for the high working temperatures (800°C and 750°C). As an example, a power density value of 802 mW∙cm-2 at 1 A∙cm-2 is found when directly feeding the cell with 8 Nml∙min-1cm-2 of ammonia and with an equivalent flowrate of 12 Nml∙min-1cm-2 of H2. These power density output values are comparable to those obtained in industrial State of Art (SoA) SOFC cells with screen printed buffer layers fed with higher hydrogen flowrates, thanks to the improved electrochemical performances obtained in the case of cells with sputtered thin buffer layers of Gd doped Ceria. At lower working temperatures (700°C and 650°C), slight changes in the electrochemical behaviour of the cells are observed. Nevertheless, also in this temperature range, we obtain an output current density value of 0.54 A∙cm-2 in pure ammonia flowrate of 12 Nml min-1cm-2, at 800 mV and 700°C, equal to the value observed in SoA button cells with industrial screen printed GDC barrier layer fuelled with 16 Nml∙min-1cm-2 of H2. These results pave the way towards the use of innovative SOFC structures with sputtered thin buffer layers fuelled by ammonia.
Keywords:
sofc
; ammonia
; sputtered barrier layers
; fuel flexibility
Introduction
The urgent need of green, renewable, sustainable and efficient energy production solutions able to replace fossil fuels in industrial processes, brought attention to hydrogen and hydrogen related technologies, nowadays considered among the most promising alternatives to fossil fuels-related energy production. However, hydrogen production is still heavily dependent on fossil fuels, since the main processes are gasification, methane steam reforming and partial oxidation[1,2]. Moreover, limits to direct utilization of hydrogen come from the low energy storage, s along with the lack of infrastructures [1,2]. For all these reasons the interest in alternative hydrogen-carriers fuel is rising and among them, ammonia seems to be the most attractive candidate due to its higher gravimetric H2 content (17.7 wt% in liquid ammonia) when compared to other hydrogen-carriers compounds (e.g. 13 wt% in methanol and 7 wt% in Cyclo-hexane). Moreover, ammonia is relatively simple to liquify (boiling point -33,4 °C), has a characteristic and well recognizable smell [3] and its industrial production process, based on the Haber-Bosch reaction, is well-known and simple [4].
Among hydrogen-based electricity production devices, Solid Oxide Fuel Cells (SOFCs) are among attractive mainly for their high fuel-current conversion efficiency and their fuel flexibility [5,6,7]. Being SOFC main reaction based on hydrogen and oxygen ions formation, respectively, at anode and cathode side, the use of alternative hydrogen carrier fuels strongly depends on the fuel dissociation reaction efficiency at the anode sides. The use of NH3 for direct SOFC feeding is favoured by the observation that the cracking reaction of ammonia (namely its dissociation in hydrogen and nitrogen) is catalysed by Nickel based compounds [8,9] which are, actually, the most common materials used as anode in SOFCs [3,10,11,12,13]. Moreover, being this cracking reaction endothermic, the heat management of ammonia-fed SOFCs system could be simplified. On the other hand, limits to direct ammonia feeding to SOFCs are posed by the operating temperature dependence of its decomposition at anode side. In fact, it was demonstrated [2,9] that cracking reaction efficiency in presence of Nickel-based catalysts, and thus efficient current generation in the SOFC, is limited to high operating temperatures of the device, with significant performance reductions for temperatures lower than 750°C.
Recently, with the aim of increasing industrial SoA SOFCs performances in the Intermediate-Temperature (IT) range [14,15], physical vapour deposition (PVD) techniques were proposed [16,17,18] to fabricate the air electrode/electrolyte Gadolinia Doped Ceria (GDC) barrier layer. Given its long-term expertise in thin films deposition with different PVD techniques (Molecular Beam Epitaxy [19], Pulsed Laser Deposition [20] and sputtering [21], among the others) together with the long-time knowledge in impedance characterization of thin films [22], the research group at the University of Salerno recently proposed an innovative deposition process for the fabrication of GDC thin barrier layers, based on room-temperature Radio-Frequency (RF) sputtering followed by in-air annealing at moderate temperatures. Huge increments in the output current of hydrogen-fed SOFC with sputtered GDC layers have been observed with respect to SoA industrial devices [23] both in button cells (up to +78%) [23,24] and in large industrial scale cells [25,26,27].
In this work, we investigated the performances, in terms of j-V and Electrochemical Impedance Spectroscopy (EIS), of a 5 cm diameter SOFC button cell in which the barrier layer is room-temperature sputter deposited and in-air annealed, when they are fed with ammonia at different temperatures in the range 650-800°C.
1. Materials and Methods
A 400 nm GDC thin films is grown on 5 cm diameter anode/electrolyte half button-cell (SolydEra S.p.A, Pergine (TN), Italy) by means of RF magnetron sputtering (MRC RF-Sputtering, Electron Mec Company, Milan, Italy) using a circular Gd0.1Ce0.9O2-δ sputtering target (Testbourne, 99.999% purity) with a diameter of 150 mm. The deposition took place at room temperature, thus oxygen stoichiometry and thin film granularity were optimized by means of a post-growth annealing [23,24]. The buffer layer is then covered at SolydEra S.p.A with a circular screen printed cathode (prepared as shown in [24]) thus completing the button cell structure with a final 9 cm2 active area of the SOFC.
Electrochemical test are carried out using one of the testing benches present at CEA/LITEN research centre (Grenoble, France). The anode side of the cell is placed on a current collector made of a nickel grid with 100 mesh∙cm-2 placed in a Crofer housing setup; the cell is then sealed with glass paste to ensure complete gas tightness of the fuel chamber. On top of the cell, at cathode side, a gold grid current collector of 100 mesh∙cm-2 is placed. To complete the cell mounting, a gas diffusor with a 414 g∙cm-2.weight is placed on the gold current collector in order to enhance the electrical contacts through a mechanical pressure. Once the cell is mounted, the setup is placed within a furnace. Further details of the experimental setup can be found in [28].
The electrical properties of the SOFC with room-temperature sputtered GDC barrier layer above described have been characterized in terms of j-V polarization curves and EIS measurements to evaluate the final cells performances both with usual H2 and NH3 feedings. The study was divided in two steps:
- In the first step, we evaluated the performance of the above described cell fuelled by different hydrogen flowrates; the cell has been tested at four different working temperatures (800°C, 750°C, 700°C and 650°C). For each temperature, different H2 feeding flowrates (3 Nml min-1cm-2, 6 Nml min-1cm-2,, 9 Nml min-1cm-2, 12 Nml min-1cm-2, 15 Nml min-1cm-2) have been considered. The performance of the cell is evaluated acquiring j-V curves and EIS spectra for each combination of temperature and flow rate feeding.
- In the second step, we evaluate how the performance of the cell changes according to fuel feeding; for each of the above mentioned working temperatures and H2 feeding flowrates, the amount of hydrogen is substituted by NH3 at different percentages (0%, 25%, 50%, 75% and 100%). The complete study is composed by j-V curves acquired for each combination of working temperature, gas flowrate and NH3 % . Moreover, EIS spectra have been acquired for each investigated operating condition.
2. Results and discussion
2.1. Evaluation of diluted H2 feeding performance
Sputtered barrier layer button-SOFC performances were preliminary studied by means of j-V curves and EIS measurements performed at 4 working temperatures ranging from 800°C to 650°C to estimate the SOFC behaviour in hydrogen both at usual industrial working temperatures and in the IT- range. j-V curved have been acquired with a 0.018 A∙s-1 current ramp while EIS measurements have been carried out superposing a 0.4 A amplitude signal at 0.5 A cm-2 fixed current, with frequencies ranging from 0.01 Hz to 10 kHz and gas feeding provided by a mixture of hydrogen and nitrogen; the choice of nitrogen diluted hydrogen feeding was useful for two reasons: firstly it allows to better cover the anode area with a lower hydrogen flux, secondly it allows to take into account the possible effect of N2 dilution coming from the decomposition of NH3.
In Table 1 gas dilution parameters are reported.
In Figure 1, the j-V curves acquired for each parameters combination are displayed.
From the above Figures (Figure 1a), b) and c)) one can see that the sputtered barrier layer SOFC tested at 800°C, 750°C, and 700°C is characterized by no visible limiting current for higher flow rates (i.e. 15 Nml min-1cm-2, 12 Nml min-1cm-2 and 9 Nml min-1cm-2), while the change in the slope starts to be visible for 6 Nml min-1cm-2 and then becomes evident for the lowest flowrate (3 Nml min-1cm-2), highlighting that for these inlet flow rate the fuel is consumed faster than it is supplied to the SOFC [29,30,31]. This effect becomes less evident going down with the working temperature, with the slopes of the 6 Nml min-1cm-2 flow rate curve (yellow line) and 3 Nml min-1cm-2 flow rate curve (blue line) becoming less sharp. This is furtherly confirmed by the measurement performed at 650 °C where the limiting current is not visible anymore for 6 Nml min-1cm-2 (yellow curve) and the change in slope for the 3 Nml min-1cm-2 is the less pronounced among all the blue curves present in Figure 1. At the lowest working temperature, no measurement has been performed at the highest flowrate (i.e. 15 Nml min-1cm-2) because from the data at higher temperatures, the results at 15 Nml min-1cm-2 and 12 Nml min-1cm-2 are practically the same, without giving additional information on the cell’s behaviour.
The j-V curves in Figure 1 have been used to evaluate the electric efficiency of the cell for each configuration (temperature, H2 and N2 content) using the following relation:
where is the lower calorific value of H2 (241500 J∙mol-1), Q is the volumetric flowrate is the SOFC geometrical area (i.e. 9.08 cm2) and is the molar volume (i.e. 24054 Nml∙mol-1).
In Figure 2 the evaluated efficiency curves are reported.
From Figure 2, it is clear that the electric efficiency lowers with increasing flow rates for all the investigated temperatures and decreases with decreasing working temperatures at fixed inlet flowrate, as expected [2]. Moreover, while an efficiency saturation is clearly visible for the lowest hydrogen flow rates (6 Nml min-1cm-2and 3 Nml min-1cm-2), this saturation starts to disappear at 700 °C for the yellow curve (6 Nml∙min-1cm-2) and is completely not visible at 650 °C for both lowest flowrates. The highest electrical efficiency(67%) is found at 800 °C and 3 Nml∙min-1cm-2 flow rate. We point out that the maximum power density achieved is 802 mW∙cm-2 power density at 1 A cm-2 and 12 Nml∙min-1cm-2 of H2 at 700°C. The comparison of these results with those reported in [23,33,34] once again give evidence of the improved performances in hydrogen feeding of SOFCs with sputtered GDC barrier layer.
EIS spectra have been acquired at 0.5 A cm-2 with a superposed perturbation signal of 0.044 A ∙cm-2 amplitude for all the investigated temperatures and flow rates (except for the 3 Nml∙min-1cm-2 H2 flowrate that has not been acquired, being the corresponding limiting current lower than 0.5 A cm-2); In Figure 3 the obtained results are displayed.
Looking at the data shown in Figure 3, we can observe that the ohmic and polarization resistances follow the usual trend found in literature for SOFC [23,35,36]. In detail, change in flow rate does not seem to affect the ohmic resistance, while operating temperature lowering makes this parameter increase (from 0.01 Ohm∙cm-2 at 800°C to 0.045 Ohm∙cm-2 at 650°C) and this can be related to an inductive contribution at high frequencies that modifies the shape of the high frequency arc and the value of the ohmic resistance, especially at lower operating temperatures. On the other hand, the polarization resistance is affected byboth temperature and flow rate variations: indeed for the higher temperatures (800°C, 750°C and 700°C) the polarization resistance increases with decreasing flow rates, due to the lower amounts of hydrogen available for the SOFC main reaction [37,38]. At 650°C the polarization resistance shows a remarkable increase especially in correspondence of 6 Nml∙min-1cm-2, probably due to a combination of multiple effects such as the reduced ionic transport in the electrolyte at low operating temperatures and the hydrogen flow reduction through the cell. The presence of this last effect is also confirmed by the enhancement of the low frequency arc related to gas diffusion through the electrodes at 6 Nml∙min-1cm-2.
The above results for the ohmic and polarization resistances at higher gas flow rates are in complete accordance with what is reported in [23] where a single 35 mm cermet support diameter button cell with 2 cm diameter of the screen-printed electrode is tested only for one hydrogen flow rate (16 Nml∙min-1cm-2). Small deviations in the performances can be attributed to the different size (50 mm in diameter of the cermet support, corresponding to 35 mm diameter of the electrode) of the button cell tested here with respect to the button cells tested in [23]. Indeed, in accordance to the results reported in [26], thickness inhomogeneities in a GDC sputtered barrier layer affect the final cell performances proportionally to the thickness gradient characterizing the barrier layer on the cell.
2.2. NH3 feeding performance evaluation
Following the procedure used by Dekker et al. [2], we evaluated the cell behaviour for NH3 feeding at different working temperatures (800°C, 750°C, 700°C and 650°C) by substituting increasing percentages of NH3 (25%, 50%, 75% and 100%) for each of the diluted H2 flowrates (3 Nml∙min-1cm-2, 6 Nml∙min-1cm-2, 9 Nml∙min-1cm-2, 12 Nml∙min-1cm-2 and 15 Nml∙min-1cm-2). By comparing the obtained performance to the performance in diluted H2 observed in both the same cell and in a 50 mm button cell with screen printed GDC buffer layer, we show that the cell with sputtered GDC barrier layer presents the same behaviour independently from the type of feeding, simultaneously confirming the significative performance improvement with respect to industrially prepared button SOFC.
One of the key points to be taken into account in efficiently fuelling SOFCs directly with ammonia is the effectiveness of the cracking reaction of ammonia at the anode side where two NH3 molecules split into three H2 and one N2 in order to provide H2 as fuel to the cell. It is already known [3,39,40] that Ni/Al2O3 acts as a catalyst in the ammonia cracking reaction while in [2] Ni/YSZ anodes were also demonstrated to be catalysts in the ammonia cracking reaction; thus the Ni cermet anode of the SOFC studied here should also catalyse the NH3 splitting reaction.
When comparing the performance in H2 and in NH3, it must be considered that, due to the ammonia decomposition, we have 3 H2 molecules each 2 NH3 molecules; following this rule we obtain, for example, that 12 Nml∙min-1cm-2 of hydrogen correspond to 8 Nml∙min-1cm-2 of pure ammonia feeding (100% NH3 diluted hydrogen substitution), 9 Nml∙min-1cm-2 correspond to 6 Nml∙min-1cm-2 of pure ammonia feeding, and so on. We remark that, this feeding conversion is not able to maintain the same energy content at gas inlet under the assumption of complete ammonia cracking at anode. Therefore, the following conversion table (Table 2) has been used in our measurements.
In Figure 4 we report the j-V curves acquired at 800°C for each different flowrate ( 3 Nml∙min-1cm-2, 6 Nml∙min-1cm-2, 9 Nml∙min-1cm-2, 12 Nml∙min-1cm-2 and 15 Nml∙min-1cm-2) and NH3 percentage substitution of H2 starting from 0% NH3 up to 100% NH3 feeding.
As it is clear in Figure 4, for each initial H2 flowrate, the corresponding curves with different substituted percentages of NH3 are perfectly superposed to the 0% substituted one. This means that, at 800 °C, the cell does not react to the “change in fuel” and behaves exactly the same in terms of output current when hydrogen is substituted by ammonia. This is not surprising due to the expected 100% cracking reaction efficiency at anode side at high working temperatures [2]. The same behaviour was observed in terms of output current performing the same experiment at 750 °C for all the above presented feeding flowrates and NH3 substituted percentages.
Once more, given the high performance of sputtered barrier layer SOFC fed in pure or diluted H2 (up to ≈ 31% increased performance when compared to SoA button cells with screen printed GDC layer at 750 °C) [23], the above mentioned results give further evidence that similar high and promising performances can be achieved by the same SOFC structure fed by ammonia.
In terms of electric conversion efficiencies, the above polarization curves give the results summarized in Figure 5 in which we report the evaluated efficiencies at 6, 9 and 15 Nml∙min-1cm-2. In this case the calculation was performed as follows:
where and the lower calorific value of H2 (241500 J∙mol-1) and NH3 (317000 J∙mol-1) respectively, Q and Q’ are the volumetric flowrate of H2 and NH3 is the SOFC geometrical area (i.e. 9.08 cm2) and are the molar volumes of H2 and NH3; A and B are two factors that take into account the gas percentage substitution, therefore while A assumes the values 1, 0.75, 0.50, 0.25 and 0, B assumes the following values: 0, 0.25, 0.50, 0.75 and 1.
As already seen in Figure 2, the efficiency lowers with increasing flow rates [2]. An efficiency saturation is clearly visible for the lowest hydrogen flow rate (6 Nml∙min-1cm-2), disappearing at the highest flow rate of 15 Nml∙min-1cm-2. The increase in fuel efficiency with increasing percentage ammonia substitution is due to the higher energy content of ammonia and is in accordance with the results present in [2].
Changes in the electrochemical behaviour of SOFC have been also monitored by performing EIS measurements at 0% and 100% hydrogen substituted by NH3 for all the equivalent flow rates and all the operating temperatures. In line with what presented above the results in Figure 6 report EIS acquired at 800°C, because those observed at the different temperatures are practically the same.
At all the flowrates, the ohmic resistance is always lower when the cell is fed in diluted H2 (red dots), in agreement with previous results [9], measuring a drop in the open circuit voltage (OCV) with increasing NH3 concentrations. Indeed, we observed a similar small drop with increasing ammonia percentage substitutions for all the flowrates in the j-V curves in Figure 4 despite the 100% efficiency of the ammonia cracking reaction. Such a small OCV drop with increasing ammonia concentrations is probably related to the endothermic nature of ammonia dissociation reaction being responsible of slight temperature’s decrement when increasing ammonia content. Moreover, the polarization resistance observed at 9 Nml∙min-1cm-2 and 15 Nml∙min-1cm-2, slightly decreases in the 100% NH3 feeding, giving evidence of the decrement in the overpotentials when directly fuelling the SOFC with ammonia [9]. Due to unexpected electrical contact’s problems, the measurement at 6 Nml∙min-1cm-2 was not carried out.
In the following j-V and efficiency data, since we observed similar curves under higher flow rates (9 Nml∙min-1cm-2, 12 Nml∙min-1cm-2 and 15 Nml∙min-1cm-2) and for the lower flow rates (3 Nml∙min-1cm-2 and 6 Nml∙min-1cm-2), we will show only one curve for the “ high” and “low” flowrate results, being those two curves completely representative of all the measurements performed [2].
At 750 °C, the curves in Figure 7 are almost completely superposed, in particular for the “low” flowrate, indicating the effectiveness of the NH3 cracking reaction. As already observed for 800°C operating temperature, the only change in the j-V curves is given by the slight lowering of the OCV with increasing ammonia percentage substitution favoured by the endothermic cracking reaction. We point out that the same output power density of 802 mW∙cm-2 at 1 A∙cm-2 has been observed both for 12 Nml∙min-1cm-2 of H2 and for the equivalent NH3 flow rate (100% NH3 substituted, corresponding to 8 Nml∙min-1cm-2 of ammonia, according the conversion in Table 2). These values of the power density outputs are comparable to those obtained in industrial SoA SOFC cells with screen printed GDC, fed with higher hydrogen flowrates [23,24].
At 700°C, the curves in Figure 7start to spread out for both the “low” and “high” flow rates, probably due to the less effective ammonia cracking reaction at the Ni cermet anode. By the way, the power density lowering with the change of fuel results to be negligible for the “low” flow rate curve (about 2% at 0.4 A∙cm-2 and 3.6% at maximum current density 0.75 A∙cm-2). The “high” flow rate curve shows the same behaviour but with an higher reduction in the power density generated by the cell (-3.2% at 0.4 A∙cm-2 and -6.7% at 0.88 A∙cm-2). Therefore, even higher NH3 substitution percentages are still efficient in terms of the output power density, with values not appreciably different from those obtained in diluted hydrogen at 700°C.
At 650 °C, as a consequence of the anode reduced efficiency for the ammonia splitting reaction, both the “low” and “high” flowrate curves show an increased spread as a function of the NH3 substitution. Indeed, both the displayed curves spread away with outlet current decreasing with increasing ammonia substitution. The maximum power density percentage variation is observed between the diluted hydrogen cell and the directly ammonia fed cell (100% ammonia substituted) at the higher flow rate, being -11.5% the difference in the generated power density.
In Figure 8, the “low” and “high” fuel-electricity conversion efficiencies are reported as a function of temperature and ammonia percentage substitution.
At 750 °C, it is clear that the efficiency trend and values show the same behaviour found at 800°C. The maximum value is found for the “low” flowrate at 100% substituted ammonia, while the minimum is obtained at 0% substituted ammonia for the “high” flowrate.
At 700 °C we notice a lowering of the evaluated efficiencies with respect to those observed at 800 and 750 °C. For the “high” flowrate curves related to 25 and 50% substitution the efficiencies become lower than the one acquired in diluted hydrogen (0% substituted) pointing out, again, that at this temperature the cracking reaction at anode is not anymore 100% efficient.
At 650 °C, the trend observed for higher working temperatures starts to show an inversion. The maximum efficiency is much lower than the values observed before and, more important, it is possible to see that at lower substitution percentages the cell is less efficient compared to the 0% substitution. This is in agreement with the behaviour reported in [18], again due to the temperature-dependent power generation in ammonia fed cells, strictly related to the catalytic activity of the anode in the cracking reaction. Nonetheless, we point out here that GDC sputtered barrier layers embedded in SoA industrial SOFC are able to increase the cell current generation up to +78% at 650 °C and +60% at 700°C and 800 mV, as reported in [23]. Therefore, comparing these results obtained with the ones obtained with a SoA button cell with industrially screen-printed barrier layer we can make the following observation: the output current density produced by sputtered barrier layer button SOFCs fed by 8 Nml∙min-1cm-22 , pure ammonia at 800 mV and 700 °C (i.e. 0.54 A∙cm-2) is exactly the same output current density obtained in a SoA button cell with industrial screen printed GDC barrier layer fuelled with an higher hydrogen flow rate (i.e. 16 Nml∙min-1cm-2).
Finally, all the observation made above are confirmed also analysing the Nyquist Plots shown in Figure 9.
Figure 9 shows that the polarization and ohmic resistance trends as a function of the inlet flow rate for the two higher operating temperatures is the same observed for diluted hydrogen feeding. There is no evidence of ohmic resistance dependence with the ammonia flow rate and of the polarization resistance increasing with decreasing flow rate. These results furtherly confirm that the change of fuel does not affect the button cell behaviour at high temperatures. At 700°C, while no ohmic resistance change is observed with respect to the diluted hydrogen feeding (see Figure 3), it is possible to see an increase in the polarization resistance both at NH3 equivalent feeding to 6 Nml∙min-1cm-2 and 9 Nml∙min-1cm-2 of diluted hydrogen, providing a further evidence of the lack in hydrogen available to sustain the SOFC processes. On the other hand, at 650°C, we can observe a huge polarization resistance increment for all the reported flow rates, in accordance with the efficiency lowering reported in Figure 8.
Conclusions
To evaluate the fuel flexibility of SOFCs with sputtered GDC thin buffer layers, we have firstly performed electrochemical characterization of a 9 cm2 active surface area button cell by fuelling it with different hydrogen flow rates (3 Nml∙min-1cm-2, 6 Nml∙min-1cm-2, 9 Nml∙min-1cm-2, 12 Nml∙min-1cm-2 and 15 Nml∙min-1cm-2), varying the working temperatures (800°C, 750°C, 700°C and 650°C). The performance of the cell was measured acquiring j-V curves and EIS spectra for each combination of temperature and flow rate feeding. Successively, to evaluate how the performance of the cell is changed by the change of fuel, for each of the above mentioned working temperatures, the amount of hydrogen was substituted by NH3 at different percentages (0%, 25%, 50%, 75% and 100%). The experimental results, composed by j-V curves acquired for each combination of working temperature, flow rate of the gas feeding and NH3 percentage substitution, clearly show that for the higher explored working temperatures (800°C and 750°C) the power density values do not present any sign of dependence upon the fuel type. Values of 802 mW∙cm-2 at 1 A∙cm-2 have been found when feeding the cell with both 8 Nml∙min-1cm-2 of ammonia and with an equivalent flowrate of 12 Nml∙min-1cm-2 of H2. At lower working temperatures (700°C and 650°C), we have measured an output current density value of 0.54 A∙cm-2 in pure ammonia flowrate of 12 Nml∙min-1cm-2, at 800 mV and 700°C, equal to the value observed in SoA button cells with industrial screen printed GDC barrier layer fuelled with 16 Nml∙min-1cm-2 of H2. Due to the improved electrochemical performances gained in the case of cells with sputtered GDC thin buffer layers, these power and current density output values are always comparable or even higher than those obtained in industrial SoA SOFC cells with screen printed GDC layers fed with higher hydrogen flowrates, suggesting possible applications of these innovative SOFC structures also with the use of ammonia fuel.
References
- Hagen, H. Langnickel, X. Sun, ScienceDirect Operation of solid oxide fuel cells with alternative hydrogen carriers. Int. J. Hydrogen Energy. 2019, 44, 18382–18392. [Google Scholar] [CrossRef]
- N. J.J. Dekker, G. Rietveld, Highly efficient conversion of ammonia in electricity by solid oxide fuel cells. J. Fuel Cell Sci. Technol. 2006, 3, 499–502. [Google Scholar] [CrossRef]
- Lucentini, X. Garcia, X. Vendrell, J. Llorca, Review of the Decomposition of Ammonia to Generate Hydrogen. Ind. Eng. Chem. Res. 2021, 60, 18560–18611. [Google Scholar] [CrossRef]
- J. Humphreys, R. Lan, S. Tao, Development and Recent Progress on Ammonia Synthesis Catalysts for Haber–Bosch Process. Adv. Energy Sustain. Res. 2021, 2, 2000043. [Google Scholar] [CrossRef]
- M. A. Abdelkareem, K. Elsaid, T. Wilberforce, M. Kamil, E.T. Sayed, A. Olabi, Environmental aspects of fuel cells: A review. Sci. Total Environ. 2021, 752, 141803. [Google Scholar] [CrossRef]
- D. Papurello, S. Silvestri, S. Modena, Biogas trace compounds impact on high-temperature fuel cells short stack performance. Int. J. Hydrogen Energy. 2021, 46, 8792–8801. [Google Scholar] [CrossRef]
- J. Zhou, Z. Wang, M. Han, Z. Sun, K. Sun, Optimization of a 30 kW SOFC combined heat and power system with different cycles and hydrocarbon fuels. Int. J. Hydrogen Energy. 2022, 47, 4109–4119. [Google Scholar] [CrossRef]
- Z. Chen, S. Z. Chen, S. Ristig, M. Poschmann, J. Folke, O. Go, S. Heumann, H. Ruland, Ammonia Decomposition in the Process Chain for a Renewable Hydrogen Supply, (2022) 1413–1425. [CrossRef]
- G. Cinti, U. Desideri, D. Penchini, G. Discepoli, Experimental analysis of SOFC fuelled by ammonia. Fuel Cells. 2014, 14, 221–230. [Google Scholar] [CrossRef]
- S. Mukherjee, S. V. Devaguptapu, A. Sviripa, C.R.F. Lund, G. Wu, Low-temperature ammonia decomposition catalysts for hydrogen generation. Appl. Catal. B Environ. 2018, 226, 162–181. [Google Scholar] [CrossRef]
- S. Hussain, L. Yangping, Review of solid oxide fuel cell materials: cathode, anode, and electrolyte. Energy Transitions. 2020, 4, 113–126. [Google Scholar] [CrossRef]
- N. Mahato, A. Banerjee, A. Gupta, S. Omar, K. Balani, Progress in material selection for solid oxide fuel cell technology: A review. Prog. Mater. Sci. 2015, 72, 141–337. [Google Scholar] [CrossRef]
- A. J. Jacobson, Materials for solid oxide fuel cells, Chem. Mater. 2010, 22, 660–674. [Google Scholar] [CrossRef]
- D. J.L. Brett, A. Atkinson, N.P. Brandon, S.J. Skinner, Intermediate temperature solid oxide fuel cells. Chem. Soc. Rev. 2008, 37, 1568–1578. [Google Scholar] [CrossRef] [PubMed]
- Solovyev, A. Shipilova, E. Smolyanskiy, S. Rabotkin, V. Semenov, The Properties of Intermediate-Temperature Solid Oxide Fuel Cells with Thin Film Gadolinium-Doped Ceria Electrolyte. Membranes (Basel). 2022, 12, 1–7. [Google Scholar] [CrossRef]
- C. W. Kwon, J.W. Son, J.H. Lee, H.M. Kim, H.W. Lee, K.B. Kim, High-performance micro-solid oxide fuel cells fabricated on nanoporous anodic aluminum oxide templates. Adv. Funct. Mater. 2011, 21, 1154–1159. [Google Scholar] [CrossRef]
- A. A. Solovyev, N.S. Sochugov, S. V. Rabotkin, A. V. Shipilova, I. V. Ionov, A.N. Kovalchuk, A.O. Borduleva, Application of PVD methods to solid oxide fuel cells. Appl. Surf. Sci. 2014, 310, 272–277. [Google Scholar] [CrossRef]
- P. Coddet, H. lin Liao, C. Coddet, A review on high power SOFC electrolyte layer manufacturing using thermal spray and physical vapour deposition technologies. Adv. Manuf. 2014, 2, 212–221. [Google Scholar] [CrossRef]
- Barone, A. Galdi, N. Lampis, L. Maritato, F.M. Granozio, S. Pagano, P. Perna, M. Radovic, U.S. Uccio, Charge density waves enhance the electronic noise of manganites. (2009) 1–6. [CrossRef]
- P. Orgiani, C. Adamo, C. Barone, A. Galdi, S. Pagano, A.Y. Petrov, O. Quaranta, C. Aruta, R. Ciancio, M. Polichetti, D. Zola, L. Maritato, Epitaxial growth of La0.7 Ba0.3 Mn O3 thin films on MgO substrates: Structural, magnetic, and transport properties. J. Appl. Phys. 2008, 103, 0–8. [Google Scholar] [CrossRef]
- J. L. Makous, L. Maritato, C.M. Falco, J.P. Cronin, G.P. Rajendran, E. V Uhlmann, D.R. Uhlmann, Superconducting and structural properties of sputtered thin films of YBa2Cu3O7−x. Appl. Phys. Lett. 1987, 51, 2164–2166. [Google Scholar] [CrossRef]
- Andreone, A. DiChiara, G. Peluso, M. Santoro, C. Attanasio, L. Maritato, R. Vaglio, Surface impedance measurements of superconducting (NbTi)N films by a ring microstrip resonator technique. J. Appl. Phys. 1993, 73, 4500–4506. [Google Scholar] [CrossRef]
- N. Coppola, P. Polverino, G. Carapella, C. Sacco, A. Galdi, D. Montinaro, L. Maritato, C. Pianese, Optimization of the electrical performances in Solid Oxide Fuel Cells with room temperature sputter deposited Gd0.1ce0.9o1.95 buffer layers by controlling their granularity via the in-air annealing step. Int. J. Hydrogen Energy. 2020, 45, 12997–13008. [Google Scholar] [CrossRef]
- N. Coppola, P. N. Coppola, P. Polverino, G. Carapella, C. Sacco, A. Galdi, A. Ubaldini, V. Vaiano, D. Montinaro, L. Maritato, C. Pianese, Structural and electrical characterization of sputter-deposited Gd0.1Ce0.9O2−δ thin buffer layers at the Y-stabilized zirconia electrolyte interface for IT-solid oxide cells. Catalysts. 8 (2018). [CrossRef]
- N. Coppola, H. Sami, U. Rehman, G. Carapella, P. Polverino, D. Montinaro, F. Martinelli, V. Granata, A. Galdi, L. Maritato, C. Pianese, D. Studi, F. Sa, ScienceDirect Large area solid oxide fuel cells with room temperature sputtered barrier layers : Role of the layer thickness and uniformity in the enhancement of the electrochemical performances and durability. Int. J. Hydrogen Energy. (2023). [CrossRef]
- N. Coppola, P. Polverino, G. Carapella, R. Ciancio, P. Rajak, D. Montinaro, F. Martinelli, L. Maritato, C. Pianese, Large Area Deposition by Radio Frequency Sputtering of Gd0.1Ce0.9O1.95 buffer layers in Solid Oxide Fuel Cells: Structural, Morphological and Electrochemical Investigation. Materials (Basel). 2021, 14, 5826. [Google Scholar] [CrossRef]
- Hagen, J.O. Christensen, B.R. Sudireddy, S. Balomenou, D. Tsiplakides, K.-M. Papazisi, F. Zaravelis, C. Neofytidis, E. Ioannidou, S. Neophytides, D. Niakolas, N. Coppola, L. Maritato, P. Polverino, G. Carapella, C.J. Ferchaud, F. Berkel, J. Vulliet, J. Laurencin, Selection of Highlights of the European Project Next Generation Solid Oxide Fuel Cell and Electrolysis Technology – NewSOC. ECS Trans. 2021, 103, 2205–2216. [Google Scholar] [CrossRef]
- J. Laurencin, M. Hubert, D.F. Sanchez, S. Pylypko, M. Morales, A. Morata, B. Morel, D. Montinaro, F. Lefebvre-Joud, E. Siebert, Degradation mechanism of La0.6Sr0.4Co0.2Fe0.8O3-δ/Gd0.1Ce0.9O2-δ composite electrode operated under solid oxide electrolysis and fuel cell conditions. Electrochim. Acta. 2017, 241, 459–476. [Google Scholar] [CrossRef]
- M. Fardadi, D.F. McLarty, J. Brouwer, F. Jabbari, Enhanced performance of counter flow SOFC with partial internal reformation. Int. J. Hydrogen Energy. 2014, 39, 19753–19766. [Google Scholar] [CrossRef]
- Y. Komatsu, G. Brus, S. Kimijima, J.S. Szmyd, The effect of overpotentials on the transient response of the 300W SOFC cell stack voltage. Appl. Energy. 2014, 115, 352–359. [Google Scholar] [CrossRef]
- G. Brus, K. Miyoshi, H. Iwai, M. Saito, H. Yoshida, Change of an anode’s microstructure morphology during the fuel starvation of an anode-supported solid oxide fuel cell. Int. J. Hydrogen Energy. 2015, 40, 6927–6934. [Google Scholar] [CrossRef]
- N. J.J. Dekker, G. Rietveld, Highly Efficient Conversion of Ammonia in Electricity by Solid Oxide Fuel Cells. J. Fuel Cell Sci. Technol. 2006, 3, 499. [Google Scholar] [CrossRef]
- F. Baldi, L. F. Baldi, L. Wang, M. Pérez-Fortes, F. Maréchal, A cogeneration system based on solid oxide and proton exchange membrane fuel cells with hybrid storage for off-grid applications, Front. Energy Res. 6 (2019). [CrossRef]
- Oryshchyn, N.F. Harun, D. Tucker, K.M. Bryden, L. Shadle, Fuel utilization effects on system efficiency in solid oxide fuel cell gas turbine hybrid systems. Appl. Energy. 2018, 228, 1953–1965. [Google Scholar] [CrossRef]
- H. C. Yu, F. Zhao, A. V. Virkar, K.Z. Fung, Electrochemical characterization and performance evaluation of intermediate temperature solid oxide fuel cell with La0.75Sr 0.25CuO2.5-δ cathode. J. Power Sources. 2005, 152, 22–26. [Google Scholar] [CrossRef]
- Ahamer, A.K. Opitz, G.M. Rupp, J. Fleig, Revisiting the Temperature Dependent Ionic Conductivity of Yttria Stabilized Zirconia (YSZ). J. Electrochem. Soc. 2017, 164, F790–F803. [Google Scholar] [CrossRef]
- A. L.G. Stern, M., Electrochemical Polarization: I. A Theoretical Analysis of the Shape of Polarization Curves. J. Electrochem. Soc. 1957, 104, 56. [Google Scholar]
- R. Besghaier, L. Dhouibi, M. Jeannin, M.J. Safi, The Synergetic Effect of Flow Velocity and Exposing Time on the Electrochemical Behavior of Cu–Ni 90/10 Alloy in Simulating Conditions of Desalination Plant, Chem. Africa. 2019, 2, 483–495. [Google Scholar] [CrossRef]
- Takahashi, T. Fujitani, Kinetic analysis of decomposition of ammonia over Nickel and Ruthenium catalysts. J. Chem. Eng. Japan. 2016, 49, 22–28. [Google Scholar] [CrossRef]
- A. S. Chellappa, C.M. Fischer, W.J. Thomson, Ammonia decomposition kinetics over Ni-Pt/Al2O3 for PEM fuel cell applications. Appl. Catal. A Gen. 2002, 227, 231–240. [Google Scholar] [CrossRef]
Figure 1.
j-V curves acquired at different working temperatures and different diluted hydrogen flowrates (15 Nml∙min-1cm-2 orange curve, 12 Nml∙min-1cm-2 green curves, 9 Nml∙min-1cm-2 grey curves, 6 Nml∙min-1cm-2 yellow curves and 3 Nml∙min-1cm-2 blue curves) at 800 °C (a), 750 °C (b), 700 °C (c) and 650°C (d).
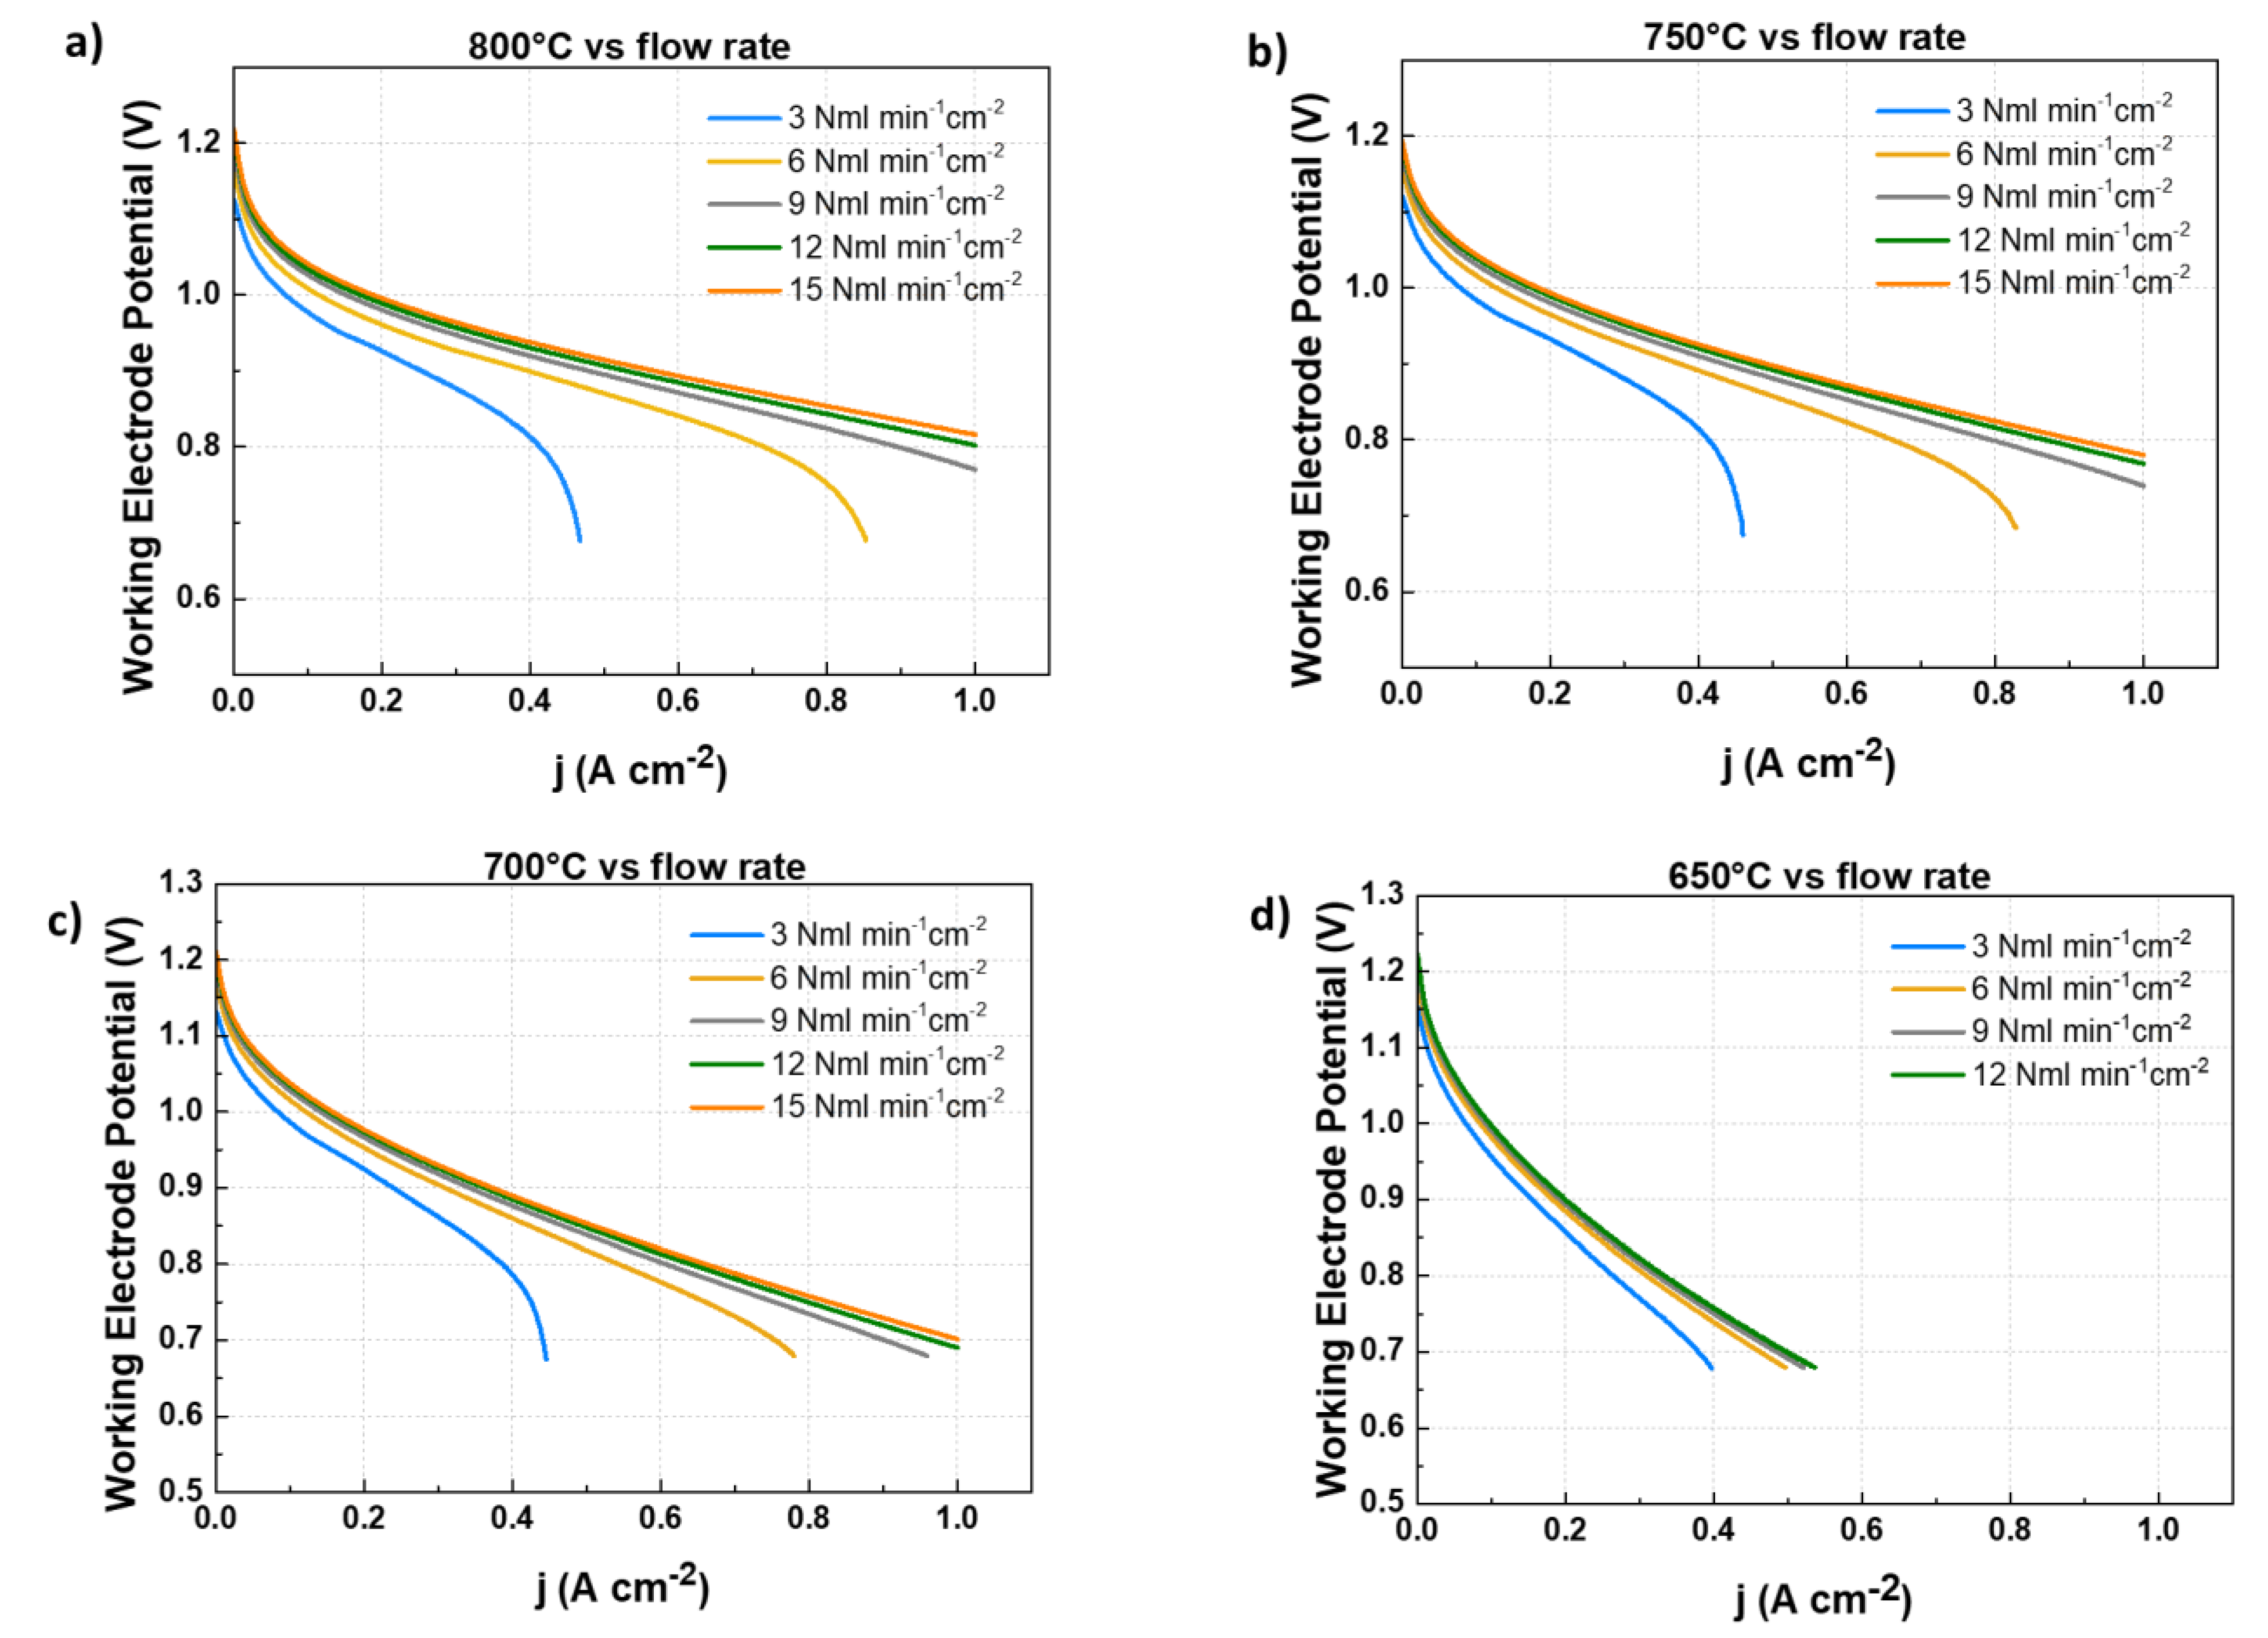
Figure 2.
Electric efficiencies evaluated for each working temperature ( 800 °C a), 750 °C b), 700 °C c) and 650 °C d)) and diluted hydrogen flow rates. The legend present in Figure 2c) applies for all the graphs composing Figure 2..
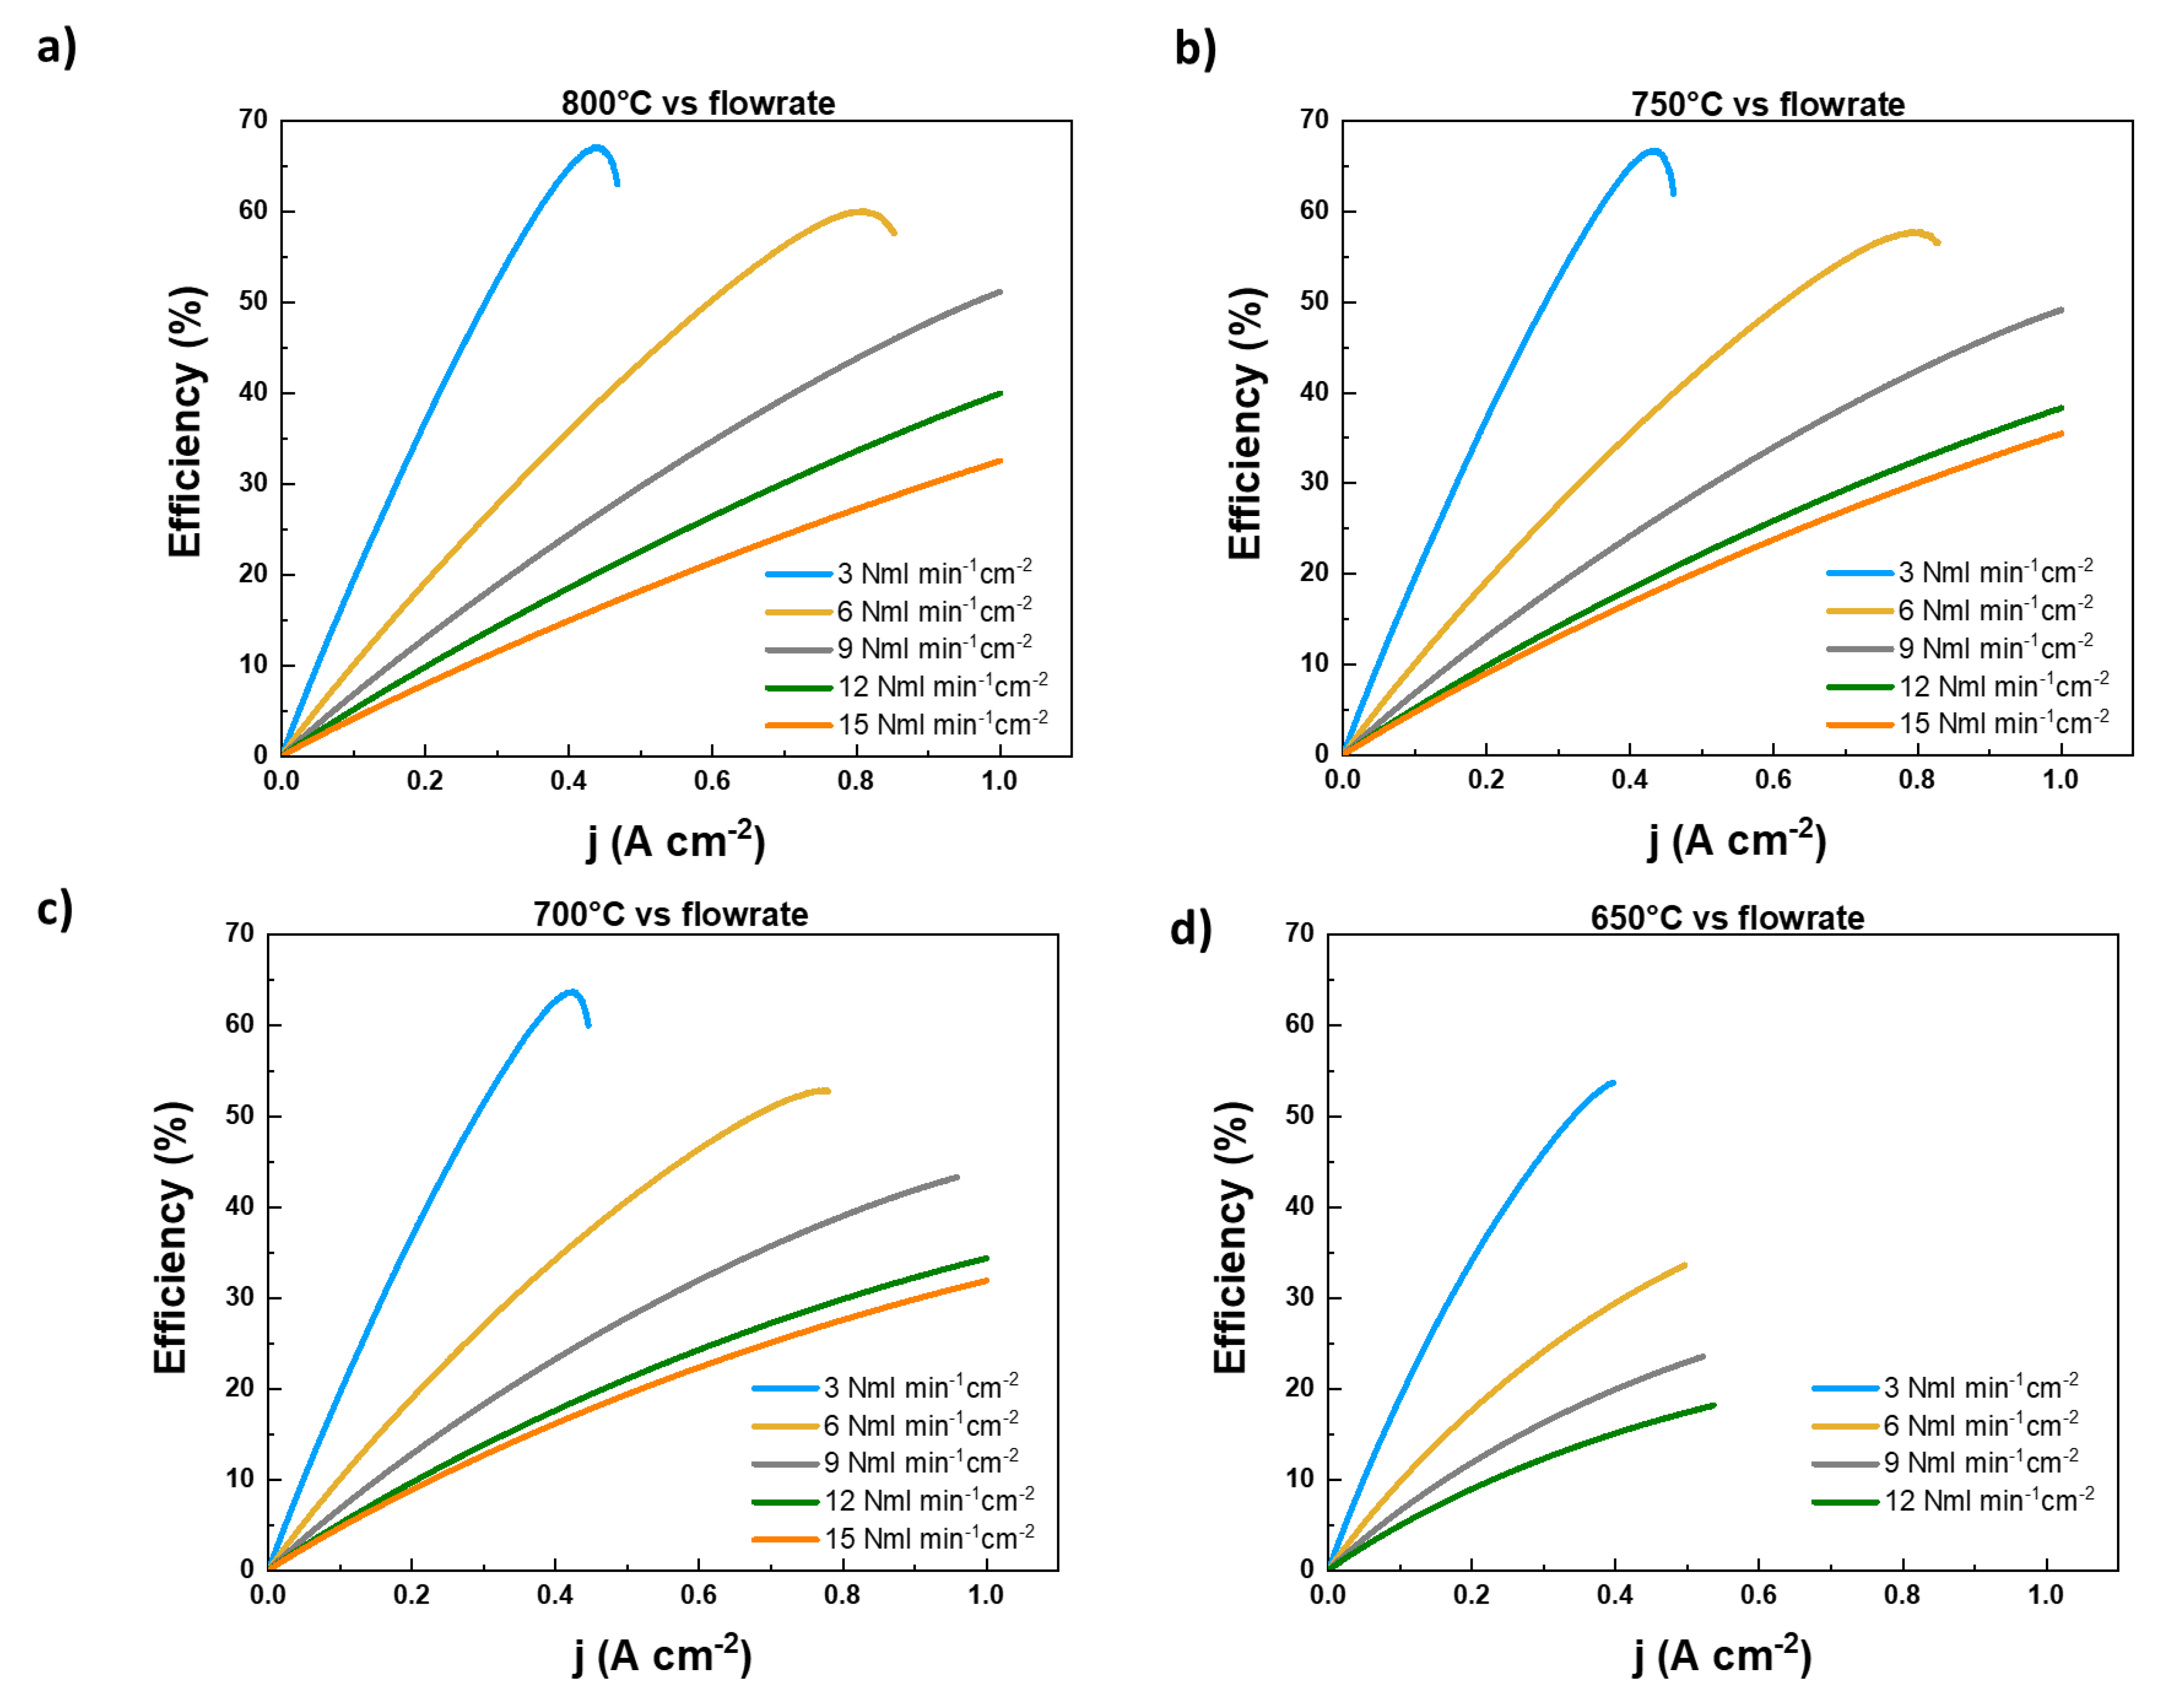
Figure 3.
Nyquist plot of EIS measurements performed on the sputtered GDC barrier layer SOFC for each explored temperature (a), b), c) and d)) and each flow rate: 6 (yellow), 9 (grey), 12 (green) and 15 (orange) Nml∙min-1cm-2.
Figure 3.
Nyquist plot of EIS measurements performed on the sputtered GDC barrier layer SOFC for each explored temperature (a), b), c) and d)) and each flow rate: 6 (yellow), 9 (grey), 12 (green) and 15 (orange) Nml∙min-1cm-2.
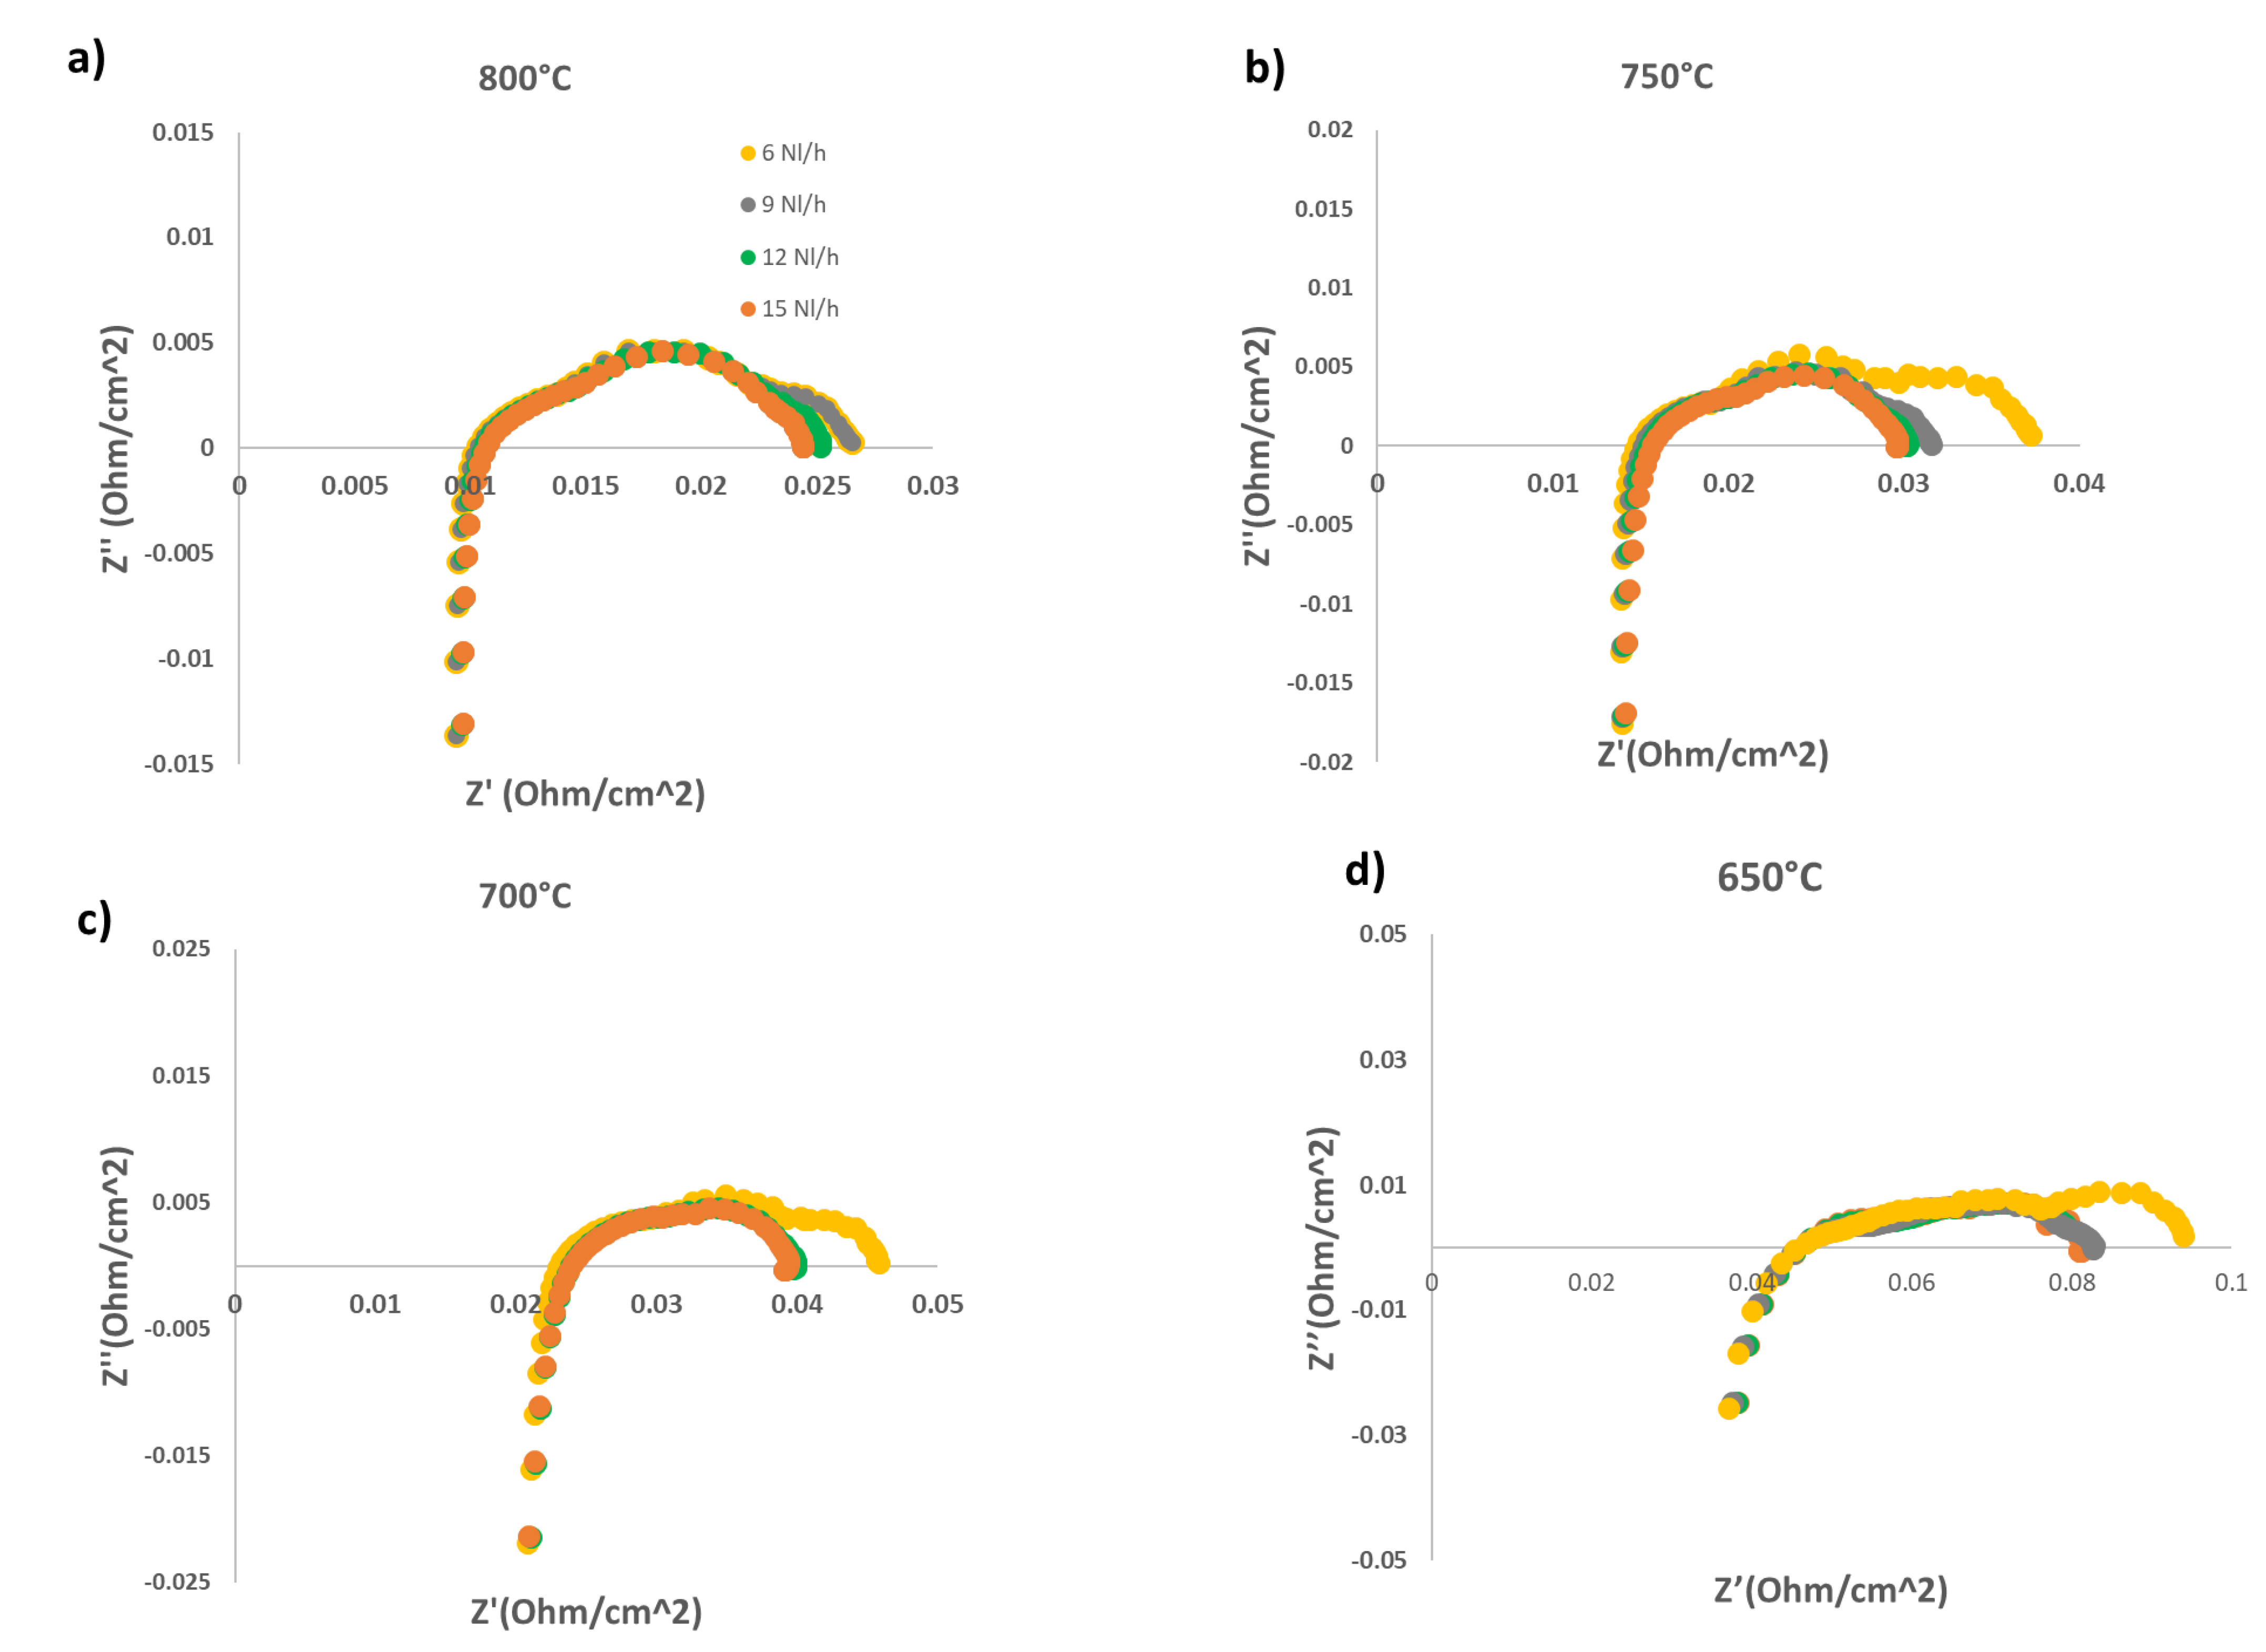
Figure 4.
j-V curves acquired at 800 °C at different flowrates: for each flowrate 0 (red line), 25 (magenta line), 50 (light blue line), 75 (yellow line) and 100 (purple line) % NH3 was substituted to diluted hydrogen following the conversion rules resumed in Table 2.
Figure 4.
j-V curves acquired at 800 °C at different flowrates: for each flowrate 0 (red line), 25 (magenta line), 50 (light blue line), 75 (yellow line) and 100 (purple line) % NH3 was substituted to diluted hydrogen following the conversion rules resumed in Table 2.
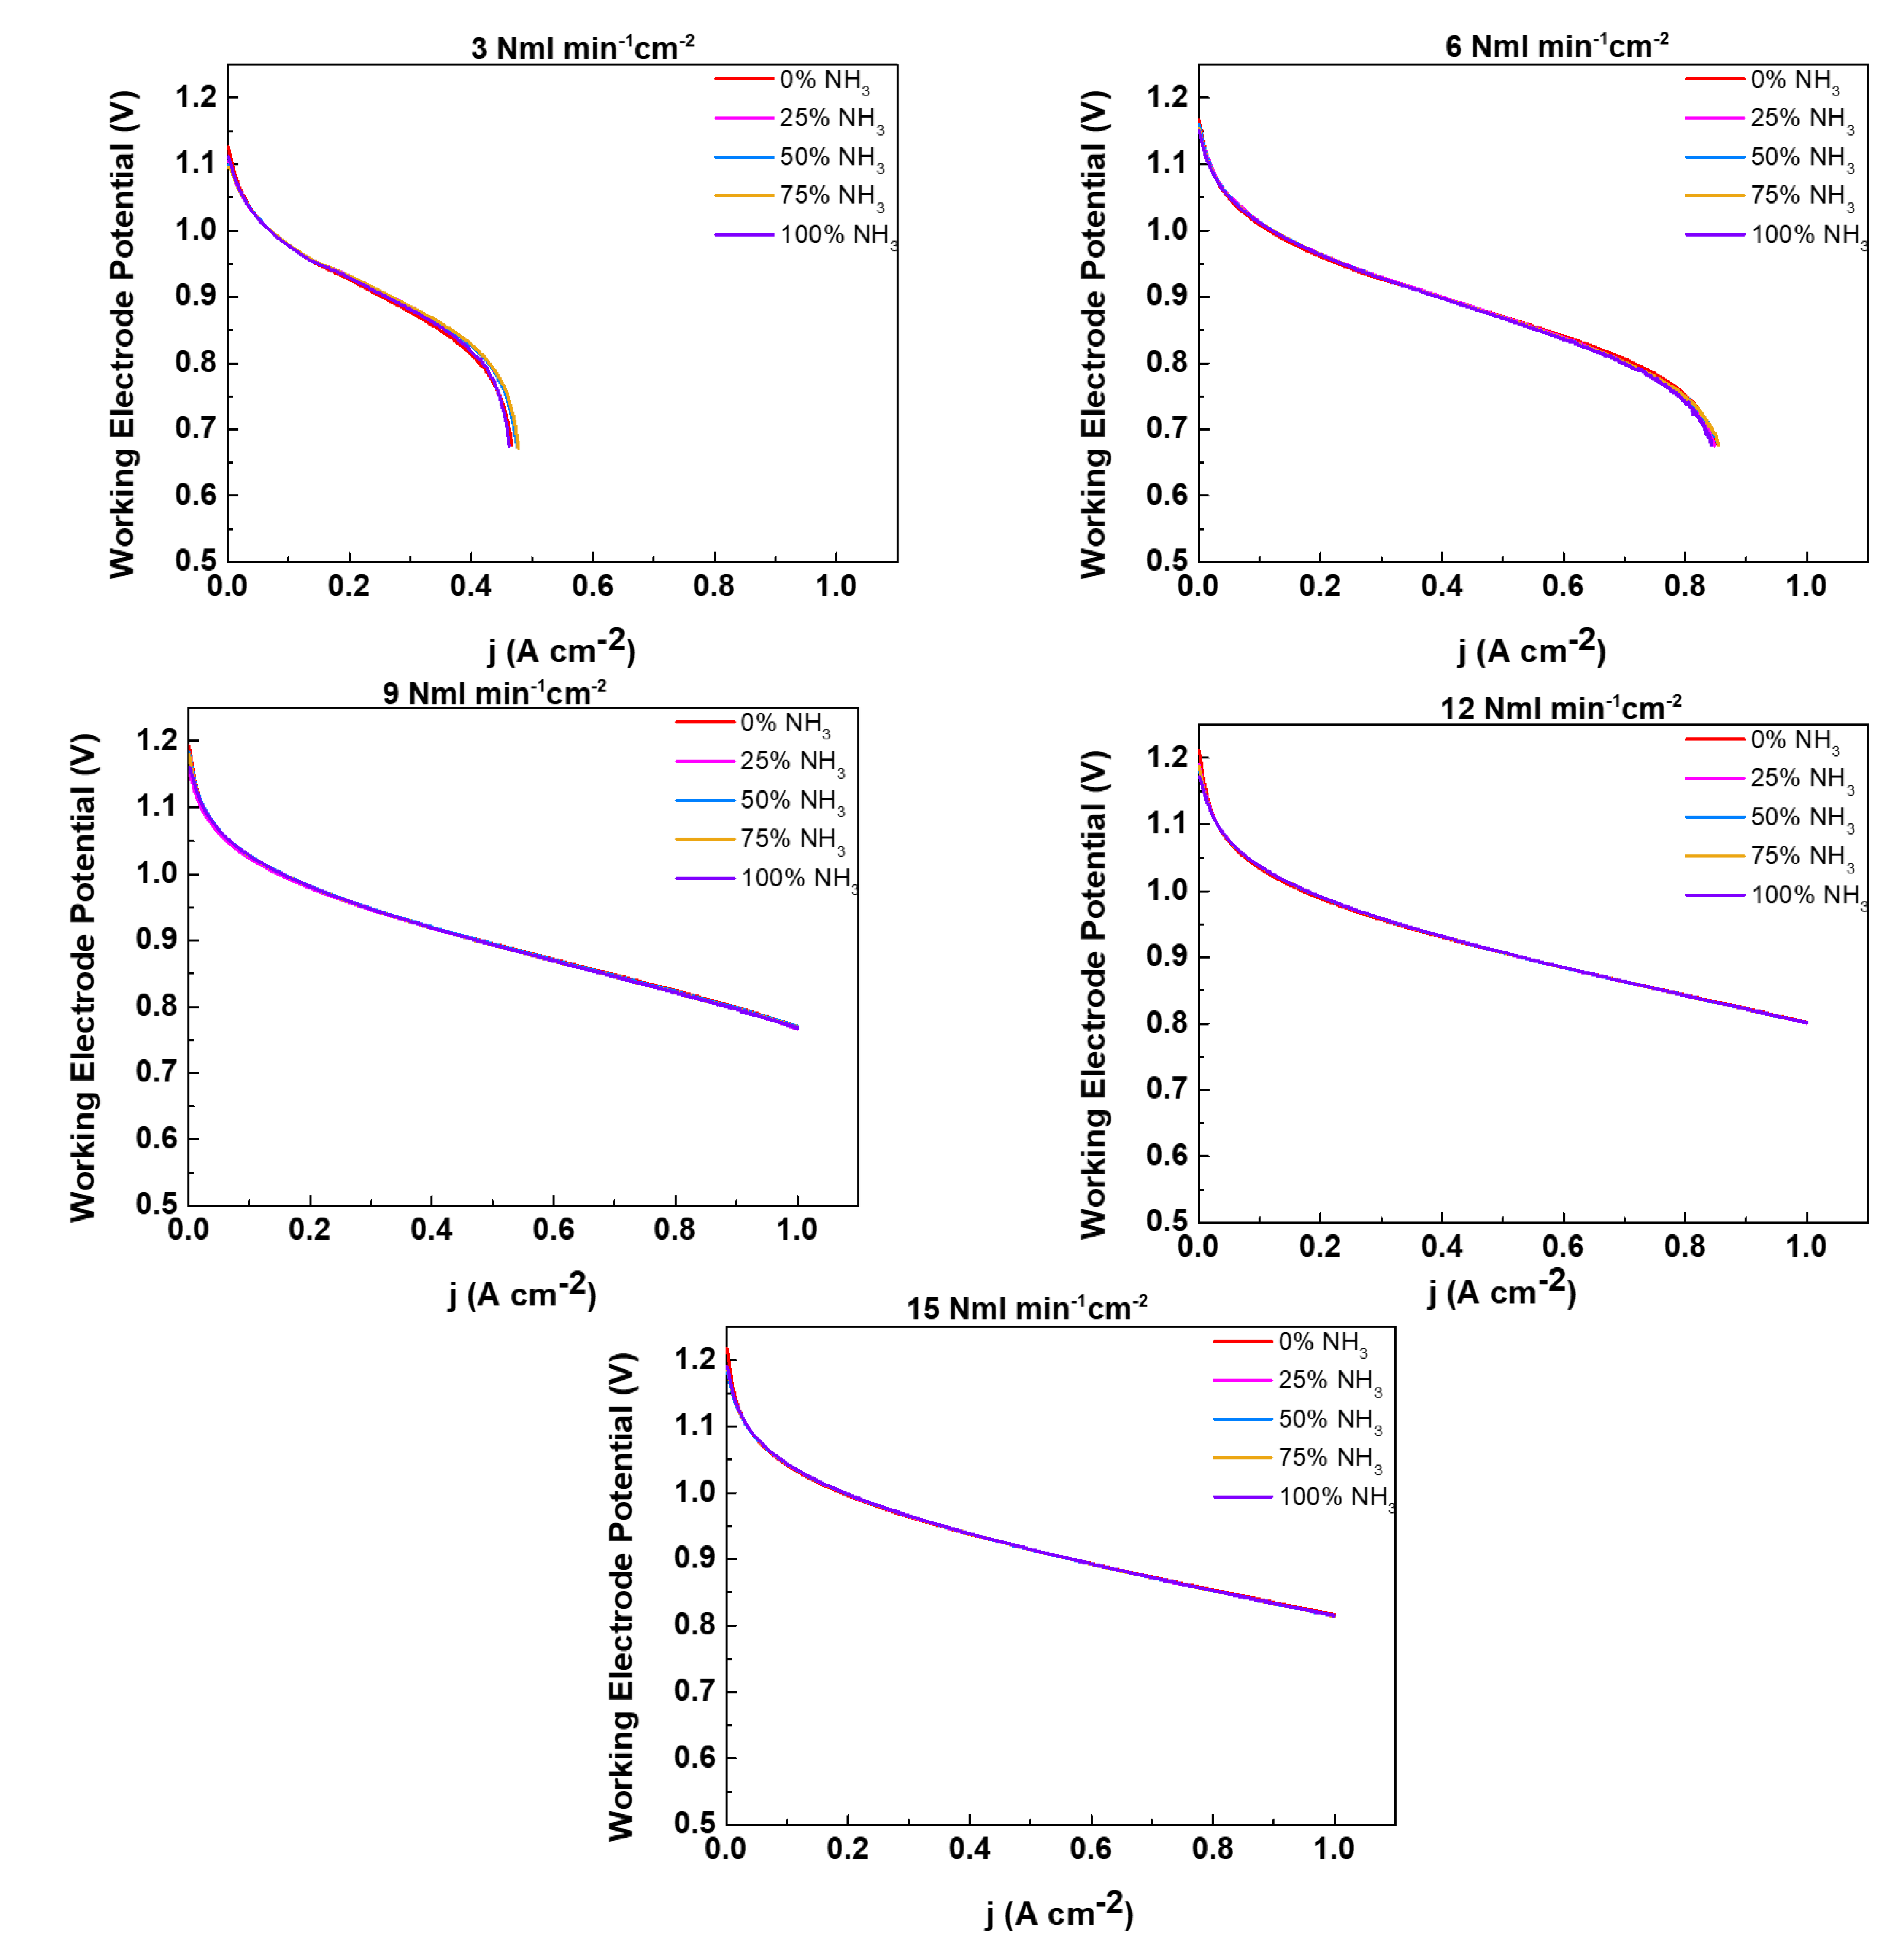
Figure 5.
Electric efficiencies evaluated for each total flow rate as a function of the percentage substitution (0% (red line), 25% (magenta line), 50% (light blue line), 75% (yellow line) and 100% (purple line).
Figure 5.
Electric efficiencies evaluated for each total flow rate as a function of the percentage substitution (0% (red line), 25% (magenta line), 50% (light blue line), 75% (yellow line) and 100% (purple line).
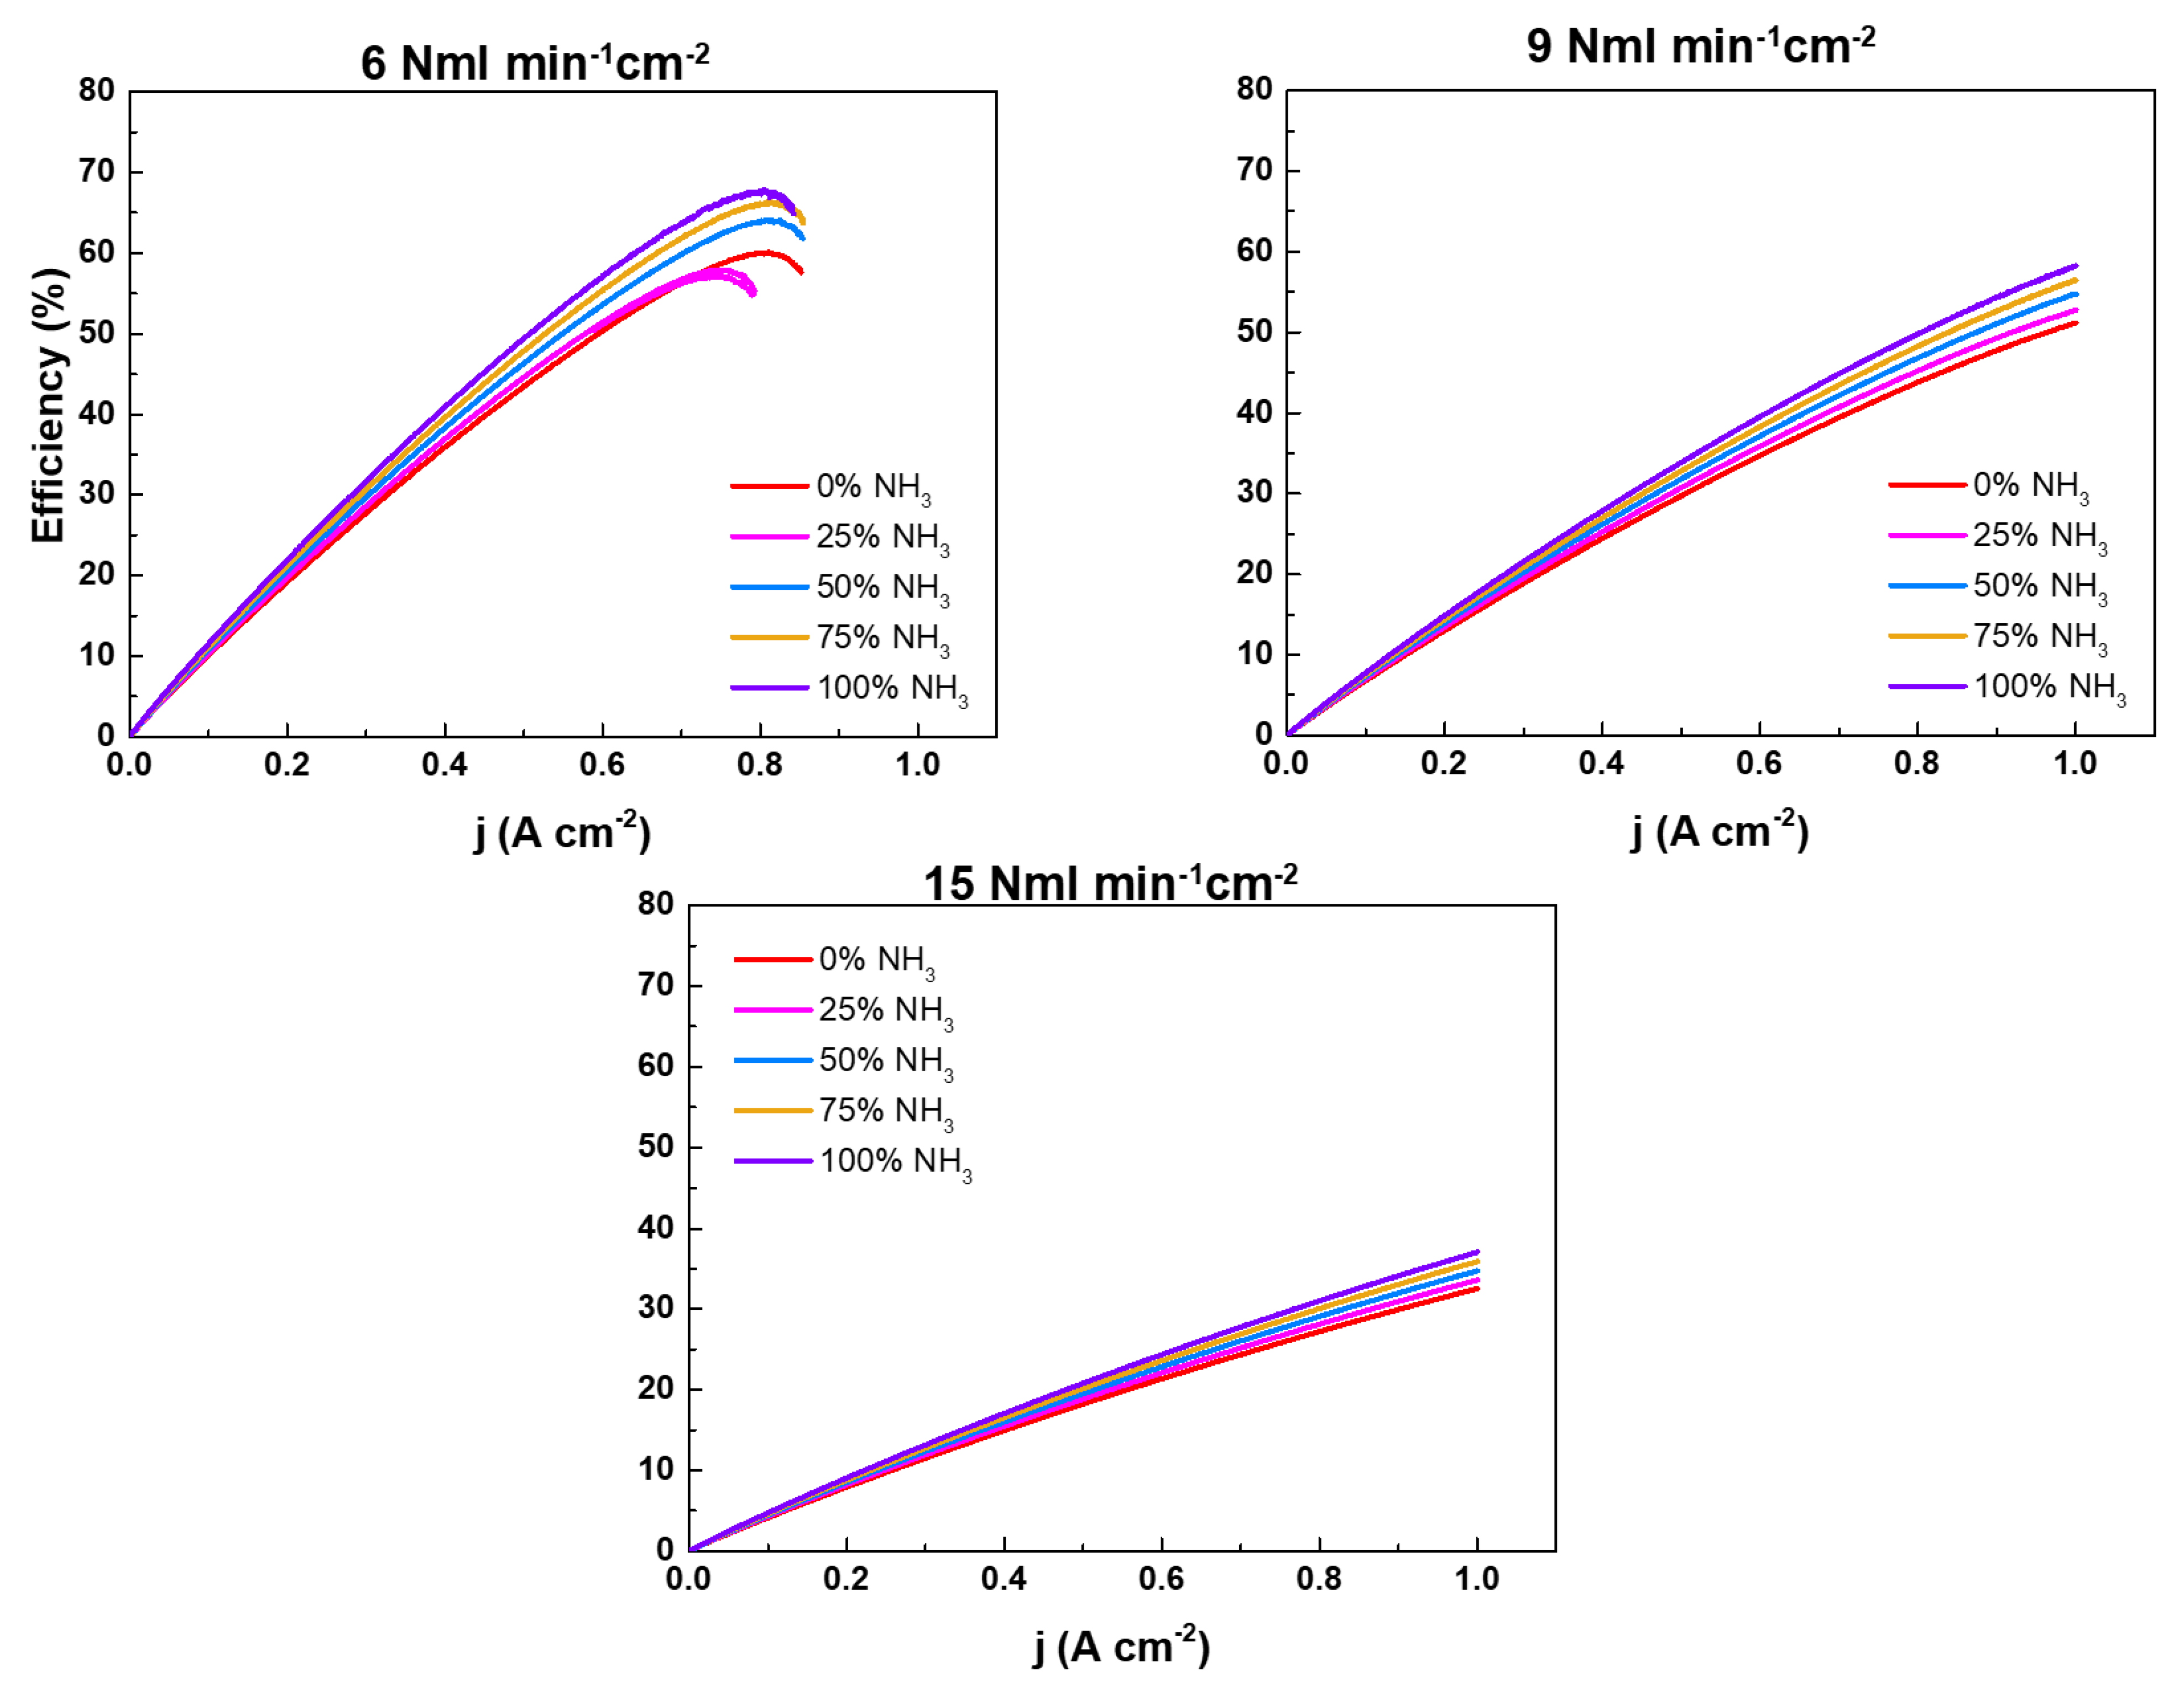
Figure 6.
Nyquist plot of EIS measurements performed on the sputtered GDC barrier layer SOFC at 800°C for 6 Nml∙min-1cm-2, 9 Nml∙min-1cm-2 and 15 Nml∙min-1cm-2 in diluted hydrogen (0% NH3, red dots) and direct ammonia feeding (100% NH3, purple dots).
Figure 6.
Nyquist plot of EIS measurements performed on the sputtered GDC barrier layer SOFC at 800°C for 6 Nml∙min-1cm-2, 9 Nml∙min-1cm-2 and 15 Nml∙min-1cm-2 in diluted hydrogen (0% NH3, red dots) and direct ammonia feeding (100% NH3, purple dots).
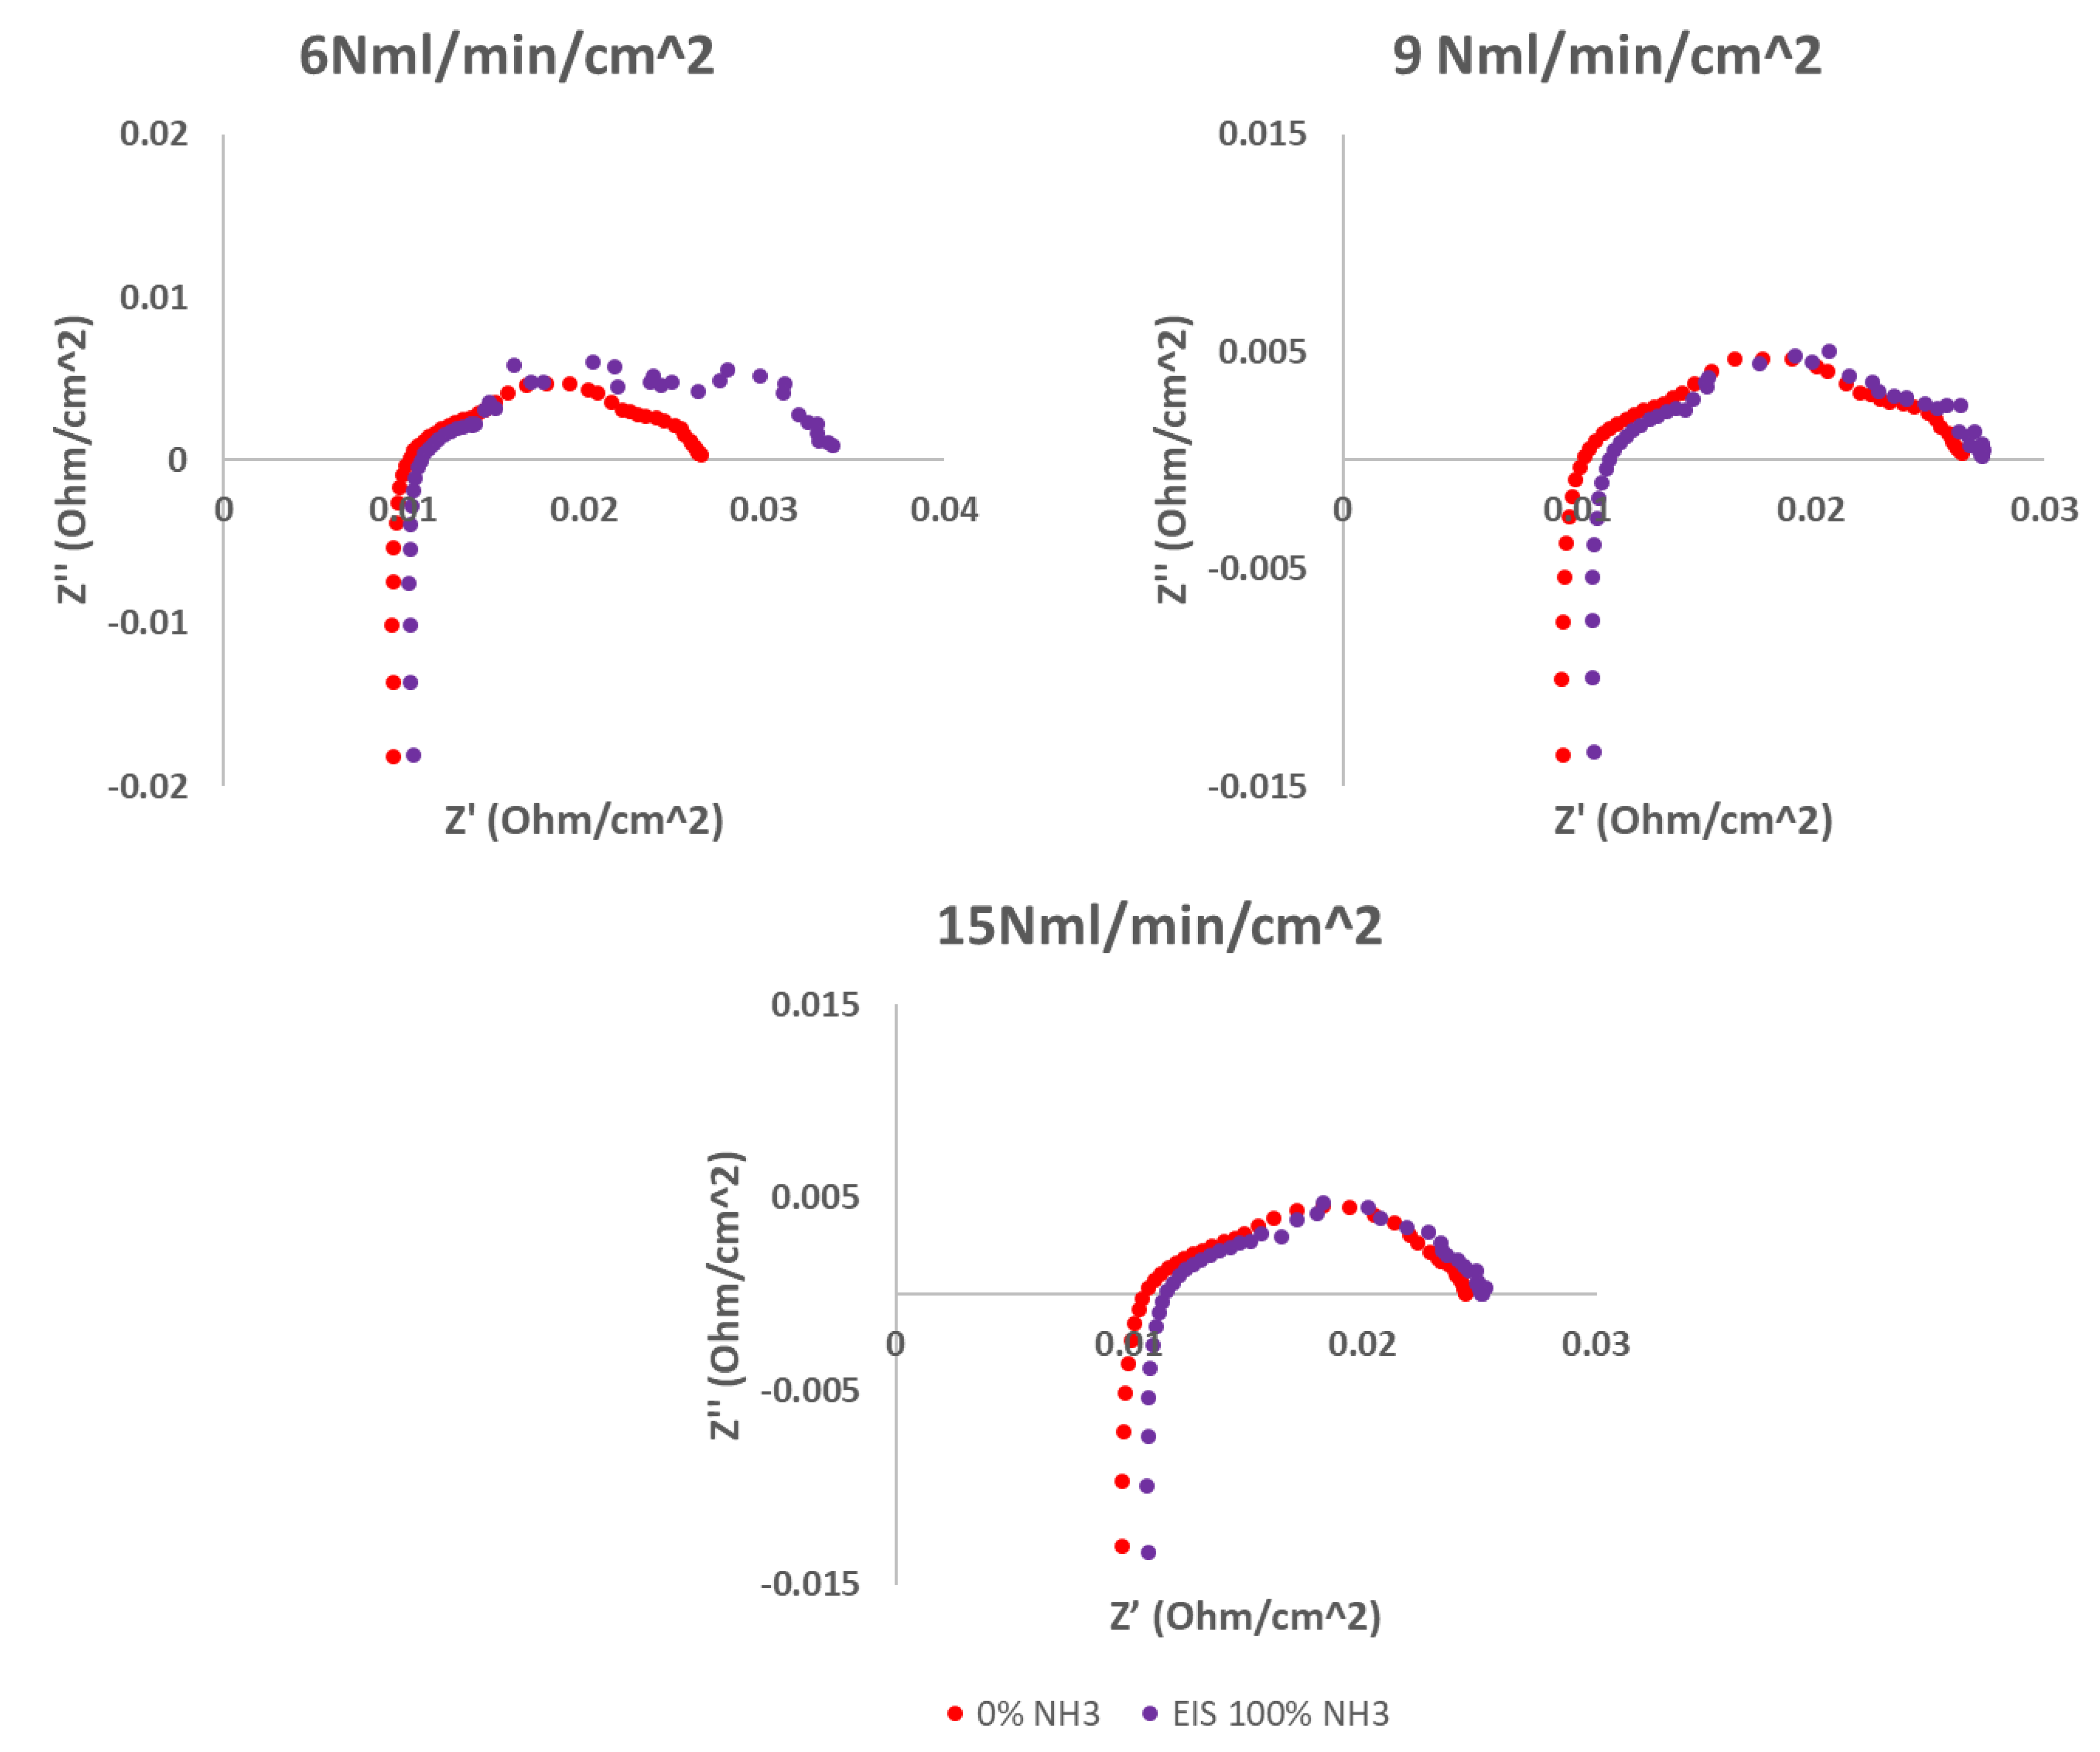
Figure 7.
j-V curves acquired at different working temperatures (750°C ), 700°C and 650°C for low flow rate (6 Nml∙min-1cm-22) and high flow rate (12 Nml∙min-1cm-22) for different percentage substitutions of diluted hydrogen with ammonia: 0% NH3 (diluted hydrogen, red line), 25% NH3 (magenta line), 50% NH3 (light blue line), 75% NH3(yellow line) and 100% NH3 (pure ammonia feeding, purple line).
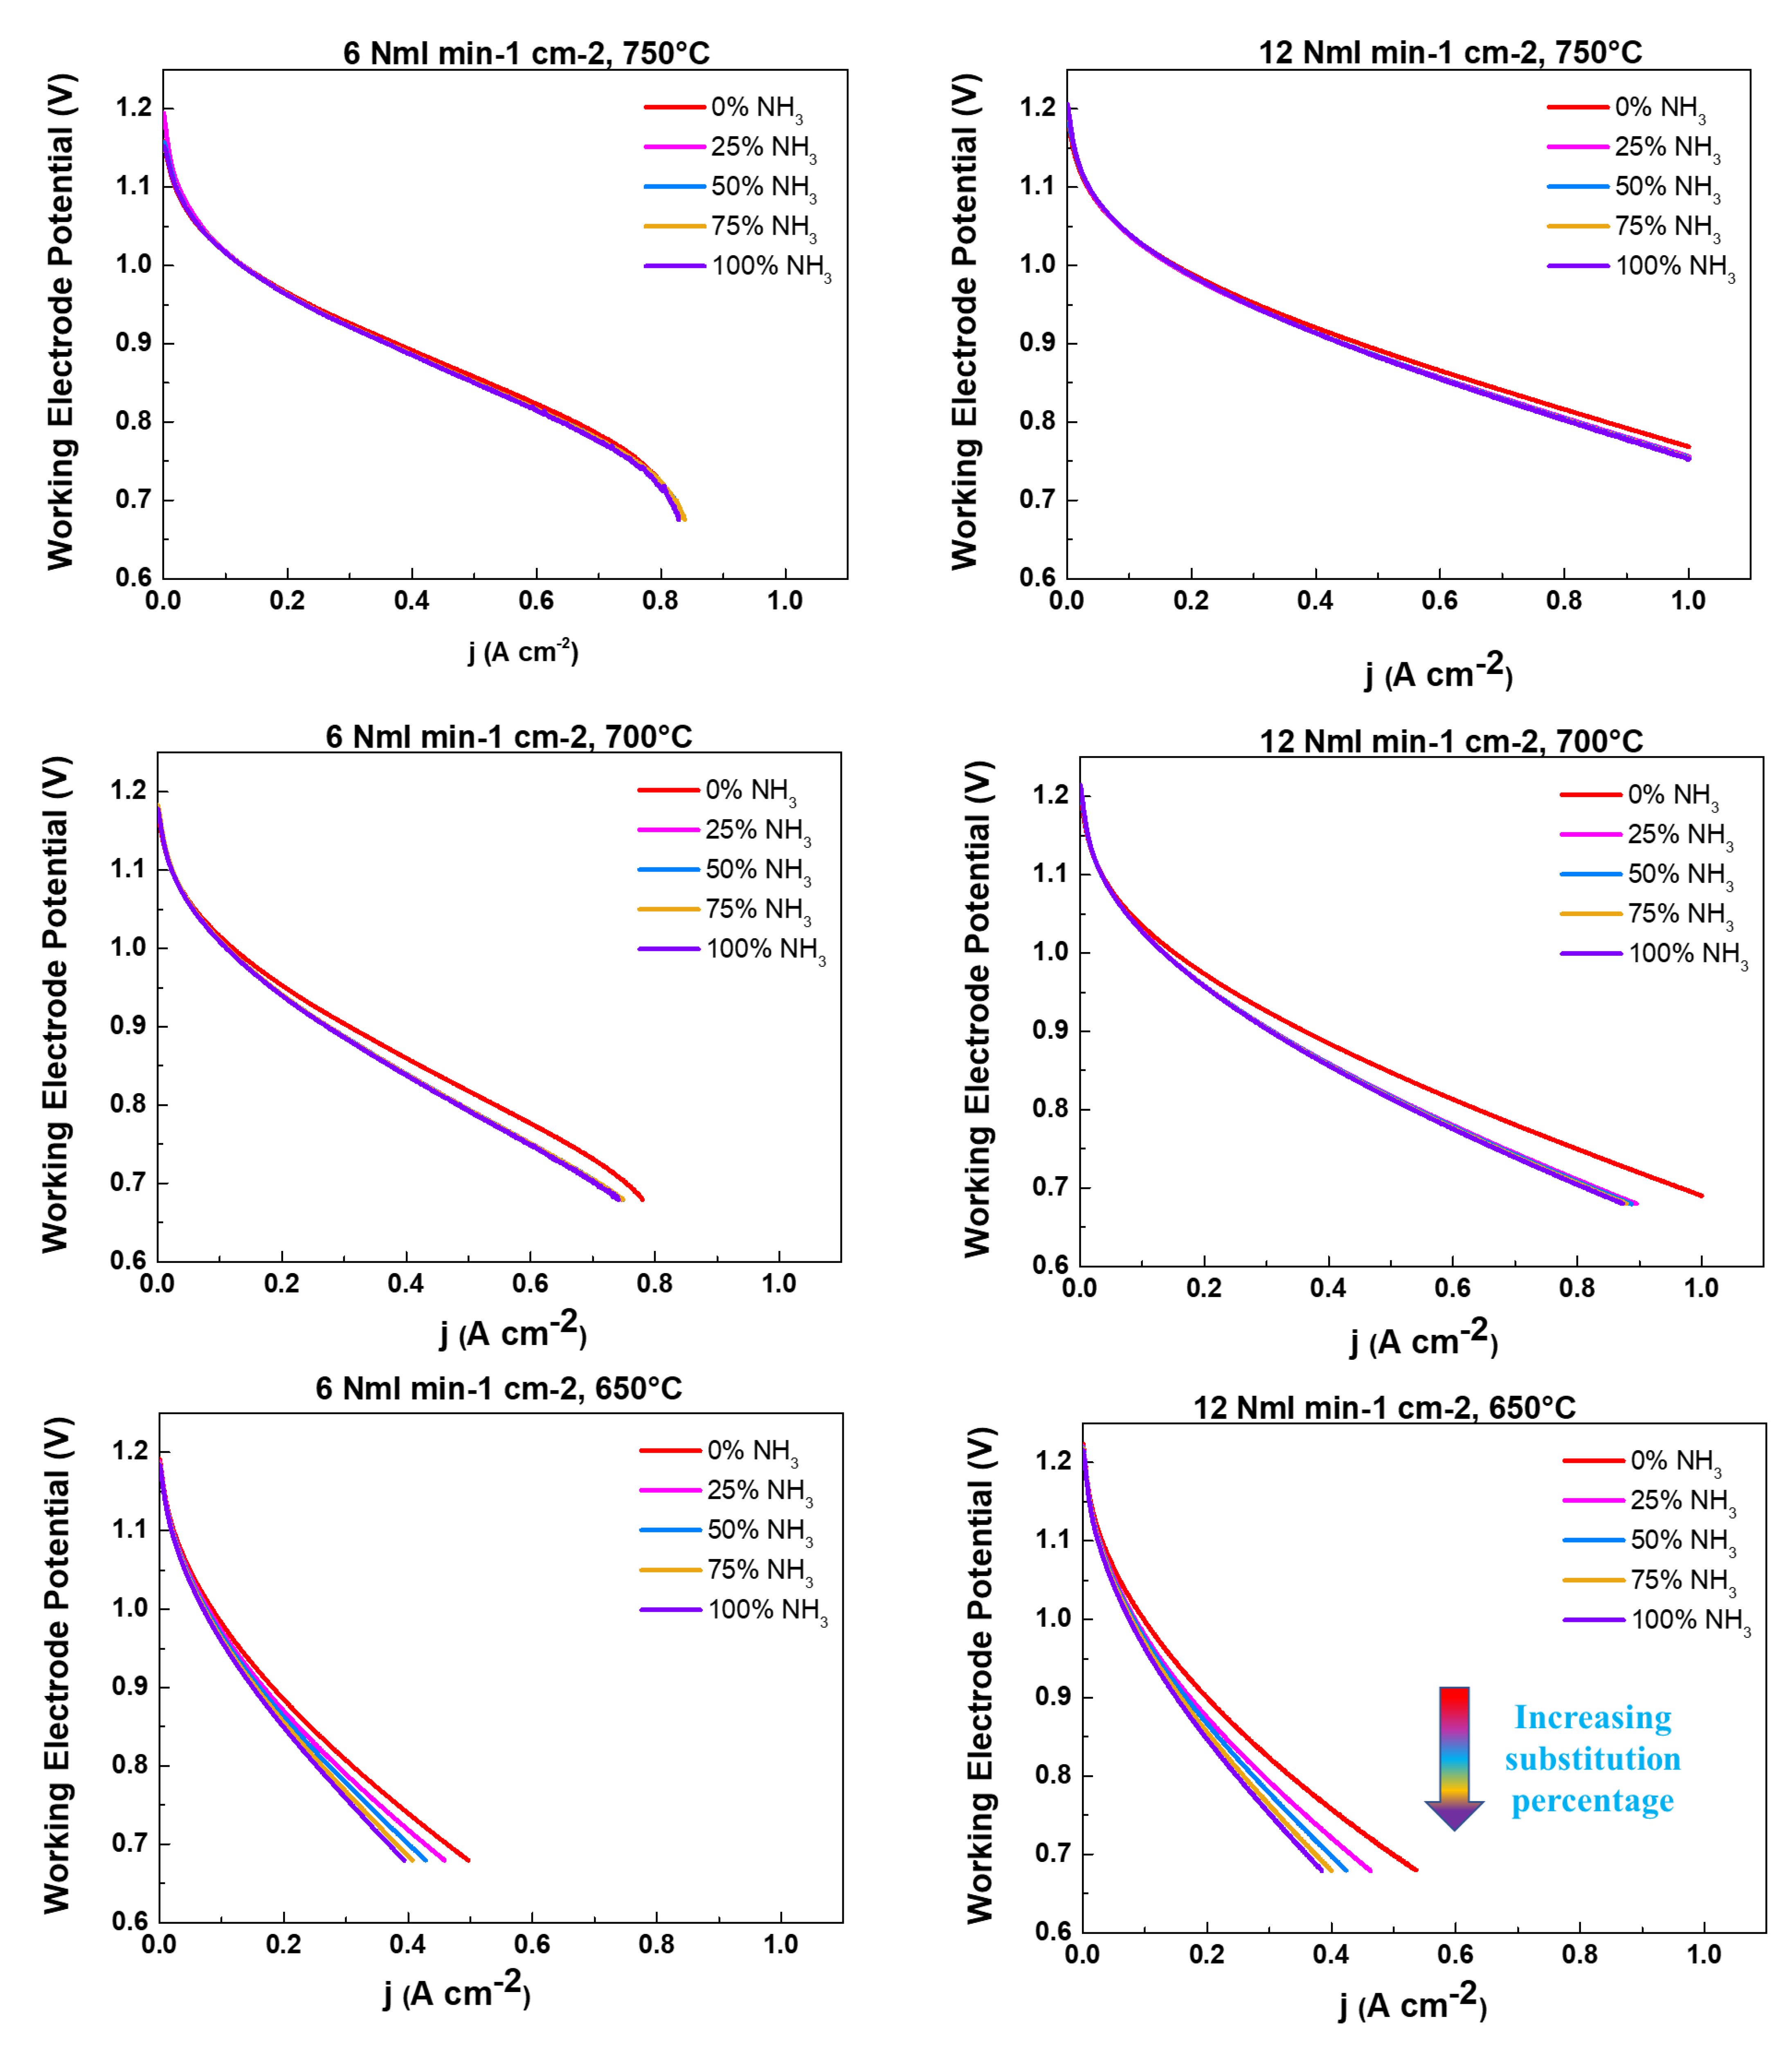
Figure 8.
Electrical efficiencies for 750°C (top), 700°C (mid) and 650°C (bottom) operating temperatures, function of high (12 Nml∙min-1cm-2) and low (6 Nml∙min-1cm-2) flow rates for the different ammonia substitution percentages: 0% (red line), 25% (magenta line), 50% (light blue line, 75% (yellow line) and 100% (purple line).
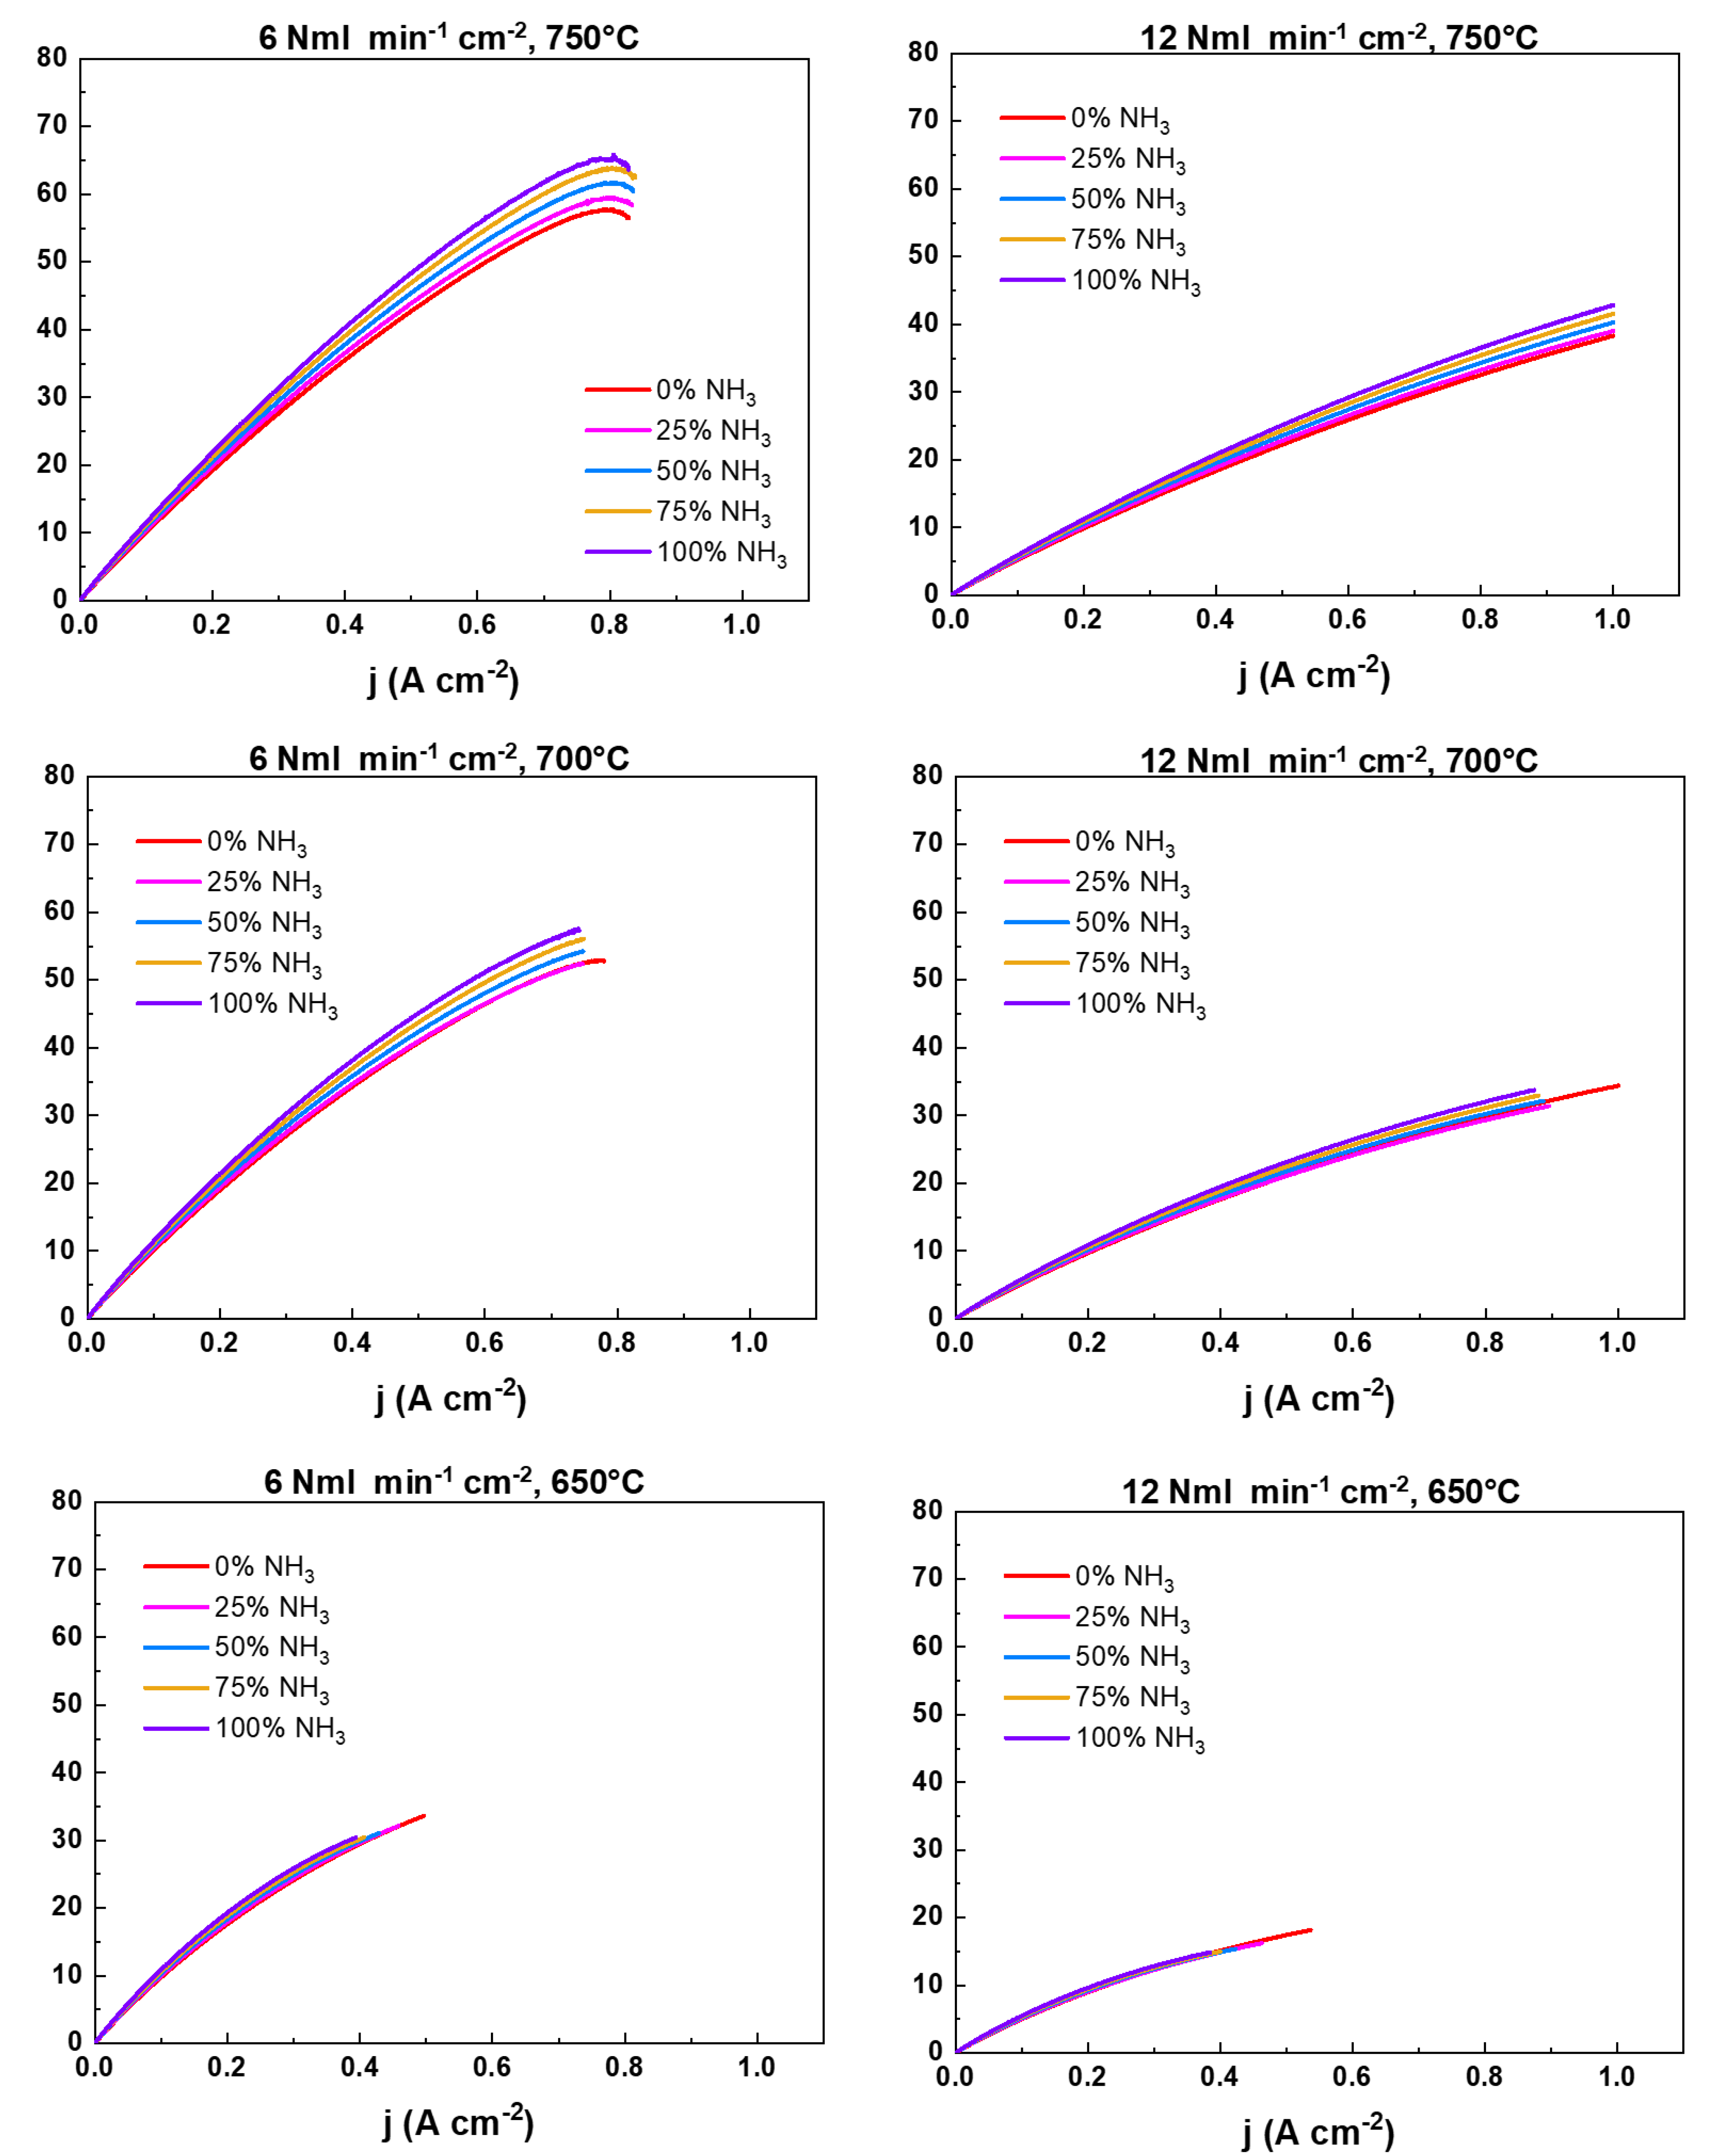
Figure 9.
EIS spectra acquired at 800°C, 750°C , 700°C and 650° at 6 Nml∙min-1cm-2 (yellow dots), 9 Nml∙min-1cm-2 (grey dots) and 12 (orange dots) Nml∙min-1cm-2 in 100% NH3 as a function of the total inlet flow rate. The legend present in the graph at 750°C applies to all the measurements present in the figure.
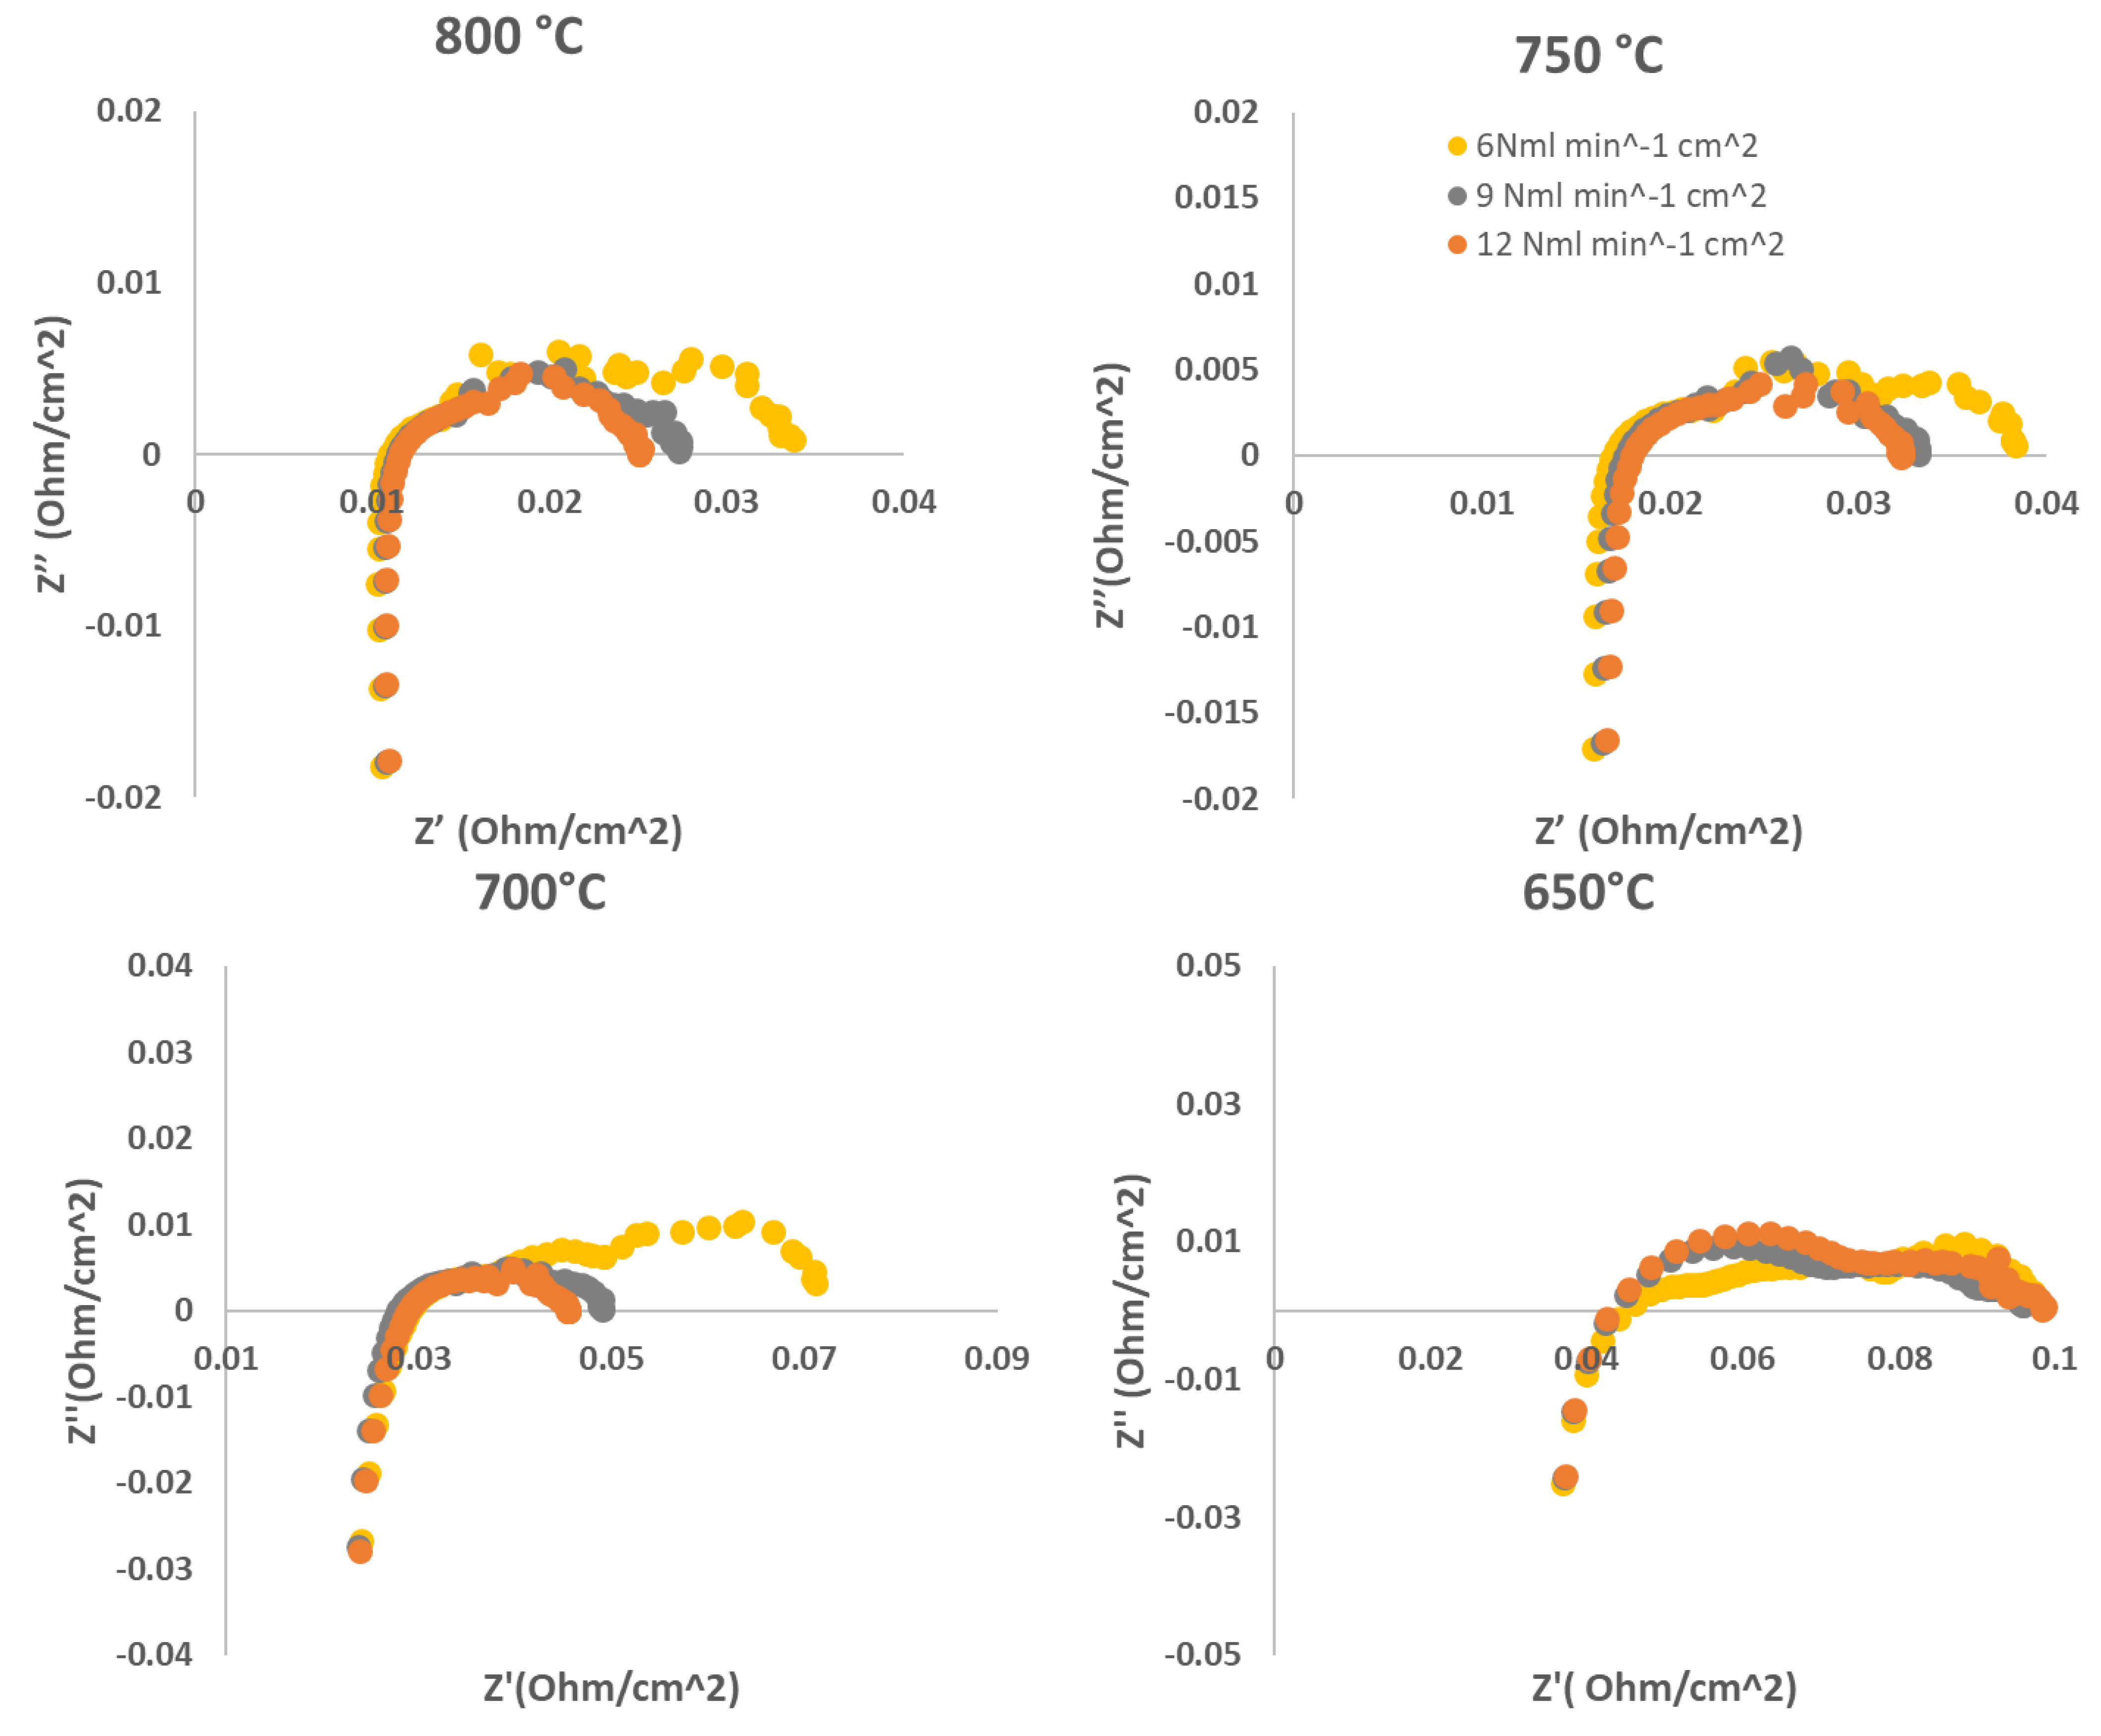

Table 1.
working temperatures and diluted H2 + N2 flowrates: for each temperature all the reported flowrates were explored.
Table 1.
working temperatures and diluted H2 + N2 flowrates: for each temperature all the reported flowrates were explored.
| Working temperatures (°C) | H2 (Nml min-1cm-2) | N2 (Nml min-1cm-2) |
|---|---|---|
| 800, 750, 700, 650 | 15 | 5 |
| 12 | 4 | |
| 9 | 3 | |
| 6 | 2 | |
| 3 | 1 |
Table 2.
NH3 substituted percentages of diluted H2 considering a gas made of 100 NH3 moles.
| substituted % | NH3 | H2 | N2 |
|---|---|---|---|
| 0 | 0 | 150 | 50 |
| 25 | 25 | 113 | 38 |
| 50 | 50 | 75 | 25 |
| 75 | 75 | 38 | 13 |
| 100 | 100 | 0 | 0 |
Disclaimer/Publisher’s Note: The statements, opinions and data contained in all publications are solely those of the individual author(s) and contributor(s) and not of MDPI and/or the editor(s). MDPI and/or the editor(s) disclaim responsibility for any injury to people or property resulting from any ideas, methods, instructions or products referred to in the content. |
© 2023 by the authors. Licensee MDPI, Basel, Switzerland. This article is an open access article distributed under the terms and conditions of the Creative Commons Attribution (CC BY) license (http://creativecommons.org/licenses/by/4.0/).
Copyright: This open access article is published under a Creative Commons CC BY 4.0 license, which permit the free download, distribution, and reuse, provided that the author and preprint are cited in any reuse.


