
Submitted:
31 May 2023
Posted:
31 May 2023
You are already at the latest version
Abstract
Management of Sclerotinia stem rot (SSR) disease in Brassica napus is heavily reliant on prophylactic fungicide applications at flowering, which often provides inconsistent control depending on timing of ascospore release in the field and environmental conditions. Understanding host response to Sclerotinia sclerotiorum infection is essential for sustainable disease management in the future. This study determined the host response of nine B. napus varieties to four aggressive S. sclerotiorum isolates across two years by measuring four disease variables; area under the disease progress stairs (AUDPS), seed production, sclerotia number and average sclerotia weight. Brassica napus varieties varied greatly in their response to the four measured variables, with varieties producing the highest AUDPS not the same varieties that had the lowest seed production, the highest numbers of sclerotia or heaviest sclerotia. Repeating the experiment over two years using the same varieties and isolates identified the impact of environment as the most influential factor on measured disease variables, highlighting the complexity of disease responses to diverse isolates and host genotypes under different environments. It was recommended that both long-term (such as inoculum production) and short-term (such as seed production) disease outcomes be combined with lesion length measurement (i.e. AUDPS) for future host screening studies.
Keywords:
Sclerotinia stem rot
; SSR
; pathogen
; canola/rapeseed
; sclerotia
; lesion
1. Introduction
Sclerotinia sclerotiorum Lib. (de Bary), a widespread necrotrophic plant pathogen, is known to infect and cause disease in over 500 plant species worldwide [1], including many important agronomic crops and weeds [2]. Sclerotinia stem rot (SSR) disease is a major limiting factor in the production of Brassica napus L. (canola/ rapeseed), the second most important oilseed crop in the world [3]. Under favourable environmental conditions, outbreaks of SSR can lead to substantial economic losses in B. napus through reduction in yield and grain quality [4]. Yield loss in B. napus is typically caused by S. sclerotiorum colonization of the main stem via infected petals lodging on axils, which blocks the movement of nutrients and water to the developing seeds [5]. Currently, SSR management in B. napus depends heavily on effective fungicide applications at the flowering stage, with no complete SSR host resistance available [6]. However, prophylactic fungicide applications are challenging as efficacy depends on accurate prediction of timing of fungal ascospore release and presence on the plant tissue [4]. A rapid expansion of B. napus production in Australia over the past few decades in combination with the long-term persistence of inoculum (sclerotia) in soil has highlighted the need for development of economically viable and effective SSR management strategies, that is underpinned by sound knowledge of the disease cycle in B. napus.
Whilst S. sclerotiorum has a broad host range and is considered to have little host specificity, the importance of understanding isolate diversity and subsequent pathogenicity on hosts throughout the growing period is well known as it enables effective screening strategies to be developed that identify host response and resistance [7]. Although many studies have been conducted on the pathogenicity of S. sclerotiorum isolates on mature Brassica [5,8,9,10,11,12,13] and non-Brassica species [14,15] host genotypes using stem inoculation, disease impact and isolate aggressiveness was singularly determined by stem lesion measurements. Furthermore, many of these B. napus screening studies utilized single isolates i.e. [5,8,10,11,13], which does not reflect the diversity present in S. sclerotiorum populations in the field with genetically distinct isolates infecting B. napus showing differentiation in phenotypic traits such as aggressiveness [9,12,16], germination and pre-conditioning requirements [17,18] and fungicide sensitivity [19].
To determine the whole impact of an isolate on its B. napus host (via expression of SSR disease), it is essential that the impact is assessed throughout the growing season examining both short- (i.e. lesion development, yield) and long-term (i.e. inoculum production) outcomes. Whilst it has been observed in the field that with heavy infections of the pathogen and under conducive conditions necrotic stem lesions can lead to lodging of B. napus plants by girdling the stem and causing SSR-induced yield loss [4], to our knowledge no study has examined the relationship between the degree of pathogenicity as measured by lesion length and final yield of Brassica napus genotypes. There have been research activities examining other important disease survival traits such as inoculum production on hosts, however these either focused on measurement of sclerotia morphology only [20,21], or were limited in their analysis or correlation to pathogenicity as determined by lesion length [12,16]. For example, Taylor et al. [12] measured both lesion length and sclerotia production in 20 B. napus lines inoculated with a single S. sclerotiorum isolate, with more resistant lines observed to produce fewer sclerotia in the stem, however no direct correlation between the two traits were made. Ge et al. [16] compared lesion length of B. napus with isolate sclerotia morphological traits such as growth rate and production, but these sclerotial traits were determined in vitro under laboratory conditions. Research has shown S. sclerotiorum isolates differ in their ability to produce inoculum, with sclerotia production highly variable in two genetically distinct S. sclerotiorum isolates from Alaska [20] when inoculated on excised tissue from two cabbage and three lettuce cultivars, but differences were less pronounced on carrot and celery. The strong influence of both host and isolate genotype on inoculum potential is also confirmed in the field by results from Taylor et al. [21] who inoculated five host genotypes (bean, carrot, potato, rape, lettuce) with three genetically distinct isolates. The ability of isolates to produce more sclerotia is highly beneficial for the long-term continuation of the pathogen as sclerotia can survive for up to 8 years in soil [2], increasing the potential for higher levels of infection in subsequent years. Furthermore, the ability of particular isolates to produce larger sclerotia may also lead to an ecological fitness advantage as they are shown to survive in the soil for longer periods [22] and produce more apothecia (and consequently ascospores) during carpogenic germination [23].
The aim of this study was to screen B. napus varieties to four diverse aggressive S. sclerotiorum isolates over two growing seasons. Host response was determined using a combination of disease variables measured through the disease cycle.
2. Materials and Methods
2.1. Sclerotinia sclerotiorum isolates
The four isolates used in this study, CU8.20, CU8.24, CU11.17, CU11.19, were selected from a collection of 71 isolates and identified as the most aggressive on B. napus. Each isolate represented a different mycelium compatibility grouping (MCG), a phenotypic marker controlled by multiple loci based on the ability of two isolates to form one indistinct colony. Cultures of each isolate were produced from stock sclerotia that were surface sterilized in bleach (White King premium bleach; 4% v/v sodium hypochlorite) for 4 mins, then washed for 4 mins in 4% ethanol, followed by a final wash in sterile Milli-Q water for 4 mins. Sclerotia were cut in half and placed on 90 mm Petri-dishes containing half strength potato dextrose agar (PDA) supplemented with 50µg mL-1 neomycin, 100 µg mL-1 streptomycin and 100 µg mL-1 ampicillin. Petri-dishes were incubated in the dark at room temperature (~20°C) until actively growing mycelium was observed (3-5 days). Each isolate was sub-cultured twice onto half-strength PDA plates by extracting an agar plug from the actively growing margins of mycelial growth before being used for inoculation.
2.2. Experimental design and plant growth
On 21 May 2019, five seeds from nine commercial B. napus varieties (Table 1) were sown 1 cm deep into 4 L pots filled with an all-purpose potting mix (UWA mix, Richgro) with five replicates of each variety grown for inoculation of each of four S. sclerotiorum isolates (CU8.20, CU8.24, CU11.17, CU11.19) with two application types (leaf axis, stem). A total of 360 pots were placed into an enclosed polytunnel greenhouse at Curtin University (-32.00581°, 115.89662°) in a completely randomized block design and irrigated daily for one minute. Seven days after sowing, germinated seedlings were thinned to one plant per pot and two 5 g doses of granular fertilizer Nitrophoska® Perfect (EuroChem Agro) were applied to each pot as required.
On 23rd April 2020, five seeds from nine B. napus varieties were sown into 4 L pots and maintained in an enclosed polytunnel greenhouse as described above (Table 1). A total of 340 pots were sown with five replicates of each variety used for each of the four S. sclerotiorum isolates (CU8.20, CU8.24, CU11.17, CU11.19) with one inoculation type (stem).
2.3. Inoculation
Plants were inoculated with 5 mm PDA agar plugs of actively growing S. sclerotiorum mycelium of one of the four isolates at 30% flowering (Table 1), considered to be the optimal timing for fungicide control. For plants grown in 2019, two inoculation treatments were applied, stem or leaf axis; whereas only stem inoculation was used for the 2020 experiment. For stem inoculation, the 5mm agar plug was positioned at the mid-point between two nodes approximately 30 cm from ground height on the main stem and secured in position using parafilm. For leaf axis inoculation, the 5 mm agar plug was placed at the base of the leaf node approximately 30 cm from ground height on the main stem and secured in position using parafilm.
2.4. Assessments and disease measurement
Stem lesion length (mm) was recorded at 7, 14, 21 and 28 days post inoculation and used to calculate the area under the disease progress stairs (AUDPS), a measurement that combines multiple observations of disease progression into a single value [24]. Stem width (mm) was measured seven days post inoculation at the point of inoculation and used to calculate lesion area (lesion length x stem width). Brassica napus seed were harvested two weeks after the irrigation was turned off to prevent losses from pod shattering due to desiccation. Seeds per plant were kept in individual paper bags in the polytunnel greenhouse until completely dry before being weighed to determine seed production (total grams per plant). Sclerotia were collected from dry plants approximately 2-3 weeks after harvest and sclerotia number, total sclerotia weight (g) and average individual sclerotia weight were recorded per plant.
For both studies, time of sowing was determined by following current farmer practice for high rainfall conditions in southern Australian mediterranean-type environments, with the optimum sowing window (April to May) in autumn corresponding with the onset of reliable growing season rainfall in each year. Daily minimum and maximum temperatures were recorded during the growing period. Accumulated thermal time (TT, °C days) for the pathogen was calculated using the R package “pollen” [25], with a minimum temperature base of 7°C and maximum base of 26°C used for S. sclerotiorum mycelium growth in the stem as previously determined by Koch [26].
2.5. Statistical analysis
The R package “agricole” [27] was used to calculate AUDPS from raw lesion data (7, 14, 21 and 28 days lesion length). Using the option “Analysis of Variance by ANOVA, REML or regression” in Genstat Version 20 (VSN International, Hemel Hempstead, UK.), statistical analyses were applied to raw data (AUDPS, seed production, sclerotia number, average sclerotia weight) to determine significant differences between means. Data were transformed to meet normality and homogeneity of variance where required. Bonferroni post-hoc test (P < 0.05) was performed when significant differences were observed following ANOVA. A Pearson’s correlation matrix was conducted in Genstat using all measured variables to determine which to include in further analysis. Using data from the stem inoculated varieties grown in both years, a Principal Components Analysis (PCA) was performed in R [28] with a correlation matrix of the six independent variables; seed production, stem width, AUDPS, sclerotia number, accumulated thermal time during AUDPS (0-28 days post inoculation) and accumulated thermal time post AUDPS (28 days post inoculation to harvest). A correlation matrix was used to convert all the variables to a common scale. Boxplots, climate and PCA data were plotted using the “ggplot2” R package [29].
3. Results
3.1. Effect of inoculation location
Brassica napus plants inoculated at the leaf axis with S. sclerotiorum had a significantly higher AUDPS (2353 vs 2054, P < 0.001), lower seed production (10.9 g vs 18.0 g, P < 0.001) and produced more sclerotia (11.2 vs 7.1, P < 0.001) that were heavier (0.021 g vs 0.019 g, P < 0.01) when compared to plants inoculated on the stem (Figure 1, Table 2A). The interaction between inoculation site and isolate also had a significant effect (P < 0.05) on sclerotia number and AUDPS (Table 2A), with isolate CU8.24 inoculated at the axis producing the most sclerotia (17, data not shown) and CU11.7 inoculated at the stem producing the least (5, data not shown). There was also an interaction between inoculation and variety (P<0.05) for AUDPS. As the leaf axis inoculation method was more significantly more aggressive than the stem inoculation method the subsequent experiment in 2020 focused on the stem inoculation method only.
3.2. Disease susceptibility of stem inoculated B. napus varieties
Analysis of variance of AUDPS and total sclerotia produced on stem inoculated varieties showed variety had a significant influence, both as a main effect (P < 0.001) and by interactions with year and with isolate (Figure 2, Table 2B). Variety type also differed in AUDPS, with open-pollinated (OP) varieties having a higher AUDPS than both the triazine (TT) and glyphosate tolerant (GT) hybrid B. napus varieties (data not shown). Variety had an impact on seed production (P < 0.001), which was also influenced by the interaction between variety and year (P < 0.001). The relationships between variety and the four disease variables was consistent across both datasets (Table 2; A 2019 varieties only, B stem inoculated varieties only), with variety influencing AUDPS, seed and sclerotia production (P < 0.001) but having no effect on average sclerotia weight.
Isolate significantly influenced all disease variables (Figure 3, Table 2B), with AUDPS highest in plants inoculated with CU8.20, significantly higher than those inoculated with CU11.7 and CU11.19 (following Bonferroni post-hoc tests). However, the interaction between isolate and year had a greater influence (P < 0.001) on AUDPS than the main treatment effect of isolate (P < 0.05) (Table 2B), with the lowest and highest AUDPS recorded in CU8.24 in 2019 and 2020 respectively (Figure 3A). The average seed production of inoculated plants was lower in plants grown in 2020 than those in 2019 (P < 0.001) with the lowest seed production recorded following inoculation with CU8.20 in 2020 (Figure 3B), and in the OP varieties across all isolates (data not shown). A significant interaction was only recorded for seed production between variety and year (P < 0.001) as well as in the three independent main factors (P < 0.05) (Table 2B) with the largest impact on seed production being year (F=114.86, df=1, P < 0.001). Total sclerotia number was also significantly higher in 2019 that in 2020 across all isolates with isolate CU8.24 consistently producing the most sclerotia (Figure 3C). Average sclerotia weight was analyzed using REML, to account for plants where no sclerotia were produced, and only showed a significant difference between isolates (P < 0.01).
3.3. Correlations between disease variables
Pearson’s correlation coefficient analysis of varieties stem inoculated across both years showed stem lesion length at 28 days, lesion area and AUDPS were strongly positively correlated (r≥0.91, P < 0.001) to each other (Table S1), as were sclerotia number and total sclerotia weight (r=0.88, P < 0.001). A weak, although still significant, negative relationship was observed between AUDPS and seed production (r = -0.56, P < 0.001), which was also the strongest correlation measured between seed production and any other disease or environmental variable (Table S1) No significant correlation was found between the two experimental years for each of the four response variables (r < 0. 19, r2 < 0.04).
3.4. Principal Components Analysis
The PCA was conducted using four disease variables; seed production, stem width, AUDPS and sclerotia number, in addition to two environmental variables; accumulated thermal time (TT) during the AUDPS measurements, and accumulated thermal time (TT) post AUDPS measurements until harvest (Table 3). All six variables were selected due to their independence as determined previously using the Pearson’s correlation coefficient analysis. The PCA was found to explain 82% of the variation in the first three principal components, and 67% in the first two components. The eigenvalues for the first two components (PC1 and PC2) exceeded 1.0, indicating they both encompass more variation than can be explained by any of the original variables independently. Variables having a strong loading on PC1 were seed production, accumulated thermal time during AUDPS and accumulated thermal time post AUDPS, and the variable with the strongest loading on PC2 was AUDPS, followed by stem width and sclerotia number.
The PCA biplot showed a distinct separation by year (Figure 4A) based on positive loadings for accumulated thermal time during and post AUDPS, and to a lesser extent seed production. AUDPS and stem width had an impact on separating plants in relation to maturity, with the mid-maturity varieties predominantly to the bottom of the biplot with an increasing stem width and reduced AUDPS and total sclerotia number (Figure 4B). A cluster of early maturity genotypes (Hyola 350TT in 2019) was present in the centre of the PCA biplot with high AUDPS scores (Figure 4C). Isolate did not appear to show any differentiation or clustering with all four isolates evenly dispersed throughout the biplot (Figure 4D).
4. Discussion
This study determined SSR susceptibility at various points through the growing season of B. napus varieties to four diverse S. sclerotiorum isolates screened over two years. We identified notable differences in varietal response, isolate aggressiveness and their corresponding interactions in relation to four disease outcomes – lesion development, sclerotia production, sclerotia weight and seed production. These responses also varied greatly depending on the environmental conditions experienced, with no consistent pattern occurring between the two study years.
The influence of environment, recorded in this study as temperature within the two experimental periods, is acknowledged as being crucial for SSR disease development and outcome, and therefore needs to be considered when undertaking variety screening studies as well as developing a disease rating system for B. napus. We found that the four isolates responded contrarily under the different environmental conditions of two growing seasons. For example, CU8.20 produced the longest lesions across all stem inoculated varieties in 2019, whereas the longest lesions were produced by CU8.24 in 2020, with CU8.20 producing significantly smaller lesions. The same response was also observed between varieties, with those being most susceptible in 2019 (i.e highest AUDPS and sclerotia numbers with lowest seed production) not being the same as the most susceptible varieties in 2020. Crop responses to S. sclerotiorum inoculation can be hard to replicate, even under controlled temperature environmental conditions. For example, following an experiment on lesion diameter growth on B. napus cotyledons after inoculation with four isolates of S. sclerotiorum, Garg et al. [7] found significant differences in cotyledon lesion diameter between hosts, isolates and host by isolate interactions. However, when the experiment was repeated using the same environment conditions (18/14°C) and treatments, pathogenicity responses differed, resulting in a significant, but weak correlation (r=0.56, r2 = 0.26) between the two experiments. In our study the experiment was repeated across two different seasons (effectively different environments) with no significant correlation identified between years, with seed production and sclerotia production, in particular, producing dissimilar responses in different seasons. However, the interactions between year and isolate, and year and variety were highly significant further emphasising the strong influence of environmental condition on host genotype and isolate response in relation to disease expression. It is suggested that temperature at the time of inoculation, and during disease progression (lesion and sclerotia development) has a significant effect on the aggressiveness of the different isolates, and their subsequent impact on the host. Barbetti et al. [30] previously suggested that warmer temperatures can lead to a reduction in host resistance through increased disease severity, as well as some of the genes associated with resistance being temperature-dependent and ineffective at higher temperatures.
A study by Li et al. [31] found time of inoculation (measured as days to 50% flowering) was strongly correlated to lesion length when measured at one and two weeks after inoculation, but no significant correlation was found at three weeks. Barbetti et al. [8] also found no significant relationship between flowering time and lesion length at three weeks. It was proposed that delaying the measurement of lesion length until after three weeks post inoculation avoids any confounding effect of flowering time between genotypes. This is supported by results from our study, which showed only a very weak correlation between lesion length at four weeks post inoculation and flowering time.
Brassica napus varieties were also found to vary in their response to the different measured disease variables, with varieties with the highest AUDPS not typically producing the highest sclerotia numbers or the heaviest sclerotia. Only a weak correlation was identified between B. napus seed production and AUDPS indicating that lesion length alone may not be the best measure of host resistance, as it does not provide an indication of the impact on B. napus seed production. To the best of our knowledge, no other studies investigating the susceptibility of B. napus varieties to S. sclerotiorum have continued their experiment through to harvest to obtain data for the mean seed production of infected plants. Following our results, it is recommended to also include other long-term disease outcome factors such as sclerotia production and weight as well as the impact on final seed production on assessments of variety susceptibility. Although the immediate impact of SSR is evident within the season in which it occurs (i.e. stem lesion length, yield loss), the long-term impact may be realised for up to eight years post infection through the production and persistence of sclerotia as a source of inoculum in subsequent seasons [2].
The final yield of B. napus following S. sclerotiorum infection varies depending on the size of the lesion and whether that lesion envelopes the whole stem, effectively impeding the translocation of nutrients and water up and down the stem, and the environmental conditions during and post infection. The influence of plant traits, such as thin versus thicker stems and maturity length, are reported to only have a weak relationship with disease susceptibility. Barbetti et al. [8] found no significant relationship between stem width and lesion length based on screening 19 B. napus genotypes with a single S. sclerotiorum isolate and measuring lesion length at three weeks post inoculation. No correlation between stem width and lesion length was also observed by Li et al. [31] who inoculated 15 B. napus and 38 B. juncea genotypes with a single isolate under field conditions. This contrasts with that found in Li et al. [32] where a strong relationship was observed between the two traits, potentially explained by the larger stem widths measured in the later study (0.37 to 1.01 cm from 42 B. napus and 12 B. juncea genotypes [32] compared to 0.46 to 1.79 cm in the later study [31]). Taylor et al. [12] also found a significant correlation between the two traits, however this relationship was very weak (R = -0.26). Our study also showed a weak significant correlation (-0.41) between the two traits, based on an average stem width of 1.27 cm and lesion length at four weeks across all varieties and years. However, it is important to note that the above studies only used a single isolate, whereas we used four diverse aggressive isolates. Stem width, therefore, does not appear to be a significant factor in predicting SSR resistance but may contribute to the overall variability in measured disease traits. For this reason, stem width was used as an explanatory variable in the PCA to help in the interpretation of the observed patterns but appeared to separate the plants based on season/year which may be linked to plant growth response to seasonal conditions, rather than disease response.
Inoculation at the leaf axis was found to be too aggressive and direct comparisons to other inoculation studies was difficult. Although inoculation at the leaf axis mimics what occurs in a commercial crop in the field, inoculation in the study was through the application of actively growing mycelium, rather than germinating ascospores on dying petals sitting in the leaf axis. There appears to be a weak point in the stem-leaf axis which resulted in a more severe impact of the pathogen, in relation to a greater number and heavier sclerotia being produced, a lower B. napus seed production and a greater AUDPS. Stem inoculation is therefore recommended as the best method for a standardised inoculation procedure and is a commonly used inoculation method in the literature (i.e. [5,8,9,10,11,13,14,16,32,35].
Long term success in breeding and utilising resistant B. napus genotypes requires a detailed understanding of the ecology and life history of both host and pathogen as well as their interactions [33]. With abundant information on host and pathogen genotypes generated from rapidly evolving next-generation sequencing and other molecular tools in the laboratory, the challenge is to apply this knowledge to the field and develop better disease management systems [33]. Resistance to Sclerotinia species is through the interaction of many minor effect genes, termed quantitative disease resistance [34], indicating the development of complete host resistance as a disease management tool is problematic. Consequently, only partial resistance has been identified in B. napus to date [35], and therefore it is important to understand the impact of infection from the whole disease cycle perspective, not just stem resistance.
The important points arising from this study that require further investigation are the potential importance of environmental conditions, primarily temperature, at the time of inoculation and during the infection process and their influence on the response of both different B. napus varieties and different S. sclerotiorum isolates. This has important implications for future screening of disease resistance in B. napus genotypes and in the development of a disease rating system, as the results and recommendations may vary depending on the environment in which the screening takes place, and on the varietal choices that growers are making depending on their environment. Further work is required to better understand the role of environmental conditions within the season on disease development.
To conclude, the host response of nine B. napus varieties to four aggressive S. sclerotiorum isolates was determined across four disease variables over two years. The varieties varied greatly in their response with the impact of environment having the greatest effect on disease development across all the measured variables. The lack of correlation between the disease traits highlights the complexity of disease responses to diverse isolates and host genotypes under different environments, and it is recommended that both long-term (such as inoculum production) and short-term (such as seed production) disease outcomes are combined with lesion length measurements for future studies.
Supplementary Materials
The following supporting information can be downloaded at the website of this paper posted on Preprints.org, Table S1: Pearson’s correlation coefficient matrix using all 27 disease variables measured for nine commercial Australian B. napus varieties stem inoculated in 2019 and 2020 with four S. sclerotiorum isolates.
Author Contributions
Conceptualization, P.M. and S.B.; methodology, P.M., A.R-L. and S.B.; validation, P.M. and S.B.; formal analysis, P.M. and S.B.; investigation, P.M., A.R-L. and S.B.; resources, P.M. and S.B.; data curation, P.M., A.R-L. and S.B.; writing—original draft preparation, P.M. and S.B.; writing—review and editing, P.M. and S.B.; visualization P.M. and S.B.; supervision, S.B.; project administration, P.M. and S.B.; funding acquisition, S.B. All authors have read and agreed to the published version of the manuscript.
Funding
This research was funded through a co-investment by Curtin University and the Grains Research and Development Corporation (GRDC), grant number CUR00023.
Data Availability Statement
The data that support the findings of this study are available from the corresponding author upon reasonable request.
Acknowledgments
Thank you to BASF Australia Ltd, Pioneer Seeds Australia, Nuseed Pty Ltd, Advanta Seeds Pty Ltd and Nutrien Ag Solutions Ltd for provision of seed.
Conflicts of Interest
The authors declare no conflict of interest. The funders had no role in the design of the study; in the collection, analyses, or interpretation of data; in the writing of the manuscript, or in the decision to publish the results.
References
- Saharan, G.S.; Mehta, N. Sclerotinia diseases of crop plants: biology, ecology and disease management; Springer: Dordrecht, Netherlands, 2008.
- Bolton, M.D.; Thomma, B.; Nelson, B.D. Sclerotinia sclerotiorum (Lib.) de Bary: biology and molecular traits of a cosmopolitan pathogen. Mol. Plant Pathol. 2006, 7, 1-16. [CrossRef]
- Zheng, X.; Koopmann, B.; Ulber, B.; von Tiedemann, A. A global survey on diseases and pests in oilseed rape - current challenges and innovative strategies of control. Front. Agron. 2020, 2, 590908. [CrossRef]
- Derbyshire, M.C.; Denton-Giles, M. The control of Sclerotinia stem rot on oilseed rape (Brassica napus): current practices and future opportunities. Plant Pathol. 2016, 65, 859-877. [CrossRef]
- Gyawali, S.; Harrington, M.; Durkin, J.; Horner, K.; Parkin, I.A.P.; Hegedus, D.D.; Bekkaoui, D.; Buchwaldt, L. Microsatellite markers used for genome-wide association mapping of partial resistance to Sclerotinia sclerotiorum in a world collection of Brassica napus. Mol. Breed. 2016, 36, 72. [CrossRef]
- Derbyshire, M.C.; Newman, T.E.; Khentry, Y.; Owolabi Taiwo, A. The evolutionary and molecular features of the broad-host-range plant pathogen Sclerotinia sclerotiorum. Mol. Plant Pathol. 2022, 23, 1075-1090. [CrossRef]
- Garg, H.; Kohn, L.M.; Andrew, M.; Li, H.; Sivasithamparam, K.; Barbetti, M.J. Pathogenicity of morphologically different isolates of Sclerotinia sclerotiorum with Brassica napus and B. juncea genotypes. Eur. J. Plant Pathol. 2010, 126, 305-315. [CrossRef]
- Barbetti, M.J.; Li, C.X.; Banga, S.S.; Banga, S.K.; Singh, D.; Sandhu, P.S.; Singh, R.; Liu, S.Y.; You, M.P. New host resistances in Brassica napus and Brassica juncea from Australia, China and India: key to managing Sclerotinia stem rot (Sclerotinia sclerotiorum) without fungicides. Crop Protect. 2015, 78, 127-130. [CrossRef]
- Denton-Giles, M.; Derbyshire, M.C.; Khentry, Y.; Buchwaldt, L.; Kamphuis, L.G. Partial stem resistance in Brassica napus to highly aggressive and genetically diverse Sclerotinia sclerotiorum isolates from Australia. Can. J. Plant Pathol. 2018, 40, 1-11. [CrossRef]
- Li, C.; Liu, S.; Sivasithamparam, K.; Barbetti, M. New sources of resistance to Sclerotinia stem rot caused by Sclerotinia sclerotiorum in Chinese and Australian Brassica napus and B. juncea germplasm screened under Western Australian conditions. Australas. Plant Pathol. 2008, 38, 149-152. [CrossRef]
- Rana, K.; Atri, C.; Gupta, M.; Akhatar, J.; Sandhu, P.S.; Kumar, N.; Jaswal, R.; Barbetti, M.J.; Banga, S.S. Mapping resistance responses to Sclerotinia infestation in introgression lines of Brassica juncea carrying genomic segments from wild Brassicaceae B. fruticulosa. Scientific Reports 2017, 7, 5904. [CrossRef]
- Taylor, A.; Coventry, E.; Jones, J.E.; Clarkson, J.P. Resistance to a highly aggressive isolate of Sclerotinia sclerotiorum in a Brassica napus diversity set. Plant Pathol. 2015, 64, 932-940. [CrossRef]
- Uloth, M.B.; You, M.P.; Barbetti, M.J. Host resistance to Sclerotinia stem rot in historic and current Brassica napus and B. juncea varieties: critical management implications. Crop Pasture Sci. 2015, 66, 841-848. [CrossRef]
- Ekins, M.G.; Aitken, E.A.B.; Goulter, K.C. Aggressiveness among isolates of Sclerotinia sclerotiorum from sunflower. Australas. Plant Pathol. 2007, 36, 580-586. [CrossRef]
- Mwape, V.W.; Khentry, Y.; Newman, T.E.; Denton-Giles, M.; Derbyshire, M.C.; Chen, K.; Berger, J.; Kamphuis, L.G. Identification of sources of Sclerotinia sclerotiorum resistance in a collection of wild Cicer germplasm. Plant Dis. 2021, 105, 2314-2324. [CrossRef]
- Ge, X.T.; Li, Y.P.; Wan, Z.J.; You, M.P.; Finnegan, P.M.; Banga, S.S.; Sandhu, P.S.; Garg, H.; Salisbury, P.A.; Barbetti, M.J. Delineation of Sclerotinia sclerotiorum pathotypes using differential resistance responses on Brassica napus and B. juncea genotypes enables identification of resistance to prevailing pathotypes. Field Crops Res. 2012, 127, 248-258. [CrossRef]
- Michael, P.J.; Lui, K.Y.; Thomson, L.L.; Lamichhane, A.R.; Bennett, S.J. Impact of preconditioning temperatures and duration period on carpogenic germination of diverse Sclerotinia sclerotiorum (Lib.) de Bary populations in south-western Australia. Plant Dis. 2021, 105, 1798-1805. [CrossRef]
- Michael, P.J.; Lui, K.Y.; Thomson, L.L.; Stefanova, K.; Bennett, S.J. Carpogenic germinability of diverse Sclerotinia sclerotiorum populations within the southwestern Australian grain belt. Plant Dis. 2020, 104, 2891-2897. [CrossRef]
- Attanayake, R.N.; Carter, P.A.; Jiang, D.; del Río-Mendoza, L.; Chen, W. Sclerotinia sclerotiorum populations infecting canola from China and the United States are genetically and phenotypically distinct. Phytopathology 2013, 103, 750-761. [CrossRef]
- Leiner, R.H.; Winton, L.M. Differential production of sclerotia by isolates of Sclerotinia sclerotiorum from Alaska. Can. J. Plant Pathol. 2006, 28, 435-440. [CrossRef]
- Taylor, A.; Coventry, E.; Handy, C.; West, J.S.; Young, C.S.; Clarkson, J.P. Inoculum potential of Sclerotinia sclerotiorum sclerotia depends on isolate and host plant. Plant Pathol. 2018, 67, 1286-1295. [CrossRef]
- Harvey, I.C.; Foley, L.M.; Saville, D.J. Survival and germination of shallow-buried sclerotia of Sclerotinia sclerotiorum in pastures in Canterbury. N. Z. J. Agric. Res. 1995, 38, 279-284. [CrossRef]
- Dillard, H.R.; Ludwig, J.W.; Hunter, J.E. Conditioning sclerotia of Sclerotinia sclerotiorum for carpogenic germination. Plant Dis. 1995, 79, 411-415.
- Simko, I.; Piepho, H.-P. The area under the disease progress stairs: calculation, advantage, and application. Phytopathology 2012, 102, 381-389. [CrossRef]
- Nowosad, J. pollen: Analysis of Aerobiological Data; R package version 0.71; https://CRAN.R-project.org/package=pollen: 2019.
- Koch, S.; Dunker, S.; Kleinhenz, B.; Röhrig, M.; Tiedemann, A.V. A crop loss-related forecasting model for Sclerotinia stem rot in winter oilseed rape. Phytopathology 2007, 97, 1186-1194. [CrossRef]
- de Mendiburu, F. agricolae: Statistical Procedures for Agricultural Research; R package version 1.3-3. https://CRAN.R-project.org/package=agricolae: 2020.
- R Core Team R: A language and environment for statistical computing, R Foundation for Statistical Computing: Vienna, Austria, 2020.
- Wickham, H. Elegant graphics for data analysis; Springer-Verlag: New York, USA, 2016.
- Barbetti, M.J.; Banga, S.S.; Salisbury, P.A. Challenges for crop production and management from pathogen biodiversity and diseases under current and future climate scenarios – case study with oilseed Brassicas. Field Crops Res. 2012, 127, 225-240. [CrossRef]
- Li, C.X.; Li, H.; Siddique, A.B.; Sivasithamparam, K.; Salisbury, P.; Banga, S.S.; Banga, S.; Chattopadhyay, C.; Kumar, A.; Singh, R., et al. The importance of the type and time of inoculation and assessment in the determination of resistance in Brassia napus and B. juncea to Sclerotinia sclerotiorum. Aust. J. Agric. Res. 2007, 58, 1198-1203. [CrossRef]
- Li, C.; Li, H.; Sivasithamparam, K.; Fu, T.; Li, Y.; Liu, S.; Barbetti, M. Expression of field resistance under Western Australian conditions to Sclerotinia sclerotiorum in Chinese and Australian Brassica napus and Brassica juncea germplasm and its relation with stem diameter. Aust. J. Agric. Res. 2006, 57, 1131-1135. [CrossRef]
- Neik, T.X.; Barbetti, M.J.; Batley, J. Current status and challenges in identifying disease resistance genes in Brassica napus. Front. Plant Sci. 2017, 8, 1788. [CrossRef]
- O’Sullivan, C.A.; Belt, K.; Thatcher, L.F. Tackling control of a cosmopolitan phytopathogen: Sclerotinia. Front. Plant Sci. 2021, 12, 1764. [CrossRef]
- Mbengue, M.; Navaud, O.; Peyraud, R.; Barascud, M.; Badet, T.; Vincent, R.; Barbacci, A.; Raffaele, S. Emerging trends in molecular interactions between plants and the broad host range fungal pathogens Botrytis cinerea and and Sclerotinia sclerotiorum. Front. Plant Sci. 2016, 7. [CrossRef]
Figure 1.
Boxplots showing (A) AUDPS (area under the disease progress stairs), (B) seed production (g), (C) total sclerotia number and (D) average sclerotia weight (g) of nine varieties of B. napus inoculated in 2019 at either the leaf axis or stem with four S. sclerotiorum isolates; CU8.20, CU11.7, CU11.19, CU8.24 (mean of five replicates is shown as ◆). Each boxplot visualizes the median, two hinges (25th and 75th percentile), two whiskers (largest value no further than 1.5 x interquartile range) and all outliers.
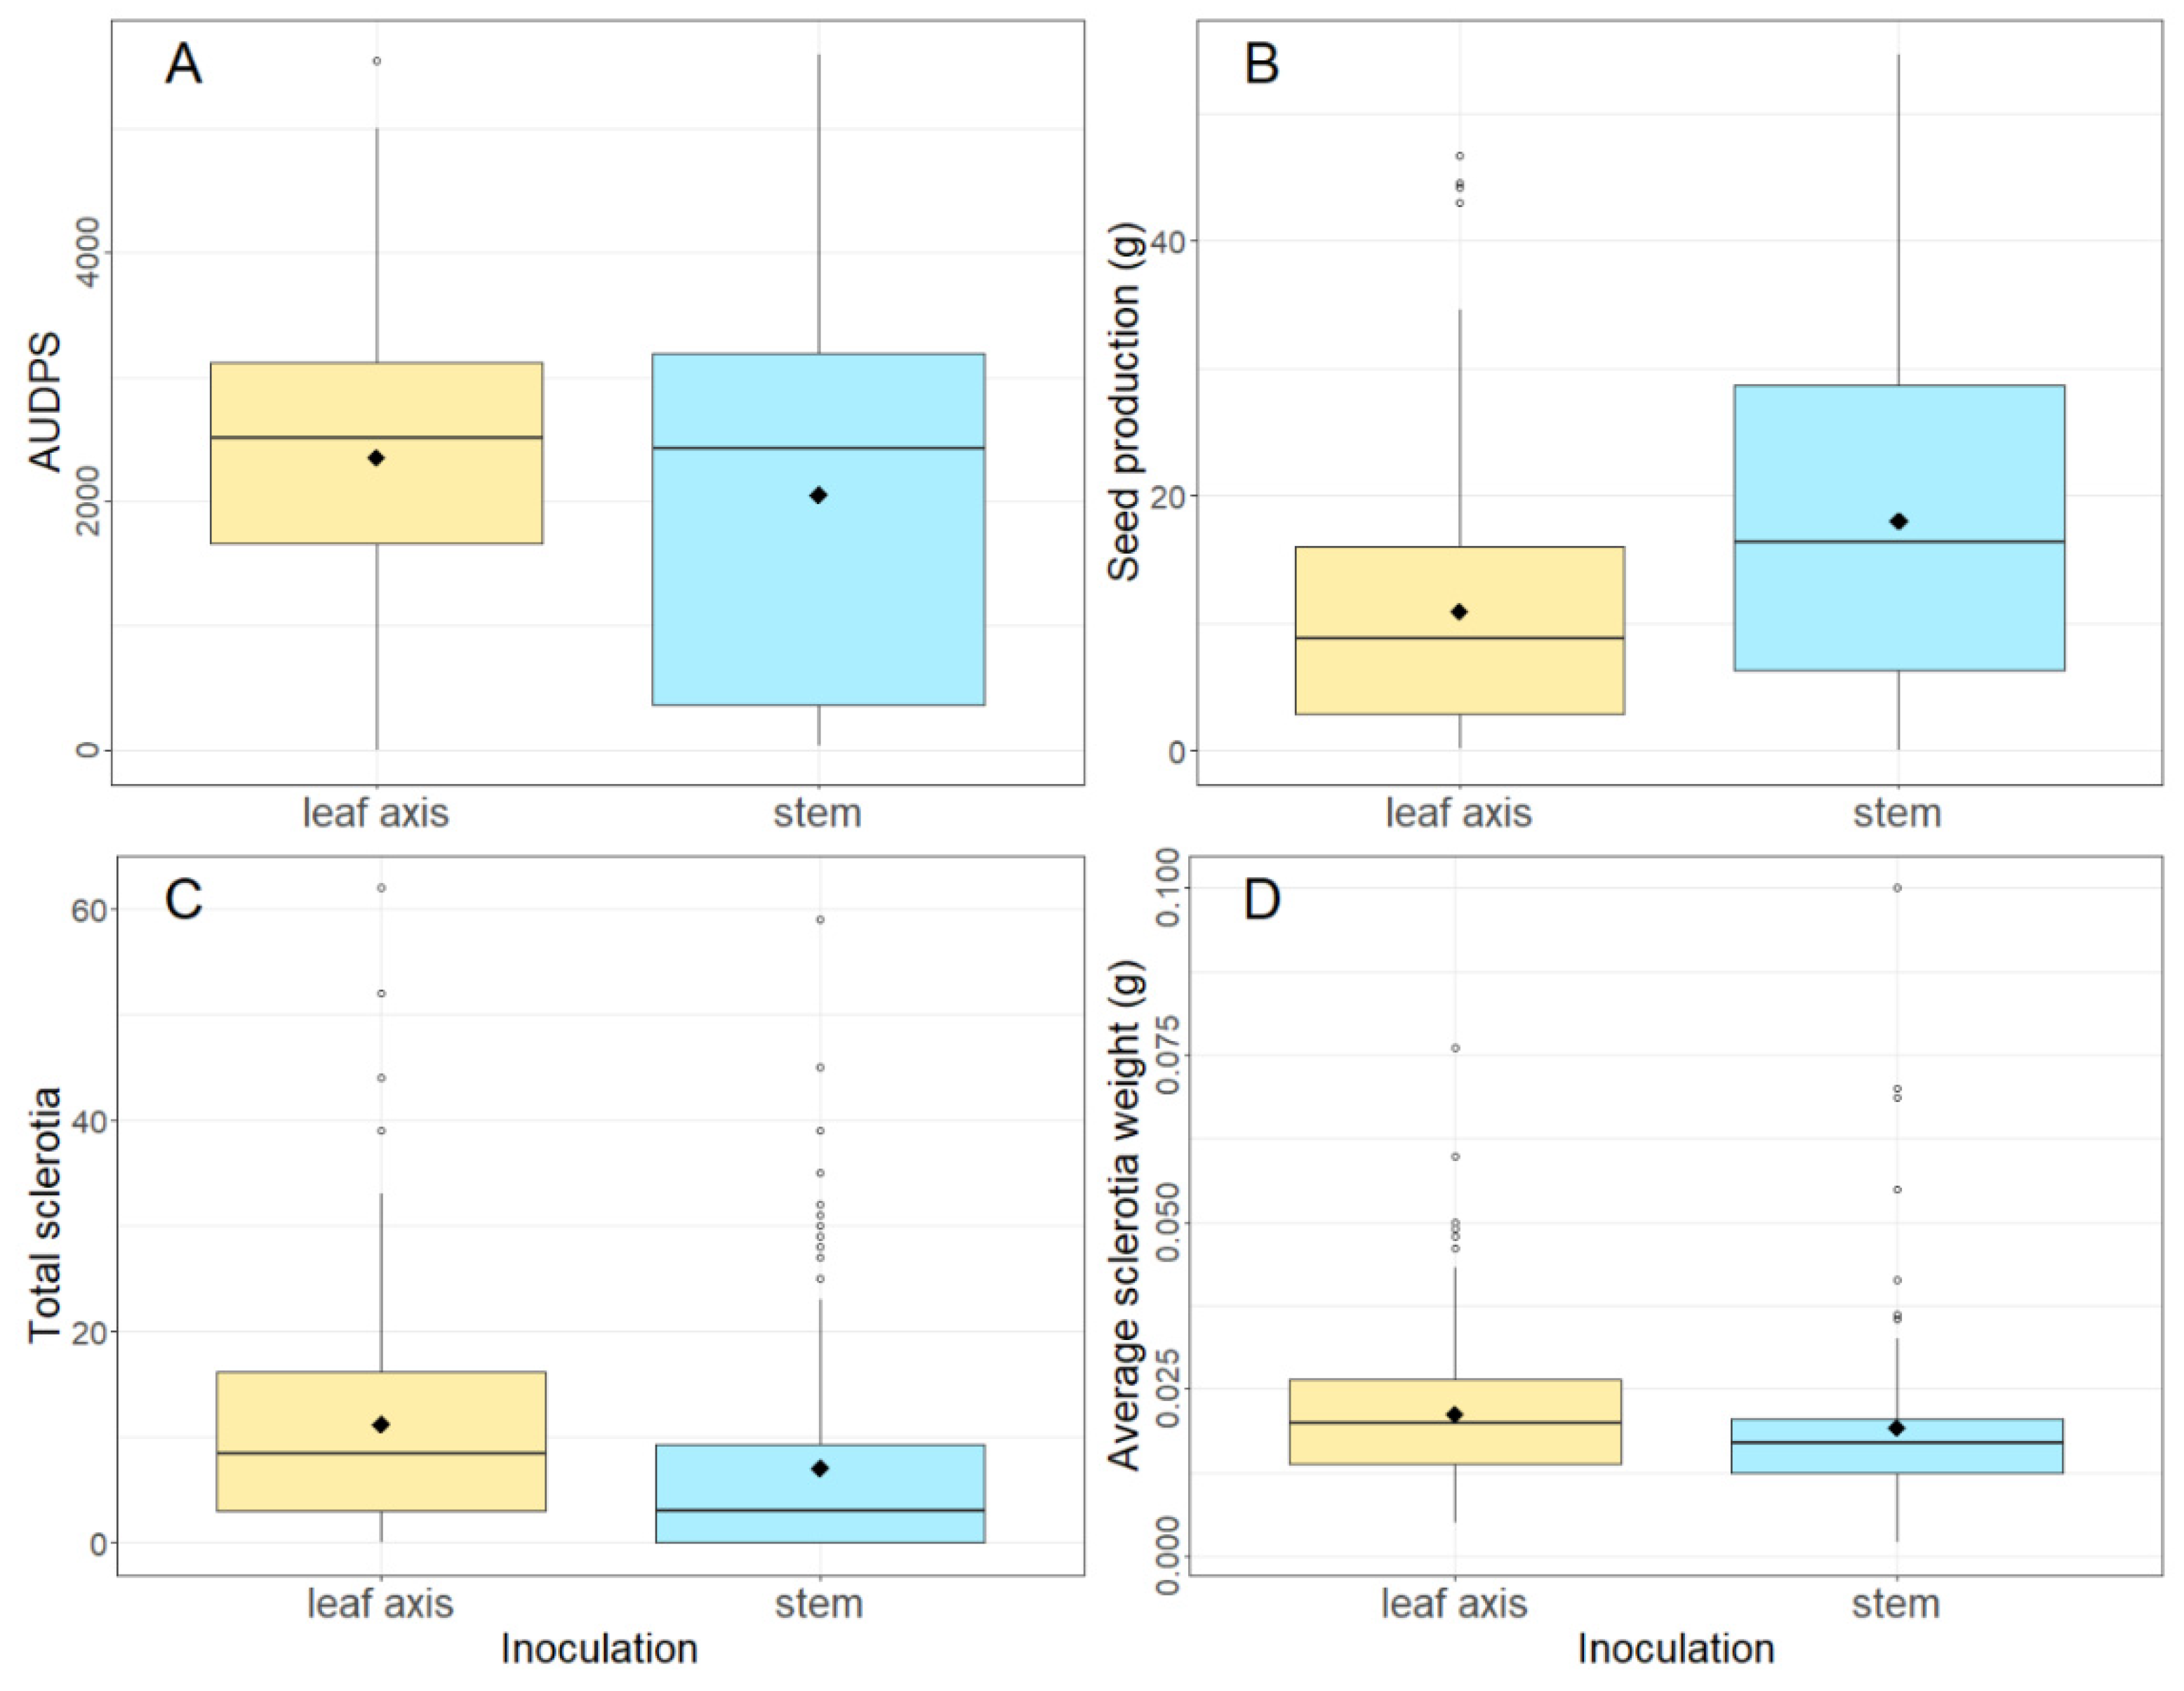
Figure 2.
Boxplots showing AUDPS (area under the disease progress stairs), seed production (g), total sclerotia number and average sclerotia weight (g) of nine B. napus varieties stem inoculated with four S. sclerotiorum isolates; CU8.20, CU11.7, CU11.19, CU8.24, over two years (mean of five replicates is shown as ◆). Each boxplot visualizes the median, two hinges (25th and 75th percentile), two whiskers (largest value no further than 1.5 x interquartile range) and all outliers.

Figure 3.
Boxplots showing (A) AUDPS (area under the disease progress stairs), (B) seed production (g), (C) total sclerotia number and (D) average sclerotia weight (g) of nine B. napus varieties stem inoculated in 2019 and 2020 with four S. sclerotiorum isolates; CU8.20, CU11.7, CU11.19, CU8.24 (mean of five replicates is shown as ◆). Each boxplot visualizes the median, two hinges (25th and 75th percentile), two whiskers (largest value no further than 1.5 x interquartile range) and all outliers.
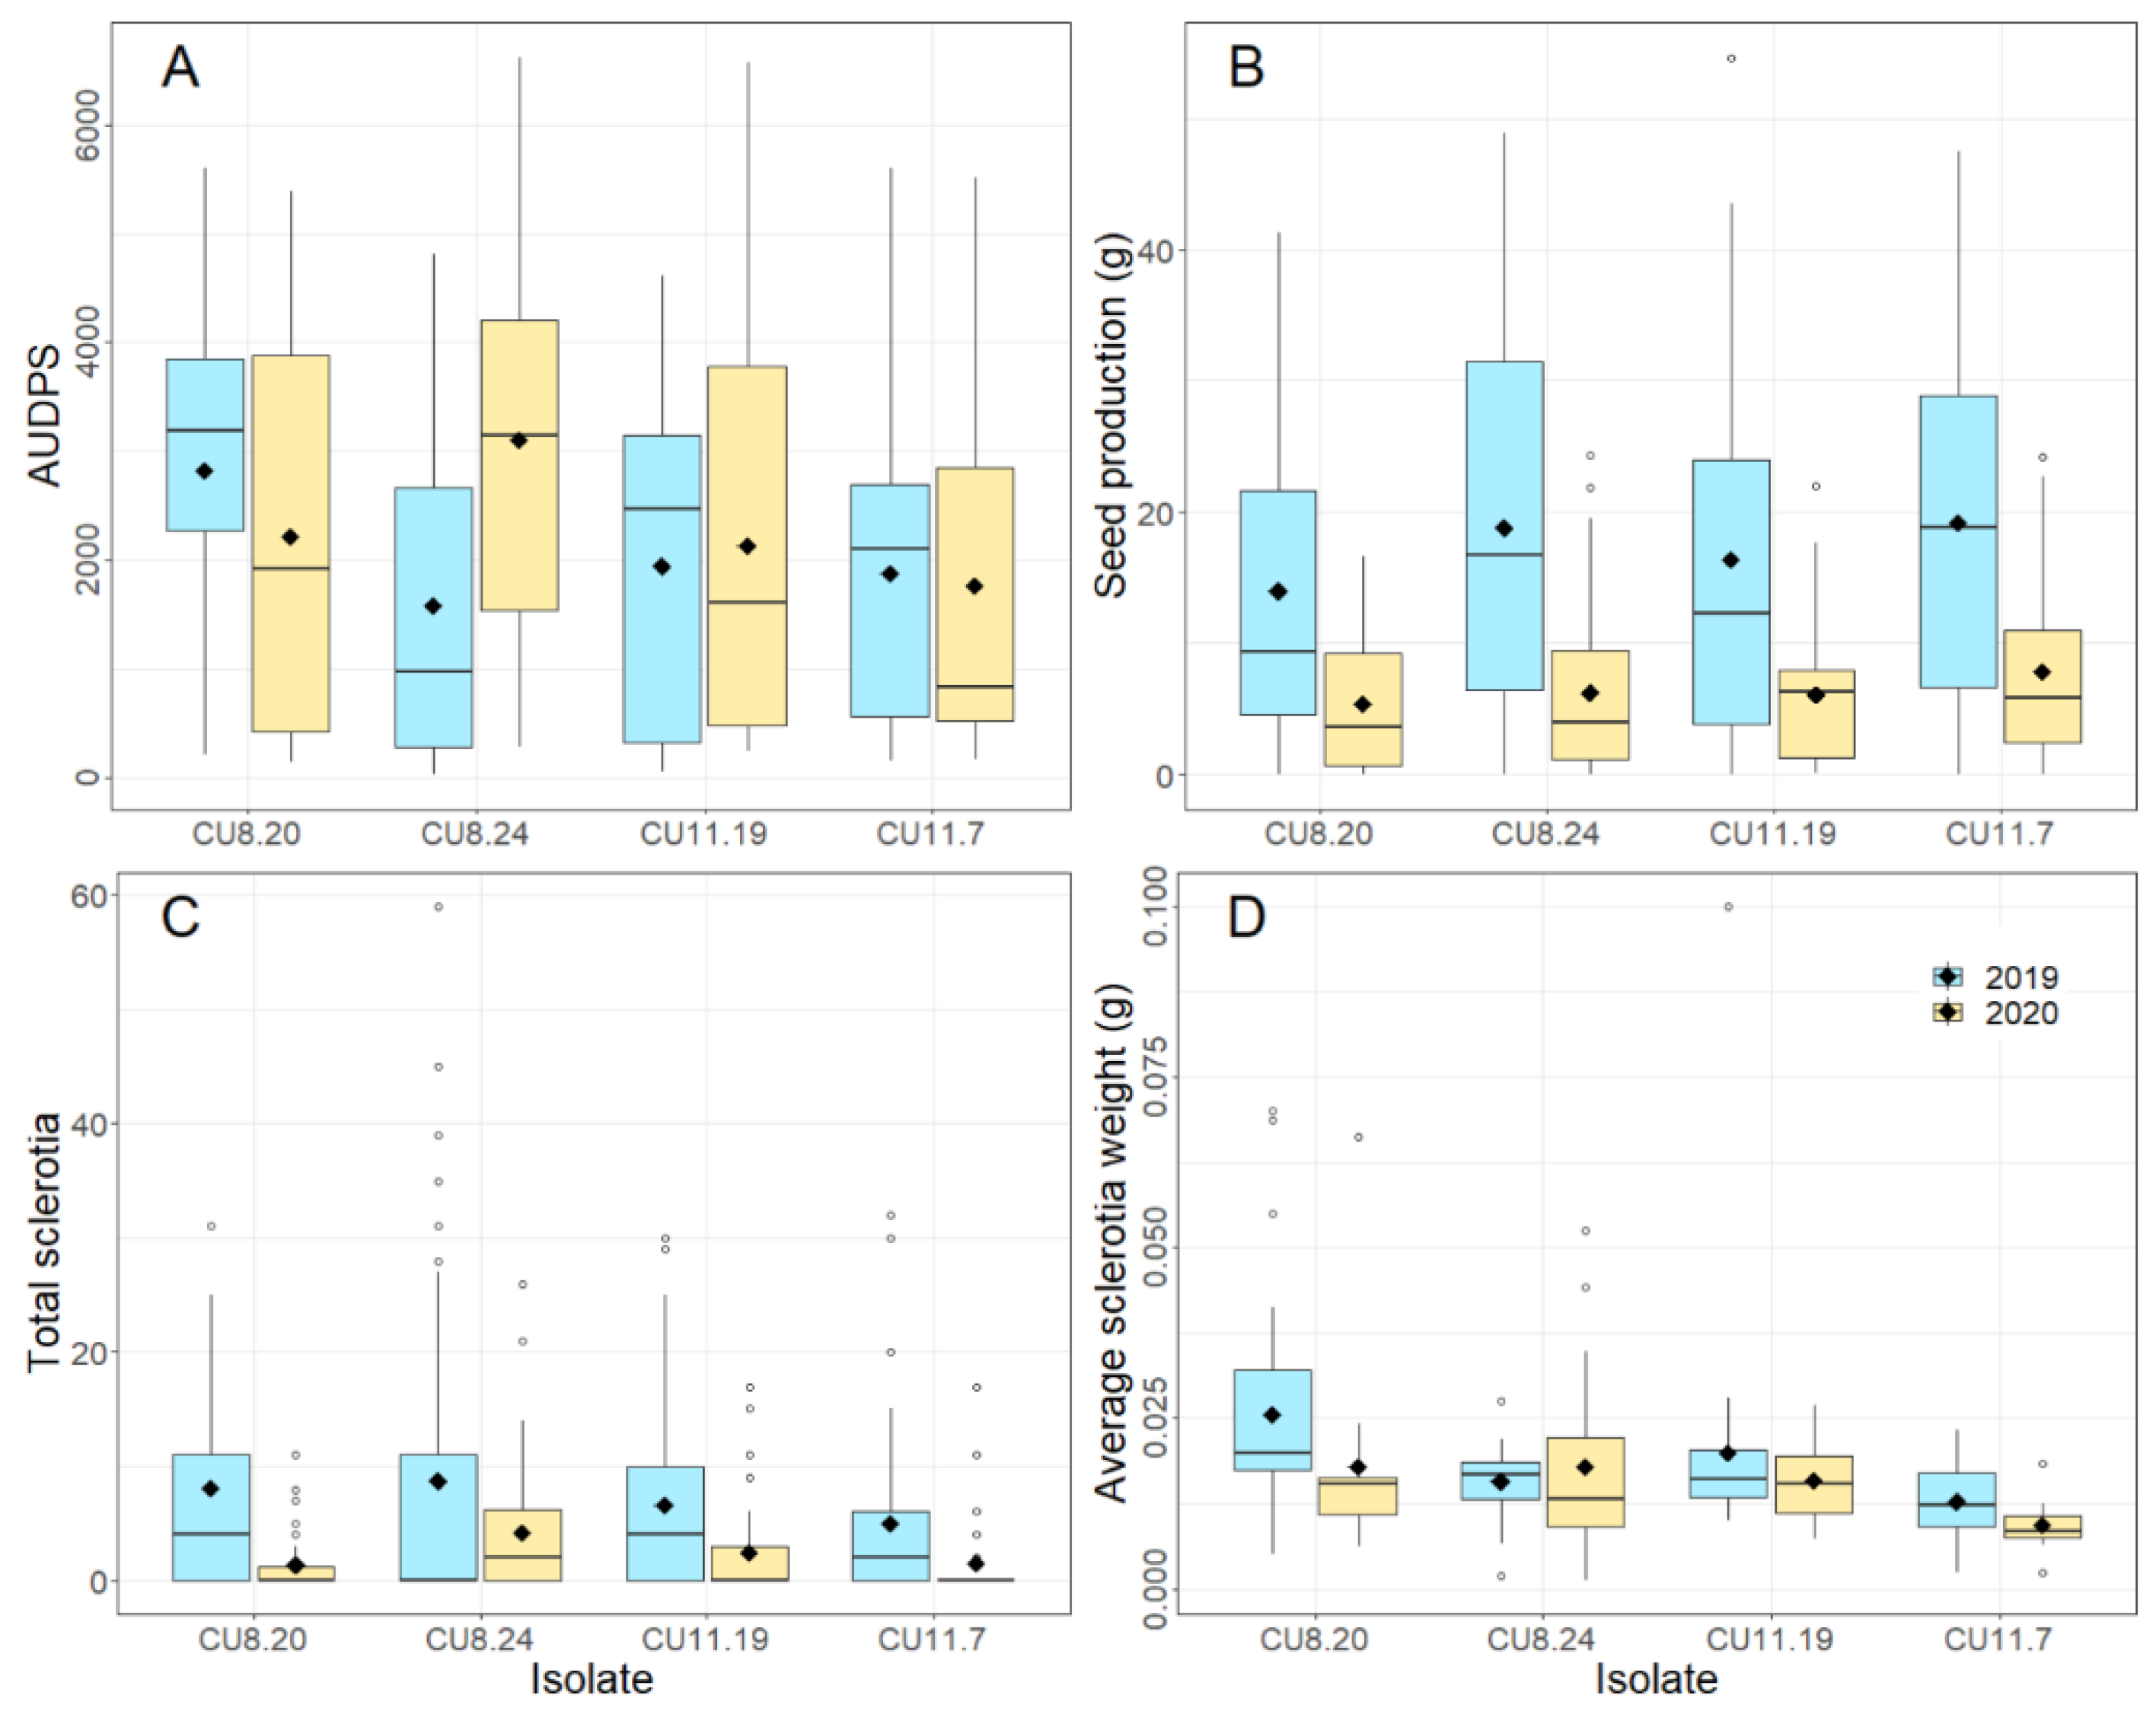
Figure 4.
Biplots following Principal Components Analysis for nine B. napus varieties stem inoculated in 2019 and 2020 with four S. sclerotiorum isolates; CU8.20, CU11.7, CU11.19, CU8.24. Data is colour coded according to A) Year, B) Variety maturity, C) Variety and D) Isolate. Variable abbreviations are AUDPS (area under the disease progress stairs) and TT (accumulated thermal time, °C days).


Table 1.
Australian Brassica napus varieties used in the study.
| Variety | Breeding type | Herbicide tolerance | Release date | Inoculation date | Flowering maturity | Stem width (mm) | |
|---|---|---|---|---|---|---|---|
| 2019 | 2020 | ||||||
| Hyola 559TT | Hybrid | Triazine | 2012 | 12th Aug | 22nd July | mid | 13.8 ± 0.4 |
| Hyola 350TT | Hybrid | Triazine | 2017 | 29th July | 1st July | early | 12.1 ± 0.3 |
| Pioneer 43Y23 RR | Hybrid | Glyphosate | 2012 | 29th July | 8th July | early | 13.3 ± 0.3 |
| ATR Bonito | Open pollinated | Triazine | 2013 | 5th Aug | 15th July | early-mid | 11.3 ± 0.3 |
| ATR Mako | Open pollinated | Triazine | 2015 | 5th Aug | 8th July | early-mid | 11.8 ± 0.3 |
| DG 408RR | Hybrid | Glyphosate | 2017 | 5th Aug | 15th July | early-mid | 13.2 ± 0.4 |
| HyTTec Trophy | Hybrid | Triazine | 2017 | 5th Aug | 8th July | early-mid | 13.1 ± 0.3 |
| InVigor T 4510 | Hybrid | Triazine | 2016 | 5th Aug | 15th July | early-mid | 12.6 ± 0.4 |
| Pioneer 44Y27 RR | Hybrid | Glyphosate | 2017 | 5th Aug | 22nd July | early-mid | 13.9 ± 0.4 |
Table 2.
Summary of treatment main effects and interactions on AUDPS, seed production (g), total sclerotia and average sclerotia weight for A) 2019 B. napus varieties either stem or leaf axis inoculated, and B) B. napus varieties stem inoculated in both years, with four known S. sclerotiorum isolates; CU8.20, CU11.7, CU11.19, CU8.24. Variance ratio and degrees of freedom (in brackets) presented. Significance indicated by: ns, not significant, * P < 0.05, ** P < 0.01, *** P < 0.001.
| Response | |||||||||
|---|---|---|---|---|---|---|---|---|---|
| Treatment | AUDPS | Seed production |
Total sclerotia | Sclerotia weight a | |||||
| A) 2019 varieties | |||||||||
| Isolate | 15.37 (3) | *** | 6.23 (3) | *** | 9.15 (3) | *** | 16.80 (3) | *** | |
| Variety | 17.93 (8) | *** | 10.40 (8) | *** | 6.45 (8) | *** | 2.06 (8) | ns | |
| Inoculation | 7.93 (1) | ** | 45.50 (1) | *** | 19.08 (1) | *** | 8.05 (1) | ** | |
| Isolate x Variety | 2.93 (24) | *** | 2.35 (24) | *** | 3.03 (24) | *** | 1.12 (24) | ns | |
| Isolate x Inoculation | 2.66 (3) | * | 1.20 (3) | ns | 3.38 (3) | * | 0.85 (3) | ns | |
| Variety x Inoculation | 2.24 (8) | * | 1.95 (8) | ns | 1.03 (8) | ns | 0.69 (8) | ns | |
| B) 2019 and 2020 varieties (stem inoculated only) | |||||||||
| Isolate | 4.81 (3) | ** | 4.44 (3) | ** | 2.73 (3) | * | 5.23 (3) | ** | |
| Variety | 16.47 (8) | *** | 9.46 (8) | *** | 4.39 (8) | *** | 0.95 (8) | ns | |
| Year | 3.44 (1) | ns | 114.86 (1) | *** | 37.25 (1) | *** | 2.18 (1) | ns | |
| Isolate x Variety | 1.45 (24) | ns | 1.78 (24) | ns | 2.12 (24) | ** | 0.58 (23) | ns | |
| Isolate x Year | 11.64 (3) | *** | 0.73 (3) | ns | 0.82 (3) | ns | 0.76 (3) | ns | |
| Variety x Year | 8.67 (8) | *** | 5.05 (8) | *** | 4.68 (8) | *** | 0.63 (8) | ns | |
a Variable analysed using REML, all other variables analysed using analysis of variance.
Table 3.
Principal Component Analysis results showing eigenvalues, percentage variation and component loadings for nine Australian B. napus varieties stem inoculated over two growing seasons with four S. sclerotiorum isolates; CU8.20, CU11.7, CU11.19, CU8.24. AUDPS (area under the disease progress stairs); TT (accumulated thermal time); PC (principal component).
| Component | PC1 | PC2 | PC3 | |
|---|---|---|---|---|
| Eigenvalues (Standard deviation) | 1.4204 | 1.4128 | 0.9431 | |
| Proportion of Variance | 0.3363 | 0.3327 | 0.1482 | |
| Cumulative Proportion | 0.3363 | 0.6689 | 0.8171 | |
| Loadings | ||||
| Seed production | 0.5110 | -0.3686 | 0.0481 | |
| Stem width | -0.1803 | -0.4349 | -0.7235 | |
| AUDPS | -0.2155 | 0.5951 | 0.1134 | |
| Sclerotia number | 0.0659 | 0.4946 | -0.6676 | |
| TT during AUDPS | 0.5765 | 0.1044 | -0.0299 | |
| TT post AUDPS to harvest | 0.5685 | 0.2557 | -0.1219 | |
Disclaimer/Publisher’s Note: The statements, opinions and data contained in all publications are solely those of the individual author(s) and contributor(s) and not of MDPI and/or the editor(s). MDPI and/or the editor(s) disclaim responsibility for any injury to people or property resulting from any ideas, methods, instructions or products referred to in the content. |
© 2023 by the authors. Licensee MDPI, Basel, Switzerland. This article is an open access article distributed under the terms and conditions of the Creative Commons Attribution (CC BY) license (http://creativecommons.org/licenses/by/4.0/).
Copyright: This open access article is published under a Creative Commons CC BY 4.0 license, which permit the free download, distribution, and reuse, provided that the author and preprint are cited in any reuse.


