Submitted:
24 May 2023
Posted:
26 May 2023
You are already at the latest version
Abstract
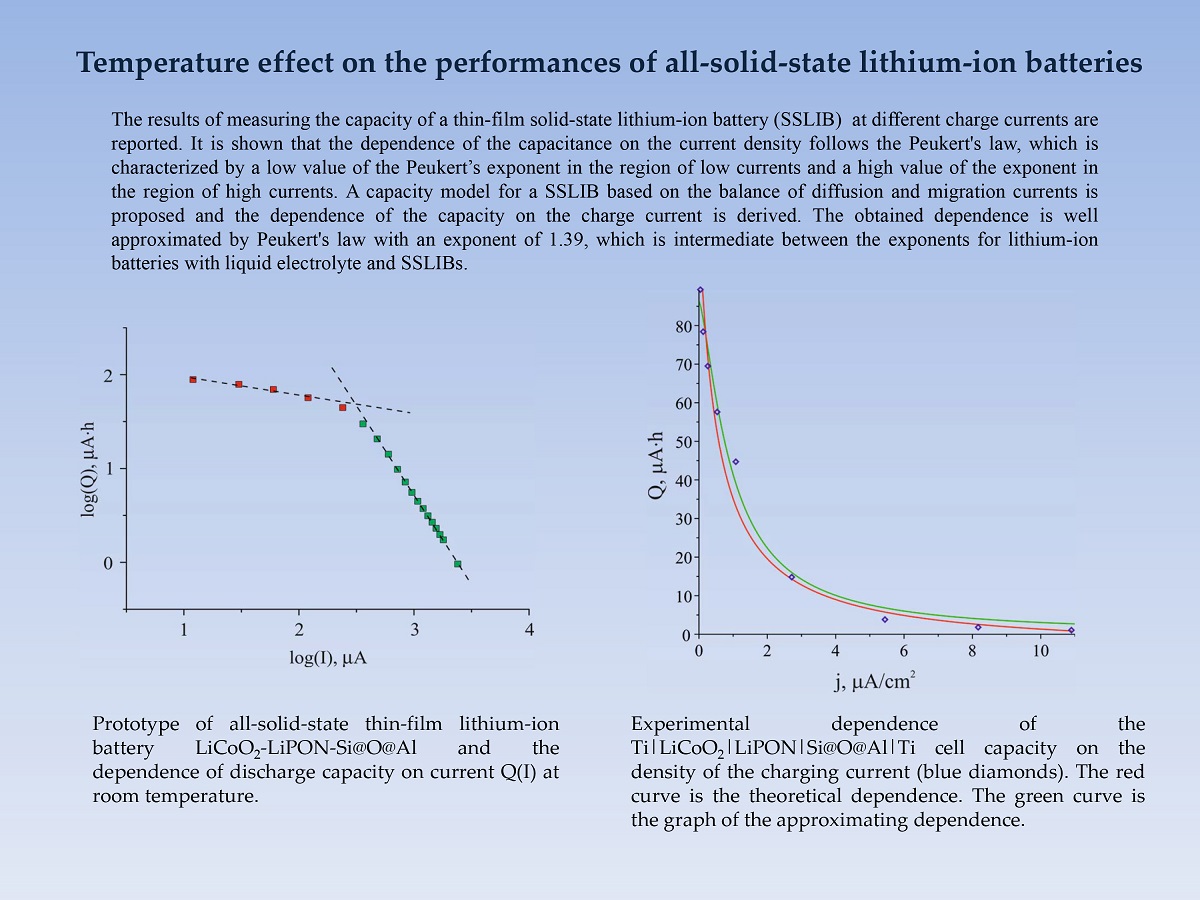
The results of measuring the capacity of a thin-film solid-state lithium-ion battery (SSLIB) Ti|Si@O@Al|LiPON|LiCoO2|Ti at different charge currents are reported. It is shown that the dependence of the capacity on the current density follows the Peukert's law, which is characterized by a low value of the Peukert’s exponent in the region of low currents and a high value of the exponent in the region of high currents. A capacity model for a SSLIB based on the balance of diffusion and migration currents is proposed and the dependence of the capacity on the charge current is derived. The obtained dependence is well approximated by Peukert's law with an exponent of 1.39, which is intermediate between the exponents for lithium-ion batteries with liquid electrolyte and SSLIBs.
Keywords:
all-solid-state lithium-ion batteries
; Peuckert’s law
; battery model
; Peuckert’s exponent
1. Introduction
Solid-state thin-film lithium-ion batteries (SSLIB) are an important, and at the same time very specific, type of rechargeable chemical power source [1] In the last decade simultaneously with the expansion of the scope of SSLIB application was observed a steady growth in the number of studies aimed at increasing their capacity. Some types of SSLIB, including thin-film structures and , were the objects of our recent studies [2,3,4]. SSLIB tested at room temperature, under various charge-discharge rates. With an increase in the charging current, was observed a reduction in the capacitance, well described by the Peukert’s law [5]
where Q is the battery discharge capacity, I is the discharge current, A is empirical constant, and α is Peukert’s exponent. For lithium-ion batteries this parameter varies between 1.00 and 1.28 [6]. However, SSLIB is characterized by a sharper decrease in capacitance with increasing current and, accordingly, a higher value of the Peukert exponent . Peukert's law, empirically withdrawn in 1987 and valid for a narrow range of currents and temperatures [6‒9], remains in the spotlight to this day, since it is directly related to the actual problem of battery control. For batteries operating in extreme conditions, such as in vehicles, an adequate model is required that can predict the behavior of the battery in any circumstances [10]. To build and implement a battery control algorithm, a method for estimating the state of charge (SoC) is needed, since all parameters of the battery model depend on this factor. Plenty of works are devoted to this issue, a review of which can be found e.g. in [11,12]. A number of approaches to estimating SoCs, for example, [13] are based on the calculation of ampere-hours, which requires an accurate determination of the Peukert’s law parameters. Therefore, the number of studies devoted to modeling lithium-ion batteries and calculating the parameters of the Peukert's equation continues to grow steadily.
As a rule, battery models that follow Peukert's law are phenomenological in nature, i.e. based on experimental regularities. In this paper, we consider a simplified battery model based on the equations for the balance of diffusion and drift flows of charge carriers in a stationary mode. As will be shown below, the current balance condition is a certain ratio of lithium ions concentrations at the anode and cathode, which decreases with increasing current density.
2. Experimental
The below derivation of the SSLIB model is based on the experimental regularities of SSLIB charge-discharge. The experimental cells were manufactured according to the technology described in previous works, for example, in [3] and with a due account for differences in density of LiCoO2 and Si@O@Al, as well as in thickness of their layers. Therefore, the change in potential of negative electrode in the course of galvanostatic cycling was negligible. Figure 1 shows galvanostatic charge and discharge curves for cell recorded at room temperature with various currents. Since the discharge capacity noticeably changes with the variation in current, Figure 1 is presented in two panels ‒ panel a displays data at relatively small currents, from 12 to 240 μA (which corresponds to C-rate from 0.09 to 1.77 C), panel b shows data at currents from 600 to 2400 μA (C-rate from 4.24 to 17.7 C).
Quantitative dependence of discharge capacity Q on current I can be seen in Figure 2. It is noteworthy that Figure 2 shows only discharge capacity because it turned out that charge capacity was very close to discharge one (the Coulombic efficiency was close to 100%). Here this dependence is presented in bi-logarithmic coordinates to check an applicability of Peuckert equation (1). One can see that Q(I) dependence in this case is well described by two linear segments. At glance, both obey Peuckert equation however real situation is more complicated. Indeed, the exponent α in eq. (2), which determines the slope of the curve, in a low currents segment (from 12 to 120 µA) is equal to 0.2, whereas for the slope of high-currents segment (from 360 to 2400 µA) the exponent is as high as 1.9.
3. Anode charge model
To derive an equation that describes the dependence of capacity on current, an expression is needed that relates the battery capacity to the lithium concentration at the anode-electrolyte interface. This expression can be derived from the simplified SSLIB model shown in Figure 3. The figure shows the distribution of lithium atoms in the anode and in the electrolyte. If in systems with a liquid electrolyte and a porous anode, the reduction of lithium ions occurs in almost the entire volume of the anode, then in SSLIB, the reduction of Li ions takes place inside the δ-layer at the anode-LiPON interface (Figure 3). The reduction rate of lithium ions can be written as , where is the ion concentration at the anode, δ is the layer thickness on the order of the lithium ion radii, and is the relaxation time of the ion concentration due to reduction at the anode. The reduced atoms can diffuse into the anode, creating a current of density , and into the electrolyte, creating a leakage current. Although we are not aware of any studies on the diffusion of atomic lithium in LiPON, there are a number of experimental facts indicating this phenomenon. For example, a leakage current in M|LiPON|M structures [14].
Under the condition (Figure 3) the rate of lithium atoms generation at the anode will be constant. However, in this case, the anode current can change due to the redistribution of the flows of lithium atoms into the anode and into the electrolyte. The flow of atoms into the anode can be found from the balance condition at the electrolyte-cathode interface (Figure 3) and the rate of lithium atoms oxidation at the cathode which is as follows
where is the relaxation time of the nonequilibrium concentration of lithium atoms as a result of their oxidation at the cathode, and is the flux density of lithium atoms into the anode. From relation (2), one can express the concentration of lithium atoms on the cathode
Next, one can write an expression for the flux density of atoms in the electrolyte
where DE is the diffusion coefficient of lithium atoms in the electrolyte, and substitute equation (3) into (4)
The flow of atoms reduced at the anode-electrolyte interface deep into the anode can be represented as the difference between the rate of reduction of lithium ions and the flow of atoms into the electrolyte
With regard to (5), expression (6) transforms into the equation
which allows to find the flux density of lithium atoms into the anode
and formulate the boundary condition at the anode-electrolyte interface
where it is considered that .
Condition (9) allows us to formulate the boundary value problem on lithium atoms diffusion in the anode as follows
The solution of the boundary value problem (10), sought for by the Fourier method, is
where is the nth root of the equation , defining the spectrum of eigenvalues of the Sturm-Liouville problem. Here is a so-called controlling parameter of the order of unity, DA is lithium diffusivity coefficient in the anode.
Solution (11) allows to find the time-dependence of the anode charge
Charging curve (12) is shown in Figure 4 for current density , which corresponds to curve 5 in Figure 1 a. The remaining values of the model parameters are given in the caption to the figure. According to (12), the dependence of the total charge on the battery parameters has the form
where the complex of parameters in (13) has the meaning of the charge current.
It should be mentioned that model (13) describes only a certain section of the charge curve, on which the process can be considered stationary. In real cells, there are a number of factors, absent in model (10), that limit the value of the total charge. State of equilibrium (13) is reached only in the dissipative system, in this case it is a diffusion flow of lithium atoms in the direction of the cathode. Without leakage, i.e. at and/or within the framework of the idealized model, the state of equilibrium is not achieved. Since the leakage current in this model has a sense of all real limiting factors, its parameters obtained by fitting (13) to the experimental results can be overestimated.
Solution (13) yields the dependence of the total charge Q on the only variable which is the concentration of lithium ions at the anode-electrolyte interface. This allows finding dependence on the charging current density and obtaining the relationship between the SSLIB charge and the current density.
4. Dependence of the lithium concentration at the anode-electrolyte interface on the charge current density
Since below is considered the transport of lithium ions through the electrolyte and all the following equations refer to the segment [0,d] in Figure 3, the notation instead of is used. The current density through the electrolyte is the sum of the drift and diffusion currents
where is the ionic conductivity of the electrolyte, U is the potential difference across the electrolyte layer, is the permittivity of the electrolyte, d is the thickness of the electrolyte layer, q is the lithium ion charge; DE is the diffusion coefficient of the lithium ion, c is the concentration of lithium ions. Considering the relations and expression (14) can be written in the form
Within the framework of a simplified model, the concentration gradient can be represented as
while the concentration can be set equal to the average value of the concentration in the electrolyte . Then the current density through the electrolyte (15) takes the form
where is the ratio of the lithium ions concentrations at points 0 and d. can It can be express from equation (17) as
On the other hand, the current density through the electrolyte must be equal to the density of the electron current through the anode
where Up is the voltage of the potentiostat. Expressing U from (19) and substituting it into (18) yields
Thus, relations (13) and (22) set up the dependence of the charge on the charging current
where
The experimental (Figure 1) and theoretical (23) dependences of the capacitance on the current density are compared in Figure 5.
Gudging by the shape of graphs in Figure 5, it is rather difficult to determine to what extent the experimental and theoretical dependences correspond to Peikert's law. Therefore, it is expedient to compare them with a hyperbolic function
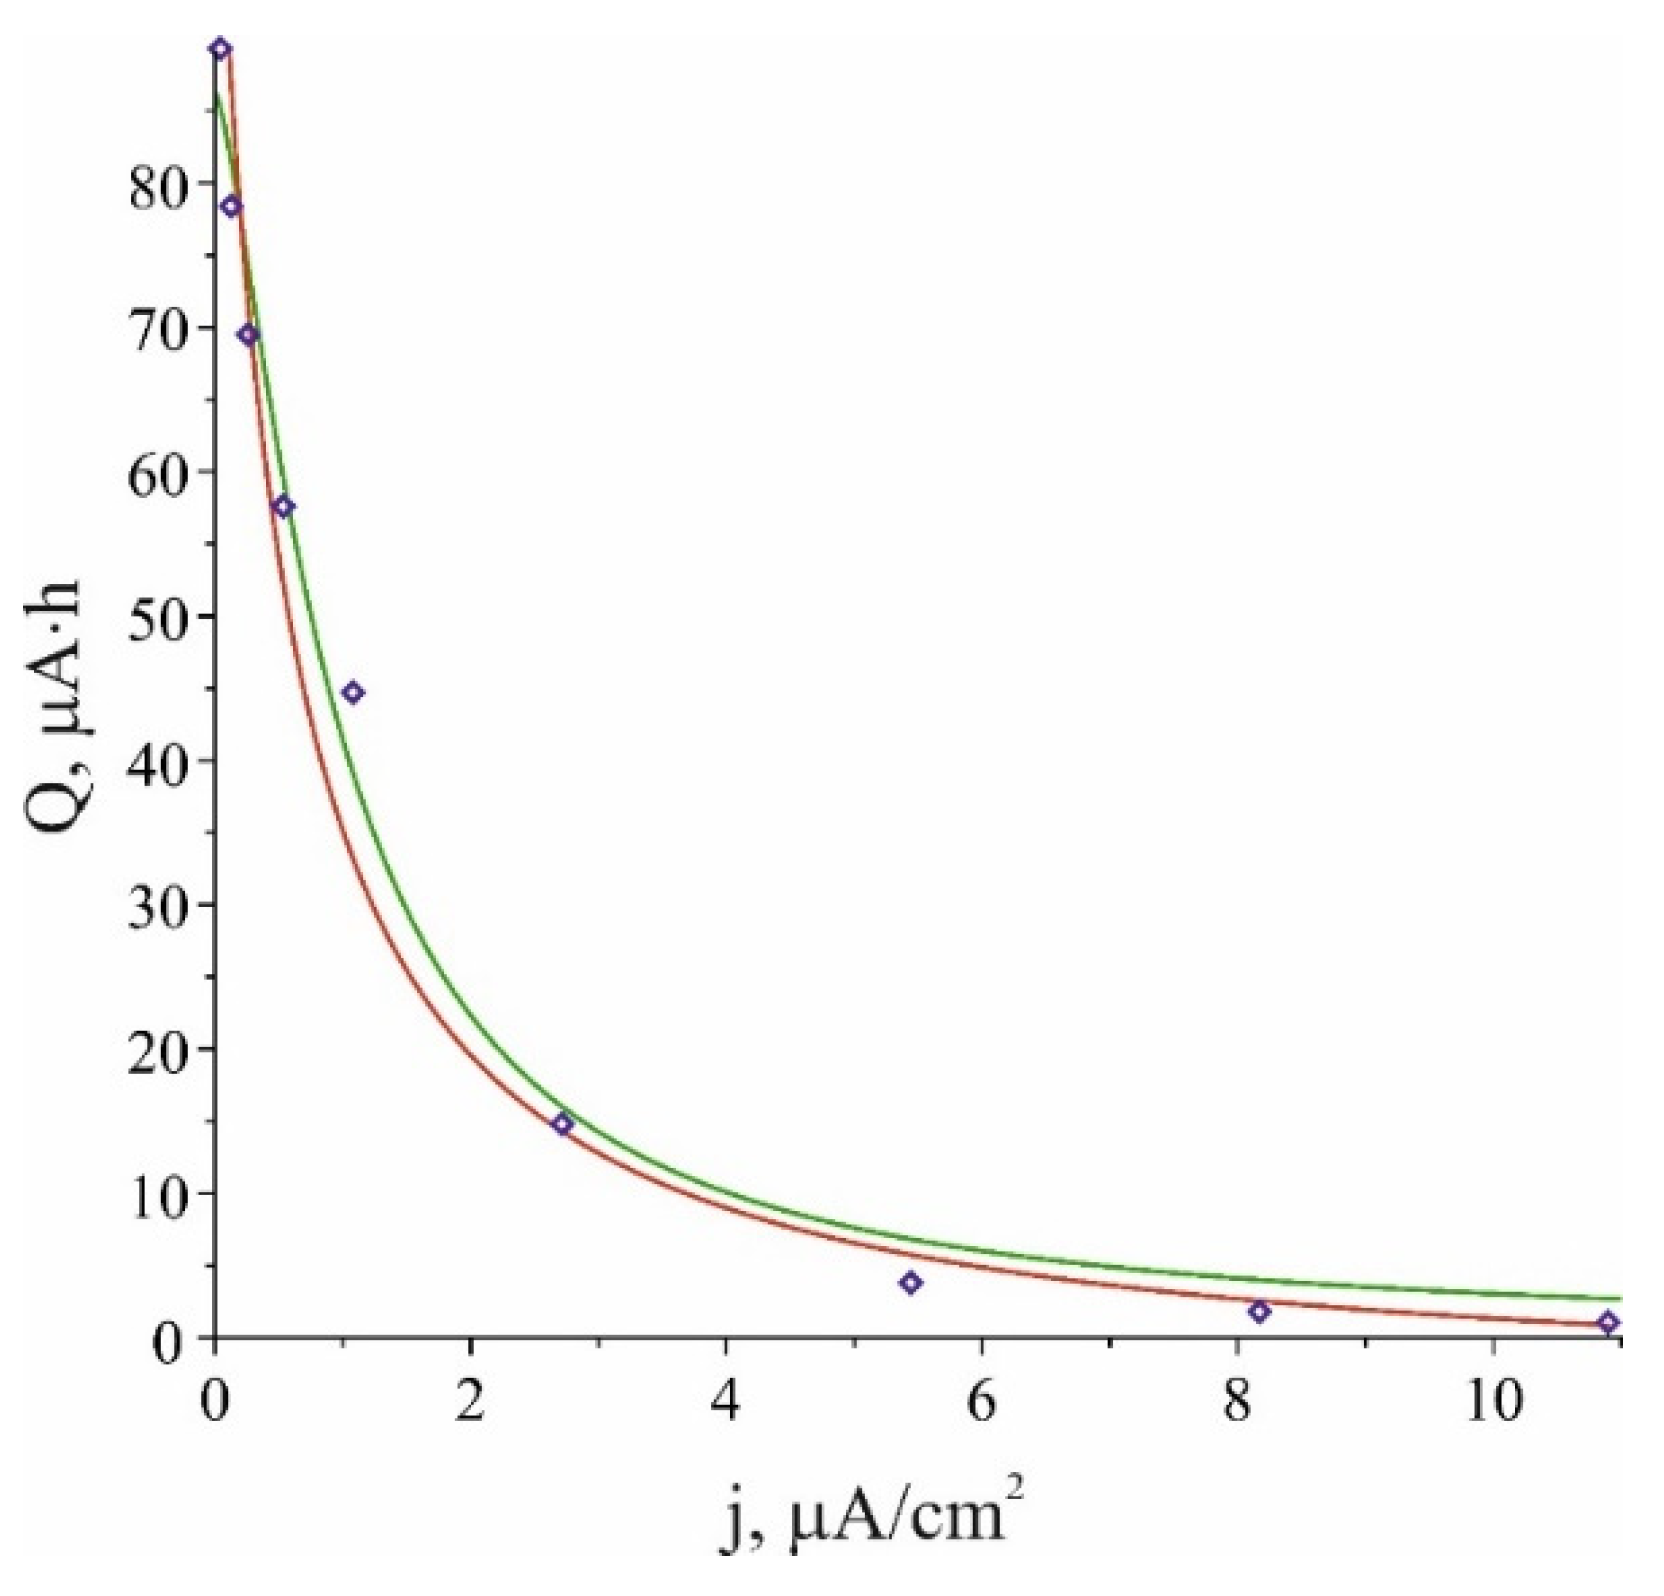
for which the fitting gives the following values , , . The experimental points and approximating functions (23) and (25) are shown in Figure 6. Regarding the fact that the Peukert’s law in the form has a singularity at the point , its representation in the form (25) is more correct. Thus, basing on the graphs shown in Figure 6, it can be concluded that Peiker's law is valid for SSLIB.
5. Summary
As shown above, the dependence of SSLIB capacitance on the density of the charging current (Figure 2) obeys Peukert's law. This dependence contains two sections from 12 to 120 μA and from 360 μA to 2.4 mA, which correspond to the Peukert’s exponents 0.2 and 1.9. To explain the reasons for the decrease in SSLIB capacitance, a simple model based on the balance of conduction currents and diffusion transfer of lithium ions is proposed. The model qualitatively describes the decrease in capacitance with increasing charging current density.
An obvious condition for the high capacitance of SSLIB is a high lithium concentration at the anode boundary, i.e. high degree of electrolyte polarization. For typical values of the SSLIB parameters, the model predicts a decrease in polarization, characterized by the parameter ρ, with increasing current (Figure 5a). At the same time, in the region of typical values of the SSLIB parameters, there is a good agreement between the characteristics of the experimental cell and the model.
The looks somewhat overestimated, which may be due to the fact that Si@O@Al is a hole semiconductor. In this case, the lithium reduction goes through an intermediate stage of electron-hole pair generation. The electron reduces lithium, while the hole transport the charge to the down collector, where it recombines with Ti electrons. In this case, the time of lithium ions concentration relaxation will be rather longer than in the direct Li+ reduction by conduction electrons.
It should be mentioned once more that model (23) is rather idealized. Partly due to the fact that excessive detailing of the model always veils the phenomenon under study. In present case, idealization leads to the fact that the model Peukert’s exponent 1.39 is an intermediate for the above obtained values and . By selecting parameters (23), primarily the permittivity, one can achieve a better approximation of the curve in Figure 2 separately in the region of low and high current density.
The main reason why the Peukert’s exponent for SSLIB is higher than its typical values for conventional batteries is the flat shape of the anode-electrolyte interface. In batteries with liquid electrolyte, this boundary repeats the porous structure of the anode, so the reduction of lithium ions actually occurs inside the anode. As a consequence, all the above relations, which are valid at all points of the flat interface, become local for porous electrodes and liquid electrolyte.
In this case, the current balance equations can be obtained by averaging the local currents over the interface surface. Obviously, the averaged dependencies will differ from relation (23). Note that model (23) can be generalized to the case of a liquid electrolyte if parameter δ in (24) is replaced by the diffusion length of the lithium atom in the anode .
Author Contributions
Alexander Rudy– conceptualization, writing of original draft; Alexander Skundin – supervision, methodology; Alexander Mironenko – investigation; Victor Naumov - investigation, visualization.
Funding
This research was funded by the Ministry of Science and Higher Education of the Russian Federation grant number 0856-2020-0006.
Data Availability Statement
Supporting reported results data can be found or get by demand at The Facilities Sharing Centre "Diagnostics of Micro- and Nanostructures" (FSC DMNS), P.G. Demidov Yaroslavl State University.
Conflicts of Interest
The authors declare that they have no conflicts of interest. The funders had no role in the design of the study; in the collection, analyses, or interpretation of data; in the writing of the manuscript, or in the decision to publish the results.
References
- Skundin, A.; Kulova, T.; Rudy, A.; Mironenko, A. All Solid State Thin-Film Lithium-Ion Batteries: Materials, Technology, and Diagnostics, 1st ed.; CRC Press: Boca Raton, FL, USA, Ed.; Taylor & Francis Group: Boca Raton, FL, USA, 2021; 214p, ISBN 9780367086824. [Google Scholar]
- Rudy, A.S.; Mironenko, A.A.; Naumov, V.V.; Fedorov, I.S.; Skundin, A.M.; and Tortseva, Y.S. . Thin-Film Solid State Lithium-Ion Batteries of the LiCoO2/Lipon/Si@O@Al System. Russ. Microelectron. 2021, 50, 333–338. [Google Scholar] [CrossRef]
- Rudy, A.S.; Kurbatov, S.V.; Mironenko, A.A.; Naumov, V.V.; Skundin, A.M. and Egorova, Y.S. Effect of Si-Based Anode Lithiation on Charging Characteristics of All-Solid-State Lithium-Ion Battery. Batteries 2022, 8. Iss. 8. Article # 87. [CrossRef]
- Kulova, T.L. and Skundin A.M. Temperature Effects on the Performance of Batteries. Russ. J. Electrochem. 2021, 57, 700–705. [Google Scholar] [CrossRef]
- Peukert, W. Über die Abhänigkeit der Kapazität von der Entladestromstärke bei Bleiakkumulatoren. Elektrotechnisch Z. 1897, 27, 287–288. (in German). [Google Scholar]
- Baert, D. , Vervaet A. Lead-acid battery model for the derivation of Peukert's law. Electrochim. Acta 1999, 44, 3491–3504. [Google Scholar] [CrossRef]
- Ekunde, P. A simplified model of the lead/acid battery. J. Power Sources. 1993, 46, 251–262. [Google Scholar] [CrossRef]
- Bouet J., Pompon J.P. Analyse des causes de degradation des plaques positives de batteries au plomb. Electrochim. Acta, 1981, 26, 1477‒1487. [CrossRef]
- Doerffel, D. , Abu Sharkh S. A critical review of using the Peukert equation for determining the remaining capacity of lead-acid and lithium-ion batteries. J. Power Sources. 2006, 155, 395–400. [Google Scholar] [CrossRef]
- Noshin Omar, Peter Van den Bossche, Thierry Coosemans and Joeri Van Mierlo Energies Peukert Revisited—Critical Appraisal and Need for Modification for Lithium-Ion Batteries 2013, 6, 5625-5641. [CrossRef]
- Bergveld HJ, Kruijt WS, Notten PHL (2002) Battery management systems: design by modelling. Kluwer, Amsterdam, chap. 6, pp 193‒239.
- Lerner S, Lennon H, Seiger HN (1970) Development of an alkaline battery state of charge indicator. In: Collins DH (ed) Power Sources . Oriel Press, Newcastle, pp 135–137.
- Wu, G.; Lu, R.; Zhu, C.; Chan, C.C. An Improved Ampere-Hour Method for Battery State of Charge Estimation Based on Temperature, Coulomb Efficiency Model and Capacity Loss Model. In Proceedings of the IEEE Vehicle Power and Propulsion Conference (VPPC), Lille, France, 1–3 September 2010; pp. 1–4. [Google Scholar]
- A. S. Rudyiа, M. E. Lebedev, A. A. Mironenko, L. A. Mazaletskii, V. V. Naumov, A. V. Novozhilova, I. S. Fedorov and A. B. Churilov. Russian Microelectronics, 2020, Vol. 49, No. 5, pp. 345–357. [CrossRef]
Figure 1.
Charge and discharge curves for cell at currents: 1 – 12 µA, 2 – 30 µA, 3 – 60 µA, 4 – 120 µA, 5 - 240 µA, 6 – 600 µA, 7 – 1200 µA, 8 – 1800 µA, 9 – 2400 µA. Battery area is 2.2 cm2. Capacities (μA∙h) at different C-rates make: 1 — 89, 2 — 78, 3 — 69, 4 — 57, 5 — 44, 6 — 14, 7 — 3,7, 8 — 1,7, 9 — 0,95.
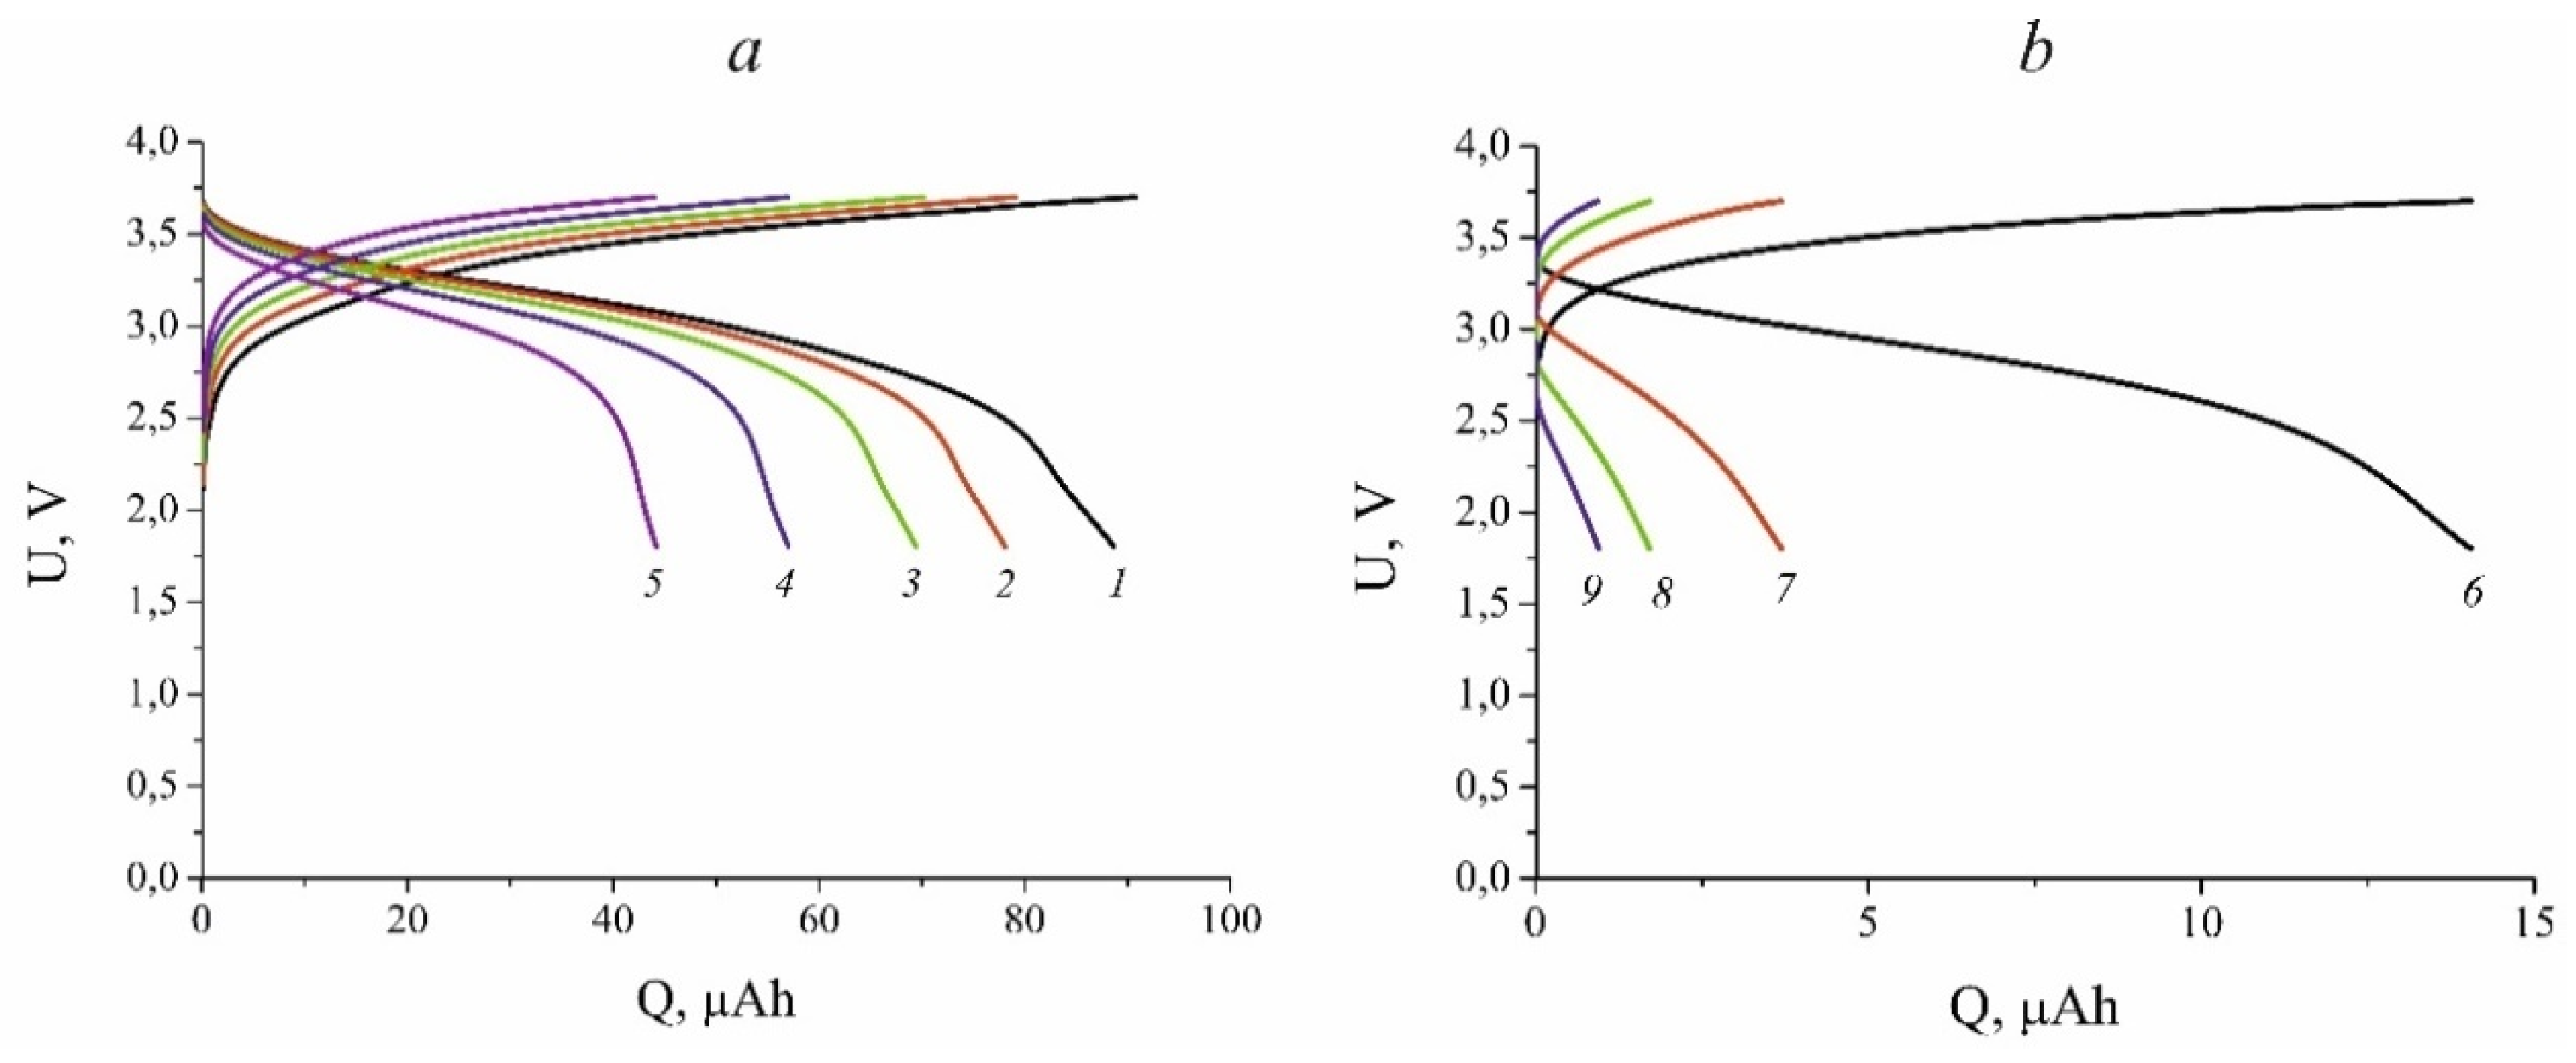
Figure 2.
The dependence of discharge capacity on current Q(I) for cell at room temperature.
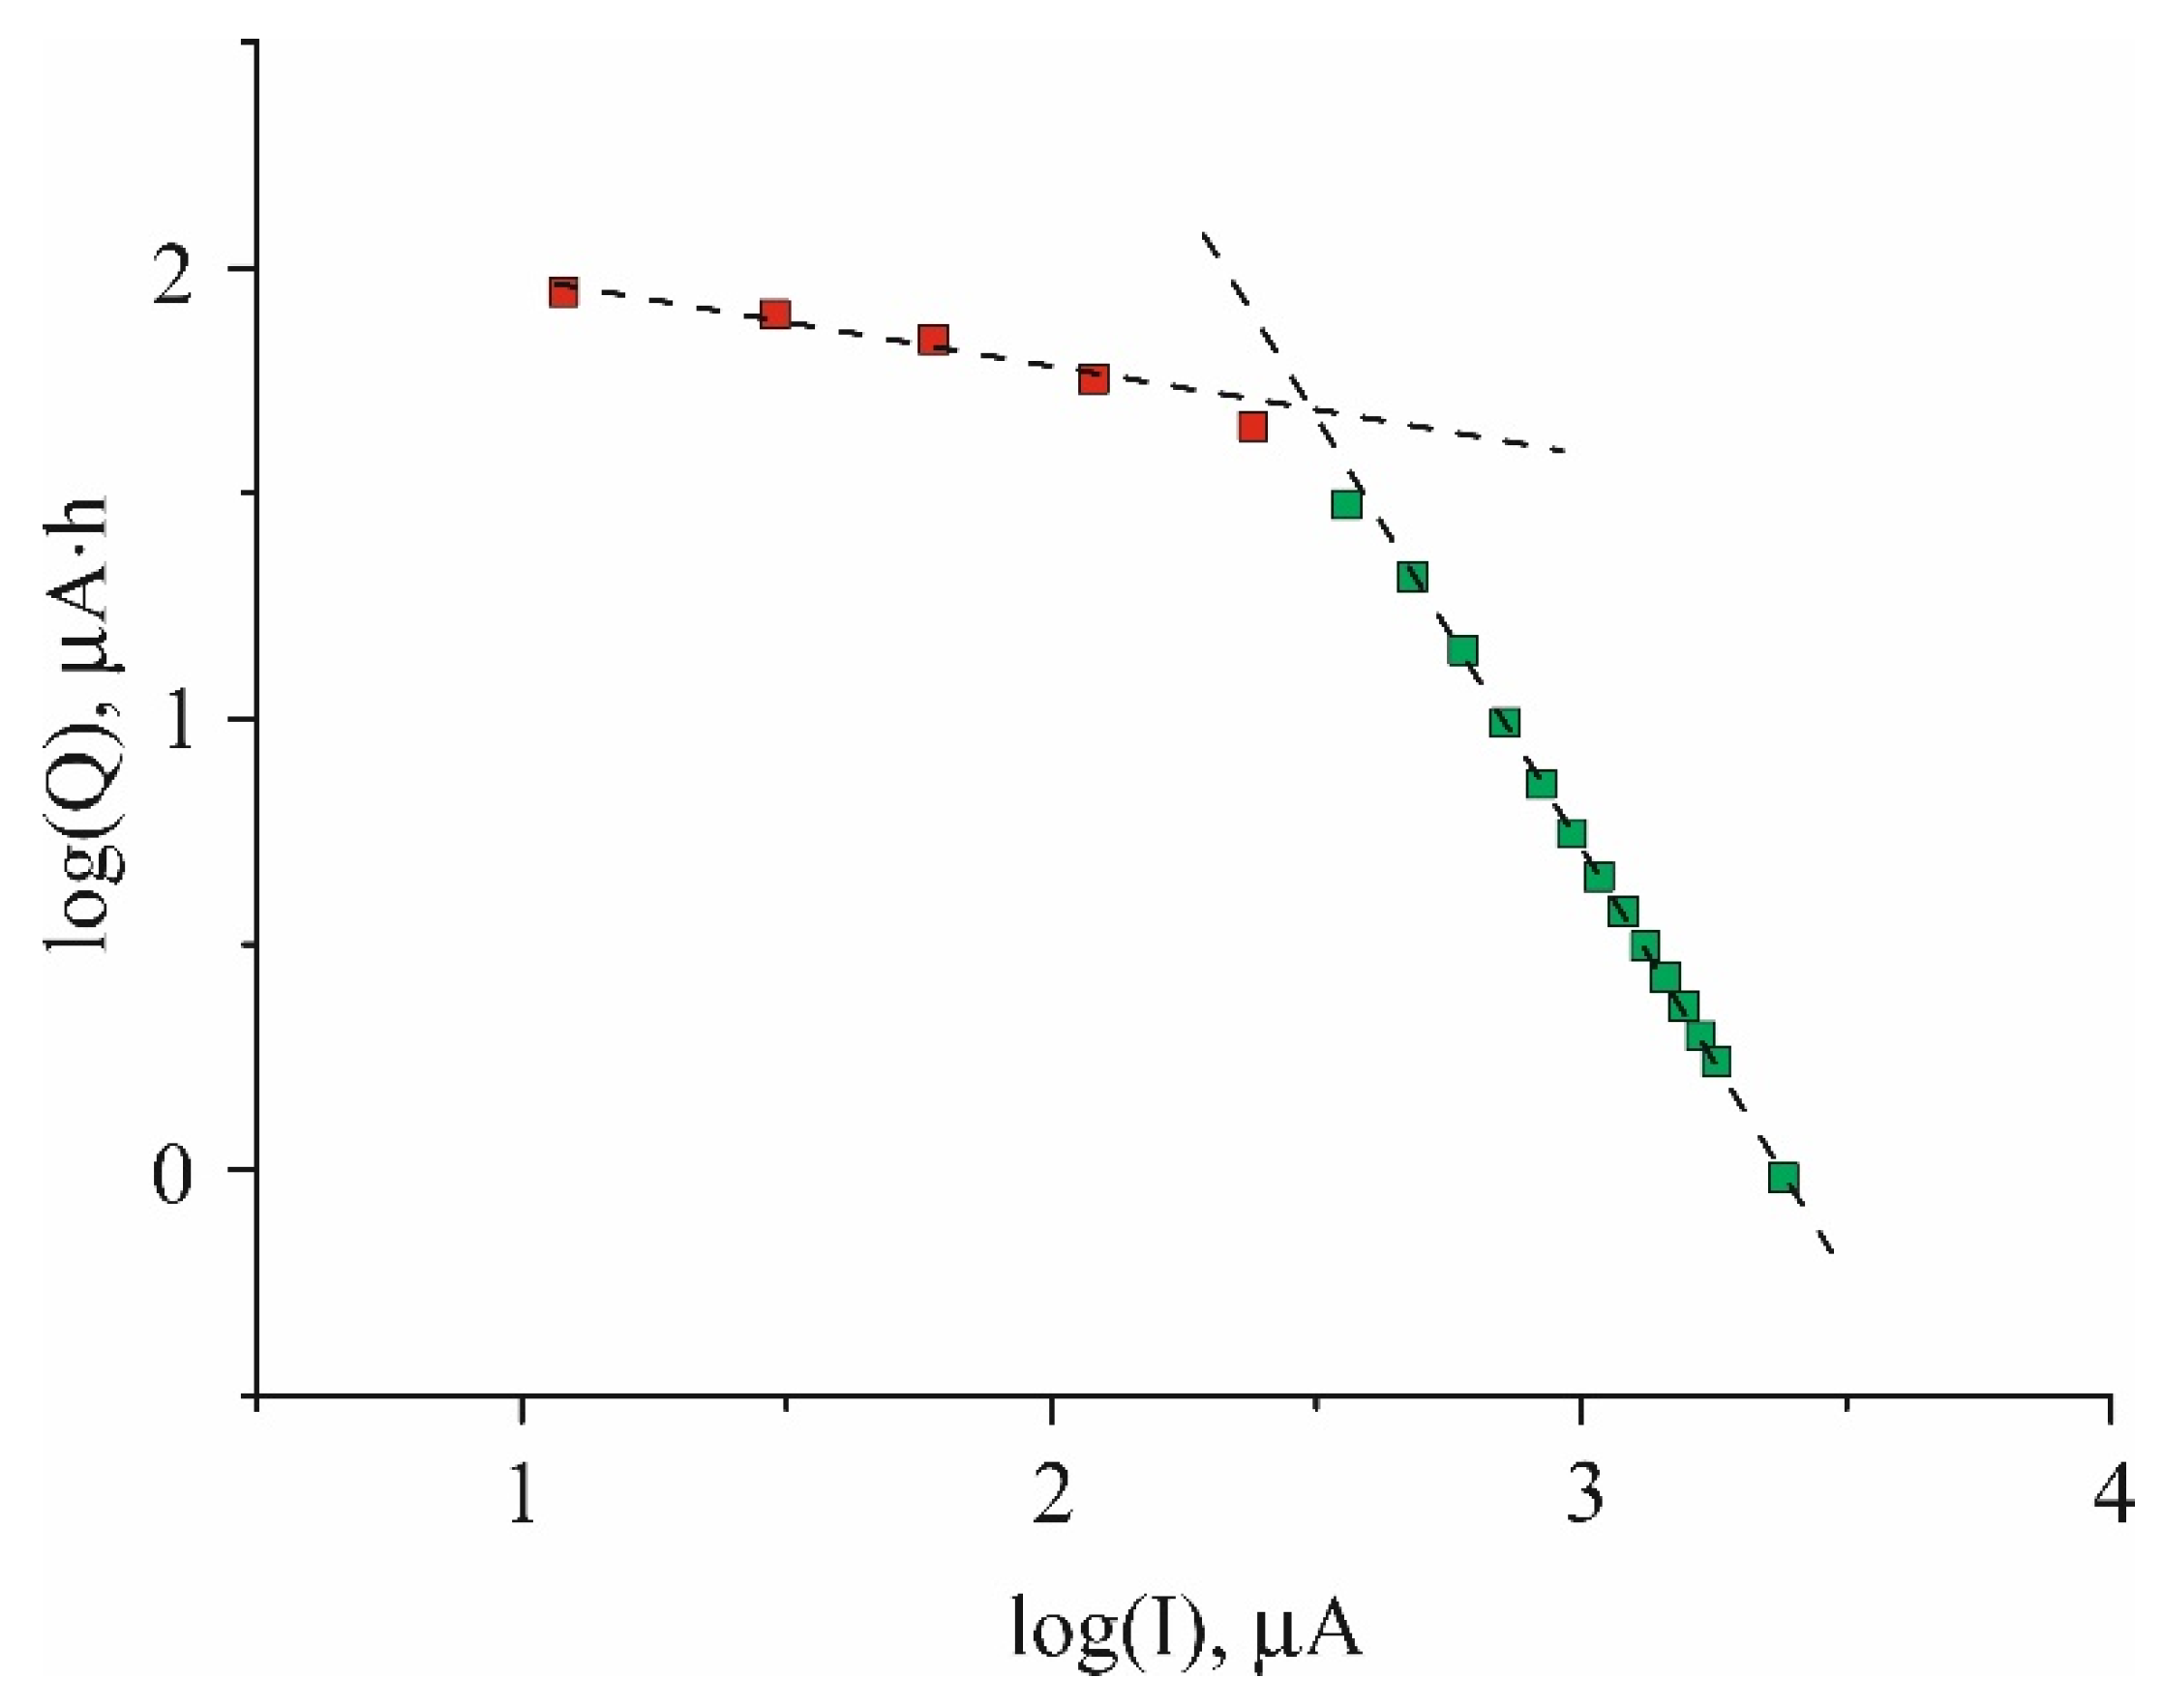
Figure 3.
Stationary distribution of lithium ions concentration in the electrolyte and the instant distribution of lithium atoms in the anode.
Figure 3.
Stationary distribution of lithium ions concentration in the electrolyte and the instant distribution of lithium atoms in the anode.
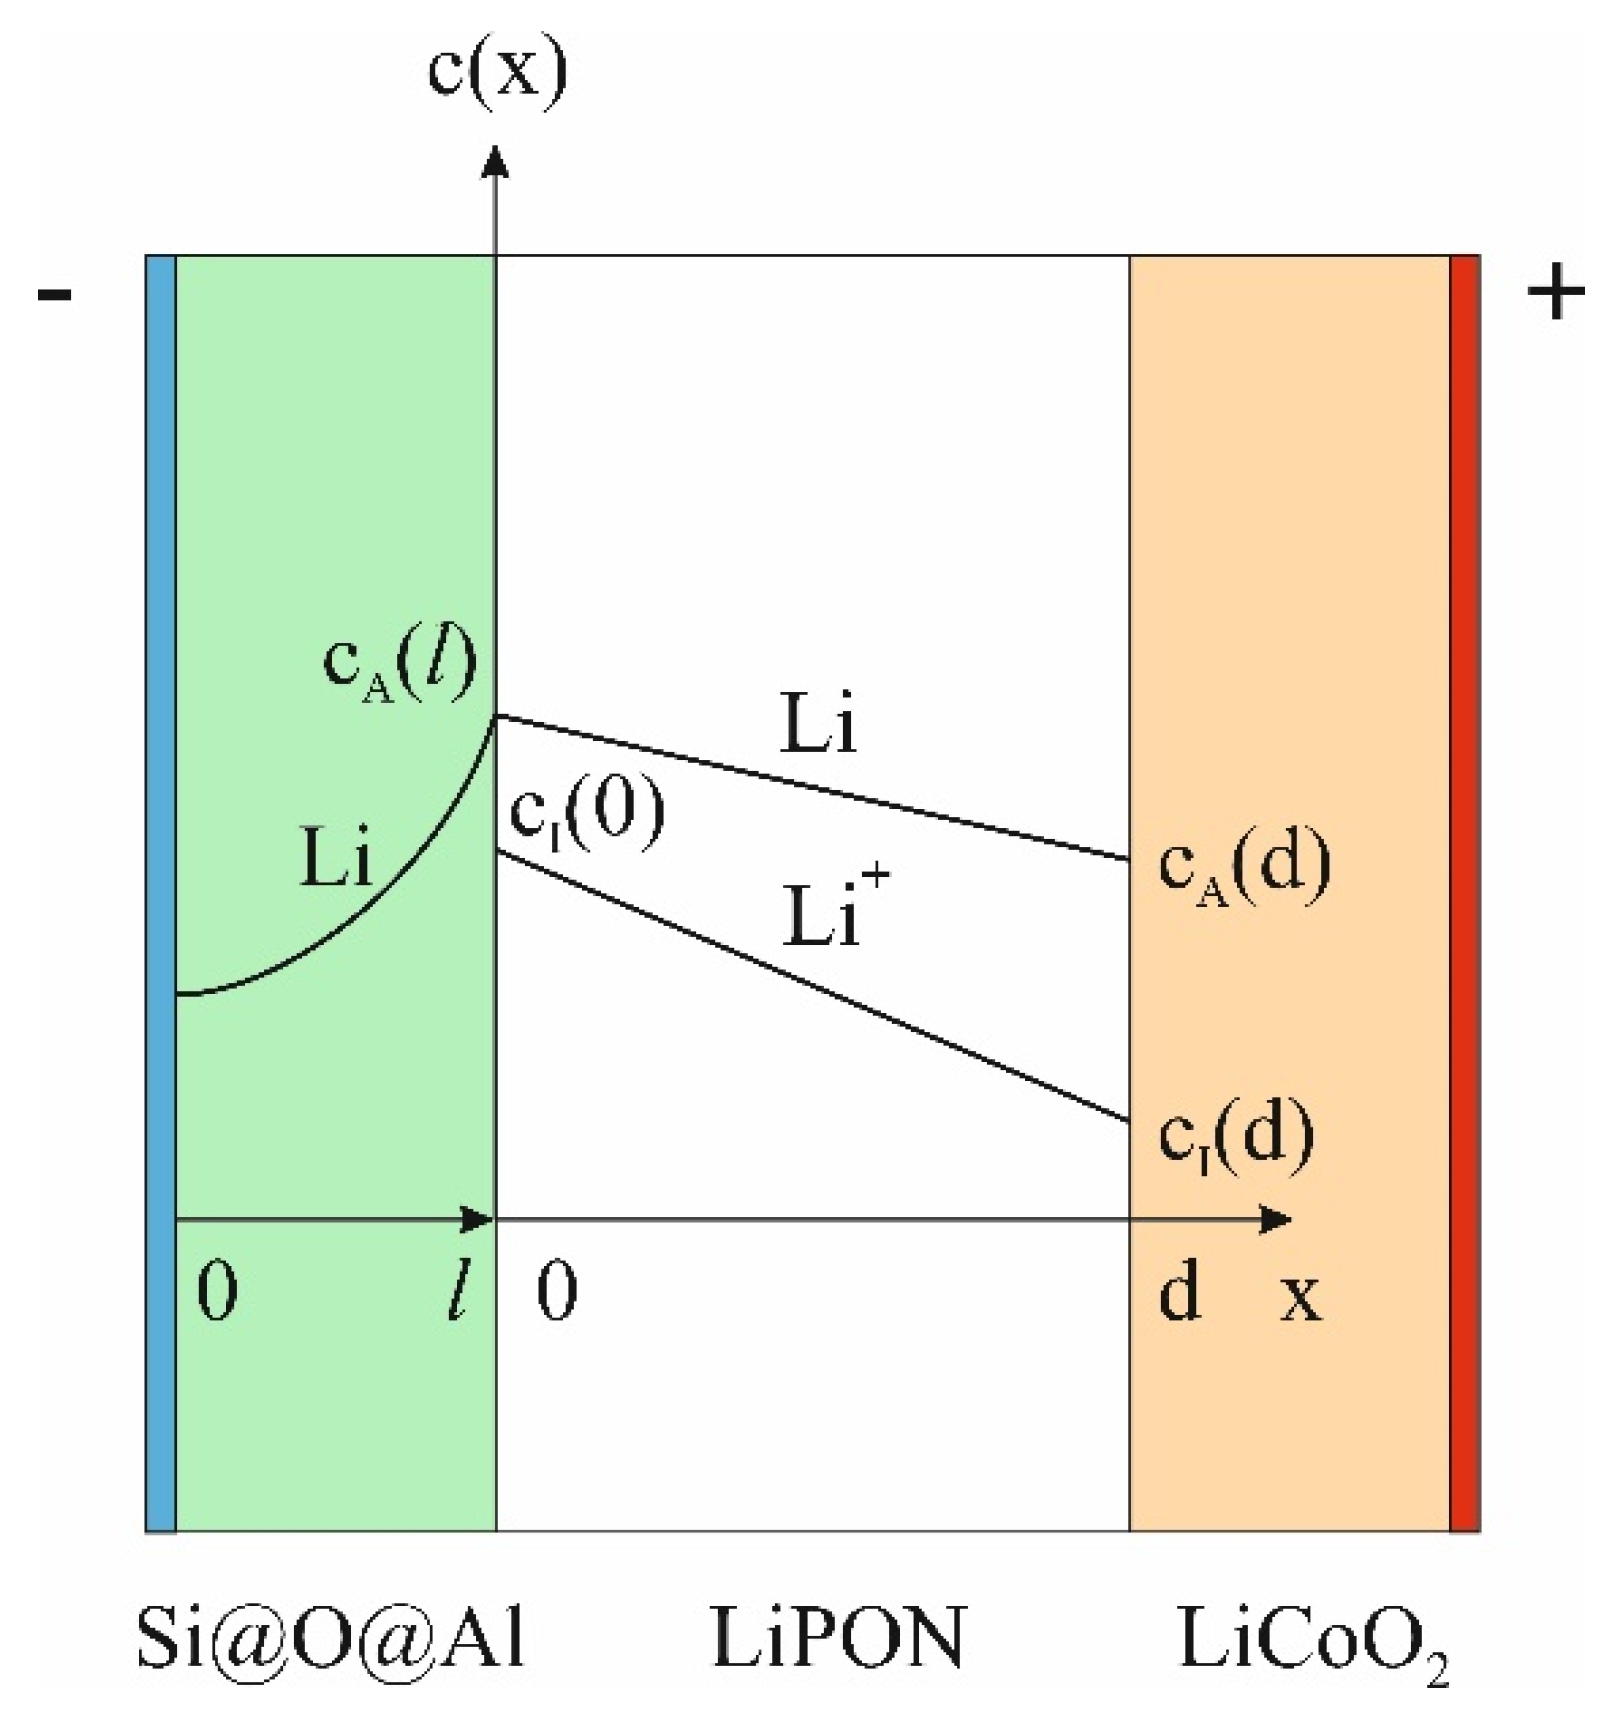
Figure 4.
Charging curve (12) at charge current density and equation parameters ; ; ; ; ; ; ; .
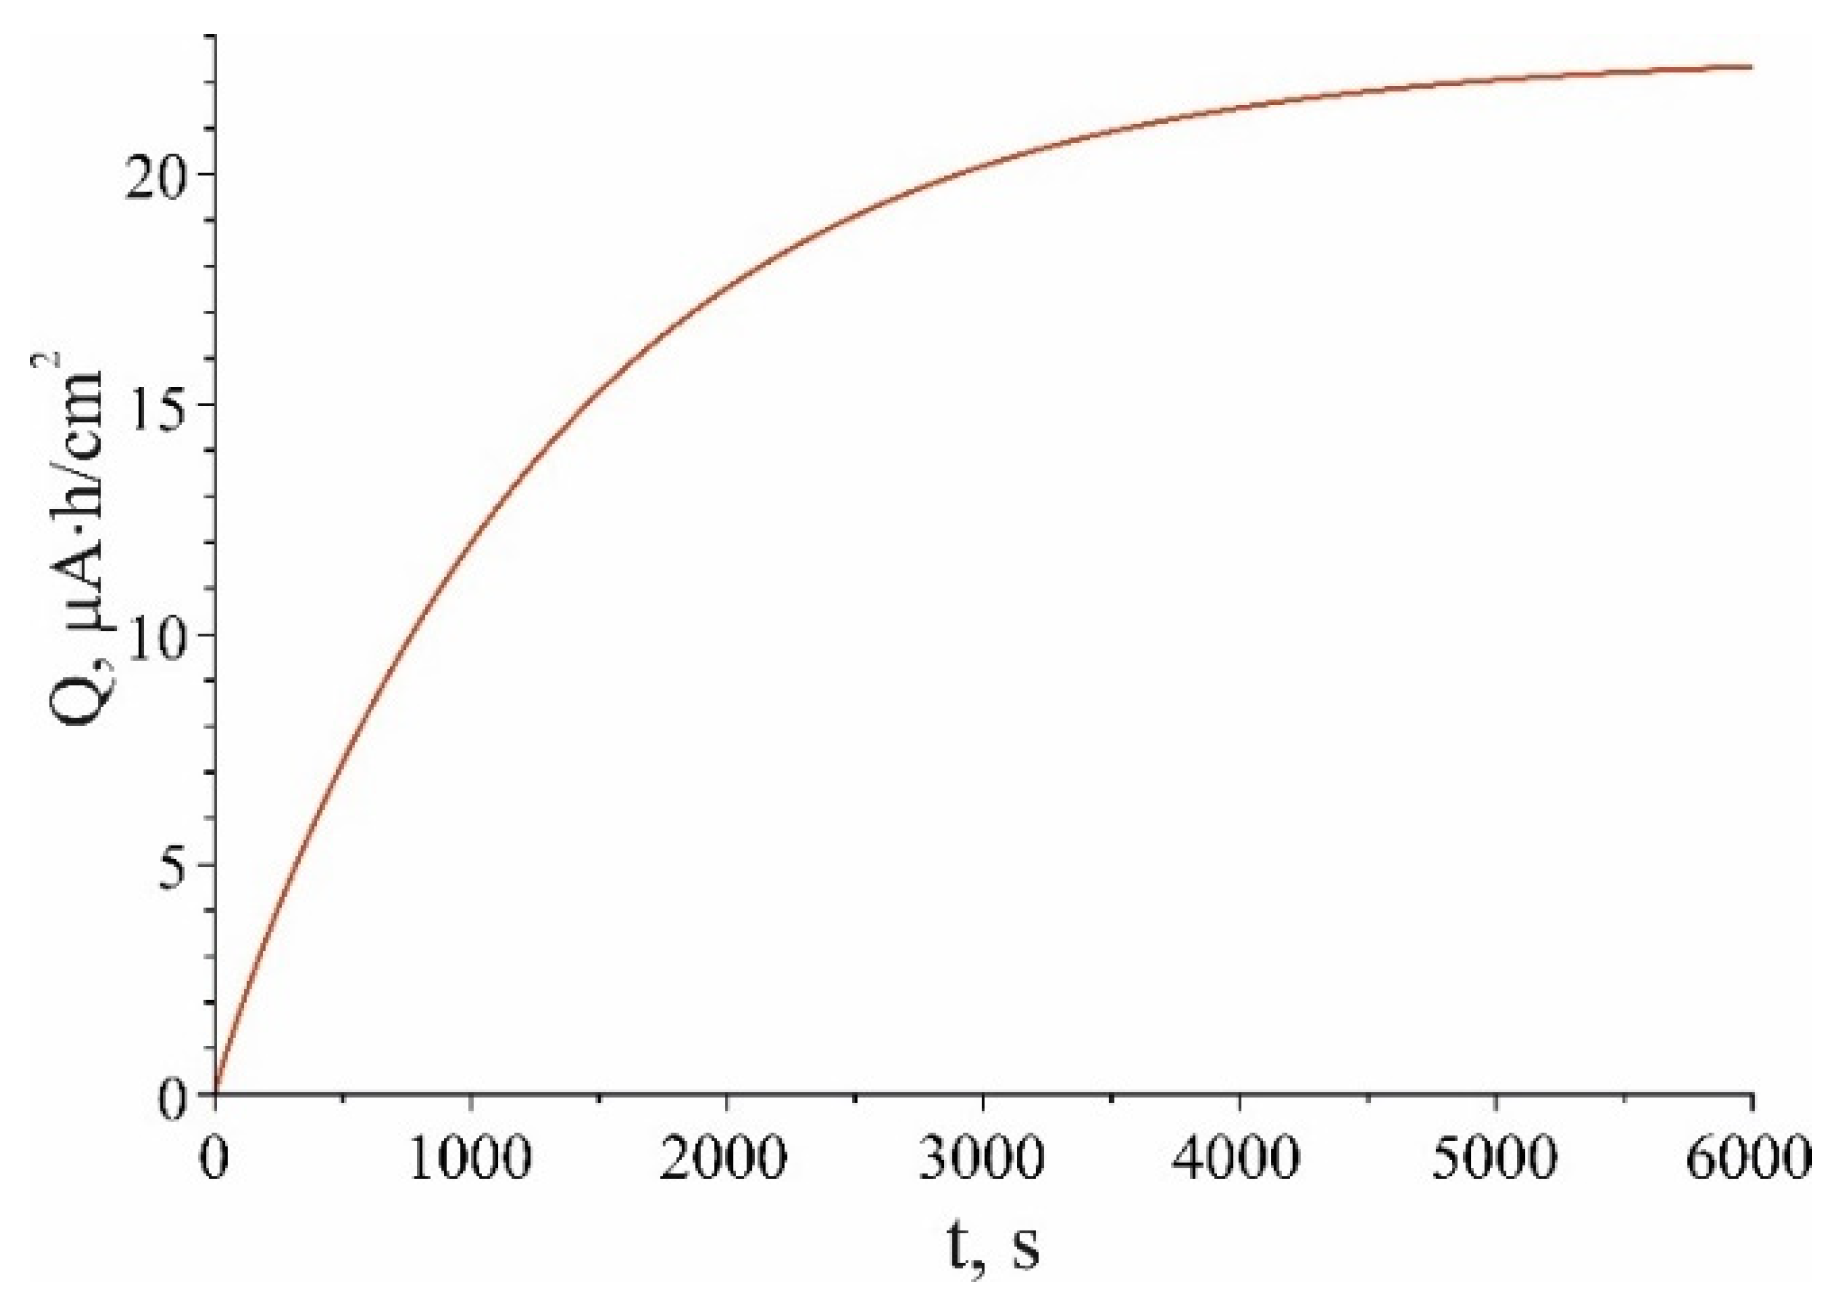
Figure 5.
a - The experimental dependence of capacity on current density (dots). The solid line is the theoretical dependence (23). b - The same curves on a logarithmic scale. Parameters of equation (23):; ; ; ; ; ; ; ; ; ; .
Figure 5.
a - The experimental dependence of capacity on current density (dots). The solid line is the theoretical dependence (23). b - The same curves on a logarithmic scale. Parameters of equation (23):; ; ; ; ; ; ; ; ; ; .
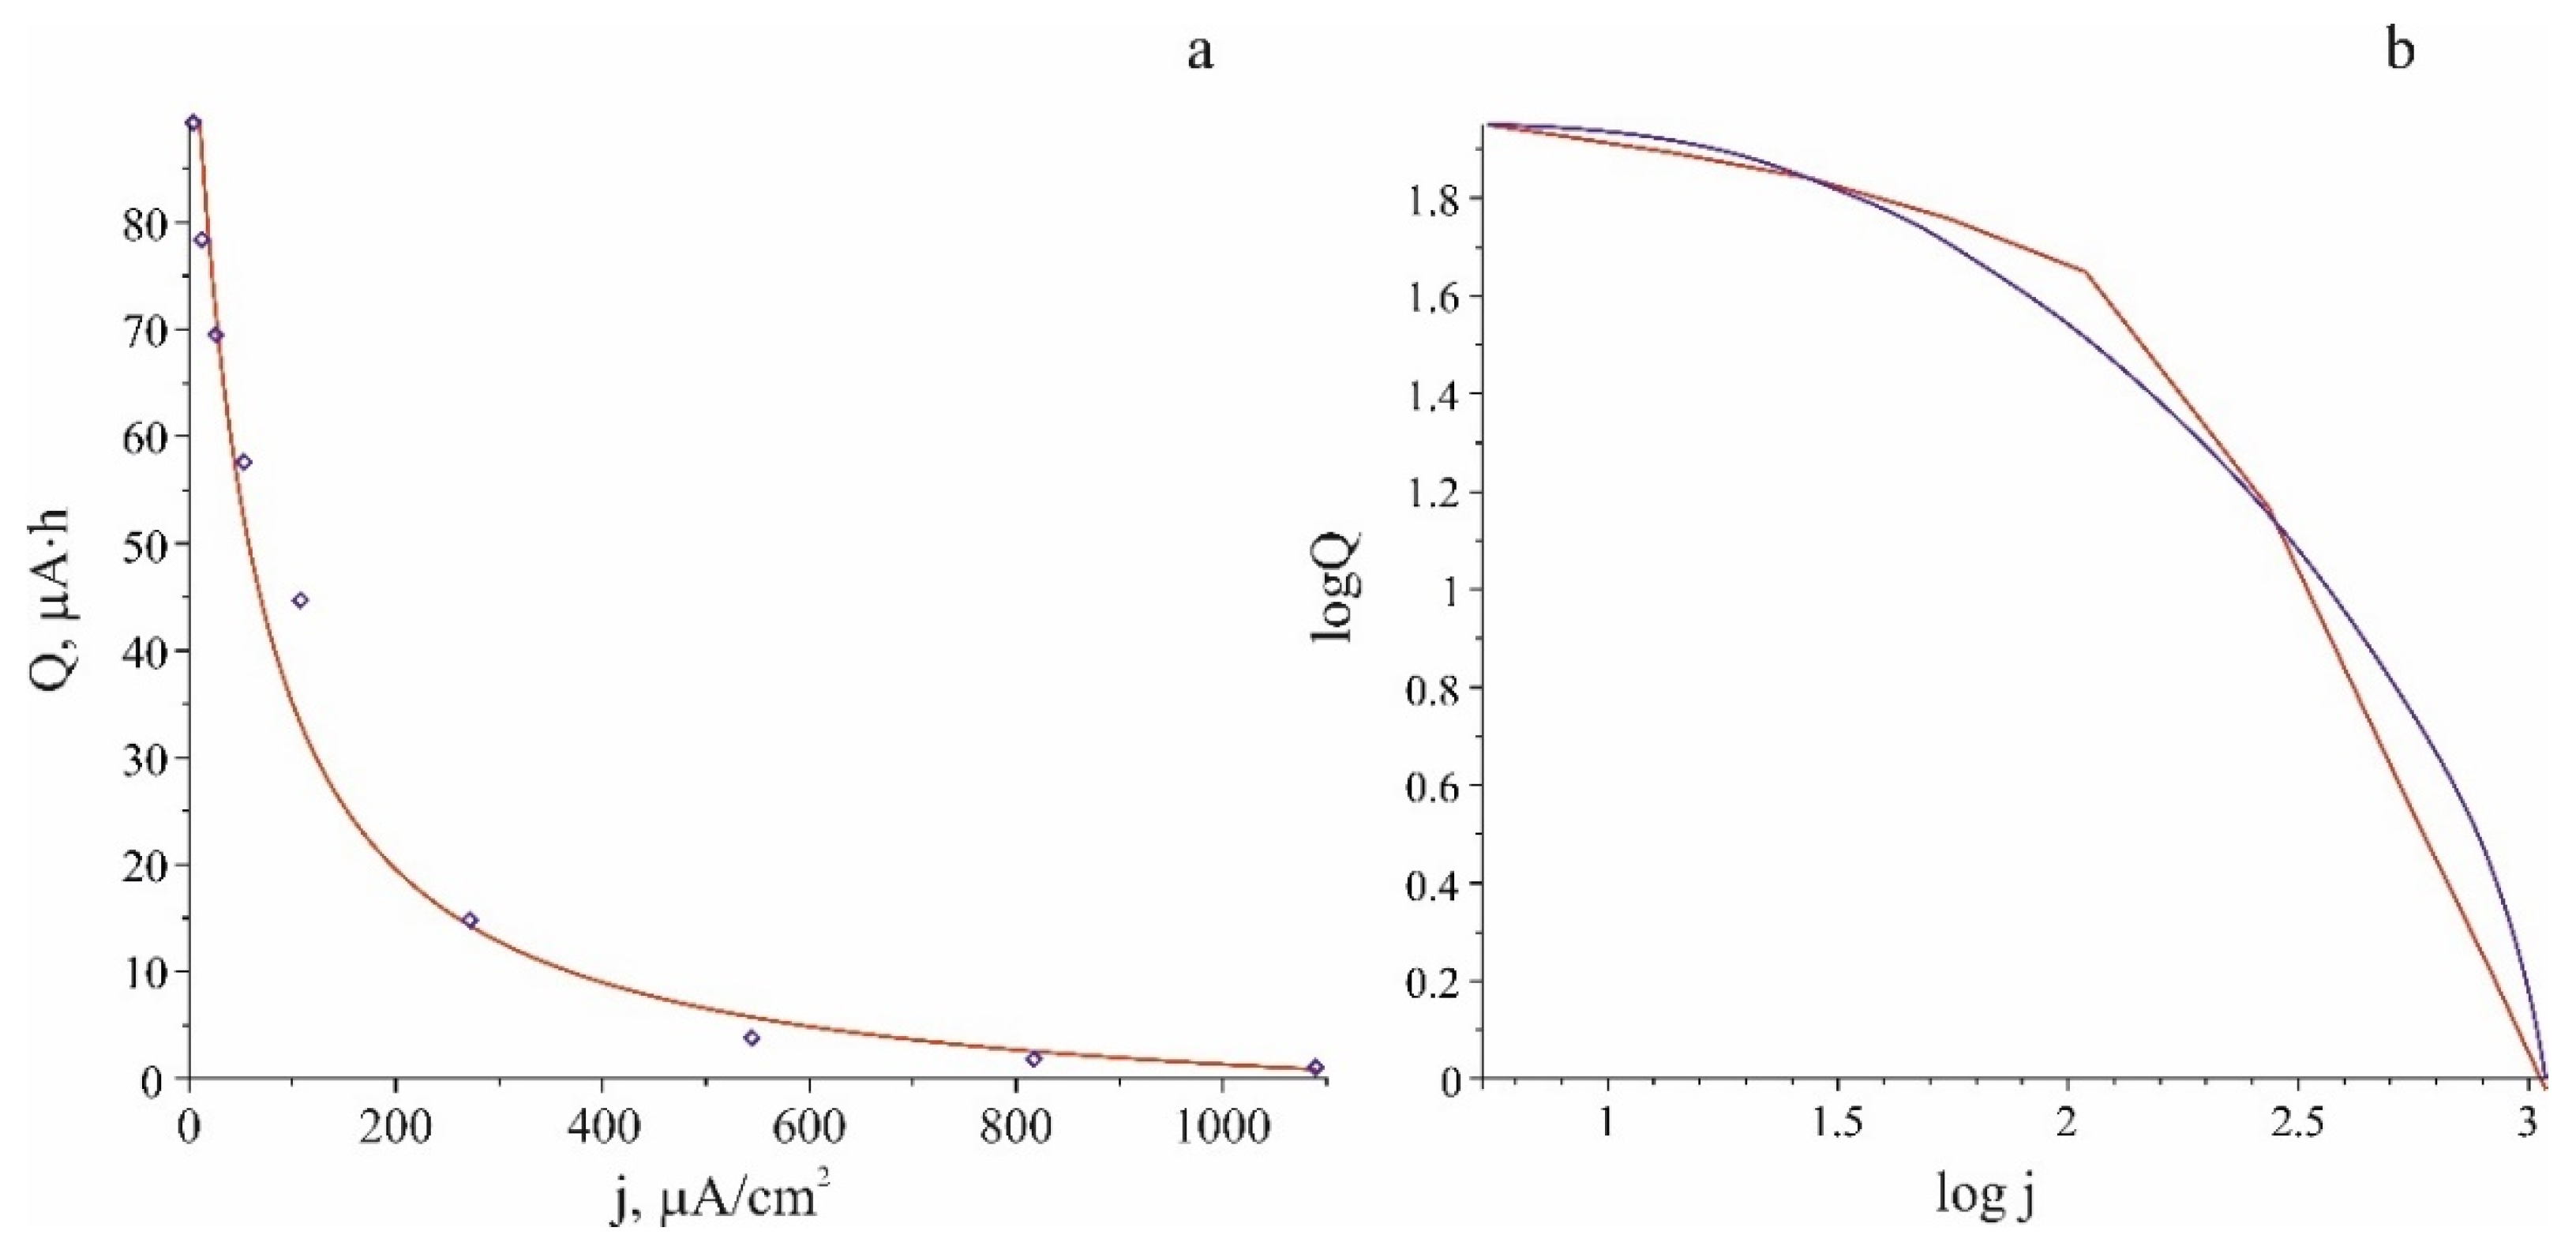
Figure 6.
Experimental dependence of the cell capacity on the density of the charging current (blue diamonds). The red curve is the theoretical dependence (23). The green curve is the graph of the approximating dependence (25).
Figure 6.
Experimental dependence of the cell capacity on the density of the charging current (blue diamonds). The red curve is the theoretical dependence (23). The green curve is the graph of the approximating dependence (25).
Disclaimer/Publisher’s Note: The statements, opinions and data contained in all publications are solely those of the individual author(s) and contributor(s) and not of MDPI and/or the editor(s). MDPI and/or the editor(s) disclaim responsibility for any injury to people or property resulting from any ideas, methods, instructions or products referred to in the content. |
© 2023 by the authors. Licensee MDPI, Basel, Switzerland. This article is an open access article distributed under the terms and conditions of the Creative Commons Attribution (CC BY) license (http://creativecommons.org/licenses/by/4.0/).
Copyright: This open access article is published under a Creative Commons CC BY 4.0 license, which permit the free download, distribution, and reuse, provided that the author and preprint are cited in any reuse.


