
Submitted:
24 May 2023
Posted:
25 May 2023
You are already at the latest version
Abstract
Achieving high-yield potential is always the ultimate objective of any breeding program. However, various abiotic stresses like salinity, drought, cold, flood, and heat hampered rice productivity tremendously. Salinity is one of the most important abiotic stresses that adversely affect rice grain yield. The present investigation was undertaken to dissect new genetic loci, which are responsible for salt tolerance at the early seedling stage in rice. A bi-parental mapping population (F2:3) was developed from the cross between BRRI dhan28/Akundi, where BRRI dhan28 (BR28) is a salt-sensitive irrigated (boro) rice mega variety and Akundi is a highly salinity tolerant Bangladeshi origin indica rice landrace that is utilized as a donor parent. We report stable QTLs for salt tolerance from a common donor (Akundi) irrespective of two different genetic backgrounds (BRRI dhan49/Akundi and BRRI dhan28/Akundi). A robust 1k-Rice Custom Amplicon (1k-RiCA) SNP marker genotyping platform was used to genotype this bi-parental population. After eliminating markers with high segregation distortion, 886 polymorphic SNPs built a genetic linkage map covering 1526.5 cM of whole rice genome with an average SNP density of 1.72 cM for the 12 genetic linkage groups. A total of 12 QTLs for nine different salt tolerance-related traits were identified using QGene and inclusive composite interval mapping of additive and dominant QTL (ICIM-ADD) under salt stress on seven different chromosomes. All of these 12 new QTLs found unique, as no other map from the previous study has reported these QTLs in the similar chromosomal location and found them different from extensively studied Saltol, SKC1, OsSalT and salT locus. Twenty-eight significant digenic/epistatic interactions identified between chromosomal regions linked to or unlinked to QTLs. Akundi acts like a new alternate donor source of salt tolerance except for other usually known donors like Nona Bokra, Pokkali, Capsule, and Hasawi used in salt tolerance genetic analysis and breeding programs worldwide, including Bangladesh. Integration of the seven novel and stable QTLs (qSES1, qSL1, qRL1, qSUR1, qSL8, qK8, qK1) reported in this investigation will expedite the cultivar development that is highly tolerant to salt stress.
Keywords:
genetic loci
; salt tolerant indica germplasm (Akundi)
; single nucleotide polymorphisms (SNP)
; 1k-RiCA
; Oryza sativa L.
1. Introduction
Rice is the staple food crop in the world which is used by more than half of the world population [1,2,3] who depend on it for their source of nutrition [4]. However, several problems affect rice production and salinity is one of them.
Salinity is key abiotic stress in this changed climatic condition that affects about one-third land areas of the world. Globally, salinity stress poses enormous challenges to food security [5]. Because the rice plant is basically sensitive to salt stress, increasing the level of salinity detrimentally affects productivity [6]. The extent of saline-prone vulnerable areas will continue to expand in these altered climatic conditions [6]. High salinity impedes the water and nutrients uptake from soil and this inhibits seedling growth and development and hence reduces production. Consequently, breeding programs targeting coastal saline zones must emphasize salt-stress tolerant rice cultivar development.
An increase in rice productivity in coastal saline-affected regions is inevitable [7]. Salinity stress is a severe constraint on coastal rice farming, owing to its susceptibility during the young seedling stage and reproductive development (panicle initiation to flowering stages) [8]. Various studies have demonstrated that salt tolerance is influenced by polygenes and QTL [9]. By applying QTL dissection in segregating populations, several genetic loci for different traits related to salinity in rice have been reported. Hossain et al. [10] stated that using 14 microsatellite markers in an F2 biparental mapping population, six QTLs with LOD values ranging from 3.2 to 22.3 were mapped on chromosomes 1, 7, 8, and 10. Rahman et al. [9] observed that genomic loci on the bottom of the long arm of chromosome 1 were responsible for Na+ concentration, K+ uptake, Na+-K+ ratio, and survival rate; chromosome 3 was responsible for Na+ accumulation, sustenance, and overall phenotypic score applying the standard evaluation system (SES) score (for scoring of visual salt injury at seedling and reproductive stages in rice); and chromosome 5 was responsible for SES. Additionally, six pairwise significant digenic relationships between QTL-linked and QTL-unlinked (QTL vs. background loci) regions were detected. Nayyeripasand et al. [11] postulated 151 trait-marker associations involved in stress resistance on rice chromosome 10 that were arranged in 29 genomic areas.
Investigating effective traits in rice germplasm is necessary for detecting suitable/ desirable alleles. However, Akundi is a salt-tolerant, Bangladeshi origin indica landrace and considerably acclimated, deposited less Na and proportionally more K in shoots/leaves, maintaining a minimal Na+-K+ ratio. They considerably restrict sodium translocation from roots to the shoots, which was known as a useful and novel salinity tolerance source [12]. Despite the well-recognized salinity tolerant donors such as Pokkali, Capsule, Hasawi, Nona Bokra, Cheriviruppu, and Akundi serves as substitute new donor of salt tolerance for detailed genetic investigation and breeding programs in Bangladesh as well as globally. Pokkali shows better adaptability to salt stress because of two different features to cope with difficult salt-stress conditions: it’s capacity to keep a less Na+/K+ equilibrium in the shoot/leaf tissue, consequently it maintains vigorous growth rate in saline ecosystems, which helps in diffusion of the salt and reducing the stress related cytotoxicity within the plant tissue [13,14]. An F2:3 biparental mapping population was generated from a cross of BRRI dhan28 and Akundi, where BRRI dhan28, a sensitive irrigated (boro) season rice variety, was crossed with Akundi, a salt-tolerant traditional variety. The mapping of genetic loci is important for enhancing and deciphering our insights on the type of the distribution, genetic and genomic architecture of component characters of interest [15,16]. In addition, it enables the development of markers for complicated traits and useful /important alleles in breeding programs. The main objective of the present investigation is to dissect new and stable quantitative trait loci (QTLs) from common salt tolerant parent (donor) Akundi using two different sensitive parents BRRI dhan49 and BRRI dhan28, which control salt-tolerance in the early seedling stage of rice, to find epistatic/diallelic interactions.
2. Results
2.1. Salt stress reactions of the selected F2:3 progenies and the parental genotypes
Ninety-two F2:3 individuals were obtained from BRRI dhan28/Akundi cross, where BRRI dhan28 was a sensitive variety and Akundi was salt tolerant and were assessed in phytotron using a hydroponic system under a salt-stress condition. The F2 population is adequately dissimilar, indicating that these individuals have significant genetic variability from one another, as explained further below.
2.2. Assessing agronomic characters under salt-stress
2.2.1. SES score
Two parents showed significantly different reactions to salt stress, where BRRI dhan28 (BR28) was found highly sensitive (SES score = 8) and Akundi demonstrated tolerance to salinity (SES score = 3). The distribution of this trait is likely multifactorial and negatively skewed (skewness = -0.74). Figure 1a illustrates a histogram that shows the frequency of numerical value of different variables/ traits of the mapping population and its parents. The ultimate visual SES score for the tolerant plants ranged from 4 to 5, with an average of 4.5, while the SES score for the sensitive individuals ranged from 6 to 8 (average SES score = 7.0).
2.2.2. Survival rate
The average survival rate for Akundi was 100%, while the average survival of BR28 was 45% (range: 40–50%). This trait showed a negative skew (skewness = -1.37). A higher rate of survival (90–100%) was observed in about 79% of individuals in the biparental population (Figure 1b).
2.2.3. Shoot length
The average length of the shoot was 57.2 cm in tolerant parent Akundi (range: 55.8–58.6 cm), while BR28 had a mean shoot length of 28.00 cm (range: 27.0–29.0 cm). Significant variability was observed for shoot length among F2:3 progenies (range: 30.85–55.31 cm). Moreover, the frequency distribution reveals that the distribution is fairly symmetrical with a skewness of 0.24 (Figure 1c).
2.2.4. Shoot dry weight
The shoot dry weight ranged between 0.05 and 0.16 g, with shoot dry weight obtained at 0.21 g in Akundi and 0.08 g in BR28 (Figure 1d). 31 out of the 92 F2:3 progenies had shoot biomass in the range of 0.12-0.20 g, while only 13 had shoot biomass of less than 0.08 g, comparable to that of BR28. This distribution is skewed negatively (-0.14).
2.2.5. Root length
Average root length of Akundi was 13.3 cm (range of 13.2–13.4 cm); while the mean root length of BR28 was 12.0 cm (range of 11.5–12.5 cm) (Figure 1e). In root length, large variation was found in the F2:3 individuals (range of 8.35–18.17 cm). The frequency distribution is negatively skewed (-0.25) and the distribution is slightly symmetrical.
2.3. Characterizing physiological parameters under stress
2.3.1. SPAD value
SPAD value ranged from 14.5 to 30.8. The SPAD value of Akundi was 29.70 and BR28 was 22.65 and (Figure 1f). The highest SPAD value was more than 29.70 observed in 22 individuals and the lowest SPAD value was less than 20.00 found in 8 plants. The data were negatively skewed (-0.15).
2.3.2. Na+ concentration
Na+ concentration was less than 0.1 mmolg-1 dwt in around 33 individuals, 59 plants had higher Na+ concentration (more than 0.10 mmolg-1 dwt). The Na+ concentration in tolerant parent Akundi (0.18 mmolg-1 dwt) and sensitive parent BR28 (0.31 mmolg-1 dwt) vary considerably. The data shows positive skewness (0.21) (Figure 1g).
2.3.3. K+ concentration
The K+ concentration was positively skewed (0.35). Around 13 plants had low (less than 0.47 mmog-1 dwt) K+ concentration, 30 plants had high (more than 0.70 mmolg-1 dwt) K+ concentration, and the rest of the individuals had an intermediate K+ concentration. The potassium concentration of Akundi (1.12 mmolg-1 dwt) and BR28 (0.47 mmolg-1 dwt) exhibit significant differences (Figure 1h).
2.3.4. Na+/K+ ratio
The Na+/K+ ratio of tolerant Akundi and susceptible parent BR28 had 0.16 and 0.34 respectively. The Na+/K+ ratio of around 30 progenies had low (less than 0.16 mmolg-1 dwt) and 13 plants had high (more than 0.30 mmolg-1 dwt) Na+/K+ ratio. The frequency distribution is positively skewed, and the value of skewness was 0.84 (Figure 1i).
2.4. Trait correlation analysis between different characters
For polygenic traits of salinity, efficient selection strategies rely on the information on the association between overall phenotypic performance/ salt injury scores (SES Score) and their contributing characteristics. Positive correlations were observed among salt injury scores (SES), shoot length (cm), shoot dry weight (g), and Na+ concentration (mmolg-1 dwt), and significant and negative correlations with K+ concentration, and SPAD value (Figure 2). Here positive correlation was found between SES and Na+ concentration. If the Na+ concentration increases in the plant tissue then the visual salt injury scores (SES score) also increase; that is, the two traits have a cause-effect relationship, and are reliant on each other. The correlation of SES with K+ concentration and SPAD value has a negative association demonstrating that the visual symptom (SES) decreases as the accumulation of chlorophyll and potassium concentration increases in the plant tissue. Survival rate revealed a significant and positive correlation with shoot length and K+ concentration. So, high amount of potassium and low SES score are important considerations for plant survival under salt stress. Potassium (K+) concentration has also a significant and positive correlation with survival rate, shoot length (cm), shoot dry weight (g), and root length (cm) and a negative correlation was observed with the SES score. Consequently, K+ concentration is a key parameter in rice plants through maintaining ionic balance (homeostasis) under salt stress conditions (Figure 2).
2.5. Determining the contribution of component agronomic and physiological traits (independent variables) to overall phenotypic performance (SES score: dependent variable) through path analysis
Overall phenotypic performance (SES score) under salt stress depends on the contribution of various agronomic and physiological traits under study. The higher the magnitude of the SES Score indicates a lower level of salt tolerance and vice-versa. The Na+ concentration and Na+/K+ ratio had a significant positive effect on overall phenotypic performance (SES), whereas negative direct effect observed between SES score and shoot dry weight, root length, SPAD value, and K+ concentration (Table 1). It is indeed the circumstance that a lower SES score shows more tolerance to salinity and less amount of Na+ concentration and the Na+/K+ ratio corresponds to a lower SES score, which shows consistency with the correlation (0.24 and 0.33). Na+ concentration had an indirect effect on tolerance via root length. It demonstrates that the direct negative effect (-0.16) of root length on SES is indicative of tolerance. The values of other traits like survival rate, shoot length, shoot dry weight, SPAD value, K+ concentration, and Na+/K+ ratio was used to calculate indirect path coefficients, indicating the extent to which this trait indirectly influenced the SES score through their effects on other traits (Table 1). The overall magnitude of indirect effects was estimated by adding the indirect path coefficients for each character.
A residual effect (R) is 0.27; this means that the variables % survival, shoot and root length, shoot dry weight, SPAD value, sodium (Na+) concentration, potassium (K+) concentration, and Na+ -K+ ratio combinedly responsible for 73% of the phenotypic variation in salinity tolerance.
2.6. SNP marker polymorphism and construction of genetic linkage map
Marker polymorphism of 1k-RiCA SNP markers was checked between two parents (BR28 vs Akundi). In total 886 polymorphic markers (88.6% polymorphism) identified and they showed difference from each other for both parents were then used to the 92 F2 individuals were genotyped using these 886 polymorphic SNP markers. Polymorphic SNPs were sorted on excel sheet based on first chromosome number then their physical distance in ascending order. A molecular map of QTL regions was constructed using QTL IciMapping Version 4.2 software. The linkage map was approximately 1526.5 cM in length [33], with a mean interval length of 1.72 cM (Figure 3). At a threshold LOD of 3.0, 12 QTLs were identified applying interval mapping and composite interval mapping (Table 2). Robust QTLs were shown on the genomic linkage map. Figure 4 illustrates the QTL likelihood (LOD curve) graphs for newly detected QTL loci controlling traits linked with seedling stage salt tolerance.
2.7. Salinity tolerance QTLs controlling agronomic traits
One QTL, qSES1 was reported for visual/phenotypic symptoms using SES score, reponsible for 15.6% phenotypic variance. Here the QTL position was 151.8 cM, and the QTL contributing parent is Akundi. The Akundi allele (qSES1) significantly enhanced salt tolerance ability through reducing SES visual score. On chromosome 11, one major QTL (qSUR11) for survival was revealed. For the QTL qSUR11, the phenotypic variance was 16.1% which is contributed by BR28. Two QTLs were identified on chromosomes 1 and 8 that were significantly associated with shoot length nearby the QSES1-2_2 and GM4_4, here the R2 value is 30.7% and 16.3%, respectively by the interval mapping (IM) and composite interval mapping (CIM) method. Two QTLs qSDW1 and qSDW10 were observed on chromosomes 1 and 10 of which phenotypic variations were 16.4% and 17.1% respectively. Here the QTL position were 123.4 and 68.6 cM and the locus names chro01_231396842 and chr10_17397576 and contribute by the allele was Akundi. The QTL qRL1 was detected from the choromosome1 by single marker regression method (LOD value for SES score trait 3.4, survival LOD: 3.5 and LOD for shoot length is 7.3, LOD for shoot dry weight 3.6 and root length LOD:3.5 in QGene program) (Table 2).
2.8. QTL regions governing physiological characters
QTL related to chlorophyll content was identified using SPAD readings, with a significant LOD value. This QTL is located at 91.4 cM position on chromosome 7 which explained 12.1% phenotypic variation. Two QTLs (qNa2 and qNa10) were identified on chromosomes 2 and 10 respectively that are significantly linked with Na+ concentration trait in plant tissue by interval mapping and composite interval mapping method. QTL qNa2 and qNa10 accounted for about 14.5% and 15.5% of the total phenotypic variation and exhibited salt-tolerance through reducing 1.43 mmolg-1 dwt and 0.74 mmolg−1 dwt Na+ content in plant tissue respectively (Table 2). One significant QTL (qK1) was identified through single marker regression (SMR) for K+ concentration. These QTLs are found on chromosome 1 accounting for about 19.3% of the total phenotypic variation in K+ concentration. The QTL of qK1 was contributed by BR28. One QTL (qNaKR12) was detected for Na+ /K+ ratio which is located on chromosome 12 and locus name is chr12_10051752. The position of the QTL is 39.4 cM, whereas the additive effect is -0.04 and 12.1% of the total variation. (SPAD readings LOD: 3.0, Na+ concentration LOD: 3.3, LOD: 3.0 for K+ concentration and Na+/K+ ratio LOD: 3.0 analyzed using QGene) (Table 2).
2.9. Probable functional genes detection in the different QTL regions
The QTLs controlling traits like SES score (qSES1) were observed in the chromosomal region 38723347-38724165 bp on chromosome 1 with 16 functional genes. The putative function of the candidate gene (LOC_Os01g66670) was expressed protein and drought-induced proteins, anther, and pollen wall remodeling/metabolism proteins contribute to the salt-stress tolerance of rice. The QTLs for shoot length (qSL1), shoot dry weight (qSDW1), root length (qRL1), and K+ concentration (qK1) were also found in chromosome 1. However, the QTL position, number of loci, candidate gene, and putative function are different from one another. The position of QTL, locus number, candidate gene, and putative function of shoot length (qSL1) was 39794226-39799341 bp, 18, LOC_Os01g68490 and tetra-trico peptide-like helical, putative, expressed, abscisic acid responses and tolerance to osmotic stress, enable plants to acclimatize with adverse environmental conditions respectively. The QTL position, number of loci, candidate gene, and putative function of shoot dry weight (qSDW1) was 31473897-31477599 bp, 17 loci, LOC_Os01g54700 and retrotransposon protein, putative, Ty1-copia subclass, expressed, regulating gene expression during the development of plant under salt stress, played a major role in shaping genome structure respectively. The position of QTL, number of locus, candidate gene, and putative function of root length (qRL1) was 10713139-10714271 bp, 16 loci, LOC_Os01g18950 and peroxidase precursor, putative, expressed, increases defense against oxidative stress, highly tolerant to different stresses allowing survival when the water supply is a limiting factor respectively. The QTL position of qK1 for K+ concentration, total number of locus, candidate gene, and putative function was 39922192-39923794 bp, 16, LOC_Os01g68730 and RNA-binding protein FUS, putative, expressed, involved in cellular stress response, responses against pathogen infection respectively. Another functional gene LOC_Os11g09990 was observed on chromosome 11 encoding mTERF family protein, expressed, coordinate mitochondrial transcription, growth, development, and stress response between the chromosomal region 5357710-5359379 bp inside the QTL qSUR11 at the seedling stage. In the chromosomal region 5613578-5616235 bp of chromosome 8, one functional gene LOC_Os08g09715 was identified F-box domain-containing protein, expressed, F-box protein-encoding genes during the floral transition as well as panicle and seed development, play a variety of roles in developmental processes including plant hormonal signal transduction, floral development, secondary metabolism, senescence, circadian rhythms, and responses to both biotic and abiotic stresses within the significant QTLs, qSL8 of shoot length at the seedling stage. The QTLs of shoot dry weight (qSDW10) and Na+ concentration (qNa10) were found in chromosome 10. However, their QTL position, number of locus, candidate gene and putative function are different from one another. The QTL position, number of locus, candidate gene, and putative function of shoot dry weight (qSDW10) and Na+ concentration (qNa10) were 17547961-17548260 bp, 11 loci, LOC_Os10g33360, expressed protein, drought-induced proteins, anther and pollen wall remodeling/metabolism proteins contribute to the tolerance of rice to salt stress respectively. SPAD value (qSPAD7), Na+ concentration (qNa2) and Na+/K+ ratio (qNaK12) were also found in chromosome in 7, 2 and 12 in QTL position 23314482-23319154 bp, 34274401-34276956 bp and 10048848-10053017 bp respectively. Here the candidate gene and putative function were LOC_Os07g38860, LOC_Os02g56010, LOC_Os12g17530 and OsGH3.10 - Probable indole-3-acetic acid-amidosynthetase, expressed; anthocyanidin 3-O-glucosyltransferase, putative, expressed and expressed protein, drought-induced proteins, anther and pollen wall remodeling/metabolism proteins contribute to the tolerance of rice to salt stress respectively at the seedling stage (Supplementary Table 2).
2.10. Epistatic interaction
Epistasis is important to control quantitative characters by maintaining interactions between two alleles at a number of loci. For all traits, a two-way test was performed to identify three types of interactions, such as i) interaction between complementary loci, ii) interaction between QTLs, and, iii) interaction between QTLs and background loci using the ICIM-EPI method from QTL IciMapping Version 4.2 software. The epistatic analysis revealed 28 significant interactions. They were made up of eight interactions for SES score, two marker intervals (MI) for % survival rate, five marker loci intervals for shoot length, one interaction for root length, shoot dry weight, and Na+ and K+ concentration. Five marker intervals for SPAD value and four intervals for Na+/K+ ratio were spread across eleven different chromosomes (1, 2, 3, 4, 5, 6, 7, 9, 10, 11, and 12) (Supplementary Table 3). Two types of digenic interactions (complementary type and between QTLs background type interaction) were identified (Supplementary Table 3; Figure 5). (I) interaction between the QTL (marker interval M180-M181; qSDW10) on chromosome 10 for shoot dry weight and background loci (such as marker interval M510-M511) on chromosome 6 with LOD of 34 for shoot dry weight (Supplementary Table 3; Figure 5a) and (II) interaction between complementary locus (90 cM; MI: M165-M166) on chromosome 2 and 61 cM; MI: M769-M770 on chromosome 10 for SPAD value (Figure 5b). Interaction between background loci at MI: M247-M248 (62 cM) on chromosome 3 and MI: M921-M922 on chromosome 12 (76 cM) with LOD of 48.7 and PVE of 0.50% for SES score (Figure 5c). Interaction between QTLs is not observed in this study. Two marker pairs significantly affected the phenotypic expression of the trait through the interaction between the QTL and background loci and 26 significant interactions between complementary loci, thus demonstrating robust interaction effects. Out of two QTLs and background, epistasis interaction for shoot dry weight trait on chromosomes 6 and 10 had a high LOD value (34) with PVE 1.33%. Out of 26 complementary loci, a high LOD value (69) was observed in survival percentage with 1.32% phenotypic variation explained.
2.11. Stable QTLs for different agronomic and physiological traits responsible for salinity tolerance
Fifteen QTLs reported the mapping population derived from BR49/Akundi [5] and 12 QTLs controlling different salt-tolerant traits were identified from the present investigation using the population from BR28/Akundi cross. A total of seven QTLs (qSES1, qSL1, qRL1, qSUR1, qSL8, qK8, qK1) found stable that are colocated on chromosomes 1 and 8 detected from the same donor Akundi using two different F2:3 mapping populations derived from BR28/Akundi and BR49/Akundi (Table 3). Three genomic loci (qSES1, qSL1, and qK1) are located at 151.8- 156.0 cM position on the bottom of chromosome 1. The other stable QTLs such as qRL1, and qSUR1 were found at 42.0 – 50.0 cM position of chromosome 1. However, chromosome 8 also harbored two colocated QTL regions (qSL8 and qK8) that were positioned at 18.8-22.0 cM for governing shoot length and potassium absorption traits respectively.

Table 3.
Common and stable QTLs sharing common chromosomal region on two different chromosomes detected from the same donor Akundi using two different F2:3 mapping populations derived from BR28/Akundi and BR49/Akundi.
Table 3.
Common and stable QTLs sharing common chromosomal region on two different chromosomes detected from the same donor Akundi using two different F2:3 mapping populations derived from BR28/Akundi and BR49/Akundi.
| Trait | Population-1 | Favorable allele contributing parent | Trait | Population-2 | Favorable allele contributing parent | Common and stable QTLs in different genetic background | ||||
|---|---|---|---|---|---|---|---|---|---|---|
| QTL detected in pop. 1 | Chr. | QTL Position (cM) |
QTL detected in pop. 2 | Chr. | QTL Position (cM) | |||||
| SES | qSES1 | 1 | 151.8 | Akundi | SES | qSES1 | 1 | 151.8 | Akundi | qSES1 |
| Shoot length | qSL1 | 1 | 156 | BR28 | Shoot length | qSL1 | 1 | 156 | BR49 | qSL1 |
| Root length | qRL1 | 1 | 42 | BR28 | Root length | qRL1 | 1 | 48.8 | Akundi | qRL1 |
| Root length | qRL1 | 1 | 42 | BR28 | Survival (%) |
qSUR1 | 1 | 50 | BR49 | qSUR1 |
| Shoot length | qSL8 | 8 | 22 | BR28 | K+ Conc. | qK8 | 8 | 18.8 | Akundi | qSL8 |
| Shoot length | qSL8 | 8 | 22 | BR28 | K+ Conc. | qK8 | 8 | 18.8 | Akundi | qK8 |
| K+ conc. | qK1 | 1 | 156.5 | BR28 | Shoot length | qSL1 | 1 | 156 | BR49 | qK1 |
Figure 6.
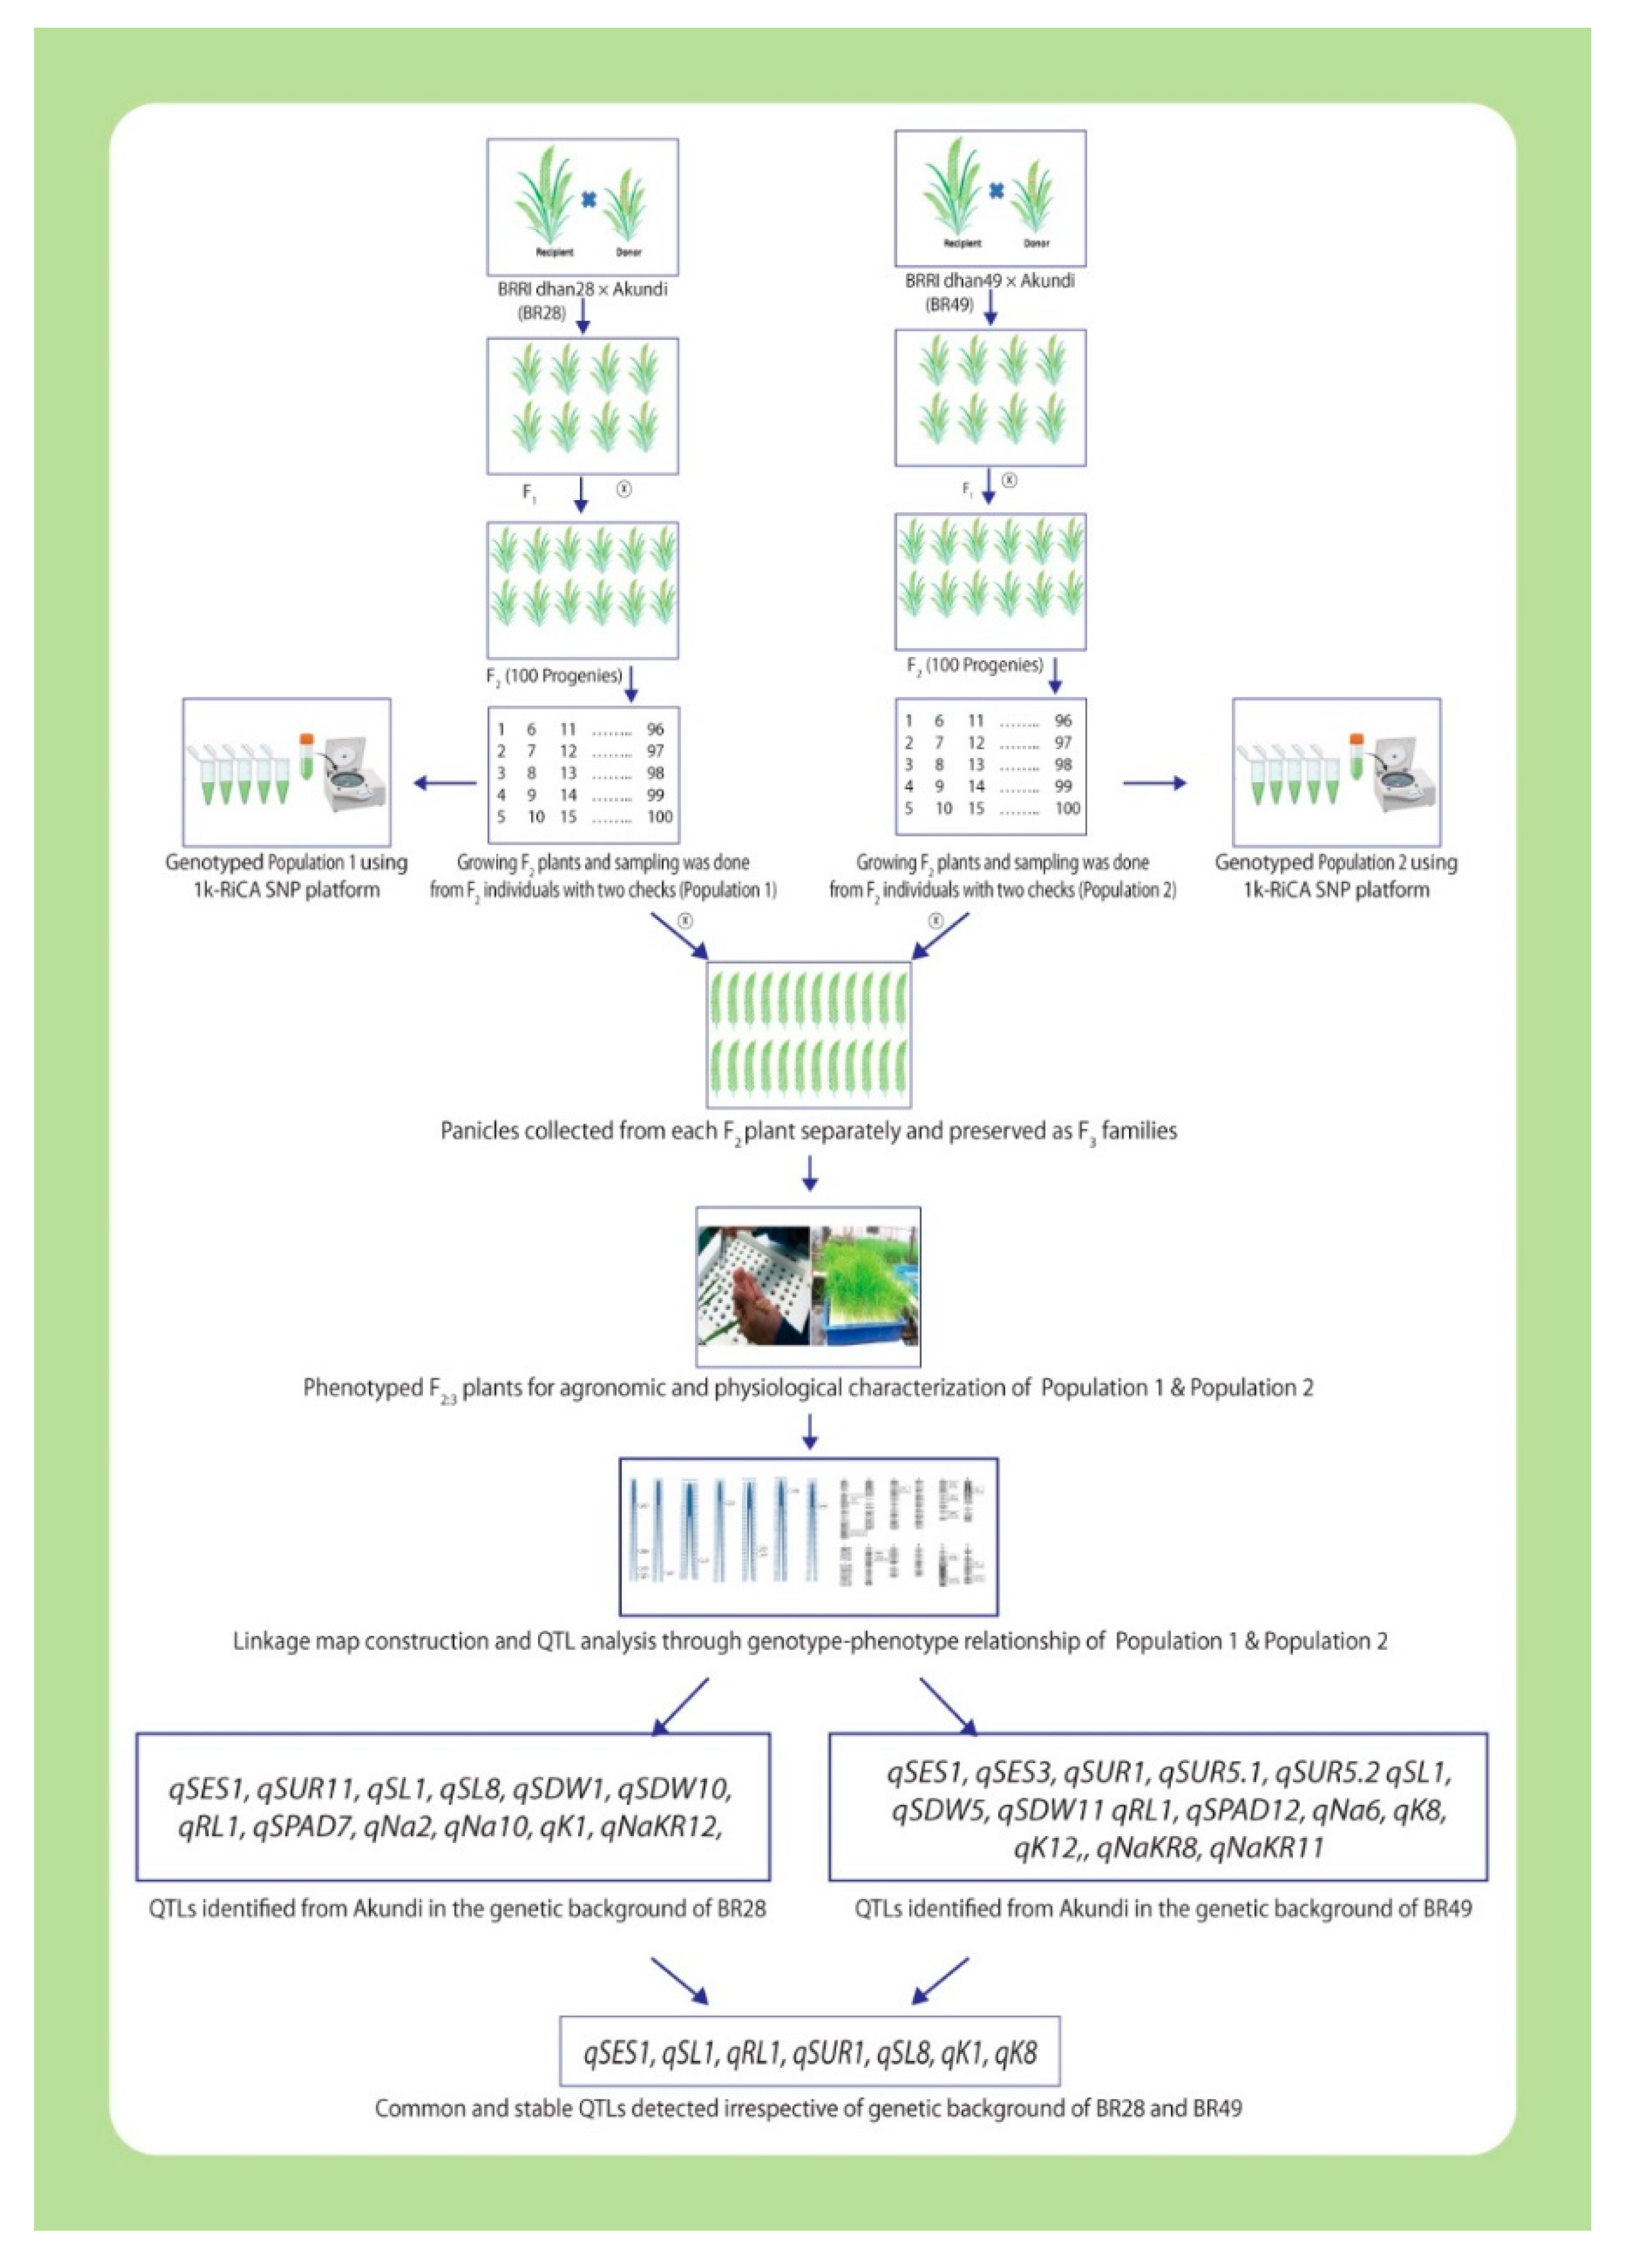
Schematic illustration for molecular mapping by 1k-RiCA SNP genotyping assay using two different bi-parental mapping populations to discover stable QTLs for salt resilience under salt-stress in rice (partly designed with BioRender.com, accessed on 28 August 2022).
Figure 6.
Schematic illustration for molecular mapping by 1k-RiCA SNP genotyping assay using two different bi-parental mapping populations to discover stable QTLs for salt resilience under salt-stress in rice (partly designed with BioRender.com, accessed on 28 August 2022).
3. Discussion
Previous reports to dissect molecular mechanisms for salinity tolerance at the early seedling stage were regularly used different salt-tolerant donors like Nona Bokra, Pokkali, Hasawi and Capsule. Limited attempts were made to find novel salt-tolerant germplasm, new QTL, and analyze digenic interaction for salinity tolerance. We used a Bangladeshi landrace Akundi as a donor in the present investigation. This landrace shows highly resilience to salt-stress, and it was collected from in the coastal hotspot saline areas of Bangladesh [12]. BRRI dhan28, a highly popular Boro mega rice cultivar (this popular rice cultivar is grown by farmers that cover at least one million hectares of land or more areas.) in Bangladesh was also used as parent which is sensitive to salt-stress. The current study reports 12 QTLs which were identified on seven different chromosomes controlling various component traits pertaining to salt tolerance. Multiple QTLs colocated and found on chromosome 1 (qSES1, qSL1, qSDW1, qRL1, qK1), on chromosome 10 (qSDW10, qNa10), and the other QTL loci are identified on chromosome 2 (qNa2), on chromosome 7 (qSPAD7), on chromosome 8 (qSL8), on chromosome 11 (qSUR11), and on chromosome 12 (qNaKR12) through the QGene and ICIM-ADD software [29,30]. Here 12 putative candidate genes were identified for these QTLs, where their position, the total number of locus and putative function also mentioned. This study also identified 28 significant epistasis interactions by using ICIM-EPI software. Seven QTLs such as qSES1, qSL1, qRL1, qSUR1, qSL8, qK8, qK1 were identified on chromosomes 1 and 8 detected using same donor Akundi but two different F2:3 mapping populations derived from BR28/Akundi and BR49/Akundi. These QTLs are stable and robust despite the different genetic backgrounds (Table 3).
3.1. Assessing the salt-stress responses in the selected F2:3 progenies with their parents and determining cause and effect relationship via path analysis
The leading traits were SES, SPAD value, Na+ and K+ concentration, Na+-K+ ratio, % survival rate, shoot length and root length and shoot biomass have a vital role in salt resilience. In this study, SES scores of the tolerant parent (Akundi) ranged from 3 to 4 with an average of 3.5, but in sensitive parent SES score was 6 to 8 with an average of 7. The Na+ concentration in the sensitive parent was almost more than 0.31 mmolg-1dwt whereas the tolerant parent had 0.18 mmolg-1dwt and Na+/K+ ratio was also higher in salt sensitive individuals and lower Na+/K+ ratio was observed in salt-tolerant progenies. If the amount of Na+ in the plant is high, water absorption is lower and plant growth is slowed down. This is because the plant cell's enzymatic connection is disrupted, which causes the plant to die early and reduces grain yield [5,9,34,35]. The tolerant plants had high percentage of survival (100%), but a lower percentage of survival (45%) found in the sensitive set. In this study, the tolerant set had a high shoot length of 57.2 cm, which ranged from 55.8 cm to 58.6 cm, while the sensitive set had a shorter shoot length of 28.0 cm. The tolerant set also had more shoot biomass (0.21g), while the sensitive set had less (0.08g), which strongly supports that higher biomass and shoot length accelerate the growth at the seedling stage, which lowers the Na+ concentration in the plant tissue [5,9,35].
The negative correlation was found among the SES score with K+ concentration, root length and SPAD value; shoot and root length with Na+ concentration; and Na+/K+ ratio with K+ concentration, survival, shoot length and root length. In salt-stress conditions, a large amount of Na+ accumulated in the plant tissue causes severe cell damage consequently early plant death observed and also grain yield reduction occurred [5,35]. The correlation between the different variables (traits) helps us in the selection of progenies in the plant breeding program [36]. The positive and significant association between SES score and Na+ concentration impacts the overall performance (phenotypic responses) as reported before [5].
On the basis of path analysis, the different independent salt tolerance traits such as Na+ concentration, K+ concentration and Na+/K+ ratio, survival, shoot length, shoot dry weight, root length, SPAD value contributed to the overall salt tolerance. So the total salt tolerance is the result of these eight traits and have some residual effect (R), which agreed with the previous reports [5,35]. In this study, path coefficient analysis revealed that % survival, Na+ concentration, K+ concentration and Na+/K+ ratio are the major traits to contribute salt tolerance because these variables jointly explain a major phenotypic variation. Many researchers also made similar observations [5,9,38]. This study is strongly supported by those researchers. So for the breeding program for developing salt tolerant cultivar, we need to select the promising advanced lines based on these four characters, and path coefficient can play a great role in stress breeding including breeding for salinity tolerance.
3.2. Marker segregation and important salt-tolerant QTL regions
A total of 12 QTLs were identified in the current study, those are tolerant to salt condition associated with agronomic and physiological traits. Five QTLs, qSES1, qSL1, qK1 on chromosome 1 and qSDW10 and qNa10 on chromosome 10 described over 65.6% and 32.6% of the combined phenotypic variations, respectively. Now focus should be placed on these QTLs for extensive analysis to find better insights regarding their vital roles in regulating salt tolerance via the physiological process [5]. In the recent study, seven common QTLs (qSES1, qSL1, qRL1, qSUR1, qSL8, qK8 and qK1) were reported both in QGene and ICIM-ADD software. So, these QTLs may be considered as main-effect QTLs in our study.
Multi-locus analysis shows that the pooled effect of major QTLs qSES1, qSL1, qK1 on chromosome 1 (pooled/combined PVE 65.6% of three QTL with R2 15.6%, 30.7% and 19.3% respectively) and similarly qSDW10 and qNa10 on chromosome 10 (combined PVE 32.6% with R2 17.1% and 15.5% respectively) when main QTL of these characters were considered simultaneously, their summation of single/individual effect is greater than their pooled effect. This is as a consequence of i) QTL co-localization or pleiotropy ii) Additive epistatic interaction among QTLs is high iii) Similar pathways/mechanisms are used for affecting this trait by some of the QTL.
3.3. Comparing the QTLs revealed in the present study with previously reported QTLs
The QTLs identified in the present study were checked with the previously reported QTLs from various studies. In the early vegetative (seedling) stage, a main QTL (Saltol) for salt-tolerance was detected which is located on chromosome 1 and had a large phenotypic variation (R2 of 39.0- 44.0%) from the traditional widely studied landrace Pokkali [39,40]. In addition, a main effect salt-tolerant gene (SKC1) responsible for maintaining K(+)/Na(+) ionic balance (homeostasis) in response to salt stress is reported on chromosome 1 during the early vegetative stage from the Nona Bokra [41]. The QTLs/genes such as Saltol (10.5-11.5 Mb; [39]), OsSalT [42], salT [43] and SKC1 (11.46 Mb; [41]) were not found in Akundi. Three new QTLs (qSES1, qSL1 and qK1) are co-located on chromosome 1, and two QTLs (qSDW10 and qNa10) were identified on chromosome 10 and position was 68.5 cM. So, these new QTLs are strongly responsible for tolerance to salt stress.
We summarized the salinity tolerant QTLs from the previous studies as compared with present investigation, the QTL position for this study is totally different from the other studies [5,35,44,45] (Supplementary Table S4). So from this comparison, the present study suggests that all of these QTLs did not locate in the same position of previously reported well-known QTLs/gene like Saltol [39], SKC1 [41], OsSalT [42]: a gene controlling salt-stress found on Saltol QTL region of rice, and salT (a cDNA clone) was reported as salt-stress induced protein changes in the roots of the salt-sensitive Oryza sativa, var. Indica, cv Taichung native 1 [43]. Therefore, the QTLs identified in this study are novel which could be used in rice breeding for enhancing salt tolerance.
Several QTLs had large effect, which are located on the chromosome 1, 8 and 10. One QTL (qSES1) for SES score where LOD is 3.4 and R2 (PVE) of 15.6% another QTLs are qSL1 (LOD =7.3, R2 =30.7%), qK1 (LOD = 4.3, R2 = 19.3%), qSDW10 (LOD = 3.6, R2 = 17.1%) and qNa10 (LOD = 3.3, R2 = 15.5%). These two sets (qSES1, qSL1, qK1 co-located on chromosome1 and qSDW10, qNa10 shared common location on chromosome 10) of QTLs are co-located and have a functional kinship. Thus, these main effect QTLs may have pleiotropic effects (number of traits impacted by same QTL) on other traits. The QTLs sharing a common region located on chromosome 1 and chromosome 10 for component salt-tolerance traits also supported that there is strong correlation among the traits.
From the above summary, the seven stable major QTLs were found from this study which might be potential targets for QTL stacking and marker-enabled selection. Here, 12 QTLs were reported as novel QTLs that might be used for further breeding programs in rice for enhancing salt resilience.
4. Materials and Methods
4.1. Parent selection
Akundi and BRRI dhan28 were chosen as parents to produce the bi-parental mapping population. Akundi is a Bangladesh-origin indica germplasm that shows salt tolerance at the early vegetative phase and was collected from southern coastal areas of Bangladesh. This region is rich in diverse salinity-tolerant germplasm. The agronomic features of Akundi such as i) plant height of ~155 cm, ii) it has moderate sensitivity to photoperiod, iii) produces robust seedlings with wide, long, and droopy leaves, iv) moderate tillering ability, and panicles are approximately 20-25 cm long. Usually, the grains are bold, and awnless, and their appearance is reddish-colored. v) it has a low yield potential (1.9–2.5 tha-1) and matures within 120–125 days of growth duration [12].
BRRI dhan28 is a common indica irrigated (boro) rice type with 90-95 cm in height, typically awnless, grains are medium slender; it matures in 140-145 days and gives yield 6.0-6.5 tha-1. BRRI dhan28 is a salt-stress sensitive variety at the vegetative stage, but photoperiod insensitive [17].
One F2:3 family derived from the cross of BRRI dhan28/Akundi was used in the present study for genetic dissection of traits linked with salinity tolerance.
The present investigation also compared genetic loci detected from two mapping populations derived from the cross of landrace Akundi with BRRI dhan49 [5] and BRRI dhan28/Akundi.
4.2. Growing conditions
The experiments were performed at the Bangladesh Rice Research Institute (BRRI; http://brri.gov.bd/), Gazipur 1701, Bangladesh, during the irrigated/ dry (Boro) season. Two parents (BRRI dhan28 and Akundi) were grown in three different sets. Seeds of the first set were sown on November 15, 2019, the second set was seeded with a 7-day interval from the first set and the third set was sown 7-days later to match flowering times for making successful cross through hybridization. The thirty-day-old single seedling was transplanted in a 5.0 m × 8 rows plot with a spacing of 20 × 20 cm. Fertilizer doses were 80, 60, 40, and 20 kg NPKS/ha, with nitrogen applied in three stages (40+20+20). The total amount of P, K, and S was utilized during the final plot/land preparation. Additional measures were taken as and when necessary. Eventually, the crossing was done in the net house of the Plant Breeding Division at the end of the season and F1 seeds were harvested ~ 25 days after pollination. The F1 plants were confirmed as a true hybrid using the 10-SNP panel. Then F2 seeds were harvested and collected with proper labeling, and then preserved from selected crosses. In the following rainfed lowland rice (RLR/wet) season, on July 7, 2020, F2 seeds were sown in the seedbed. Twenty days old single seedling of F2 individuals was transplanted in the field. After seedling establishment in the field, the leaf samples were collected for genotyping at 25 days after sowing. In 2021, the F2:3 seedlings were screened and phenotyped in hydroponics in a phytotron that was set at 30°C/22°C day/night temperature respectively and 65-70% relative humidity maintained. To initiate germination, seeds were oven dried for 3 days at 50°C, then surface sterilized using a fungicide (Vitavax-200, Syngenta) and washed with distilled water. Seeds were then placed in petri dishes lined with moistened filter paper and incubated at 30°C for 48 hours. Two pre-germinated seeds were sown per hole in 10 L plastic trays using styrofoam seedling floats floating in distilled water for three days, followed by Yoshida culture solution [18]. Salt stress was imposed 14 days after sowing by adding salt (NaCl) to the culture solution until an electrical conductivity of 12 dS m-1 was achieved. Sodium metasilicate 9 hydrate (4.5 mg L-1) was applied as a source of silicon to avoid the lodging of the plants. The culture solution was made acidic every day to prevent iron (Fe) deficiency by maintaining a pH of 5.0 and replaced the culture solution at every seven days interval.
4.3. Characterizing agronomic traits
For describing specific morphological and physiological features, 92 F2:3 plants were characterized that developed from a cross between BRRI dhan28 and Akundi. The seedling salt stress injury symptoms were phenotypically assessed using SES scores [19], with a magnitude of one indicating highly tolerance to salt stress and a score of 9 suggesting highly sensitive genotypes. Sampling was done from individual plants 21 days after salinization, dried them for 3 days at 70°C, and then the dried samples were weighed. Sodium - potassium concentrations were then measured [10,12,20,21]. Survivors were recorded at three weeks after applying salt stress, and the survival rate (%) was calculated using the number of seedlings during the initiation of the salt treatment. The shoot length was estimated by measuring the distance between the stem base and the tip of the longest leaf. The individual plant was harvested including all plant components and the root. All samples were oven dried for three days at 70°C before being weighed them. The root length was determined from the base of the stem to the top of the longest root.
4.4. Determining physiological traits response
The individual plant was taken from different F2:3 families and washed three times using deionized water prior to drying. Each plant was sun-dried for three days before drying further at 50°C in an oven for three days. After drying, the plant material was ground and weighted and about 0.50 g powdered sample was kept in a test tube where 25 ml 1N HCl was poured before. The digested samples were filtered after 24 hours of digestion in 1N HCl. The one ml extract was then diluted by adding 39 ml 1N HCL. Then, a reference solution was prepared, and a flame photometer (Model410) was used to analyze sodium and potassium concentrations [18].
4.5. SPAD reading
The chlorophyll content was estimated from five entirely expanded third leaves selected from each replicate using a SPAD meter (Minolta 502, Japan). The leaves chlorophyll content was determined using a non-destructive method before harvesting.
4.6. Analyzing trait associations (correlation)
A total of 92 F2:3 individuals were carefully chosen for this investigation from the cross of BRRI dhan28/Akundi. The strength of relationship measures through correlation coefficients comprising different characters was assessed using the RStudio 4.1.1 software [22].
4.7. Path coefficient analysis
4.8. SNP genotyping and genetic linkage map construction
Leaf samples of three-week-old plants were collected for DNA extraction from 92 F2 individuals derived from the cross combination of BRRI dhan28/Akundi. Then leaf samples were preserved at an extremely low temperature of -80°C for 1k-RiCA genotyping. The 1k-RiCA (1K Rice Custom Amplicon) assay was constructed on Illumina’s TruSeq Custom Amplicon (TSCA) 384 Index Kit technology (https://www.illumina.com) using Illumina’s registered workflow [25]. During sample preparation, each leaf sample was perforated into a small piece and placed into a specific well of 96 well plate based on the exact sequence of a sample. Only one PCR well plate was needed for keeping 92 individual samples. Then the sample plate was put into an oven for drying samples at 50°C for 24 hours and bundled in a zipper bag. Finally, the oven-dried 92 samples were sent for 1k-RiCA SNP assay for the whole genome genotyping using 945 SNP markers through genotyping by sequencing technique. 1k-RiCA SNP assay was done at the Agriplex genomics, Cedar Avenue, Suite 250, Cleveland, 011444106, USA. The 945 markers' molecular linkage map was constructed using the Nipponbare genome sequence (www.gramene.org), and the SNP marker physical distances were calculated by multiplying the megabase pair (Mb) positions by 3.924 to get a corresponding estimate of centiMorgan (cM; 1 cM = ~ 244 kb [26]).
4.9. QTL dissection
Molecular marker assay and genetic mapping were done on the 92 F2 individuals selected from the cross BRRI dhan28/Akundi. These plants were genotyped using 886 SNP markers, and 886 bin markers with genome-wide coverage of the BRRI dhan28/Akundi population were employed to build a genetic linkage map. The genetic map is spanned by 1.72 cM on the average distance between two SNPs. To estimate the association between specific SNP marker loci and phenotypic traits linked with salinity tolerance, QTL dissection was carried out using QGene 4.0 [27] and the ICIM-ADD method (QTL IciMapping Version 4.2 software; [28,29,30]). Single marker regression (SMR) analysis, interval mapping (IM), and composite interval mapping (CIM) were applied to detect the position of the revealed QTL for salinity tolerance. The minimum LOD value is estimated to declare a QTL significant. QTLs were determined by the CIM method using permutation analysis at 1000 iterations [31]. The value of R2 (PVE: phenotypic variation explained by the QTL) was calculated as the portion of the total PVE by each QTL. The forward cofactor selection method was used for the QTL detection in the CIM method using QGene. The additive effects and contributor of favorable allele/QTL for each trait of interest were calculated.
4.10. Epistatic QTLs identification
Epistatic QTLs were identified using epistasis mapping method ICIM-Epi [32] using current population. Then a two-dimensional scanning (or interval mapping) was performed to detect significant epistatic QTLs using the multiple regression model. The LOD threshold for epistasis mapping was 5.0. Three possible digenic epistasis can be identified i) QTL vs QTL (both QTLs may have additive effects), ii) QTL vs background loci, iii) between complementary loci (background loci vs background loci).
5. Conclusions
Salinity tolerance is the complex abiotic stress which is controlled by multigenes. Here, the contribution of traits for salt tolerance was assessed through correlation and path analysis. The results suggested that if Na+ concentration and Na+/K+ ratio increased in the plant tissue, then the early death of rice occurs. So % survival rate, Na+ concentration, K+ concentration, Na+/K+ ratio is the key mechanism in the plant tissue at the seedling stage. The present investigation reported two biparental mapping populations developed from the cross of Bangladeshi landrace Akundi with two sensitive parents BRRI dhan28 and BRRI dhan49. The study detected seven large effect QTLs for salt tolerance across the populations. Here, 12 QTLs were identified by single markers regression, interval mapping, and composite interval mapping method by the QGene and ICIM-ADD software. The QTLs identified on chromosome 1 (qSES1, qSL1, qSDW1, qRL1, qK1); 2(qNa2); 7(qSPAD7); 8(qSL8); 10 (qSDW10, qNa10); 11 (qSUR11); 12 (qNaKR12) that all are novel because here these QTLs does not match with other QTLs, which is previously identified. In this study, five major QTLs (qSES1, qSL1, qK1, qSDW10 and qNa10) were identified and they have a major-effect on salt tolerance. Seven QTLs (qSES1, qSL1, qRL1, qSUR1, qSL8, qK8, qK1) were found stable in the different genetic backgrounds (genetic background independent) that are co-existed on chromosomes 1 and 8 detected from the same donor Akundi using two different F2:3 mapping populations derived from BR28/Akundi and BR49/Akundi. These stable QTLs may be important for pyramiding and marker-enabled selection in future breeding programs and will validate the introgression of these QTL regions into advanced breeding lines that developed from both studies. These QTLs will help to develop rice cultivars that can withstand salt stress. These will be good targets for extensive study through QTL fine mapping and QTL deployment for salt tolerance breeding.
Supplementary Materials
The following supporting information can be downloaded at the website of this paper posted on Preprints.org, Supplementary Table1: title; List of SNP markers (SNP ID) used in the QTL analysis. Supplementary Table2: title; Putative candidate genes in the QTL regions sho wing probable functions and references. Supplementary Table3: title; Epistatic gene interaction for the traits related to seedling stage salinity tolerance in a F2:3 population derived from the cross BR 28/ Akundi. Supplementary Table S4: title; Comparisons of the QTL regions identified in this study for salinity tolerance at seedling stage, with previously mapped QTLs from different populations and for different growth stages.
Author Contributions
MAR conceived the project. MAR and SM designed the experiment. SM, MAR and HK developed the mapping population. SM and MAR performed the experiment. SM, MAR, HK and SA analyzed data and wrote the manuscript. MAR and MH supervised the research. MH, MAR, MGR, AHM and KMI edited the manuscript. All authors read and approved the manuscript.
Funding
The work is supported by NATP-PIU, Bangladesh Agricultural Research Council (BARC), Dhaka and Bangladesh Rice Research Institute (BRRI), Gazipur and TRB-BRRI Project funded by Bill and Melinda Gates Foundation (BMGF).
Institutional Review Board Statement
Not applicable.
Informed Consent Statement
Not applicable.
Data Availability Statement
Not applicable.
Acknowledgments
The authors gratefully acknowledge the Project Implementation Unit, National Agricultural Technology Program-Phase II Project (NATP-2), Bangladesh Agricultural Research Council (BARC), Ministry of Agriculture, Bangladesh and TRB-BRRI Project funded by Bill and Melinda Gates Foundation (BMGF) for funding the research. We show our heartfelt thanks to Md. Solaiman Hossain, Scientific Officer, Belal Hossain, Senior Scientific Officer and Md. Sazzadur Rahman, Principal Scientific Officer of Bangladesh Rice Research Institute for their kind support during data analysis and the formatting of the manuscript.
Conflicts of Interest
The authors declare no conflict of interest.
References
- Hossain, M.S.; Ali, M.A.; Khan, M.A.I.; Maniruzzaman, S. (2020). Prevalence and Transmission of Fusarium moniliforme: A Seed Borne Pathogen of Rice. Bangladesh Rice J. 24, 11–19. [CrossRef]
- Hossain, M. S., Ivy, N. A., Maniruzzaman, S., Raihan, M. S., Ruma, A. S., Akter, A., ... & Kabir, K. F. (2023). Genetic Variability of Floral and Agronomic Characteristics that Influence Outcrossing Rate Percentage of Cytoplasmic Male Sterile Rice. Asian Journal of Advances in Agricultural Research, 22(1), 46-57. [CrossRef]
- Maniruzzaman, S.; Hossain, M.; Ahmed, H. U., Hossain, M., Jahan, G. S., Kundu, P. K., & Haque, M. M. (2023). Development of Rice Varieties for Stress-Prone Tidal Ecosystem of Bangladesh. Middle-East Journal of Scientific Research, 31(1), 22-31. [CrossRef]
- Xu, R.; Yang, Y.; Qin, R.; Li, H.; Qiu, C.; Li, L.; Wei, P.; & Yang, J. (2016) Rapid improvement of grain weight via highly efficient CRISPR/Cas9-mediated multiplex genome editing in rice. J Genet Genomics 43:529–532. [CrossRef]
- Maniruzzaman, S., Rahman, M. A., Hasan, M., Rasul, M. G., Molla, A. H., Khatun, H., & Akter, S. (2022). Genetic Mapping to Detect Stringent QTLs Using 1k-RiCA SNP Genotyping Platform from the New Landrace Associated with Salt Tolerance at the Seedling Stage in Rice. Plants, 11(11), 1409. [CrossRef]
- Islam, F., Wang, J., Farooq, M. A., Yang, C., Jan, M., Mwamba, T. M., ... & Zhou, W. (2019). Rice responses and tolerance to salt stress: deciphering the physiological and molecular mechanisms of salinity adaptation. In Advances in rice research for abiotic stress tolerance (pp. 791-819). Woodhead Publishing. [CrossRef]
- -Tamimi, N., Brien, C., Oakey, H., Berger, B., Saade, S., Ho, Y. S., ... & Negrão, S. (2016). Salinity tolerance loci revealed in rice using high-throughput non-invasive phenotyping. Nature communications, 7(1), 1-11. [CrossRef]
- Rasel, M., Tahjib-Ul-Arif, M., Hossain, M. A., Hassan, L., Farzana, S., & Brestic, M. (2021). Screening of salt-tolerant rice landraces by seedling stage phenotyping and dissecting biochemical determinants of tolerance mechanism. Journal of Plant Growth Regulation, 40(5), 1853-1868. [CrossRef]
- Rahman, M. A., Thomson, M. J., De Ocampo, M., Egdane, J. A., Salam, M. A., & Ismail, A. M. (2019). Assessing trait contribution and mapping novel QTL for salinity tolerance using the Bangladeshi rice landrace Capsule. Rice, 12(1), 1-18. [CrossRef]
- Hossain, H., Rahman, M. A., Alam, M. S., & Singh, R. K. (2015). Mapping of quantitative trait loci associated with reproductive-stage salt tolerance in rice. Journal of Agronomy and Crop Science, 201(1), 17-31. [CrossRef]
- Nayyeripasand, L., Garoosi, G. A., & Ahmadikhah, A. (2021). Genome-wide association study (GWAS) to identify salt-tolerance QTLs carrying novel candidate genes in rice during early vegetative stage. Rice, 14(1), 1-21. [CrossRef]
- Rahman, M. A., Thomson, M. J., Shah-E-Alam, M., de Ocampo, M., Egdane, J., & Ismail, A. M. (2016). Exploring novel genetic sources of salinity tolerance in rice through molecular and physiological characterization. Annals of botany, 117(6), 1083-1097. [CrossRef]
- de Souza Freitas, W. E., de Oliveira, A. B., Mesquita, R. O., de Carvalho, H. H., Prisco, J. T., & Gomes-Filho, E. (2019). Sulfur-induced salinity tolerance in lettuce is due to a better P and K uptake, lower Na/K ratio and an efficient antioxidative defense system. Scientia Horticulturae, 257, 108764. [CrossRef]
- Singh, R.K., Kota, S.; & Flowers, T.J. (2021). Salt tolerance in rice: seedling and reproductive stage QTL mapping come of age. Theor Appl Genet 134, 3495–3533. [CrossRef]
- Mackay, T. F., & Huang, W. (2018). Charting the genotype–phenotype map: lessons from the Drosophila melanogaster Genetic Reference Panel. Wiley Interdisciplinary Reviews: Developmental Biology, 7(1), e289. [CrossRef]
- Rahman M.A., Khatun H., Sarker M.R.A., Hossain H., Quddus M.R., Iftekharuddaula K.M.; & Kabir, M. S. (2021). Enhancing abiotic stress tolerance to develop climate-smart rice using holistic breeding approach. Cereal Grains - Volume 2. [CrossRef]
- BRRI.(2020). Adhunik dhaner chash (23th edition), Bangladesh Rice Research Institute, Gazipur-1701, Bangladesh.
- Yoshida, S. Forno, D. A., & Cock, J. H. (1976). Laboratory manual for physiological studies of rice. Laboratory manual for physiological studies of rice.
- IRRI (2014). Standard evaluation system for rice (SES), 5th edn. Los Banos, International Rice Research Institute, p 57.
- Flowers, T. J., & Yeo, A. R. (1981). Variability in the resistance of sodium chloride salinity within rice (Oryza sativa L.) varieties. New Phytologist, 88(2), 363-373. 10.1111/j.1469-8137.1981.tb01731.x.
- Moradi, F., & Ismail, A. M. (2007). Responses of photosynthesis, chlorophyll fluorescence and ROS-scavenging systems to salt stress during seedling and reproductive stages in rice. Annals of botany, 99(6), 1161-1173. 10.1093/aob/mcm052.
- RStudio Team (2020). RStudio: Integrated Development for R. RStudio, PBC, Boston, MA URL http://www.rstudio.com/.
- Wright, S. (1922). Coefficients of inbreeding and relationship. The American Naturalist, 56(645), 330-338. [CrossRef]
- Dewey, D. R., & Lu, K. (1959). A correlation and path-coefficient analysis of components of crested wheatgrass seed production 1. Agronomy journal, 51(9), 515-518. [CrossRef]
- Arbelaez, J.D., Dwiyanti, M.S., & Tandayu, E. (2019) 1k-RiCA (1K-Rice Custom Amplicon) a novel genotyping amplicon-based SNP assay for genetics and breeding applications in rice. Rice 12, 55. [CrossRef]
- Chen, M.; Presting, G.; Barbazuk, W.B.; Goicoechea, J.L.; Blackmon, B.; Fang, G.; Kim, H.; Frisch, D.; Yu, Y.; Sun, S.; et al. (2002) An integrated physical and genetic map of the Rice genome. Plant Cell 14:537–545. [CrossRef]
- Joehanes, R., & Nelson, J. C. (2008). QGene 4.0, an extensible Java QTL-analysis platform. Bioinformatics, 24(23), 2788-2789. [CrossRef]
- Meng, L., Li, H., Zhang, L., & Wang, J. (2015). QTL IciMapping: Integrated software for genetic linkage map construction and quantitative trait locus mapping in biparental populations. Crop Journal. 3(3), 269-283. [CrossRef]
- Li, H., Ye, G., & Wang, J. (2007). A modified algorithm for the improvement of composite interval mapping. Genetics 175, 361-374. [CrossRef]
- Zhang, L., Li, H., Li, Z., & Wang, J. (2008). Interactions between markers can be caused by the dominance effect of quantitative trait loci. Genetics 180(2), 1177-1190. [CrossRef]
- Churchill, G.A.; & Doerge, R.W. (1994). Empirical threshold values for quantitative trait mapping. Genetics 138, 963–971. [CrossRef]
- Li, H., Ribaut, J.-M., Li, Z., & Wang, J. (2008a). Inclusive composite interval mapping (ICIM) for digenic epistasis of quantitative traits in biparental populations. Theor. Appl. Genet. 116(2), 243-260. [CrossRef]
- Kosambi, D.D. (1944). The estimation of map distance from recombination values. Ann. Eugen. 12, 172–175. [CrossRef]
- Rahman, M. A., Bimpong, I. K., Bizimana, J. B., Pascual, E. D., Arceta, M., Swamy, B. P., ... & Singh, R. K. (2017). Mapping QTLs using a novel source of salinity tolerance from Hasawi and their interaction with environments in rice. Rice, 10(1), 1-17. [CrossRef]
- Nakhla, W. R., Sun, W., Fan, K., Yang, K., Zhang, C., & Yu, S. (2021). Identification of QTLs for salt tolerance at the germination and seedling stages in rice. Plants, 10(3), 428. [CrossRef]
- Debsharma, S. K., Syed, M., Ali, M., Maniruzzaman, S., Roy, P. R., Brestic, M., ... & Hossain, A. (2023). Harnessing on Genetic Variability and Diversity of Rice (Oryza sativa L.) Genotypes Based on Quantitative and Qualitative Traits for Desirable Crossing Materials. Genes, 14(1), 10. [CrossRef]
- Hossain, M.; Ivy, N.; Raihan, M.; Kayesh, E.; & Maniruzzaman, S. (2020). Genetic Variability, Correlation and Path Analysis of Floral, Yield and its Component Traits of Maintainer Lines of Rice (Oryza sativa L.). Bangladesh Rice Journal. 24, 1–9. [CrossRef]
- Rajasekar, R., Jeyaprakash, P., Manonmani, K., Nithila, S., & Thirumurugan, T. (2021). Trait relationship and path analysis under sodicity in Nagina 22 rice mutants. Electronic Journal of Plant Breeding, 12(3), 963-968.
- Thomson, M. J., de Ocampo, M., Egdane, J., Rahman, M. A., Sajise, A. G., Adorada, D. L., ... & Ismail, A. M. (2010). Characterizing the Saltol quantitative trait locus for salinity tolerance in rice. Rice, 3(2), 148-160. [CrossRef]
- Manohara, K. K., Morajkar, S., Shanbhag, Y., Phadte, P., & Singh, N. K. (2021). Haplotype analysis of Saltol QTL region in diverse landraces, wild rice and introgression lines of rice (Oryza sativa L.). Plant Genetic Resources, 19(4), 289-298. [CrossRef]
- Ren, Z.H.; Gao, J.P.; Li, L.G.; Cai, X.L.; Huang, W.; & Chao, D.Y. (2005). A rice quantitative trait locus for salt tolerance encodes a sodium transporter. Nature Genetics 37: 1141–1146. [CrossRef]
- Kaur, N.; Prashanth, K.V.H.; Bhatti, M.S.; & Pati, P.K. (2022). OsSalT gene cloned from rice provides evidence of its role in salinity and drought stress tolerance. Plant Science, 320, 111306. [CrossRef]
- Claes, B.; Dekeyser, R.; Villaroel, R.; Van den Bulcke, M.; Bauw, G. M.V.; Montagu, & Caplan, A. (1990). Characterization of rice gene showing organ specific expression in response to salt stress and drought. Plant Cell 2: 19-27. [CrossRef]
- Jahan, N. , Zhang, Y. U., Lv, Y., Song, M., Zhao, C., Hu, H., ... & Guo, L. (2020). QTL analysis for rice salinity tolerance and fine mapping of a candidate locus qSL7 for shoot length under salt stress. Plant Growth Regulation, 90(2), 307-319. [CrossRef]
- O’Connor, K. , Hayes, B., Hardner, C., Nock, C., Baten, A., Alam, M., ... & Topp, B. (2020). Genome-wide association studies for yield component traits in a macadamia breeding population. BMC genomics, 21(1), 1-12. [CrossRef]
Figure 1.
Histogram shows frequency distribution (no. of individuals) of the F2:3 populations for different traits related to salinity tolerance during the early seedling stage; a) Salt injury score (SES score) b) Survival rate (%) c) Shoot length (cm) d) Shoot dry weight (g) e) Root length (cm), f) SPAD value g) Sodium concentration (Na-Conc.) h) Potassium concentration (K-Conc.) i) Na+/K+ ratio. Dotted and solid arrows on rectangle show the trait value of the salt-tolerant and sensitive parent Akundi and BR28, respectively.
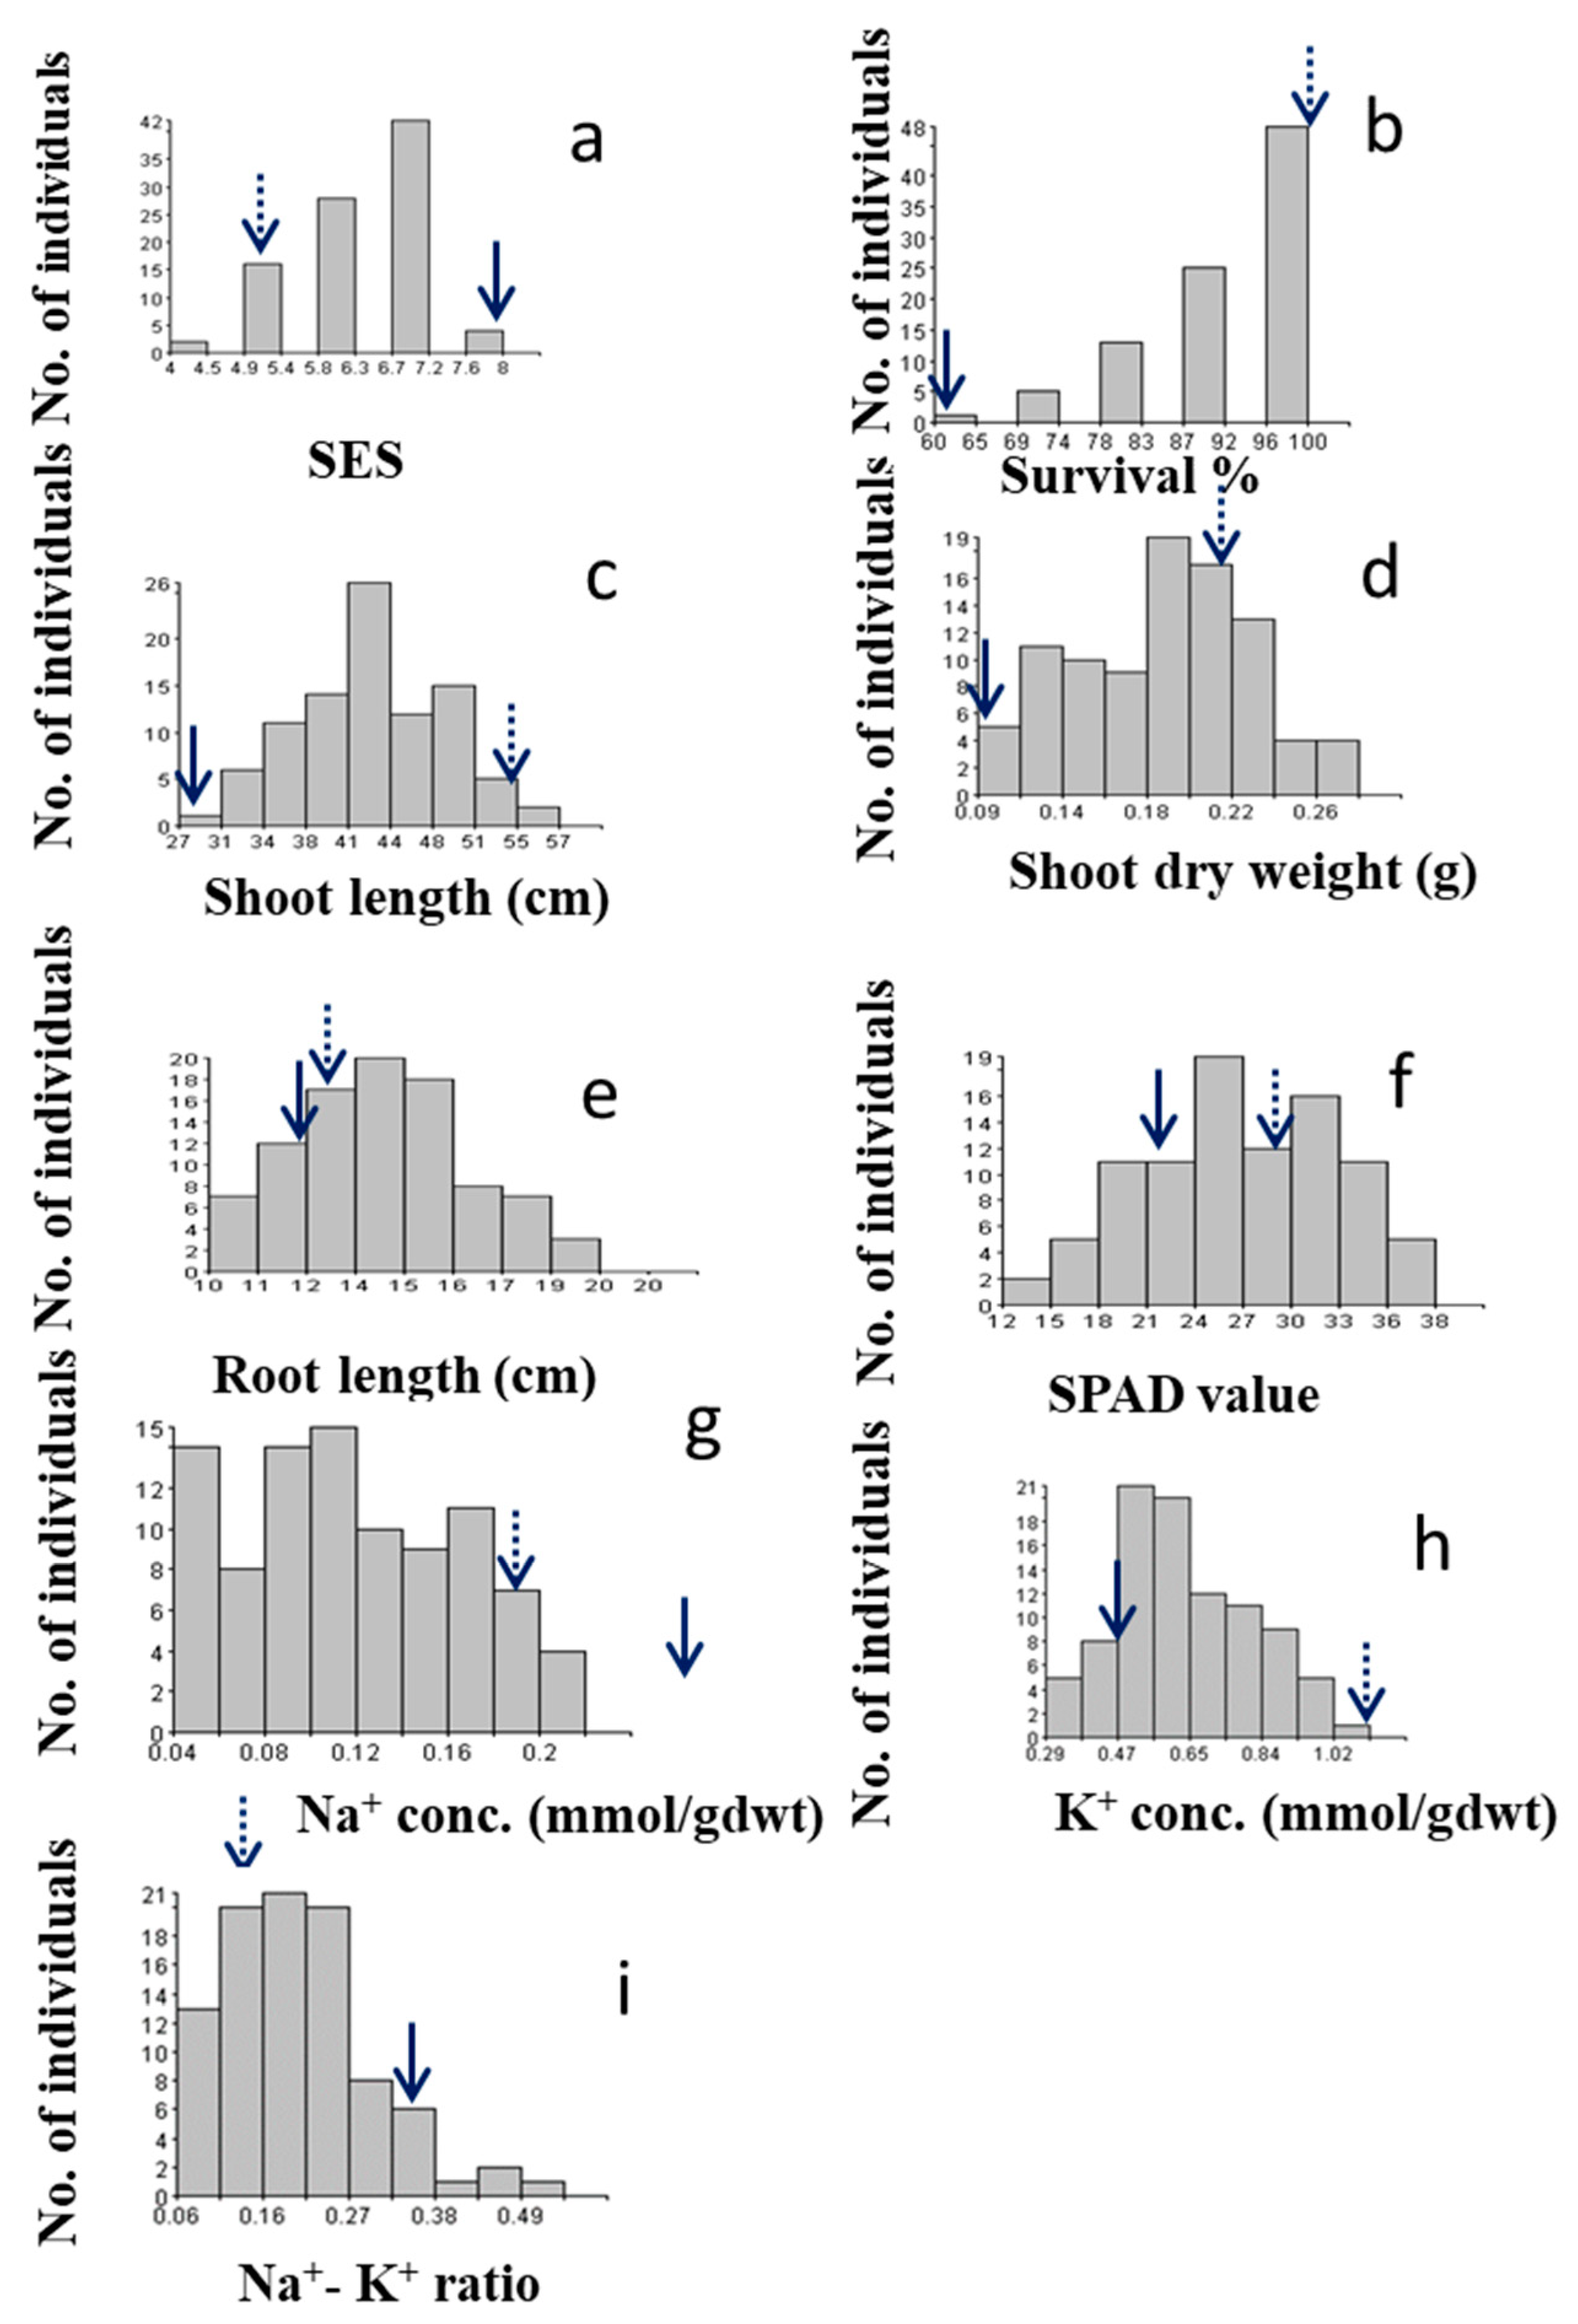
Figure 2.
Strength of the relationship among different component traits associated with salinity tolerance was measured using correlation analysis in an F2:3 population developed from a cross BR28 (sensitive to salt-stress)/ Akundi (salt tolerant) at the seedling stage. Conc.: Concentration.
Figure 2.
Strength of the relationship among different component traits associated with salinity tolerance was measured using correlation analysis in an F2:3 population developed from a cross BR28 (sensitive to salt-stress)/ Akundi (salt tolerant) at the seedling stage. Conc.: Concentration.
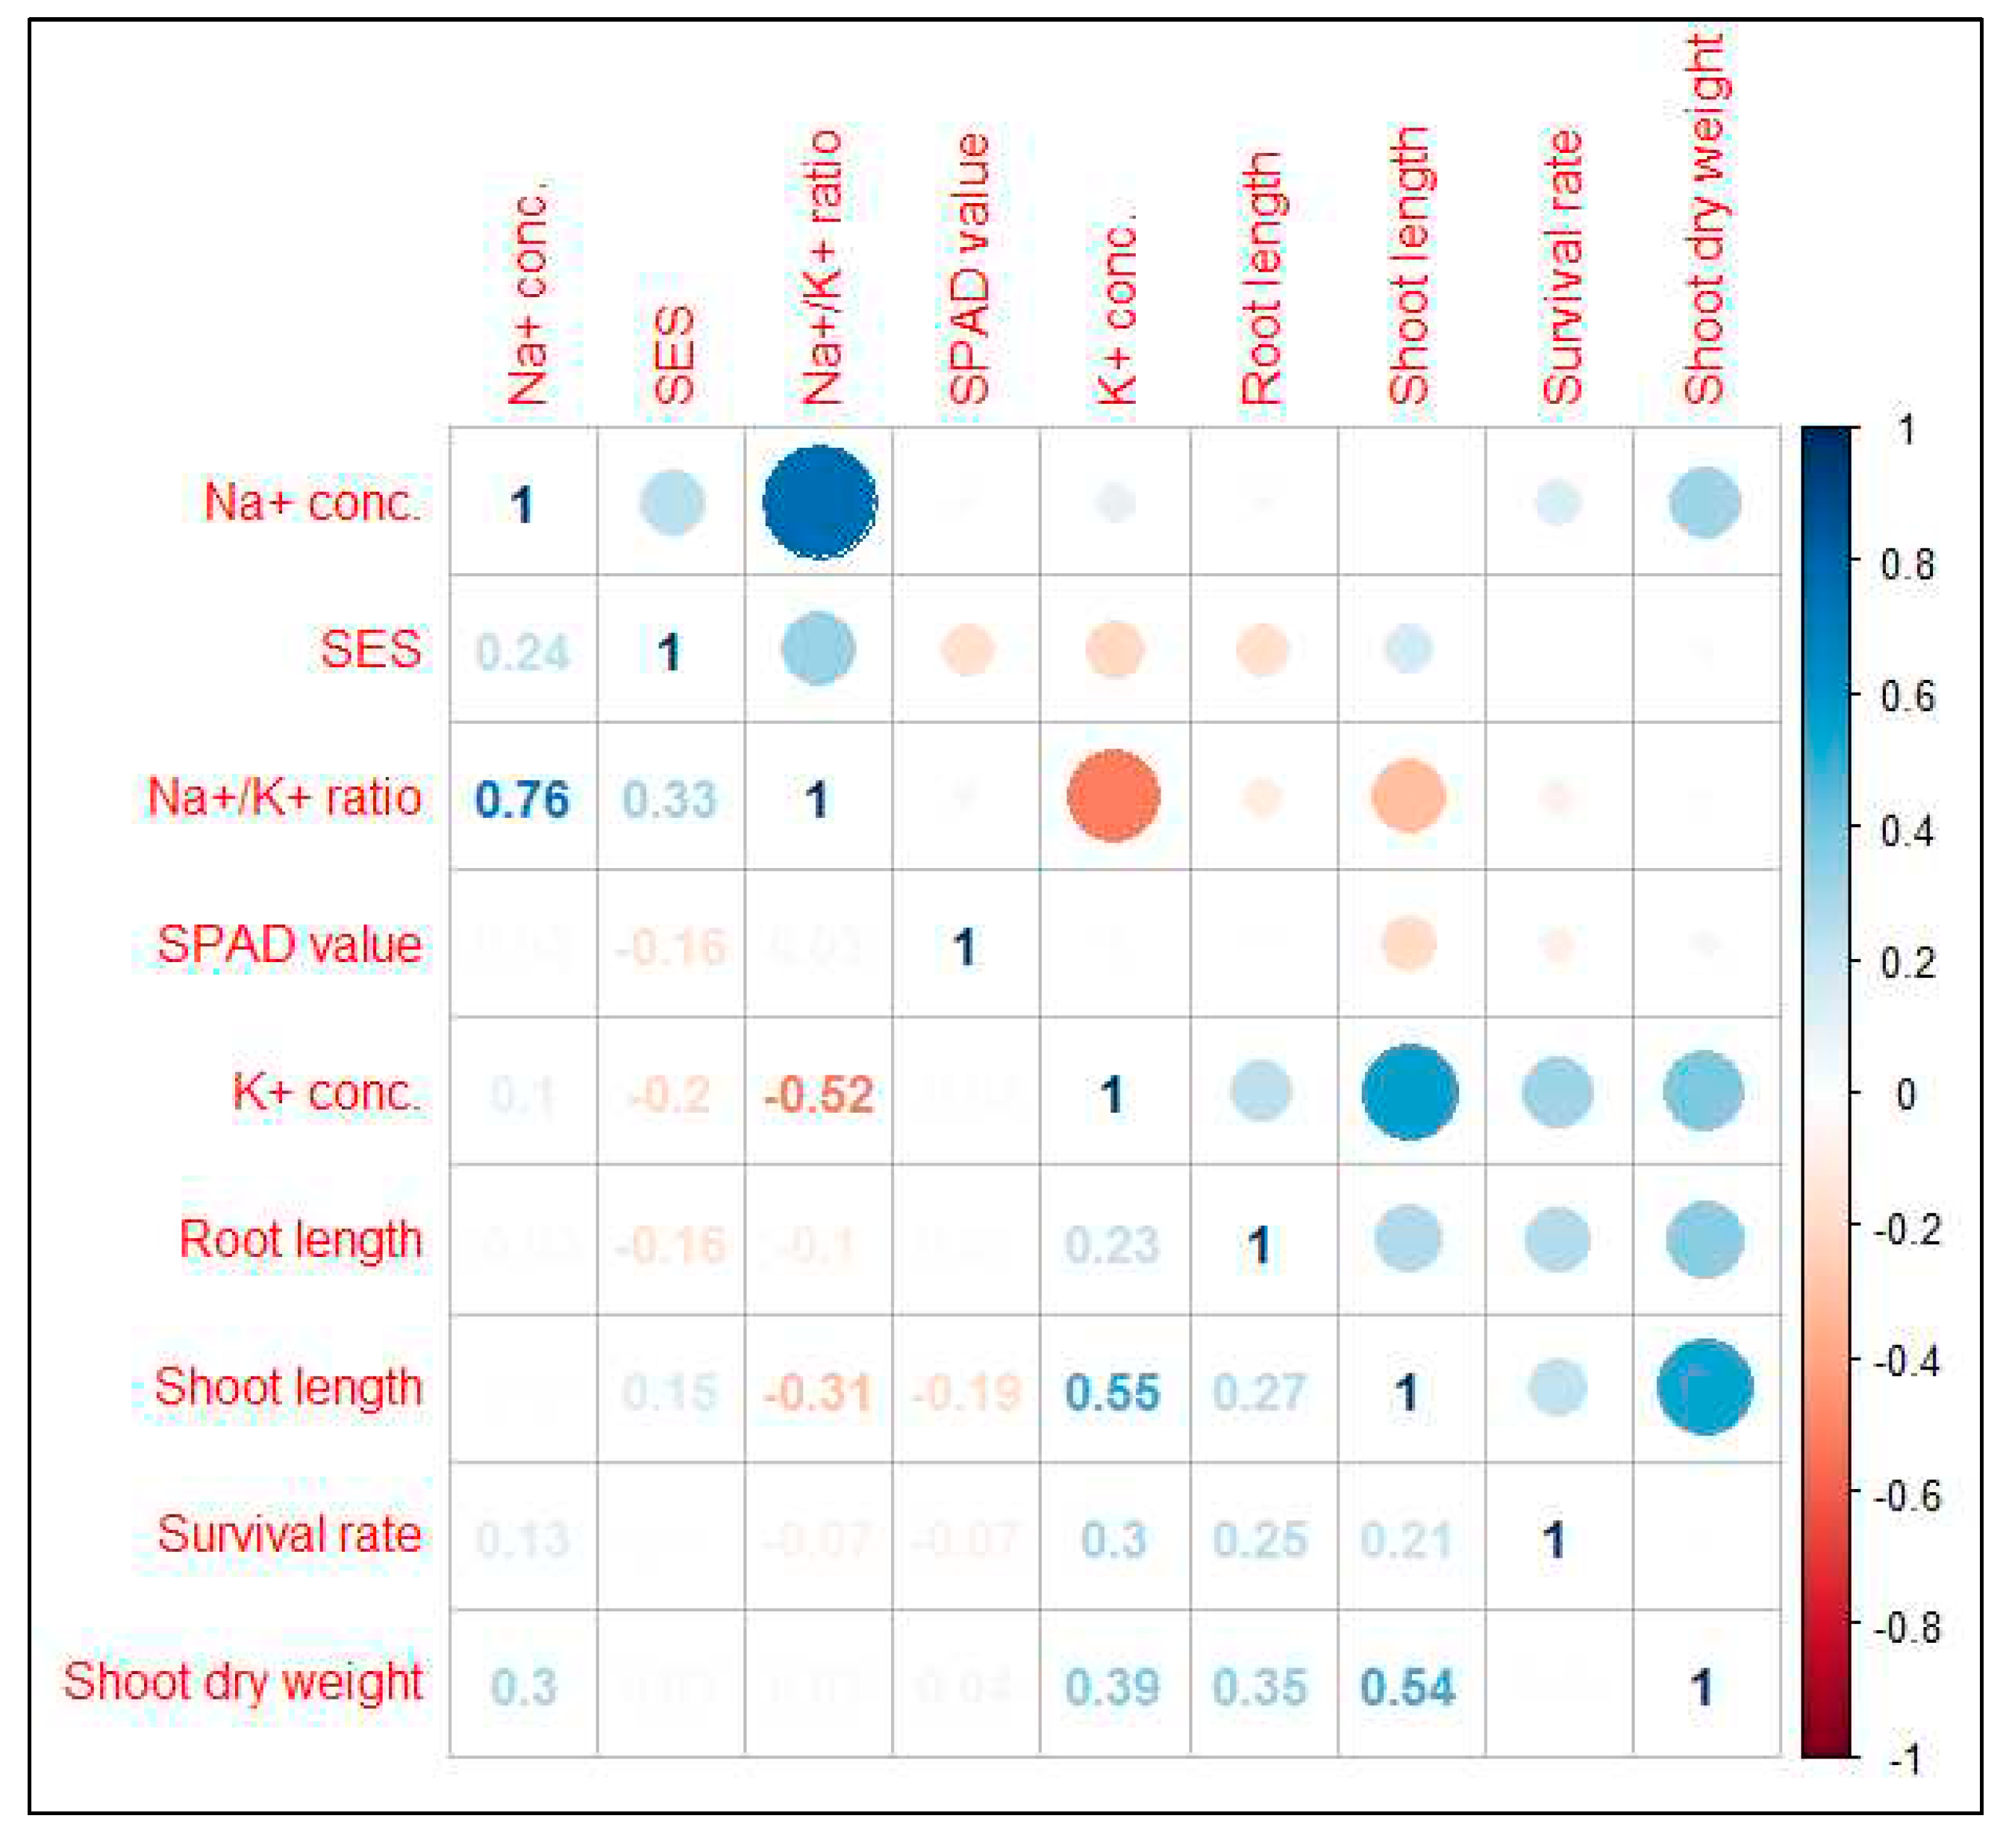
Figure 3.
A molecular marker-based linkage map of Oryza sativa L. rice F2:3 population generated from a cross between BR28 and Akundi with the help of QTL IciMapping Version 4.2 software. A total of 886 SNP markers were assigned to detect 12 QTLs on seven linkage groups under salinity stress of EC 12 dSm-1 at the seedling stage of rice. The designation of the SNP IDs is illustrated at the right, and the elliptical boxes adjacent to SNP markers denote the approximate positions of the detected 12 QTLs for salt tolerance in BR28/Akundi population. QTLs which are shown in rectangular boxes indicating stable and common QTLs (qSES1, qSL1, qRL1, qK1 and qSL8; see Table 3) observed in both BR28/Akundi and BR49/Akundi populations. However, qK8 (from BR49/Akundi population) share similar position with qSL8 (from BR28/Akundi population) and qSUR1 (BR49/Akundi population) located close to qRL1 (BR28/Akundi population).
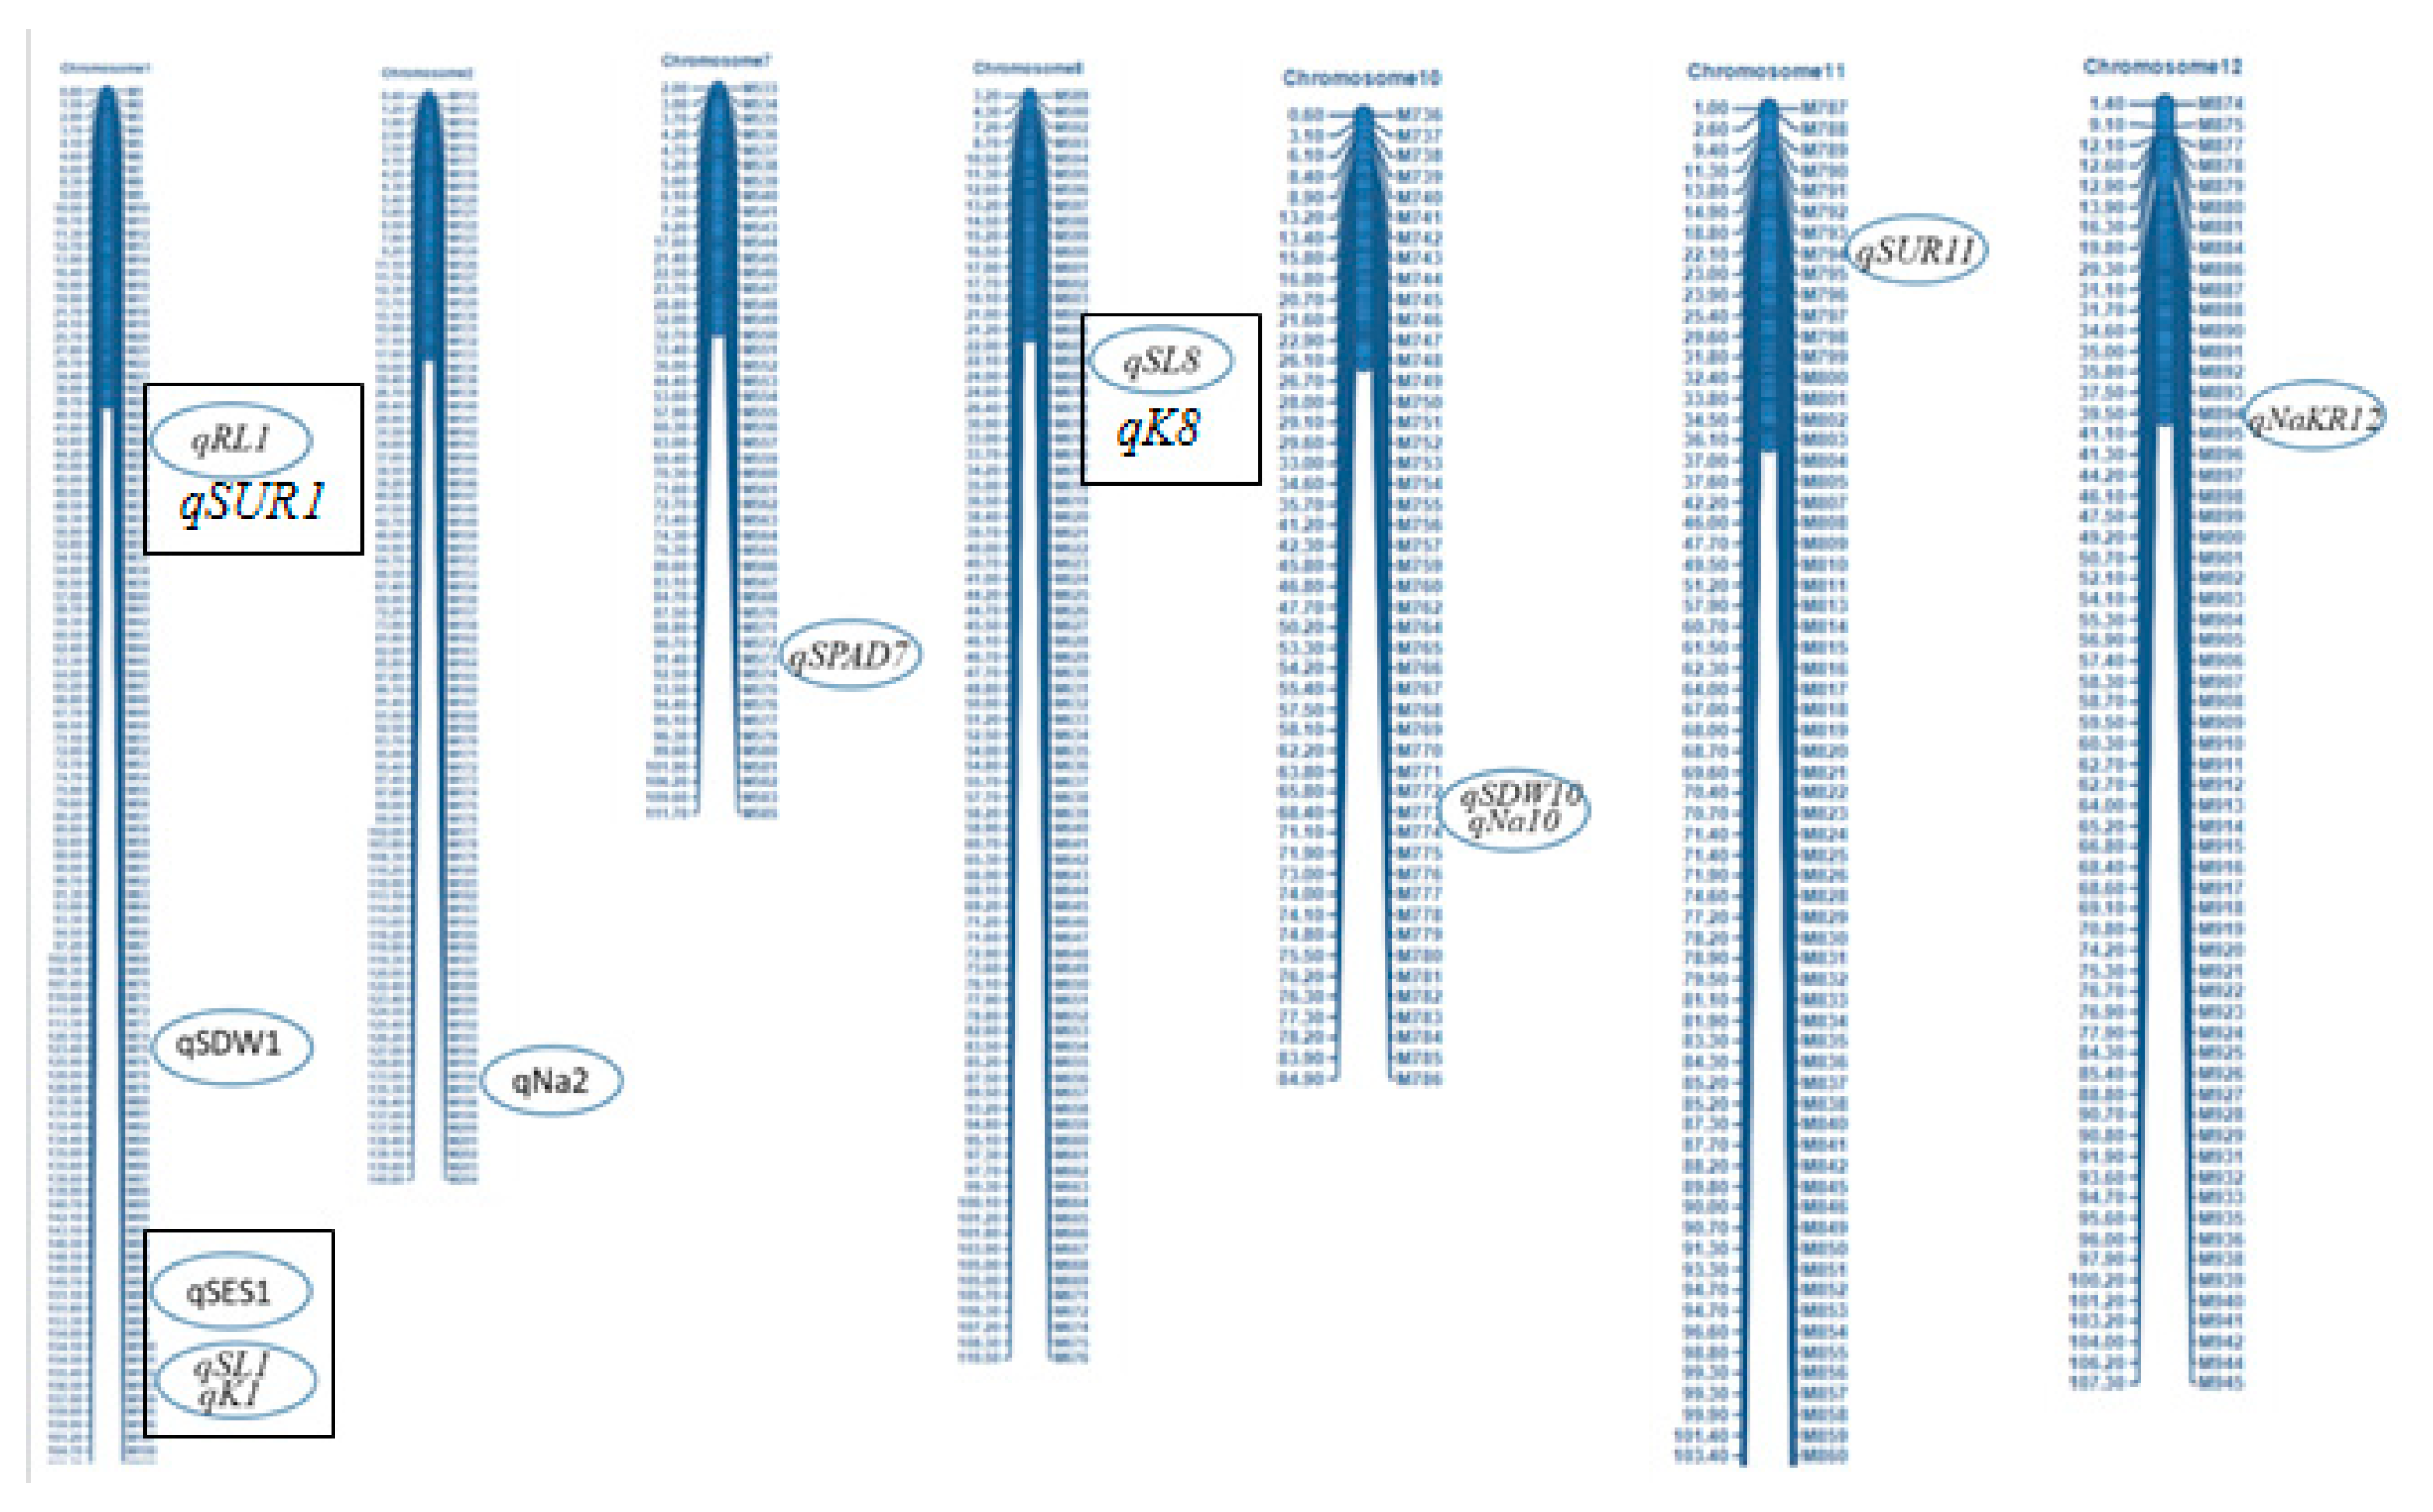
Figure 4.
QTL probability graphs of the LOD score (significance threshold of LOD = 3.0) of different traits (a. SES Score, b. % Survival, and Na+ concentration) indicate the strength/power of evidence for the occurrence/presence of a QTL on a particular chromosomal location.
Figure 4.
QTL probability graphs of the LOD score (significance threshold of LOD = 3.0) of different traits (a. SES Score, b. % Survival, and Na+ concentration) indicate the strength/power of evidence for the occurrence/presence of a QTL on a particular chromosomal location.
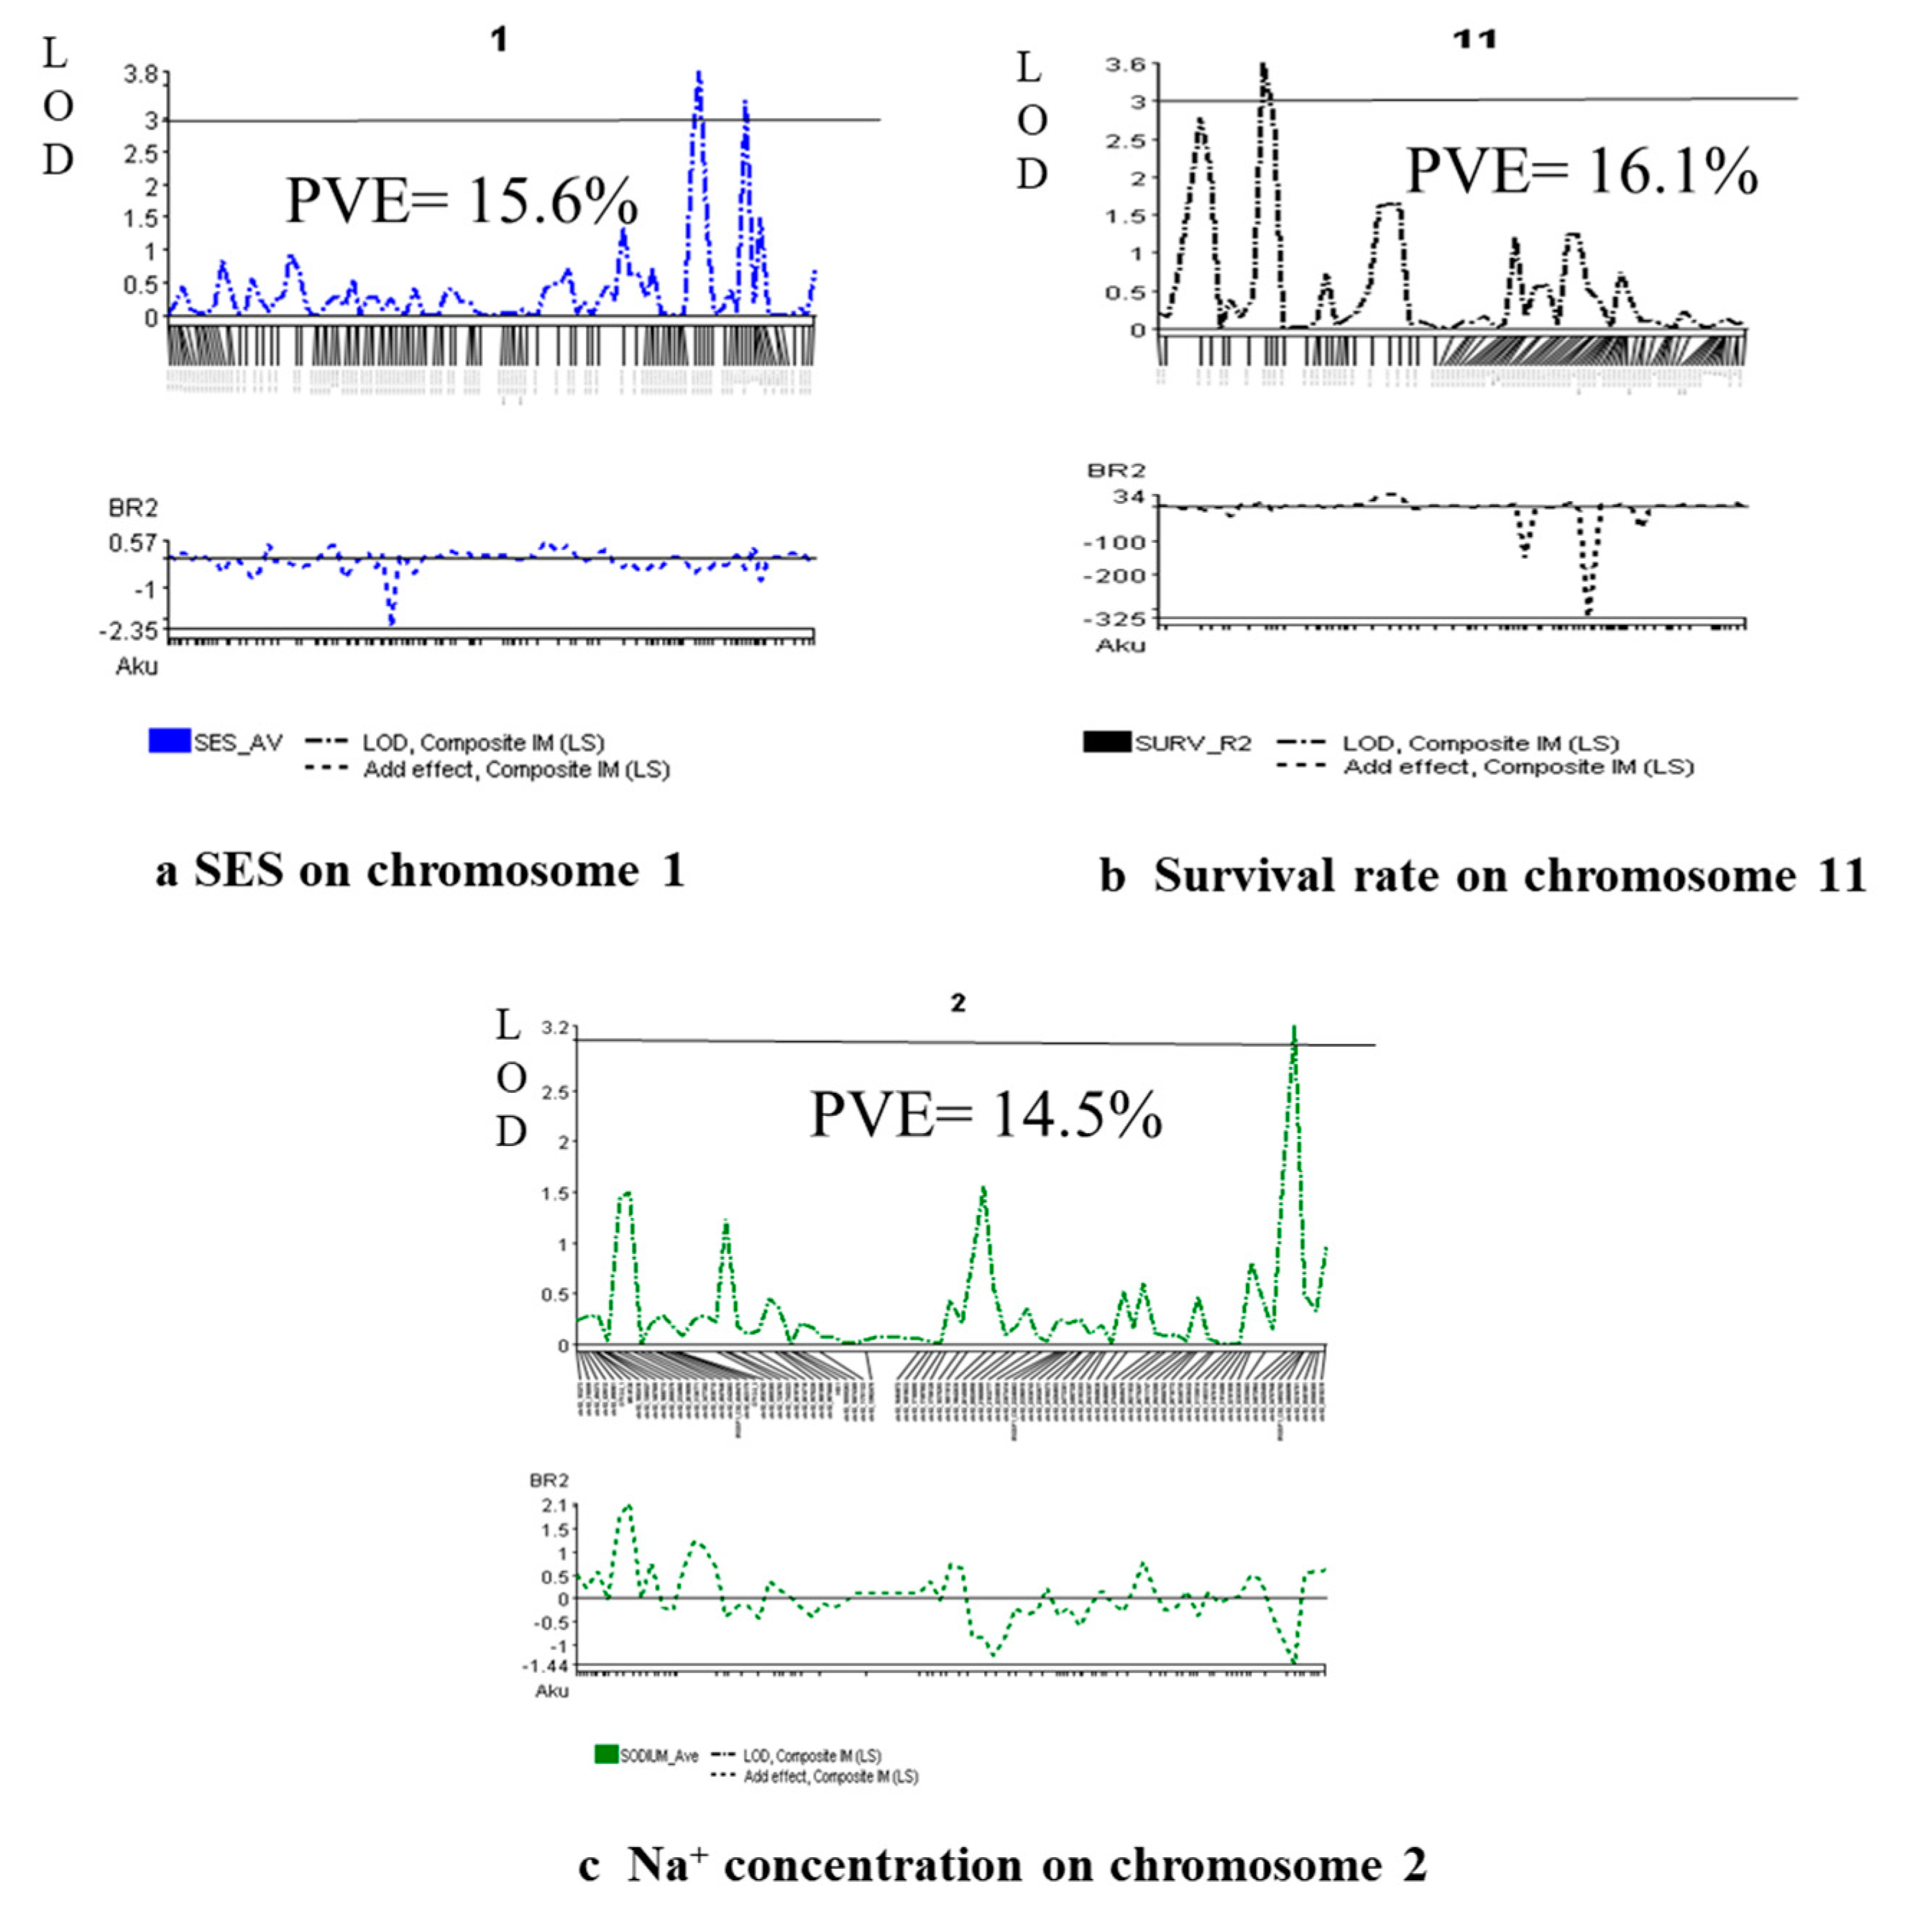
Figure 5.
Cyclic diagrams of epistatic QTLs for various salt tolerance traits: (a) shoot dry weight, (b) SPAD value and (c) Na+/K+ ratio. The spotted-marked lines designate the interacting marker pairs found on the same or different chromosomes with respective LOD value due to epistatic effect.
Figure 5.
Cyclic diagrams of epistatic QTLs for various salt tolerance traits: (a) shoot dry weight, (b) SPAD value and (c) Na+/K+ ratio. The spotted-marked lines designate the interacting marker pairs found on the same or different chromosomes with respective LOD value due to epistatic effect.
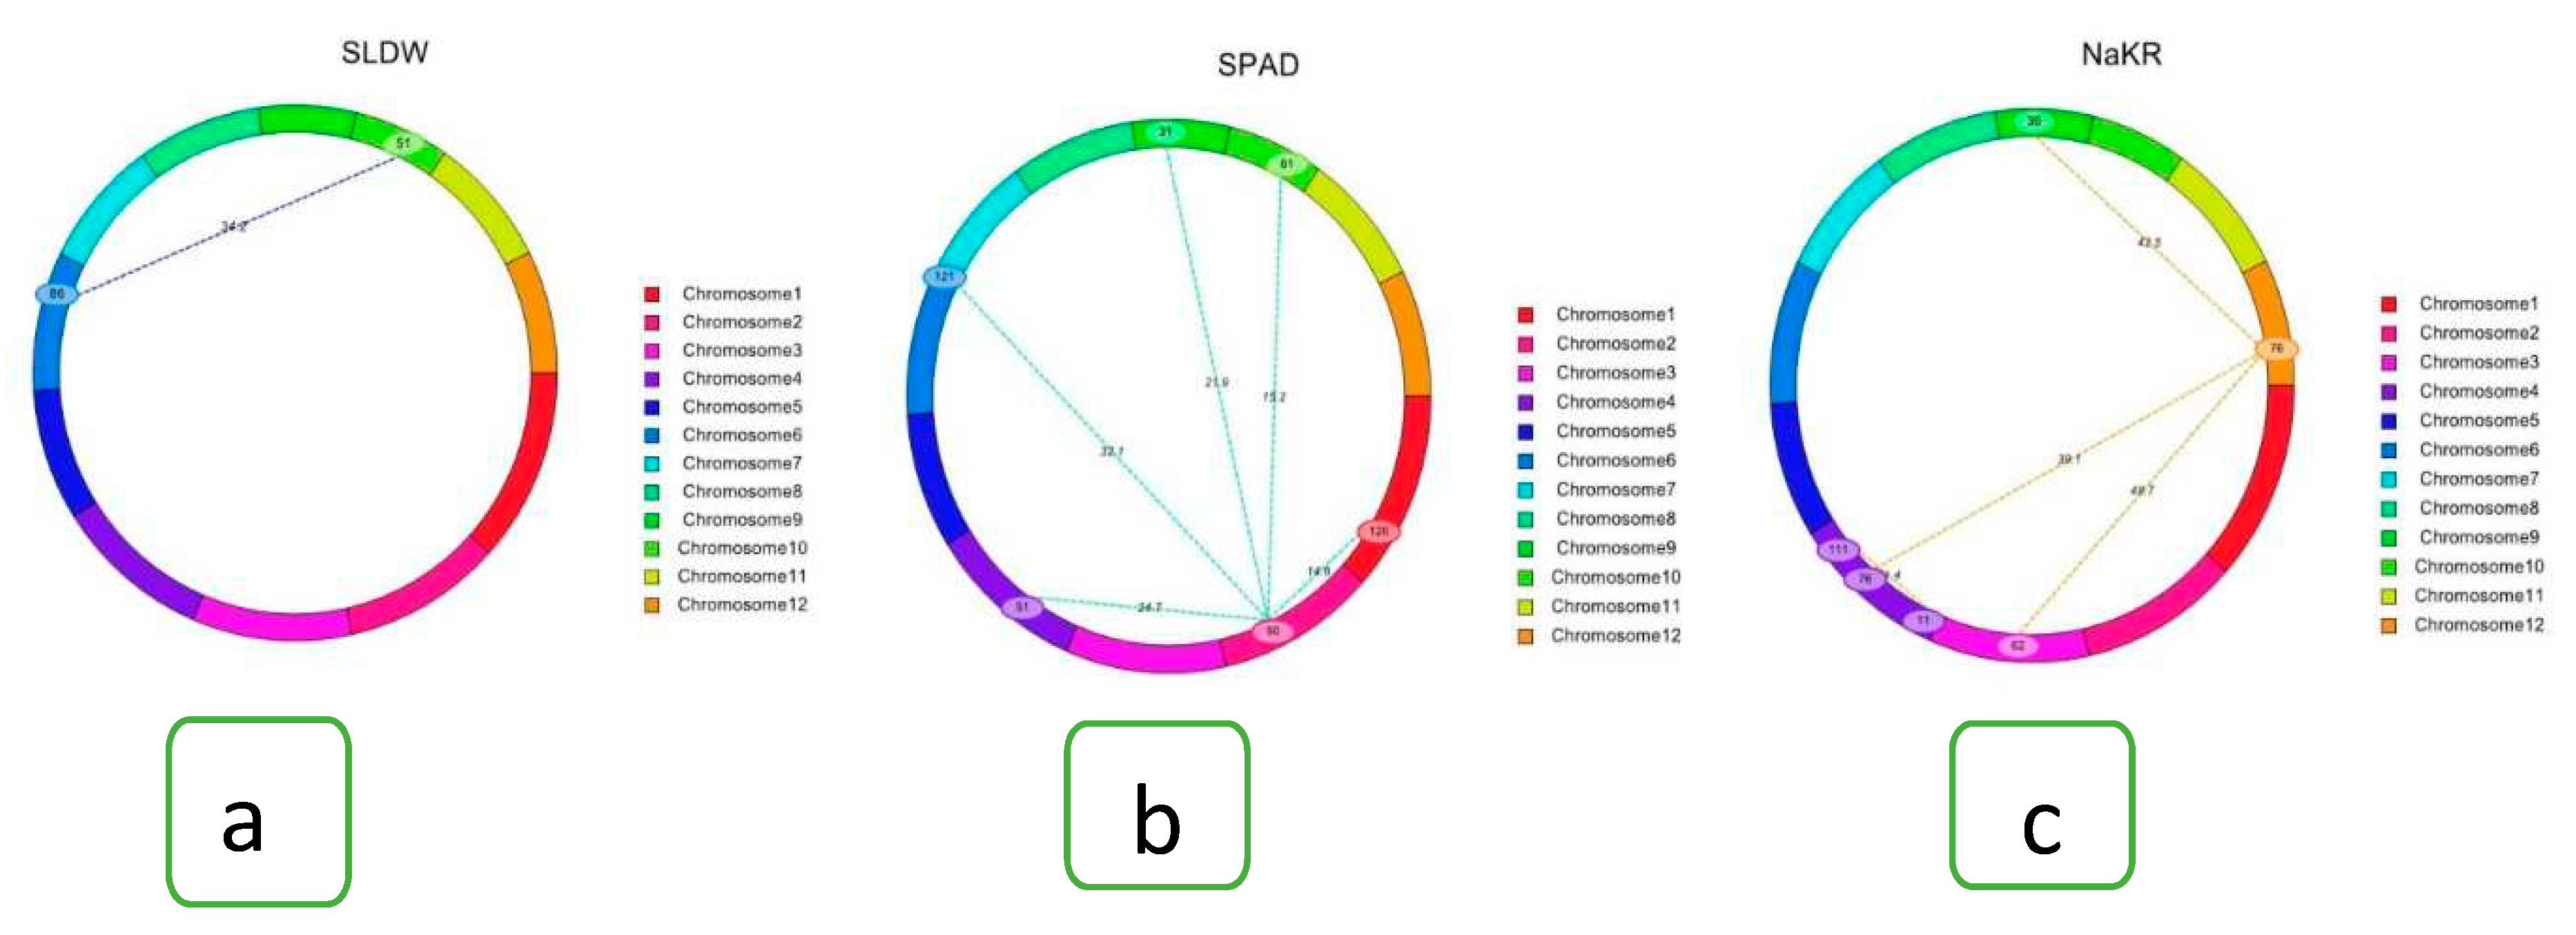
Table 1.
Trait association (correlation) and path coefficients for estimating the contribution of studied traits through analyzing the possible causal relationship/linkage between independent (causal) variables (different traits like % survival, shoot length etc.) on dependant variable (effect) like overall phenotypic performance (SES scores) under salt-stress.
| Variable name | Correlation | % Survival | Shoot | Root length | SPAD value | Na+ concentration | K+ concentration | Na+/K+ Ratio | Total effect | |
|---|---|---|---|---|---|---|---|---|---|---|
| length | dry weight | |||||||||
| % Survival | 0.008 | 0.035 | 0.093 | 0.001 | -0.042 | 0.006 | 0.021 | -0.096 | -0.011 | 0.008 |
| Shoot length | 0.147 | 0.007 | 0.440 | -0.046 | -0.044 | 0.016 | -0.001 | -0.173 | -0.052 | 0.147 |
| Shoot dry weight | 0.018 | 0.001 | 0.235 | -0.086 | -0.058 | -0.004 | 0.049 | -0.121 | 0.003 | 0.018 |
| Root length | -0.161 | 0.009 | 0.118 | -0.030 | -0.164 | -0.001 | -0.004 | -0.072 | -0.017 | -0.161 |
| SPAD value | -0.162 | -0.003 | -0.083 | -0.004 | -0.003 | -0.086 | 0.005 | 0.005 | 0.006 | -0.162 |
| Na+ conc. | 0.239 | 0.004 | -0.002 | -0.025 | 0.004 | -0.003 | 0.164 | -0.031 | 0.127 | 0.239 |
| K+ conc. | -0.201 | 0.011 | 0.243 | -0.033 | -0.038 | 0.001 | 0.016 | -0.314 | -0.087 | -0.201 |
| NaK Ratio | 0.328 | -0.002 | -0.137 | -0.001 | 0.016 | -0.003 | 0.125 | 0.163 | 0.168 | 0.328 |
Residual effect: 0.27.
Table 2.
QTLs identified for quantitative characters associated with salt tolerance during the seedling stage in BR28/Akundi F2:3 population.
Table 2.
QTLs identified for quantitative characters associated with salt tolerance during the seedling stage in BR28/Akundi F2:3 population.
| Characters | QTL identified | Chr. | QTL peak marker | QTL position (cM) | Additive effect | LOD | PVE (%) | QTL detection method | Favorable allele contributing parent | |||
|---|---|---|---|---|---|---|---|---|---|---|---|---|
| QGene | ICIM | QGene | ICIM | QGene | ICIM | |||||||
| SES | qSES1 | 1 | chr01_38632196 | 151.8 | 150.8 | -0.61 | 3.4 | 3.0 | 15.6 | 2.59 | IM, CIM | Akundi |
| Survival rate (%) | qSUR11 | 11 | chr11_5615885 | 21 | 21 | 13.73 | 3.5 | 4.0 | 16.1 | 0.85 | IM, CIM | BR28 |
| Shoot length | qSL1 | 1 | QSES1-2_2 | 156 | - | 4.86 | 7.3 | - | 30.7 | - | IM, CIM | BR28 |
| qSL8 | 8 | GM4_4 | 22 | - | 4.29 | 3.2 | - | 16.3 | - | IM, CIM | BR28 | |
| Shoot dry weight | qSDW1 | 1 | chr01_231396842 | 123.4 | 137.8 | -0.25 | 3.6 | 6.0 | 16.4 | 13.44 | IM, CIM | Akundi |
| qSDW10 | 10 | chr10_17397576 | 68.6 | 64.6 | -0.2 | 3.6 | 5.0 | 17.1 | 17.31 | IM, CIM | Akundi | |
| Root length | qRL1 | 1 | chr01_1045259 | 42 | - | 1.93 | 3.5 | - | 26 | - | SMA | BR28 |
| SPAD value | qSPAD7 | 7 | AG3_1 | 91.4 | - | -2.32 | 3.0 | - | 12.1 | - | SMR | Akundi |
| Na+ conc. | qNa2 | 2 | chr02_34072964 | 134.4 | - | -1.43 | 3.1 | - | 14.5 | - | IM, CIM | Akundi |
| qNa10 | 10 | chr10_17397576 | 68.8 | 68.6 | -0.74 | 3.3 | 5.0 | 15.5 | 21.20 | IM, CIM | Akundi | |
| K+ conc. | qK1 | 1 | QSES1-2_2 | 156.5 | 156.8 | 0.102 | 4.28 | 4.0 | 19.3 | 18.75 | SMR | BR28 |
| Na+/K+ ratio | qNaKR12 | 12 | chr12_10051752 | 39.4 | - | -0.04 | 3.0 | - | 12.1 | - | CIM | Akundi |
SMA = Single marker association, IM = Interval mapping, CIM = Composite interval mapping, SMR = Single marker regression
Disclaimer/Publisher’s Note: The statements, opinions and data contained in all publications are solely those of the individual author(s) and contributor(s) and not of MDPI and/or the editor(s). MDPI and/or the editor(s) disclaim responsibility for any injury to people or property resulting from any ideas, methods, instructions or products referred to in the content. |
© 2023 by the authors. Licensee MDPI, Basel, Switzerland. This article is an open access article distributed under the terms and conditions of the Creative Commons Attribution (CC BY) license (http://creativecommons.org/licenses/by/4.0/).
Copyright: This open access article is published under a Creative Commons CC BY 4.0 license, which permit the free download, distribution, and reuse, provided that the author and preprint are cited in any reuse.


