
Submitted:
24 May 2023
Posted:
25 May 2023
You are already at the latest version
Abstract
This study investigated the effects of three oil production methods on the physicochemical properties of dietary fiber from rice bran flour, and the hypolipidemic effects of the dietary fibers were investigated in vitro and in vivo. The particle size results showed that the organic solvent-impregnated rice bran meal dietary fiber (N-RBDF) had the smallest average particle size and the aqueous enzymatic rice bran meal dietary fiber (E-RBDF) had the narrowest particle size distribution. Scanning electron microscopy (SEM) results demonstrated that all three kinds of rice bran meal dietary fibers (RBDF) were irregularly flaky. Fourier transform infrared spectroscopy (FT-IR) results revealed that the three RBDFs had similar reactive groups, and X-ray diffraction (XRD) results indicated that all three RBDFs were cellulose type I crystals. The results of thermogravimetric analysis showed that the lignin content of N-RBDF was significantly lower than that of the other two. Among the three kinds of RBDFs, E-RBDF had higher water retention capacity, swelling capacity, oil holding capacity, and adsorption capacity for cholesterol and sodium bile salts. The results of experimental studies in hyperlipidemic rats showed that all three kinds of RBDFs significantly reduced triglycerides (TG), total cholesterol (TC) and low-density lipoprotein cholesterol (LDL-C) and elevated high-density lipoprotein cholesterol (HDL-C) in serum of hyperlipidemic rats; they also significantly lowered malondialdehyde (MDA) and elevated total superoxide dismutase (T-SOD) and glutathione peroxidase (GSH-Px) activities in liver of rats. In addition, all three kinds of RBDFs decreased aminotransferase (ALT) and aminotransferase (AST) activity in serum and also improved liver steatosis and reduced atherosclerosis index (AI) in rats with hyperlipidemia. Our study provides a reference for the development and utilization of rice bran meal and the application of rice bran meal dietary fiber in food processing.
Keywords:
Dietary Fiber
; Rice bran meals
; Physicochemical properties
; Hypolipidemic activity
; Oil production methods
1. Introduction
Hyperlipidemia is characterized by elevated serum total cholesterol (TC), low-density lipoprotein cholesterol (LDL-C), triglycerides (TG), or reduced high-density lipoprotein cholesterol (HDL-C), resulting in elevated serum lipoprotein level, hence the term hyperlipoproteinemia [1]. Hyperlipidemia leads to atherosclerosis, which in turn is one of the direct causes of cardiovascular diseases and ultimately leads to death due to blood clots and myocardial infarction [2]. As people's living standard improve, the consumption of refined food increased, leading to the increase of "civil-diseases" such as obesity, hyperlipidemia, hyperglycemia, cardiovascular diseases, cancer and type 2 diabetes [3]. In clinical practice, lipid-lowering drugs such as western statins and fibrates are the most commonly and effective drugs. However, they are associated with high cost and side effects [4]. Therefore, the search for natural lipid-lowering drugs has become a hot topic in recent years.
Rice bran meal (RBM) is the by-product of rice bran oil extractions, also known as defatted rice bran, which is more stable and easy to store and process. Besides retaining the nutritional values of rice bran, it is rich in protein, starch, phytates and dietary fiber with the content is as high as 30 to 50% [5,6]. Dietary fiber is the sum of non-starch polysaccharides that cannot be digested and absorbed in the small intestine, but can be fully or partially fermented in the large intestine digestion [7]. According to its solubility, it can be divided into two major groups: soluble dietary fiber (SDF) and insoluble dietary fiber (IDF). SDF includes pectin, gum and some other plant-related mucopolysaccharides [8]. IDF includes cellulose, hemicellulose and lignin and exhibits high water-holding, swelling and oil-holding properties as well as adsorption capacity, which suggests that IDF has the ability to increase stool volume, shorten the gastrointestinal transit cycle, and prevention of colon cancer, obesity, type 2 diabetes, and cardiovascular diseases [9]. IDF contains free carboxyl and hydroxyl groups, and due to its high cation exchange capacity, IDF also has detoxifying effects [10]. Studies had shown that physical [11,12], chemical [13,14] and biological [15] methods can alter the structure of rice bran meal dietary fiber (RBDF), thus affecting its physicochemical and functional properties.
Among the extraction processes of vegetable oil, the most commonly used in industrial scale are pressing method and leaching method, aqueous enzymatic is an emerging method of oil extraction. Different vegetable oil extraction processes have different effects on the quality of edible oils. Shi et al. [16] had found that properties of the hot pressed Torreya grandis kernel oils were more superior than those of cold pressed and solvent extracted Torreya grandis kernel oils. Li et al. [17] studied the effects of different processing processes on the quality of rapeseed oil and animal lipid metabolism and found that the polyphenol, α-tocopherol and β-carotene contents and antioxidant properties of canola oil extracted by aqueous enzymatic method were better than those of cold-pressed, hot-pressed and hexane-infused canola oil. Jiang et al. [18] investigated the effects of cold pressing, hot pressing, and enzyme-assisted aqueous extraction on the composition and nutrition of peanut oil and found that different process technologies cause differentiation of trace active ingredients. Wongwaiwech et al. [19] compared the bioactive substances in defatted rice bran derived from solvent extracted and cold pressing oil extraction and found that the content of γ-aminobutyric acid in the solvent-extracted defatted rice bran was higher than that of the cold-pressed residue. However, the effect of different oil extraction processes on the dietary fiber in rice bran meal has not been reported.
This study used the multiple enzymatic method to prepare dietary fiber from hydraulic pressed rice bran meal (H-RBM), n-hexane leached rice bran meal (N-RBM) and aqueous enzyme method Rice Bran Meal (E-RBM), namely H-RBDF, N-RBDF and E-RBDF, analyzed their physicochemical and structural properties. We also investigated the RBDF’s water holding capacity, swelling power, cholesterol and sodium cholate binding in vitro. Last but not least, we used the hyperlipidemia rats experimental models to evaluate its potential blood lipidlowering effects. Our study provided a theoretical basis for the development and utilization of rice bran meal.
2. Materials and Methods
2.1. Materials
Rice bran provided by Changsha Tianhao Grain Oil Co. (Changsha, China). Hydraulic Pressed Rice Bran Meal (H-RBM), N-hexane Leached Rice Bran Meal (N-RBM) and Aqueous Enzyme Method Rice Bran Meal (E-RBM) were obtained after hydraulic pressing, hexane extraction and aqueous enzyme production of rice bran oil in the laboratory. Heat-stable α-amylase (activity: 40 000 U/g), alkaline protease (activity: 200 U/mg) and glycosylase (activity: 100 000 U/g) were ordered from Shanghai Yuanye Biotechnology Co.. Sodium glycinate, sodium taurocholate, pepsin and trypsin were obtained from Shanghai Maclean Biochemical Technology Co. (Shanghai, China). All other chemicals and solvents used were analytical grade.
2.2. Preparation of Samples
Rice bran meal dietary fiber (RBDF) was prepared according to Jia et al. [20] method described with minor modification. Briefly, 100 g of each of H-RBM, N-RBM and E-RBM were suspended in 1000mL of distilled water. The suspension was hydrolyzed by 2.0 g heat-stable α-amylase for 60 min at 95 °C with an oscillation speed of 150 r/min, then the enzyme was inactivated by cooling to 60 °C. After that, the pH of the suspension was adjusted to 8.0, two gram of alkaline protease was added, and the enzyme was hydrolyzed at 60 °C for 60 min with an oscillation speed of 150 r/min. Lastly, the pH of the suspension was adjusted to 4.5, two gram of glycosylase was added, and the enzyme was hydrolyzed at 60 °C for 60 min with an oscillation speed of 150 r/min. Add 4 times the volume of 95% ethanol precipitation overnight, the residue obtained by filtration was dried and crushed to obtain H-RBDF, N-RBDF and E-RBDF.
2.3. Structure Characterization
2.3.1. Particle Size Distribution
The particle size distribution of RBDF samples were determined according to Bender et al. [21] method by a Laser micron particle sizer (LS 13 320, Beckman Coulter Co., USA).
2.3.2. Scanning Electron Microscopy (SEM)
The micromorphological characteristics of the surfaces of H-RBDF, N-RBDF, and E-RBDF were observed by SEM (FEG-250, FEI Co., USA). The samples point by point were scanned with the focused electron beam under accelerating voltage 20 kV and the working distance to 11.4 mm.
2.3.3. Fourier Transform Infrared (FT-IR) Spectroscopy
The functional groups and glycosidic bond types of H-RBDF, N-RBDF and E-RBDF could be detected by FTIR spectroscopy (IRTracer-100, Shimadzu, Japan). The dried H-RBDF, N-RBDF and E-RBDF samples were weighed 2.0 mg, respectively. Then the sample was put into a mill, and dried potassium bromide (KBr) powder was added 1:100 and ground well respectively. Lastly, the sample was pressed into thin slices with a press, and scanned in the frequency region of 4000-400 cm-1 with blank KBr slices as the background.
2.3.4. X-ray diffraction Analysis (XRD)
According to Hua et al. [22] method with minor modification. The crystal structure of H-RBDG, N-RBDF, and E-RBDF were measured by X-ray diffractometer (D8 ADVANCE, Bruker, Germany) under the diffraction conditions: Cu target, scanning area (2θ) 5° - 60°, scanning speed 20°/min.
2.3.5. Thermo Gravimetric Analysis (TGA)
The thermogravimetric (TG) and derivative thermogravimetric (DTG) analyses of H-RBDF, N-RBDF and E-RBDF were determined using a thermogravimetric analyzer (TGA/DSC 1/1100SF, METTLER TOLEDO, Switzerland) with reference to the method of Zhang et al [23] and with slight modifications. Five milligram sample was weighed and loaded into an alumina crucible, and the temperature was controlled to increase from 30 °C to 600 °C at a heating rate of 10 °C/min. N2 was used as the protective gas.
2.4. Physicochemical Properties
2.4.1. Water Holding Capacity (WHC)
The WHC of H-RBDF, N-RBDF and E-RBDF were determined according to the method of Zhang et al [24]. One gram sample was weighted into 80 mL of distilled water and shook for 2 h at room temperature (25 °C), centrifuged at 4000 r/min for 10 min. Then discarded the supernatant, weighed, and calculated the WHC according to formula:
Where WHC is the water holding capacity, g/g; m0 is the mass of the centrifuge tube, g; m1 is the mass of the sample before centrifugation, g; m2 is the sum of the mass of the sample and the centrifuge tube after centrifugation, g.
2.4.2. Oil Holding Capacity (OHC)
The OHC of H-RBDF, N-RBDF and E-RBDF were determined according to the method of Zhang et al [24]. One gram of sample was weighted and placed in a centrifuge tube and 40 mL of sesame oil was added, shook at room temperature (25°C) for 2 h, then the samples were centrifuged at 4000 r/min for 10 min. The upper layer of clear oil was discarded and weighed. OHC was calculated according to formula:
where OHC is the oil holding capacity, g/g; m0 is the mass of the centrifuge tube, g; m1 is the weight of the sample before centrifugation, g; m2 is the sum of the mass of the sample and the centrifuge tube after centrifugation, g.
2.4.3. Swelling Capacity (SC)
One gram sample was weighed separately in a 10 mL graduated test tube, the volume of the sample was recorded, and 5.0 mL distilled water was added. The sample was stirred evenly and standing in a water bath at 25°C for 24 h. Recorded the volume of dietary fiber after dissolution. SC was calculated according to formula:
Where SC is the swelling force; m is the sample mass, g; V0 is the volume of the sample before swelling, mL; V1 is the volume of the sample after swelling, mL.
2.4.4. Cholesterol Adsorption Capacity (CAC)
Referring to the method of Benitez et al [25] with slightly modified. Take the egg yolk and beat it evenly, add 9 times the volume of distilled water. One gram of the sample was weighed in a conical flask and added to 25 g of egg solution, and use 1 mol/L HCl solution to adjust the pH value of the solution to 2.0 (simulated stomach environment), and 0.1 mol/L NaOH to adjust the pH value of the solution to 7.0 (simulates small intestine environment), respectively, and shaken in a water bath at 37°C for 2 h. Then the supernatant was centrifuged at 4000 r/min for 20 min, absorb 1.0 mL of supernatant at a wavelength of 550 nm, and determine the absorbance value by the orthophthalaldehyde method. The cholesterol mass concentration c1 in the supernatant at 550 nm was measured, and the cholesterol mass concentration c2 in the egg yolk emulsion before adsorption was also measured. The CAC calculation formula is as follows:
Where CAC is the cholesterol adsorption capacity, mg/g; c2 is the mass concentration of cholesterol before adsorption (mg/mL); c1 is the mass concentration of cholesterol after adsorption (mg/mL); M is the mass of sample (g); V is volume (mL).
2.4.5. Sodium Cholate Binding Capacity (SCBC)
Referring to the method of Daou et al [26] with slightly modified. Half a gram sample was weighed and placed in a conical flask, then added 1 mL of 0.01 mol/L HCl solution and 3 mL of 10 mg/mL pepsin solution, and shook and digested in a water bath at 37°C for 1 h. Subsequently, the pH was adjusted to 6.3 and added 4.0 mL of 10 mg/mL trypsin solution, and shake and digest at 37°C for 1 h. Then, added 4.0 mL of bile acid salt solution (0.5 mmol/L sodium taurocholate solution, 0.5 mmol/L sodium glycocholate solution, both prepared in PBS buffer at pH 6.3), shook in a water bath at 37°C for 1 h, centrifuged at 4500 r/min for 20 min, and took supernatant 2.4 mL, then added 7.6 mL of 60% H2SO4 and shook well in a water bath at 70°C for 20 min, and then in an ice bath for 5 min, measure the absorbance value at 387 nm wavelength. The calculation formula for the binding ratio of sodium glycocholate and sodium taurocholate are as follows:
Where c3 and c4 are the amount of sodium glycocholate added and remaining adsorption (mmol); c5 and c6 are the amount of sodium taurocholate added and remaining adsorption (mmol).
2.5. Animal Experiment Design
Forty-two specific pathogen free Sprague-Dawley rats 180 ± 20 g were selected. Animals were provided by Hunan Slyke Jingda Experimental Animal Co. LTD. The animals were fed individually in cages in a controlled room with the room temperature of 20-26°C, and humidity of 40%-70%. Rats can access food and water freely. After one week of adaptive feeding, they were randomly divided into 2 groups. Seven rats were given basic feed as a negative control, and the remaining 35 were given high-fat feed as high-fat group. Serum total cholesterol (TC) and triglyceride (TG) of rats in the high-fat group were significantly higher compared to the NC group. The animal protocol were approved by Hunan Slack Jingda Laboratory Animal Co., Ltd. Experimental Animal Welfare Ethics Committee (approval number: IACUC-SJA2022088) under the guidelines of the Chinese Academy of Sciences.
The 35 rats that were successfully modeled were randomized again and divided into 5 groups of 7 rats each, namely, hyperlipidemia model (Model Control, MC) group, positive drug control (Positive Control, PC) group, H-RBDF group, N-RBDF group and E-RBDF group. The NC group was fed with basic feed, and the other groups were all fed high-fat feed. The amount of gavage according to Liu et al [27], and details of feeding and dosing are shown in Table 1. All 6 groups of rats continued to be fed for 28 days with once daily gavage. At the end of 4 weeks, all rats were fasted with food and water for 12 h. All rats were anesthetized with isoflurane and rapidly deprogrammed, the blood was quickly taken from the abdominal aorta. The livers were dissected, washed and dried, weighed and photographed, some livers were fixed in 4% paraformaldehyde and used for histopathological sections of the liver, and the rest were stored in a refrigerator at -80°C for further analysis and detection.
2.6. Serum Lipid Level
The blood was collected from the abdominal aorta, centrifuged at 4000 r/min for 10 min, and the upper serum was used to determine TC, TG, HDL-C, LDL-C by a fully automated biochemical analyzer (BS-430, Shenzhen Merry Biomedical Electronics Co., China).
2.7. Determination of AST and ALT Activity in Serum
The rat serum was taken after centrifugation and AST and ALT activities were determined according to the kit method.
2.8. Determination of GSH-Px, SOD Activity and MDA in Liver
Half of gram liver tissue was put into a tissue grinder, and added saline at 4°C in the ratio of 1:9 (g/mL) by weight of liver. The liver tissue was groud it into 10% homogenate in an ice water bath, centrifuged it at 3000 r/min for 10 min, took the supernatant, and the GSH-Px, SOD, MDA of liver were determined by enzyme marker (SpectraMax i3X, Molecular Devices, USA) according to the instructions of the kit.
2.9. Pathological Observation of Liver
The rat livers were soaked in 4% paraformaldehyde fixative for 48 h and replaced with new paraformaldehyde fixative for 24 h. The livers were then dehydrated with gradient ethanol, paraffin embedded, dehydrated by hematoxylin and eosin section staining, and sealed by neutral gum, and photographed under panoramic slice scanner (PANNORAMIC DESK/MIDI/250/1000, 3DHISTECH, Hungary).
2.10. Statistical Analyses
The results were shown as the mean ± standard deviation. The data were analyzed using Origin 2018 and SPSS 17.0 software. P values less than 0.05 were considered to be statistically significant.
3. Results and Discussion
3.1. Structure Analysis
3.1.1. Particle Size Analysis
Both particle size and distribution can affect the structure and properties of dietary fibers. Therefore, many efforts have been made by researchers to modify dietary fibers, including the reduction of their particle size. Reducing the particle size of dietary fibers may lead to some changes in their structure, porosity, surface area, and functional properties [28]. The particle size and particle size distribution of H-RBDF, N-RBDF and E-RBDF are shown in Table 2, respectively. The median particle size of N-RBDF was 18.10 μm, which was significantly smaller than that of E-RBDF (26.15 μm) and H-RBDF (39.82 μm); the specific surface area of N-RBDF (5613.72 m2/g) was also significantly larger than that of E-RBDF (3082.04 m2/g) and H-RBDF (1914.75 m2/g). Both indicating that the average particle size of N-RBDF is the smallest, E-RBDF is the second and H-RBDF is the largest. However, the span of E-RBDF was 2.34, which was smaller than 2.61 for N-RBDF and 3.03 for H-RBDF, which indicates that the particle size distribution of E-RBDF is more uniform. A similar trend was observed in rice bran IDF [29].
3.1.2. SEM Analysis
The SEM images of H-RBDF, N-RBDF and E-RBDF were illustrated in Figure 1. It can be seen from Figure 1(A1, B1, C1) that the N-RBDF particles were smaller, n-hexane treatment can destroy the structure of rice bran to make it more fragmented, dried and cracked [30]. It could be seen from Figure 1(A2, B2, C2), H-RBDF, N-RBDF and E-RBDF were all irregularly lamellar with protein particles on the surface. While N-RBDF had the most protein particles attached to the surface, broken lamellar structure and larger specific surface area, and E-RBDF had more folds and pore-like structures on the surface, and H-RBDF had a smooth surface with more particles attached. The pleated and pore-like structure of dietary fiber increased its water and oil holding power, and also had a certain impact on its adsorption capacity [31].
3.1.3. FT-IR Analysis
Figure 2 shows the FTIR chart of H-RBDF, N-RBDF and E-RBDF, the absorption peaks near the wave number 3379 cm-1 in the IR spectrogram are intramolecular or intermolecular hydrogen bond stretching vibrations of the -OH group within the crystalline region of cellulose [32]. The two absorption peaks at 2925 cm-1 and 2854 cm-1 are due to the methyl or methylene groups resulting in the type of C-H stretching band [33]. The peak near 1754 cm-1 was caused by the characteristic peak of the stretching vibration of the ester C=O [34]. The absorption peak at 1658 cm-1 may be a characteristic peak caused by the (-NHZ) variable angle vibration, or it may be caused by the carboxyl stretching vibration of the hydrogen bonds formed between the cellulose chains [35]. The stretching vibration absorption peak of carboxyl C=O appears near 1530 cm-1, which could also be an absorption peak caused by asymmetric stretching vibrations, and most of the absorption peaks responding to these positions are characteristic absorption peaks of sugars [36]. The peak near 1103 cm-1 probably caused by the C-O stretching vibration of C-O-C between hemicellulose and cellulose [37]. In summary, the position and number of characteristic absorption peaks of H-RBDF, N-RBDF and E-RBDF did not change significantly after the modification treatment, but the intensity of absorption peaks varied, especially the intensity of N-RBDF at 2925 cm-1 and 1754 cm-1 were significantly weakened, probably due to the destruction of ester, ether and intermolecular hydrogen bonding groups of cellulose, lignin and hemicellulose during the organic solvent extraction [38].
3.1.4. XRD Analysis
It can be seen from Figure 3 that H-RBDF, N-RBDF, and E-RBDF all had a strong diffraction peak near 2θ at 21.88°, indicating that they are typical cellulose I crystals [39]. Both H-RBDF and N-RBDF had strong diffraction peaks near 31.54° and weaker diffraction peaks at 30.59° and 44.59° [40], which might be a result of organic solvents and hydraulic pressure causing changes in the crystal structure of H-RBDF and N-RBDF. The crystallinity of H-RBDF, N-RBDF and E-RBDF were calculated by MDI Jade v 6.0 software as 31.98%, 20.27% and 29.80%, respectively, and the decrease in crystallinity might be caused by the organic solvents and enzymes that disrupt the crystalline regions of rice bran meal dietary fibers more significantly than hydraulic pressure [41].
3.1.5. Thermal Analysis
Thermogravimetric (TG) and Differential Thermogravimetric (DTG) analyses were used to evaluate the changes in thermal stability and structural properties of H-RBDF, N-RBDF and E-RBDF. Lignin, cellulose and hemicellulose in dietary fibers have different thermal decomposition temperatures due to their different chemical structures [42]. The curve a in Figure 4 shows the Thermogravimetric curves of H-RBDF, N-RBDF and ERBDF, the solid residues of H-RBDF, N-RBDF and E-RBDF were 31.98%, 41.21% and 29.79%, respectively. The results over indicated that the chemical method improved the thermal stability of RBDF, which was consistent with the study of Zhang et al [43] results. The DTG curves of H-RBDF, N-RBDF and E-RBDF (Figure 4 b) had four peaks. The first peak at around 100 °C might be due to evaporation of water; the second peak at 289 °C might be due to degradation of hemicellulose. Moriana et al [44] showed that hemicellulose is usually degraded rapidly between 210 and 350 °C. The third peak was located at 336°C was formed by cellulose degradation. Yang et al [45] found that cellulose degradation starts at 315°C and continues until 400°C and the maximum loss rate of cellulose peaks at 355°C.The fourth peak located at 430°C was caused by lignin degradation, and both hemicellulose and cellulose were degraded below 400°C. Zhang et al [46] reported that the maximum rate of lignin loss occurred between 399-450°C. The fourth peak of N-RBDF was significantly weaker than that of H-RBDF and E-RBDF, and this result surface the lignin content of H-RBDF and E-RBDF was higher than that of N-RBDF, which might be caused by the destruction of the structure of lignin during the organic solvent extraction.
3.2. Functional Properties Analysis
3.2.1. WHC, OHC and SC Analysis
The WHC and SC of dietary fiber are important properties in food processing. Higher WHC can bring better taste and processing properties to foods, while stronger SC can promote gastrointestinal motility and defecation and increase the volume of feces, thus having the function of preventing constipation, and the particle size, specific surface area and hydrophilic group content of dietary fiber particles can affect their WHC and SC [47,48]. The porous microstructure and larger specific surface area of dietary fibers can increase the contact between fibers and oil and improve the oil-holding power. But too small particle size will instead expose more hydrophilic groups thus reducing the OHC [49], and higher OHC is beneficial for dietary fibers to absorb excess oil in the human body, which can prevent obesity. The WHC, OHC and SC of H-RBDF, N-RBDF and E-RBDF are shown in Table 3. The WHC, OHC and SC of E-RBDF reached 2.39 g/g, 1.61 g/g and 1.59 mL/g, which were 1.56 times, 1.27 times and 1.33 times of H-RBDF and 1.29 times, 1.1 times and N-RBDF, respectively. 1.37 times.
3.2.2. CAC Analysis
The cholesterol adsorption capacity of H-RBDF, N-RBDF and E-RBDF were shown in Figure 5, it could be seen that the cholesterol adsorption capacity of rice bran meal dietary fiber was stronger at pH=7 than at pH=2 (p < 0.05), which indicated that rice bran meal dietary fiber is mainly used for cholesterol adsorption in the intestine, which is consistent with Nsor-Atindana et al [50]. When pH=2, the cholesterol adsorption capacity of E-RBDF was 1.02 times that of H-RBDF and 1.24 times that of N-RBDF; and 1.77 times that of H-RBDF and 1.89 times that of N-RBDF at pH=7, respectively. It was consistent with the conclusion that E-RBDF had more folds and pore-like structures on the surface, which was more conducive to the adsorption of dietary fiber to cholesterol.
3.2.3. SCBC Analysis
Dietary fiber combined with bile acid sodium salt is an indirect way to lower cholesterol and blood lipids, because the increased excretion of bile acid sodium salt can promote the consumption of cholesterol metabolite bile acid, further accelerating cholesterol decomposition and lowering serum cholesterol levels [51]. The adsorption capacities of H-RBDF, N-RBDF and E-RBDF on sodium glycocholate and sodium taurocholate are shown in Figure 6, with the binding rate of sodium glycocholate reaching (32.61 ± 1.21) % for E-RBDF, which was 2.03 times higher than that of H-RBDF and 1.43 times higher than that of N-RBDF, respectively. The sodium taurocholate binding rate of E-RBDF reached (50.24 ± 0.09) %, which was 1.68 times higher than that of H-RBDF and 1.57 times higher than that of N-RBDF, respectively.
3.3. Effect of Dietary Fiber on Blood Lipid Level of Rats
As shown in Table 4, TC, TG, and LDL-C levels in the MC group were significantly higher than those in the NC group (p < 0.01), and HDL-C levels were lower than those in the NC group (p < 0.05). Compared with the MC group, TG was highly significantly lower in the H-RBDF, N-RBDF and E-RBDF groups (p < 0.01), TC was significantly lower in the H-RBDF and E-RBDF groups (p < 0.05), TC was also lower in the N-RBDF group, LDL-C was significantly lower in the H-RBDF, N-RBDF and E-RBDF groups (p < 0.05), and HDL-C levels were essentially unchanged. The above results indicate that H-RBDF, N-RBDF and E-RBDF can improve the accumulation of lipids in the serum of hyperlipidemic rats and have some hypolipidemic activity, especially E-RBDF was more effective than H-RBDF and N-RBDF in reducing TG and TC levels in the serum of hyperlipidemic rats. Hu et al [52] found that xylanase modified corn husk fiber can significantly reduce TG, TC and LDL-C in serum of rats. The AI of hyperlipidemic rats in the MC group was extremely significantly higher than that in the NC group, indicating that high-fat diet feeding led to elevated AI in rats. The AI of hyperlipidemic rats of the PC group, H-RBDF group, N-RBDF group and E-RBDF group decreased to different degrees, in addition the AI of rats in the H-RBDF and E-RBDF groups was significantly lower than that in the MC group (p < 0.05), and the effect of E-RBDF intervention treatment was the best. Similarly, Dabour et al [53] found that yogurt supplemented with wheat bran or dietary fiber significantly (p < 0.05) reduced AI in hypercholesterolemic rats.
3.4. Effect of Dietary Fiber on AST and ALT Activity in Serum
ALT and AST are dysfunctional enzymes found in serum and plasma, mainly in hepatocytes, and their activity is often used to determine liver injury or liver dysfunction [54]. When hepatocytes are damaged ALT and AST are released into the blood, the enzyme activity increases and this increase in ALT and AST activity is a sign of liver damage [55]. The activities of ALT and AST in the serum of rats were shown in Figure 7. ALT and AST were highly significantly elevated in the MC group compared to the NC group (p < 0.01), indicating that long-term high-fat diet feeding leads to liver damage in rats. After drug, H-RBDF, N-RBDF and E-RBDF interventions, the PC group, H-RBDF group, N-RBDF group and E-RBDF group all reduced the ALT and AST activities in the serum of hyperlipidemic rats.
3.5. Effect of Dietary Fiber on GSH-Px, SOD Activity and MDA in Liver
GSH-Px is an enzyme that catalyzes the breakdown of H2O2, scavenging lipid peroxides and blocking the chain reaction of lipid peroxidation, thus achieving the reduction of hepatocyte damage [56]. SOD can effectively scavenge oxygen free radicals in the body and maintain the balance of the body's oxidative and antioxidant capacity, and SOD activity is one of the main indicators of the body's antioxidant capacity [57]. MDA is a membrane lipid peroxidation product that indirectly reflects the damage of hepatocytes in fatty liver patients in a state of lipid peroxidation and oxidative stress [58]. It could be seen from Table 5 that the MC group significantly reduced the activity of GSH-Px and SOD in the liver of hyperlipidemic rats relative to the NC group (p < 0.01), and also significantly elevated the MDA content in the liver of hyperlipidemic rats (p < 0.01). Compared with the MC group, the GSH-Px activity in the liver of hyperlipidemic rats in the PC, H-RBDF, N-RBDF and E-RBDF groups was highly significantly increased (p < 0.01), and the SOD activity was also raised. In addition, the MDA content in the liver of hyperlipidemic rats in the PC, H-RBDF, N-RBDF and E-RBDF groups highly significantly decreased (p < 0.01). In conclusion, H-RBD, N-RBDF and E-RBDF enhanced the antioxidant activity in the liver of hyperlipidemic rats, thereby reducing liver damage in rats. Similarly, Liu et al [59] found that dietary fiber from monkey head mushroom significantly counteracted oxidative stress by reducing lipid peroxidation product levels and promoting enzymatic and non-enzymatic antioxidant activities.
3.6. Histopathological Analysis of the Rat Liver
Figure 8 showed the appearance of the liver of hyperlipidemic rats. The liver of rats in the NC group was dark red in color with smooth and shiny surface and sharp edges, while the liver of rats in the MC group was significantly larger in size, creamy white in color with blunt edges and fat particles visible to the naked eye on the surface. The livers of rats in the PC, H-RBDF, N-RBDF and E-RBDF groups were significantly improved in color and also had improved fat particles on the surface compared with the MC group, but there was no significant decrease in volume.
As shown in Figure 9, the hepatocytes in the liver of the NC group were structurally intact, densely arranged and unchanged. While the hepatocytes in the liver of the MC group were covered with fat particles of different sizes, with diffuse steatosis and disorganized cell arrangement, and small focal necrosis of the hepatocytes was seen, accompanied by a small amount of inflammatory cell infiltration. This indicated that steatosis and histopathology in the rat liver due to high-fat diet feeding. Compared with the MC group, the above symptoms were improved in the livers of rats in the PC, H-RBDF, N-RBDF and E-RBDF groups, but a small amount of white fat particles were still visible. In contrast, the fat particles in the liver of rats in the H-RBDF and E-RBDF groups were significantly less than those in the N-RBDF, and the improvement of cellular arrangement in the liver of rats in the E-RBDF group was more obvious compared with those in the H-RBDF and N-RBDF groups, and these results were consistent with the results of liver appearance maps of rats in each group. The above results showed that all three kinds of rice bran meal dietary fiber could improve the fibrosis phenomenon in the liver of rats with hyperlipidemia, and had a certain positive intervention effect on the degeneration of fat in the liver of rats, with certain hypolipidemic function.
4. Conclusions
In this study, the effects of three oil production methods on the physicochemical properties and lipid-lowering function of rice bran meal dietary fiber were investigated. All kinds of three rice bran meal dietary fibers showed irregular flakes, exhibited polysaccharide infrared absorption spectral characteristics, showed cellulose type I characteristic diffraction peaks, and E-RBDF had higher water holding capacity, oil holding capacity, swelling capacity, cholesterol and sodium cholate adsorption capacity compared with H-RBDF and N-RBDF. Animal experiments showed that all three kinds of rice bran meal dietary fiber could reduce TC, TG, LDL-C, AI, AST and ALT activity and enhance HDL-C in serum of hyperlipidemic rats; they could also enhance GSH-Px and SOD activity in liver tissues of hyperlipidemic rats, and at the same time reduce MDA content in liver tissues of hyperlipidemic rats, alleviate liver damage and reduce steatosis. Among them, E-RBDF had the best therapeutic effect on hyperlipidemic rats.
Author Contributions
Renwei Zhu: Data curation (equal); investigation (equal); methodology (equal); project administration (lead); supervision (equal); writing-review & editing (equal). Yayi Wang: formal analysis (equal); investigation (equal); methodology (equal). Linwei Zhang: Formal analysis (equal); methodology (equal); writing-review & editing (equal). Liang Huang: Funding acquisition (equal); supervision (equal).
Acknowledgments
This work was supported by The Natural Science Foundation of Hunan Province(2019JJ60020).
Conflicts of interest
The authors declare that they have no conflicts of interest.
Abbreviations
| TDF | Total Dietary Fiber |
| SDF | Soluble Dietary Fiber |
| IDF | Insoluble Dietary Fiber |
| H-RBM | Hydraulic Pressed Rice Bran Meal |
| N-RBM | N-hexane Leached Rice Bran Meal |
| E-RBM | Enzyme Method Rice Bran Meal |
| H-RBDF | Hydraulic Pressed Rice Bran Meal Dietary Fiber |
| N-RBDF | N-hexane Leached Rice Bran Meal Dietary Fiber |
| E-RBDF | Enzyme Method Rice Bran Meal Dietary Fiber |
| NC | Negative Control |
| MC | Model Control |
| PC | Positive Control |
| MDA | Malonic Dialdehyde |
| SOD | Superoxide Dismutase |
| GSH-Px | Glutathione Peroxidase |
| AST | Aspartate aminotransferase |
| ALT | Alanine aminotransferase |
| TG | Triacylglycerol |
| TC | Total Cholesterol |
| HDL-C | High-density Lipoprotein Cholesterol |
| LDL-C | low-density Lipoprotein Cholesterol |
| AI | Atherogenic Index |
References
- Verma, N. INTRODUCTION TO HYPERLIPIDEMIA AND ITS TREATMENT: A REVIEW. International journal of current pharmaceutical research 2016, 9, 6. [CrossRef]
- Goldstein, J. L.; Hazzard, W. R.; Schrott, H. G.; Bierman, E. L.; Motulsky, A. G. Hyperlipidemia in coronary heart disease I. Lipid levels in 500 survivors of myocardial infarction. The Journal of Clinical Investigation, 1973, 52, 1533-1543. [CrossRef]
- Cassidy, Y.M.; Mcsorley, E.M.; Allsopp, P.J. Effect of soluble dietary fibre on postprandial blood glucose response and its potential as a functional food ingredient. J. Funct. Foods 2018, 46, 423-439. [CrossRef]
- Shattat, G.F. A Review Article on Hyperlipidemia: Types, Treatments and New Drug Targets. Biomedical and Pharmacology Journal 2014, 7, 399-409. [CrossRef]
- Cao, T.C.; Nguyen, T.P.; Nguyen, S.N.; Tran, T.T.T.; Ton, N.M.N.; Le, V.V.M. Cellulase-treated deoiled rice bran: effects of treatment conditions on dietary fiber content and utilization for formulation of cookies. Journal of Food Measurement and Characterization 2022, 16, 840-848. [CrossRef]
- Wang, L.; Wu, J.; Luo, X.; Li, Y.; Wang, R.; Li, Y.; Chen, Z. Dynamic high-pressure microfluidization treatment of rice bran: Effect on Pb (II) ions adsorption in vitro. Journal of food science, 2018, 83, 1980-1989. doi.org/10.1111/1750-3841.14201.
- Chen, H.; Zhao, C.; Li, J.; Hussain, S.; Yan, S.; Wang, Q. Effects of extrusion on structural and physicochemical properties of soluble dietary fiber from nodes of lotus root. Food science & technology 2018, 93, 204-211. [CrossRef]
- Li, S.; Li, J.; Zhi, Z.; Wei, C.; Wang, W.; Ding, T.; Chen, S. Macromolecular properties and hypolipidemic effects of four sulfated polysaccharides from sea cucumbers. Carbohydrate polymers, 2017, 173, 330-337. doi.org/10.1016/j.carbpol.2017.05.063.
- Sapwarobol, S.; Saphyakhajorn, W.; Astina, J. Biological Functions and Activities of Rice Bran as a Functional Ingredient: A Review. Nutrition and Metabolic Insights 2021, 14, 1389573753. [CrossRef]
- Zhu, R.; Xu, T.; He, B.; Wang, Y.; Zhang, L.; Huang, L. Modification of Artichoke Dietary Fiber by Superfine Grinding and High-Pressure Homogenization and Its Protection against Cadmium Poisoning in Rats. Foods 2022, 11, 1716. [CrossRef]
- Wu, N.; Qiao, C.; Tian, X.; Tan, B.; Fang, Y. Retrogradation inhibition of rice starch with dietary fiber from extruded and unextruded rice bran. Food Hydrocolloid. 2021, 113, 106488. [CrossRef]
- Zadeike, D.; Vaitkeviciene, R.; Degutyte, R.; Bendoraitiene, J.; Rukuiziene, Z.; Cernauskas, D.; Juodeikiene, G. A comparative study on the structural and functional properties of water-soluble and alkali-soluble dietary fibres from rice bran after hot-water, ultrasound, hydrolysis by cellulase, and combined pre-treatments. International Journal of Food Science & Technology, 2022, 57, 1137-1149. [CrossRef]
- Qi, J.; Yokoyama, W.; Masamba, K. G.; Majeed, H.; Zhong, F.; Li, Y. Structural and physico-chemical properties of insoluble rice bran fiber: effect of acid–base induced modifications. RSC advances, 2015, 5, 79915-79923. [CrossRef]
- Qi, J.; Li, Y.; Masamba, K.G.; Shoemaker, C.F.; Zhong, F.; Majeed, H.; Ma, J. The effect of chemical treatment on the In vitro hypoglycemic properties of rice bran insoluble dietary fiber. Food Hydrocolloid. 2016, 52, 699-706. [CrossRef]
- Ren, F.; Feng, Y.; Zhang, H.; Wang, J. Effects of modification methods on microstructural and physicochemical characteristics of defatted rice bran dietary fiber. LWT 2021, 151, 112161. [CrossRef]
- Shi, L.; Zheng, L.; Mao, J.; Zhao, C.; Huang, J.; Liu, R.; Chang, M.; Jin, Q.; Wang, X. Effects of the variety and oil extraction method on the quality, fatty acid composition and antioxidant capacity of Torreya grandis kernel oils. LWT 2018, 91, 398-405. [CrossRef]
- Li, Y.; Zhang, L.; Xu, Y.; Li, J.; Cao, P.; Liu, Y. Evaluation of the functional quality of rapeseed oil obtained by different extraction processes in a Sprague-Dawley rat model. Food Funct. 2019, 1, 653-6516. [CrossRef]
- Jiang, F.; Yuan, L.; Shu, N.; Wang, W.; Liu, Y.; Xu, Y. Foodomics Revealed the Effects of Extract Methods on the Composition and Nutrition of Peanut Oil. J. Agr. Food Chem. 2020, 68, 1147-1156. [CrossRef]
- Wongwaiwech, D.; Weerawatanakorn, M.; Tharatha, S.; Ho, C. Comparative study on amount of nutraceuticals in by-products from solvent and cold pressing methods of rice bran oil processing. J. Food Drug Anal. 2019, 27, 71-82. [CrossRef]
- Jia, M.; Chen, J.; Liu, X.; Xie, M.; Nie, S.; Chen, Y.; Xie, J.; Yu, Q. Structural characteristics and functional properties of soluble dietary fiber from defatted rice bran obtained through Trichoderma viride fermentation. Food Hydrocolloid. 2019, 94, 468-474. [CrossRef]
- Bender, A.B.B.; Speroni, C.S.; Moro, K.I.B.; Morisso, F.D.P.; Dos Santos, D.R.; Da Silva, L.P.; Penna, N.G. Effects of micronization on dietary fiber composition, physicochemical properties, phenolic compounds, and antioxidant capacity of grape pomace and its dietary fiber concentrate. LWT 2020, 117, 108652. [CrossRef]
- Hua, X.; Xu, S.; Wang, M.; Chen, Y.; Yang, H.; Yang, R. Effects of high-speed homogenization and high-pressure homogenization on structure of tomato residue fibers. Food Chem. 2017, 232, 443-449. [CrossRef]
- Zhang, Y.; Liao, J.; Qi, J. Functional and structural properties of dietary fiber from citrus peel affected by the alkali combined with high-speed homogenization treatment. LWT 2020, 128, 109397. [CrossRef]
- Zhang, Y.; Qi, J.; Zeng, W.; Huang, Y.; Yang, X. Properties of dietary fiber from citrus obtained through alkaline hydrogen peroxide treatment and homogenization treatment. Food Chem. 2020, 311, 125873. [CrossRef]
- Benitez, V.; Rebollo-Hernanz, M.; Hernanz, S.; Chantres, S.; Aguilera, Y.; Martin-Cabrejas, M.A. Coffee parchment as a new dietary fiber ingredient: Functional and physiological characterization. Food Res. Int. 2019, 122, 105-113. [CrossRef]
- Daou, C.; Zhang, H. Functional and physiological properties of total, soluble, and insoluble dietary fibres derived from defatted rice bran. Journal of Food Science and Technology 2014, 51, 3878-3885. [CrossRef]
- Liu, Q.; Zhao, J.; Liu, S.; Fan, Y.; Mei, J.; Liu, X.; Wei, T. Positive intervention of insoluble dietary fiber from defatted rice bran on hyperlipidemia in high fat diet fed rats. J. Food Sci. 2021, 86, 3964-3974. [CrossRef]
- Liu, Y.; Wang, L.; Liu, F.; Pan, S. Effect of Grinding Methods on Structural, Physicochemical, and Functional Properties of Insoluble Dietary Fiber from Orange Peel. Int. J. Polym. Sci. 2016, 2016, 1-7. [CrossRef]
- Zhao, G.; Zhang, R.; Dong, L.; Huang, F.; Tang, X.; Wei, Z.; Zhang, M. Particle size of insoluble dietary fiber from rice bran affects its phenolic profile, bioaccessibility and functional properties. Food science & technology 2018, 87, 450-456. [CrossRef]
- Xu, D.; Hao, J.; Wang, Z.; Liang, D.; Wang, J.; Ma, Y.; Zhang, M. Physicochemical properties, fatty acid compositions, bioactive compounds, antioxidant activity and thermal behavior of rice bran oil obtained with aqueous enzymatic extraction. LWT 2021, 149, 111817. [CrossRef]
- Dong, J. L.; Wang, L.; Lü, J.; Zhu, Y. Y.; Shen, R. L. Structural, antioxidant and adsorption properties of dietary fiber from foxtail millet (Setaria italica) bran. Journal of the Science of Food and Agriculture, 2019, 99, 3886-3894. [CrossRef]
- Wen, Y.; Niu, M.; Zhang, B.; Zhao, S.; Xiong, S. Structural characteristics and functional properties of rice bran dietary fiber modified by enzymatic and enzyme-micronization treatments. LWT 2017, 75, 344-351. [CrossRef]
- Wang, C.; Song, R.; Wei, S.; Wang, W.; Li, F.; Tang, X.; Li, N. Modification of insoluble dietary fiber from ginger residue through enzymatic treatments to improve its bioactive properties. LWT 2020, 125, 109220. [CrossRef]
- Wu, Q.; Wu, J.; Ren, M.; Zhang, X.; Wang, L. Modification of insoluble dietary fiber from rice bran with dynamic high pressure microfluidization: Cd (II) adsorption capacity and behavior. Innov. Food Sci. Emerg. 2021, 73, 102765. [CrossRef]
- Zhang, M.; Liao, A.; Thakur, K.; Huang, J.; Zhang, J.; Wei, Z. Modification of wheat bran insoluble dietary fiber with carboxymethylation, complex enzymatic hydrolysis and ultrafine comminution. Food Chem. 2019, 297, 124983. [CrossRef]
- Sangnark, A.; Noomhorm, A. Effect of particle sizes on functional properties of dietary fibre prepared from sugarcane bagasse. Food Chem. 2003, 80, 221-229. [CrossRef]
- Mudgil, D.; Barak, S.; Khatkar, B.S. X-ray diffraction, IR spectroscopy and thermal characterization of partially hydrolyzed guar gum. Int. J. Biol. Macromol. 2012, 50, 1035-1039. [CrossRef]
- Xie, J.; Liu, S.; Dong, R.; Xie, J.; Chen, Y.; Peng, G.; Liao, W.; Xue, P.; Feng, L.; Yu, Q. Bound Polyphenols from Insoluble Dietary Fiber of Defatted Rice Bran by Solid-State Fermentation withTrichoderma viride: Profile, Activity, and Release Mechanism. J. Agr. Food Chem. 2021, 69, 5026-5039. [CrossRef]
- Zhao, X.; Chen, J.; Chen, F.; Wang, X.; Zhu, Q.; Ao, Q. Surface characterization of corn stalk superfine powder studied by FTIR and XRD. Colloids and Surfaces B: Biointerfaces 2013, 104, 207-212. [CrossRef]
- Xie, F.; Zhao, T.; Wan, H.; Li, M.; Sun, L.; Wang, Z.; Zhang, S. Structural and Physicochemical Characteristics of Rice Bran Dietary Fiber by Cellulase and High-Pressure Homogenization. Applied Sciences 2019, 9, 1270. [CrossRef]
- Liu, Y.; Zhang, H.; Yi, C.; Quan, K.; Lin, B. Chemical composition, structure, physicochemical and functional properties of rice bran dietary fiber modified by cellulase treatment. Food Chem. 2021, 342, 128352. [CrossRef]
- Yang, X.; Dai, J.; Zhong, Y.; Wei, X.; Wu, M.; Zhang, Y.; Huang, A.; Wang, L.; Huang, Y.; Zhang, C.; et al. Characterization of insoluble dietary fiber from three food sources and their potential hypoglycemic and hypolipidemic effects. Food Funct. 2021, 12, 6576-6587. [CrossRef]
- Zhang, Y.; Liao, J.; Qi, J. Functional and structural properties of dietary fiber from citrus peel affected by the alkali combined with high-speed homogenization treatment. LWT 2020, 128, 109397. [CrossRef]
- Moriana, R.; Vilaplana, F.; Karlsson, S.; Ribes-Greus, A. Improved thermo-mechanical properties by the addition of natural fibres in starch-based sustainable biocomposites. Composites Part A: Applied Science and Manufacturing 2011, 42, 30-40. [CrossRef]
- Yang, H.; Yan, R.; Chen, H.; Lee, D.H.; Zheng, C. Characteristics of hemicellulose, cellulose and lignin pyrolysis. Fuel 2007, 86, 1781-1788. [CrossRef]
- Zhang, W.; Zeng, G.; Pan, Y.; Chen, W.; Huang, W.; Chen, H.; Li, Y. Properties of soluble dietary fiber-polysaccharide from papaya peel obtained through alkaline or ultrasound-assisted alkaline extraction. Carbohyd. Polym. 2017, 172, 102-112. [CrossRef]
- Gao, W.; Chen, F.; Zhang, L.; Meng, Q. Effects of superfine grinding on asparagus pomace. Part I: Changes on physicochemical and functional properties. J. Food Sci. 2020, 85, 1827-1833. [CrossRef]
- Xia, Y.; Meng, P.; Liu, S.; Tan, Z.; Yang, X.; Liang, L.; Xie, F.; Zhang, H.; Wang, G.; Xiong, Z.; et al. Structural and Potential Functional Properties of Alkali-Extracted Dietary Fiber from Antrodia camphorata. Front. Microbiol. 2022, 13. [CrossRef]
- He, S.; Tang, M.; Sun, H.; Ye, Y.; Cao, X.; Wang, J. Potential of water dropwort (Oenanthe javanica DC.) powder as an ingredient in beverage: Functional, thermal, dissolution and dispersion properties after superfine grinding. Powder Technol. 2019, 353, 516-525. [CrossRef]
- Nsor-Atindana, J.; Zhong, F.; Mothibe, K.J. In vitro hypoglycemic and cholesterol lowering effects of dietary fiber prepared from cocoa (Theobroma cacao L.) shells. Food Funct. 2012, 3, 1044-1050. [CrossRef]
- Feng, Z.; Dou, W.; Alaxi, S.; Niu, Y.; Yu, L.L. Modified soluble dietary fiber from black bean coats with its rheological and bile acid binding properties. Food Hydrocolloid. 2017, 62, 94-101. [CrossRef]
- Hu, Y.; Fu, X.; Zhang, F.; Ma, F.; Wang, Z.; Xu, S. Hypolipidemic study of xylanase-modified corn bran fibre in rats. Food Chem. 2010, 123, 563-567. [CrossRef]
- Dabour, N.; Elsaadany, K.; Shoukry, E.; Hamdy, S.; Taïbi, A.; Kheadr, E. The ability of yoghurt supplemented with dietary fibers or brans extracted from wheat or rice to reduce serum lipids and enhance liver function in male hypercholesterolemic rats. J. Food Biochem. 2022, 46. [CrossRef]
- Thapa, B. R.; Walia, A. "Liver function tests and their interpretation." The Indian Journal of Pediatrics. 2007, 74, 663-671.
- Shakeel, M.; Jabeen, F.; Qureshi, N.A.; Fakhr-E-Alam, M. Toxic Effects of Titanium Dioxide Nanoparticles and Titanium Dioxide Bulk Salt in the Liver and Blood of Male Sprague-Dawley Rats Assessed by Different Assays. Biol. Trace Elem. Res. 2016, 173, 405-426. [CrossRef]
- Xu, Y.; Zhang, X.; Yan, X.; Zhang, J.; Wang, L.; Xue, H.; Jiang, G.; Ma, X.; Liu, X. Characterization, hypolipidemic and antioxidant activities of degraded polysaccharides from Ganoderma lucidum. Int. J. Biol. Macromol. 2019, 135, 706-716. [CrossRef]
- Gao, H.; Zeng, Z.; Zhang, H.; Zhou, X.; Guan, L.; Deng, W.; Xu, L. The Glucagon-Like Peptide-1 Analogue Liraglutide Inhibits Oxidative Stress and Inflammatory Response in the Liver of Rats with Diet-Induced Non-alcoholic Fatty Liver Disease. Biol. Pharm. Bull. 2015, 38, 694-702. [CrossRef]
- Zhao, M.; Sheng, X.; Huang, Y.; Wang, Y.; Jiang, C.; Zhang, J.; Yin, Z. Triterpenic acids-enriched fraction from Cyclocarya paliurus attenuates non-alcoholic fatty liver disease via improving oxidative stress and mitochondrial dysfunction. Biomed. Pharmacother. 2018, 104, 229-239. [CrossRef]
- Liu, T.; Wang, N.; Xu, X.; Wang, D. Effect of high quality dietary fiber of Hericium erinaceus on lowering blood lipid in hyperlipidemia mice. Journal of Future Foods 2022, 2, 61-68. [CrossRef]
Figure 1.
SEM of H-RBDF (A), N-RBDF (B) and E-RBDF (C) (2000 ×, 20000 ×).
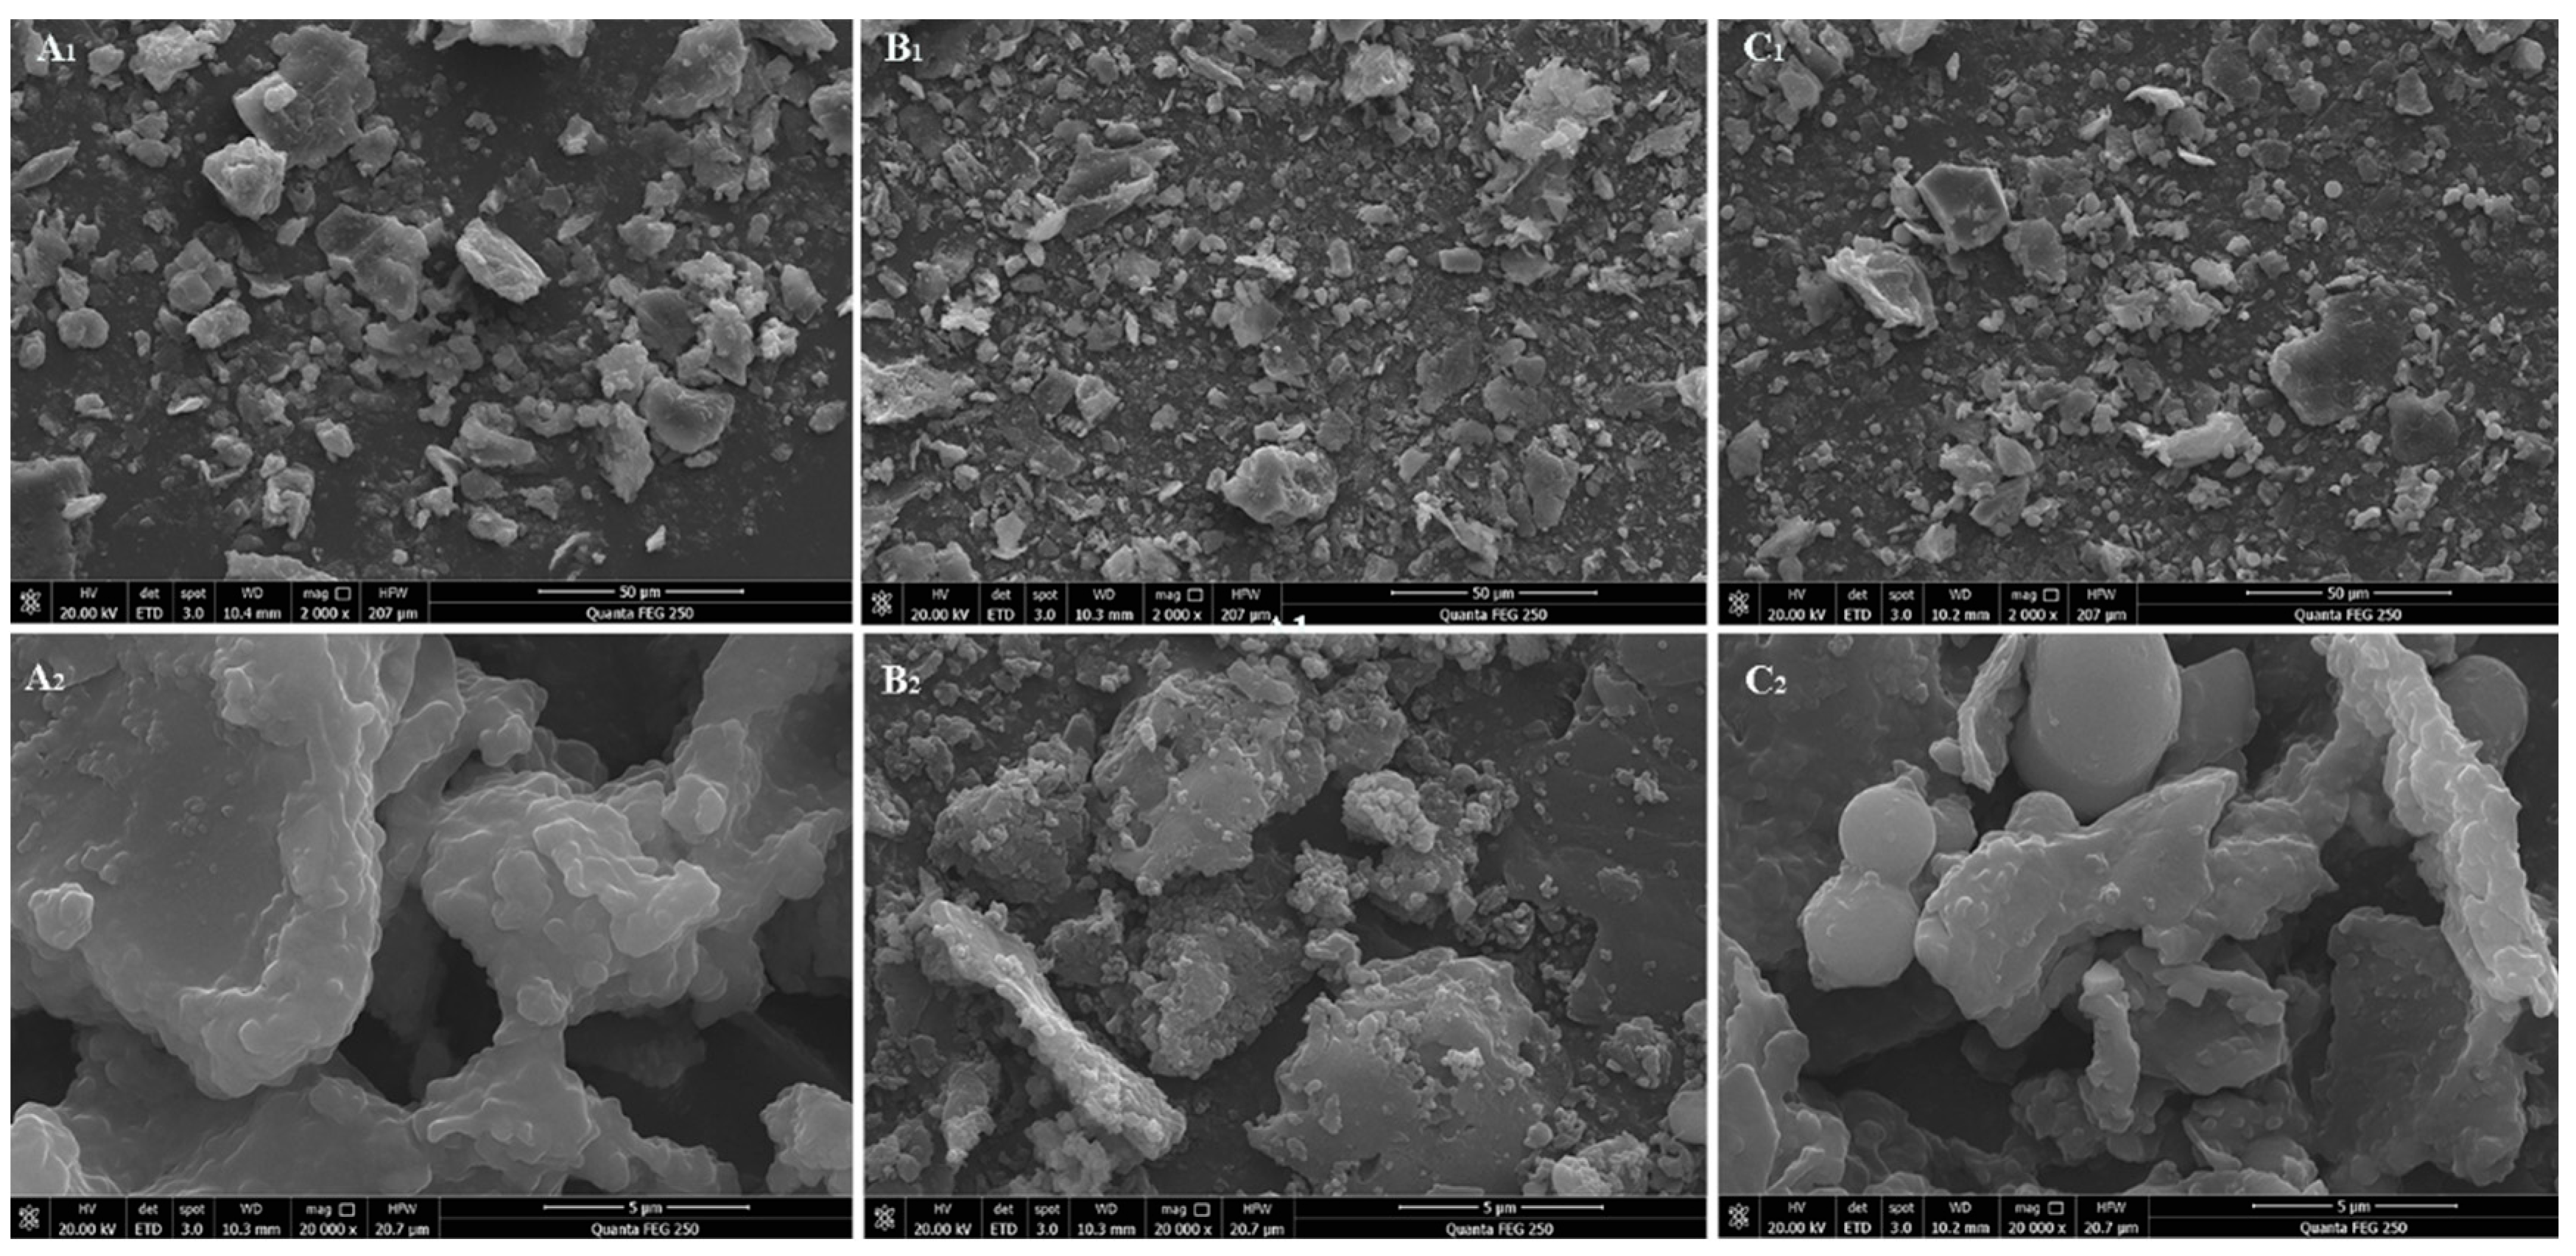
Figure 2.
Fourier infrared spectrum of H-RBDF, N-RBDF and E-RBDF.
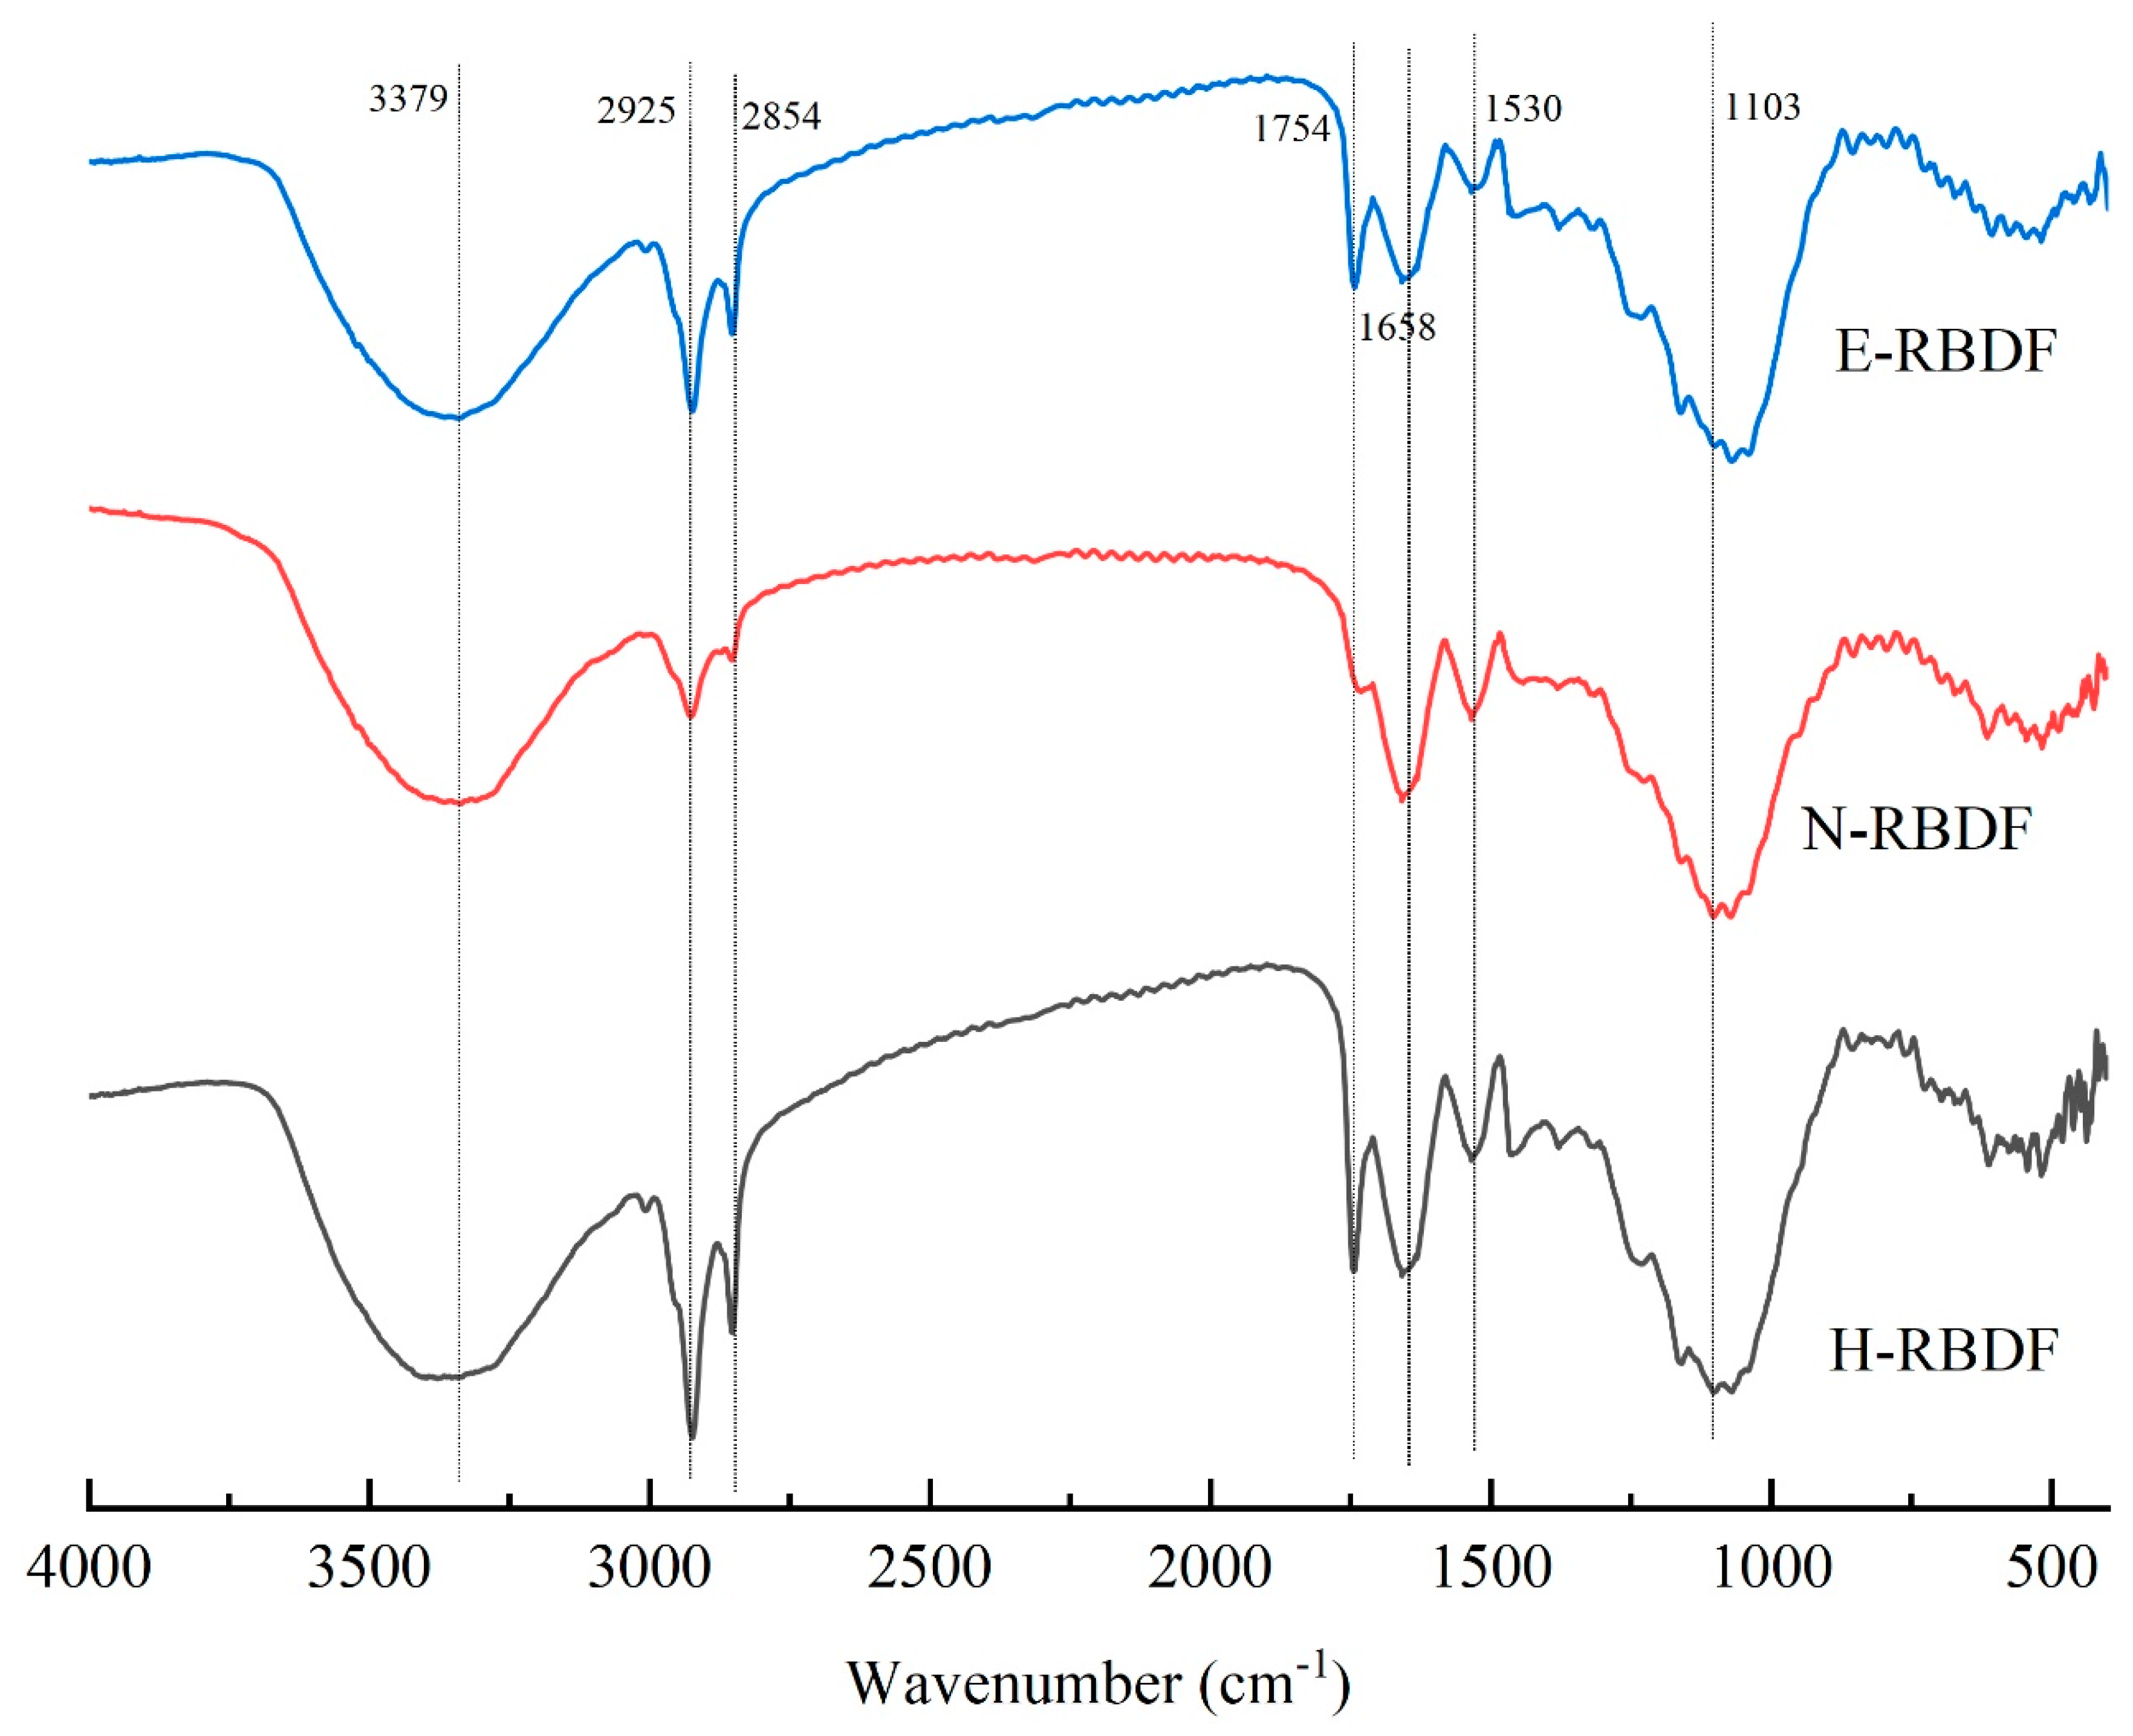
Figure 3.
XRD patterns of H-RBDF, N-RBDF and E-RBDF.
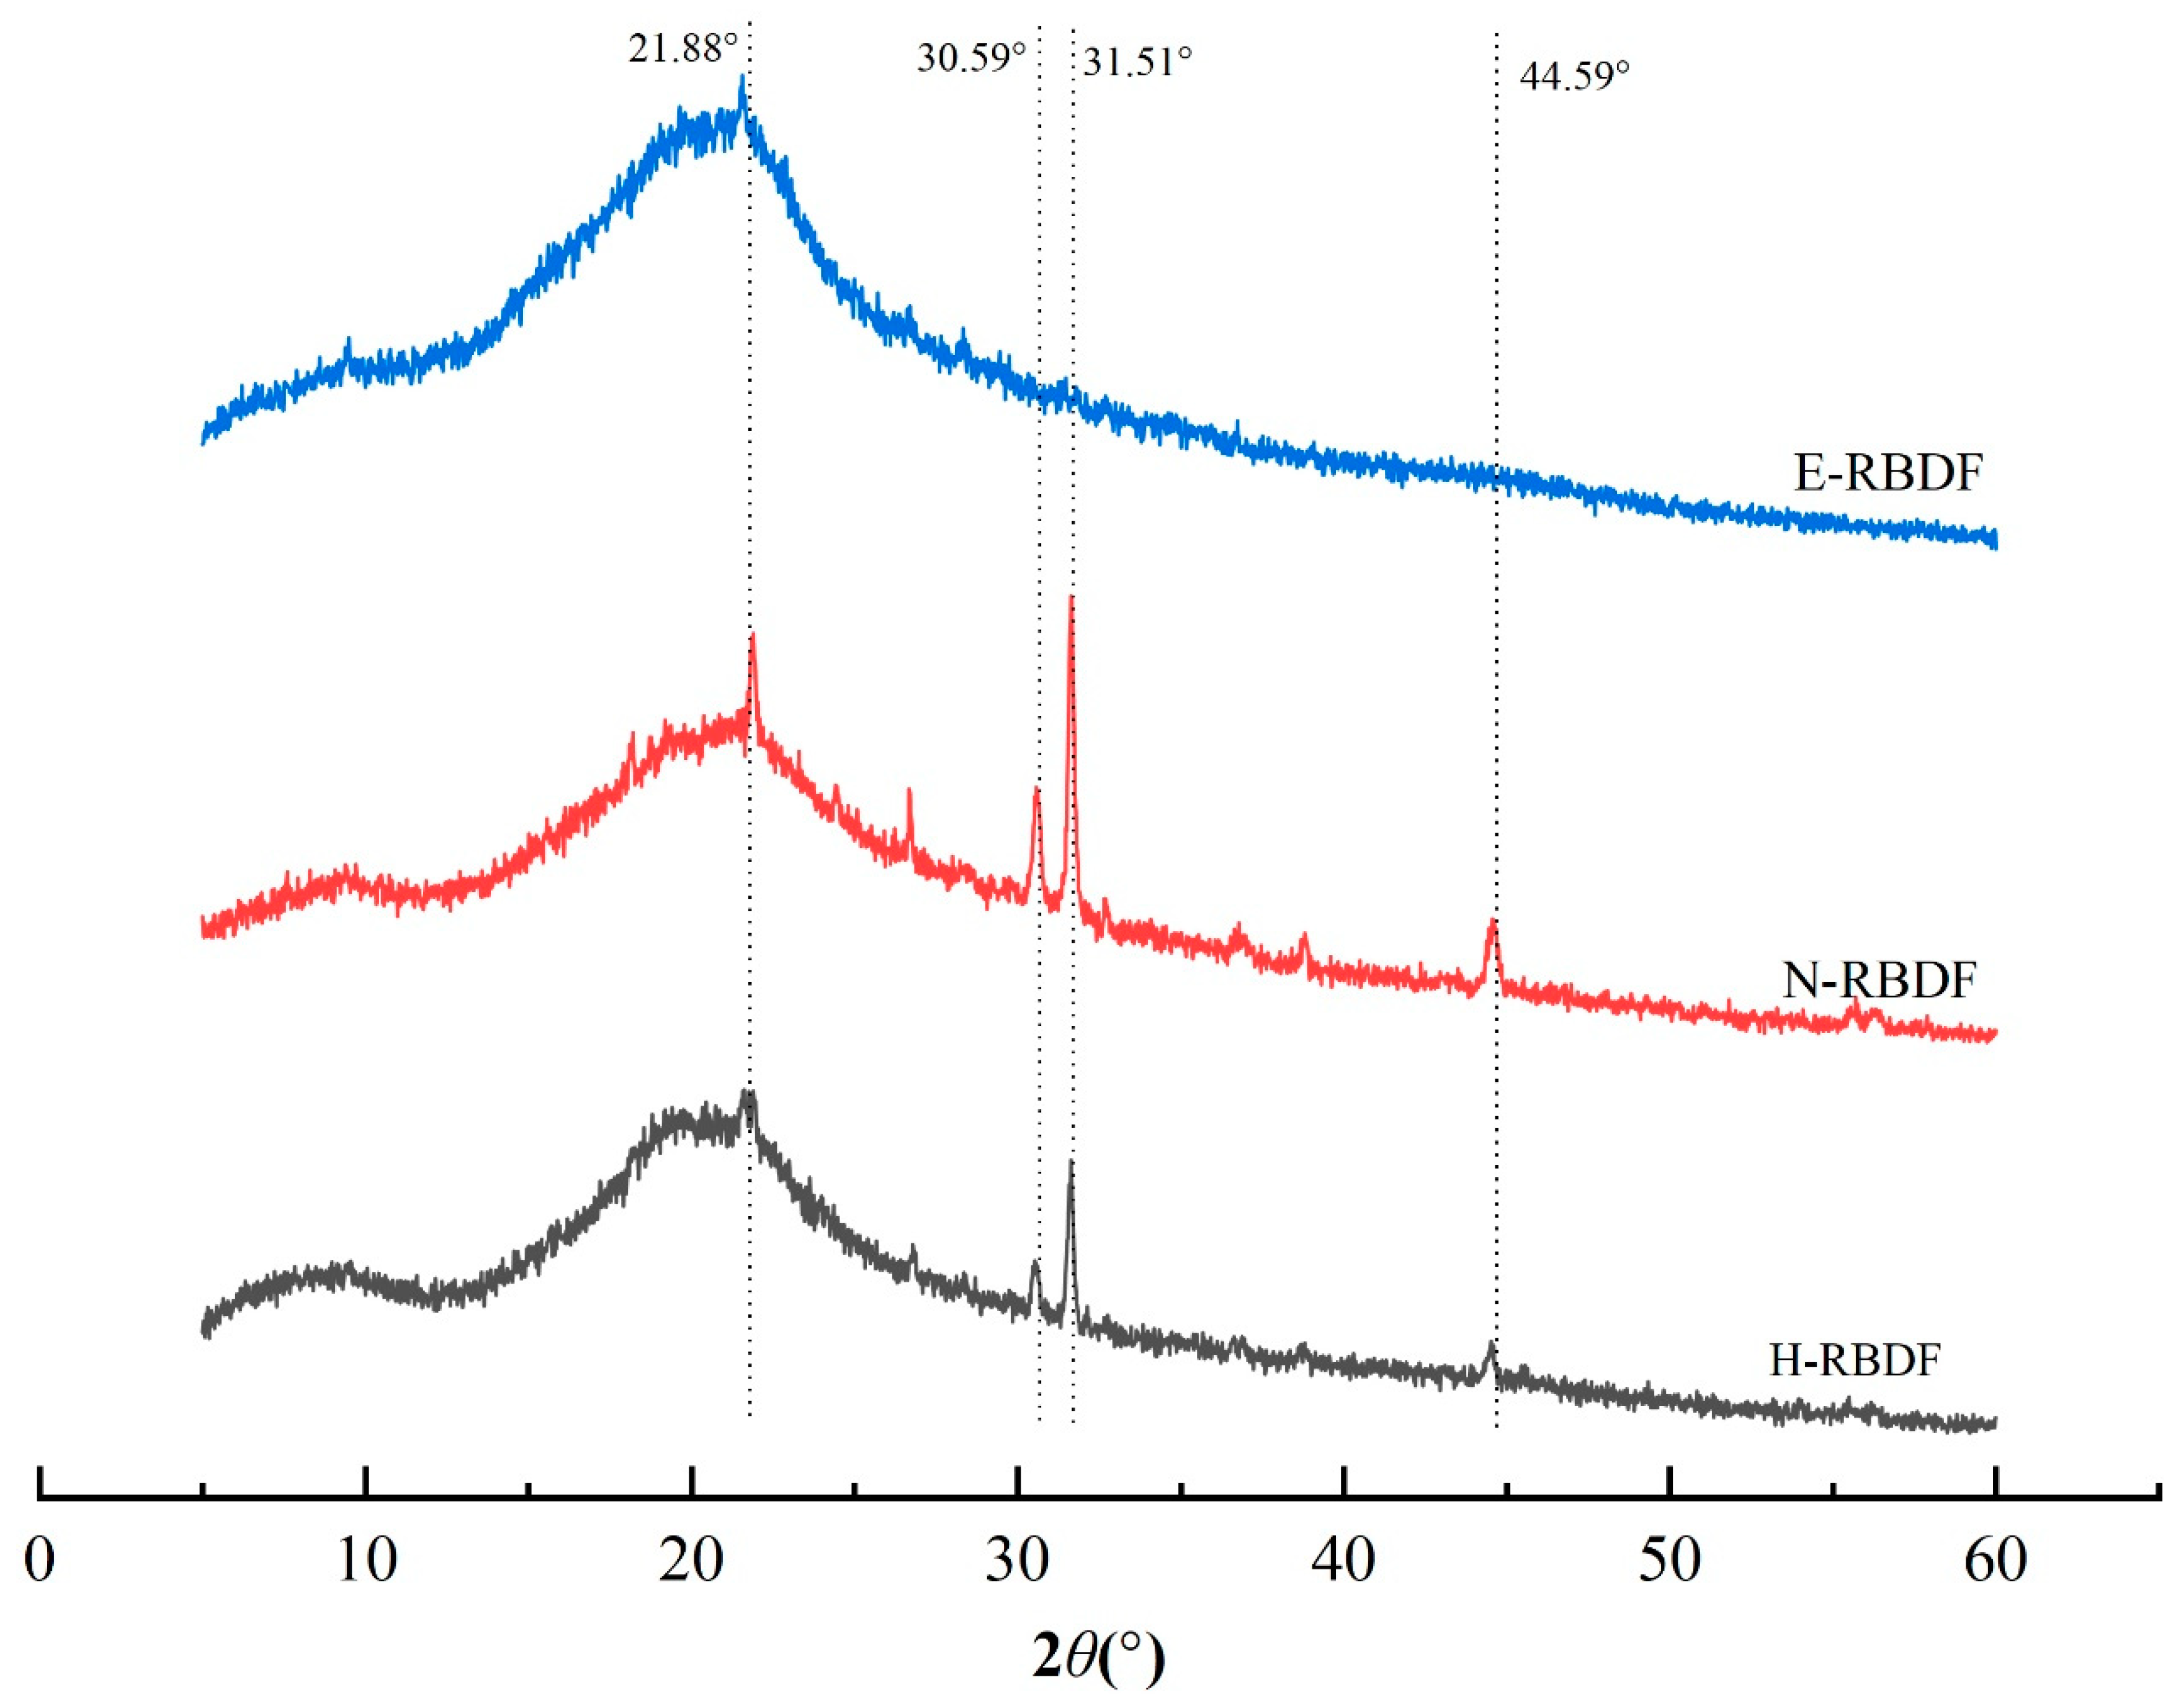
Figure 4.
Thermogravimetric (a) and differential thermogravimetric (b) curves of H-RBDF、N-RBDF and E-RBDF.
Figure 4.
Thermogravimetric (a) and differential thermogravimetric (b) curves of H-RBDF、N-RBDF and E-RBDF.
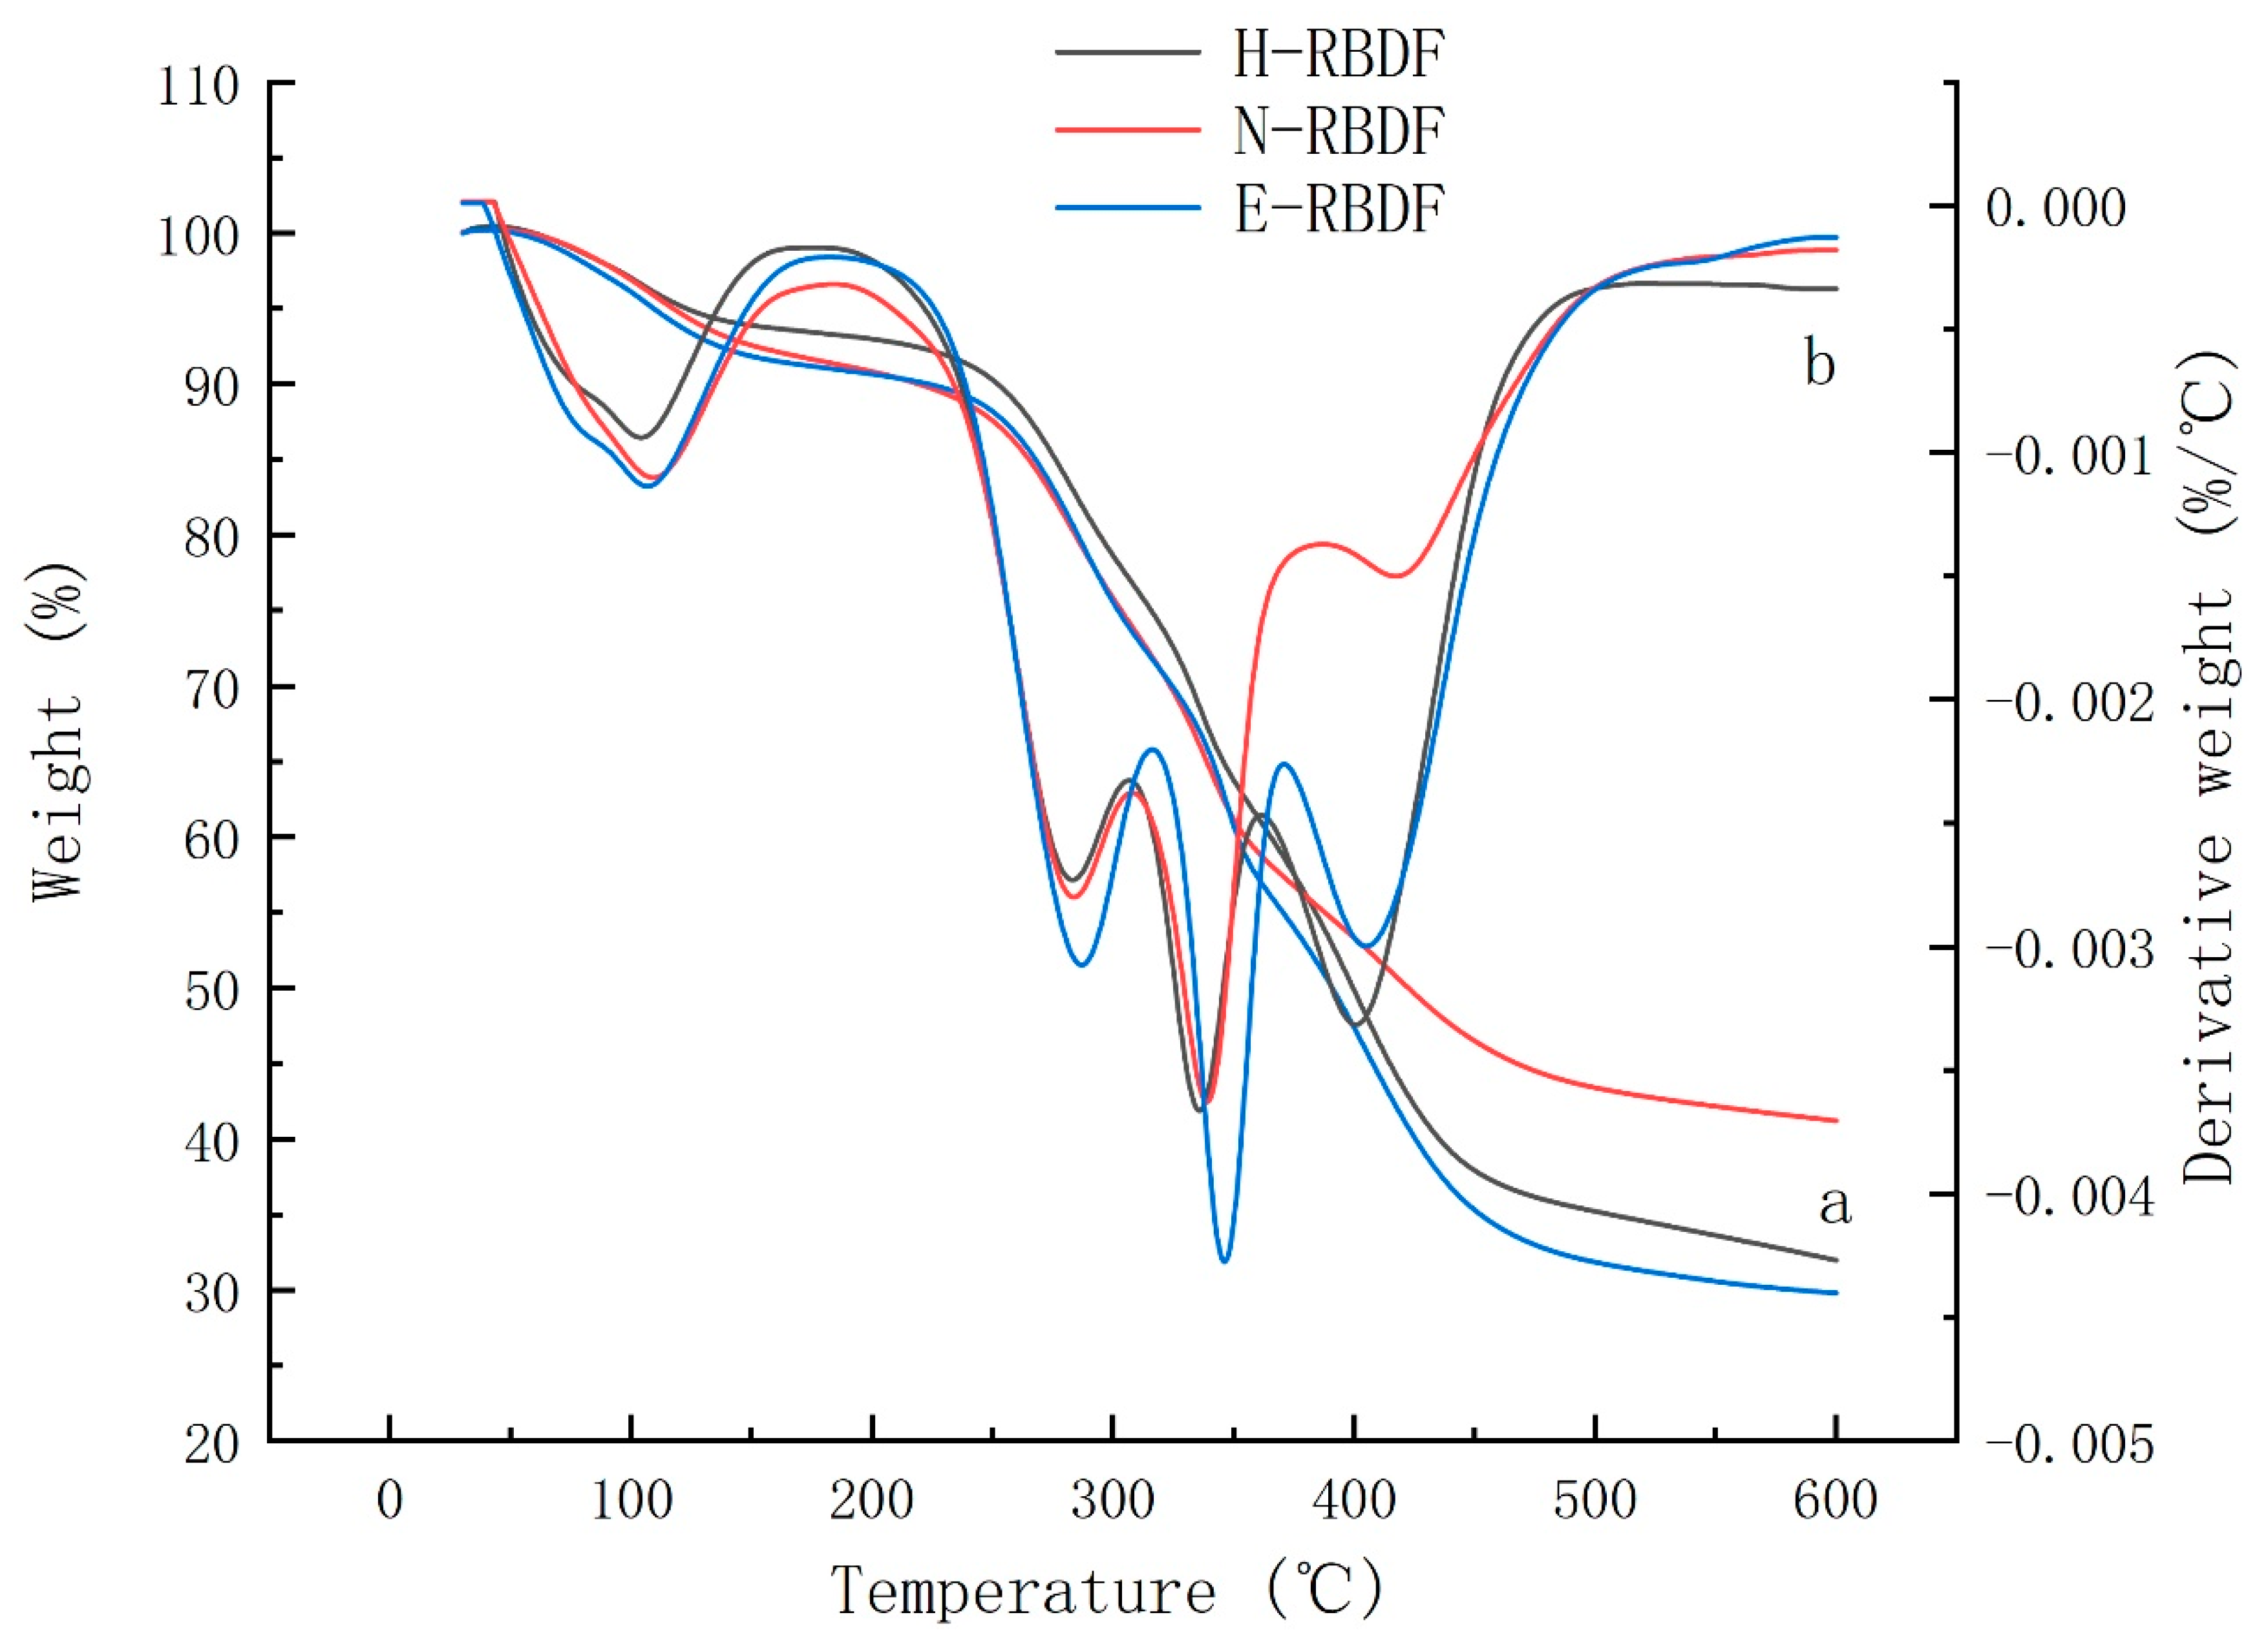
Figure 5.
Cholesterol adsorption capacity of H-RBDF, N-RBDF and E-RBDF. The values represent mean ± SD (n = 3), and showed significant difference at the p < 0.05 levels.
Figure 5.
Cholesterol adsorption capacity of H-RBDF, N-RBDF and E-RBDF. The values represent mean ± SD (n = 3), and showed significant difference at the p < 0.05 levels.
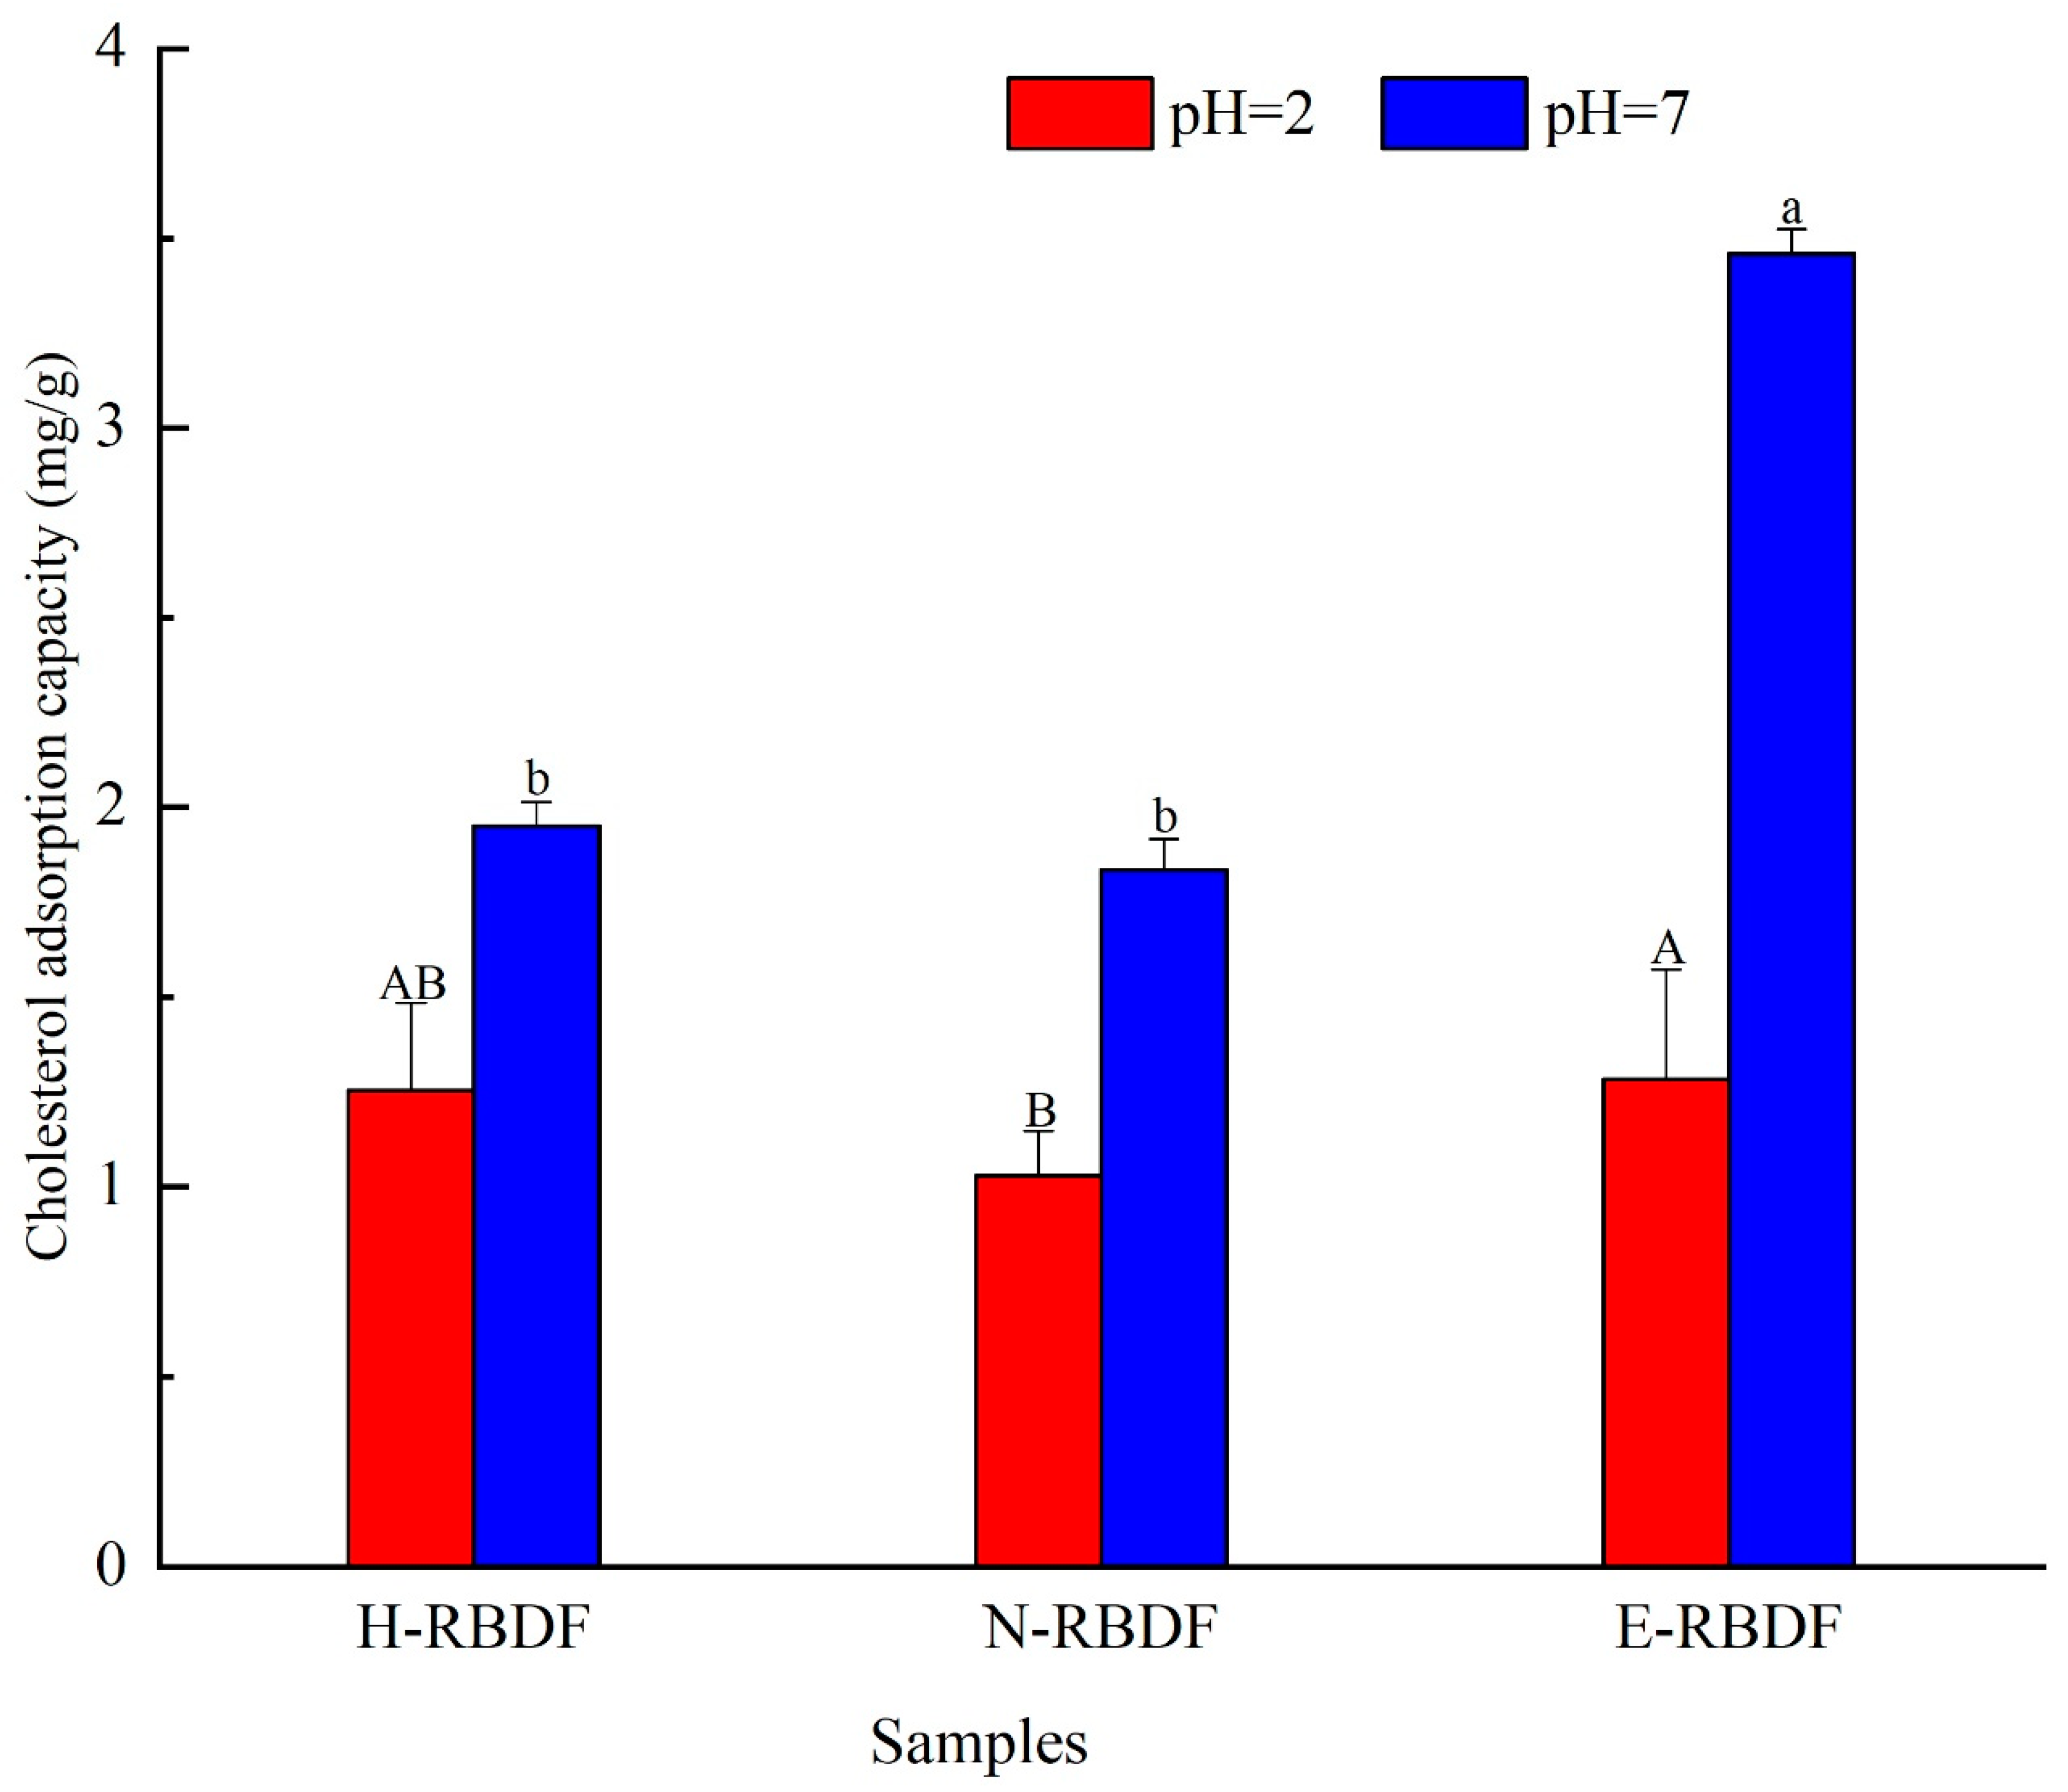
Figure 6.
In vitro adsorption capacities to sodium cholate binding capacity of H-RBDF, N-RBDF and E-RBDF. The values represent mean ± SD (n = 3). Different letters are significantly different at the level of p < 0.05.
Figure 6.
In vitro adsorption capacities to sodium cholate binding capacity of H-RBDF, N-RBDF and E-RBDF. The values represent mean ± SD (n = 3). Different letters are significantly different at the level of p < 0.05.

Figure 7.
Effects of three types of rice bran meal dietary fiber on AST and ALT levels in rat serum. The values represent mean ± SD (n = 7), and different letters showed significant difference at the p < 0.05 levels.
Figure 7.
Effects of three types of rice bran meal dietary fiber on AST and ALT levels in rat serum. The values represent mean ± SD (n = 7), and different letters showed significant difference at the p < 0.05 levels.
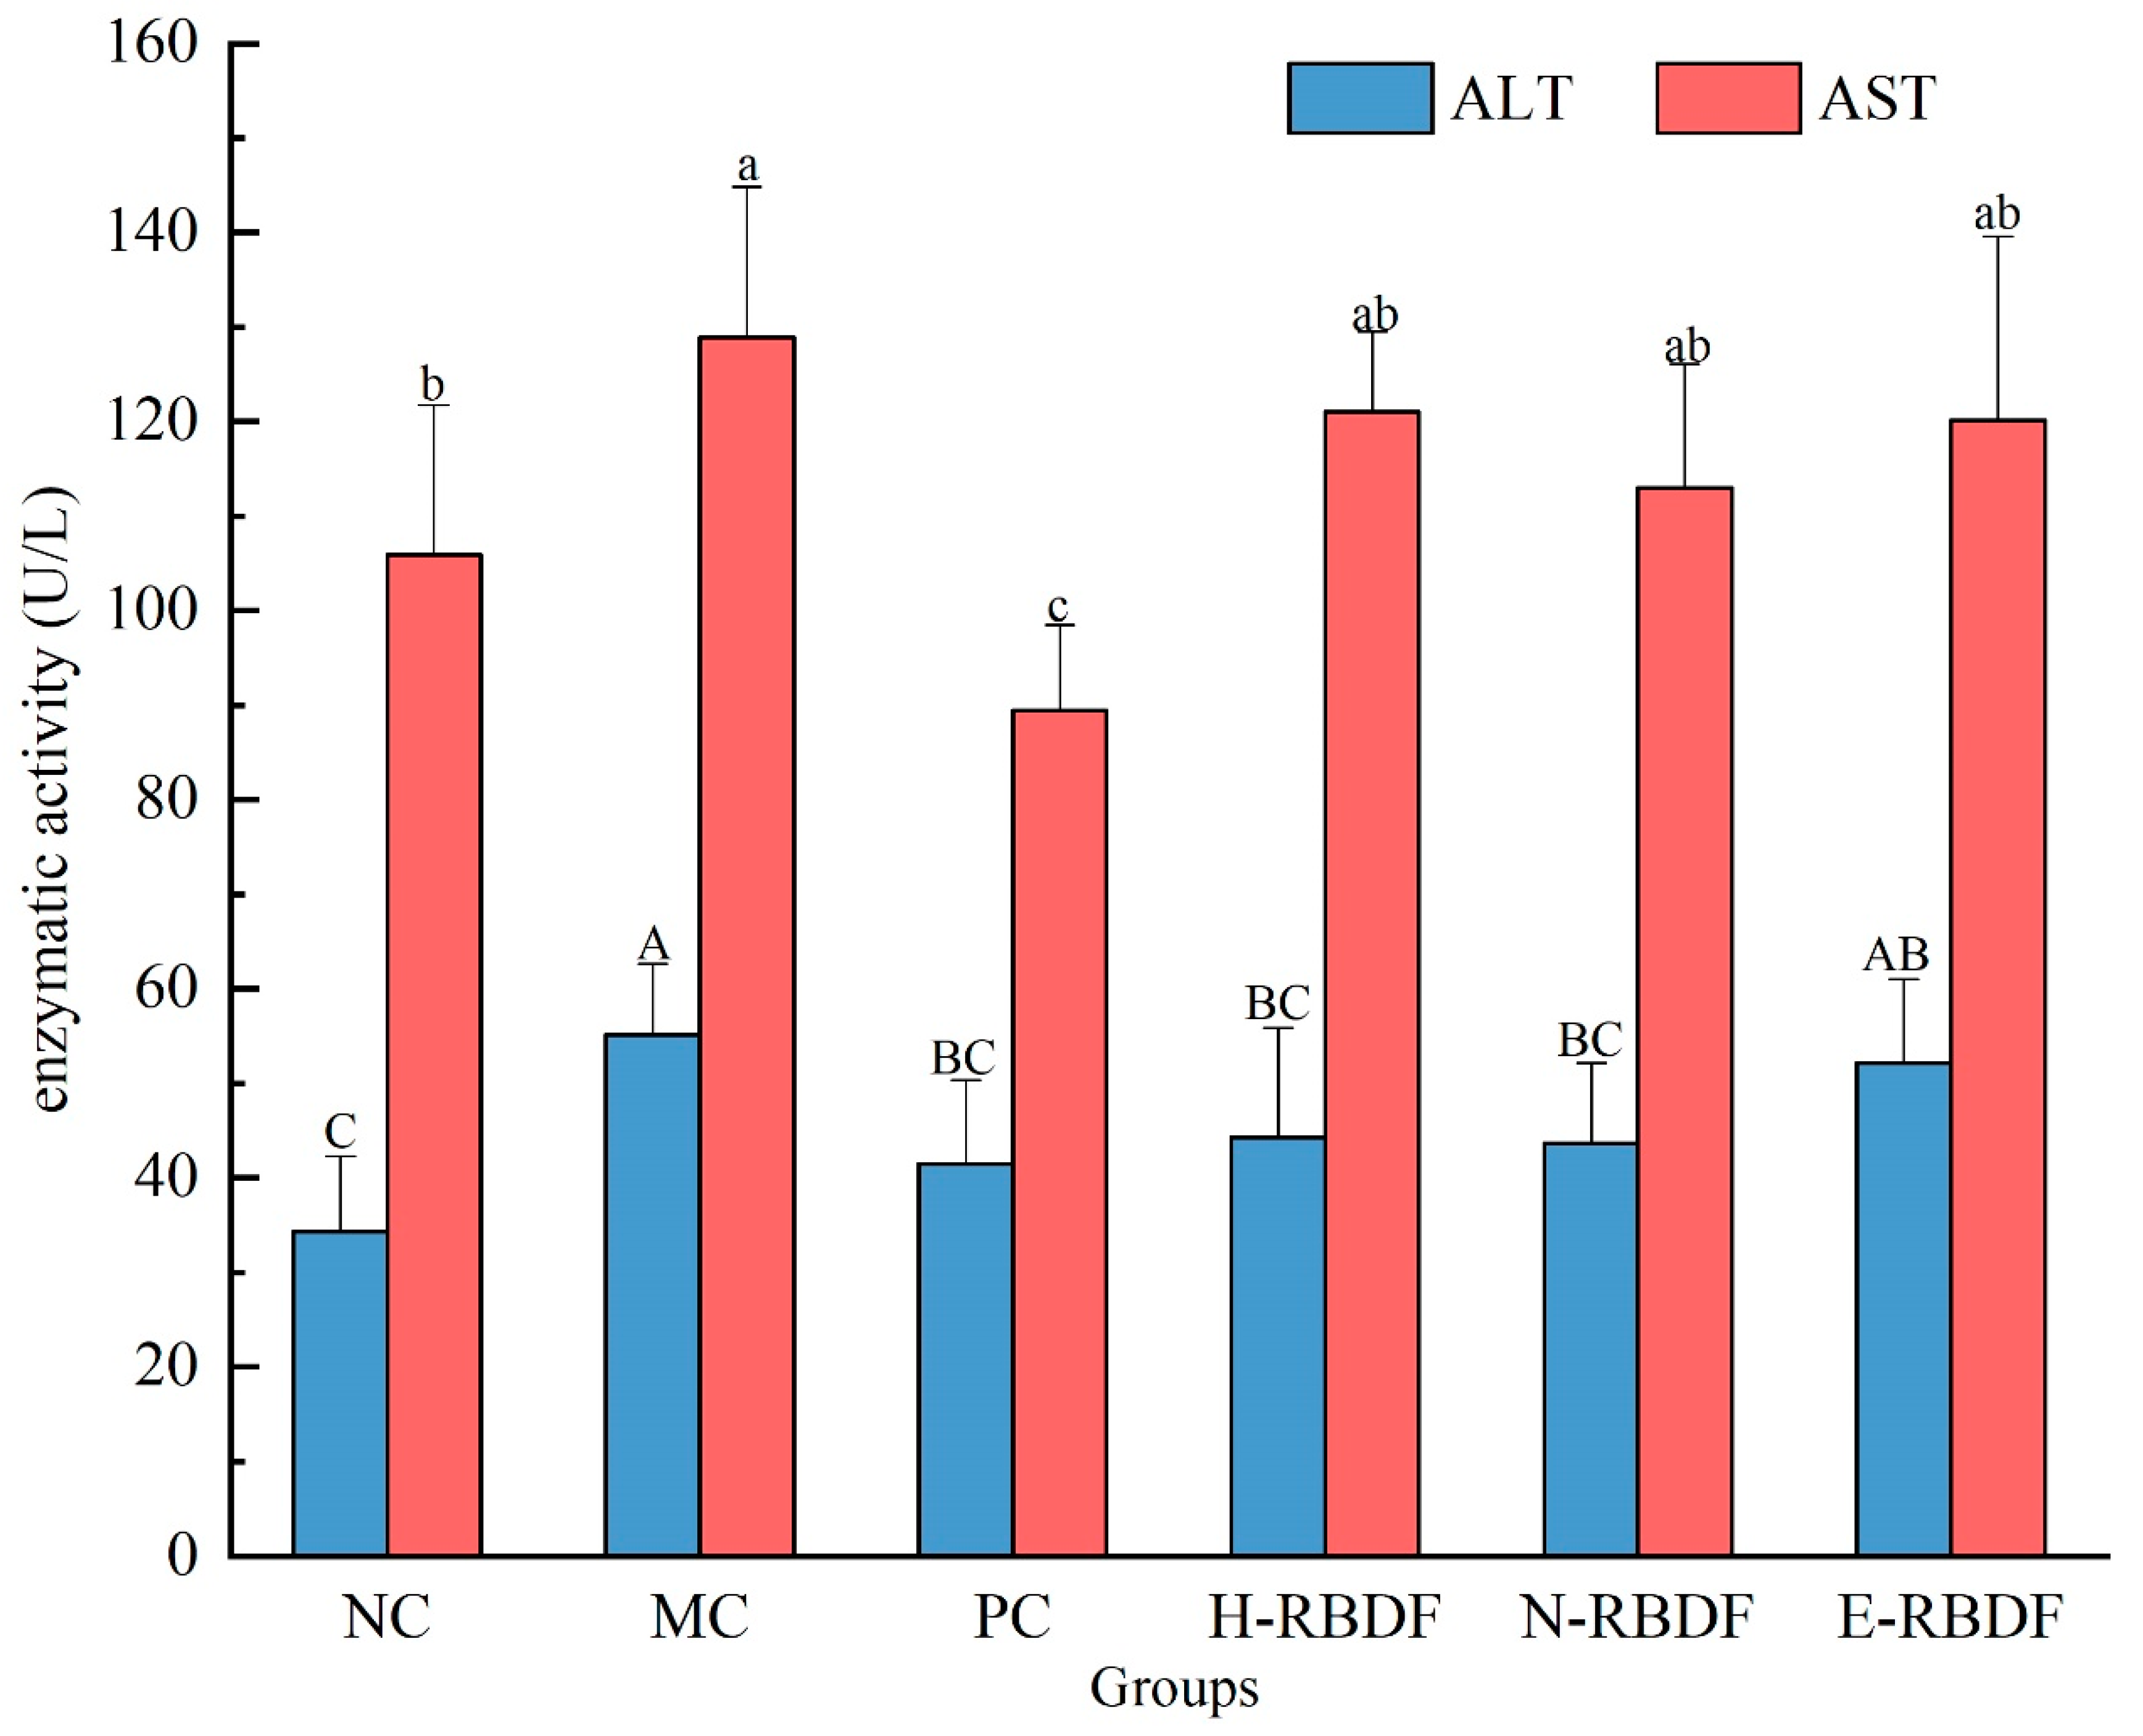
Figure 8.
Effects of three types of rice bran meal dietary fiber on the appearance of the liver in hyperlipidemic rats.
Figure 8.
Effects of three types of rice bran meal dietary fiber on the appearance of the liver in hyperlipidemic rats.
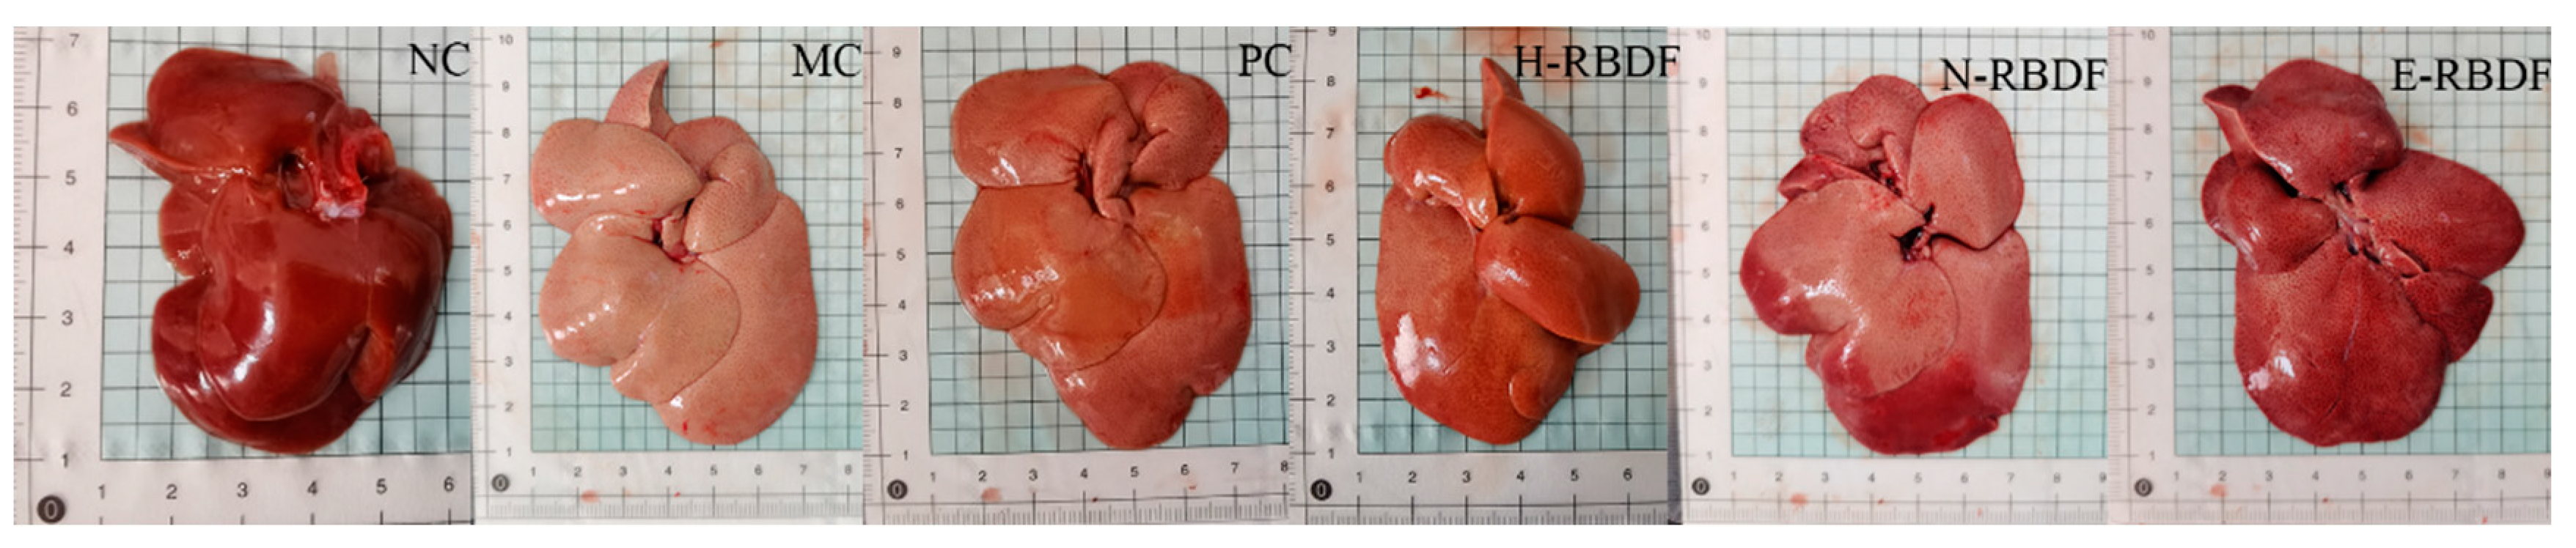
Figure 9.
Effects of three types of rice bran meal dietary fiber on pathological changes in the liver of hyperlipidemic rats.
Figure 9.
Effects of three types of rice bran meal dietary fiber on pathological changes in the liver of hyperlipidemic rats.
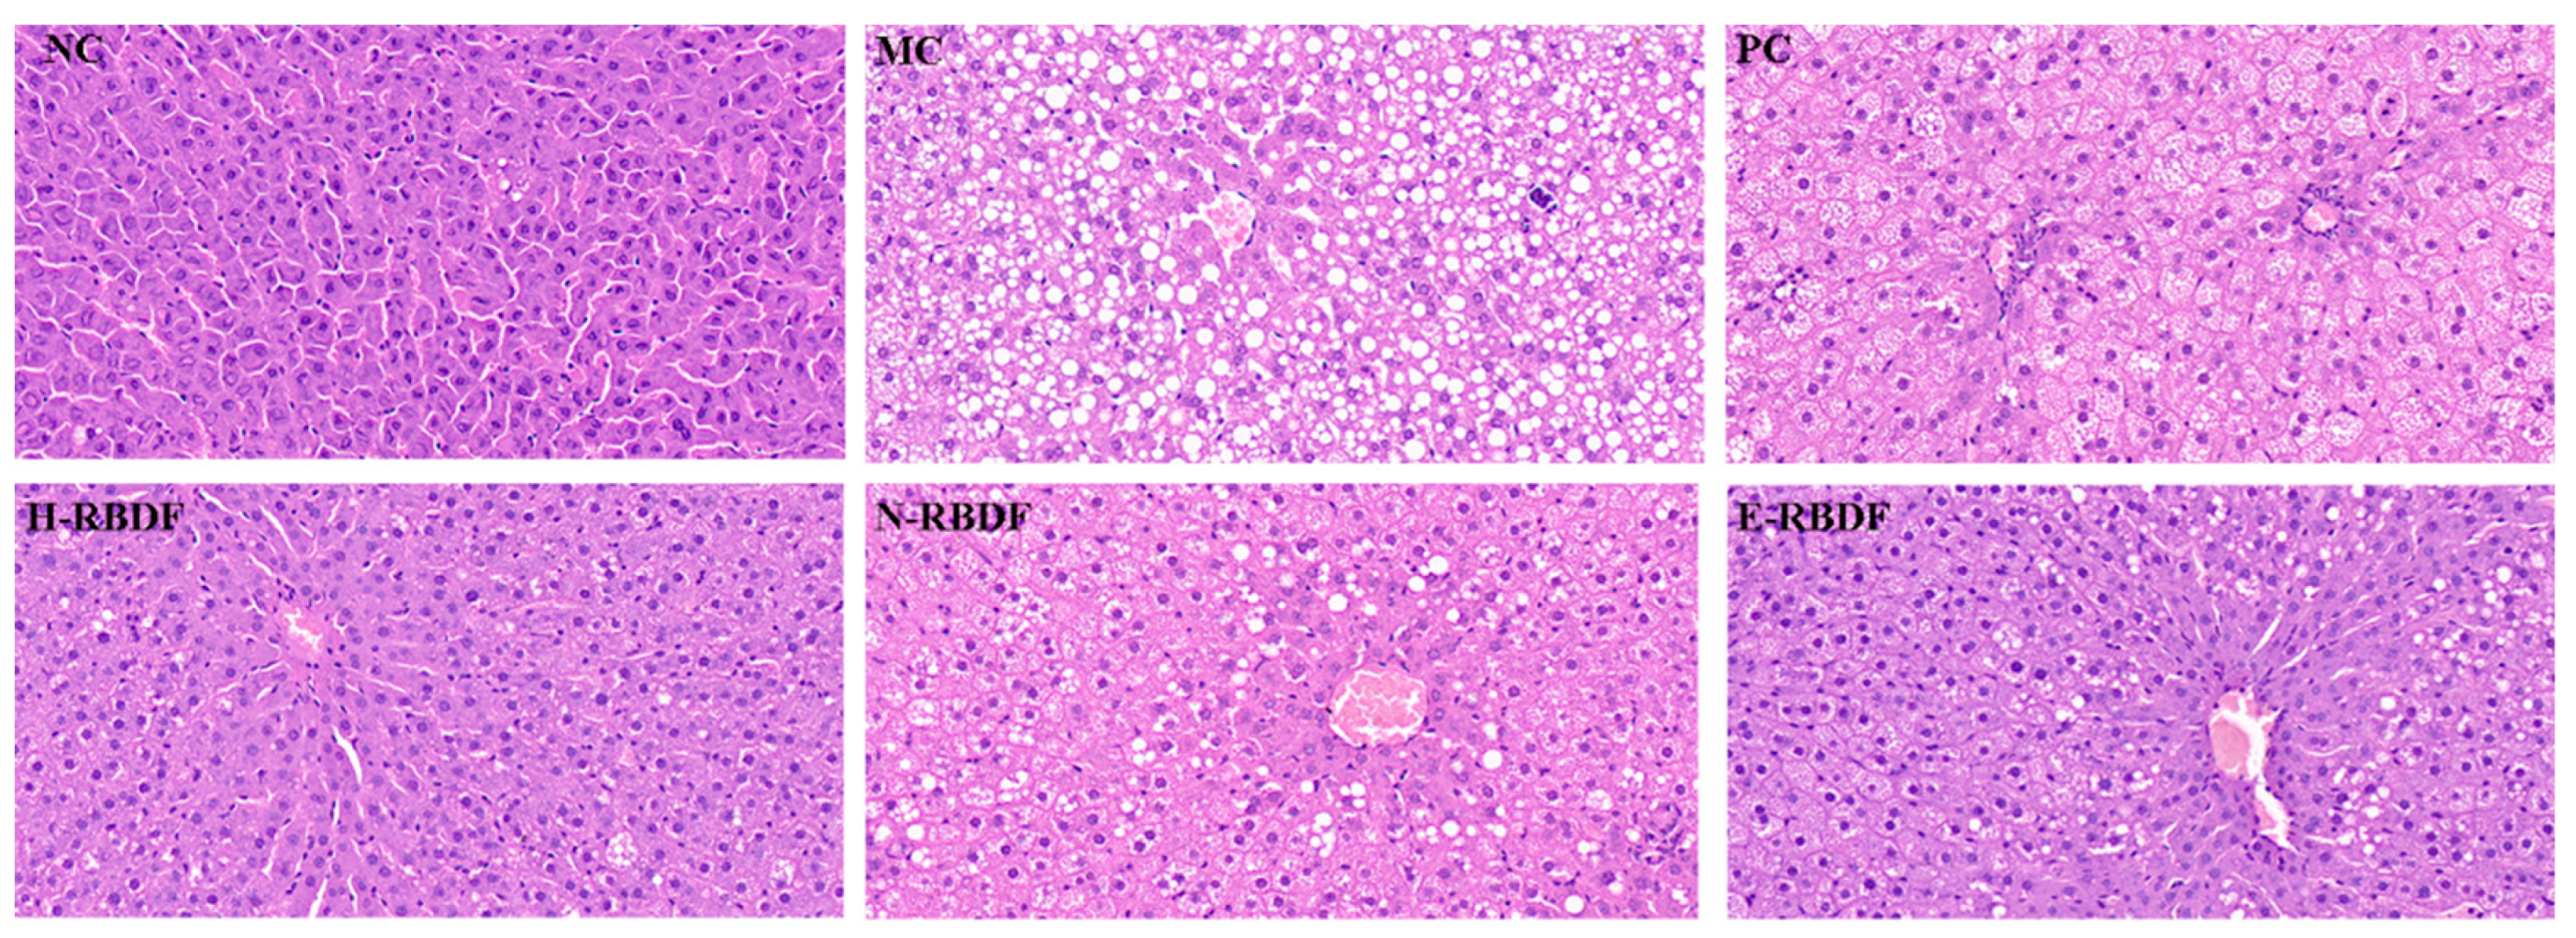

Table 1.
Feeding and drug administration for each group of rats.
| Group | Feed | Gavage drugs |
|---|---|---|
| NC | Basic feed | Normal saline |
| MC | High-fat feed | Normal saline |
| PC | High-fat feed | 2 mg/Kg BW/d Simvastatin |
| H-RBDF | High-fat feed | 3 g/Kg BW/d H-RBDF |
| N-RBDF | High-fat feed | 3 g/Kg BW/d N-RBDF |
| E-RBDF | High-fat feed | 3 g/Kg BW/d E-RBDF |
Table 2.
Particle size distribution of H-RBDF, N-RBDF and E-RBDF.
| Sample | Specific surface area m2/g |
D [3,2] (μm) | D10(μm) | D50(μm) | D90(μm) | Span |
|---|---|---|---|---|---|---|
| H-RBDF | 1914.75 | 31.34 | 15.94 | 39.82 | 136.68 | 3.03 |
| N-RBDF | 5613.72 | 10.68 | 4.68 | 18.10 | 51.95 | 2.61 |
| E-RBDF | 3082.04 | 19.47 | 9.35 | 26.15 | 70.72 | 2.34 |
Note: D [3,2] denotes the area-averaged diameter of the particles; D10, D50 and D90 denote the particle size corresponding to a sample with a cumulative particle size distribution of 10%, 50% and 90%; Span is the span: .
Table 3.
WHC OHC and SC of H-RBDF, N-RBDF and E-RBDF.
| Samples | WHC (g/g) | OHC (g/g) | SC (mL/g) |
|---|---|---|---|
| N-RBDF | 1.85 ± 0.05b | 1.46 ± 0.00b | 1.19 ± 0.00b |
| E-RBDF | 2.39 ± 0.01a | 1.61 ± 0.01a | 1.59 ± 0.01a |
| H-RBDF | 1.53 ± 0.02c | 1.26 ± 0.02c | 1.20 ± 0.01b |
Note: Data are presented as the mean values ± SD (n = 3). Different letters in the same column indicate significant differences p < 0.05.
Table 4.
Effects of three types of rice bran meal dietary fiber on TG, TC, HDL-C, LDL-C and AI in the serum of hyperlipidemic rats.
Table 4.
Effects of three types of rice bran meal dietary fiber on TG, TC, HDL-C, LDL-C and AI in the serum of hyperlipidemic rats.
| Groups | TC (mmol/L) |
TG (mmol/L) |
HDL-C (mmol/L) |
LDL-C (mmol/L) |
AI |
|---|---|---|---|---|---|
| NC | 0.71 ± 0.19 | 1.59 ± 0.19 | 1.02 ± 0.20 | 0.34 ± 0.09 | 0.58 ± 0.17 |
| MC | 1.97 ± 0.80ΔΔ | 2.63 ± 0.67ΔΔ | 0.78 ± 0.13Δ | 0.83 ± 0.33ΔΔ | 2.44 ± 0.95ΔΔ |
| PC | 0.95 ± 0.37** | 2.38 ± 0.37 | 0.76 ± 0.15 | 0.81 ± 0.20* | 2.16 ± 0.44 |
| H-RBDF | 1.01 ± 0.31** | 2.15 ± 0.22* | 0.79 ± 0.07 | 0.70 ± 0.10* | 1.72 ± 0.31* |
| N-RBDF | 0.95 ± 0.26** | 2.23 ± 0.37 | 0.73 ± 0.15 | 0.69 ± 0.17* | 2.09 ± 0.40 |
| E-RBDF | 0.76 ± 0.18** | 1.97 ± 0.41* | 0.78 ± 0.16 | 0.74 ± 0.14* | 1.55 ± 0.46* |
Note: Data are presented as the mean values ± SD (n = 7); Compared with NC group, Δ p < 0.05, ΔΔ p < 0.01; Compared with the MC group, * p < 0.05, ** p < 0.01.
Table 5.
Effects of three types of rice bran meal dietary fiber on GSH-Px, SOD and MDA in rat liver.
Table 5.
Effects of three types of rice bran meal dietary fiber on GSH-Px, SOD and MDA in rat liver.
| Groups | GSH-Px (U/mgprot) | SOD (U/mgprot) | MDA (nmol/mgprot) |
|---|---|---|---|
| NC | 102.7 ± 10.16 | 32.2 ± 5.17 | 26.9 ± 3.36 |
| MC | 50.0 ± 8.96ΔΔ | 5.6 ± 1.50ΔΔ | 151.5 ± 21.13ΔΔ |
| PC | 76.4 ± 13.66** | 6.9 ± 1.74 | 56.1 ± 10.73** |
| H-RBDF | 72.2 ± 12.36** | 8.8 ± 2.83* | 78.7 ± 15.66** |
| N-RBDF | 67.7 ± 9.86* | 7.2 ± 1.50 | 82.6 ± 10.44** |
| E-RBDF | 86.9 ± 5.73** | 7.8 ± 1.52 | 63.7 ± 14.64** |
Note: Data are presented as the mean values ± SD (n = 7); Compared with NC group, Δ p < 0.05, ΔΔ p < 0.01; Compared with the MC group, * p < 0.05, ** p < 0.01.
Disclaimer/Publisher’s Note: The statements, opinions and data contained in all publications are solely those of the individual author(s) and contributor(s) and not of MDPI and/or the editor(s). MDPI and/or the editor(s) disclaim responsibility for any injury to people or property resulting from any ideas, methods, instructions or products referred to in the content. |
© 2023 by the authors. Licensee MDPI, Basel, Switzerland. This article is an open access article distributed under the terms and conditions of the Creative Commons Attribution (CC BY) license (http://creativecommons.org/licenses/by/4.0/).
Copyright: This open access article is published under a Creative Commons CC BY 4.0 license, which permit the free download, distribution, and reuse, provided that the author and preprint are cited in any reuse.


