
Submitted:
23 May 2023
Posted:
24 May 2023
You are already at the latest version
Abstract
Food processing and consumption involves multiple contacts between biological fluids and solid materials of processing devices of which steel is one of the most common. Due to complexity of these interactions, it is difficult to identify the main control factors in the formation of undesirable deposits on the device surfaces that may affect safety and efficiency of the processes. Mechanistic understanding of biomolecule-metal interactions involving food proteins could improve management of these pertinent industrial processes and consumer safety in food industry and beyond. In this work, we perform a multiscale study of formation of protein corona on iron surfaces and nanoparticles in contact with cow milk proteins. By calculating the binding energies of proteins with the substrate we quantify the adsorption strength and rank proteins by the adsorption affinity. We use a multiscale method involving all-atom and coarse-grained simulations as well as generation of 3D structures of the proteins for this purpose. Finally, using the adsorption energy results, we predict the composition of protein corona on iron nanoparticles and flat surfaces via a competitive adsorption model.
Keywords:
nanoparticle
; potential of mean force
; protein adsorption
; proteins corona
; bionano interface
; multiscale modelling
1. Introduction
Biological activity and biocompatibility of inorganic materials are controlled by interactions at the bionano interface – a nanoscale layer where the material gets in contact with biomolecules. Through biomolecule adsorption, change of conformation, and surface chemistry, the bionano interface plays a key role in medical applications and food processing. Understanding the underlying mechanism for these interactions may help to control bio film growing, fouling, or contamination by metabolites arsing from bacterial activity at the contact surfaces [1,2,3,4]. Therefore, a molecular level insight into the main contributions governing the adhesion of biomolecules and the structure of the bionano interface would be beneficial.
Among the materials used in industrial and medical applications one of the most common one is the stainless steel, predominately consisting of metallic iron alloyed with chromium and carbon. These materials are widely used due to a low cost, relative biological neutrality, and corrosion resistance at standard low heat conditions. However, this might be not true at the higher temperatures: e.g. milk fouling and milk contamination is a critical problem in the heating process for food industry [5]. Daily, about a billion liters of milk being being processed. This causes fouling of the surfaces of heat exchangers which in turn leads to decreased heat transfer efficiency and frequent pressure drop events. Efficient and fast cleaning of factory’s heat transfer equipment is a costly and challenging task. When done often it can result in reduced production volumes and economical losses [6]. When liquid milk is heated, several processes take place that result in the deposition of minerals and proteins on the surface of containers. Generally, a thin protein layer is formed on a material’s surface right after the liquid milk is brought in contact with a food processing unit [7]. Adsorbed proteins may contribute to the decrease of heating by forming an insulating layer between the heater and material, can affect milk pasteurization and sterilization, and may cause contamination [8]. Physicochemical characteristics of the heat exchanger surface as well as the conditions and biochemical composition of the milk determine the outcome of this interaction. [9,10].
Beside the food industry, biomolecular interactions at metallic surfaces are essential for implants and other medical devices. When a tissue makes contact with such surfaces, unfavorable reactions such as infections, fibrosis, thrombosis, and inflammation may result [11]. Recent research demonstrates that quickly after implantation a layer of proteins form interstitial fluids covers biomaterial implants. Thus, the nature of this protein layer and its properties play a key role in how cells responses. To improve the operation and safety of medical implants, it is imperative to develop materials that cause the necessary tissue reactions. In order to increase implant biocompatibility, the majority of research has concentrated on the engineering of surface features that can change the numbers and types of bound proteins as well as the conformation, orientation, or binding strength of the adsorbed proteins [11,12,13].
Finally, the interest to bionano interactions is also driven by the concerns of safety of nanoparticles (NP) for human and animal health. The NP toxicity correlates to chemical aggressiveness of the material and scales with its physicochemical properties such as surface area, charge, or reactivity [14]. Establishing the relationship between metal properties and the reaction with different biomolecules is therefore key to screening the materials for potential health risks. In practice, the safety assessment is often costly and time-consuming and includes animal studies. In silico modelling may help predicting the interactions of nanomaterials with living organisms and providing the required information in a humane and cost-effective way [15,16,17,18,19]. Statistical data-driven methods are used for this purpose, where sufficient data are available [20,21,22]. Recently, also physics-based models have addressed the bionano interface. In particular, mechanisms of formation of NP protein corona have been studied my multple labs [23,24,25,26]. It is expected that the composition and configuration of corona determine the biochemical reactivity and sensitivity of NPs as well as their cell uptake and systemic transfer [23,27]. Yet, to allow predictive modelling one needs more information about the interactions at the bionano interface and their relation to the material and protein properties.
In this work, we investigate interactions between milk proteins and three face-centered-cubic (fcc) slabs of zero-valent iron constituting a simplified model of the stainless steel. To accomplish this, we have selected six of the most abundant proteins from the major protein groups found in natural cow milk [28]. Our primary goal is to quantify the binding affinity of these proteins on iron surfaces by evaluating their adsorption energy at their different orientations in respect to the solid iron. To calculate these energies and to predict the composition of insulating protein layer on the metallic surfaces, we will invoke a three-stage multiscale computational method including all-atom [29,30] and coarse-grained (CG) United Atom (UA) [26,31] and Monte-Carlo [22] simulations. This method was previously applied to explain various examples of interfacial phenomena between biomolecules and inorganic materials, including nanotoxicity [32,33]. The remainder of the paper is organized as follows. In the "Materials and Methods" section (Section 2) we will provide a detailed explanation of the theoretical model built to study the protein-metal interaction and the rationale behind the model parametrization scheme. In Section 3, we will discuss simulation results, analyze individual adsorption affinities predicted for molecules representing the bio-part of the interface (amino acids, milk proteins and carbohydrates), and report their preferred orientations. We will also discuss kinetics of competitive adsorption for six most abundant milk proteins to understand the process of protein deposition on the metallic surfaces. Obtained results will be also compared with existing experimental data on protein adsorption. And finally, in Section 4, we will summarize the key insights gained from this study.
2. Materials and Methods
We aim to calculate the content of milk protein layer on iron surfaces using first principles multiscale simulations. To do so, we will use a CG kinetic Monte Carlo (KMC) method [22] to model competitive adsorption of the six most abundant milk proteins. The KMC simulation requires the knowledge of individual binding energies at different orientations (heatmaps) for each selected protein immobilised at each fcc configuration of metallic surface. Heatmaps for individual proteins can be obtained by UA simulations as described in a following sub-section. Although the UA method was already parameterised for the range of crystalline surfaces for noble metals (Ag, Au, Cu), oxides (TiO, SiO, FeO),organic NPs (graphene, carbon nanotubes and carbon black), and semiconductors (CdSe) [34,35] the method is missing the set of short-range potentials essential for calculating milk protein-iron adsorption energies. These potentials in a form of tabulated potentials of mean force (PMF) will be calculated from explicit all-atom simulations through a previously introduced scheme [29].
2.1. Protein-solid surface interaction in UA
Generally, the interaction between a protein and a solid surface, such as an inorganic engineered material (EM), includes several contributions, both specific and non-specific, and depends on the chemical composition, size, shape, surface roughness, surface charge, surface functionalization, and hydrophobicity of the EM. All these aspects should be considered for building CG models of the bio-metal interfaces. Various examples of such models (incl. UA model) have been previously reported to study the competitive adsorption of proteins onto solid surfaces [26,36].
The UA model, previously developed in our lab [26,31], includes all major non-covalent contributions to the interactions between the NP and the protein in a simplified way. The solid surface can be represented by a rigid flat (slabs), spherical (NP), or cylindrical (nanotubes) shape. Proteins are considered as rigid-body structures consisting of 20 different amino acids (AA). Each AA is represented by one bead in the UA model and respective positions of these beads within the protein are fixed. The center of the AA bead is positioned on the AA’s C atom. The CG model of the protein has the same three-dimensional structure and key details as the original all-atom model. However, fewer beads will decrease the dimensionality of the model and result in lower calculation times. This model is illustrated in Figure 1 along with the presentations on all-atom and CG UA. Further coarse-graining will be applied to reduce the dimension of modelling the kinetics of the competitive adsorption. The ultra-CG hard-sphere (HS) model for selected proteins will be parameterised based on the UA heatmaps.
The UA model divides the NP into a core and a surface segments according to the distances between them and the protein. Then, the interaction potential between each AA and the NP can be represented by a combination of a short-range surface van der Waals (vdW) potential (), a long-range core vdW potential (), and an electrostatic potential(). The interaction potential between NP and the entire protein () is written in a pairwise-additive way via interaction potentials for individual AAs with the NP:
This potential depends on the distance between centers of mass (COMs) of the NP and each AA in the protein. This distance is determined by the protein’s overall orientation relative to the surface of the NP, which is set by two rotational angles with respect to the protein’s initial orientation as defined in the PDB file. The electrostatic interaction between NP and AA is described by the screened Coulomb potential:
where is the distance between the residue of charge and the point charge on the NP surface in terms of the elementary charge , is the Boltzmann constant, T is the temperature, is Debye length, is the Bjerrum length, and I is the ionic strength, with being the ion concentrations and valencies, respectively. The properties of the solvent are reflected in the dielectric constant . The VdW potential, representing combined dipole-dipole and dispersion interactions between i-th AA and the NP, includes short-range and long-range terms:
We extracted the short-range surface potentials from all-atom adaptive well-tempered Metadynamics (AWR-MetaD) simulations by following the procedure described in next section. The long-range term arising from the vdW forces acting through the water medium between the core of the NP and the i-th AA can be approximated by the Hamaker procedure:
Here, the coefficient corresponds to the interaction of material 1 with material 3 through the medium 2, and are the radii of AA and NP, respectively.
We then calculate the interaction energy for all possible orientations of the protein, described by orientation angles and with respect to the initial orientation (taken from the origin PDB file). The total potential energy is found as a function of distance of the protein center of mass from the NP surface.
Integration of the interaction potential over all possible orientations and corresponding distances will give the mean interaction energy . For flat surfaces, the energy is calculated as:
For a protein interacting with a spherical NP,
The set of rotational configurations along with corresponding are stored in the heatmap. The next step is to calculate the average adsorption energy by using the potential energy as a function of distance for each angle with Boltzmann averaging and weighting factors:
where is the Boltzmann weighting factor. Below, we will show how the maximum binding energy affecting the protein adsorption the most can be defined from the adsorption heat maps.
2.2. All-atom model for recovering short-range potentials
The interaction of atoms with a solid surface can be best done using enhanced sampling methods [37,38,39,40]. These techniques include estimating the free energy during simulation and feeding that information back into the dynamics as a statistical bias. The common goal is to spend as little time as possible sampling already sampled free energy zones [41]. Adaptive biasing force methods, which employ an approximation of the mean force to bias the dynamics, are one of the strategies that can speed up the simulation [42,43]. In this work, we use the Adaptive Well-Tempered Metadynamics method that has previously been described for measuring the adsorption of the biomolecules for TiO [29] and Ag [30]. The approach keeps the adsorbate away from previously visited regions of the collective variable space by introducing a time-dependent bias to the system’s potential energy. GROMACS software was used to carry out the simulations in this section of the work [44,45]. CHARMM-GUI/Nanomaterial Modeler was used to create three fcc surfaces of iron: (100), (110), and (111) [46].
The AA side chain analogues (SCAs are the compounds that result from cutting off the side chains of AAs at the protein backbone and substituting a hydrogen for the carbon) were placed in the center top of the slab. In this work, we calculated the energy for 22 SCAs, including two forms of Histidine, HID and HIE, depending on the location of the protonation on the nitrogen atom and two forms of Glutamic acid, GLU and GAN, negatively charged and neutral respectively (See the Supporting Materials for more details). The system was solvated using the original form of TIP3 water model [47]. It was then neutralized by NaCl regarding the charge of the whole system. In the MD calculations, the energy of the system has been minimized by Verlet particle-based cut-off scheme using charge groups and steepest gradient method for 1000 steps. Figure 2 shows the simulation box, the Fe-100 slab and the SCA after the minimization, the water molecules have been removed for better visualization. The system was equilibrated under constant pressure 1.0 bar and temperature conditions (NPT ensemble) using Berendsen weak coupling [48] for 1.0 ns. Then, the system was pre-equilibrated for 10 ns in the NVT ensemble. The Nose-Hoover thermostat’s relaxation time constant for the NVT ensemble was 5 ps. The cut-off distance was set to 1.0 nm for the VdW short range interactions. In the metadynamics biased simulation, the surface separation distance (SSD) was used as the reaction coordinate. This SSD measures the minimum distance of the COMs of the SCA and the surface atoms along the z axis,
In the adaptive well-tempered metadynamics, the adsorption energy is measured as a function of SSD. These simulations were done in the NVT ensemble with PLUMED software plugin in GROMACS [44,45,49]. The simulation time was between 500-600 ns for each SCA to get the set short-range one-dimensional PMFs in a tabulated form. The bias factor and the time factor was set to 10 and 500 ps respectively. Every 0.5 ps the Gaussian was added and the initial height was kJ/mol and the temperature was kept at 300 K.
2.3. Preparation of starting coordinates for biomolecules and surfaces
We simulated three fcc surfaces of iron slabs (100, 110, 111) using GROMACS with CHARMM-GUI/Nanomaterial Modeler tool and force fields [46,50,51]. The slab thickness for all surfaces (100, 110, 110) was between 3.53 to 3.71 nm, elongated in z direction in vacuum and were in periodic boundary conditions along x and y coordinates. The final simulation box size were nm for Fe-100, nm for Fe-110 and nm for Fe-111. To calculate the PMFs at the atomistic level, 22 sets of SCAs were chosen which are sufficient to assess adsorption affinities for different kinds of proteins in the CG UA model.
In order to investigate the interaction of entire protein with the NP, the UA model reads the atomistic 3D structure of the protein. These structures might not be available from experiments such as X-ray crystallography, NMR spectroscopy and cryo-electron microscopy. Thus, we predicted 3D structures of the proteins using the sequence data. Here, we used I-TASSER (Iterative Threading ASSEmbly Refinement) software [52] to generate 820 milk protein structures [53,54]. It should be noted, that the majority of these proteins do not exhibit a well defined globular structure. Table 1 shows the list of 6 selected representative milk proteins, UniProt ID, molecular weight, charge and number of AAs in each molecule. The charge information was obtained from PROPKA calculation [55,56] at pH 7.0. All the proteins were subsequently equilibrated in water for 50 ns under NVT and NPT ensembles.
To model competitive protein adsorption from milk, we imitated the natural protein concentrations. The majority of the milk ingredients are water (86–88%), fat (3–6%), protein (3–4%), lactose (5%), and minerals (0.7%) [28]. Milk proteins have many physicochemical properties that allow them to be used in a wide range of applications, from nutritional to functional and biological functions [57]. Caseins and soluble (whey) proteins are classified into two broad categories of milk proteins. Caseins account for about 78 % of bovine milk proteins in total and whey proteins for 17% [58]. Caseins can be classified into four genetic groups based on the similarity of their primary AA sequences [28]. These four groups are s1-caseins, s2-caseins, -caseins, and -caseins and correspondingly make up , , , of the total casein [59]. In decreasing quantities, the whey proteins consist of -lactoglobulins, lactalbumins, immunoglobulin and serum albumin of the total , and of the whey proteins [60,61]. In the competitive adsorption simulations, we set the protein concentrations of representative in solution according to their relative mass concentrations in milk. We estimated this concentration based on the the percentage of each protein and considering the fact that cow milk has 30-39 g/L protein in total. The molar mass of each protein was taken from AlphaFold database [62].
2.4. Competitive adsorption model
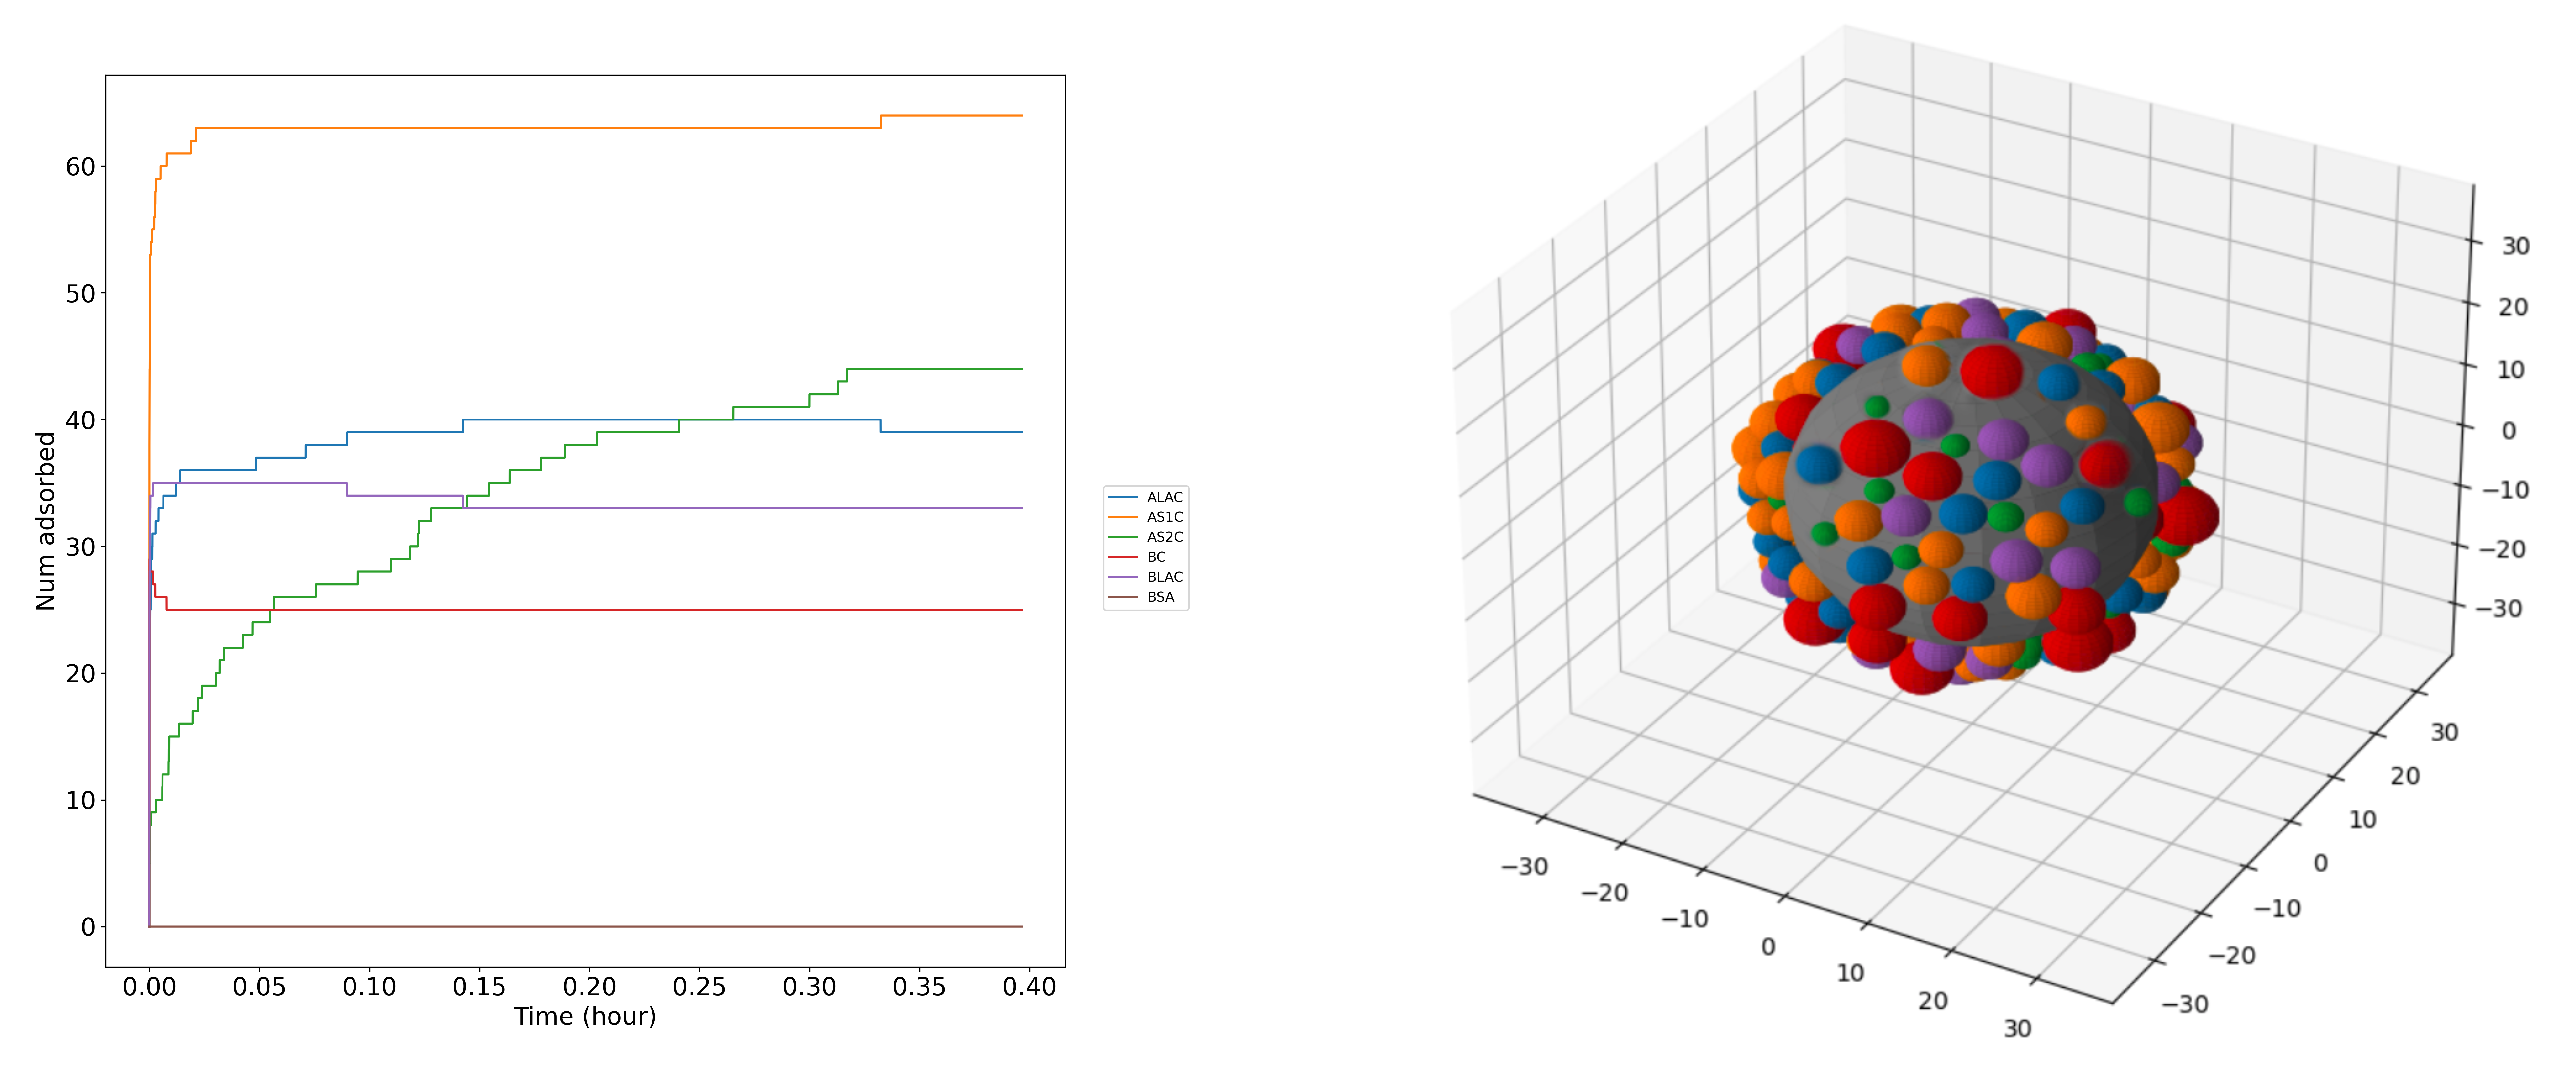
With extracted individual protein UA adsorption heatmaps, we can predict the composition of the adsorbed protein layer on the metallic surface. Proteins, composing this layer, can be fundamentally divided into two classes of hard and soft bound protein [63]. The term "hard" refers to proteins that are bonded directly to the surface of the material with strong affinity and "soft " labels a group of proteins that are weakly bound on top of the adsorbed hard corona via protein-protein interaction [22,63]. We will further study the hard bound layer. The composition of the hard bound layer evolves with time and, depends the morphology and composition of the adsorbent material. In this dynamical process, which can last several hours in real systems, proteins diffuse from the bulk of the milk and adsorb on solid surfaces before occasionally desorbing and being replaced by other proteins. Since the milk sample contains hundreds of proteins, all-atom and even UA simulations of simultaneous adsorption of all milk proteins would be very time consuming [64]. Here, we use an ultra-CG method to describe the actual adsorption-desorption dynamics representing each protein as a single ultra-fine CG bead. Since the adsorption rate of incoming proteins is dependent on previously adsorbed molecules, the whole surface area of the metal will not be accessible for a full coverage by proteins [65]. The HS model, which was initially developed for predicting adsorption onto NPs, considers proteins as rigid spheres with established positions, while the solid is modelled as a spherical NP. In this model, the protein is in a reversible physical contact with the NP’s surface and occupies space that becomes unavailable to other proteins. For each protein, we set a molar concentration in solution as well as rate constants for adsorption and desorption. Due to the slow rates of protein adsorption and desorption, we use reaction-diffusion equations and KMC method to simulate the process [22]. Figure 7 below illustrates the corona formed by milk proteins on a large iron NP using KMC calculations.
3. Results and Discussion
3.1. Short-range potentials for SCAs on iron surfaces
The short-range potentials (in ) for 22 AA SCAs on Fe (100, 110, 111) obtained by atomistic MD with Metadynamics are shown in Figure 3. Water density profiles from MD simulations for the slab-water system indicate that two water layers with elevated density are formed near the surface at around 0.2 nm and 0.6 nm for all three fcc surfaces. We can identify three different regions: one close to the wall with strong repulsion, an intermediate region between the two layers of water, and the bulk region when the PMF curve comes to a plateau. Traditionally, AAs are classified into four groups as hydrophobic, charged, polar, and aromatic. According to our data, these groups demonstrate different binding affinities to the zero-valent iron surfaces. Hydrophobic AAs (such as ALA, VAL, LEU) bind weakly while aromatic and charged AAs (such as PRO, TYR, ARG and HIS) are more strongly attached. Analysis of the PMFs suggests that the deepest minimum for SCAs adsorption is located close to the first water adlayer which can facilitate adsorption of hydrophilic and charged aminoacids. Similar behaviour was reported for adsorption of AAs onto noble metal surfaces [30,66,67,68,69,70] with the only difference to a sulfur-containing AAs. For example, for the most studied AuNPs the binding affinity ranking was as following: S-containing > aromatic > amines > aliphatic > amides > hydroxylic > carboxylic. The energy of adsorption for individual SCAs were ranging from T to T. This predicted range of adsorption energies for the small molecules in our study is in line with the adsorption free energy of furfural onto nZVI reported in [71]. For ALA SCA (which model is chemically equivalent to methane) onto Fe-110 we found adsorption energy close to , corresponding to the lack of binding. Similar adsorption pattern was reported in [72] where no stable binding complexes were predicted for CH by DFT calculations.
3.2. Protein adsorption energies, preferred orientations and heatmaps
To model milk protein adsoprtion at the metallic surfaces we have selected six most abundant proteins listed in Table 1. These proteins were a subject to UA model simulations to obtain their adsorption binding affinities and preferred orientations for the protein immobilised on the iron surfaces. For these calculations, we used nm and potential mV. We report a single value for each protein after averaging of the energy over all possible orientations. Obtained adsorption energy rankings based on the lowest energy values of the adsorption heatmaps are listed in Table 2. The casein (AS1C) and casein (AS2C) was predicted to be the most strongly bound proteins and lactoglobulin (BLAC) and lactalbumin (ALAC) are the weakest bound proteins on all Fe (100, 110, 111) surfaces. The preferred orientation of the proteins would not change that much on different fcc faces of iron.
The preferred orientation of all 820 milk proteins based on the lowest energy from heatmaps are reported in the Table S2 of the Supplementary Material. We performed calculations with five Fe NPs of radii 5 nm, 20 nm, 50 nm, 80 nm, and 100 nm to study the size dependence of adsorption energies. The data are presented in the Supplementary Materials (Figure S2). Figure 5 shows the output of the UA model for six selected milk proteins on iron NPs. The heatmap contains the adsorption energies for all values of and . The blue spots (with lower energy) correspond to the more favourable orientations of immobilised proteins. 3D presentation of the protein on the NP surface is shown on top of each heatmap corresponding to the same protein. The closest AAs to the surface of the NP are marked in each case. Analysis of the configurations shows that LYS, GLU, PRO, ASN are most likely to be in contact with the metal surface. This observation is in agreement with the results from Ref. [73] that will be discussed in Section 3.3 section.
The protein adsorption energies predicted by the UA model (Table 2) are high and correspond to irreversible binding of these molecules. This is a result of a high activity of zero-valent Fe. For example for BSA protein the average adsorption energy for all fcc facets was -23.67 T for Ag0 [30]and -21.68 T for Au(0) [32,74] vs. -75.23 T for zero-valent Fe.
3.3. Validation of UA model parameters
To validate our model, we further considered interaction between zero-valent FeNPs and human serum albumin (HSA) through both experimental and docking simulation methods. Analysis using fluorescence spectroscopy showed that the FeNPs formed a complex with HSA through hydrogen bonds and van der Waals interactions. Furthermore, circular dichroism spectroscopy showed that the secondary structure of HSA was not affected by the FeNP. An MD study indicated that the FeNPs interacted with polar residues on the surface of the HSA molecule. The docking study found that ASP, ARG, SER, LYS, GLU residues are most likely to be on the FeNP surface. The reported adsorption free energy G was kJ/mol, which is comparable to our observations. Taking the same initial protein PDB structure and temperature and size for Fe-110 in UA model we measured the minimum free energy was equal to kJ/mol at and . The nearest interacting AAs in our case are LYS-564, GLU-565, LYS-573, GLU-505, ASP-562, GLU-82, ARG-81, LEU-80, ASP-56, ASP-129.
In reality, the metallic iron surfaces are quickly oxidized and hydroxylized, which changes their adsorption affinity to water and reduces the binding strength for AAs and proteins. Another assumption that affects the range of the observed energies is that the orientation distribution for adsorbed proteins is equilibrium. This assumption is used implicitly in the ensemble averaging procedure represented by Eq. (7). This average energy is dominated by a single preferred orientation. If, however, we assume that proteins bind in random orientations, then the simple average over all angles would reflect the actual binding strength. Yet, in the previous study [30] we found that the Boltzmann average correlates better with the adsorption affinity ranking for proteins, so we used these figures below to analyse binding affinities of individual proteins and to model the competitive adsorption. Section 5 of the Supplementary Materials discusses another experimental approach to validate the binding properties of Hen egg white lysozyme (HEWL) on zero-valent FeNP.
3.4. Competitive adsorption and milk protein layer
We next determined the composition of the milk protein layer at the iron surfaces. As discussed above, in this method we assumed that the surface is represented by a spherical NP with a the protein layer adsorbed on the whole surface of the NP (protein corona) and the adsorption energy is determined by the UA method. The adsorption free energy controls the behaviour between the NP and the protein by using the HS KMC model. The higher the adsorption energy the more probable it is for the protein to be bound on the surface for long periods of time. Calculating the actual adsorption kinetics for different proteins is more challenging. After giving the system enough time the proteins will compete and form a stable protein corona around the NP. The concentrations of milk proteins to determine the corona has been chosen from literature [28,59]. The adsorption-desorption process will stabilise after certain time that depend on the NP radius.
Figure 7 shows a snapshot of 6 milk proteins adsorbing on the iron surface from solution imitating natural milk. Our estimates suggest that the layer of the milk proteins should come to the equilibrium within about 40 minutes due to the high individual adsorption affinities for selected proteins. The process stops when the surface reach full loading capacity with no more space left for further protein adsorption and the protein replacements cease. We can see from the Figure 7 and Table 3 that AS1C (orange colored beads) is adsorbed in largest numbers on the surface and BSA (brown colored beads) has the least abundance in the corona. The left panel of Figure 7 demonstrates the nontrivial kinetics of the corona formation: the concentrations of bound BC, BLAC and ALAC decrease with time after a very quick buildup, while the concentration of AS2C grows much slower only to exceed the amount of the former after about 0.3 hours, evidently replacing the originally bound proteins. The concentration of AS1C remains high after the initial buildup and the concentration of BSA stays low at all times.
Figure 7.
Protein adsorption kinetics on a FeNP plot that shows the adsorption-desorption of each protein over time (left). A snapshot of a NP (grey) of radius size 20 nm with protein corona of milk proteins (coloured) adsorbing on the surface using KMC model (right)
Figure 7.
Protein adsorption kinetics on a FeNP plot that shows the adsorption-desorption of each protein over time (left). A snapshot of a NP (grey) of radius size 20 nm with protein corona of milk proteins (coloured) adsorbing on the surface using KMC model (right)
We repeated the KMC simulations several times for each NP size and averaged the observable over at least three randomly selected runs. Results of these simulations are listed in Table 3. There, we present the average abundance on the unit area and percentage of relative mass abundance for each milk protein on each surface of fcc Fe. The results in the table show that AS1C is the most abundant both in terms of number of molecules and mass on all the iron surfaces while BSA has the least number and mass abundance. BLAC, and BC are almost equally present in the corona are the second and third most abundant proteins. ALAC and AS2C respectively are the forth and fifth most abundant proteins. This is explained by relatively low molar fraction of BSA in milk as compared to caseins and lactalbumins.
The corona results obtained on NPs of nm essentially represent flat iron surfaces. In previous works [31], we have demonstrated that for majority of proteins, the adsorption energies and preferred orientations for most proteins do not change after NP radius of about 30 nm as the surface curvature becomes too large compared to the protein size. Therefore, we expect that the predicted abundances and amounts of deposited proteins should be valid for industrial applications involving steel or iron devices. In the future, we are planning to extend the analysis to competitive adsorption involving lactose and milk fat at different temperatures. Further extension of this work is possible with an inclusion of protein unfolding and denaturation at high temperatures and different pH values. This, however, requires much more complex simulations with flexible proteins and 3D structures adjusted to the specific conditions and may be currently unfeasible in the most detailed form.
4. Conclusions
In this work, we presented the results of modelling the interaction between iron surfaces and most abundant milk proteins in a multiscale scheme based on combination of CG UA model with KMC model for predicting the composition of protein in the deposited layer at iron surfaces. We have considered a simplified model of milk formed from the solution of six most abundant proteins occurring in natural cow milk. Our study ranked the proteins by the adsorption strength as follows: s1 caseins, s2 caseins, casein, bovine serum albumin, lactalbumin and lactoglobulins, respectively, from strong to weak binding. We have found that the amount of the bound protein depends on its concentration in solution, so the KMC simulation of the adsorption kinetics ranked the proteins differently (in terms of mass fraction in the milk model solution): s1 caseins, lactoglobulins, casein, lactalbumin, s2 caseins and, finally, bovine serum albumin. In the future, we are planning to extend the multiscale model of the milk adsorption by adding lactose and milk fat molecules.
Our multiscale model of protein corona formation on solid NPs and surfaces can be generalised to a large variety of systems. It essentially relies only on the existence of atomistic force field for the solid. It can be used for variety of applications such as controlling fouling, biofilm growth in food processing and packaging, and medical devices. We also plan to extend the boundaries of the multiscale model to a wider range of temperatures and pH values employed in the industrial settings.
Author Contributions
Conceptualization, P.M.A. and J.S. and V.L; methodology, P.M.A and J.S..; validation, P.M.A.and J.S.; investigation, P.M.A and J.S and V.L; resources, P.M.A and J.S and V.L; data curation, P.M.A.; writing—original draft preparation, P.M.A.; writing—review and editing, P.M.A. and J.S. and V.L.; visualization, P.M.A. and J.S.; supervision, V.L. and J.S.; project administration, V.L. All authors have read and agreed to the published version of the manuscript.
Funding
This research was funded by Science Foundation Ireland grant number 16/IA/4506.
Data Availability Statement
We have made available all the relevant data for the parameters related to the PMFs of zero-valent FeNP surfaces, I-TASSER PDB structures for 820 milk proteins and equilibrated PDB structures for the 6 most abundant milk proteins with MD calculation. The data is publicly accessible at the following links: short-range surface potentials (PMFs), i-TASSER structures of the milk proteins along with six MD-equilibrated PDB coordinates. The recent distribution of United Atom and KMC codes can be found at here.
Acknowledgments
This work was funded by Science Foundation of Ireland under grant number 16/IA/4506. We would like to thank Irish Centre for High End Computing (ICHEC), Juelich Supercomputing Centre (JSC), and UCD Sonic High Performance Computing for providing computational facilities. Parinaz Mosaddeghi Amini is grateful for the support of her colleagues, their useful help and guidance in this study, Dr.Ian Rouse, Dr. Konstantinos Kotsis, Dr. David Power, Dr. Shada Alsharif, Dr. Anais Colibaba and Romana Petry. She also specially thanks her parents and partner’s endless supports.
Conflicts of Interest
The authors declare no conflict of interest. The funders had no role in the design of the study; in the collection, analyses, or interpretation of data; in the writing of the manuscript; or in the decision to publish the results.
Abbreviations
The following abbreviations are used in this manuscript:
| AA | Amino acid |
| ALAC | -lactalbumins |
| AS1C | -casein |
| AS2C | -casein |
| AWR-MetaD | Adaptive well-tempered metadynamics |
| BC | -caseins |
| BLAC | -lactoglobulins |
| BSA | Bovine Serum Albumin |
| CG | Coarse-grained |
| AA | Amino acid |
| COM | Center of mass |
| EM | Engineered material |
| fcc | Face-centered cubic |
| Fe NP | Fe nanoparticle |
| HS | Hard-sphere |
| HSA | Human serum albumin |
| I-TASSER | Iterative Threading ASSEmbly Refinement |
| KMC | Kinetic Monte Carlo |
| MD | Molecular dynamics |
| MW | Molecular weight |
| NP | Nanoparticle |
| PMF | Potential of mean force |
| PDB | Protein data bank |
| SCA | Side chain analogues |
| SSD | Surface separation distance |
| UA | United Atom |
| vdW | van der Waals |
References
- Hesterberg, T.W.; Long, C.M.; Lapin, C.A.; Hamade, A.K.; Valberg, P.A. Diesel exhaust particulate (DEP) and nanoparticle exposures: what do DEP human clinical studies tell us about potential human health hazards of nanoparticles. Inhalation toxicology 2010, 22, 679–694. [CrossRef]
- Gopal, N.; Hill, C.; Ross, P.R.; Beresford, T.P.; Fenelon, M.A.; Cotter, P.D. The prevalence and control of Bacillus and related spore-forming bacteria in the dairy industry. Frontiers in microbiology 2015, 6, 1418. [CrossRef]
- Marchand, S.; De Block, J.; De Jonghe, V.; Coorevits, A.; Heyndrickx, M.; Herman, L. Biofilm formation in milk production and processing environments; influence on milk quality and safety. Comprehensive Reviews in Food Science and Food Safety 2012, 11, 133–147. [CrossRef]
- Flint, S.; Bremer, P.; Brooks, J. Biofilms in dairy manufacturing plant-description, current concerns and methods of control. Biofouling 1997, 11, 81–97. [CrossRef]
- Bansal, B.; Chen, X.D. A critical review of milk fouling in heat exchangers. Comprehensive reviews in food science and food safety 2006, 5, 27–33. [CrossRef]
- Rosmaninho, R.; Santos, O.; Nylander, T.; Paulsson, M.; Beuf, M.; Benezech, T.; Yiantsios, S.; Andritsos, N.; Karabelas, A.; Rizzo, G.; others. Modified stainless steel surfaces targeted to reduce fouling–Evaluation of fouling by milk components. Journal of Food Engineering 2007, 80, 1176–1187. [CrossRef]
- Rahman, M.; Laurent, S.; Tawil, N.; Yahia, L.; Mahmoudi, M.; Rahman, M.; Laurent, S.; Tawil, N.; Yahia, L.; Mahmoudi, M. Nanoparticle and protein corona. Protein-Nanoparticle Interactions: The Bio-Nano Interface 2013, pp. 21–44.
- Barroso da Silva, F.L.; Carloni, P.; Cheung, D.; Cottone, G.; Donnini, S.; Foegeding, E.A.; Gulzar, M.; Jacquier, J.C.; Lobaskin, V.; MacKernan, D.; others. Understanding and controlling food protein structure and function in foods: perspectives from experiments and computer simulations. Annual review of food science and technology 2020, 11, 365–387. [CrossRef]
- Changani, S.; Belmar-Beiny, M.; Fryer, P. Engineering and chemical factors associated with fouling and cleaning in milk processing. Experimental Thermal and Fluid Science 1997, 14, 392–406. [CrossRef]
- Förster, M.; Bohnet, M. Influence of the interfacial free energy crystal/heat transfer surface on the induction period during fouling. International journal of thermal sciences 1999, 38, 944–954. [CrossRef]
- Tang, L.; Thevenot, P.; Hu, W. Surface chemistry influences implant biocompatibility. Current topics in medicinal chemistry 2008, 8, 270–280. [CrossRef]
- Wilson, C.J.; Clegg, R.E.; Leavesley, D.I.; Pearcy, M.J. Mediation of biomaterial–cell interactions by adsorbed proteins: a review. Tissue engineering 2005, 11, 1–18. [CrossRef]
- Tang, L.; Hu, W. Molecular determinants of biocompatibility. Expert review of medical devices 2005, 2, 493–500. [CrossRef]
- Landsiedel, R.; Ma-Hock, L.; Kroll, A.; Hahn, D.; Schnekenburger, J.; Wiench, K.; Wohlleben, W. Testing metal-oxide nanomaterials for human safety. Advanced Materials 2010, 22, 2601–2627. [CrossRef]
- Winkler, D.A.; Burden, F.R.; Yan, B.; Weissleder, R.; Tassa, C.; Shaw, S.; Epa, V.C. Modelling and predicting the biological effects of nanomaterials. SAR and QSAR in Environmental Research 2014, 25, 161–172. [CrossRef]
- Dell’Orco, D.; Lundqvist, M.; Oslakovic, C.; Cedervall, T.; Linse, S. Modeling the time evolution of the nanoparticle-protein corona in a body fluid. PloS one 2010, 5, e10949. [CrossRef]
- Darabi Sahneh, F.; Scoglio, C.; Riviere, J. Dynamics of nanoparticle-protein corona complex formation: analytical results from population balance equations. PloS one 2013, 8, e64690. [CrossRef]
- Shao, Q.; Hall, C.K. Protein adsorption on nanoparticles: model development using computer simulation. Journal of Physics: Condensed Matter 2016, 28, 414019. [CrossRef]
- Vilaseca, P.; Dawson, K.A.; Franzese, G. Understanding and modulating the competitive surface-adsorption of proteins through coarse-grained molecular dynamics simulations. Soft Matter 2013, 9, 6978–6985. [CrossRef]
- Angioletti-Uberti, S.; Ballauff, M.; Dzubiella, J. Competitive adsorption of multiple proteins to nanoparticles: the Vroman effect revisited. Molecular Physics 2018, 116, 3154–3163. [CrossRef]
- Rouse, I.; Power, D.; Brandt, E.G.; Schneemilch, M.; Kotsis, K.; Quirke, N.; Lyubartsev, A.P.; Lobaskin, V. Advanced in silico characterization of nanomaterials for nanoparticle toxicology. arXiv preprint arXiv:2007.04017 2020. [CrossRef]
- Rouse, I.; Lobaskin, V. A hard-sphere model of protein corona formation on spherical and cylindrical nanoparticles. Biophysical Journal 2021, 120, 4457–4471. [CrossRef]
- Monopoli, M.P.; Walczyk, D.; Campbell, A.; Elia, G.; Lynch, I.; Baldelli Bombelli, F.; Dawson, K.A. Physical- chemical aspects of protein corona: relevance to in vitro and in vivo biological impacts of nanoparticles. Journal of the American Chemical Society 2011, 133, 2525–2534. [CrossRef]
- Vilanova, O.; Mittag, J.J.; Kelly, P.M.; Milani, S.; Dawson, K.A.; Rädler, J.O.; Franzese, G. Understanding the kinetics of protein–nanoparticle corona formation. ACS nano 2016, 10, 10842–10850. [CrossRef]
- Hasenkopf, I.; Mills-Goodlet, R.; Johnson, L.; Rouse, I.; Geppert, M.; Duschl, A.; Maier, D.; Lobaskin, V.; Lynch, I.; Himly, M. Computational prediction and experimental analysis of the nanoparticle-protein corona: Showcasing an in vitro-in silico workflow providing FAIR data. Nano Today 2022, 46, 101561. [CrossRef]
- Lopez, H.; Lobaskin, V. Coarse-grained model of adsorption of blood plasma proteins onto nanoparticles. The Journal of chemical physics 2015, 143, 12B620_1. [CrossRef]
- Walkey, C.D.; Olsen, J.B.; Song, F.; Liu, R.; Guo, H.; Olsen, D.W.H.; Cohen, Y.; Emili, A.; Chan, W.C. Protein corona fingerprinting predicts the cellular interaction of gold and silver nanoparticles. ACS nano 2014, 8, 2439–2455. [CrossRef]
- Eskin, N.A.M.; Goff, H.D. Chapter 4 - Milk. In Biochemistry of Foods (Third Edition), Third Edition ed.; Eskin, N.M.; Shahidi, F., Eds.; Academic Press: San Diego, 2013; pp. 187–214. doi:https://doi.org/10.1016/B978-0-08-091809-9.00004-2. [CrossRef]
- Brandt, E.G.; Lyubartsev, A.P. Molecular dynamics simulations of adsorption of amino acid side chain analogues and a titanium binding peptide on the TiO2 (100) surface. The Journal of Physical Chemistry C 2015, 119, 18126–18139. [CrossRef]
- Subbotina, J.; Lobaskin, V. Multiscale Modeling of Bio-Nano Interactions of Zero-Valent Silver Nanoparticles. The Journal of Physical Chemistry B 2022, 126, 1301–1314. [CrossRef]
- Power, D.; Rouse, I.; Poggio, S.; Brandt, E.; Lopez, H.; Lyubartsev, A.; Lobaskin, V. A multiscale model of protein adsorption on a nanoparticle surface. Modelling and Simulation in Materials Science and Engineering 2019, 27, 084003. [CrossRef]
- Alsharif, S.A.; Power, D.; Rouse, I.; Lobaskin, V. In silico prediction of protein adsorption energy on titanium dioxide and gold nanoparticles. Nanomaterials 2020, 10, 1967. [CrossRef]
- del Giudice, G.; Serra, A.; Saarimäki, L.; Kotsis, K.; Rouse, I.; Colibaba, A.; Jagiello, K.; Mikolajczyk, A.; Papadiamantis, A.; Sanabria, N.; others. A gene regulation model reveals an ancestral adaptation response to particulate exposure triggered by nanomaterials 2022. [CrossRef]
- Repositories of United Atom code and tools. https://bitbucket. org/softmattergroup/ (accessed Dec 11, 2020).
- NanoCommons. Nano-Knowledge Community. https:// www.nanocommons.eu/ (accessed Jan 15, 2021).
- Bellion, M.; Santen, L.; Mantz, H.; Hähl, H.; Quinn, A.; Nagel, A.; Gilow, C.; Weitenberg, C.; Schmitt, Y.; Jacobs, K. Protein adsorption on tailored substrates: long-range forces and conformational changes. Journal of Physics: Condensed Matter 2008, 20, 404226. [CrossRef]
- Darve, E.; Pohorille, A. Calculating free energies using average force. The Journal of chemical physics 2001, 115, 9169–9183. [CrossRef]
- Wang, F.; Landau, D.P. Efficient, multiple-range random walk algorithm to calculate the density of states. Physical review letters 2001, 86, 2050. [CrossRef]
- Marsili, S.; Barducci, A.; Chelli, R.; Procacci, P.; Schettino, V. Self-healing umbrella sampling: a non-equilibrium approach for quantitative free energy calculations. The Journal of Physical Chemistry B 2006, 110, 14011–14013. [CrossRef]
- Maragliano, L.; Vanden-Eijnden, E. A temperature accelerated method for sampling free energy and determining reaction pathways in rare events simulations. Chemical physics letters 2006, 426, 168–175. [CrossRef]
- Dickson, B.M.; Legoll, F.; Lelievre, T.; Stoltz, G.; Fleurat-Lessard, P. Free energy calculations: An efficient adaptive biasing potential method. The Journal of Physical Chemistry B 2010, 114, 5823–5830. [CrossRef]
- Laio, A.; Parrinello, M. Escaping free-energy minima. Proceedings of the national academy of sciences 2002, 99, 12562–12566. [CrossRef]
- Laio, A.; Gervasio, F.L. Metadynamics: a method to simulate rare events and reconstruct the free energy in biophysics, chemistry and material science. Reports on Progress in Physics 2008, 71, 126601. [CrossRef]
- Hess, B.; Kutzner, C.; Van Der Spoel, D.; Lindahl, E. GROMACS 4: algorithms for highly efficient, load-balanced, and scalable molecular simulation. Journal of chemical theory and computation 2008, 4, 435–447. [CrossRef]
- Pronk, S.; Páll, S.; Schulz, R.; Larsson, P.; Bjelkmar, P.; Apostolov, R.; Shirts, M.R.; Smith, J.C.; Kasson, P.M.; Van Der Spoel, D.; others. GROMACS 4.5: a high-throughput and highly parallel open source molecular simulation toolkit. Bioinformatics 2013, 29, 845–854. [CrossRef]
- Jo, S.; Kim, T.; Iyer, V.G.; Im, W. CHARMM-GUI: a web-based graphical user interface for CHARMM. Journal of computational chemistry 2008, 29, 1859–1865. [CrossRef]
- Jorgensen, W.L.; Chandrasekhar, J.; Madura, J.D.; Impey, R.W.; Klein, M.L. Comparison of simple potential functions for simulating liquid water. The Journal of chemical physics 1983, 79, 926–935. [CrossRef]
- Berendsen, H.J.; Postma, J.v.; Van Gunsteren, W.F.; DiNola, A.; Haak, J.R. Molecular dynamics with coupling to an external bath. The Journal of chemical physics 1984, 81, 3684–3690. [CrossRef]
- Tribello, G.A.; Bonomi, M.; Branduardi, D.; Camilloni, C.; Bussi, G. PLUMED 2: New feathers for an old bird. Computer physics communications 2014, 185, 604–613. [CrossRef]
- Brooks, B.R.; Brooks III, C.L.; Mackerell Jr, A.D.; Nilsson, L.; Petrella, R.J.; Roux, B.; Won, Y.; Archontis, G.; Bartels, C.; Boresch, S.; others. CHARMM: the biomolecular simulation program. Journal of computational chemistry 2009, 30, 1545–1614. [CrossRef]
- Lee, J.; Cheng, X.; Swails, J.M.; Yeom, M.S.; Eastman, P.K.; Lemkul, J.A.; Wei, S.; Buckner, J.; Jeong, J.C.; Qi, Y.; others. CHARMM-GUI input generator for NAMD, GROMACS, AMBER, OpenMM, and CHARMM/OpenMM simulations using the CHARMM36 additive force field. Journal of chemical theory and computation 2016, 12, 405–413. [CrossRef]
- Roy, A.; Kucukural, A.; Zhang, Y. I-TASSER: a unified platform for automated protein structure and function prediction. Nature protocols 2010, 5, 725–738. [CrossRef]
- Meurant, G. Handbook of milk composition; Elsevier, 1995.
- Reinhardt, T.A.; Lippolis, J.D.; Nonnecke, B.J.; Sacco, R.E. Bovine milk exosome proteome. Journal of proteomics 2012, 75, 1486–1492. [CrossRef]
- Olsson, M.H.; Søndergaard, C.R.; Rostkowski, M.; Jensen, J.H. PROPKA3: consistent treatment of internal and surface residues in empirical p K a predictions. Journal of chemical theory and computation 2011, 7, 525–537.
- Søndergaard, C.R.; Olsson, M.H.; Rostkowski, M.; Jensen, J.H. Improved treatment of ligands and coupling effects in empirical calculation and rationalization of p K a values. Journal of chemical theory and computation 2011, 7, 2284–2295. [CrossRef]
- Delboni, L.A.; Da Silva, F.L.B. On the complexation of whey proteins. Food Hydrocolloids 2016, 55, 89–99. [CrossRef]
- Dupont, D.; Croguennec, T.; Pochet, S. Milk Proteins-Analytical Methods. Reference Module in Food Science 2018, p. np.
- Davies, D.T.; Law, A.J. The content and composition of protein in creamery milks in south-west Scotland. Journal of Dairy Research 1980, 47, 83–90. [CrossRef]
- Kalyankar, S.; Khedkar, C.; Patil, A.; Deosarkar, S. Milk: Sources and composition 2016.
- Davoodi, S.H.; Shahbazi, R.; Esmaeili, S.; Sohrabvandi, S.; Mortazavian, A.; Jazayeri, S.; Taslimi, A. Health-related aspects of milk proteins. Iranian journal of pharmaceutical research: IJPR 2016, 15, 573.
- Jumper, J.; Evans, R.; Pritzel, A.; Green, T.; Figurnov, M.; Ronneberger, O.; Tunyasuvunakool, K.; Bates, R.; Žídek, A.; Potapenko, A.; others. Highly accurate protein structure prediction with AlphaFold. Nature 2021, 596, 583–589. [CrossRef]
- Kharazian, B.; Hadipour, N.; Ejtehadi, M. Understanding the nanoparticle–protein corona complexes using computational and experimental methods. The international journal of biochemistry & cell biology 2016, 75, 162–174. [CrossRef]
- Casals, E.; Pfaller, T.; Duschl, A.; Oostingh, G.J.; Puntes, V. Time evolution of the nanoparticle protein corona. ACS nano 2010, 4, 3623–3632. [CrossRef]
- Talbot, J.; Tarjus, G.; Van Tassel, P.; Viot, P. From car parking to protein adsorption: an overview of sequential adsorption processes. Colloids and Surfaces A: Physicochemical and Engineering Aspects 2000, 165, 287–324. [CrossRef]
- Wright, L.B.; Rodger, P.M.; Corni, S.; Walsh, T.R. GolP-CHARMM: first-principles based force fields for the interaction of proteins with Au (111) and Au (100). Journal of chemical theory and computation 2013, 9, 1616–1630. [CrossRef]
- Feng, J.; Pandey, R.B.; Berry, R.J.; Farmer, B.L.; Naik, R.R.; Heinz, H. Adsorption mechanism of single amino acid and surfactant molecules to Au {111} surfaces in aqueous solution: design rules for metal-binding molecules. Soft Matter 2011, 7, 2113–2120.
- Nawrocki, G.; Cieplak, M. Aqueous amino acids and proteins near the surface of gold in hydrophilic and hydrophobic force fields. The Journal of Physical Chemistry C 2014, 118, 12929–12943. [CrossRef]
- Hoefling, M.; Iori, F.; Corni, S.; Gottschalk, K.E. Interaction of amino acids with the Au (111) surface: adsorption free energies from molecular dynamics simulations. Langmuir 2010, 26, 8347–8351. [CrossRef]
- Shao, Q.; Hall, C.K. Binding preferences of amino acids for gold nanoparticles: a molecular simulation study. Langmuir 2016, 32, 7888–7896. [CrossRef]
- Fazlzadeh, M.; Ansarizadeh, M.; Leili, M. Data of furfural adsorption on nano zero valent iron (NZVI) synthesized from Nettle extract. Data in brief 2018, 16, 341–345. [CrossRef]
- Xu, L.; Kirvassilis, D.; Bai, Y.; Mavrikakis, M. Atomic and molecular adsorption on Fe (110). Surface Science 2018, 667, 54–65. [CrossRef]
- Anbouhi, T.S.; Esfidvajani, E.M.; Nemati, F.; Haghighat, S.; Sari, S.; Attar, F.; Pakaghideh, A.; Sohrabi, M.J.; Mousavi, S.E.; Falahati, M. Albumin binding, anticancer and antibacterial properties of synthesized zero valent iron nanoparticles. International journal of nanomedicine 2019, 14, 243. [CrossRef]
- Power, D.; Poggio, S.; Lopez, H.; Lobaskin, V. Bionano interactions: a key to mechanistic understanding of nanoparticle toxicity. In Computational Nanotoxicology; Jenny Stanford Publishing, 2019; pp. 189–215.
Figure 1.
All-atom (left) vs coarse-grained united-atom (middle) vs single bead KMC (right) structure of Bovine -casein protein (using I-TASSER-predicted structure).
Figure 1.
All-atom (left) vs coarse-grained united-atom (middle) vs single bead KMC (right) structure of Bovine -casein protein (using I-TASSER-predicted structure).
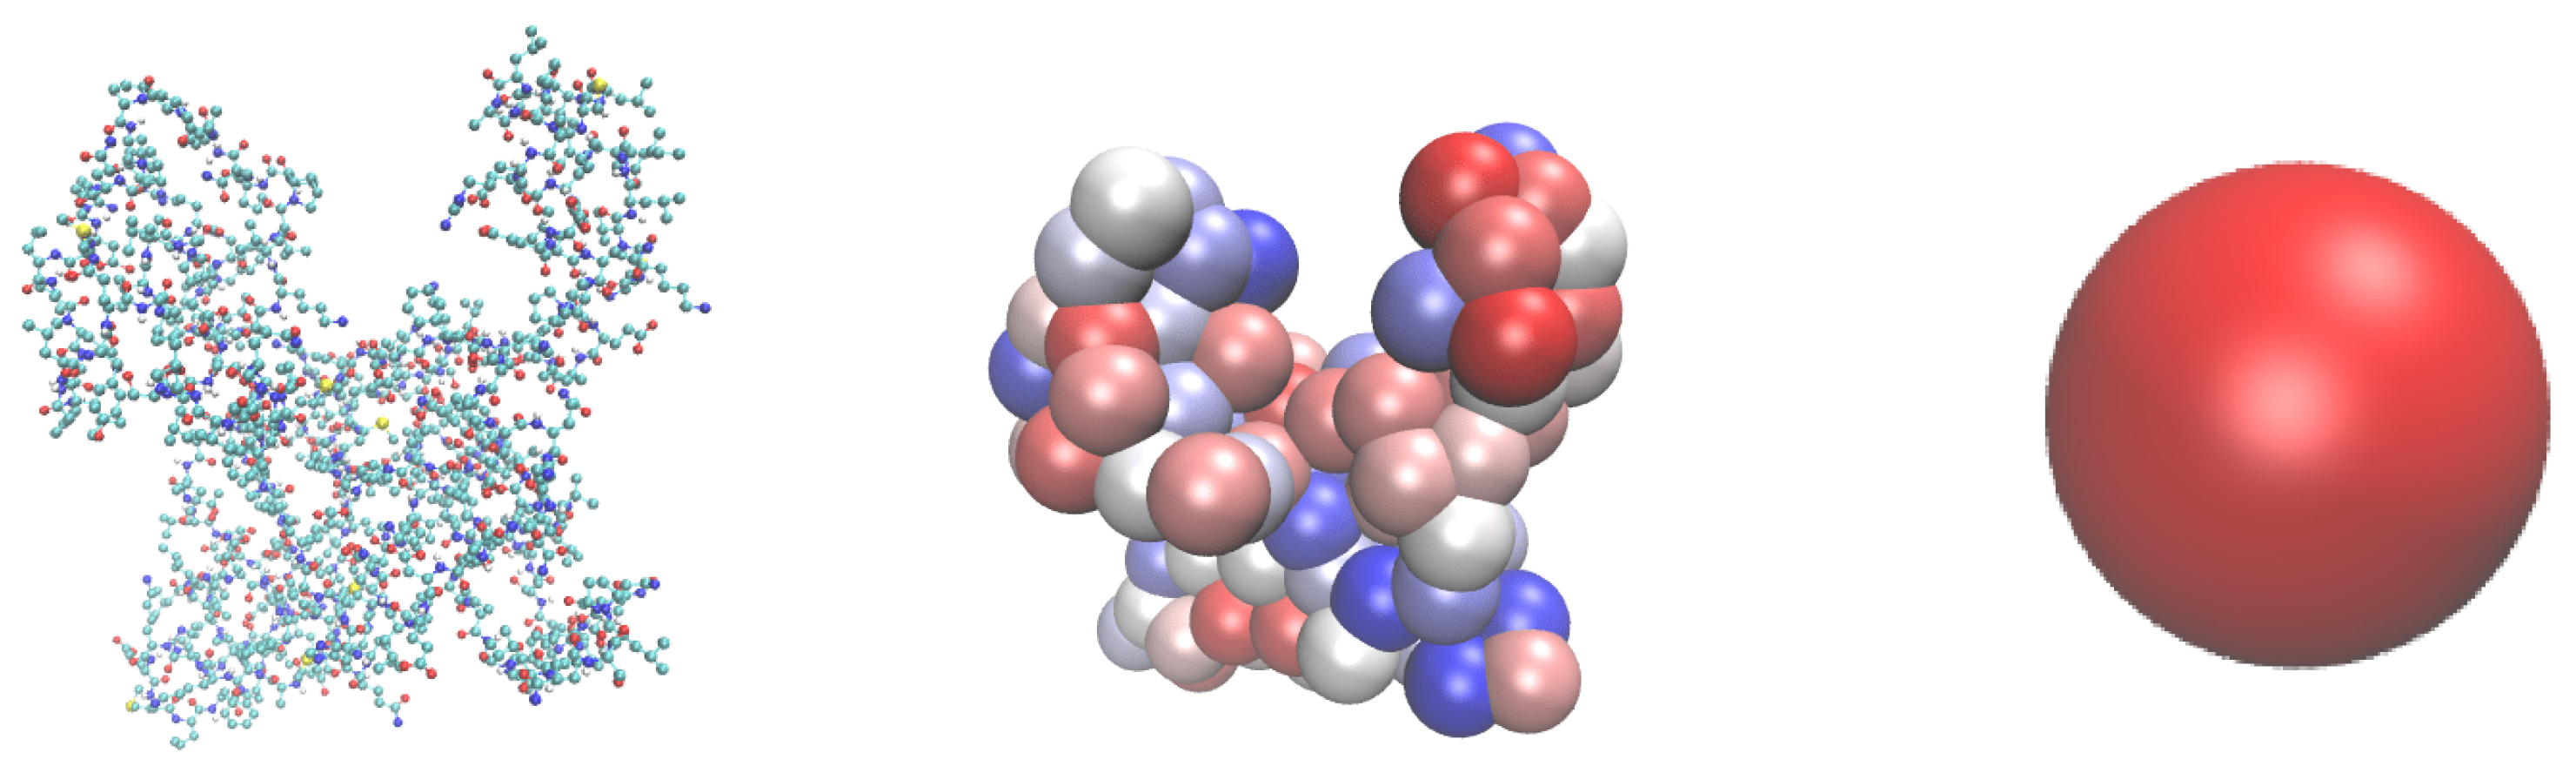
Figure 2.
System used to simulate the adsorption of SCAs on Fe slabs.
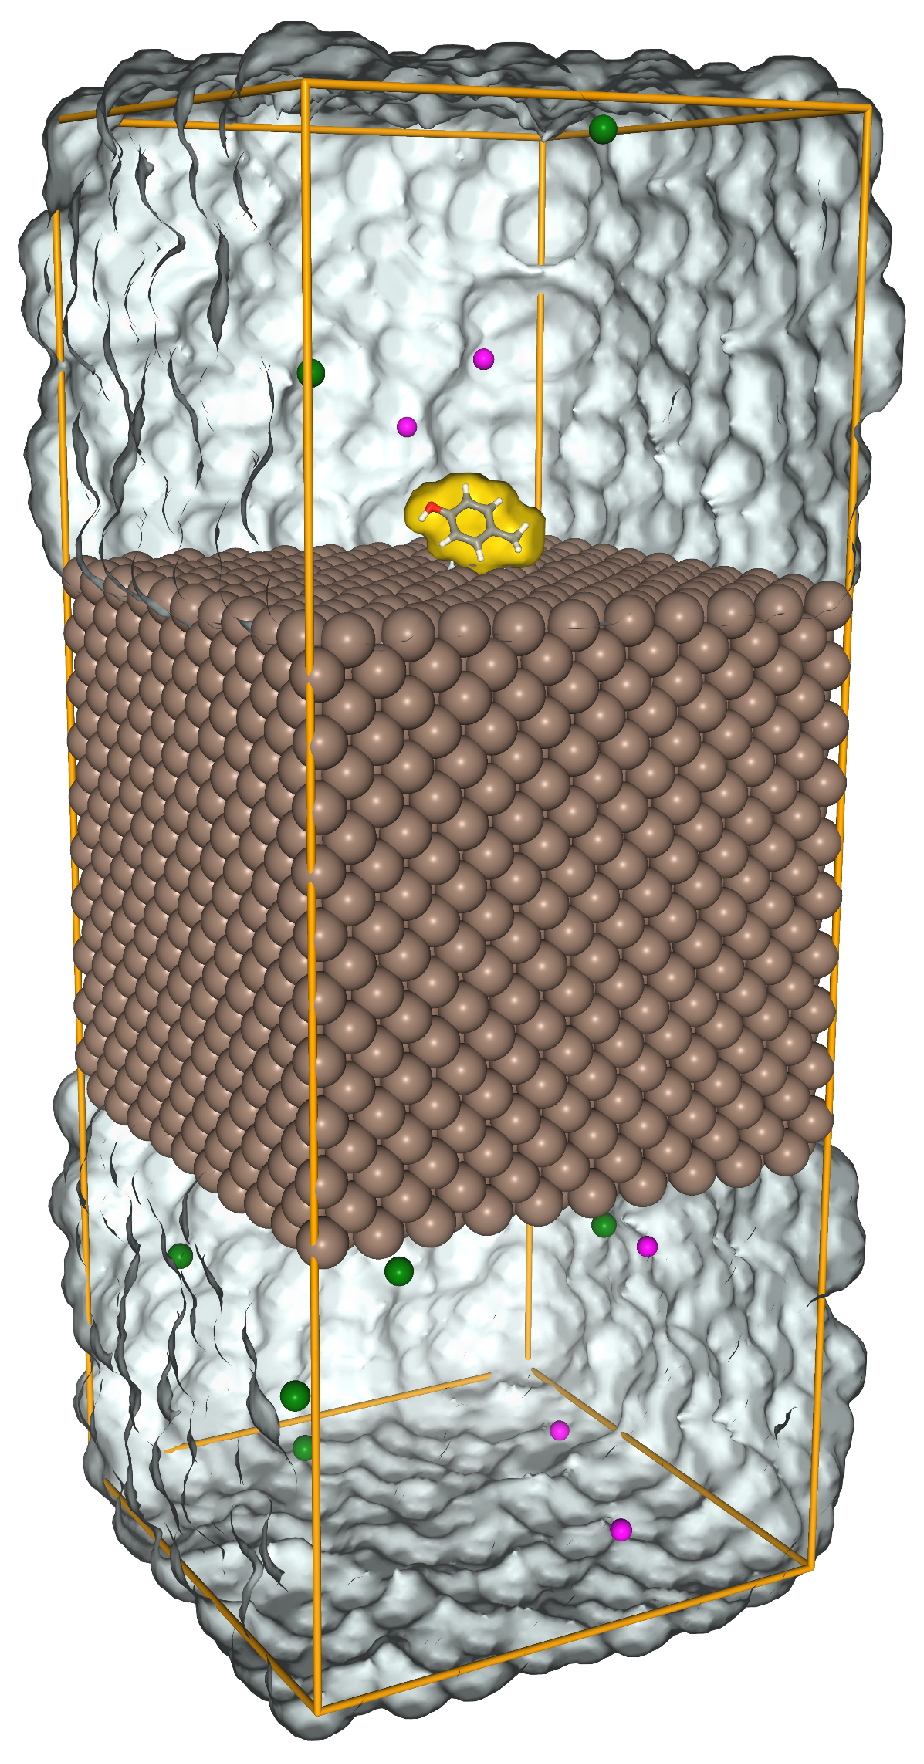
Figure 3.
Adsorption free energy profiles of AA SCA on 3 Fe fcc slabs as a function of SSD, calculated using AWT-MetaD. The vertical lines show the position of water and ion layers. (a) Fe-100 (b) Fe-110 and (c) Fe-111.
Figure 3.
Adsorption free energy profiles of AA SCA on 3 Fe fcc slabs as a function of SSD, calculated using AWT-MetaD. The vertical lines show the position of water and ion layers. (a) Fe-100 (b) Fe-110 and (c) Fe-111.
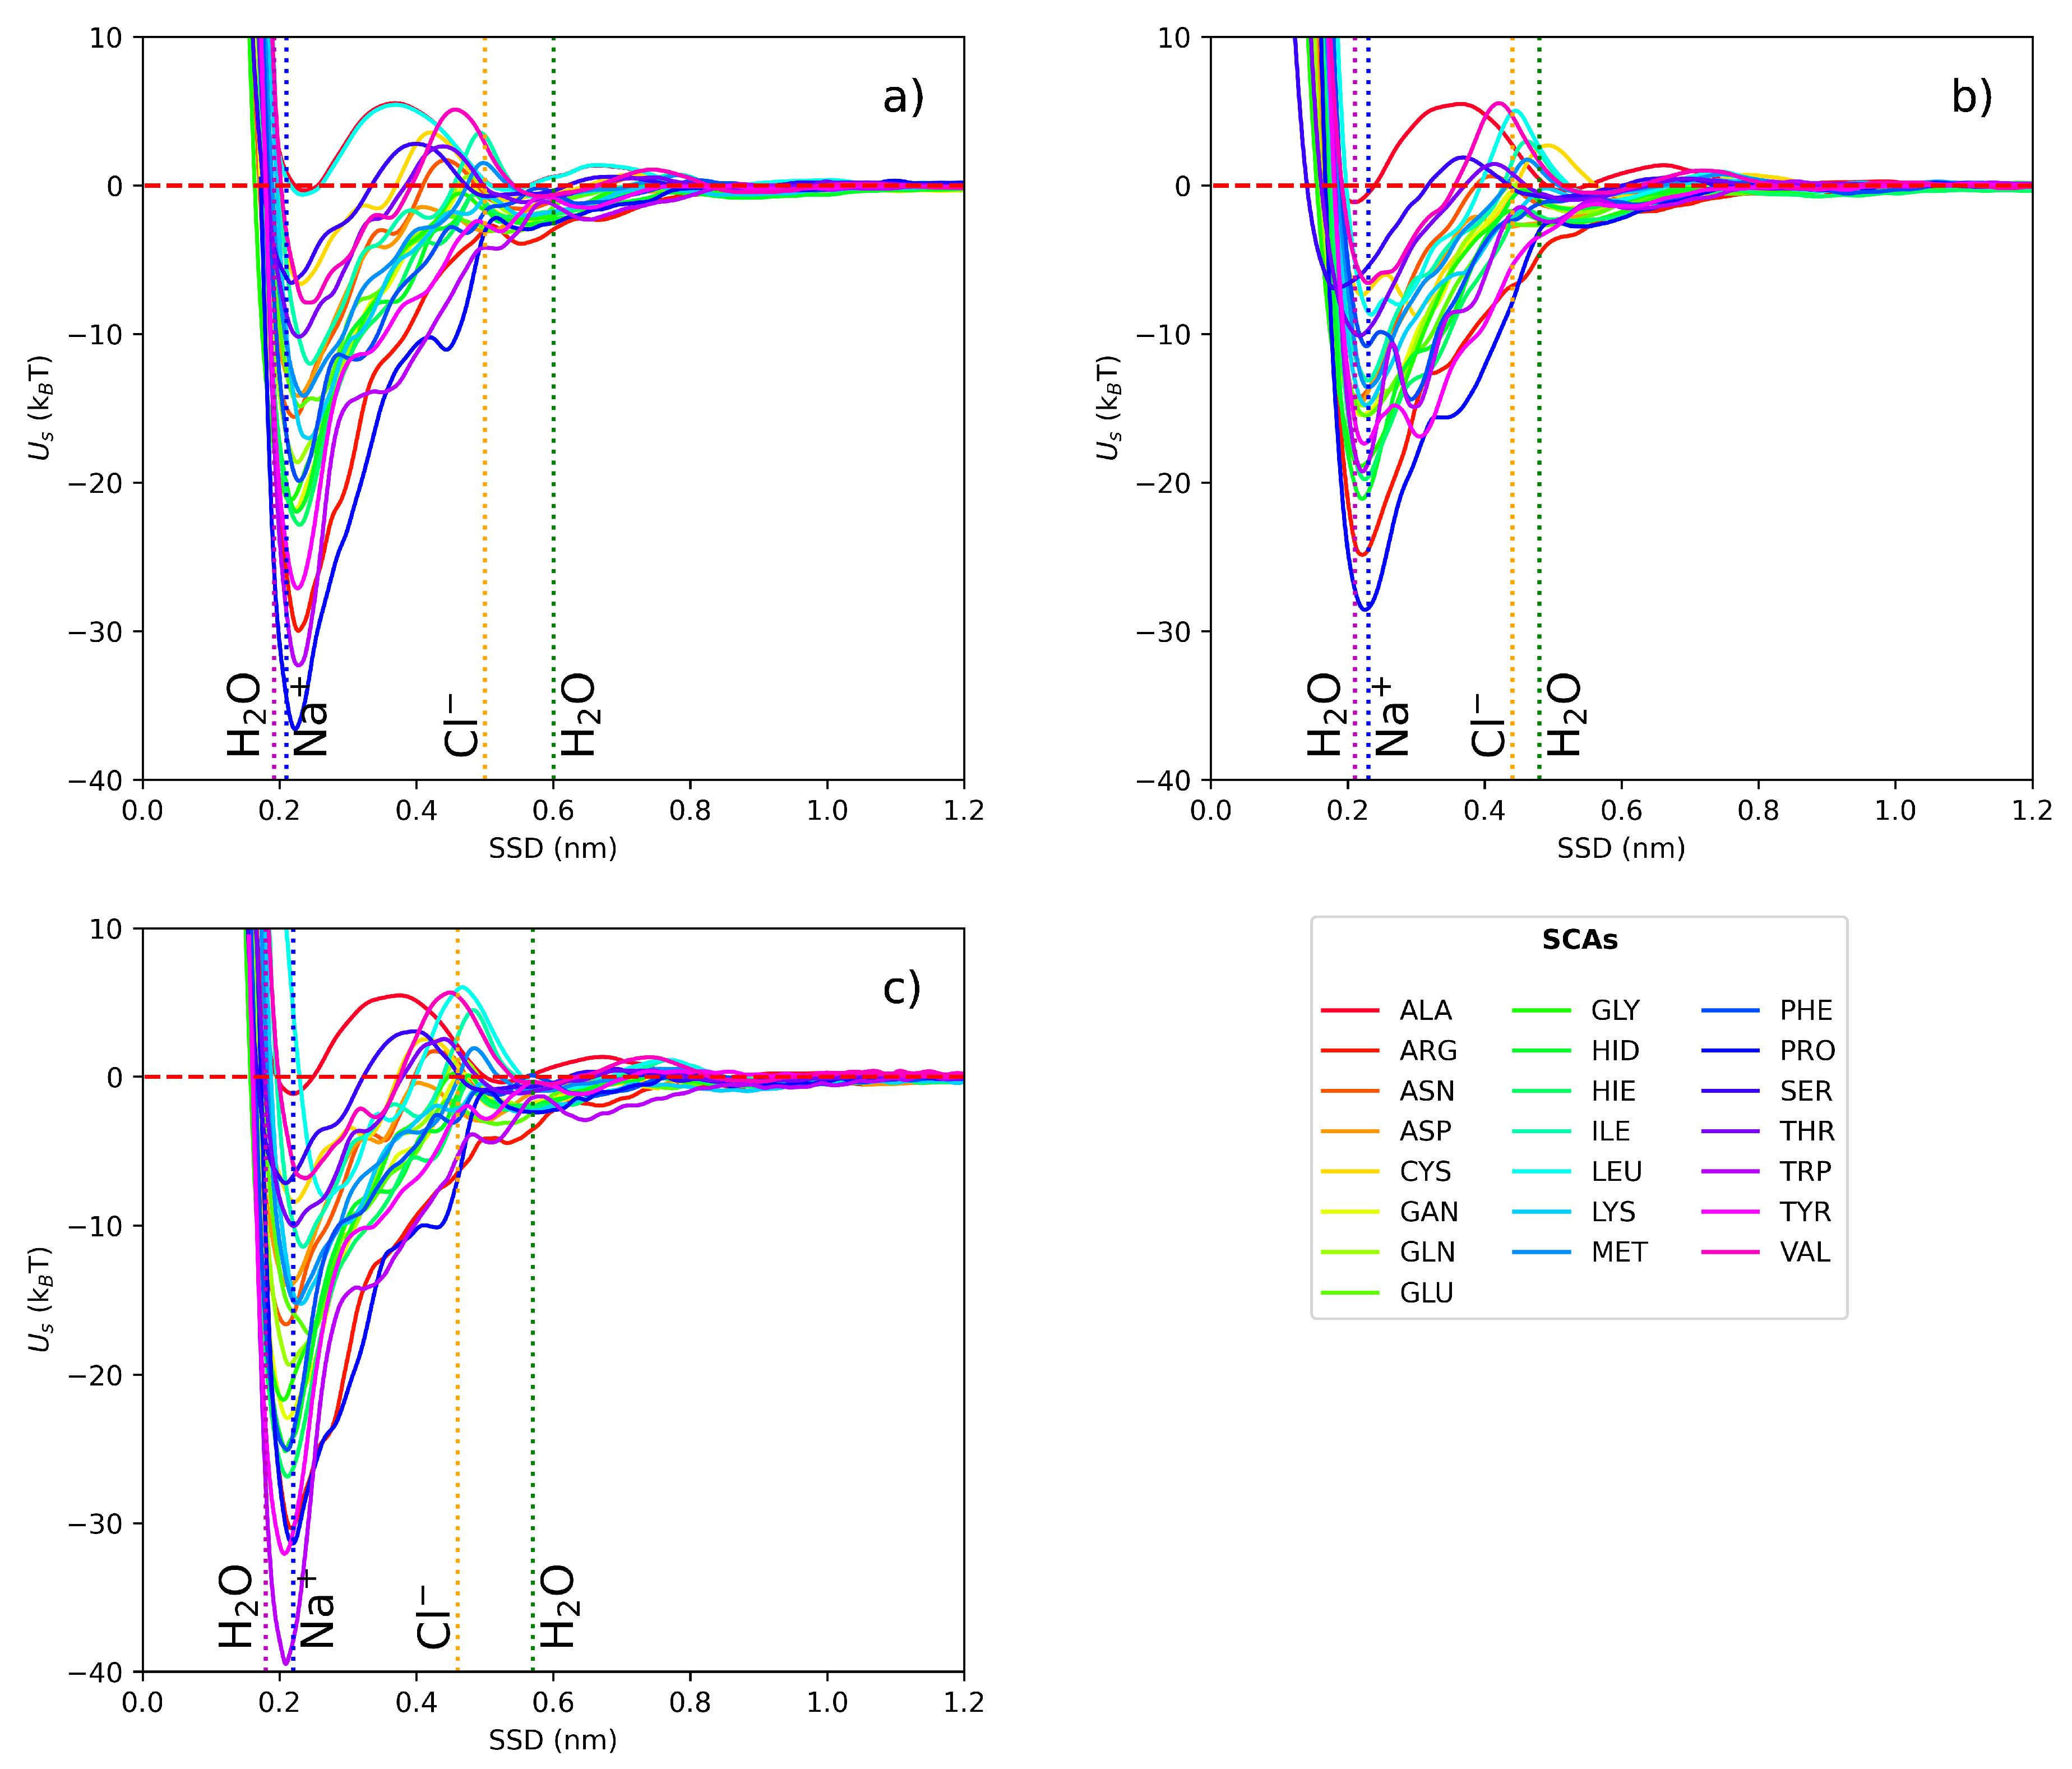
Figure 4.
Energy of adsorption (T) for each SCA on three Fe fcc slabs (100, 110, 111). Hydrophobic and polar AA weakly bind to the surfaces while the aromatic and charged AAs are bind strongest. Fe-111 shows stronger binding in comparison to Fe-100 and Fe-110.
Figure 4.
Energy of adsorption (T) for each SCA on three Fe fcc slabs (100, 110, 111). Hydrophobic and polar AA weakly bind to the surfaces while the aromatic and charged AAs are bind strongest. Fe-111 shows stronger binding in comparison to Fe-100 and Fe-110.
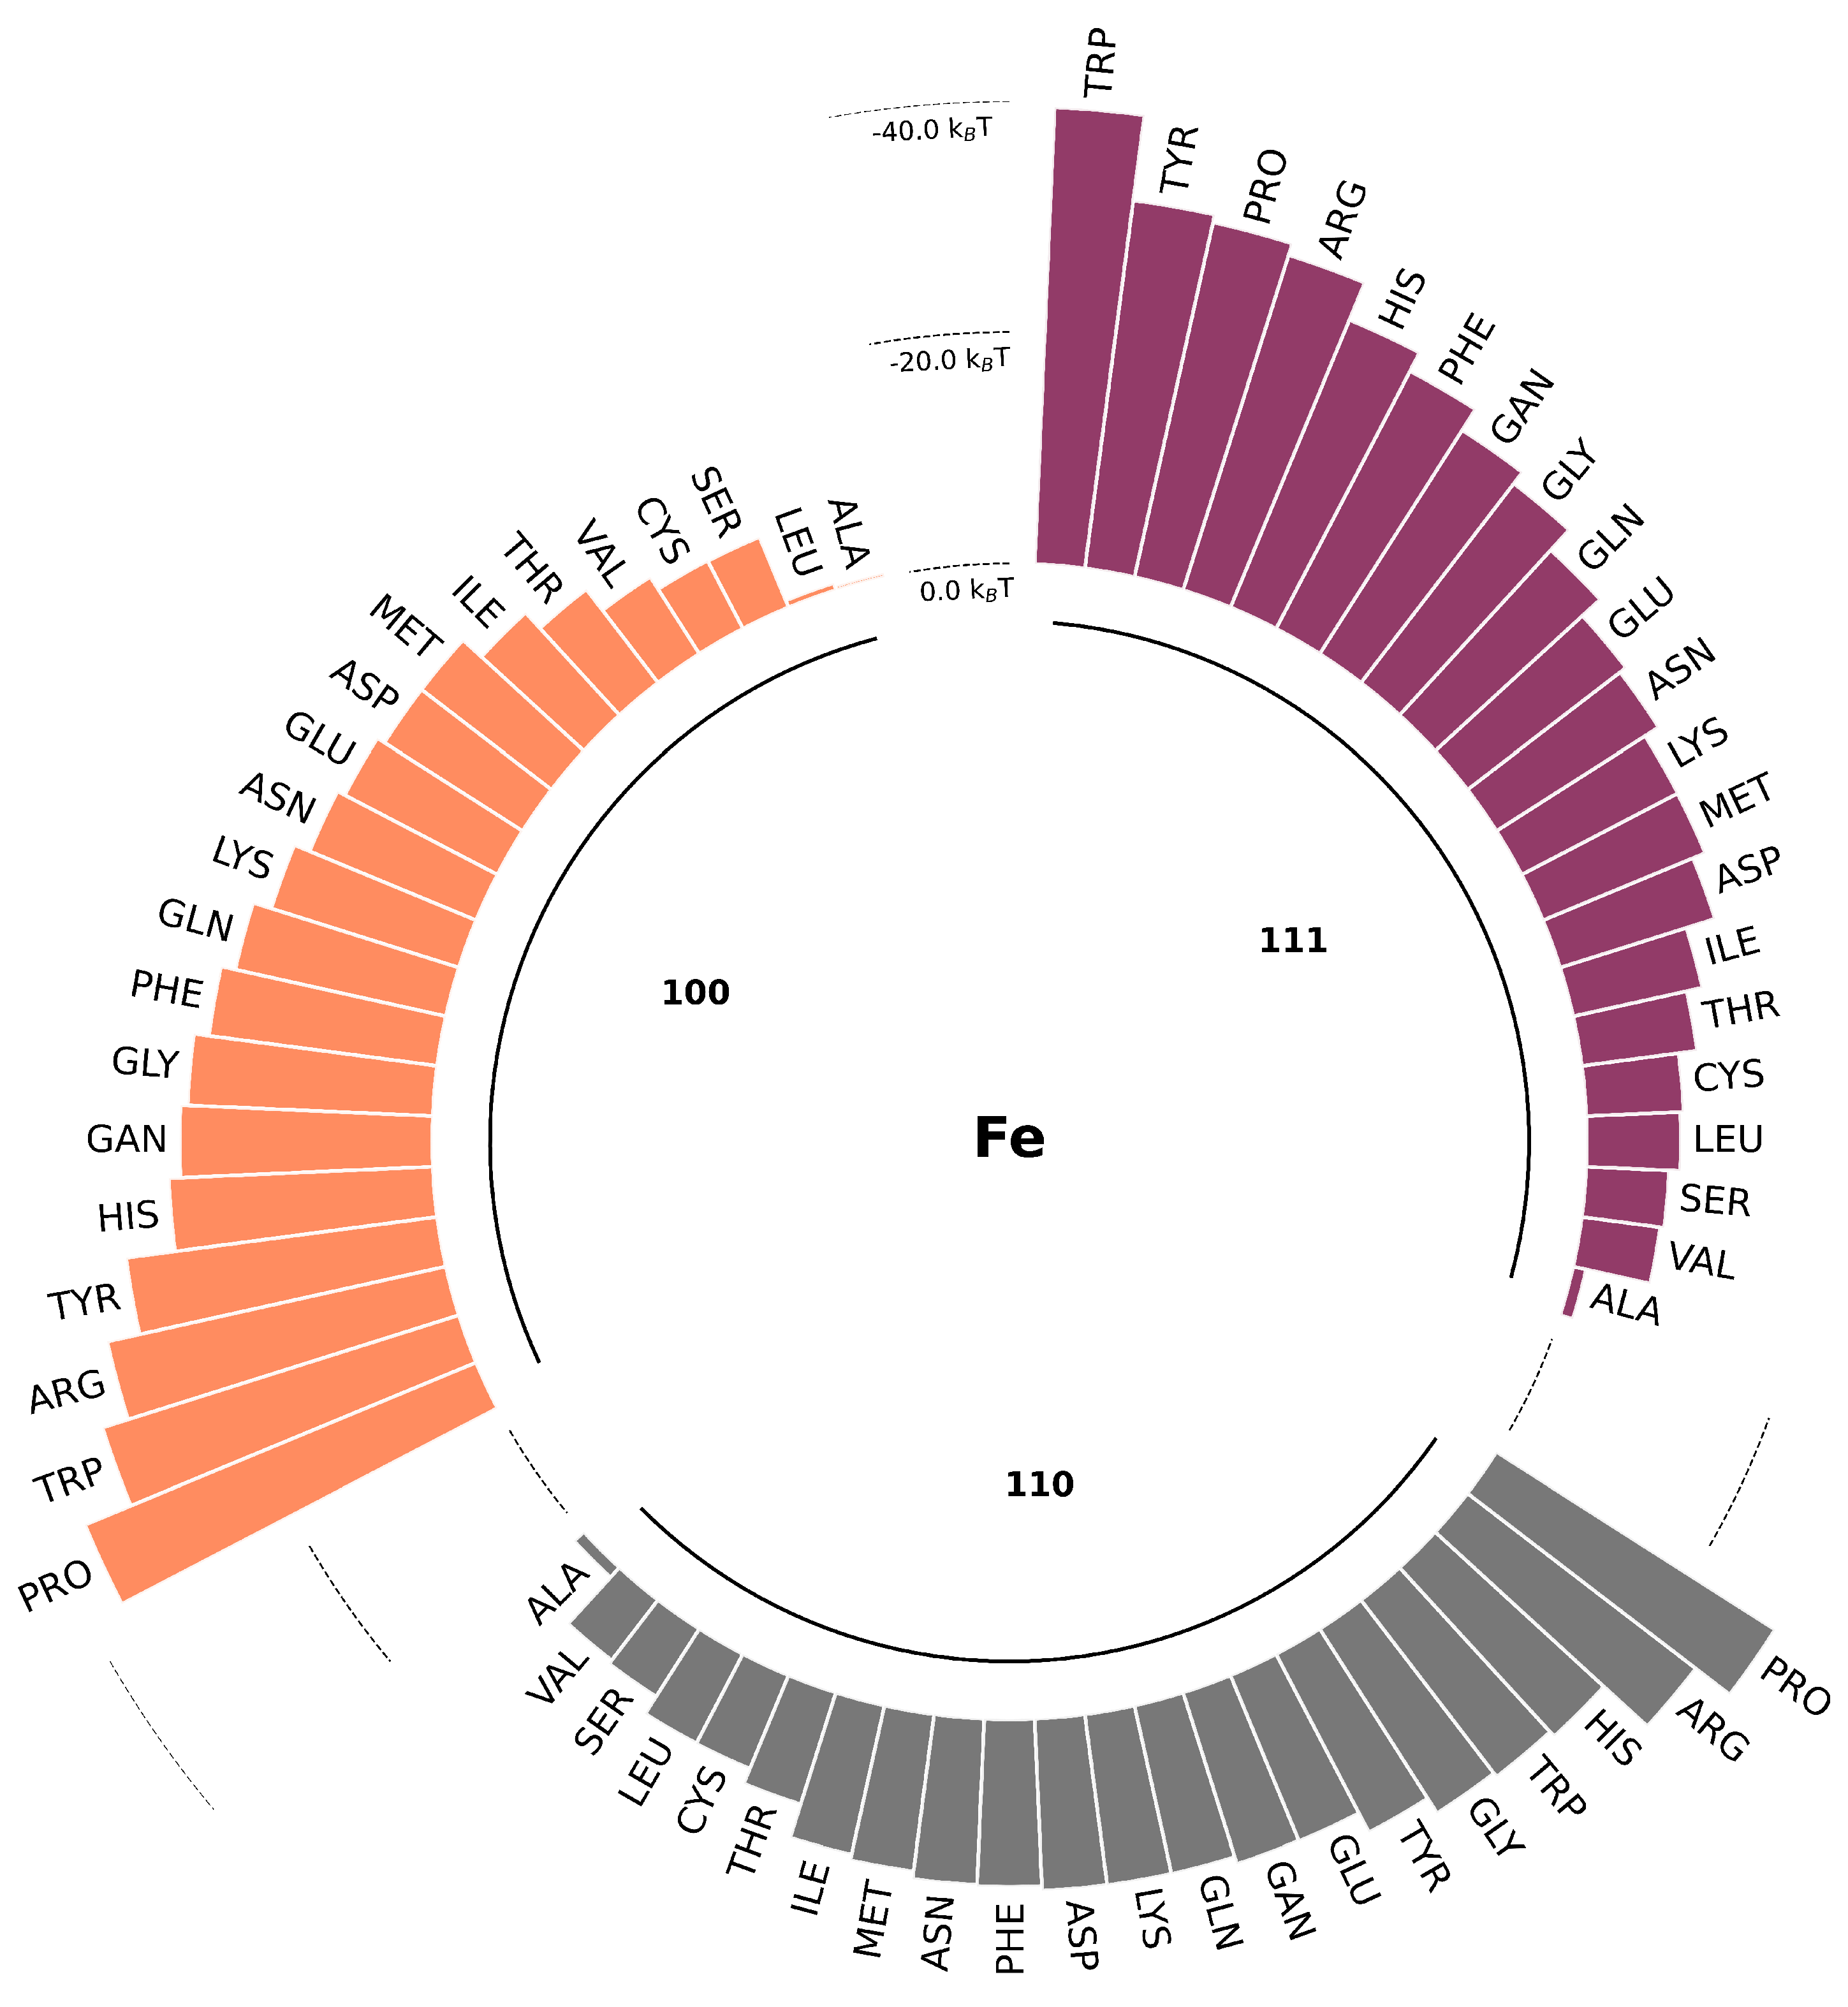
Figure 5.
Heatmap and corresponding 3D representation of the interaction of the (a) s1casein, (b) s2 casein, (c) casein, (d) lactoglobulins, (e) lactalbumin and (f) bovine serum albumin with Fe-110 on the preferred orientation, the figure is showing the closest SCAs to the surface of the material.
Figure 5.
Heatmap and corresponding 3D representation of the interaction of the (a) s1casein, (b) s2 casein, (c) casein, (d) lactoglobulins, (e) lactalbumin and (f) bovine serum albumin with Fe-110 on the preferred orientation, the figure is showing the closest SCAs to the surface of the material.
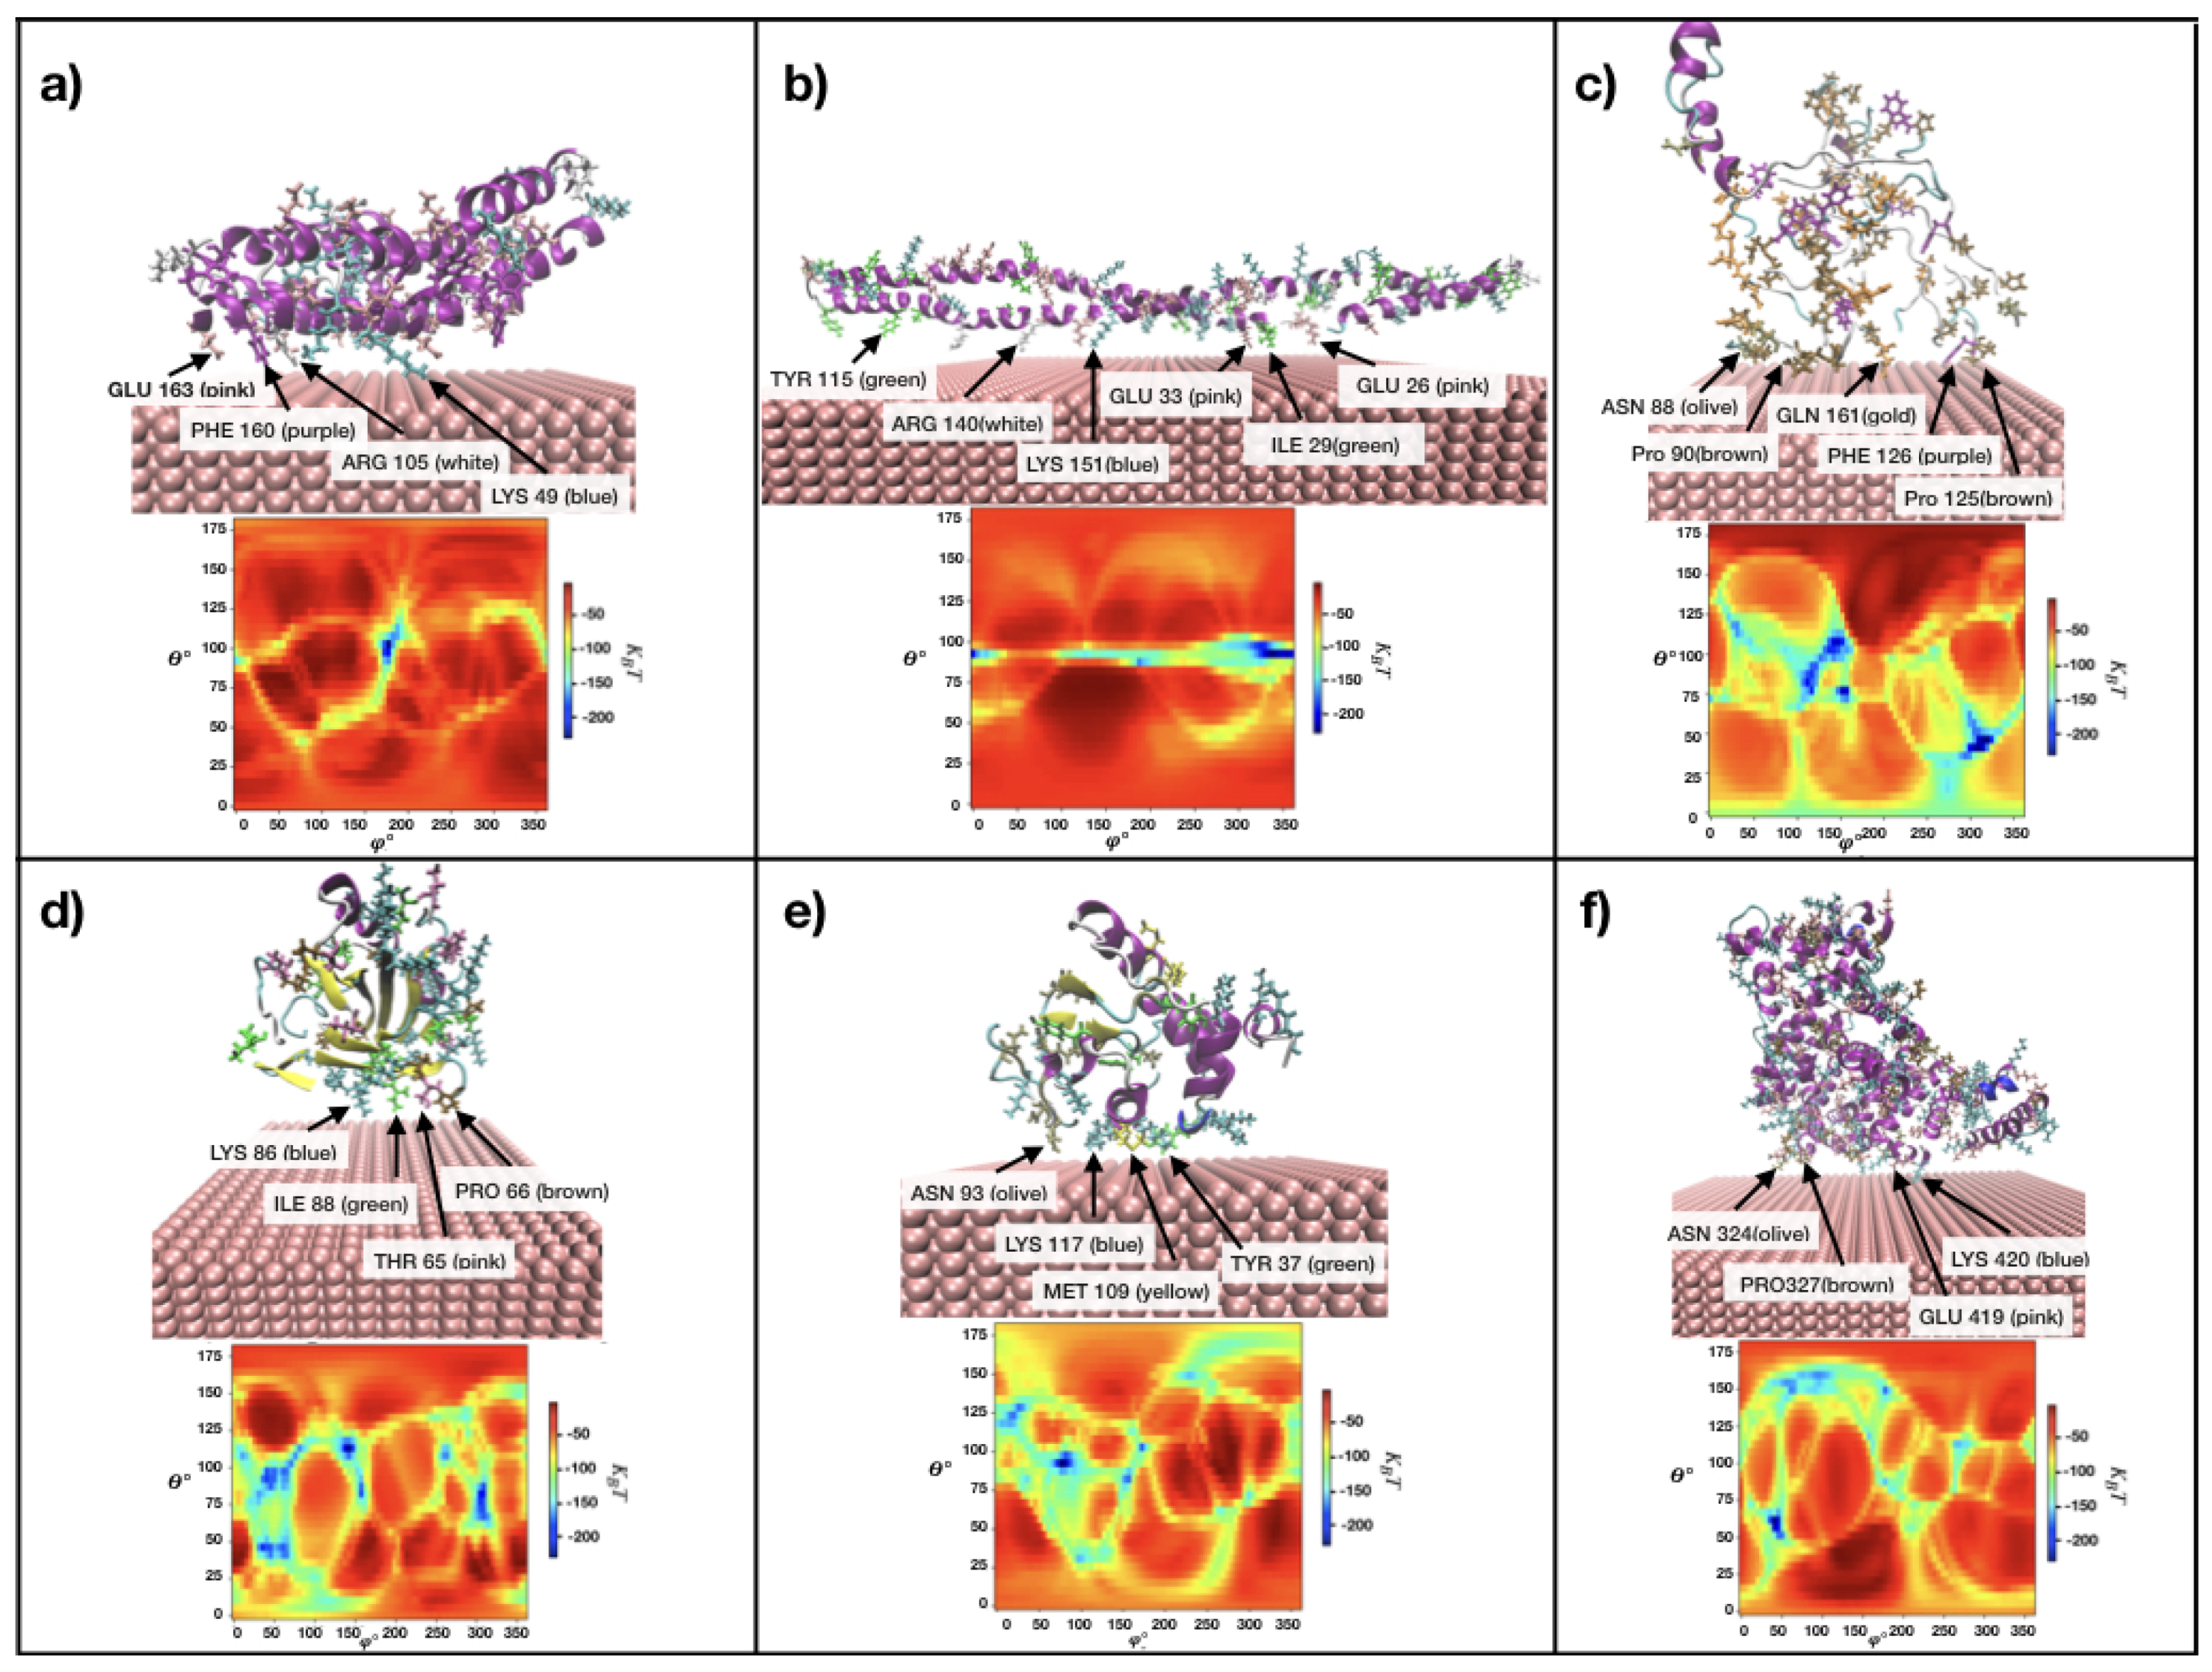
Figure 6.
adsorption on HSA on Fe-110 using UA and VMD. The figure shows the nearest amino acids of the protein to the slab (LYS,GLU,ASP and ARG).
Figure 6.
adsorption on HSA on Fe-110 using UA and VMD. The figure shows the nearest amino acids of the protein to the slab (LYS,GLU,ASP and ARG).
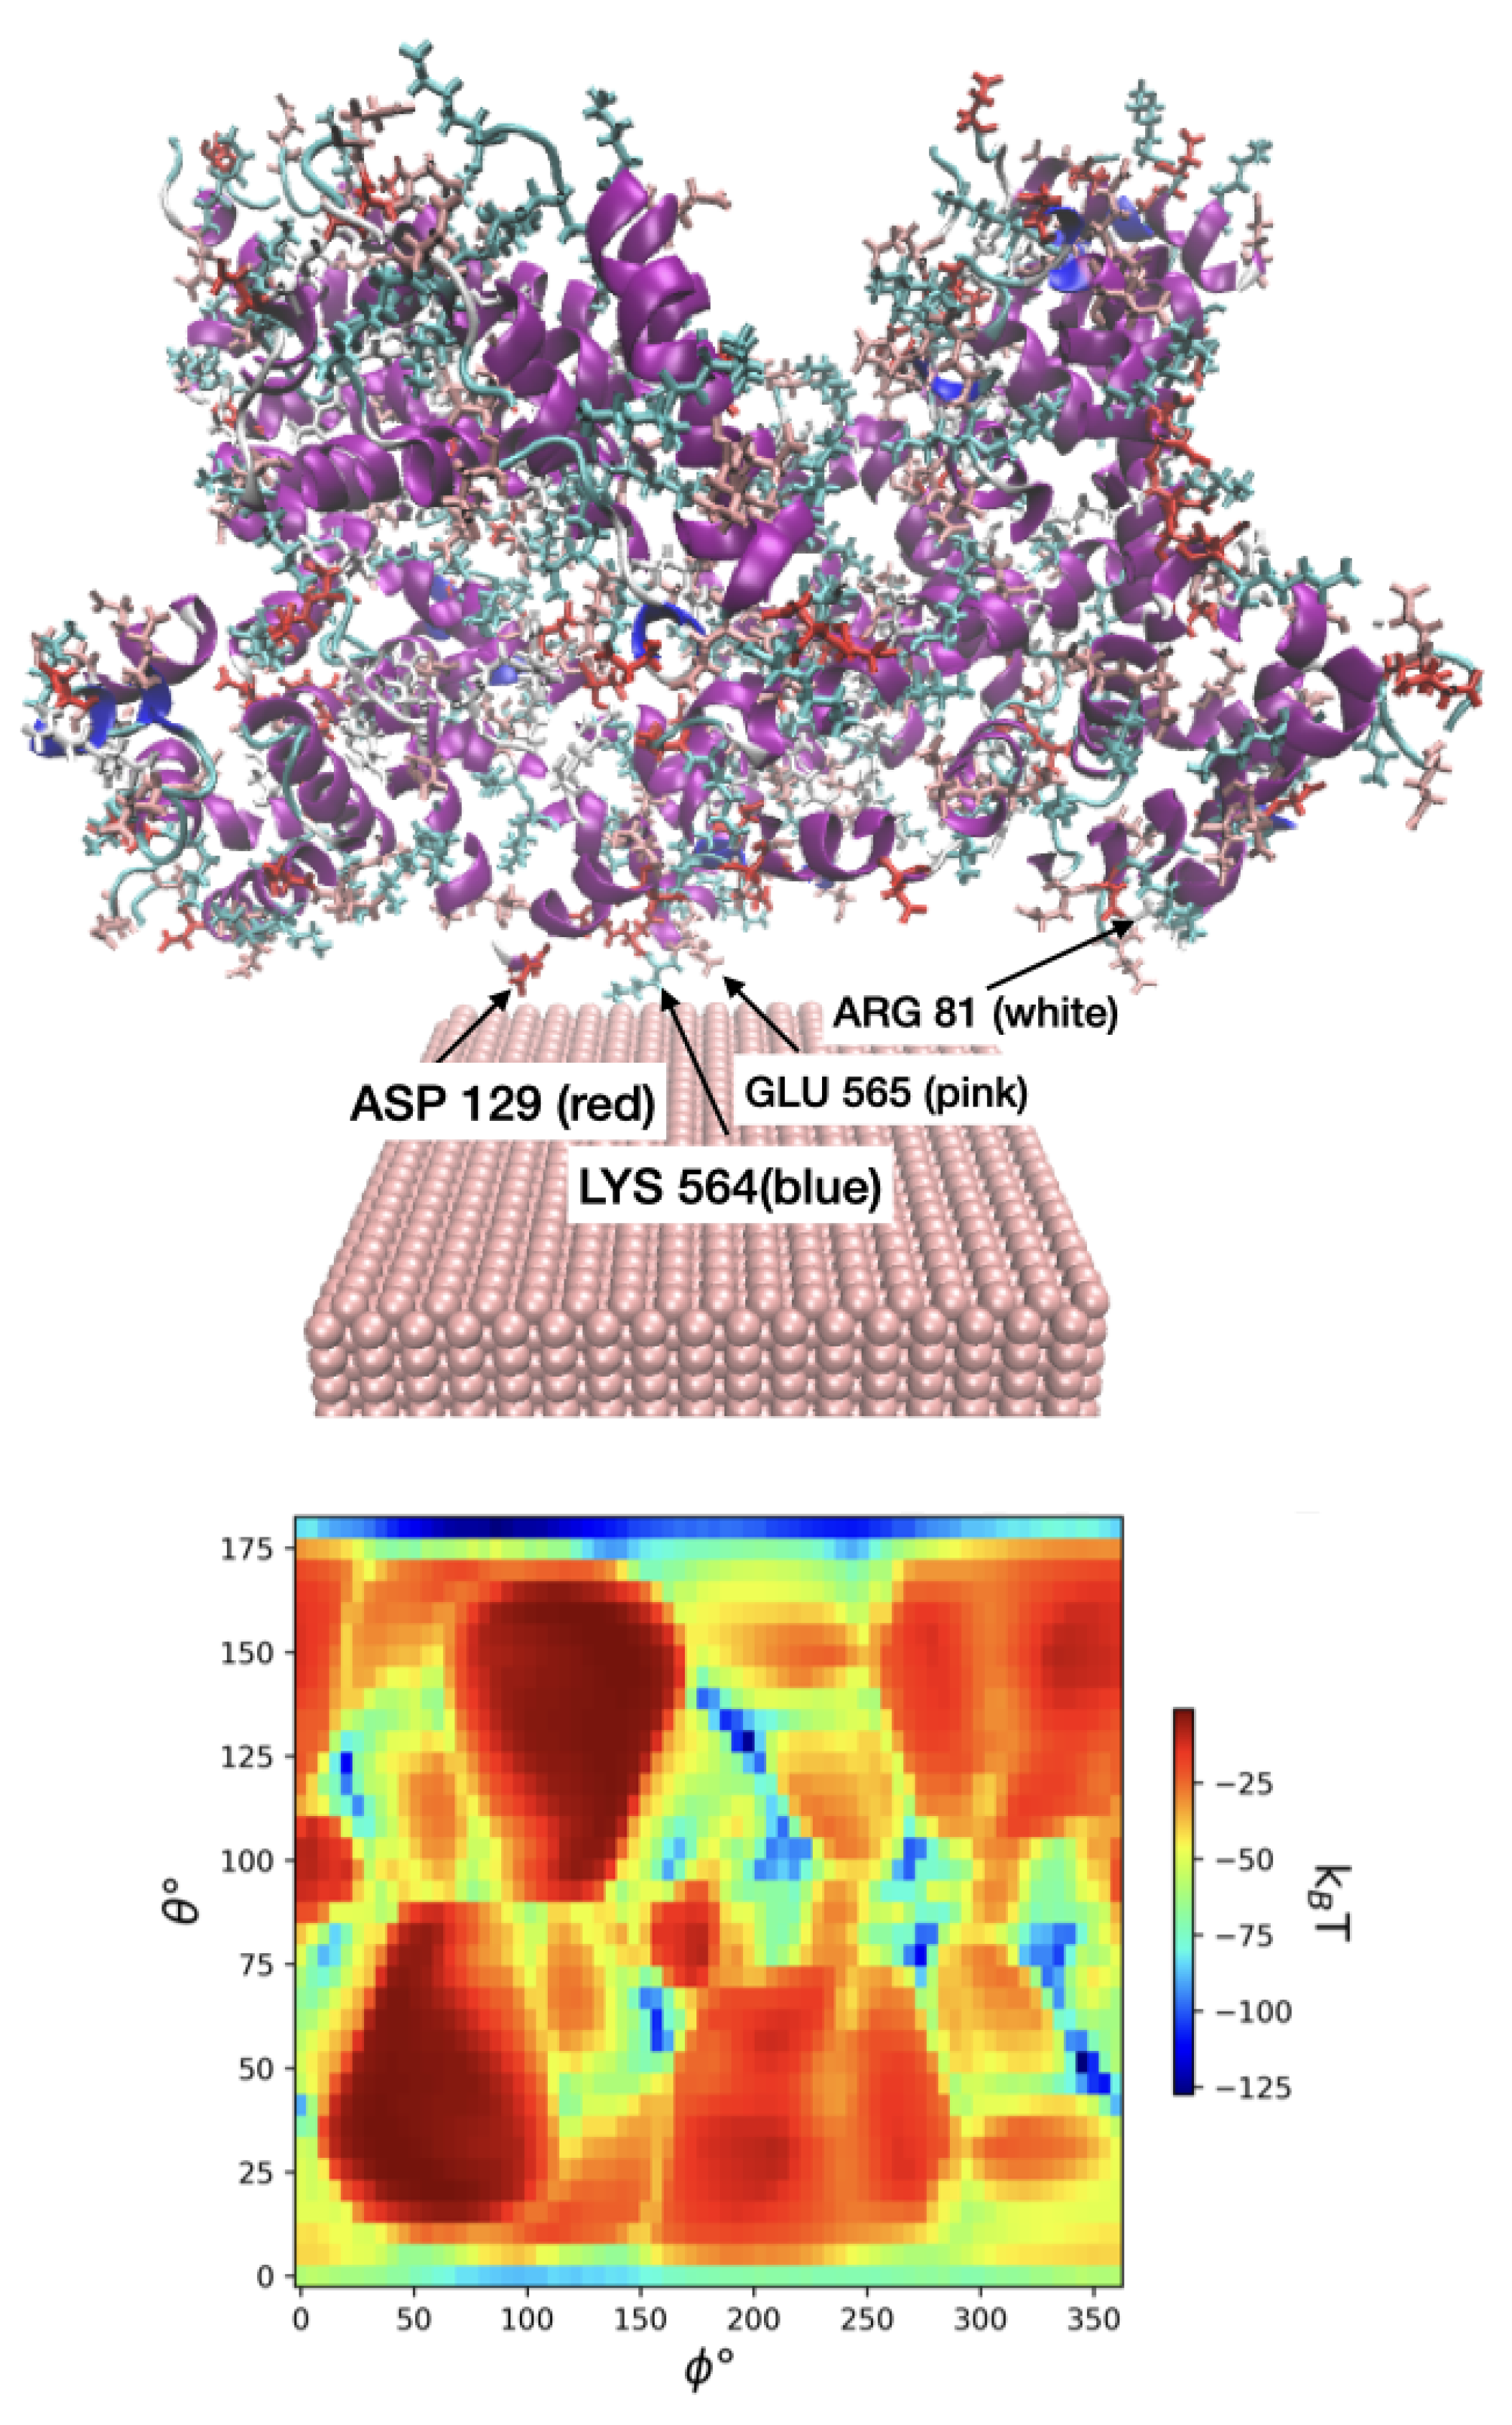

Table 1.
Characteristics of the selected milk proteins.
| Abbreviation | UniProt ID | Protein Name | , Da | Charge, e | ,mol/l | |
|---|---|---|---|---|---|---|
| AS1C | P02662 | -casein | 24528.00 | -8.5 | 214 | 4 |
| AS2C | P02663 | -casein | 26018.69 | 4.5 | 222 | 1 |
| BC | P02666 | -casein | 25107.33 | -4.5 | 224 | 4 |
| ALAC | P00711 | -lactalbumin | 16246.61 | -5 | 142 | 0.9 |
| BLAC | P02754 | -lactoglobulin | 19883.25 | -6 | 178 | 2 |
| BSA | P02769 | Bovine Serum Albumin | 69293.41 | -4.5 | 607 | 0.1 |
(a) Molecular weight, (b) Number of residues, (c) Concentrations [mol/l] of the protein in milk that were used in KMC calculations, Section 3.4.
Table 2.
Comparison of milk proteins’ binding affinities, orientations on Fe-100, Fe-110 and Fe-111 ordered by the binding strength on each surface.
Table 2.
Comparison of milk proteins’ binding affinities, orientations on Fe-100, Fe-110 and Fe-111 ordered by the binding strength on each surface.
| Individual protein adsorption description on Fe-10 | ||||
| Protein, | ,T | , | , | , nm |
| AS1C | -343.07 | 175 | 100 | 0.14 |
| AS2C | -238.64 | 335 | 90 | 0.08 |
| BC | -211.96 | 315 | 45 | 0.04 |
| BSA | -202.99 | 40 | 60 | 0.08 |
| ALAC | -159.12 | 80 | 90 | 0.18 |
| BLAC | -142.98 | 140 | 110 | 0.19 |
| Individual protein adsorption description on Fe-110 | ||||
| Protein, | ,T | , | , | , nm |
| AS1C | -325.92 | 175 | 100 | 0.14 |
| AS2C | -229.90 | 335 | 90 | 0.07 |
| BSA | -189.87 | 40 | 60 | 0.06 |
| BC | -162.43 | 310 | 45 | 0.04 |
| BLAC | -147.43 | 140 | 110 | 0.18 |
| ALAC | -144.41 | 75 | 90 | 0.16 |
| Individual protein adsorption description on Fe-111 | ||||
| Protein, | ,T | , | , | , nm |
| AS1C | -330.36 | 175 | 100 | 0.14 |
| AS2C | -230.99 | 330 | 90 | 0.10 |
| BC | -186.44 | 310 | 40 | 0.02 |
| BSA | -178.25 | 40 | 60 | 0.06 |
| ALAC | -154.60 | 75 | 90 | 0.15 |
| BLAC | -151.56 | 140 | 110 | 0.18 |
Descriptions of all 820 milk proteins interaction with FeNP surfaces based on the minimum energy of adsorption, their preferred orientation and minimum distance from surface are available here.
Table 3.
Mean amounts of proteins adsorbed on Fe surfaces per unit area: number concentration (per nm), mass abundance obtained from KMC simulations with NPs of radius 80 nm.
Table 3.
Mean amounts of proteins adsorbed on Fe surfaces per unit area: number concentration (per nm), mass abundance obtained from KMC simulations with NPs of radius 80 nm.
| Fe-100 | Fe-100 | Fe-110 | Fe-110 | Fe-111 | Fe-111 | |
|---|---|---|---|---|---|---|
| Protein | , nm] | ,% | , nm] | , % | , nm] | , % |
| AS1C | 9.8 | 41.22 | 9.0 | 38.77 | 9.6 | 40.33 |
| BLAC | 5.6 | 19.18 | 5.5 | 19.37 | 5.4 | 18.50 |
| BS | 4.1 | 17.40 | 4.2 | 18.80 | 4.3 | 18.29 |
| ALAC | 5.5 | 15.43 | 5.6 | 16.29 | 5.7 | 15.94 |
| AS2C | 1.4 | 6.19 | 1.3 | 6.15 | 1.4 | 6.19 |
| BSA | 0.05 | 0.59 | 0.05 | 0.60 | 0.06 | 0.73 |
Disclaimer/Publisher’s Note: The statements, opinions and data contained in all publications are solely those of the individual author(s) and contributor(s) and not of MDPI and/or the editor(s). MDPI and/or the editor(s) disclaim responsibility for any injury to people or property resulting from any ideas, methods, instructions or products referred to in the content. |
© 2023 by the authors. Licensee MDPI, Basel, Switzerland. This article is an open access article distributed under the terms and conditions of the Creative Commons Attribution (CC BY) license (http://creativecommons.org/licenses/by/4.0/).
Copyright: This open access article is published under a Creative Commons CC BY 4.0 license, which permit the free download, distribution, and reuse, provided that the author and preprint are cited in any reuse.


