Submitted:
23 May 2023
Posted:
24 May 2023
You are already at the latest version
Abstract
There are close dynamic relationships among the livelihood, well-being, and ecological environment of farm households. It is of great significance to scientifically clarify the impact of the grain for green policy on the livelihoods and well-being of farm households in mountainous areas. Based on data from a survey of 392 farm households in Zhangbei County, a system of indicators for farm household livelihood assets and farm household well-being was constructed, drawing on a sustainable livelihood framework (SLF). The livelihood assets and well-being levels of different types of farm households were measured, and a multiple linear regression model was used to analyze the impact of the grain for green policy implementation on the well-being levels of farm households. The three main results are as follows: (1) The level of natural assets among the total average livelihood assets of farm households in Zhangbei County is the highest at 0.374, while the level of physical assets is the lowest at 0.018. The level of livelihood assets of returned farmland households (0.948) is lower than that of nonreturned farmland households (1.117). (2) The level of well-being of all farm households in Zhangbei County is 0.517, with the level of wealth contributing the most to the well-being of farm households at 40.20% and the quality of the ecological environment contributing the least at 11.99%. The level of well-being of returned farmland households (0.518) was slightly higher than that of nonreturned farmland households (0.514). (3) The degree of influence of each influence factor on the level of well-being of farm households varies significantly. Household size was the strongest driver, at 0.366, while educational attainment of household members, household labor capacity, annual household expenditure, livelihood diversity, number of large production tools, and total value of livestock were also important drivers of household well-being, and area of arable land is negatively associated with household well-being. There are also differences in the factors influencing the level of well-being of different types of farming households.
Keywords:
Grain for green project
; Livelihood assets
; Livelihood diversity
; Well-being of farm households
; the mountainous areas of northern Hebei Province
1. Introduction
There are close dynamic relationships among the livelihood, well-being, and ecological environment of farm households. To relieve regional ecological pressure, improve ecological environment, and enhance farm households’ well-being, the Chinese government implemented the grain for green policy in 1999, and successively carried out ecological projects such as the construction of the Three Northern Protective Forests System (phases IV and V), the construction of the Beijing–Tianjin Wind and Sand Source Control, the construction of the Yangtze River Protective Forest System (phases II and III), and the treatment of rock desertification in Southwest China [1]. Grain for green project is a management mode of ecological restoration by stopping cultivation of sloping land and planting trees and grass to restore vegetation. In the past 20 years, China has implemented reforestation and grass restoration up to 3.43×10⁵ km2 and contributed more than 4% to the global greening area in the same period, which has significantly improved the ecological environment and ecosystem services quality. Ecosystem changes directly or indirectly affect the survival and livelihood development of rural farmers and the well-being of residents, and protecting ecosystems, promoting livelihood development, and improving the well-being of residents are core components of achieving the United Nations (UN) 2030 Sustainable Development Goals [2]. In China’s vast fragile mountainous areas, the contradictions between ecological environmental protection, farm households’ livelihood development, and residents’ well-being are prominent, and how to protect the ecological environment while safeguarding farm households’ livelihoods and improving residents’ well-being is a critical issue that needs urgent attention. Therefore, it is important to scientifically clarify the impacts of the grain for green policy on the livelihoods of farm households and the well-being of residents in mountainous areas.
Many scholars have studied the relationships among ecological conservation, farmers’ livelihoods, and residents’ well-being, focusing on the relationship between farmers’ livelihoods and ecosystem services [3,4,5], the relationship between ecosystem services and residents’ well-being [2,6,7,8,9], and the relationship between farmers’ livelihoods and residents’ well-being [10]. Recently, ecological protection and high-quality development have become the focus of Chinese efforts. With the implementation of ecological civilization and rural revitalization strategies, research on the relationship between ecosystem services, farmers’ livelihoods, and residents’ well-being has become a hot academic issue. Ecosystem services can be used to measure the effectiveness of ecological policies, and the value and physical quantity of ecosystem services can be estimated through value-equivalent scales and the Integrated Valuation of Ecosystem Servicesand Tradeoffs (InVEST) model [11,12]. Farm households’ livelihoods are measured by drawing on the sustainable livelihoods framework, and the human development index, life satisfaction, and well-being index frameworks are used to assess residents’ well-being [13,14,15]. The relationship between ecosystem services and residents’ well-being has been measured with the coupled coordination model, elasticity coefficient, and bivariate spatial autocorrelation, with different results. Some scholars argue that ecosystem services and cultural services greatly impact the satisfaction of material needs and the development of social relationships, respectively, and that ecosystem services have a significant positive impact on the objective and subjective well-being of residents, with group differences in their effects [16,17]; others point out that ecosystem services have a negative impact on human health and physical well-being [18]. Based on the value of ecosystem services theory, researchers have identified spatial and temporal variations in per capita ecological well-being and economic efficiency in Chinese cities at the prefecture level and above and have elucidated patterns of different types of ecological well-being [19]. Ecological compensation also has an important impact on residents’ well-being, as it compensates for the loss of well-being to incentivize conservation and thus increase the well-being of the residents [20]. Therefore, some scholars have summarized the reasons, implications, and pathways of ecological compensation mechanisms from a resource opportunity-cost perspective [21]. A survey of farm households in special hardship areas found a coupling between ecosystem service functions and farm household well-being [22]; moreover, there are couplings between all four ecosystem service functions (supply service, regulation service, cultural service and support service) and farm household well-being levels [23]. Concurrently, studies on the impact of the grain for green policy on the well-being of residents are emerging. A comparative analysis of panel data on farm households revealed variations in grain for green policy impacts on the well-being of farm households across regions [24]. Overall, studies have focused on the contribution of ecosystem services to human well-being, the dependence of human well-being on ecosystem services, and the coupling between the two, while less attention has been paid to the impact of changes in farm households’ livelihoods on the well-being of residents in the context of ecological policy implementation or ecological engineering.
This study selects Zhangbei County in the mountainous area of northern Hebei Province as the investigation area, and based on the sustainable livelihood framework and farm household survey data, it integrates the livelihood asset measurement model, resident well-being measurement model, and the multiple linear regression model to analyze the impact of farm household livelihoods on farm household well-being in the mountainous areas of northern Hebei under the effects of the grain for green policy. This work provides a scientific reference for the ecological project construction and resident well-being improvements in the region.
2. Materials and Methods
2.1. Study area
Zhangbei County is in the northwestern part of Zhangjiakou City, at the transition zone between the Inner Mongolia Plateau and the North China Plain. The geographical location is 40°57’–41°34’ N and 114°10’–115°27’ E. Its area is 4185 km2, including 18 towns (7 towns and 11 townships), 366 administrative villages, and 1167 natural villages. The topography of the county decreases from southwest to north, with elevations between 1300 m and 2128 m, and the terrain includes plateaus, hills, and mountains. Due to the continental monsoon climate of middle latitude temperate zone, the average annual temperature of the area is only 3.2℃ and the average annual precipitation is only 392.7 mm, which is suitable for vegetable cultivation in different seasons. By the end of 2021, the total population of Zhangbei County was 0.356 million. In 2021, its gross domestic product (GDP) was 4.98 billion yuan, and the ratio of the structure of primary, secondary and tertiary industriesbreakdown was 9.9:32.7:57.4. Agriculture and animal husbandry are intertwined within the county, and the ecological environment is sensitive and fragile. Zhangbei County is a component of an important green ecological barrier in northern China, responsible for building a strong ecological barrier in the Beijing–Tianjin–Hebei region. The grain for green policy has been piloted since 2000 and was fully launched in 2002. In the past 20 years, the vegetation coverage rate in Zhangbei County has significantly increased, and the ecological environment has been continually improving, which has affected the livelihoods and well-being of farm households. Given the large-scale and significant grain for green policy achievements in Zhangbei County, a survey was conducted on the impacts of the policy on the livelihoods and well-being of farm households in some townships of Zhangbei County (Figure 1).
2.2. Data sources
The data used in this work were obtained through questionnaires and semistructured interviews with farm households using the Participatory Rural Appraisal (PRA). Based on the physical geography, accessibility, and implementation of the grain for green policy in Zhangbei County, 392 farm households in 26 villages in 8 townships were selected for research interviews (Figure 1). Based on the farmers’ own evaluation, analysis, implementation, supervision, and assessment of the grain for green policy status, an in-depth understanding of the policy and the living and production environment of the farmers in Zhangbei County was conducted. Three-hundred-ninety-eight questionnaires were distributed in this survey, and six invalid questionnaires were eliminated for a total of 392 valid questionnaires involving 1,173 people. The questionnaire efficiency was 98.5%. Among the surveyed farm households, there are 273 returning farmland households, accounting for 69.6% of the total valid sample households and 119 nonreturning farmland households, accounting for 30.4% of the total valid sample households.
The survey included demographic information (population, employment, income, etc.), basic land information (the status of farm households’ land returned to forest, the overall status of farm households’ land and crop cultivation before and after the return to forest), the status of livelihood assets, livelihood strategies, and farm households’ response to the grain for green policy.
2.3. Research methods
2.3.1. Classification of farm households by type
Since the implementation of the grain for green policy, Zhangbei County has successively returned farmland to forest and grass on sloping farmland above 25°, on sloping farmland with important water sources between 15° and 25°, and on sandy farmland. Restricted by the policy conditions, the grain for green policy cannot cover all farm households within the project area. Therefore, in this work, the surveyed households are divided into returned farmland households and nonreturned farmland households based on whether they participate in the policy. Among the surveyed households, there were 273 returned farmland households and 119 nonreturned farmland households, accounting for 69.64% and 30.36% of the total households surveyed.
2.3.2. Measurement of livelihood diversity
According to the survey results, livelihood diversity is increased by one unit whenever a farm household engages in a certain livelihood activity, until the total number of types of livelihood activities engaged in by the household is reached. The calculation method of farm households’ livelihood diversity is:
Where N is farm household livelihood diversity and βi is farm household livelihood type.
2.3.3. Measurement of livelihood assets and well-being
(1) Indicator Selection
Referring to the sustainable livelihood framework of the United Kingdom Department for International Development [25,26], the livelihood assets evaluation system of farm households in Zhangbei County was constructed from five dimensions: human, natural, physical, social, and financial assets (Table 1), with corresponding adjustments to the actual situation in the study area. The welfare of farm households involves production, living, health, and safety conditions of rural farm households, concentrating on the improvement of living standards, production conditions, infrastructure, and social security. This method is based on the conceptual framework of human well-being and its multidimensional and hierarchical structure, following the principles of scientificity, validity, and hierarchy. The farm household welfare indicators system was constructed from the four dimensions of household characteristics, wealth level, ecological environment quality, and social conditions (Table 2).
(2) Determination of Indicator Weight
The nature of the indicators are divided according to their attributes of the selected indicators and the assigned values. Positive indicators are those that represent upward or forward progress, and the higher the value of these indicators the better the evaluation, while the opposite is true for negative indicators. To facilitate the calculation and make the indicators trend the same, the negative indicators are converted to positive. Since the indicators have different dimensions, the work adopts the standardization of the mean value to dimensionlessly process the indicators. The entropy value method was used to determine the index weights [27]. The relevant formulas are detailed in the literature collection.
(3) Measurement of Indicators
The livelihood assets and welfare level of farm households was calculated using the linear weighted summation method. The calculation formulas are as follows:
Where F is the total value of livelihood assets or the well-being level of farm households, Wj is the weight of the livelihood assets index of the jth item or the well-being index of the jth item, and Yij is the standardized value of the jth item in the ith statistical unit.
2.3.4. Model of factors influencing the farm household welfare level
The welfare level of farm households is influenced by numerous factors, such as farm households’ livelihood diversity and farm households’ livelihood assets. In this work, the multiple linear regression model quantitatively identifies the specific factors influencing the welfare level of farm households. The regression model is as follows:
Where Y represents the welfare level of farm households, Xi (i=1, 2, 3,...) represents the relevant indicators, B0 represents the regression constant, Bi represents the regression coefficient, and ε represents the random error term.
3. Results
3.1. Analysis of livelihood characteristics of farm households
Based on the interpretation of the sustainable livelihood framework, the livelihood status of farm households depends on the comprehensive role of various livelihood assets, and their livelihood goals are also achieved on this basis [28,29]. However, livelihood assets cannot indicate farm households’ choice of livelihood activities, so the characteristics of farm households’ livelihoods include two aspects: livelihood assets and livelihood diversity.
3.1.1. Farm households’ livelihood diversity characteristics
Farm households are rational economic agents that can choose different livelihood activities according to their available livelihood assets. Farm households can maintain their status by diversifying their livelihood activities through different asset allocations to cope with risks and shocks [30]. After conducting a survey of 392 farm households, three distinct types of farming livelihoods were identified: food crops, cash crops, and vegetable crops. In addition, nonfarming livelihoods were also present, including animal husbandry, forestry, part-time work, self-employment, permanent work, and freelance work.
The statistics show that the average livelihood diversity of the returned farmland households is higher than that of the nonreturned farmland households (Figure 2), which is because returned farmland households have shifted to other livelihood activities after retiring from farming. However, the difference in average livelihood diversity between the two types of farm households is not significant, probably because most nonreturning households are engaged in more than one type of cultivation.
3.1.2. Farm households’ livelihood assets characteristics
Zhangbei County is in the Bashang plateau area, and the landscape can be divided into the dam-head mountainous area, the hilly area, and the undulating plateau area [31]. The special topography and climatic conditions have led to ecological fragility and frequent natural disasters in the area. As a result, in general, Zhangbei farm households have low levels of livelihood assets and live in poverty.
The order of average livelihood asset levels of farm households in Zhangbei County is Natural Assets > Social Assets > Financial Assets > Human Assets > Material Assets. A comparison of returned farmland and nonreturned farmland households revealed that the average total asset levels of returned farmland households are lower than those of nonreturned farmland households. Among them, only the financial assets of the returned farmland households are higher than those of the nonreturned farmland households, while the rest of the assets are lower than those of the nonreturned farmland households. The level of natural assets in Zhangbei County was 0.374 (Figure 3), contributing the most to total assets at 37.43% (Figure 4). In terms of the contribution of each indicator to natural assets, the area of watered land contributed the most, at 87.69% (Table 3). In comparing returned farmland and nonreturned farmland households, the natural assets level of nonreturned farmland households was greater than that of returned farmland households. The human assets per capita of all farm households in Zhangbei County was 0.068, contributing 6.77% to the total assets (Table 3). The education attainment of household members contributed the most to the level of human assets, at 61.69%, while the size of the household contributed the least, at 14.76%. The level of human assets of nonreturned farmland households is greater than that of returned farmland households. The level of physical assets in Zhangbei County was 0.018, contributing 1.83% to the total assets and accounting for the lowest proportion. The number of large production tools and the residential index contributed 72.96% and 27.04%, respectively. The physical assets of returned farmland households are slightly lower than those of nonreturned farmland households, with the contribution of each indicator following the trend of total farm households. The level of social assets is 0.337, which is the second highest contribution to total assets, at 33.75%. The number of public officials among relatives contributed the most to social assets, at 86.09%. The social assets of returned farmland households (0.328) were lower than those of nonreturned farmland households (0.359). The average level of financial assets of farm households in Zhangbei County was 0.202, contributing 20.21% to total assets. The value of livestock made the largest contribution to financial assets, exceeding 2/3 of total financial assets.
3.2. Analysis of the level of well-being of farm households
The level of well-being of all farm households in Zhangbei County is 0.517; that of returned farmland households is 0.518 and that of nonreturned farmland households is 0.514. The contribution of each indicator to the well-being of farm households shows that the wealth level contributes the most, at 40.20%, while the ecological environment quality contributes the least, at 11.99% (Figure 5). A comparison of returned farmland households with nonreturned farmland households reveals that the labor force condition of nonreturned farmland households are greater than those of returned farmland households, because older people in general are less able to work and are more inclined to return farmland.
As can be understood from Table 4, the number of people engaged in noncultivated agriculture plays a vital role in labor force conditions, contributing the most; the household size contributes the least. Comparing returned farmland households with nonreturned farmland households, the labor force conditions in nonreturned farmland households contribute more to the level of well-being than in returned farmland households. In terms of the contribution of each indicator to the wealth level, the arable land per capita contributed the most, with a contribution of 48.65%, followed by annual household expenditure. The wealth level of nonreturned farmland households is greater than that of returned farmland households. Comparing the contribution of each factor to the ecological environment quality, in descending order these are water safety > air safety > soil and water conservation > soil safety. The overall contribution of the ecological environment quality in returned farmland households is slightly higher than that in nonreturned farmland households. Social conditions made the second highest contribution to the level of well-being of farm households. Traffic accessibility made the largest contribution to social conditions at 70.73%, significantly higher than the other two indicators. The level of social conditions is higher for returned farmland households than for nonreturned farmland households.
3.3. Analysis of the impact of farm household livelihoods on farm household well-being
The level of farm households’ well-being is influenced by a variety of factors, of which the farm households’ livelihood assets are often the basis. Figure 6 shows that there is a significant positive relationship between farm household livelihood assets and the level of well-being. The negative value of farm household livelihood assets in the figure is caused by logarithmic data of farm household livelihood assets. The purpose of taking logarithms is to make the normal relationship between the distribution of farm household livelihood assets data more apparent, as well as to reduce the absolute value of the data, and does not affect the scientific validity of the final conclusions. The linear regression analysis of livelihood assets and well-being levels passed the significance test at the 1% level, which further suggests that higher farm household livelihood assets are associated with higher levels of farm household well-being.
Because there is a significant correlation between the level of farm household well-being and livelihood assets, this work uses the value of farm household well-being in Zhangbei County as the dependent variable; the indicators of livelihood diversity and livelihood assets are the independent variables. Using SPSS 26, a multiple linear regression model was applied to analyze the impact of farm households’ livelihoods on farm households’ well-being under the effect of the grain for green policy, and to identify the factors influencing farm household well-being (Table 5).
3.3.1. Analysis of factors influencing farm household well-being for all farm households
The results show an adjusted R2 = 0.679, indicating that the model has a high degree of model fit. Eight variables had significant effects on the level of farm household well-being in terms of farm household livelihood diversity and livelihood assets. Household size, education attainment of household members, area of arable land, annual household expenditure, number of large production tools, livelihood diversity, household labor capacity, and total value of livestock were the key factors influencing farm household well-being in Zhangbei County. Because they all passed the significance test at the 1% or 5% level.
(1) Farm household livelihood diversity affects the level of farm household well-being
Table 5 shows that the coefficient of 0.107 for the effect of livelihood diversity on farm households’ well-being passed the significance test at the 1% level, indicating that the higher the diversity of farm households’ livelihoods, the higher the level of farm households’ well-being. The grain for green policy has led farm households to shift from farming to other livelihood activities, enriching their livelihood diversity, expanding their choice of livelihood strategies, and enhancing their defense and coping capacities against external risks, thus increasing their well-being.
(2) Human assets drive the level of well-being of farm households
Household size, education level of household members, and household labor capacity are important components of human assets, and their coefficients of influence on farm household well-being are 0.366, 0.323, and 0.166, respectively, with their influences on the well-being of farm households ranking first, second, and fourth, respectively. All three indicators pass the significance test at the 1% level, indicating that the higher the level of human assets, the higher the level of farm household well-being. The policy of returning farmland releases some human assets of farm households from farming to other livelihoods, optimizing the allocation of human assets. Human assets are the basis for the participation of farm household members in livelihood activities. Larger household sizes can contribute to increased cumulative production time, leading to higher productivity. Higher levels of education mean that farm household members can participate in a wider variety of occupations and buffer against external shocks. Higher levels of labor capacity mean that the farm household is more efficient in creating wealth. This suggests that human assets are a powerful driver of farm household well-being.
(3) Natural assets affect the level of farm household well-being
The coefficient of the effect of arable land area on the well-being of farm households is −0.208, which passed the significance test at the 1% level, indicating that arable land area was negatively correlated with the level of well-being of farm households. The higher the arable land area of farm households, the lower the level of well-being of farm households. The insufficient natural conditions in Zhangbei County result in poorer quality of cultivated land and lower yields. The larger the farming area, the more labor and effort farmers put in; the actual benefits gained are low relative to the inputs, reducing the level of well-being of farm households. Therefore, fallowing improves the well-being of farm households by reducing the quantity of poor quality farmland.
(4) Material assets affect the level of well-being of farm households
The coefficient of influence for the number of large production tools on the well-being of farm households is 0.086, which passed the significance test at the 1% level, indicating that the higher the number of large production tools, the higher the level of well-being of farm households. Most arable land retired by households is of inferior quality, such as sloping land, where the cultivation conditions are not conducive to the operation of large production tools. Retiring this type of farmland makes the use of large production tools much more efficient, which in turn increases the efficiency of the farm households’ use of farmland and provides the household with opportunities for other nonfarm part-time work, increasing household income. Farm households’ material assets thus contribute to their level of well-being in terms of production efficiency and livelihood types.
(5) Financial assets affect the level of well-being of farm households
The coefficient of the effect of annual household expenditure on the well-being of farm households is 0.157, which passed the significance test at the 1% level; the coefficient of the effect of the total value of livestock on the well-being of farm households is 0.064, which passed the significance test at the 5% level, indicating that the higher the financial assets, the higher the level of farm households; well-being. This is because gift expenditure and health expenditure account for a larger proportion of farm household expenditure in Zhangbei County, which affects the well-being of farm households. Zhangbei County is at the agro-pastoral ecotone, and rural livestock is more convenient and much more beneficial than farming for the same cost of investment. The shift in labor to livestock farming after farmland has been retired has increased the level of well-being of farm households by satisfying their dietary needs as well as reserving wealth.
3.3.2. Analysis of factors influencing farm household well-being for different types of farm households
The analysis of the impact of farm household livelihoods on the well-being of different types of farm households revealed that the factors influencing well-being differed between returned farmland households and nonreturned farmland households (Table 5). The results showed adjusted R2 values of 0.670 and 0.726, respectively. The goodness of fit of the two models reached 67.0% and 72.6%, respectively, indicating the good fit of the models. Household size, education attainment of household members, livelihood diversity, and area of arable land are common influencing factors for both returned farmland and nonreturned farmland households. Additionally, the level of well-being of returned farmland households is also influenced by annual household expenditure, household labor capacity, annual household income, and total value of livestock; that of nonreturned farmland households is also influenced by the number of large production tools.
Table 5 demonstrates that educational attainment of household members and household size remain the two most significant influencing factors for both returned farmland and nonreturned farmland households, and both pass the significance test at the 1% level. This indicates that human assets remain fundamental to the well-being of farm households. Similarly, area of arable land remains a significant influence on the well-being of both types of farm households and is negatively correlated with farm household well-being. The coefficient of impact of livelihood diversity on the well-being of returned farmland and nonreturned farmland households is 0.091 and 0.149, respectively, indicating that livelihood diversity has an impact on the well-being of different types of farm households, but more so on nonreturned farmland households. Nonreturned farmland households have lower livelihood diversity, and richer livelihood diversity has a more significant effect on their well-being.
Annual household expenditure, household labor capacity, annual household income, and total value of livestock are significant influencing factors on the level of well-being of returned farmland households, with impact coefficients of 0.222, 0.203, 0.081, and 0.076, respectively. Annual household expenditure and household labor capacity are influencing factors for returned farmland households because these households have a higher proportion of elderly and young children, a higher dependency ratio, and higher expenditure on health care, which have greater impacts on their level of well-being. Annual household income is an influencing factor for returned farmland households because the average total assets of such households are lower than those of nonreturned farmland households, and to make up for the lack of total livelihood assets, household income needs to be increased. The total value of livestock becomes an impact factor for returned farmland households because they need to engage in other livelihood activities to earn an income after they have fallen out of farming. As a typical agro-pastoral ecotone, Zhangbei County has a predominance of grassland, making it easier to raise livestock, and livestock farming has become the first choice for expanding household income.
The number of large production tools has a significant influence on the level of well-being of nonreturned farmland households, with an influence coefficient of 0.116, which passed the significance test at the 5% level. However, the number of large production tools is not an influential factor in the well-being of returned farmland households. This is because large production tools can be used by multiple farm households and the demand for large production tools decreases after grain for green policy implementation.
4. Discussion
4.1. Geographical differences and similarities of farm household livelihoods
The level of livelihood assets of farm households in the mountainous areas of northern Hebei is low, because of the geographic limitations of such areas. However, the structural weight of livelihood assets in this study differs from other related studies. The high level of natural assets and lower level of human assets of farm households in this study differs from the high level of human assets of farm households in alpine ecologically fragile areas [32]. This may be related to geographical differences. The alpine ecological environment results in less available arable land, extremely low crop yields, and low livestock carrying capacity, which in turn lead to relatively low natural assets of farm households and highlights the structural weight of human assets. This conjecture can be confirmed by the finding that Rural reservoir migrants have the highest share of human assets and the second highest share of financial assets in their livelihood assets [33]. The loss of arable land by rural reservoir migrants due to reservoir construction leads to an extremely low level of natural assets and increases the proportion of human assets; the large government compensation for migrant relocation raises the proportion of financial assets. Thus, farm households’ livelihood assets are related to the geographical environment and policy conditions of their regions, with significant geographical differences.
The comparison of total livelihood assets of returned farmland and nonreturned farmland households revealed that the implementation of the grain for green policy in the mountainous region of northern Hebei did not improve the livelihood assets of farm households. This is completely opposite to the impact on the livelihood assets of farm households in the Qinba Mountain area of Gansu after the grain for green policy implementation [34]. The Qinba region experienced the vigorous development of an ecological and economic forest and improved infrastructure, which improved the livelihood assets of farm households. In addition, the climatic conditions in the Qinba Mountains are more advantageous for forestry development than those in northern Hebei. The improvements of farm households’ livelihood assets in the Qinba region after the grain for green policy implementation are the result of a combination of human and natural factors. This result provides guidance for improving farm households’ livelihood assets after grain for green policy implementation in our study area. The grain for green policy requires additional supporting and guaranteeing policies to improve the livelihood assets of farm households.
The livelihood diversity of returned farmland households was higher than that of nonreturned farmland households, but the difference was not significant. This finding is consistent with those of other related studies [34,35]. This suggests that the grain for green policy has a positive impact on the livelihood strategies of farm households in different regions. Reforestation and grass restoration affects human assets by acting on natural assets, causing a portion of labor to be released from agricultural production. Theoretically, this labor force should have gone in other directions, and the livelihood diversity of farm households would subsequently increase, but the facts were not exactly as expected. The quality of the labor force is limited by education level, skills, the insufficient number of channels to work outside, and insufficient social contacts. Therefore, the government should increase cooperation with enterprises, build information exchange and promotion platforms, broaden farmers’ access to outside information, encourage laborers to work seasonally, and guide farmers to nonfarm employment to solve the employment problem.
4.2. Grain for green policy impacts on farm households’ well-being
Human well-being is a comprehensive, multidimensional, and strongly subjective concept and is closely related to human living conditions and perceptions [36]. The mountainous areas of northern Hebei have harsh natural conditions and low levels of economic development. Farm households living under such economic conditions have different perceptions of the benefits arising from the implementation of the grain for green policy. Related studies show that the subjective well-being of farm households in poor mountainous areas is most influenced by the wealth factor, and that well-being enhancement depends on economic development [37,38]. The high contribution of wealth level to the well-being of farm households in the study area indicates that such households perceive the economic benefits of the grain for green policy most strongly. The economic benefits of the grain for green policy act on farm households’ well-being in three main ways. First, grain for green policy improves the well-being of farm households through the reallocation of human assets. The retirement of farm households releases some of the labor force to engage in other more rewarding and less laborious livelihood activities. Second, the grain for green policy improves the well-being of farm households through the optimisation of natural assets. Farm households choose to return low-quality, sloping land, increasing their income and reducing their labor burden; the remaining higher-quality, irrigated land is conducive to more efficient use of large production tools, further increasing yields, household income, and the well-being of the farm households. Third, the grain for green policy improves the well-being of farm households by enhancing their financial assets. Farm households who have returned farmland take advantage of livestock farming in the local agricultural-pastoral staggered zone, which can increase income and reserve wealth.
The primary objective of the grain for green policy is to enhance regional ecological quality. The policy has changed land-use types from cropland to woodland and grassland, driving changes in the ecosystem service provisioning capacity [39]. The ecological benefits of the policy are reflected in the enhancement of ecosystem regulation and support services in the region [40], which are consistent with the results of our survey. The Yanhe River Basin is also at the agro-pastoral ecotone, and a study of the perceived well-being of rural and urban residents in this region [41] found that rural residents were more satisfied with safety and health aspects such as water quality, air quality, and water safety, and urban residents were more satisfied with basic materials such as income levels and transport conditions. This suggests that rural inhabitants in the agro-pastoral ecotone have weaker perceptions of the regulating and supporting services of the ecosystem. This is an important reason for the low contribution of ecosystem quality to the well-being of farming households in the study area. Ecological improvements resulting from the grain for green policy are not the main path to improved well-being of farm households. Therefore, the government should conduct various forms of publicity about the grain for green policy, to enhance farmers’ recognition of the policy and their ecological perceptions.
The mechanisms and pathways by which the implementation of ecological projects affect the well-being of farming households vary across regions. The grain for green policy changes the ecosystem service functions, which in turn can affect the well-being of farm households. Therefore, the impact of ecological projects on the well-being of farm households has been described in terms of changes in ecosystem service functions [42]. Due to farm households’ weak perceptions of the regulating and supporting functions of ecosystem services, the above research approach cannot well explain the mechanism of ecological projects effects on farm households’ well-being from the perspectives of economic behavior and government security. Therefore, it is necessary to introduce livelihood characteristics into the study of such effects [43].
4.3. Limitations
This work uses multiple linear regression to study the factors influencing the well-being of farm households. This statistical model has been widely used in many fields and can effectively analyze combinations of factors, but it cannot analyze the interactions between the influencing factors. There is a certain spatial coupling relationship between farm household livelihood characteristics and well-being levels, which cannot be measured by multiple linear regression.
Due to the unavailability of data related to farm households before the grain for green policy implementation in Zhangbei County, this work can only illustrate the current situation of farm households’ well-being and cannot compare farm households’ livelihoods and well-being levels before and after policy implementation. Therefore, a comparison of livelihoods and well-being differences between returning farmland and nonreturning farmland households illustrates part of the impact of the policy on farm households’ well-being.
In the process of measuring farm households’ livelihood assets, some indicators are not included because they are difficult to quantify. For example, farm households’ ecological livelihood assets cannot be effectively quantified and are not included in natural assets, which may affect the results of farm households’ livelihood assets.
5. Conclusions
This study systematically analyzes the impact of the grain for green policy on the well-being of farm households in Zhangbei County, Hebei Province, China. The Sustainable Livelihoods Framework, the conceptual framework of human well-being, and the entropy method are combined to measure the livelihood assets of farm households and the level of farm household well-being, respectively. The factors influencing the well-being of farm households were analyzed through a multiple linear regression model. The following three findings were obtained:
(1) The average level of livelihood assets of farm households in Zhangbei County is natural assets > social assets > financial assets > human assets > material assets. The comparison between returned farmland households and nonreturned farmland households shows that the livelihood diversity of returned farmland households is higher than that of nonreturned farmland households, but the total livelihood assets are lower than those of nonreturned farmland households.
(2) The well-being level of all farm households in Zhangbei County is 0.5169, with an overall low level of well-being. The well-being level of returned farmland households is slightly higher than that of nonreturned farmland households. Wealth level accounts for the largest share of the well-being structure of farm households, and the contribution of ecological quality is the smallest.
(3) The degree of influence of the factors affecting the level of well-being of farm households in Zhangbei County varies significantly. Household size, area of arable land, and educational attainment of household members have the strongest influences on the well-being of farm households; household labor capacity, annual household expenditure, livelihood diversity, the number of large production tools, and total value of livestock also play important roles in driving farm household well-being. The area of arable land is negatively related to farm household well-being. There are differences in the factors influencing the level of well-being of different types of farming households.
Author Contributions
Conceptualization, K.W. and P.S.; methodology, K.W.; software, X.W.; validation, P.S., J.M. and N.L.; formal analysis, K.W., P.S. and J.Z.; investigation, K.W., P.S., X.W., J.M., N.L. and J.Z.; writing—original draft preparation, K.W. and J.M.; writing—review and editing, K.W. and P.S.; supervision, P.S. All authors have read and agreed to the published version of the manuscript.
Funding
This research was funded by National Natural Science Foundation of China (No. 42101258) and Natural Science Foundation of Shandong (No. ZR2019QD006).
Institutional Review Board Statement
Not applicable.
Informed Consent Statement
Not applicable.
Data Availability Statement
The datasets used in this article can be obtained by readers after the article is published online.
Conflicts of Interest
The authors declare no conflict of interest.
References
- Shao, Q.Q.; Liu, S.C.; Ning, J.; Liu, G.B.; Yang, F.; Zhang, X.Y.; Niu, L.N.; Huang, H.B.; Fan, J.W.; Liu, J.Y. Assessment of ecological benefits of key national ecological projects in China in 2000-2019 using remote sensing. Sci. Geogr. Sin. 2022, 77, 2133–2153. [Google Scholar]
- Li, W.Q.; Zhao, X.Y.; Du, Y.X.; Ma, P.Y. Spatio-temporal changes of the coupling relationship between ecosystem services and residents’ well-being in Qinba Mountains Area. J. Nat. Resour. 2021, 36, 2522–2540. [Google Scholar] [CrossRef]
- Fu, B.; Wang, Y.K.; Xu, P.; Yan, K. A Review of Coupled Relationship of Rural Livelihoods and Ecosystem Services. Ecol. Econ. 2017, 33, 142–145+151. [Google Scholar]
- Guan, D.J.; Sun, L.L.; Zhou, L.L. Construction and Application of Coupling Model of Ecosystem Service and Farmers’ Livelihood in Three Gorges Reservoir Area. Res. Soil Water Conserv. 2020, 27, 269–277. [Google Scholar] [CrossRef]
- Wang, F.C.; Zheng, H.; Zhang, W.; Wang, H.; Peng, W.J. Regional differences and the driving mechanism of relationships between rural household livelihood and ecosystem services: A case study in upstream watershed of Miyun Reservoir, China. Chin. J. Appl. Ecol. 2021, 32, 3872–3882. [Google Scholar] [CrossRef]
- Qiao, X.N.; Zhang, T.; Yang, Y.J.; Niu, H.P.; Yang, D.G. Spatial flow of ecosystem services and impacts on human well-being in the Weigan River Basin. Resour. Sci. 2017, 39, 533–544. [Google Scholar]
- Zhang, J.F.; Deng, W.; Zhu, C.L.; Zhao, Y.L. Spatial Relationship and Its Dynamic Features of Ecosystem Services and Human Wellbeing in the Upper Reaches of Minjiang River. J. Mount. Sci. 2017, 35, 388–398. [Google Scholar] [CrossRef]
- Huo, R.; Xu, X.Y.; Gao, J.L.; Zhu, T.T.; Lu, B. Ecosystem Services’ Spatial Characteristics Patterns of Ecosystem Services and Their Relationships With Residents’ Well-being of Coal Resource-based Cities. Chin. J. Soil Sci. 2020, 51, 31–39. [Google Scholar] [CrossRef]
- Yang, X.T.; Qiu, X.T.; Xu, Y.; Zhu, F.B.; Liu, Y.W. Spatial heterogeneity and dynamic features of the ecosystem services influence on human wellbeing in the West Sichuan Mountain Areas. Acta Ecol. Sin. 2021, 41, 7555–7567. [Google Scholar]
- Yuan, D.B.; Chen, M.Q.; Liao, C.R.; Xie, X.X.; Liao, X.B.; Yao, D.L. Analysis of Subjective Well-being of Farmers with Land Transfer and Its Influencing Factors: From the Perspective of Livelihood Capitals. Chin. Land Sci. 2019, 33, 25–33. [Google Scholar]
- Costanza, R.; d’Arge, R.; De Groot, R.; Farber, S.; Grasso, M.; Hannon, B.; Limburg, K.; Naeem, S.; O’Neill, R.V.; Paruelo, J.; Raskin, R.G.; Sutton, P.; Van Den Belt, M. The value of the world’s ecosystem services and natural capital. Nature. 1997, 387, 253–260. [Google Scholar] [CrossRef]
- Zhong, C.; Bei, Y.; Gu, H.; Zhang, P. Spatiotemporal Evolution of Ecosystem Services in the Wanhe Watershed Based on Cellular Automata (CA)-Markov and InVEST Models. Sustainability. 2022, 14, 13302. [Google Scholar] [CrossRef]
- Otoiu, A.; Titan, E.; Dumitrescu, R. Are the variables used in building composite indicators of well-being relevant? Validating composite indexes of well-being. Ecol. Indic. 2014, 46, 575–585. [Google Scholar] [CrossRef]
- Aguado, M.; González, J.A.; López-Santiago, C.; Montes, C. Exploring subjective well-being and ecosystem services perception along a rural–urban gradient in the high Andes of Ecuador. Ecosyst. Serv. 2018, 34, 1–10. [Google Scholar] [CrossRef]
- Wang, S.Y.; Luo, Y.T.; Han, Y.J.; Li, J. Regional difference and determinants of human well-being in China: Based on the analysis of human development index. Prog. Geogr. 2018, 37, 1150–1158. [Google Scholar]
- Ciftcioglu, G.C.; Ebedi, S.; Abak, K. Evaluation of the relationship between ornamental plants–based ecosystem services and human wellbeing: A case study from Lefke Region of North Cyprus. Ecol. Indic. 2019, 102, 278–288. [Google Scholar] [CrossRef]
- Liu, D.; Chen, H.; Zhang, H.; Shi, Q.Q.; Geng, T.W. The impact of ecosystem services on human well-being and its group differences in the loess hilly and gully region. Geogr Res. 2022, 41, 1298–1310. [Google Scholar]
- Jones, S.K.; Boundaogo, M.; DeClerck, F.A.; Estrada-Carmona, N.; Mirumachi, N.; Mulligan, M. Insights into the importance of ecosystem services to human well-being in reservoir landscapes. Ecosyst. Serv. 2019, 39, 100987. [Google Scholar] [CrossRef]
- Zheng, D.F.; Wang, Y.Y.; Cao, Y.Q.; Wang, Y.H.; Hao, S.; Lv, L.T. Classification and spatiotemporal patterns of ecological well-being based on ecosystem services: Taking China’s prefecture-level and above cities for example. Resour. Sci. 2020, 42, 1110–1122. [Google Scholar] [CrossRef]
- Li, H.M.; Zhang, X.; Zhang, J.F.; Zhang, A.L.; Yang, H.Z. Herdsman’s multidimensional well-being in response of natural resources protection in the source region of the Yellow River, China: Case study based on household investigation in Maduo County. Acta Ecol. Sin. 2014, 34, 6767–6777. [Google Scholar]
- Yuan, W.T.; Qiao, D.; Ke, S.F.; Hou, Q.; Yan, R.H. How to Improve Ecological Compensation Mechanism from the Perspective of Resource Opportunity Cost? A Case Study Based on “Welfare Upside Down” of Forest Resources Compensation in State-owned Forest Area. Chin. Rural Surv. 2022, 2022, 59–78. [Google Scholar]
- Li, N.J.; Cao, G.Y.; He, B.H.; Luo, G.L. On the Relationship Between the Change in Farmer Wellbeing and Ecosystem Services—A Case Study of Wuling-Qinba Contiguous Destitute Areas in Chongqing. J. Southwest Univ. (Nat. Sci. Ed.). 2017, 39, 136–142. [Google Scholar] [CrossRef]
- Xiong, Y.; Hou, K.L.; Zheng, S.R.; Zhang, K.; Yang, T.H.; Zhao, D.D.; Sun, B.; Chen, L. Relationship between Farmer’s Well-Being and Ecosystem Services in Hilly and Mountainous Areas of South China Based on Structural Equation Model: A Case Study of Lechang in Guangdong Province. Trop. Geogr. 2020, 40, 843–855. [Google Scholar] [CrossRef]
- Ding, Y.H.; Yao, S.B. A comparative analysis of the impacts of the sloping land conversion program on the well-being of households in the Yellow and Yangtze river basins. J. Arid Land Resour. Environ. 2017, 31, 45–50. [Google Scholar] [CrossRef]
- Guo, L.P.; He, M.Y.; Chen, S.Y. The impact of farmers’ livehood capital on the adoption of different preference technologies——An analysis based on the sustainable livelihood framework. Chin. J. Agriculture. Resour Region. Plan. 2022, 43, 197–205. [Google Scholar]
- Liu, G.G.; Ge, Y.X.; Li, Y.; Zhang, H.N. Impact of ecological compensation on sustainable livelihood capacity of farmers in water source area——Based on the improved DFID livelihood analysis framework. Chin. J. Agriculture. Resour Region. Plan. 2022, 43, 97–109. [Google Scholar]
- Liu, W.; Yu, Q.Q. Impact of Poverty Alleviation Resettlement on Rural Household Livelihood Resilience in Southern Shaanxi. Geogr. Geo-Info. Sci. 2023, 39, 105–110. [Google Scholar]
- Xu, H.S.; Le, Z. Livelihood capital, livelihood risk and farmers’ livelihood strategy. Issue. Agriculture. Econ. 2012, 33, 100–105. [Google Scholar] [CrossRef]
- Wu, Y. Poor Mountain Farmers Livelihood Capital Impact on Livelihoods Strategy Research: Based on the Survey Data Pingwu and Nanjiang County of Sichuan Province. Issue. Agriculture. Econ. 2016, 37, 88–94. [Google Scholar] [CrossRef]
- Yu, Z.L.; Yang, X.J.; Yang, T. Exploring conditions, determinants and mechanisms of rural households’ adaptability to tourism development: A case study of Jinsixia in Qinling Mountains. Sci. Geogr. Sin. 2013, 68, 1143–1156. [Google Scholar]
- Deng, Q.J.; Li, W.; Zhu, Q.J.; Ma, X.M.; He, J.; Ma, X.J.; Luo, X. An analysis of the characteristics of water storage structure and the practice of groundwater exploration in the basalt area of Zhangbei County, Bashang, Hebei Province. Geol. Bul. Chin. 2020, 39, 1899–1907. [Google Scholar]
- Guo, X.L.; Li, W.P.; Sun, G.J.; Zhang, L.P. Analysis of Livelihood Capital and Its Coupling Coordination Degree of Farmers in Ecologically Vulnerable Alpine Areas —A Case of Xiahe County in Gannan Tibetan Autonomous Prefecture. Res. Soil Water Conserv. 2022, 29, 330–335. [Google Scholar] [CrossRef]
- Wu, J.; Chen, S.; Zhou, K.; Chen, X. Influence of Livelihood Capital of Rural Reservoir Resettled Households on the Choice of Livelihood Strategies in China. Water. 2022, 14, 4055. [Google Scholar] [CrossRef]
- Sun, Y.G.; Wang, C.S. Project of Conversion of Cropland to Forest (Grass) Effect on Farmers’ Livelihood: A Case Study of Qinba Mountain Area in Gansu Province. Issue. Forest. Econ. 2017, 37, 54–58. [Google Scholar] [CrossRef]
- Wei, H.L.; Bai, X. The Performance and Mechanism of the Impact of the Sloping Land Conversion Program on Households’ Livelihood Strategies. Ecol. Econ. 2019, 35, 121–127. [Google Scholar]
- Liu, D.Q.; Zhang, J.X.; Gong, J.; Qian, C.Y. Spatial and Temporal Relations among Land-Use Intensity, Ecosystem Services and Human Well-Being in the Longzhong Loess Hilly Region: A Case Study of the Anding District, Gansu Province. Acta Ecol. Sin. 2019, 39, 637–648. [Google Scholar]
- Shen, J.Y.; Han, X.; Hou, Y.L.; Wen, Y.L. Subjective Well-Being of Households in Rural Poverty Regions in Xiangxi, Hunan Province. Ecol. Econ. 2014, 36, 2174–2182. [Google Scholar]
- Li, K.M.; Yao, L.L.; Shi, Y.; Zhang, D.; Lin, Y.M. Estimate Well-Being of Urban and Rural Residents in the Yellow River Basin and Its Spatial-Temporal Evolution. Ecol. Econ. 2022, 38, 222–229. [Google Scholar]
- MA(Millennium Ecosystem Assessment). Ecosystems and human well-being; Island Press: Washington, DC, USA, 2005. [Google Scholar]
- Fu, B.J.; Zhang, L.W. Land-use change and ecosystem services: Concepts, methods and progress. Prog. Geogr. 2014, 33, 441–446. [Google Scholar]
- Yang, S.Q.; Zhao, W.W.; Pereira, P.; Liu, Y.X. Socio-cultural valuation of rural and urban perception on ecosystem services and human well-being in Yanhe watershed of China. J. Environ. 2019, 251, 109615. [Google Scholar] [CrossRef]
- Liu, X.L.; Zhang, B.; Zheng, Q.R.; He, X.Q.; Zhang, T.F.; Jia, Y.Q.; Luo, Z.M. Impacts of Converting Farmland into Forests on Farmer Well-Being in the Earth-Rock Mountain Areas of the Loess Plateau. Resour. Sci. 2014, 36, 397–405. [Google Scholar]
- Wu, Z.L.; Cao, H.; Jin, M. Influence Mechanism of Wetland Conservation on the Livelihood Outcomes of Farmers’: An Empirical Study Based on the Survey of Rural Households in Natural Reserves. J. Ecol. Rural Environ. 2022. [Google Scholar] [CrossRef]
Figure 1.
Location of the study area.
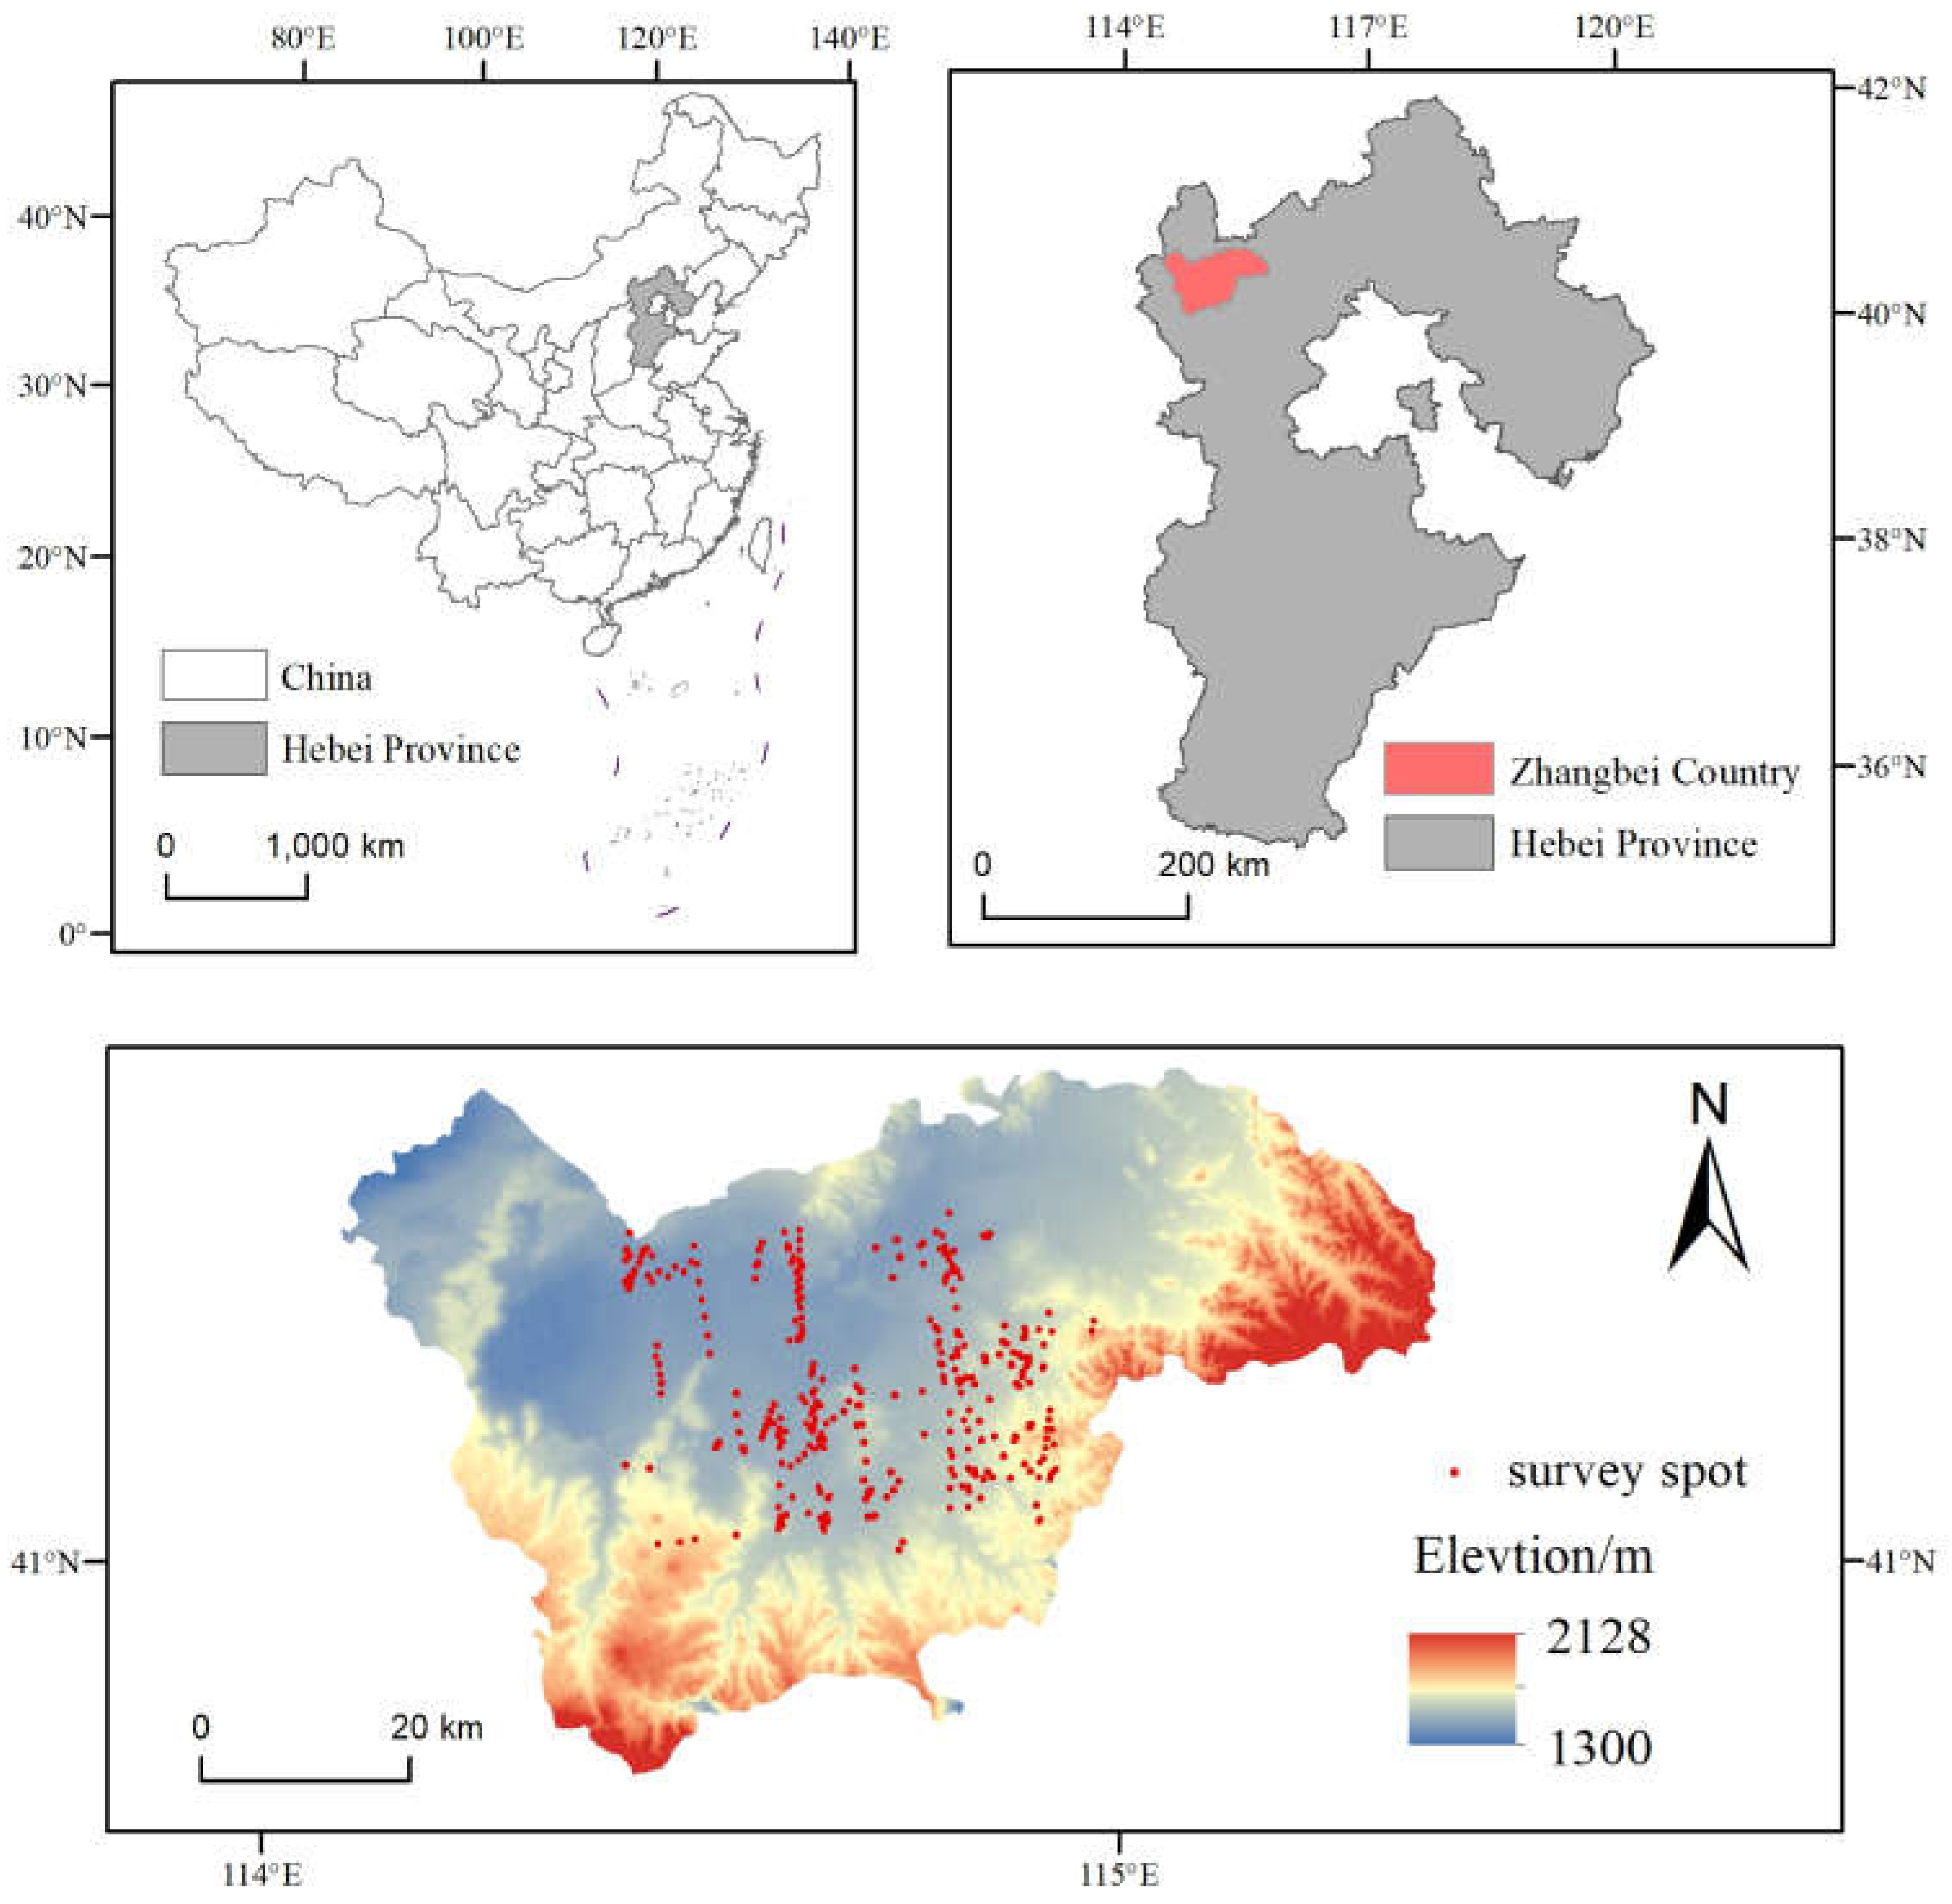
Figure 2.
Average livelihood diversity of different types of farm households.
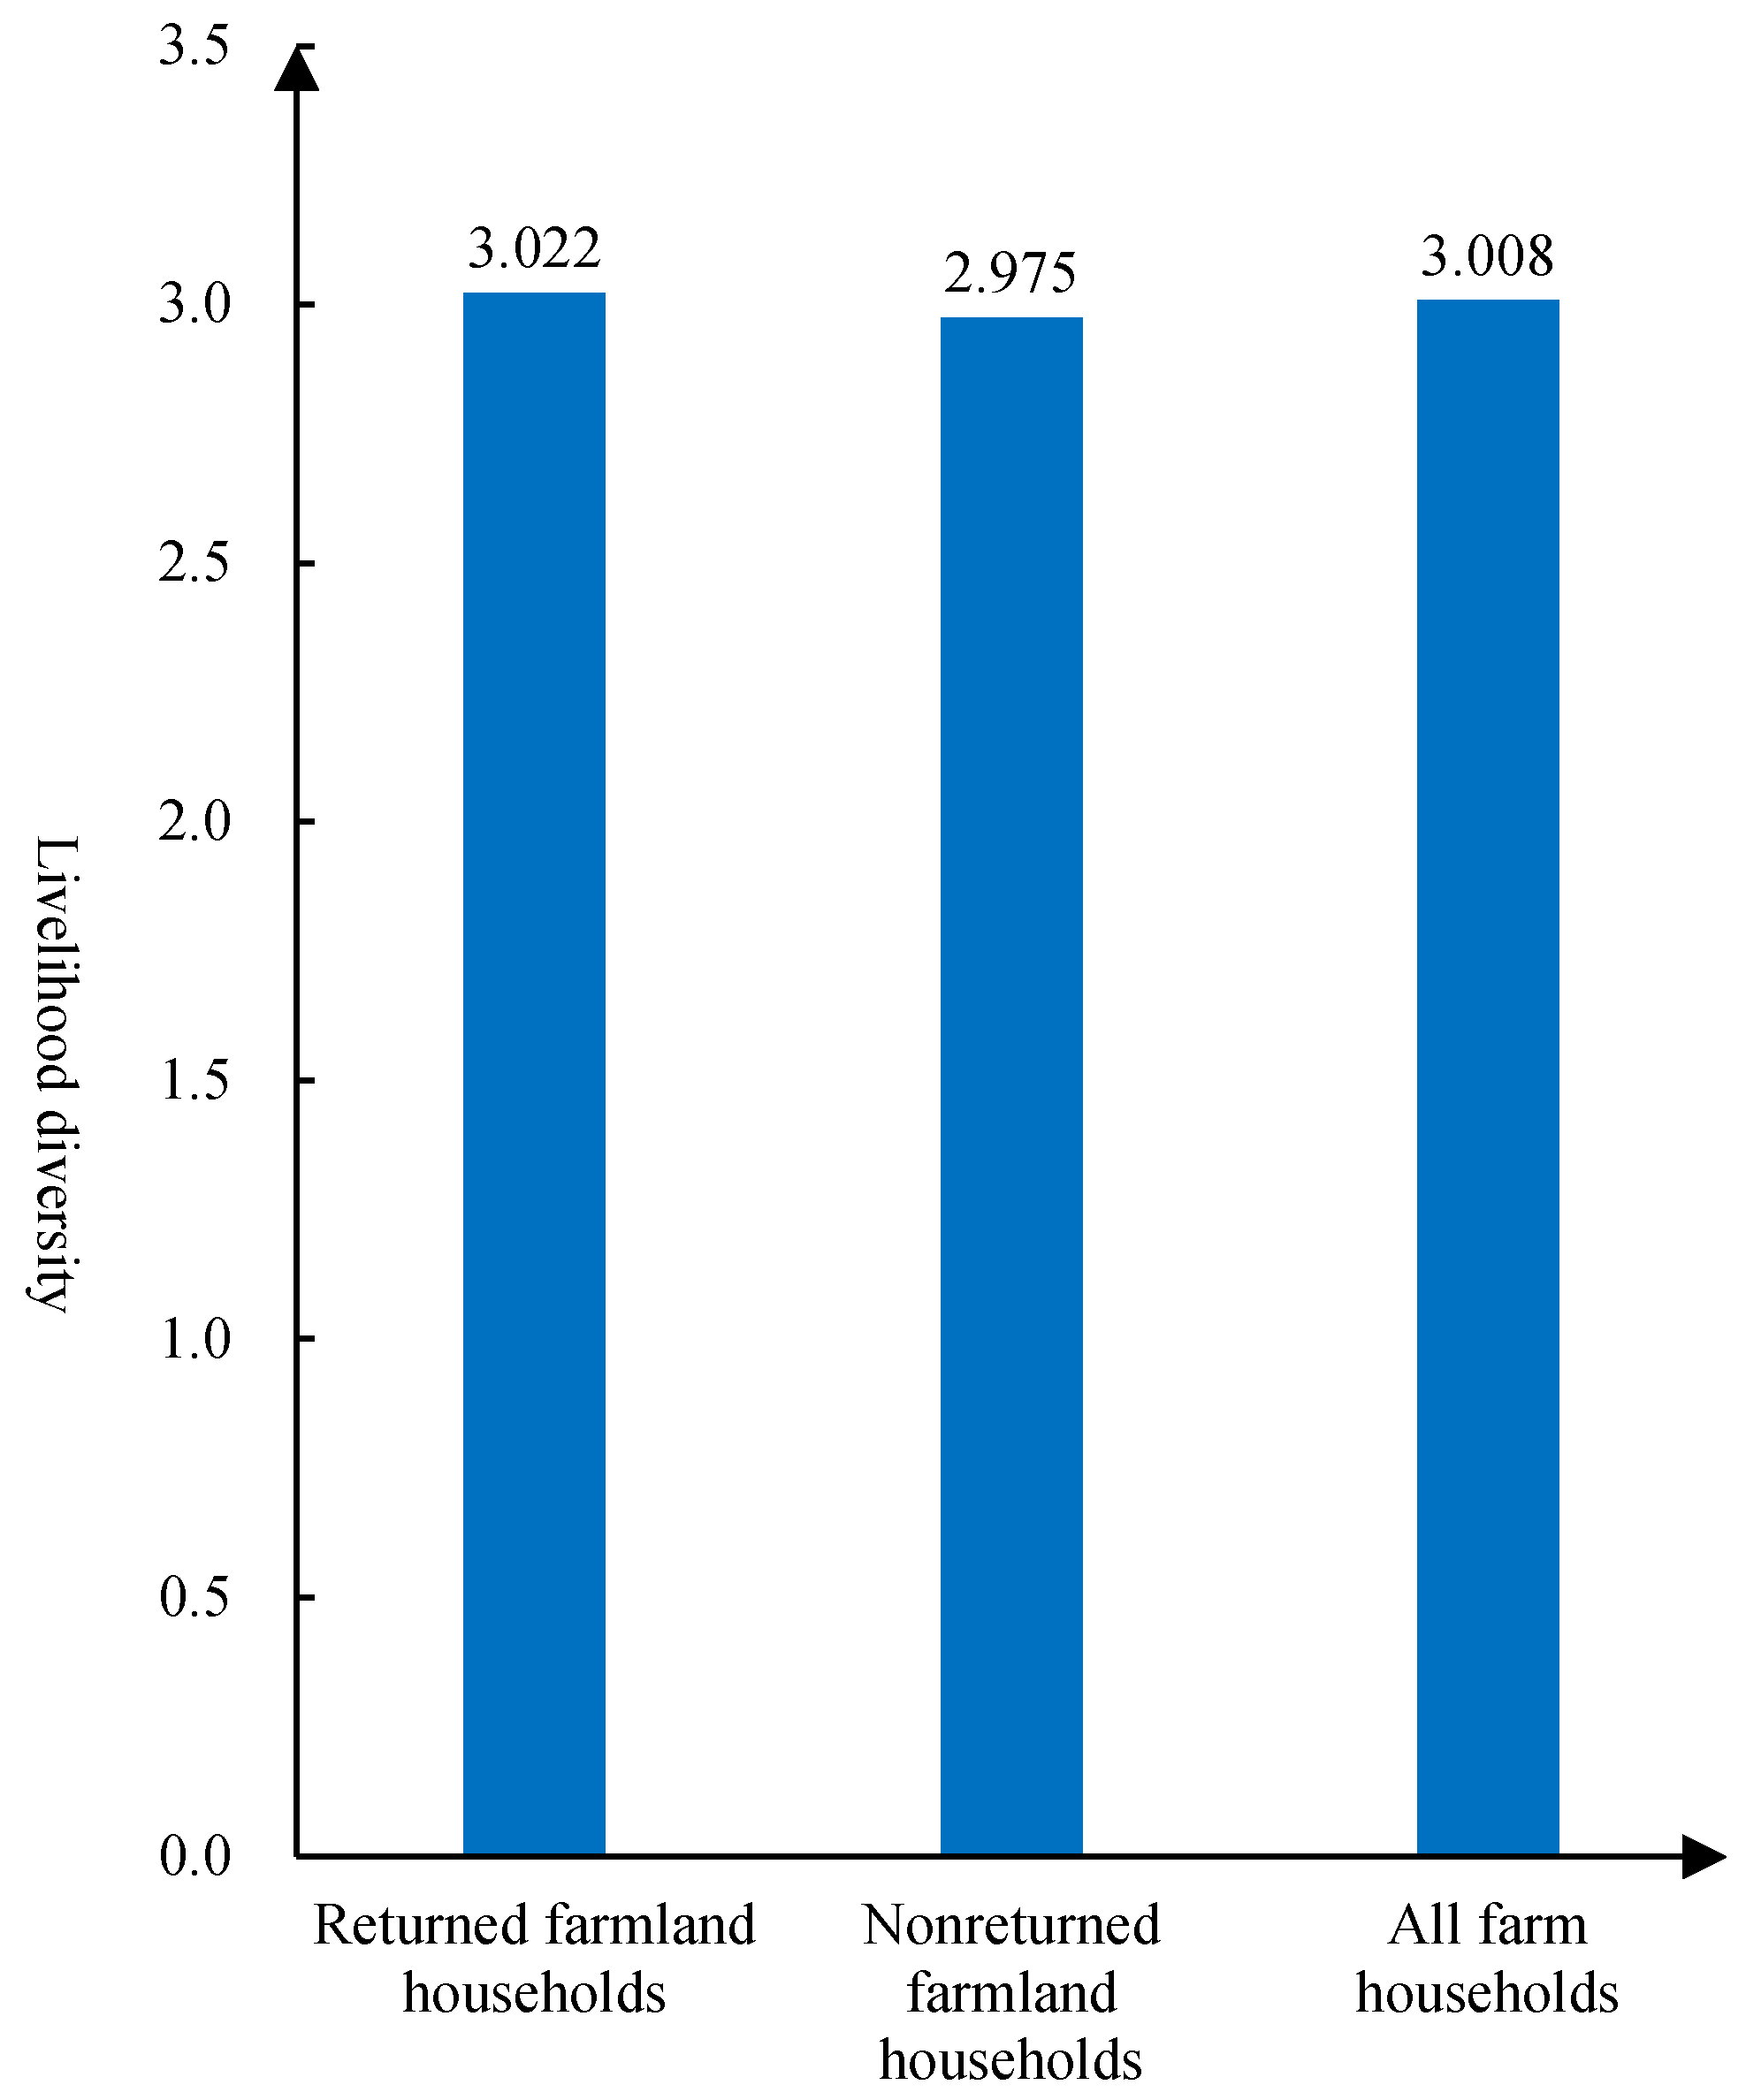
Figure 3.
Farm households’ livelihood assets.
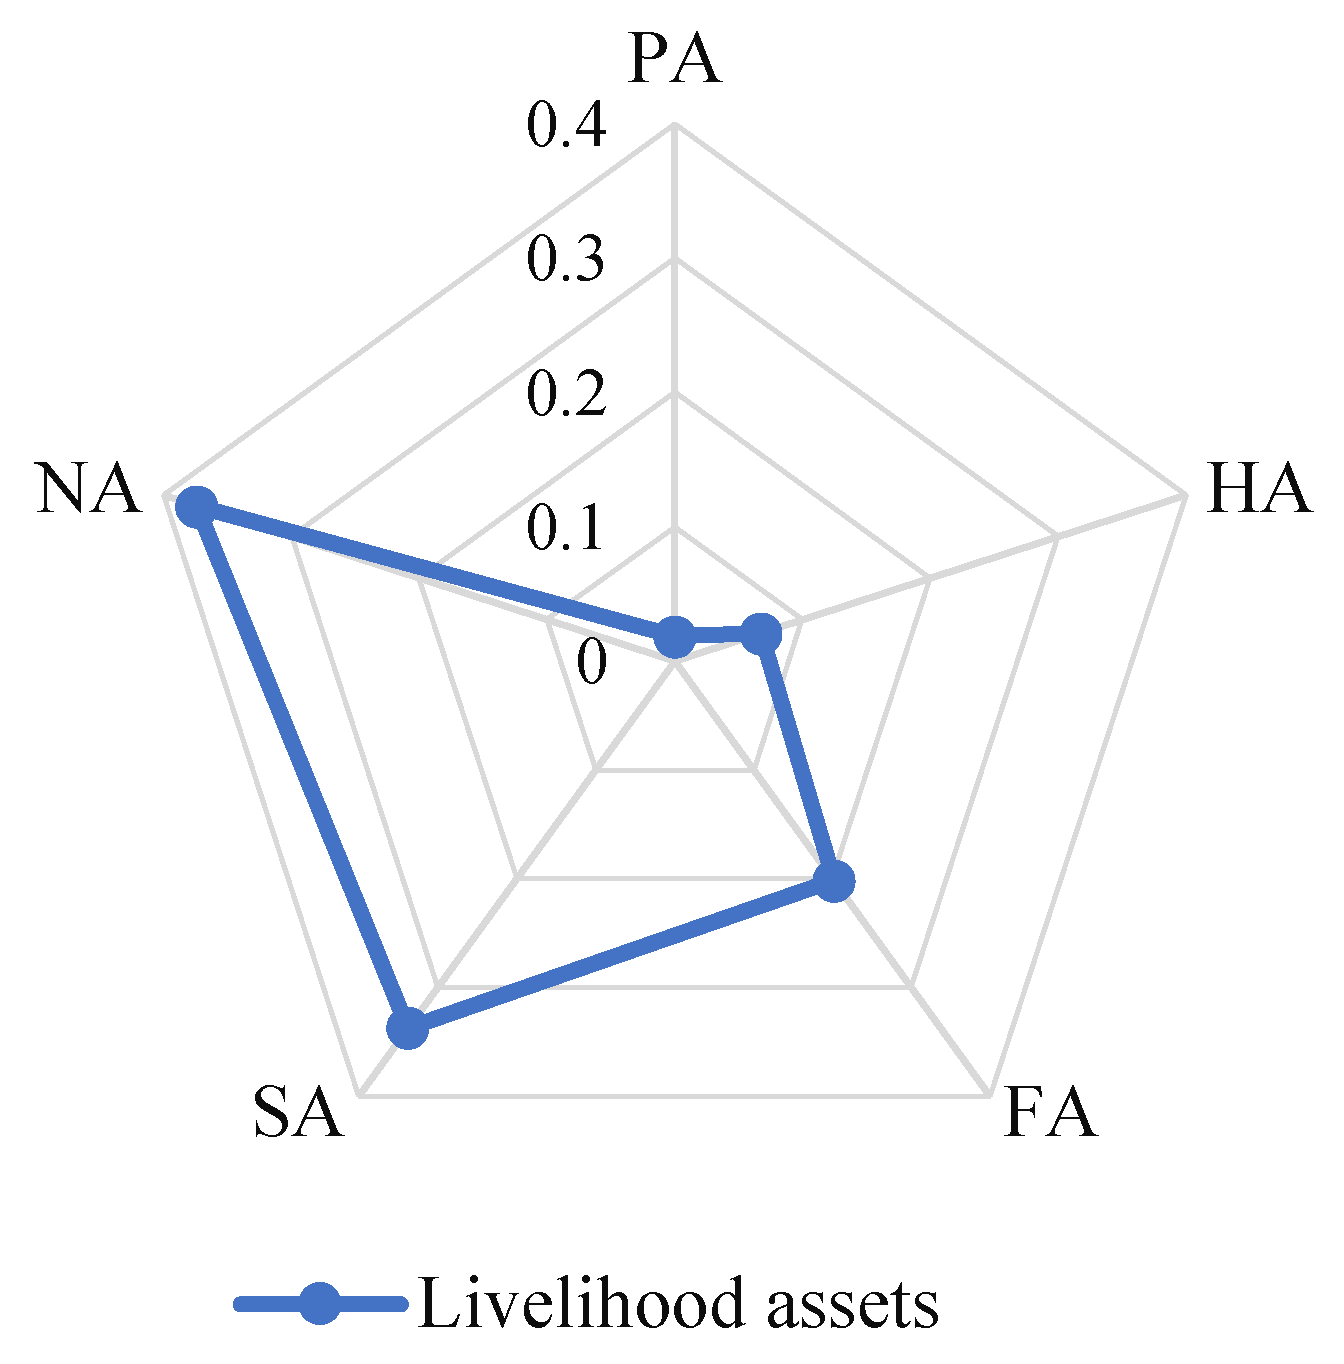
Figure 4.
Contribution of farm households’ livelihood assets.
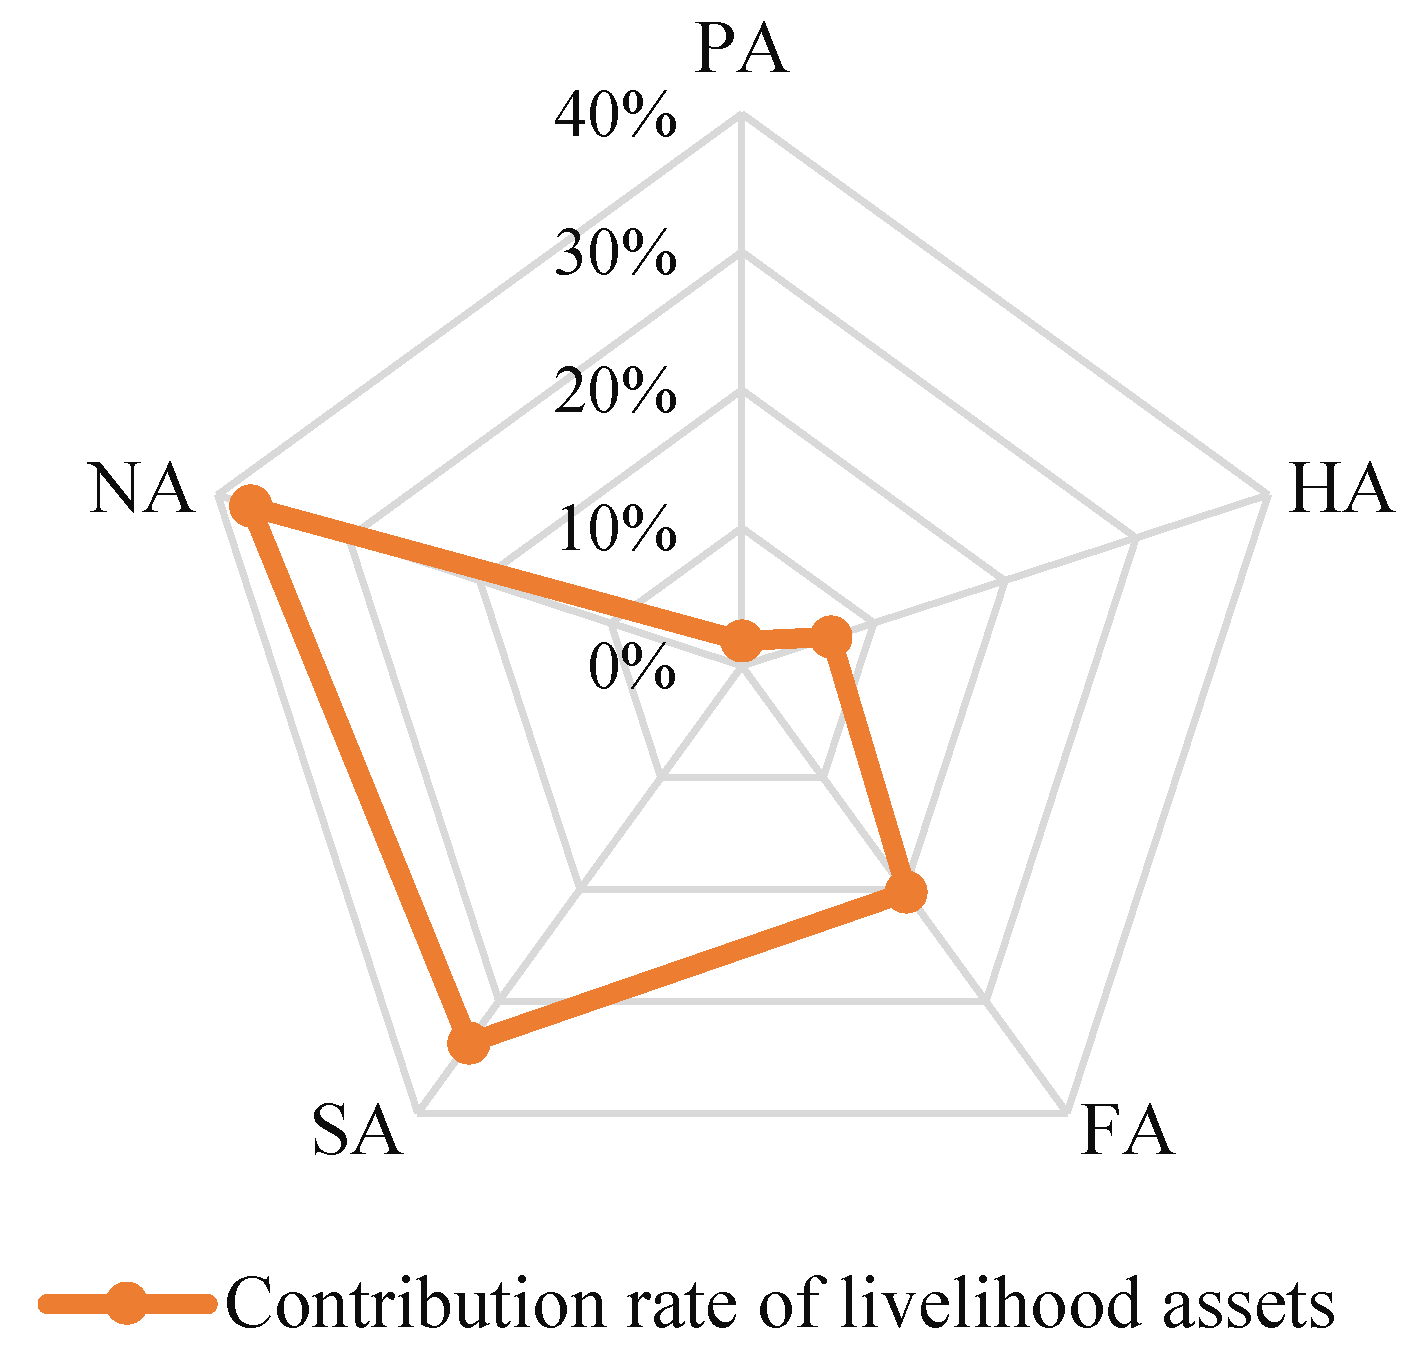
Figure 5.
Contribution rates to well-being of farm households.
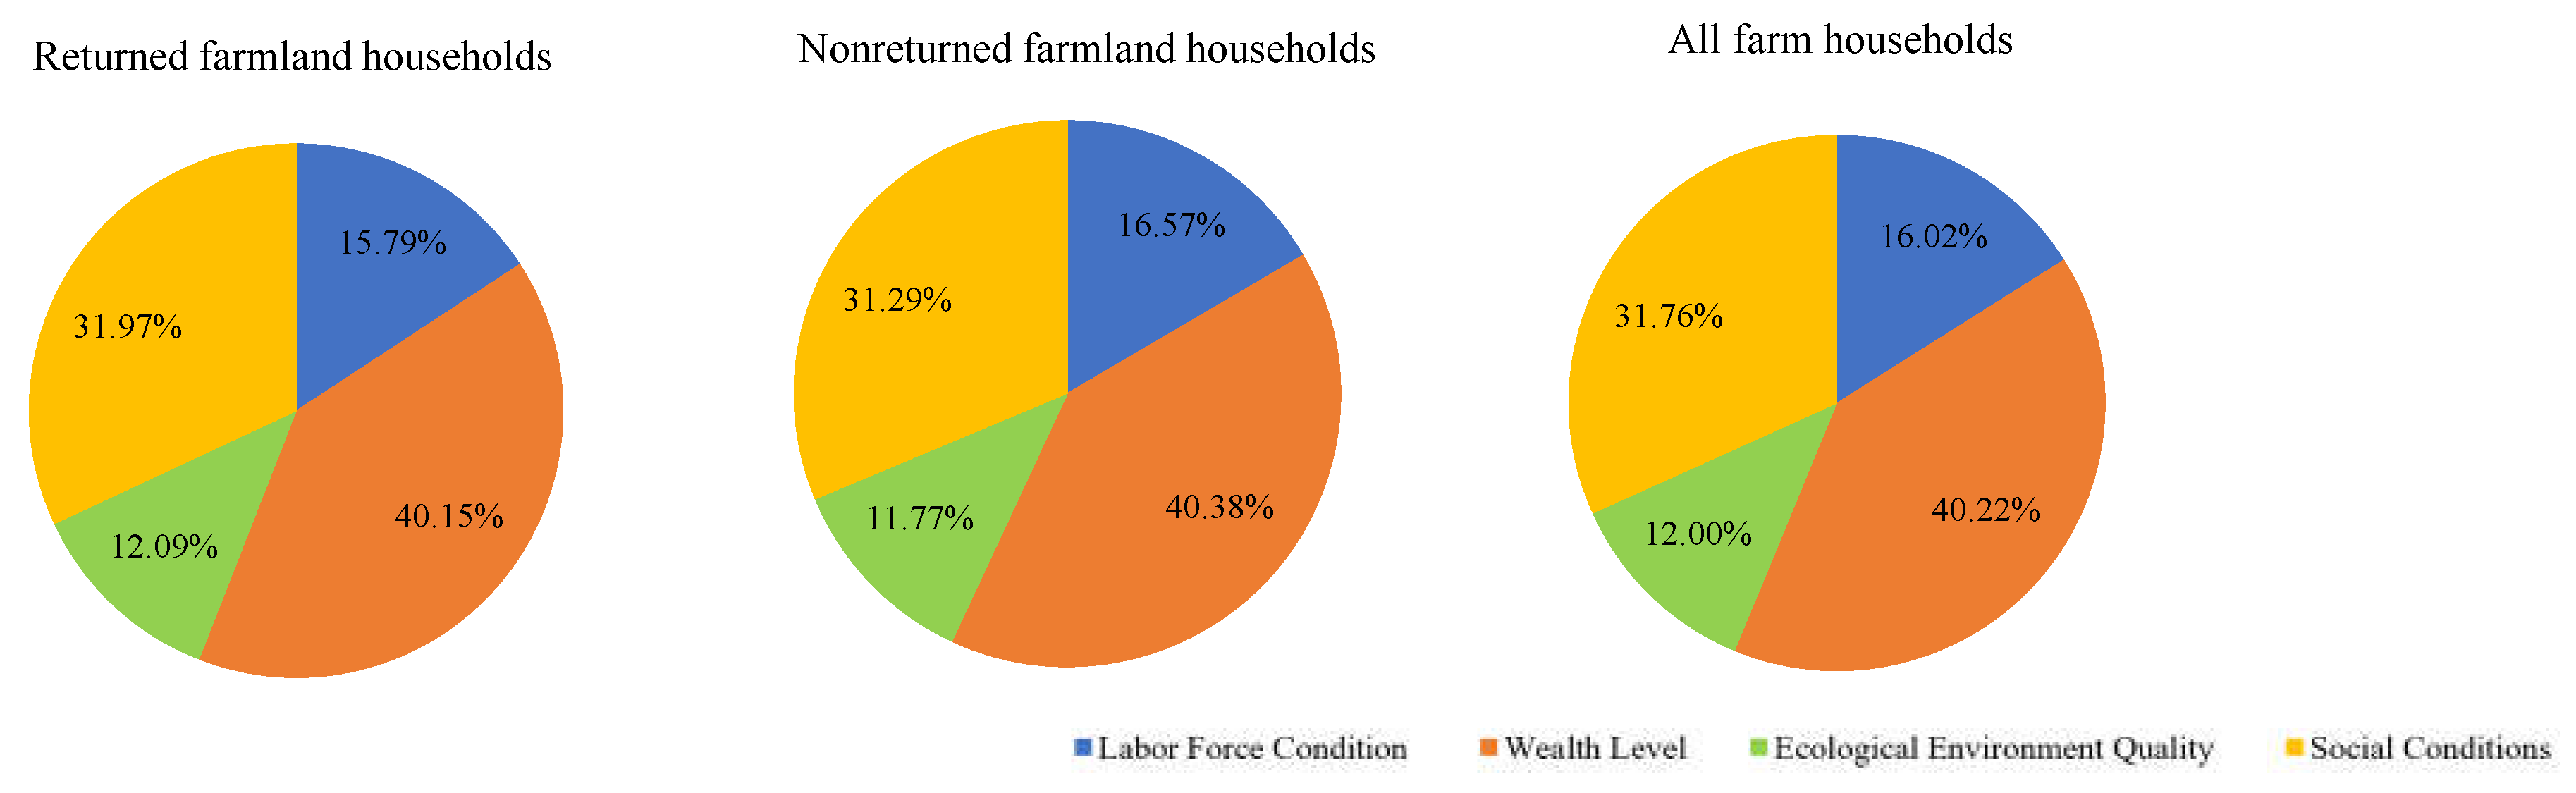
Figure 6.
Scatter plot of correlation between livelihood assets and well-being levels of farm households.
Figure 6.
Scatter plot of correlation between livelihood assets and well-being levels of farm households.
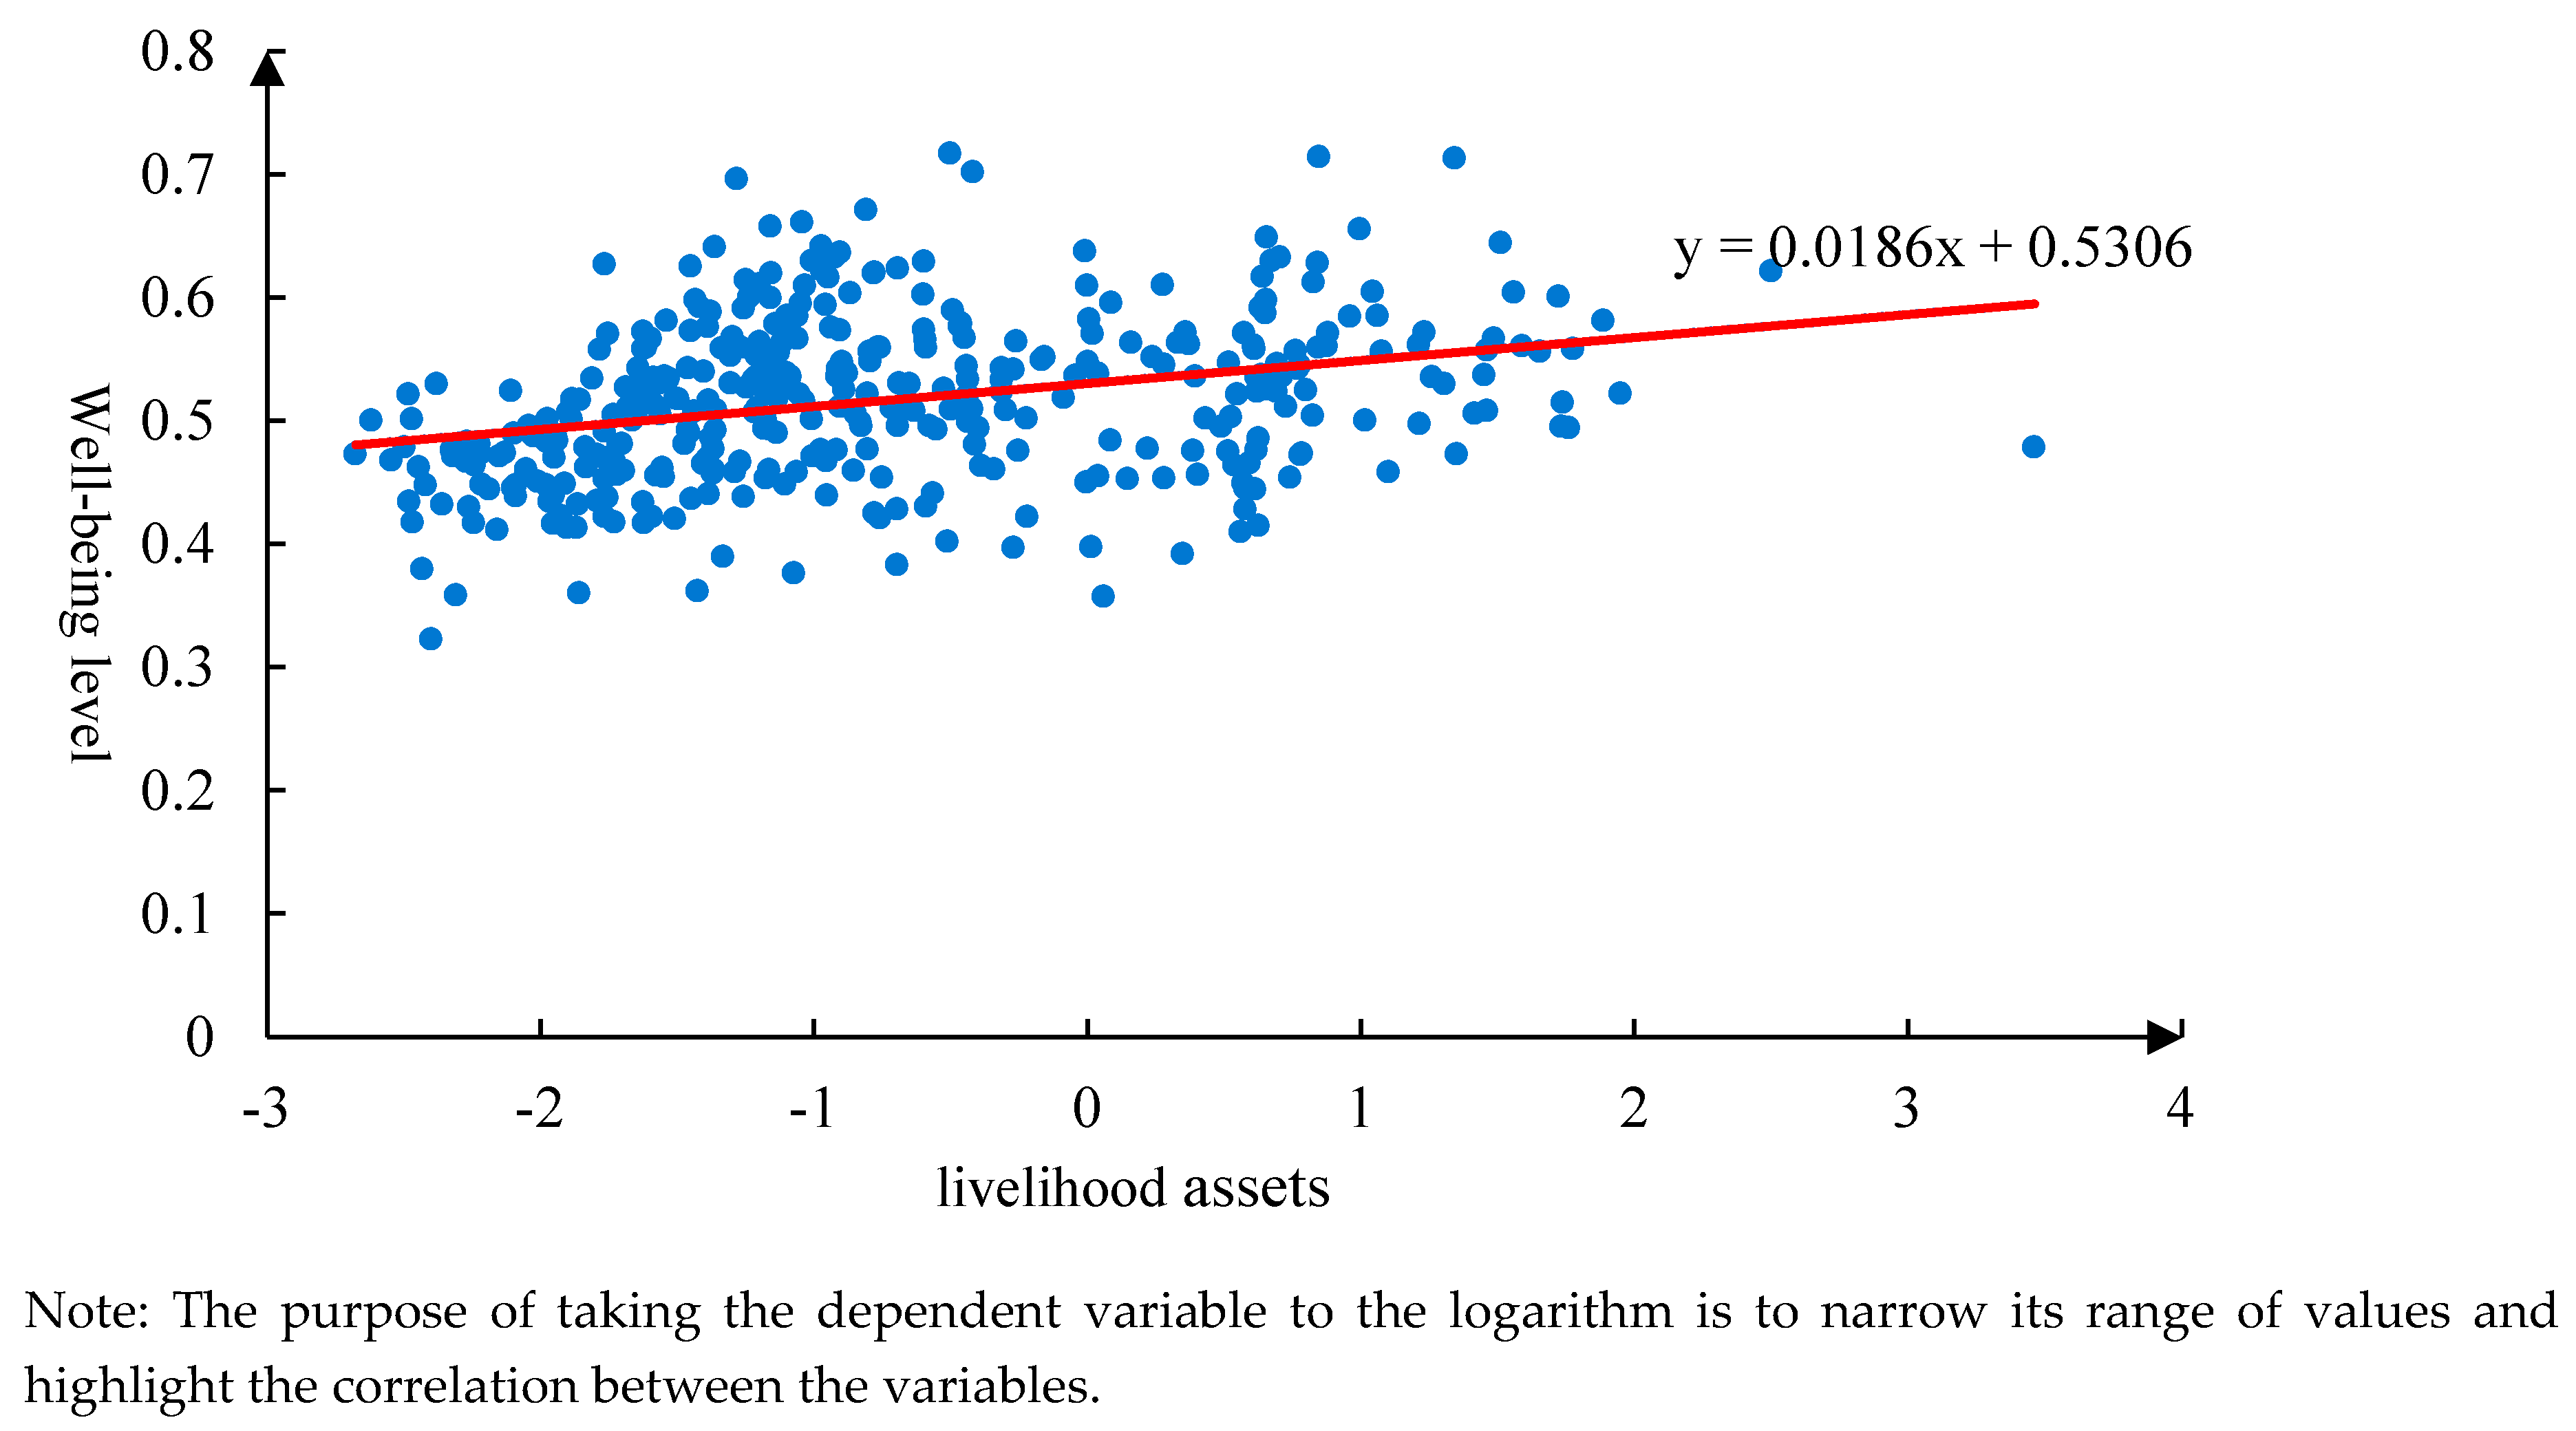

Table 1.
Indicators of farm household livelihood assets.
| Asset type | Indicator | Symbol | Indicator meaning and value | Weight |
|---|---|---|---|---|
| Human Assets (HA) |
Household size | H1 | Total household size | 0.010 |
| Educational attainment of household members | H2 | No formal education (little literacy) = 0; elementary school = 1; junior high school = 2; high school, junior college = 3; college, senior college = 4; university undergraduate and above = 5 | 0.042 | |
| Household labor capacity | H3 | Assigned according to age, where 6 and below = 0; 7−18 = 1; 18−25 = 2; 26−45 = 5; 46−60 = 4; 60 and above (including military/students aged 19−60) = 3 | 0.016 | |
| Natural Assets (NA) |
Area of arable land | N1 | Household arable land area | 0.045 |
| Area of watered land | N2 | Area of household watered land | 0.328 | |
| Area returned to farming | N3 | Area of land returned to farming by household | 0.001 | |
| Physical Assets (PA) |
Residential index | P1 | Residential index =αM+βC+γN, where M, C, and N denote the number of houses, house structure, and residential age, respectively; α, β, and γ are the weights of the three, respectively, using the entropy value method to calculate α=0.3949, β=0.4023, and γ=0.2028. where, house structure: civil structure = 1, brick structure = 2, brick and mixed structure = 4, others: such as brick = 3, relief = 0. If the house consists of different structures, the weighted summation is calculated in proportion to the number of rooms structure | 0.005 |
| Number of large production tools | P2 | Number of asset types owned by farm households | 0.013 | |
| Social Assets (SA) |
Number of public officials among relatives | S1 | Number of public officials among relatives | 0.290 |
| Number of channels for outworking | S2 | Number of types of channels for outworking | 0.024 | |
| Number of social contacts | S3 | Assigned according to the number of cell phone contacts, no cell phone = 0, 0–20 people = 1, 21–50 people = 2, 51–100 people = 3, 101 and above = 4 | 0.023 | |
| Financial Assets (FA) |
Total value of livestock | F1 | Total value of livestock = number of livestock × unit price of livestock (differentiate between young and adult livestock, unit price obtained from research data) | 0.138 |
| Annual household income | F2 | The sum of farm income, wage income, financial income (direct grain subsidy, old-age insurance, low-income insurance, social security), subsidies for retired farming and other income (medicine collection, etc.) in one year | 0.063 | |
| Annual household expenditure | F3 | Sum of children’s school fees, food consumption, gift expenditure, health expenditure, consumption of durable goods and consumption of daily necessities, etc. in one year | 0.001 |
Table 2.
Indicators of farm households’ well-being levels.
| Well-being dimension | Indicator | Symbol | Indicator assignment | Weight |
|---|---|---|---|---|
| Labor Force Condition (FL) |
Household size | F1 | Number of farm household members | 0.052 |
| Household labor capacity | F2 | Assignment according to age, where 6 years and below = 0; 7–18 years = 1; 18–25 years = 2; 26–45 years = 5; 46–60 years = 4; 60 years and above (including military/students aged between 19–60) = 3 | 0.059 | |
| Educational attainment of labor force | F3 | No formal education (little literacy) = 0; elementary school = 1; junior high school = 2; high school, junior college = 3; college or senior college = 4; university undergraduate and above = 5 | 0.092 | |
| Number of people engaged in noncultivated agriculture | F4 | Assigned according to the nature of employment, where farming = 0; farming + other employment = 1; other employment = 2 | 0.112 | |
| Wealth Level (WL) |
Annual household income | T1 | Sum of agricultural income, wage income, financial income (direct food subsidy, old-age insurance, low-income insurance, social security), fallowing subsidy, and other income (medicine picking, etc.) in one year | 0.152 |
| Annual household expenditure | T2 | Sum of children’s school fees, food consumption, gift expenditure, health expenditure, consumption of durable goods, consumption of daily necessities, etc., in one year | 0.102 | |
| Arable land per capita | T3 | Arable land/total population | 0.109 | |
| Housing area per capita | T4 | Average housing area per capita | 0.028 | |
| Ecological Environment Quality (EQ) |
Water safety | Z1 | Assigned according to farmers’ perception of changes in water pollution after fallowing, strong = 0; constant = 1; diminished = 2 | 0.039 |
| Air safety | Z2 | Assigned according to farmers’ perception of whether air quality has improved after fallowing, worse = 0; no change = 1; better = 2 | 0.020 | |
| Soil and water conservation | Z3 | Assigning values according to whether farmers’ soil erosion has improved after fallowing, severe = 0; no change = 1; improved = 2 | 0.021 | |
| Soil safety | Z4 | Assigned according to whether the farmer is serious about soil contamination after fallowing, serious = 0; not serious = 1 | 0.011 | |
| Social Conditions (SC) |
Traffic accessibility | S1 | Distance of farm households from the nearest road | 0.141 |
| Resource accessibility | S2 | Distance of farm households to the nearest hospital or school | 0.054 | |
| Policy satisfaction | S3 | Assignment of values according to whether farmers are willing to participate in the grain for green policy, where indifferent = 0; very unwilling = 1; not very willing = 2; average = 3; very willing = 4 | 0.011 |
Table 3.
Level and contribution of average farm household livelihood assets.
| Livelihood assets | Returned farmland households | Nonreturned farmland households | All farm households | ||||
|---|---|---|---|---|---|---|---|
| Asset level | Contribution rate % | Asset level | Contribution rate % | Asset level | Contribution rate % | ||
| Human assets | Household size | 0.010 | 14.97 | 0.010 | 14.30 | 0.010 | 14.76 |
| Educational attainment of household members | 0.041 | 61.43 | 0.044 | 62.26 | 0.042 | 61.69 | |
| Household labor capacity | 0.016 | 23.60 | 0.017 | 23.43 | 0.016 | 23.55 | |
| Natural assets | Area of arable land | 0.044 | 13.38 | 0.046 | 9.61 | 0.045 | 11.92 |
| Area of watered land | 0.285 | 86.21 | 0.428 | 90.06 | 0.328 | 87.69 | |
| Area returned to farming | 0.001 | 0.41 | 0.002 | 0.34 | 0.001 | 0.38 | |
| Physical assets | Residential index | 0.005 | 26.54 | 0.005 | 28.11 | 0.005 | 27.04 |
| Number of large production tools | 0.013 | 73.46 | 0.014 | 71.90 | 0.013 | 72.96 | |
| Social assets | Number of public officials among relatives | 0.280 | 85.30 | 0.315 | 87.74 | 0.290 | 86.09 |
| Number of channels for outworking | 0.025 | 7.48 | 0.022 | 5.99 | 0.024 | 7.00 | |
| Number of social contacts | 0.024 | 7.22 | 0.023 | 6.27 | 0.023 | 6.91 | |
| Financial assets | Total value of livestock | 0.143 | 69.31 | 0.127 | 65.69 | 0.138 | 68.26 |
| Annual household income | 0.062 | 30.30 | 0.066 | 33.90 | 0.063 | 31.34 | |
| Annual household expenditure | 0.001 | 0.39 | 0.001 | 0.41 | 0.001 | 0.39 | |
Table 4.
Levels and contributions of each indicator of well-being per farm household.
| Indicator | Returned farmland households | Nonreturned farmland households | All farm households | ||||
|---|---|---|---|---|---|---|---|
| Well-being level | Contribution rate % | Well-being level | Contribution rate % | Well-being level | Contribution rate % | ||
| Labor Force Condition | Household size | 0.014 | 17.51 | 0.016 | 18.36 | 0.015 | 17.78 |
| Household labor capacity | 0.017 | 20.78 | 0.018 | 21.49 | 0.017 | 21.00 | |
| Educational attainment of labor force | 0.023 | 27.61 | 0.024 | 28.11 | 0.023 | 27.76 | |
| Number of people engaged in noncultivated agriculture | 0.028 | 34.10 | 0.027 | 32.04 | 0.028 | 33.46 | |
| Wealth level | Annual household income | 0.008 | 3.62 | 0.007 | 3.55 | 0.008 | 3.60 |
| Annual household expenditure | 0.091 | 43.48 | 0.089 | 43.36 | 0.090 | 43.44 | |
| Arable land per capita | 0.102 | 48.78 | 0.100 | 48.36 | 0.101 | 48.65 | |
| Housing area per capita | 0.009 | 4.12 | 0.010 | 4.73 | 0.009 | 4.30 | |
| Ecological environment Quality | Water safety | 0.022 | 34.66 | 0.020 | 33.68 | 0.021 | 34.37 |
| Air safety | 0.018 | 28.28 | 0.017 | 27.87 | 0.018 | 28.16 | |
| Soil and water conservation | 0.013 | 20.01 | 0.013 | 20.73 | 0.013 | 20.22 | |
| Soil safety | 0.011 | 17.04 | 0.011 | 17.72 | 0.011 | 17.24 | |
| Social conditions | Traffic accessibility | 0.117 | 70.39 | 0.114 | 71.53 | 0.116 | 70.73 |
| Resource accessibility | 0.039 | 23.71 | 0.036 | 22.40 | 0.038 | 23.33 | |
| Policy satisfaction | 0.010 | 5.89 | 0.010 | 6.07 | 0.010 | 5.95 | |
Table 5.
Factors influencing farm household well-being.
| Impact factor | All farm households | Returned farmland households | Nonreturned farmland households | |||
|---|---|---|---|---|---|---|
| Standard coefficient | Sig. | Standard coefficient | Sig. | Standard coefficient | Sig. | |
| Household size | 0.366*** | 0.000 | 0.345*** | 0.000 | 0.392*** | 0.000 |
| Educational attainment of household members | 0.323*** | 0.000 | 0.305*** | 0.000 | 0.415*** | 0.000 |
| Household labor capacity | 0.166*** | 0.010 | 0.203** | 0.015 | 0.156 | 0.128 |
| Area of arable land | −0.208*** | 0.000 | −0.19*** | 0.000 | −0.199*** | 0.000 |
| Area of watered land | 0.034 | 0.343 | 0.042 | 0.380 | −0.012 | 0.813 |
| Area returned to farming | −0.048 | 0.097 | −0.035 | 0.317 | — | — |
| Residential index | 0.015 | 0.603 | 0.053 | 0.145 | -0.044 | 0.379 |
| Number of large production tools | 0.086*** | 0.005 | 0.035 | 0.376 | 0.116** | 0.021 |
| Number of public officials among relatives | 0.026 | 0.395 | 0.017 | 0.659 | −0.008 | 0.867 |
| Number of channels for outworking | 0.009 | 0.767 | 0.014 | 0.688 | −0.030 | 0.540 |
| Number of social contacts | −0.005 | 0.862 | −0.056 | 0.146 | 0.067 | 0.180 |
| Total value of livestock | 0.064** | 0.034 | 0.076** | 0.034 | 0.081 | 0.106 |
| Annual household income | 0.055 | 0.091 | 0.081** | 0.034 | 0.056 | 0.344 |
| Annual household expenditure | 0.157*** | 0.000 | 0.222*** | 0.000 | 0.071 | 0.179 |
| Livelihood diversity | 0.107*** | 0.003 | 0.091** | 0.047 | 0.149*** | 0.009 |
| Constant | — | 0.000 | — | 0.000 | — | 0.000 |
Note: *** and ** indicate significant at the 1% and 5% levels, respectively.
Disclaimer/Publisher’s Note: The statements, opinions and data contained in all publications are solely those of the individual author(s) and contributor(s) and not of MDPI and/or the editor(s). MDPI and/or the editor(s) disclaim responsibility for any injury to people or property resulting from any ideas, methods, instructions or products referred to in the content. |
© 2023 by the authors. Licensee MDPI, Basel, Switzerland. This article is an open access article distributed under the terms and conditions of the Creative Commons Attribution (CC BY) license (http://creativecommons.org/licenses/by/4.0/).
Copyright: This open access article is published under a Creative Commons CC BY 4.0 license, which permit the free download, distribution, and reuse, provided that the author and preprint are cited in any reuse.


