
Submitted:
21 June 2023
Posted:
23 June 2023
You are already at the latest version
Abstract
Existing research lacks studies that explore the impact of government fiscal support on the high-quality development of regional economy and society from the perspective of livelihood-based infrastructure construction. The investigation in this paper explores the economic and social effects of government fiscal support behavior from the perspective of livelihood infrastructure construction. On the basis of the TOPSIS-Entropy Method, this paper constructs an evaluation indicator that closely conforms to the denotation and requirements of high-quality development and then carries out empirical regressions in combination with government expenditure on people's livelihood to verify the theoretical hypothesis, whose transmission mechanism and moderating effect are further empirically tested. The results reveal that increasing government expenditure on people's livelihoods can effectively improve regional high-quality development, but the marginal improvement degree varies with different periods and locations. The mechanism test proves that the regional consumption level plays a significant part in the mediating effect, accounting for 24.27% of the total effect. Urbanization is also the critical impetus for regional high-quality development and positively moderates the promotion effect of people's livelihood fiscal expenditure. Our study presents a theoretical basis and policy inspiration for improving residents' quality of life and welfare level and improving people's livelihood in the midst of high-quality economic development.
Keywords:
Economic high-quality development systems
; Fiscal expenditure on people's livelihood
; Consumption level
; Urbanization
; Well-being economy
1. Introduction
COVID-19 is an unprecedented challenge in terms of the breadth and depth of its impact on the welfare economy [1]. Many countries are in a critical period of strategic opportunities for economic transformation, structural adjustment, modernization of governance capacity and systems in the post-COVID era. It is increasingly important to establish a comprehensive indicator system to assess the sustainable circular development status of society, economy, and the environment [2,3]. After the continuous impact of the uncertainty of the epidemic situation, countries have a more comprehensive definition of high-quality development systems. The United States, European Union and Germany have, respectively established and improved the evaluation system of the "New Economy" [4], the Sustainable Development Evaluation System [5] and the National Welfare Evaluation System [6]. This demonstrates the government’s forward-looking and universal consensus on building a healthy, equitable and prosperous society. The Chinese government first put forward the phrase "high-quality development" in 2017. In essence, it is an important embodiment of the new development concept in the new era and the new stage. Therefore, we set up an indicator system of high-quality development, which hinges on the five major development concepts contained in the new development concept. These five concepts reflect the strategies and policies to improve the quality of economic development by transforming economic momentum, promoting balanced development, valuing the ecological environment, deepening opening-up and sharing the fruits of development, which is also in line with the definition of sustainable economic development [7]. As the denotation and requirements of high-quality development become increasingly richer, it gradually appears to be able to properly satisfy people’s ever-growing actual needs [8]. Improving people’s livelihood is the fundamental purpose of development and is becoming an indispensable guarantee for development. This is because countries around the world are suffering from the impact of the pandemic and need to expand domestic demand, consumption in particular, to continuously provide a basic driving force for economic growth and then attain high-quality development. One of the key points to smooth the channel from internal demand to high-quality development is to promote the construction of livelihood undertakings. In other words, it can be argued that how to improve the scale and quality of people’s livelihood services, enhance residents’ well-being and then achieve high-quality economic development is not negligible for outlining the blueprint of economic and social development at present and in the long term.
Research on the determinants of regional development quality systems has recently become the focus of academic discussion. Existing studies have revealed that the political environment [9], cultural and legal environments [10], human capital quality [11], infrastructure construction of urban living environments [12], environmental quality [13], green innovation [14] and foreign trade [15] exert influence on high-quality development. To remove the barriers that hinder high-quality development, it will become a powerful weapon, which includes but is not limited to research innovation, technological progress, participation and governance of social organizations and a better system of government [16,17,18]. A "government that can make a difference" is expected to implement the new development concept based on the people’s livelihood in times of uncertainty. It will shoulder the historical mission of promoting high-quality economic and social development through macroeconomic regulation, support for meso-industry development, leadership in micro-technical research, and the bottom line of livelihood projects.
In the post-COVID era, it is more necessary than ever to promote high-quality development by continuously improving social security and the quality of people’s livelihood. As the maker of economic policies and the provider of public services, the government is indispensable to the development of the economy and people’s livelihood. Its fiscal function is an essential means to regulate economic activities and solve economic development problems [19]. An effective government that deepens the reform of the political system, changes the social governance model, and enhances the social governance ability could perform its public functions efficiently [20], overcome the medical situation of "difficult to see doctors", solve the "unfair" education problem, and resolve the "narrow scope" social security problem. It can also make up for shortcomings in the field of people’s livelihood, thereby improving people’s sense of happiness and living standards and providing impetus for the realization of a well-being economy and high-quality development. The existing studies has analyzed the effect of government behavior on regional development from many perspectives, including environmental institutions, technological innovation, human capital, and financial support. However, there is a lack of related research on people’s livelihood construction. By reflecting on the matter caused by inadequate infrastructure construction of people’s livelihoods in various countries in the process of resisting uncertain impacts such as the epidemic, we expand existing research from the perspective of fiscal public spending on people’s livelihoods. This paper notes that the growth of the government’s public expenditure on people’s livelihoods can promote high-quality development. An important transmission channel is the level of regional consumption, while urbanization can strengthen the promoting role of government behavior.
Our marginal contribution mainly includes three aspects. First, different from a single indicator that measures regional development quality, we start with the new development concept and build a comprehensive evaluation system to measure the high-quality development of regions. More comprehensively define the high-quality development state showing the characteristics of welfare society. Second, we have enriched the literature on government behavior that determines high-quality development with a unique cut-in point of livelihood spending and better verify the government’s fundamental contribution to the soft environment for high-quality regional development through empirical analysis. Third, we tested the mediating effect of the regional consumption level and verified the importance of livelihood security to the construction of internal circulation patterns. The paper improves the relevant research on promoting high-quality regional development with the help of livelihood infrastructure in urbanization construction.
And the remainder of the paper is designed as follows. The second part is the theoretical analysis and research hypotheses, where we provide a logical analysis of the paper’s research themes and mechanisms. The third part is the research design, where we introduce the analytical model involved in this paper and explain the relevant variables. The fourth part is the empirical analysis and testing. The fifth part is the conclusion and implication.
2. Theoretical analysis and research hypothesis
Assuring the basic supply of public services is a crucial element of promoting economic and social development [21]. The government is the bottom line in housing, education, medical care, elderly care, employment, and other aspects while taking responsibility for constructing a soft environment for high-quality development. The government can efficiently help improve the culture, education, and coordination level of the region, actively promote the formation of potential demand markets, and significantly push forward high-quality development, ultimately forming a society with a well-being economy. On the supply side, public services for people’s livelihoods can improve the quality of human capital and residents’ actual income level, narrow the resource allocation gap, drive the overall innovation environment, improve development coordination and sharing levels, and then promote high-quality development in the region. On the demand side, the current development stage has a high demand for public consumption represented by education, medical care, and elderly care. Stimulated by the effect of high-quality demand, guiding and promoting the establishment of a substantial public consumption market is the key to effectively realizing the government’s public functions. For government spending on basic public services, it is necessary to strengthen basic livelihood security, improve the quality of education development, implement employment incentive policies, increase medical service research and development, strengthen public transportation investment, and steadily improve the level of social security [22,23,24,25,26]. These factors steadily contribute to improving the operational efficiency of the economy and thus promoting high-quality development in each area. Therefore, this study will focus on education, medical care, social security, and employment as the core perspectives to analyze the specific role of livelihood expenditure on regional high-quality development. Through theoretical analysis and empirical analysis, the conclusion of this paper verifies the important position of government livelihood undertakings in regional high-quality development.
Foremost, increasing expenditure on people’s livelihood will provide higher quality services in the post-COVID era. People’s livelihood expenditure exerts an obvious positive effect on the degree of human capital [27], labor productivity and regional innovation vitality and drives high-quality regional development. According to endogenous growth theory, technological progress is the source of power to continuously promote economic growth. Under resource constraints, the government efficiently provides a range of public services, such as education, medical care, and employment. By improving the quality of human capital, guaranteeing residents’ lives and health, promoting labor employment stability, and maintaining people’s basic living security [28], regional innovation, coordination, and sharing degree have been effectively improved, thereby promoting high-quality development in regions.
Furthermore, increasing expenditure on people’s livelihood is an effective way to promote regional wealth redistribution and improve the efficiency of the allocation of public resources. Narrowing internal development differences can significantly enhance the regional development of coordination, thereby improving the high-quality regional development level. From an income redistribution perspective, the government can effectively regulate the rebalancing of actual income and wealth by making effective use of the role of public policy, including fiscal revenue and expenditure, transfer payments, and other means in the case of unbalanced initial distribution [29], maintain social fairness, and promote common prosperity. The increase in people’s livelihood services expenditure helps to rationally allocate resources, effectively alleviate the degree of unbalanced distribution of primary livelihood security resources in the region and eventually promote high-quality development by improving the sharing and coordination development level in the region.
The theory of public behavior and the regulations on government investment promulgated by the Chinese government in 2019 indicate that local governments should build a spending framework oriented to public values, shift to an implicit and high-quality government coordination mode, and effectively promote sustained, healthy, and high-quality economic and social development. As a part of government spending activities, people’s livelihood construction has always been an essential focus. The fundamental purpose of government departments to perform their public functions is to build residents’ living standards. However, in different regions or periods, due to heterogeneity in the stages and levels of economic development, local governments attach distinct importance to efficiency and equity, which leads to different emphases on the construction of infrastructure for people’s livelihood. There are differences in the quality and importance of infrastructure construction of people’s livelihood services in different periods and regions with varying levels of development. Therefore, the effect of increased livelihood expenditure on high-quality regional development may be spatiotemporally heterogeneous. Accordingly, we propose the following hypothesis:
Hypothesis 1a:
The growth of government spending on people’s livelihoods can push forward high-quality regional development.
Hypothesis 1b:
The impact of government people’s livelihood expenditure growth on high-quality regional development has temporal and spatial heterogeneity.
The increase in people’s livelihood expenditure provides high-quality basic social life security for residents to drive the expansion of their level of actual income and lower the motivation to save, effectively enhancing their personal ability to consume and their willingness and activating residents’ potential demand. It is also beneficial to form a sizeable domestic circulation pattern, which in turn stimulates regional high-quality development. Based on the life cycle theory, a rational person’s current expenditure depends on income and wealth in the whole life cycle, and individuals hope their expenditure can be stable. Assuming that rational consumers have the concept of precautionary saving in common, this theory clarifies the "Chinese savings puzzle" [30,31]. When the government improves the level of people’s livelihood services and provides individuals with relatively complete essential public services, the individual’s expenditures on education, medical care, and social security are relatively reduced, resulting in a significant decrease in the related precautionary savings. As a result, their actual income level has improved, and their consumption intention and motivation have been enhanced. The proportion of consumption used to improve the standard of life and the overall expenditure have also increased. Regional supply quality has been improved through the demand effect, thus driving high-quality regional development. In summary, we further propose the second hypothesis:
Hypothesis 2:
The growth of government people’s livelihood expenditure can improve residents’ consumption levels, thereby promoting high-quality regional development.
Marx once pointed out that modern history is a history of rural urbanization. In a narrow sense, urbanization is defined as the course of continuous population agglomeration to cities, which is an insurmountable stage of a country’s economic development. At present, few studies have revealed how the relationship between spending on people’s livelihoods and high-quality regional development is affected by urbanization. In this paper, some insights are obtained by sorting out related research.
In terms of direct impact, the process of urbanization directly affects the development quality of the region [32,33]. Some scholars believe that urbanization can promote regional economic development. Urbanization will promote productivity progress through the promotion of employment [34], the agglomeration of physical resources and human resources [35], the optimization and upgrading of industrial structure [36], and the expansion of domestic demand and promotion of consumption [37]. These measures can also improve regional total factor productivity, thereby effectively achieving regional high-quality development. It is worth noting that the problems brought about by urbanization will impede high-quality development in each area. Urban isomorphism is accompanied by the advancement of urbanization. Blind expansion of the urban scale due to the one-sided pursuit of GDP growth may lead to problems in the allocation of land resources, thus constraining regional development quality. Meanwhile, industrial development and population agglomeration induced by urbanization may affect the regional environment and inhibit regional green growth [38].
In terms of indirect impact, under the input of factors, the aggregation of production factors brought about by urbanization enhances the effect of basic input on people’s livelihood by improving the resource utilization efficiency of basic construction. Urbanization promotes population agglomeration, which highlights the shortcomings of local livelihood services. The government faces increasing pressure on basic livelihood services, and the construction of livelihood infrastructure lags. These factors hinder regional development quality from improving, so the quality and quantity of people’s livelihood expenditure need to be further improved. In the process of investment in people’s livelihood infrastructure, due to the population agglomeration effect formed by urbanization, the economic and social externalities induced by people’s livelihood infrastructure can be more fully utilized so that stock resources can effectively be used, which is manifested in the fact that urbanization strengthens the role of livelihood construction in regional high-quality development. Accordingly, the following hypotheses are proposed:
Hypothesis 3a:
Urbanization acts as a catalyst to push forward high-quality regional development.
Hypothesis 3b:
There is blindness in urbanization, which inhibits high-quality regional development.
Hypothesis 4:
Accelerating the urbanization process can enhance the positive externality of livelihood expenditure to regional high-quality development.
3. Research design
3.1. Regression model
Based on Hypothesis 1, to verify the specific impact of government people’s livelihood expenditure growth on high-quality regional development, we first set the basic regression model:
where subscripts i and t represent region and year, respectively, measures the high-quality development level of region i in time period t, the specific construction method will be given below, and is a collection of control variables. Drawing on existing studies, we select the following variables to control the impact of other ingredients on regional high-quality development: the annual rate of change of R&D expenditure (rd). The higher the R&D investment in a region, the stronger the regional government’s policy support for scientific research and innovation and technological development; the number of granted patents per ten thousand people (patent). The more patents are granted, the better the innovation foundation and atmosphere in the region, and the stronger the innovation capability; the actual foreign direct investment scale per capita (fdi), foreign direct investment may promote regional high-quality development through technology spillover or technology transfer; the rate of change of gross domestic product (gdp), the greater the value of gdp, the faster the regional economic growth; the energy consumption per unit of gross domestic product (energy), the higher the value, the more energy consumption per unit of output, the lower the development degree of green economy; The density of population (upd). Population density may affect high-quality development through human capital accumulation, labor supply or shortage of public services. ε is the random disturbance term. The coefficient is the most important in this study. Whether it is statistically significant directly determines the impact of fiscal spending on people’s livelihood on high-quality development. If is statistically significant and positive, it shows that the increase in expenditure on people’s livelihood in a region can significantly promote the high-quality development of the region.
We choose three types of empirical models to run formula (1). The first is the Tobit model. When the high-quality development evaluation index is used as the explained variable, because its value is a relative score and the value ranges from 0 to 1, the estimation results of the traditional linear regression model may be biased and inconsistent. It is better to use the limited dependent variable model, and the Tobit model can address the problem of a limited dependent variable [39]. The second is the random effect model. This model includes the omitted heterogeneity between different regions. The third is the fixed effect model. This model imposes a more stringent assumption than the random effect model. In the subsequent empirical test, we always use the two-way fixed effect model because the Hausmann test shows that the fixed effect model is more suitable than the random effect model. From the perspective of economic theory, we cannot control all the factors that affect the high-quality development level of the region, and these factors (such as the quality of institutions, business environment, etc.) may also be related to regional economic growth and R&D investment, so it is more appropriate to use a two-way fixed model.
Running the baseline regression model can test hypothesis 1. To further verify hypothesis 2, namely, the mediating effect of the regional consumption level, a stepwise regression method is adopted [40]. The mediation model is constructed as follows [41]:
On the basis of formula (1), the models in formula (2) and formula (3) are tested in turn, and the variable com measures the level of regional consumption. On the basis that the coefficient in formula (1) is significantly positive, if the coefficients and are both significantly positive, it shows that the mediated effect exists, that is, the increase in expenditure on people’s livelihood in an area can improve the consumption level of the region and then promote regional high-quality development. Furthermore, if the coefficient is significant, it means that the level of regional consumption plays a partial mediating role, and the consumption level is only one of the channels through which people’s livelihood expenditure affects the high-quality development of the region; if the coefficientis not significant, it means that there is a full mediating effect, and the regional consumption level is the only channel through which people’s livelihood expenditure affects the regional high-quality development.
In hypotheses 3-4, we propose that urbanization may be an important ingredient affecting regional high-quality development, and there may be a positive moderating effect on the key independent variable ms. To verify hypothesis 3, the indicator urb representing urbanization level is constructed, and equation (4) is established. To verify hypothesis 4, the variables urb, ms and interaction term urb×ms are simultaneously introduced into equation (5). Equation (4) and equation (5) are as follows:
In Formula (5), if the coefficient is significantly positive, it indicates that the promotion degree of people’s livelihood expenditure on regional high-quality development is indeed affected by the regional urbanization level. The higher the regional urbanization level is, the stronger the promotion effect of the former on the latter.
3.2. Variable description
3.2.1. Indicators of regional high-quality development level
As China’s economic development shifts from a phase of high-speed growth to a stage of high-quality development, efforts must be made to fully implement the five development concepts of innovative development, coordinated development, green development, open development and shared development. High-quality economic development cannot be achieved without these five driving forces. Combined with the principles of feasibility and simplicity to be followed in the construction of the index system [42], we built the index evaluation system based on these five concepts. Drawing on the treatment of Ding et al. (2016) [43] and Qiu et al. (2022) [44] and applying the TOPSIS-Entropy Method, various sub-indicators of high-quality development are integrated into a comprehensive indicator to evaluate the overall level of high-quality development of 30 administrative provinces in China. The index system and specific calculation method and definitions of indicators at all levels are given in Table 1. In addition, the following two points need to be specified. First, we use the Theil index to measure the rationalization level of industrial structure.1 Second, the indexes are positive indicators except Z21 and Z31 among the third-level indicators.

Table 1.
The evaluation system of high-quality development.
| First Level Indicators | Second Level Indicators | Third Level Indicators | Specific Indicators |
|---|---|---|---|
| High-quality development level (hqd) | Innovation (Z1) | The vitality of technological innovation (Z11): | Total number of full-time R&D employees Z11 |
| Technology research and development capability (Z12): | Number of invention patents authorized Z12 | ||
| Technology transformation capability (Z13): | High-tech industry’s development degree (Main Business Income/GDP) Z13 | ||
| Coordination (Z2) | The coordination of regional industrial structure(Z21): | Industrial structure rationalization index Z21 | |
| The coordination between urban and rural areas(Z22): | The ratio of rural income to urban income Z22 | ||
| Greenness (Z3) | Basic environmental change degree (Z31-34): |
Population-weighted concentrations of PM2.5 Z31; The average value of GDP per unit of energy consumption Z32; Comprehensive utilization rate of industrial solid waste Z33; Regional sewage recycling rate Z34 |
|
| The level of green technology development (Z35): | The regional granted number of green invention patents Z35 | ||
| Openness (Z4) | External attractiveness (Z41): | The regional actual scale of foreign capital utilized Z41 | |
| Degree of marketization (Z42): | Marketization Index by region Z42 | ||
| The development of ICT(Z43): | Regional Internet penetration rate Z43 | ||
| Sharing (Z5) | People’s quality of life (Z51): | Consumption level of regional residents Z51 | |
| Social civilization level (Z52): | Number of college students per unit of population in the region Z52 | ||
| Life and health security (Z53-54): | Number of hospital beds per ten thousand people in the region Z53; Number of practicing (assistant) physicians per ten thousand people in the region Z54 |
||
| Basic social security (Z55-57): | Utilization rate of labor resources Z55; Percentage of medical insurance cover Z56; Percentage of unemployment insurance cover Z57 |
3.2.2. The level of government expenditure on people’s livelihood
Making up for shortcomings in education, medical care, social security, and employment was highlighted at the 19th CPC National Congress. Although existing studies have not yet clarified the concept of government expenditure on people’s livelihood, in obedience to the official statements, combined with the indicators related to people’s livelihood and well-being in the "14th Five-Year Plan" outline, the government expenditure on people’s livelihood in this paper includes education, medical care, social security and employment.
3.2.3. Indicators for measuring urbanization level
The level of urbanization is the moderating variable of this paper. Along with the narrowing of the gap between urban and rural areas, human-oriented migration advancement is an important feature of urbanization. As a general practice, we select the proportion of the urban population in the total population of the region to represent the degree of urbanization.
3.2.4. Description of control variables
Apart from the four critical variables of high-quality development level (hqd), government expenditure on people’s livelihood (ms), urbanization level (urb), and regional consumption level (com), some control variables are also involved in the empirical analysis, mainly including economic growth level (gdp) and energy consumption level (energy), research and development investment level (rd), innovation atmosphere (patent), foreign investment level (fdi) and population density (upd).
3.3. Data sources
Our analysis uses panel data from 30 provincial-level administrative regions (excluding Tibet) in mainland China from 2006 to 2018. The original data of PM2.5 are obtained from the global raster data of Washington University in St. Louis, USA, https://sites.wustl.edu/acag/datasets (accessed on 2 April 2023). The number of green patents granted in the region is based on the number of green invention patents granted to listed companies in the patent database of the China National Intellectual Property Administration, https://www.cnipa.gov.cn/col/col1510/index.html (accessed on 2 April 2023). The marketization level index is obtained from the China Market Index Database, https://cmi.ssap.com.cn/dataQuery (accessed on 2 April 2023). In addition, the original data of the independent variable, control variables, and mediating variables are obtained from the China Statistical Yearbook and the database of the Chinese National Bureau of Statistics. And we used the linear complementary difference method to handle them for a small number of missing values in the data.
Table 2 shows the relevant variables’ descriptive statistics. The mean value of the high-quality development index hqd is 0.379, which indicates that China’s overall high-quality development level is not very high during the sample period and needs to be further improved. From the perspective of sub-indicators, the coordination index has the highest mean value of 0.519. The mean values for greenness, openness and sharing are in the middle of the big five, and there is little difference. The mean value of the innovation index is the lowest, which is 0.162, indicating that promoting innovation is the most important driving force. Only by making efforts to compensate for the deficiency of innovation can China’s overall high-quality development level be significantly improved.
Table 2.
Summary statistics.
| VarName | Obs | Mean | Median | SD | Min | Max |
| hqd | 390 | 0.379 | 0.372 | 0.108 | 0.166 | 0.706 |
| Innovation | 390 | 0.162 | 0.108 | 0.159 | 0.005 | 0.958 |
| Coordination | 390 | 0.519 | 0.520 | 0.166 | 0.000 | 0.911 |
| Greenness | 390 | 0.449 | 0.448 | 0.092 | 0.249 | 0.815 |
| Openness | 390 | 0.385 | 0.356 | 0.159 | 0.106 | 0.805 |
| Sharing | 390 | 0.339 | 0.330 | 0.133 | 0.088 | 0.845 |
| ms | 390 | 6.667 | 6.787 | 0.774 | 4.098 | 8.351 |
| com | 390 | 1.207 | 1.023 | 0.708 | 0.380 | 4.250 |
| urb | 390 | 0.541 | 0.524 | 0.136 | 0.275 | 0.896 |
| cu | 390 | 0.365 | 0.365 | 0.062 | 0.218 | 0.542 |
| gdp | 390 | 0.133 | 0.121 | 0.063 | -0.040 | 0.298 |
| fdi | 390 | 0.109 | 0.072 | 0.132 | 0.000 | 0.851 |
| energy | 390 | 1.060 | 0.904 | 0.613 | 0.224 | 4.142 |
| rd | 390 | 2.164 | -0.192 | 7.604 | -0.946 | 66.562 |
| patent | 390 | 1.223 | 0.449 | 2.459 | 0.036 | 21.810 |
| upd | 390 | 0.280 | 0.258 | 0.122 | 0.060 | 0.631 |
4. Regression analysis
4.1. Evaluation of Indicator Measurements
The mean value distribution of the high-quality development composite index by province from 2006 to 2018 is shown in Figure 1. By comparing the high-quality development index in each province, we observe that Beijing, Guangdong, Shanghai, Jiangsu, and Zhejiang are in the first echelon. Obviously, their comprehensive strength is stronger than that of the remaining areas. The level of high-quality development in some provinces belongs to the second echelon and has certain regional competitiveness, including Tianjin, Chongqing, Shandong, and Fujian. Among them, Chongqing, which is located in Southwest China, has the largest high-quality development index in the area, showing regional competitive advantages. Liaoning in northeast China also shows regional competitive advantages. In addition, most provinces in central China are in the third echelon, which has great room for improvement. Nevertheless, the western provinces of Qinghai, Guizhou and Gansu are at a low level. Overall, the level of high-quality development in China varies by province, showing a weakening trend from the east to the central and western areas.
Figure 1.
Distribution of high-quality development in China by province (Drawing Review No. GS(2019)1822)2.
Figure 1.
Distribution of high-quality development in China by province (Drawing Review No. GS(2019)1822)2.
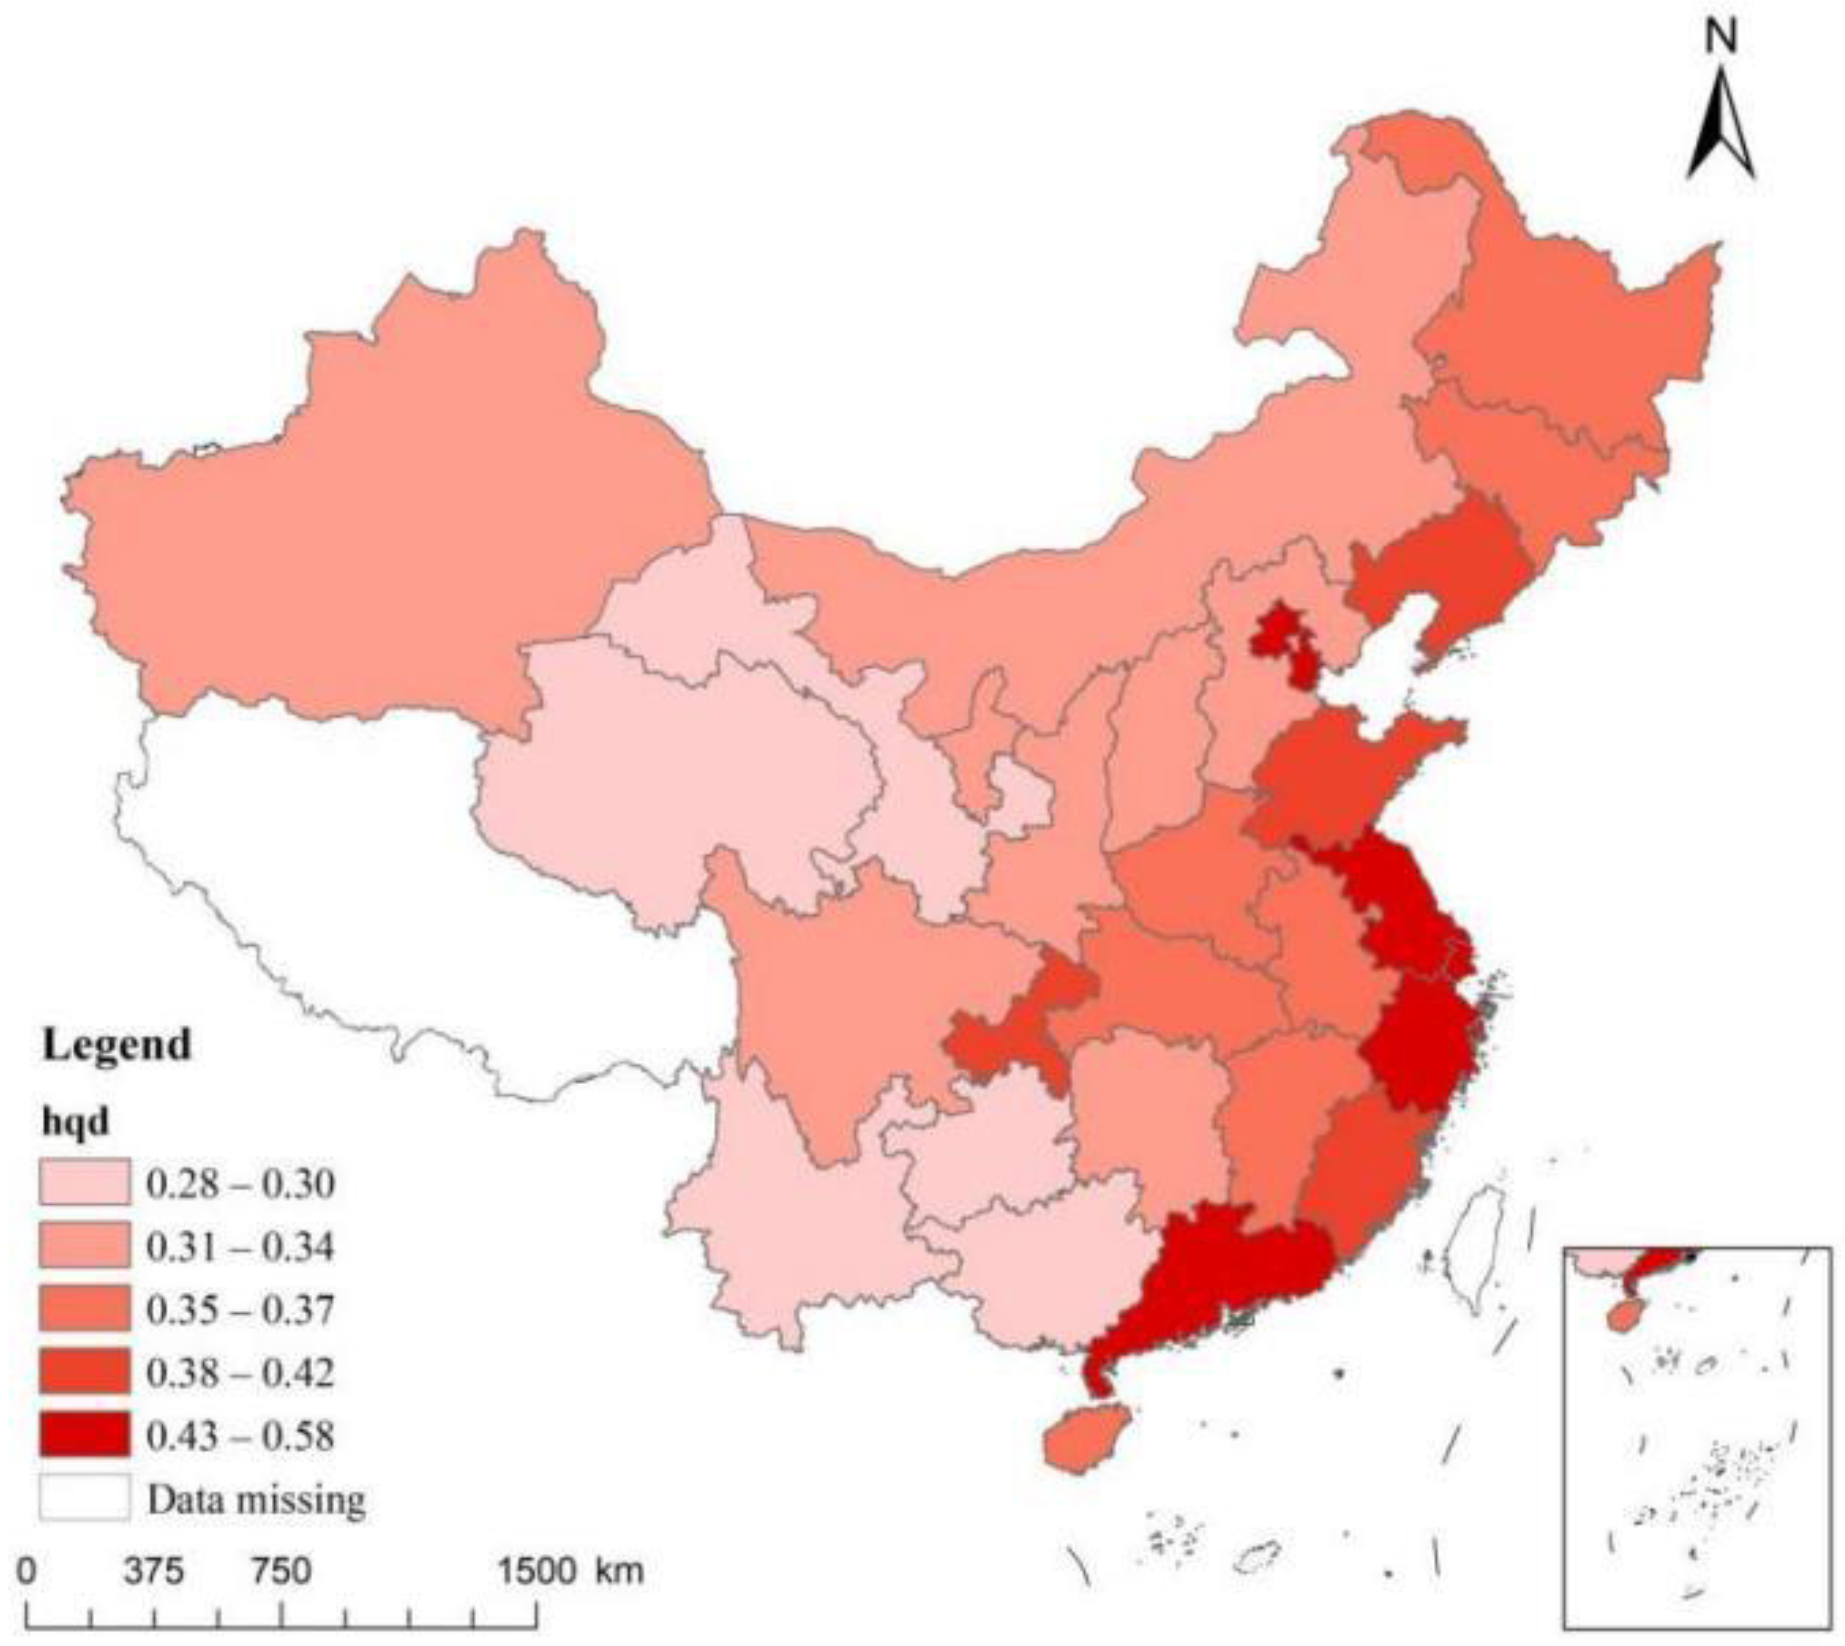
Figure 2, Figure 3, Figure 4, Figure 5 and Figure 6 show the mean value distribution of the composite index of five secondary indicators. As shown in Figure 2, the distribution of the regional innovation development level presents obvious regional differences. The top echelon consists of only two provinces, Jiangsu and Guangdong. Beijing, Zhejiang, Shandong and other provinces are in the second echelon, with a medium level of innovation competitiveness. The central region and coastal Fujian and northeast Liaoning are in the third echelon, indicating that more efforts are needed. However, the level of innovation development in Qinghai, Gansu, Inner Mongolia, Guangxi and other provinces is relatively low, so it is urgent to improve the level of regional innovation development. Generally, the overall development level of innovation in China is not very high, and it shows the weakness of uneven regional distribution.
Figure 2.
Distribution of Innovation Development in Chinese by Province.
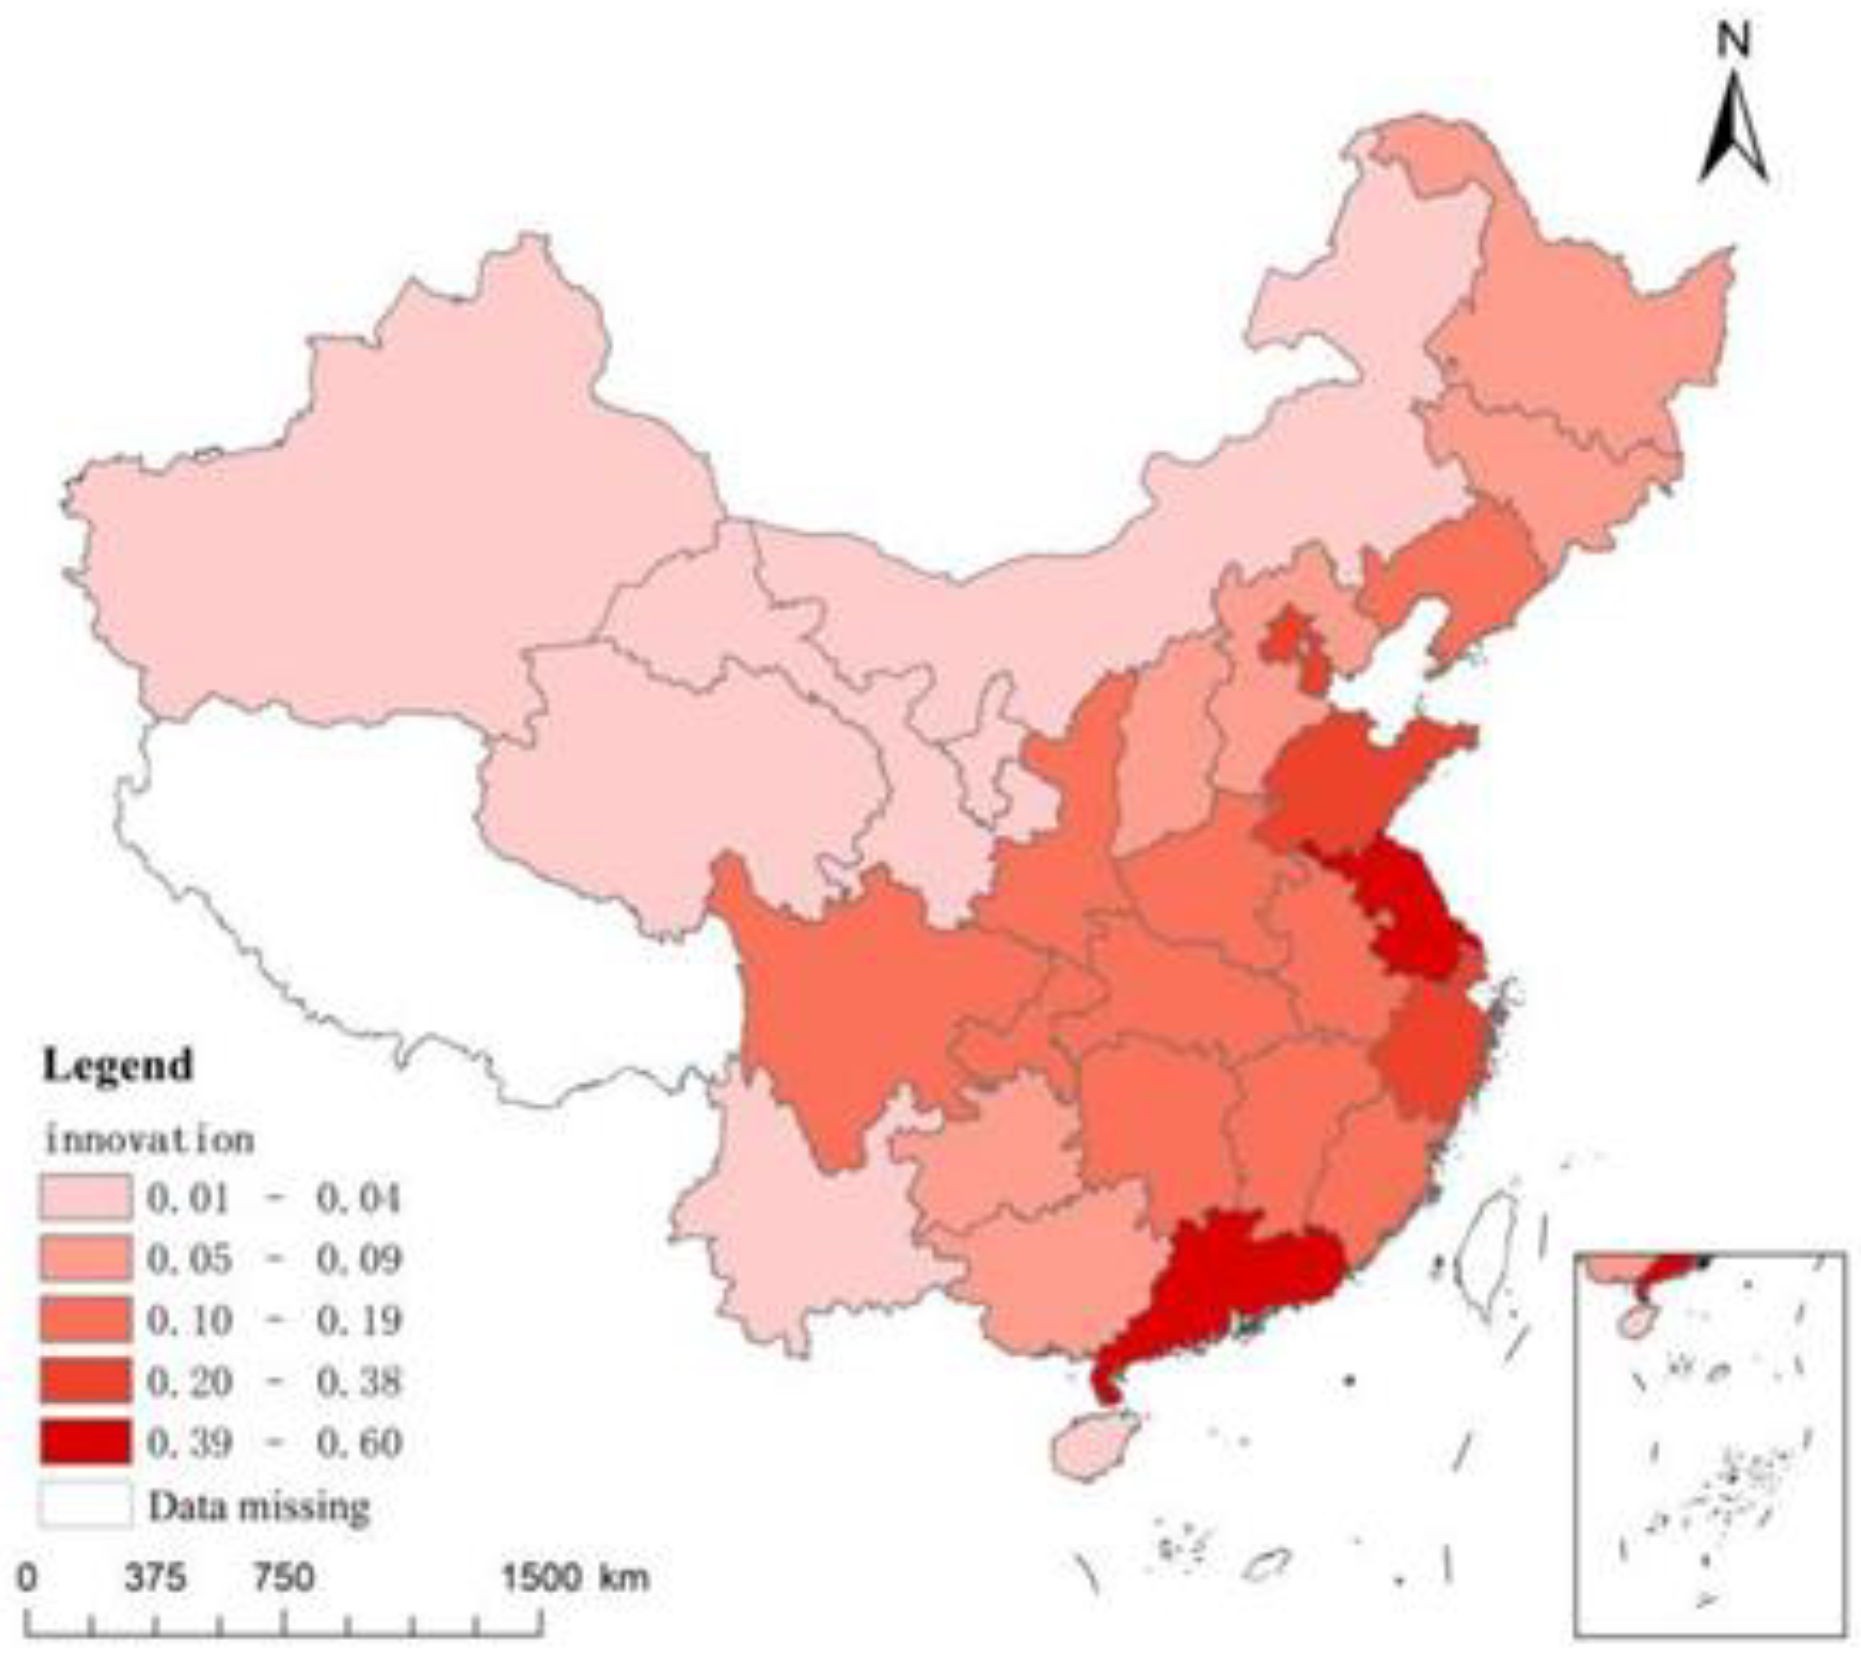
Figure 3 displays the distribution of the regional coordination development level, which generally shows ladder-like characteristics. The coordination development degree of Beijing, Jiangsu and Zhejiang is in the first echelon. Other coastal areas and the three provinces of Heilongjiang, Jilin and Liaoning are in the second echelon with good coordination development, while the central regions are in the third echelon with great room for improvement. The coordinated development of Yunnan, Guizhou, Gansu and other provinces is relatively poor.
Figure 3.
Distribution of Coordination Development in Chinese by Province.
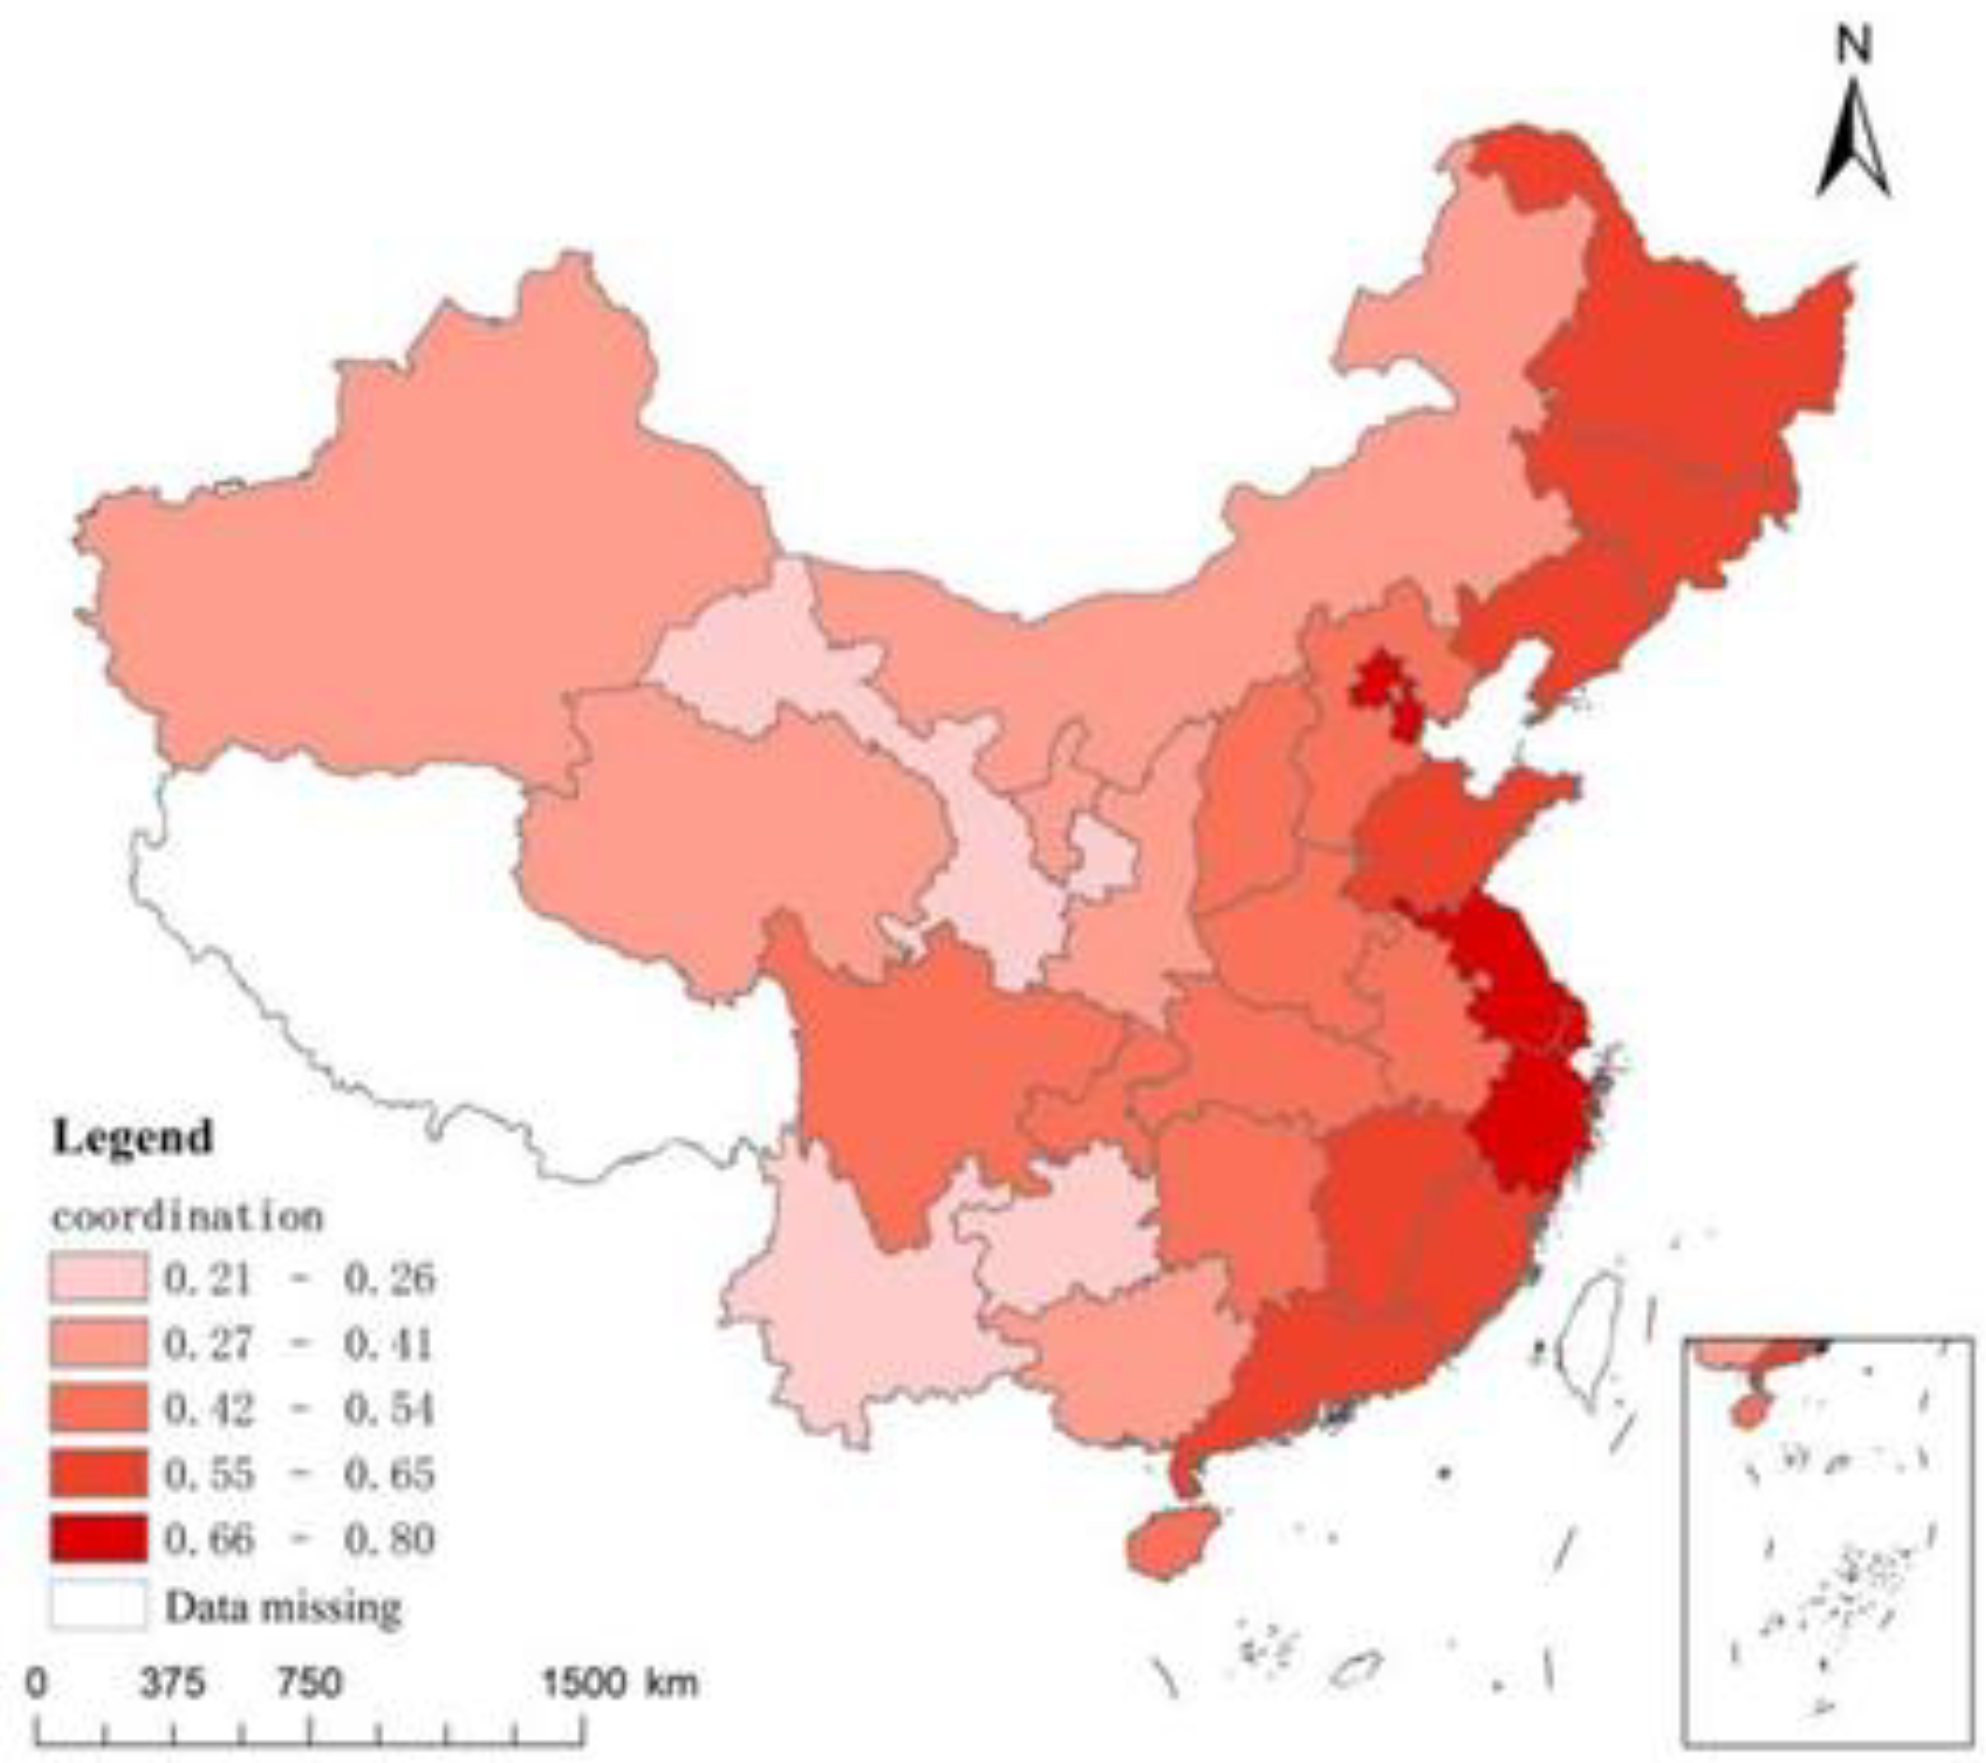
Figure 4 shows the distribution of the regional greenness development level. Beijing and the four eastern coastal provinces of Zhejiang, Jiangsu, Guangdong and Fujian are in the first tier and far ahead in greenness development. Yunnan, Chongqing, Shandong and Anhui are in the second tier, with relatively good greenness development levels. Most of the provinces in central China and Inner Mongolia, Heilongjiang and Jilin in northeast China are in the third echelon, with room for improvement. The poor level of greenness development in Shanxi, Sichuan, Qinghai, Gansu and Hebei is in urgent need of attention.
Figure 4.
Distribution of Greenness Development in Chinese by Province.
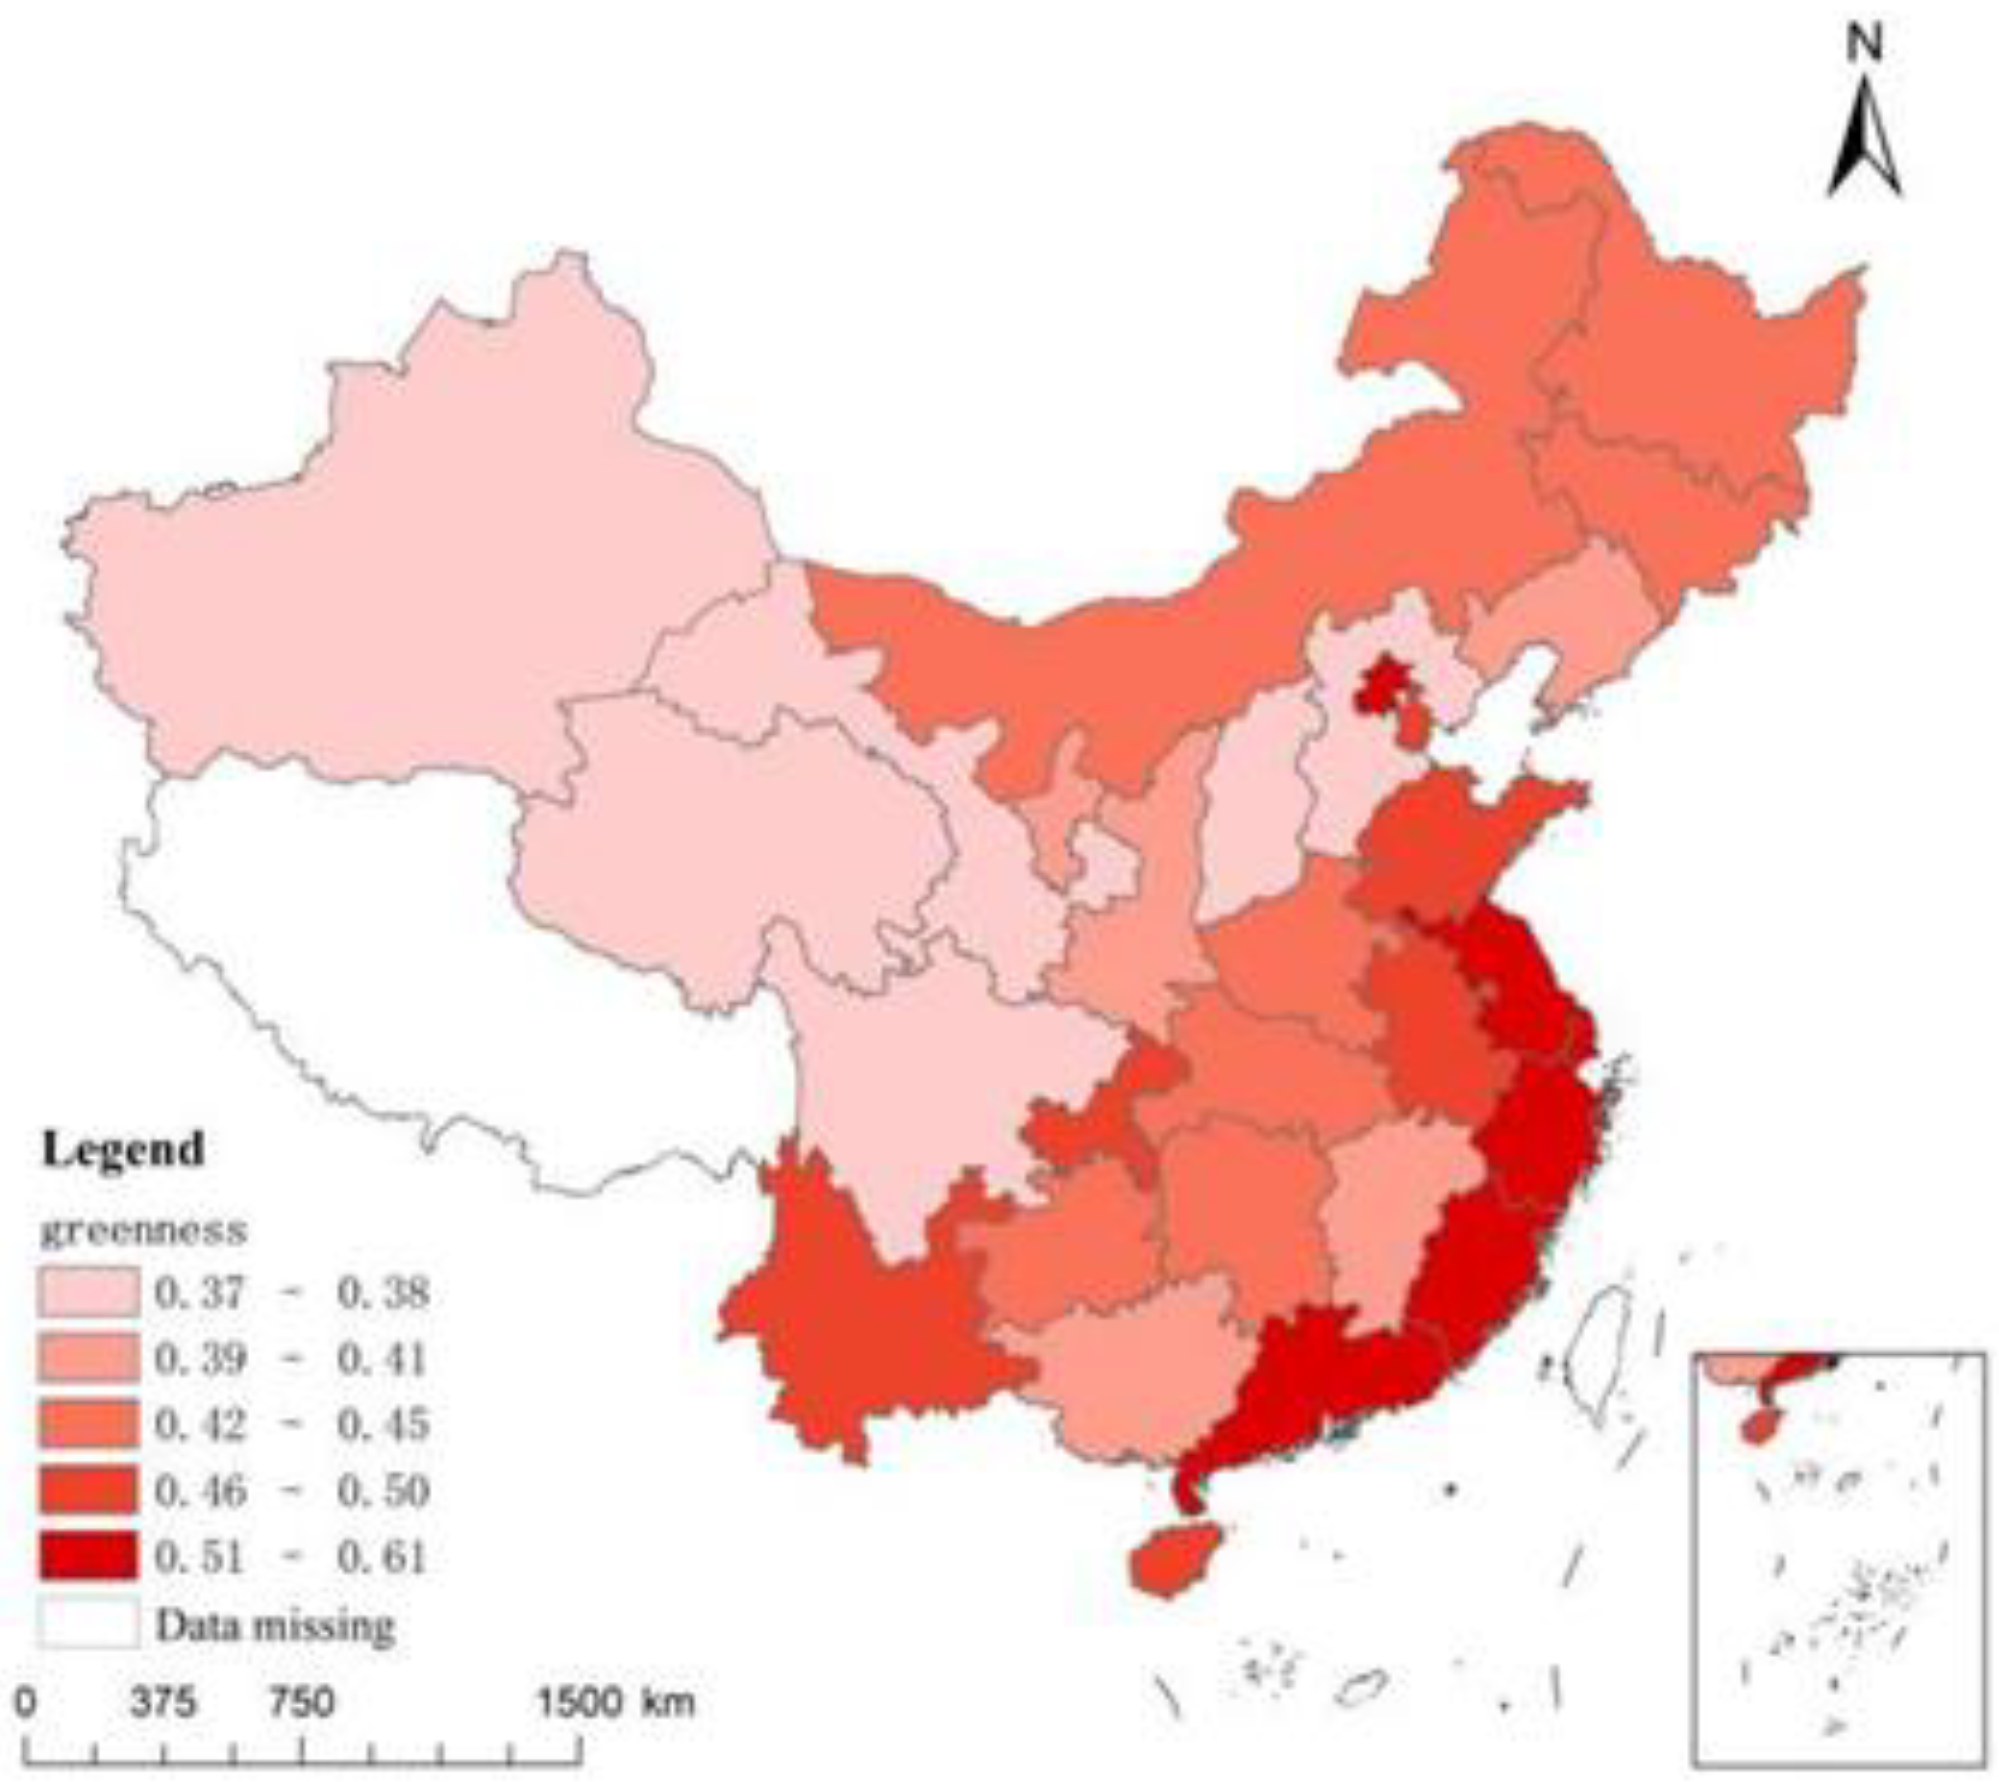
Figure 5 shows the distribution of the regional openness development level. Beijing and coastal areas are all at a relatively high level, among which Jiangsu, Guangdong and Zhejiang are the most open. The central region is slightly less open. Yunnan, Qinghai, Gansu, Guizhou, and other regions have a very low level of openness and have extremely large room for improvement.
Figure 5.
Distribution of Openness Development in Chinese by Province.
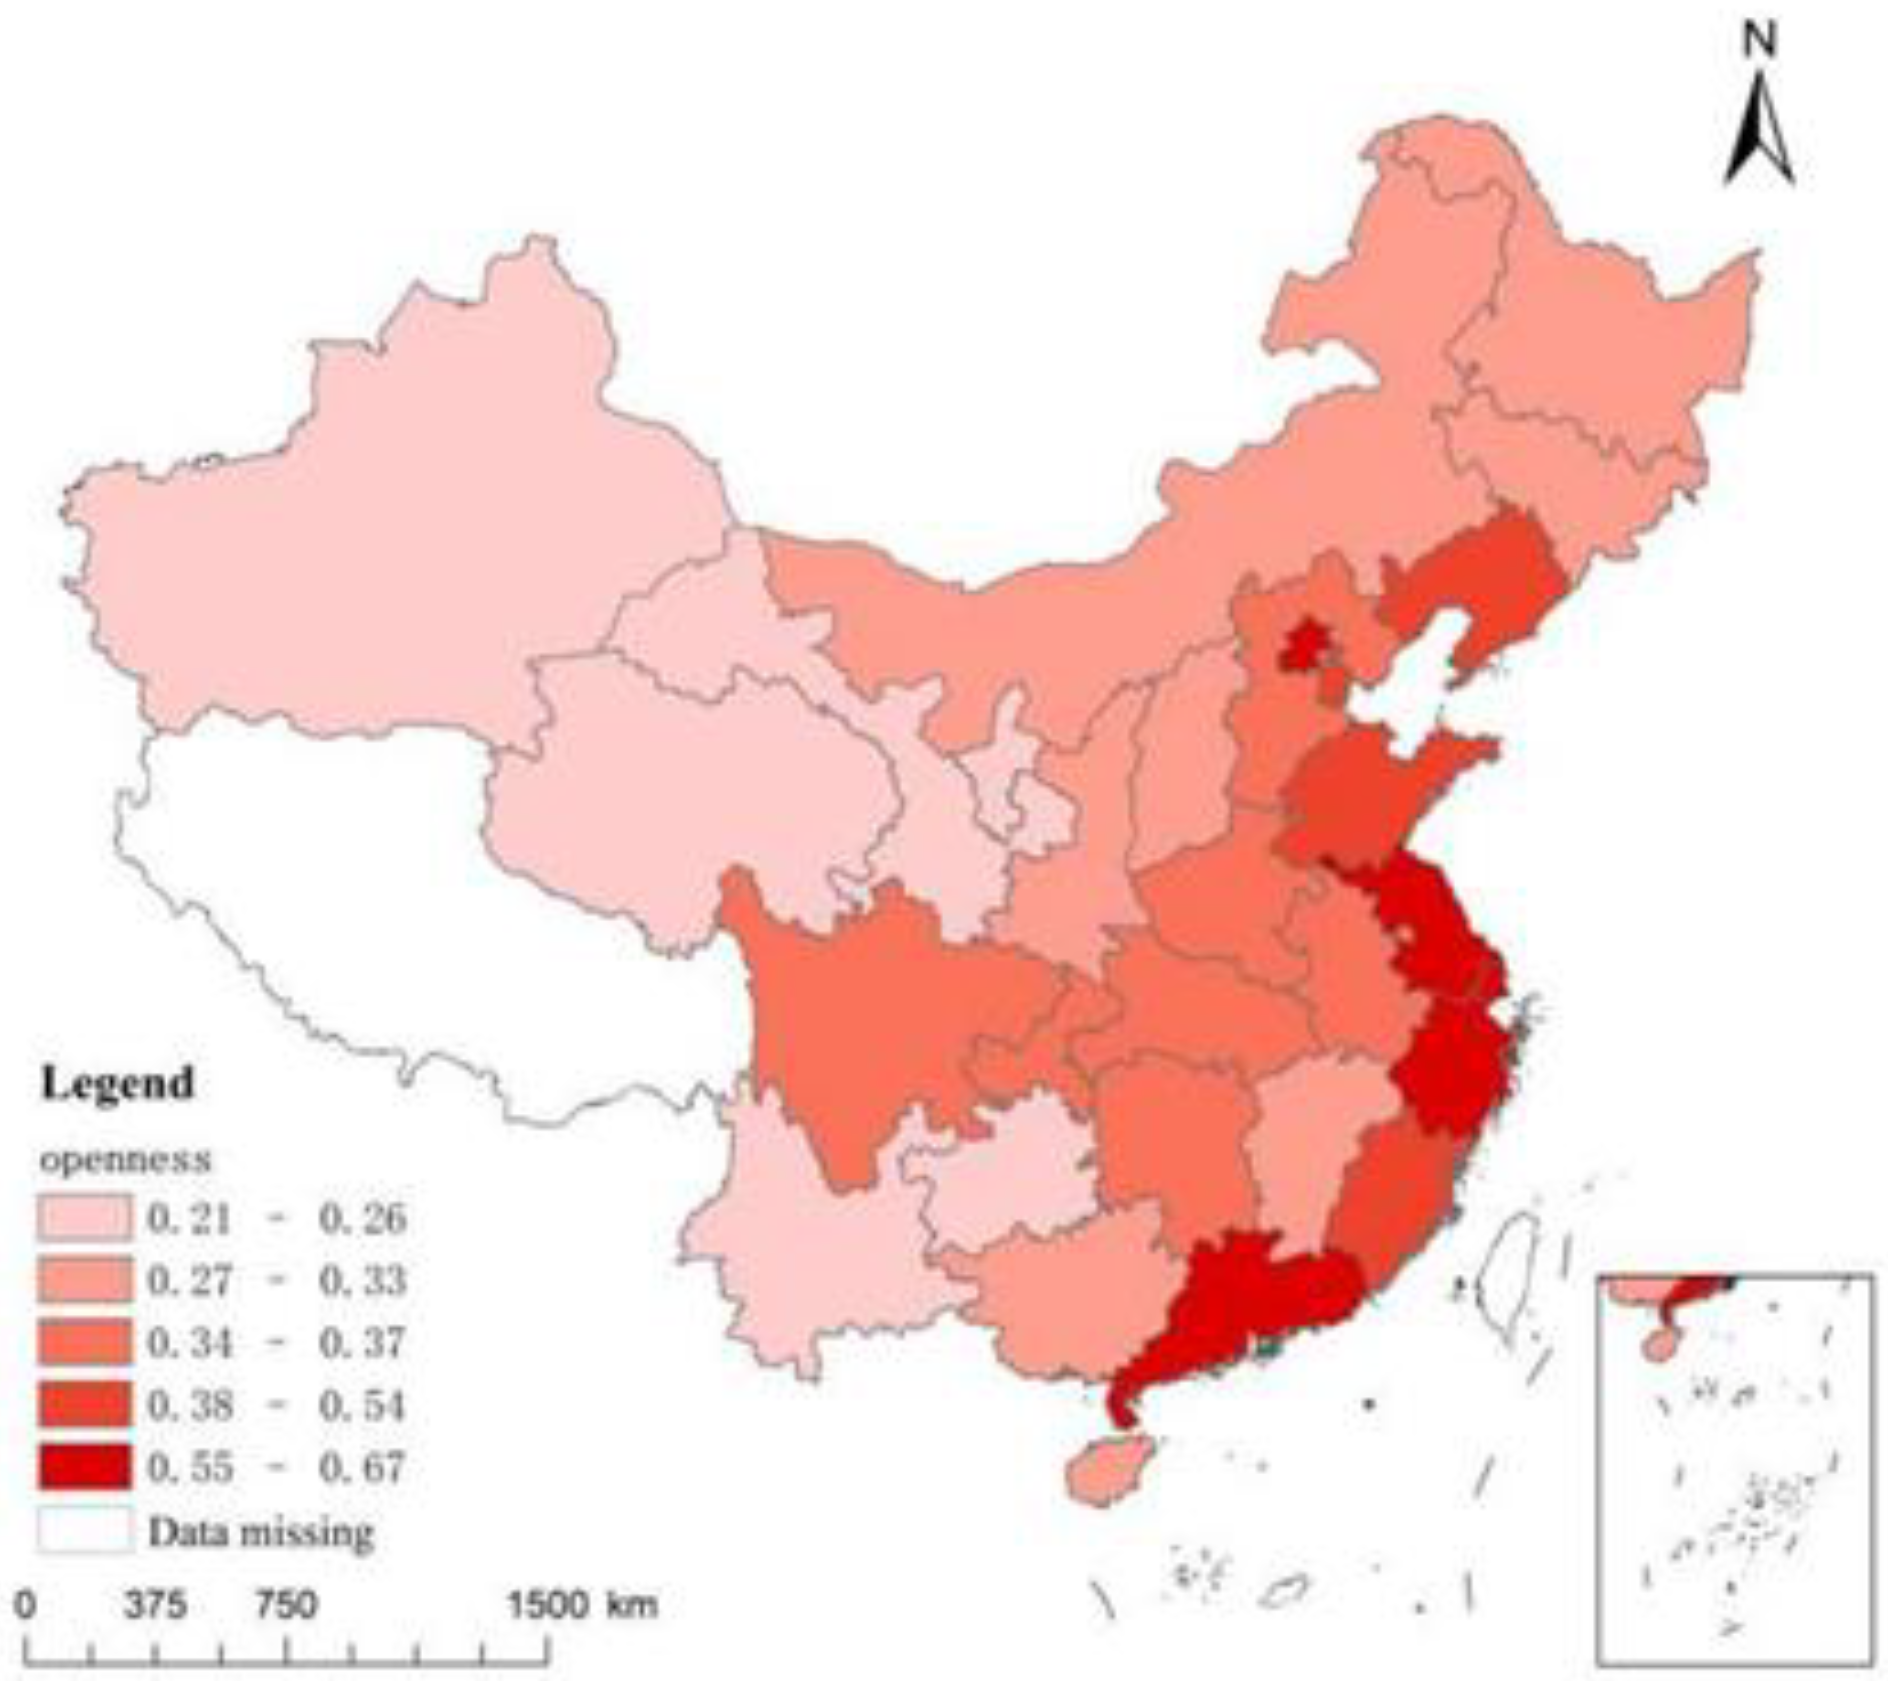
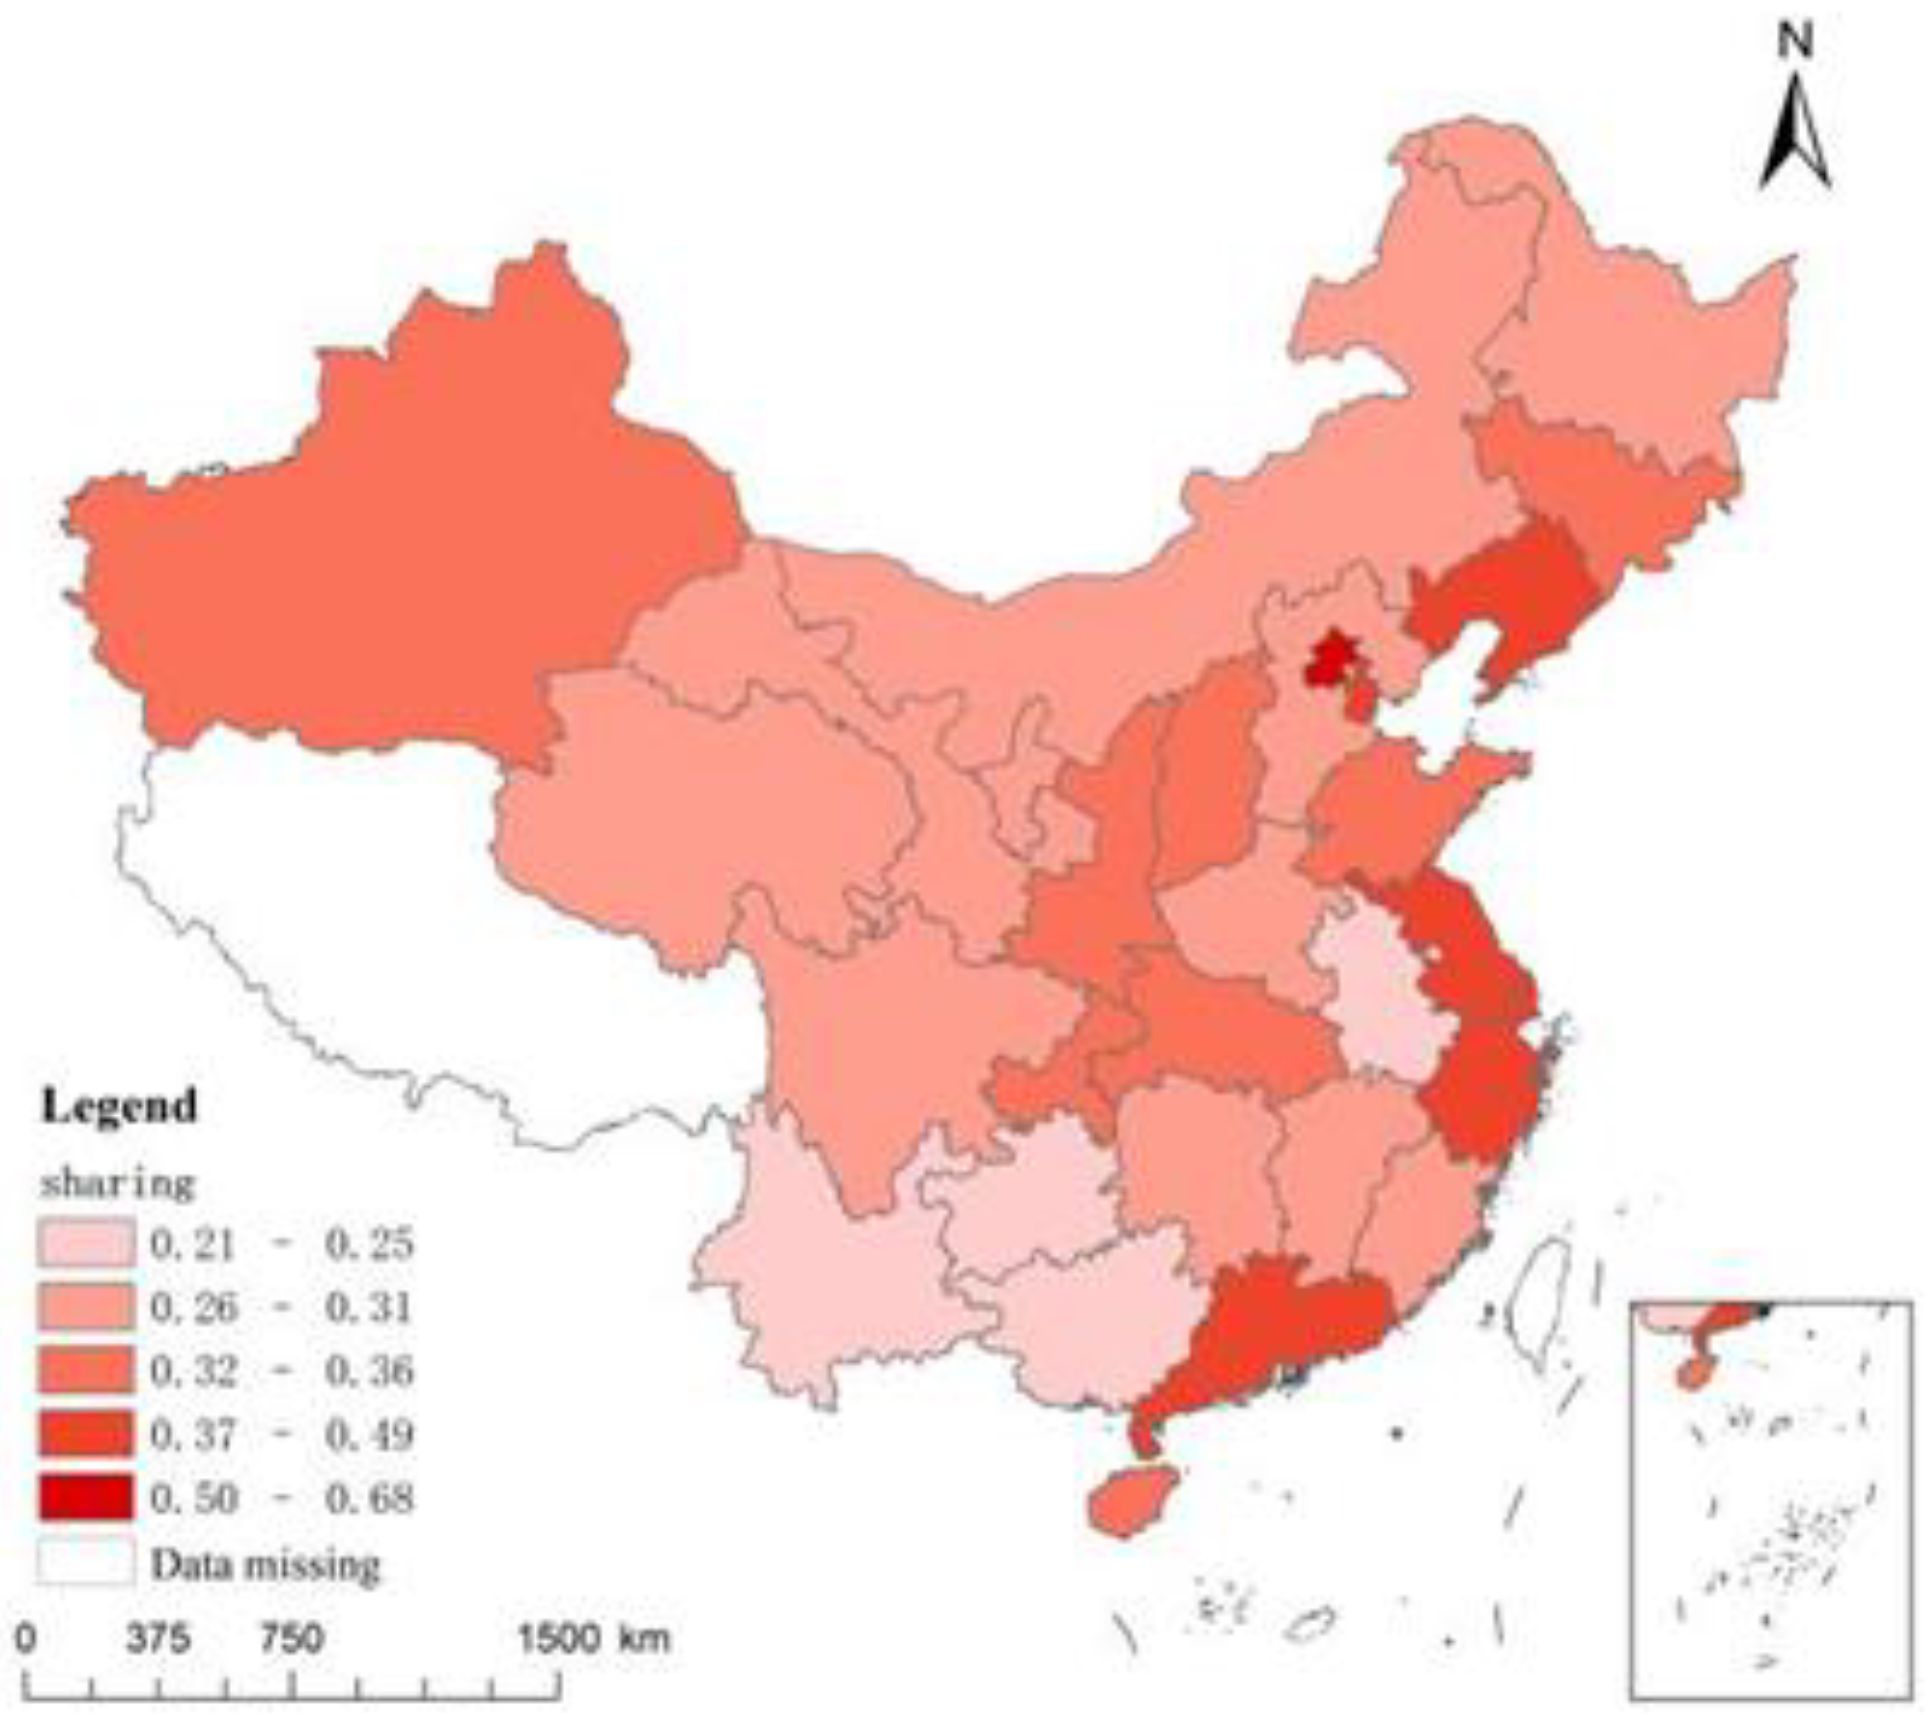
Figure 6 shows the distribution of the regional sharing development level. The provinces of Beijing, Guangdong, Jiangsu, Zhejiang and Liaoning have a high level of sharing development, while other provinces have a relatively low degree.
Figure 6.
Distribution of Sharing Development in Chinese by Province.
4.2. Baseline regression analysis
We regress Equation (1) to test the impact of people’s livelihood expenditure level on high-quality regional development. We use the random-effects model, Tobit random-effects model and stepwise fixed-effects model for testing. The expenditure on people’s livelihood has the expected positive impact on our dependent variables (see Table 3) and is statistically significant, which means that increasing expenditures on people’s livelihood within the region is a feasible way to improve regional high-quality development. This result provides empirical evidence that spending on people’s livelihood promotes high-quality development. On the one hand, a sustained increase in government investment in education and employment can effectively promote fuller and better quality employment. On the other hand, financial investment in social security and medical care can reduce people’s economic burden and improve regional coordination and sharing. Moreover, in the face of the huge impact of the epidemic, increasing spending on people’s livelihood has helped to keep the employment situation stable. Therefore, whether from the perspective of promoting economic development or maintaining employment and social stability, expenditure on people’s livelihood has an important role. Moving to the control variables, the economic growth rate (gdp) exerts a significantly negative impact. This shows that the past mode of extensive economic development with growth as the main goal is inconsistent with the denotation and requirements of high-quality development. The strategic goal of high-quality development determines that speed catch-up should give way to efficiency and quality catch-up. Currently, it can start with the transformation of the government’s goal preference function to gradually realize the transformation from catch-up government to service-oriented government. The energy consumption per unit of GDP (energy) significantly hurts high-quality regional development, suggesting that reducing the regional energy consumption level and promoting green development will help increase the quality of economic development. Therefore, on the one hand, the government should actively implement various incentive policies to promote the technological innovation of traditional industries, improve the level of greenness of industrial sectors, and increase the number of green jobs. On the other hand, it is feasible to promote the development of emerging green industries and form a comprehensive green industrial system as soon as possible. We also find strong evidence of the positive role of R&D investment (rd). Innovation is the basic driving force for economic development, and it is the general trend and necessary to continue to pay attention to innovation investment in high-quality development. The better the atmosphere of innovation (patents) is, the higher the quality of economic development, which obviously confirms that the construction of an innovation environment is a crucial driver for promoting the quality of regional development. The scale of actual foreign investment (fdi) shows a positive effect, and Model 3 passes the significance test. This shows that FDI effectively promotes high-quality regional development, but there may be a distinct utilization efficiency of foreign capital in different regions, which leads to the instability of the positive spillover effect. This implies that further strengthening the mechanism construction for win–win cooperation with foreign capital is imperative. The coefficients for population density (upd) are all positive, but most failed the significance test. This shows that the labor force, as an indispensable factor, is very important for high-quality development. Additionally, it is necessary to improve human capital and optimize the spatial distribution of the population to exploit the positive spillover effect of agglomeration areas and stimulate the demographic dividend.
Table 3.
Baseline results.
| (1) | (2) | (3) | (4) | (5) | |
| hqd | hqd | hqd | hqd | hqd | |
| ms | 0.102*** | 0.095*** | 0.067*** | 0.107*** | 0.089*** |
| (0.005) | (0.005) | (0.009) | (0.005) | (0.011) | |
| gdp | -0.073*** | -0.089*** | -0.017 | -0.066*** | -0.012 |
| (0.024) | (0.026) | (0.036) | (0.024) | (0.034) | |
| energy | -0.016** | -0.023*** | -0.011* | -0.012 | -0.002 |
| (0.007) | (0.007) | (0.006) | (0.008) | (0.006) | |
| rd | 0.002*** | 0.002*** | 0.001*** | 0.002*** | 0.000 |
| (0.001) | (0.001) | (0.000) | (0.001) | (0.000) | |
| patent | 0.010*** | 0.011*** | 0.006*** | 0.010*** | 0.004*** |
| (0.001) | (0.001) | (0.001) | (0.001) | (0.001) | |
| fdi | -0.008 | 0.020 | 0.050** | -0.023 | 0.022 |
| (0.023) | (0.024) | (0.019) | (0.023) | (0.019) | |
| upd | 0.034 | 0.021 | 0.003 | 0.040* | 0.019 |
| (0.023) | (0.024) | (0.019) | (0.024) | (0.019) | |
| constant | -0.303*** | -0.242*** | -0.093* | -0.337*** | -0.234*** |
| (0.044) | (0.043) | (0.053) | (0.044) | (0.063) | |
| Individual fixed | NO | NO | NO | YES | YES |
| Time fixed | NO | NO | YES | NO | YES |
| 0.067*** | |||||
| (0.009) | |||||
| 0.022*** | |||||
| (0.001) | |||||
| R2 | 0.946 | 0.911 | 0.948 | ||
| Wald Test | 3684.90*** | 3141.59*** | |||
| Observations | 390 | 390 | 390 | 390 | 390 |
Notes: The values in brackets are standard deviations. ***, ** and * indicate that the estimated coefficients are significant at the confidence levels of 1%, 5%, and 10%, respectively.
To guarantee the robustness of the baseline results obtained in the paper, robustness checks are conducted from the following two aspects. First, we conduct a robustness check from the perspective of high-quality development sub-dimensions. Furthermore, considering endogeneity problems that may result from reverse causation, we take people’s livelihood expenditure with a lag period as an instrumental variable and use the GMM estimation method and the 2SLS method to test the endogeneity. Moreover, we take people’s livelihood expenditure with a lag period as the core independent variable in formula (1) to partially mitigate the endogeneity problems caused by reverse causality (see Table 4). Models 1 to 5 are regression results with five second-dimension indicators of the high-quality development index as dependent variables respectively. The coefficient of people’s livelihood expenditure on the sub-dimension development index is always positive and passes the 1% significance test. Only the impact on the level of regional openness is not significant. This shows that the increased emphasis on people’s livelihood expenditure has an all-round role in pushing forward regional development. The improvement of the quality of people’s livelihood services has enabled the improvement of the quality of the growth of the domestic market; nevertheless, the impact on the level of opening up is not significant. These results indicate that in the process of promoting the formation of the dual-cycle pattern, the primary role of people’s livelihood services has not been effectively played, and the impact of foreign investment has not appeared. The possible reason is that at present, to promote high-quality development through greater opening-up, the priority is to continue to deepen institutional reform in foreign trade and investment and accelerate the development of new forms and patterns of opening-up, such as granting greater decision-making power to free trade pilot zones and establishing more comprehensive cross-border e-commerce pilot zones. Comparatively speaking, expenditure on people’s livelihood has a greater marginal effect on promoting regional innovation and sharing development, indicating that the improvement of the quality of basic services for people’s livelihood can effectively improve the regional productivity level and the regional common prosperity index based on optimizing the soft environment for regional development. In addition, to alleviate endogeneity problems in the fiscal regression analysis, this paper further uses the level of people’s livelihood expenditure with a lag period as an instrumental variable and uses the GMM estimation method and the 2SLS estimation method to re-regress Equation (1). The results of Models 6 and 7 show that livelihood expenditure still exerts a positive effect. Column (8) is the regression result of taking the lag period of the variable ms as the core explanatory variable in formula (1). The coefficient of variable ms is still significantly positive, indicating that endogeneity problems do not affect the conclusions of this paper. In summary, Hypothesis 1a is verified.
Table 4.
Robustness checks and endogenous test.
| (1) | (2) | (3) | (4) | (5) | (6) | (7) | (8) | |
| Innovation | Coordination | Greenness | Openness | Sharing | hqd | hqd | hqd | |
| ms | 0.142*** | 0.091*** | 0.087*** | 0.020 | 0.102*** | 0.031*** | 0.036*** | 0.089*** |
| (0.025) | (0.021) | (0.017) | (0.014) | (0.016) | (0.005) | (0.005) | (0.011) | |
| constant | -0.789*** | -0.131 | -0.127 | 0.090 | -0.328*** | 0.258*** | 0.218*** | -0.227*** |
| (0.147) | (0.122) | (0.100) | (0.084) | (0.094) | (0.041) | (0.042) | (0.065) | |
| control | YES | YES | YES | YES | YES | YES | YES | YES |
| Individual fixed | YES | YES | YES | YES | YES | YES | YES | YES |
| Time fixed | YES | YES | YES | YES | YES | YES | YES | YES |
| Observations | 390 | 390 | 390 | 390 | 390 | 360 | 360 | 360 |
| R2 | 0.561 | 0.809 | 0.845 | 0.938 | 0.939 | 0.807 | 0.806 | 0.945 |
Notes: The values in brackets are standard deviations. ***, ** and * indicate that the estimated coefficients are significant at the confidence levels of 1%, 5%, and 10%, respectively.
4.3. Heterogeneity analysis
To verify Hypothesis 1b, that is, the impact of government people’s livelihood expenditure growth on high-quality regional development has temporal and spatial heterogeneity, we conducts sub-sample regression from the two dimensions of time and region. In 2006, the Outline of the “11th Five-Year Plan” put forward development guidelines such as "focusing on innovative development models" and "improving the quality of development"; in 2012, the report of the 18th CPC National Congress further announced high-quality development strategies such as "innovation-driven development". Therefore, we divide the sample interval into two periods, 2006-2012 and 2013-2018, when testing the temporal heterogeneity of the impact of livelihood expenditures and use a two-way fixed effects model for verification. Table 5 shows the results. We find that the coefficients of expenditure on people’s livelihood in Models 1-2 are both significantly positive, signifying that the promotion impact of the increased emphasis on livelihood infrastructure has a stable time dimension. On the other hand, in different periods, there are differences in the promotion effect of increasing people’s livelihood expenditures. During the period from 2006 to 2012, the promotion effect of the increase in expenditures on people’s livelihoods is weak, but during the period from 2013 to 2018, the promotion effect of the rise in spending on people’s livelihoods is more prominent. The difference in effect may be due to the different historical development stages, the difference in the government’s emphasis on people’s livelihood infrastructure, and the difference in the proportion of people’s livelihood-related industries in regional economic development. After the 18th National Congress of the Communist Party of China, China attached more importance to the improvement and construction of education, medical care, social security, and employment, focusing on improving the poor quality of people’s livelihood and building a soft environment for high-quality development. Livelihood issues are increasingly important. In other words, the regression results of temporal heterogeneity obtained in Table 5 are consistent with reality and thus with Hypothesis 1b.
Table 5.
Analysis of temporal heterogeneity.
| 2006-2012 | 2013-2018 | |
| hqd | hqd | |
| ms | 0.019* | 0.133*** |
| (0.010) | (0.024) | |
| constant | 0.153** | -0.477*** |
| (0.060) | (0.165) | |
| control | YES | YES |
| Individual fixed | YES | YES |
| Time fixed | YES | YES |
| R2 | 0.936 | 0.908 |
| Observations | 210 | 180 |
Notes: The values in brackets are standard deviations. ***, ** and * indicate that the estimated coefficients are significant at the confidence levels of 1%, 5%, and 10%, respectively.
Then, we further verify whether the promoting effect of people’s livelihood expenditure varies with different locations. We perform group regression on the three different regions, and the results are shown in Table 6. First, expenditure on people’s livelihood has exerted a significant positive impact on the high-quality development of all provinces located in eastern, central and western China. Second, comparing the coefficients of the main explanatory variable ms, it can be seen that the degree of effect on eastern, central and western China weakens in turn. This shows that relatively developed areas, based on certain advantages in economic development, attach more importance to the improvement of the contribution of people’s livelihood infrastructure to regional development and that the degree of correlation between people’s livelihood services and regional economic and social development is higher. This region is well in accordance with the people-oriented high-quality development strategy. However, there is room for further improvement in the correlation between people’s livelihood construction and regional development in relatively underdeveloped areas. In summary, the sub-sample regression results of the time dimension and the regional dimension jointly prove that there are spatiotemporal differences in the positive promoting effect of people’s livelihood expenditure level, and Hypothesis 1b is verified.
Table 6.
Analysis of regional heterogeneity.
| (The Eastern) | (The Central) | (The Western) | |
| hqd | hqd | hqd | |
| ms | 0.093*** | 0.070** | 0.061*** |
| (0.023) | (0.027) | (0.014) | |
| constant | -0.257* | -0.134 | -0.044 |
| (0.132) | (0.150) | (0.075) | |
| control | YES | YES | YES |
| Individual fixed | YES | YES | YES |
| Time fixed | YES | YES | YES |
| R2 | 0.937 | 0.978 | 0.974 |
| Observations | 143 | 104 | 143 |
Notes: The values in brackets are standard deviations. ***, ** and * indicate that the estimated coefficients are significant at the confidence levels of 1%, 5%, and 10%, respectively.
4.4. Analysis of the mediating effect
As far as the baseline analysis is concerned, the increase in people’s livelihood expenditure has a significant positive effect on high-quality development, and whether there is a mediating effect on the level of residents’ consumption needs to be verified. To further test the transmission mechanism of the effect of people’s livelihood expenditure and verify whether the increase in the degree of attention given to the infrastructure and services of people’s livelihood will activate the domestic demand market by stimulating regional consumption and improving the consumption level of residents, thus promoting regional development quality, this paper adopts the intermediary effect step-by-step analysis method, returning to formulas (2) and (3). The results are shown Table 7. We analyze them in combination with baseline regression results. We observe a significant positive correlation between expenditure on people’s livelihood and regional consumption level, and the ratio of the intermediary effect to the total effect is 0.2427; that is, the consumption level of residents could explain 24.27% of the impact of expenditure on people’s livelihood on high-quality development. When taking the development index of coordination, sharing and openness as the dependent variable respectively, the coefficients of residents’ consumption level are all significantly positive, signifying that people’s livelihood expenditure can improve regional coordination, sharing, and openness by stimulating regional consumption levels. The enhancements in coordination and sharing originate from the construction of people’s livelihood infrastructure. By augmenting the intensity of people’s livelihood expenditures, the government has effectively relieved fundamental living pressures (e.g., education, employment, social security and employment), increased the actual income level of residents, and reduced the motivation to save. A good soft environment guides the inflow of external funds and factors, effectively enhancing the openness of regional development. Consumption, as one of the troika, plays a key role in promoting economic growth. However, due to the impact of the epidemic, household consumption is currently deeply depressed. The above results provide useful policy enlightenment. The measures taken by governments to promote the recovery and stability of consumption by increasing expenditure on people’s livelihood are practical and effective, which can also generate lasting impetus for the economy. From the further mediating effect test results, the Sobel test and Bootstrap test both favor the existence of the mediation effect. The above results hold Hypothesis 2.
Table 7.
Analysis of the mediating effect.
| (1) | (2) | (3) | (4) | (5) | (6) | (7) | |
| com | hqd | Innovation | Coordination | Greenness | Openness | Sharing | |
| ms | 0.472*** | 0.081*** | 0.088*** | 0.075*** | 0.094*** | 0.066*** | 0.098*** |
| (0.034) | (0.006) | (0.013) | (0.013) | (0.009) | (0.010) | (0.010) | |
| com | 0.055*** | 0.007 | 0.067*** | -0.010 | 0.107*** | 0.101*** | |
| (0.008) | (0.017) | (0.016) | (0.011) | (0.012) | (0.013) | ||
| constant | -2.163*** | -0.219*** | -0.524*** | -0.056 | -0.177*** | -0.206*** | -0.375*** |
| (0.275) | (0.044) | (0.093) | (0.088) | (0.060) | (0.067) | (0.070) | |
| control | YES | YES | YES | YES | YES | YES | YES |
| Individual fixed | YES | YES | YES | YES | YES | YES | YES |
| Time fixed | YES | YES | YES | YES | YES | YES | YES |
| R2 | 0.897 | 0.922 | 0.529 | 0.713 | 0.841 | 0.886 | 0.901 |
| Observations | 390 | 390 | 390 | 390 | 390 | 390 | 390 |
| Sobel test | 0.026*** | 0.003 | 0.031*** | -0.005 | 0.050*** | 0.048*** | |
| (0.004) | (0.009) | (0.008) | (0.005) | (0.007) | (0.007) | ||
| Bootstrap test | 0.026*** | 0.003 | 0.031*** | -0.005 | 0.050*** | 0.048*** | |
| (0.004) | (0.011) | (0.007) | (0.006) | (0.009) | (0.005) |
Notes: The values in brackets are standard deviations. ***, ** and * indicate that the estimated coefficients are significant at the confidence levels of 1%, 5%, and 10%, respectively.
4.5. Analysis of the moderating effect
The advancement of high-quality regional economic development is closely accompanied by the urbanization process, which obviously changes with different periods and different regions. Therefore, to further test how urbanization level affects the role of people’s livelihood level on regional high-quality development, we select the moderating effect model to regress Equation (1), Equation (4), and Equation (5) (see Table 8). Models 2-3 test the relationship between urbanization level and regional high-quality development, as well as its moderating effect on the promotion effect of people’s livelihood fiscal spending. The results indicate that urbanization can significantly promote regional high-quality development, revealing that compared with the possible adverse effects of a blind expansion of urbanization, its positive role as a catalyst to promote regional economic development is more prominent. This proves the necessity of promoting urbanization while promoting high-quality regional development. Hypothesis 3a is verified. The coefficient of the interaction term in Model 3 and Model 4 (after decentralized processing) is the most noteworthy element. The coefficients are significantly positive in both models. After controlling the multiplication term, the positive promotion effect of people’s livelihood expenditure is enhanced. This shows that urbanization plays an effective regulating role and can strengthen the marginal promoting effect of people’s livelihood expenditure, which verifies Hypothesis 4. Therefore, the government should continue to promote urbanization, take the reform of the system and mechanism as the driving force, and fully release the huge potential of domestic demand in urbanization around the goals of ensuring people’s livelihood and promoting high-quality development to provide a lasting and strong driving force for sustained development.
Table 8.
Moderating effect of urbanization.
| (1) | (2) | (3) | (4) | |
| hqd | hqd | hqd | hqd | |
| ms | 0.089*** | 0.046*** | 0.016 | 0.056*** |
| (0.011) | (0.011) | (0.013) | (0.011) | |
| urb | 0.540*** | 0.102 | 0.102 | |
| (0.063) | (0.118) | (0.118) | ||
| urb×ms | 0.074*** | |||
| (0.017) | ||||
| c_urb×ms | 0.074*** | |||
| (0.017) | ||||
| constant | -0.234*** | -0.268*** | -0.069 | -0.069 |
| (0.063) | (0.057) | (0.072) | (0.072) | |
| control | YES | YES | YES | YES |
| Individual fixed | YES | YES | YES | YES |
| Time fixed | YES | YES | YES | YES |
| R2 | 0.948 | 0.957 | 0.960 | 0.960 |
| Observations | 390 | 390 | 390 | 390 |
Notes: The values in brackets are standard deviations. ***, ** and * indicate that the estimated coefficients are significant at the confidence levels of 1%, 5%, and 10%, respectively.
5. Conclusions and Implications
Adhering to the concept of people-centered development and ensuring people’s livelihood are the original intention and ultimate objective of high-quality regional development. Starting from the construction of a high-quality development indicator evaluation system, the TOPSIS-entropy method is used to measure the quality development level of 30 administrative provinces in China from 2006 to 2018. Empirical testing, including expenditure on people’s livelihood, shows that it is a driving force for high-quality regional development, with varying effects across locations and periods. The study highlights the importance of regional consumption levels as a transmission channel and finds a positive moderating effect of urbanization on fiscal spending. These results are consistently robust across different estimation methods and development subdimensions.
These findings are relevant for policies that aim to achieve sustainable and high-quality development. First, The government must prioritize the basic construction of people’s livelihood by developing plans that align with economic stages and laws. It should increase financial expenditures on education, healthcare, social security, and employment services, improve their quality, and create a conducive environment for high-quality regional development. Local governments should emphasize the positive role of people’s livelihood expenditure in different regions and stages of development. Targeted policies should be introduced and implemented, while ensuring people’s livelihood is guaranteed and improved in the eastern, central, and western regions of the country.
Second, to improve regional economic structures and development quality, the government should focus on improving residents’ consumption tendencies and cultivating new consumption patterns. Local governments should increase actual income levels and reduce precautionary savings by promoting employment, improving social security policies, and national planning for basic old-age insurance. They should also guide residents in improving consumption quality, adjusting consumption structure, and cultivating new forms of consumption to build a high-quality internal market and drive regional development.
Third, local governments should accelerate new-type urbanization to improve resource utilization efficiency through population agglomeration. Local governments should also attach importance to the strengthening effect of population accumulation during urbanization on the promotion of high-quality development of regions by government spending on people’s livelihood. In addition, the government should utilize the construction of a favorable environment for people’s livelihood to improve the efficiency and quality of government services and enhance residents’ happiness during the population agglomeration process, promoting coordinated high-quality regional development.
Although the study allows us to shed light on the role of livelihood expenditure on high-quality development, we are admittedly unable to control for unobservable heterogeneity at the regional and sectoral levels. Moreover, our study selects a country as the object of observation, and analysis using cross-country data can deliver comprehensive and in-depth insights based on different stages of economic development and social characteristics. Another promising area of research that can be investigated is the analysis of cross-regional spatial spillovers of livelihood expenditure, such as migration and capital mobility. The infrastructure of people’s livelihood affects the well-being and life satisfaction of residents, thus affecting the decision-making of migration, and the change in population size further leads to changes in the scale of the local market. Considering the role of market scale and demand potential on enterprise production layout, this may lead to cross-regional reallocation of capital.
Funding
This research was supported by The National Social Science Foundation of China (The Funding Number: 22CJL033).
References
- Cheng, Cecilia, Wang,Hsin-yi, & Ebrahimi,Omid V. Adjustment to a “New Normal:” Coping Flexibility and Mental Health Issues During the COVID-19 Pandemic. Frontiers in Psychiatry 2021, 12. [CrossRef]
- Luo, H.; Qu, X. Export Trade, Absorptive Capacity, and High-Quality Economic Development in China. Systems 2023, 11, 54. [Google Scholar] [CrossRef]
- Thakker V, Bakshi B R. Toward sustainable circular economies: A computational framework for assessment and design. Journal of Cleaner Production 2021, 295, 126353. [CrossRef]
- Atkinson, R. D., & Wu, J. J. The 2017 state new economy index. Ssrn Electronic Journal 2017. [CrossRef]
- P Bolcárová, & KolosTa, S. Assessment of sustainable development in the eu 27 using aggregated sd index. Ecological Indicators 2015, 48, 699–705. [CrossRef]
- Held, B., Rodenhaeuser, D., Diefenbacher, H., & Zieschank, R. The national and regional welfare index (nwi/rwi): redefining progress in germany. Ecological Economics 2018, 145, 391–400. [CrossRef]
- Pearce DW, Turner RK, Turner RK. Economics of natural resources and the environment. Johns Hopkins University Press; 1990.
- Jin Bei. Study on the “High-Quality Development” Economics. China Industrial Economics 2018, 5-18. Available online at: https://www.emerald.com/insight/content/doi/10.1108/CPE-10-2018-016/full/html?utm_source=TrendMD&utm_medium=cpc&utm_campaign=China_Political_Economy_TrendMD_1.
- M Mlachila, R Tapsoba, SJA Tapsoba. A Quality of Growth Index for Developing Countries: A Proposal. Social Indicators Research 2017, 134, 675–710. [CrossRef]
- Butkiewicz, J. L., & Yanikkaya, H. Institutional quality and economic growth: maintenance of the rule of law or democratic institutions, or both? Economic Modelling 2016, 23, 648–661. [CrossRef]
- Khalfaoui H, Derbali A. Quality of human capital accumulation, higher education graduates and economic growth: a comparative analysis between BRICS, Southeast Asian and MENA countries. Human Systems Management 2020, 40, 723–735. [CrossRef]
- Meng, JL. Economic Growth Effect of Public Health Investment and Its Impact on Living Environment. Journal of environmental and public health 2022, 2192255. [Google Scholar] [CrossRef]
- Chen, Lingming, Wenzhong Ye, Congjia Huo, & Kieran James. Environmental Regulations, the Industrial Structure, and High-Quality Regional Economic Development: Evidence from China. Land 2020, 9, 517. [CrossRef]
- Liu, P., Zhao, Y., Zhu, J., and Yang, C. (2022). Technological industry agglomeration, green innovation efficiency, and development quality of city cluster. Green Finance 2013, 4, 411–435. [CrossRef]
- Yaya, Keho. The impact of trade openness on economic growth: The case of Cote d’Ivoire. Cogent Economics & Finance 2017, 5. [CrossRef]
- Bekhet, H. A., & Latif, N. The impact of technological innovation and governance institution quality on malaysia’s sustainable growth: evidence from a dynamic relationship. Technology in Society 2018, 54, 27–40. [CrossRef]
- Gangqiang Yang, Yongyu Xue. & Yuxi Ma. Social Organization Participation, Government Governance and the Equalization of Basic Public Services: Evidence from China. International Journal of Environmental Research and Public Health 2019, 16, 2996. [CrossRef]
- Hari Nugroho, N. Haidy Ahmad Pasay, Arie Damayanti, Maddaremmeng A. Panennungi. Institutions as the Main Determinant in Economic Growth. Etikonomi 2019, 18, 13–28. [Google Scholar] [CrossRef]
- Sineviciene, L. , & Vasiliauskaite, A. Fiscal policy interaction with private investment: the case of the baltic states. Inzinerine Ekonomika Engineering Economics 2012, 23, 233–241. [Google Scholar] [CrossRef]
- Guo S J, Jiang T Y. China’s "New Normal": from Social Control to Social Governance. Journal of Chinese Political Science 2017, 22, 327–340. [CrossRef]
- Liu, J. Y. Analysis of the synergistic impacts of public services expenditure on economic growth and social equity. International Conference on Management Science & Engineering. IEEE 2013. [Google Scholar] [CrossRef]
- Easterly W, Rebelo S T. Fiscal Policy and Economic Growth: An Empirical Investigation. Journal of Monetary Economics 1993, 32, 417–458. [CrossRef]
- Eriksson, C. . Is There a Trade-Off between Employment and Growth? Oxford Economic Papers-New Series 1997, 49, 77–88. [Google Scholar] [CrossRef]
- Bellettini G, Ceroni C B. Social security expenditure and economic growth: an empirical assessment. Research in Economics 2000, 54, 249–275. [CrossRef]
- Sugata, Ghosh, Udayan, et al. Fiscal policy, long-run growth, and welfare in a stock-flow model of public goods. Canadian Journal of Economics/Revue Canadienne Déconomique 2004, 27, 742–756. [CrossRef]
- Bosi, S., & Laurent, T. Health, growth and welfare: a theoretical appraisal of the long-run impact of medical R&D. Asia-Pacific Journal of Accounting & Economics 2011, 18. [CrossRef]
- Railaite, R., Ciutiene, R. The Impact of Public Health Expenditure on Health Component of Human Capital. Inzinerine Ekonomika Engineering Economics 2020, 31, 371–379. [CrossRef]
- Li Zhuangyuan. The Role of Public Services in China’s Economic Growth: Based on Population Structure and Population Aggregation. Population Research Available online at: https://kns.cnki.net/kcms/detail/detail.aspx?dbcode=CJFD&dbname=CJFDLAST2020&filename=RKYZ202005007&uniplatform=NZKPT&v=5iSLgmb6sLgl6EkycTE5UZlYR2Gc-54CifEIFOxat3FEMEyAXvIBcOGpPTrj7nEX. 2020, 44, 92–107.
- Musgrave, R.A. The Theory of Public Finance; McGraw-Hill Book Company: New York, 1959. [Google Scholar] [CrossRef]
- Modigliani F, Shi L C. The Chinese Saving Puzzle and the Life-Cycle Hypothesis. Journal of economic literature 2004, 42, 145–170. [CrossRef]
- Chao, C., C., Laffargue, J., & P., et al. The chinese saving puzzle and the life-cycle hypothesis: a revaluation. China Economic Review 2011, 22, 108–120. [CrossRef]
- Kassiola, J.J. Coordinated Rural–Urban Development in China: a New Social Spatial Reorganization Plan for Urbanization, Migration, and Rural Development. Journal of Chinese Political Science 2017, 22, 77–95. [Google Scholar] [CrossRef]
- Siuskaite, D., Pilinkiene, V., Zvirdauskas, D. The Conceptualization of the Sharing Economy as a Business Model. Inzinerine Ekonomika Engineering Economics 2019, 30, 373–381. [CrossRef]
- Ha Minh N, Le Dang N. The relationship between urbanization and economic growth: An empirical study on ASEAN countries. International Journal of Social Economics 2018, 45, 00–00. [CrossRef]
- Bertinelli, L., & Black, D. Urbanization and growth. Journal of Urban Economics 2004, 56, 80–96. [CrossRef]
- Lin B, Zhu J. Energy and carbon intensity in China during the urbanization and industrialization process: A panel VAR approach. Journal of Cleaner Production 2017, 168, 780–790. [CrossRef]
- Bakirtas, Tahsin, Akpolat, Ahmet, & Gokce. The relationship between energy consumption, urbanization, and economic growth in new emerging-market countries. Energy Oxford 2018, 147, 110–121. [CrossRef]
- Zhang Y J, Liu Z, Zhang H, et al. The impact of economic growth, industrial structure and urbanization on carbon emission intensity in China. Natural Hazards 2014, 73, 579–595. [CrossRef]
- Zhou H L, and Li X S. Tobit model estimation method and application. Economic Perspectives 2012, 615, 105–119.
- Baron, R. M. & Kenny, D. A. The Moderator-mediator Variable Distinction in Social Psychological Research: Conceptual. Strategic and Statistical Considerations. Journal of Personality and Social Psychology 1986, 51, 1173–1182. [CrossRef]
- Wen Z L, Zhang L, Hou J T, et al. Testing and application of the mediating effects. Acta Psychologica Sinica 2004, 614–620.
- Zhang Junkuo, Hou Yongzhi, Liu Peilin, et al. The Target Requirement and Strategic Path of High Quality Development. Management World Available online at: https://kns.cnki.net/kcms/detail/detail.aspx?dbcode=CJFD&dbname=CJFDLAST2019&filename=GLSJ201907003&uniplatform=NZKPT&v=tI3YudqOkuK3SuOTUvsMh1 sPa8aTSsGIf1eIxkOC5L6Fgp0f3gytenlbQuF9okyZ. 2019, 35, 1–7.
- Ding, Lin, et al. A Comprehensive Evaluation of Urban Sustainable Development in China Based on the Topsis-Entropy Method. Sustainability 2016, 8, 746. [CrossRef]
- Qiu, Y., Jia, S., Liao, J., and Yang, X. Evaluation of Urban High quality Development Level Based on Entropy Weight-TOPSIS Two step Method. Journal of Economic Analysis 2022, 1, 50–65.
| 1 | The specific method is given by following formula: |
| 2 |
Disclaimer/Publisher’s Note: The statements, opinions and data contained in all publications are solely those of the individual author(s) and contributor(s) and not of MDPI and/or the editor(s). MDPI and/or the editor(s) disclaim responsibility for any injury to people or property resulting from any ideas, methods, instructions or products referred to in the content. |
© 2023 by the authors. Licensee MDPI, Basel, Switzerland. This article is an open access article distributed under the terms and conditions of the Creative Commons Attribution (CC BY) license (http://creativecommons.org/licenses/by/4.0/).
Copyright: This open access article is published under a Creative Commons CC BY 4.0 license, which permit the free download, distribution, and reuse, provided that the author and preprint are cited in any reuse.


