
Submitted:
19 May 2023
Posted:
22 May 2023
You are already at the latest version
Abstract
In this work, a series of compounds in the CaO-½Er2O3-CoOz ternary oxide system were synthesized in air at 885℃ using high temperature solid-phase synthesis method. Phase boundary of each solid solution region in the CaO-½Er2O3-CoOz system was determined by X-ray powder diffraction technique. The phase diagram of the CaO-½Er2O3-CoOz system at 885℃ includes three series of ternary oxide solid solutions : (Ca3-xErx)Co4O9-z (0≤x≤0.9), (Ca3-xErx)Co2O6-z (0≤x≤1.25) and (Er1-xCax)CoO3-z (0≤x≤0.33). Four three-phase regions and five solid solution tie-line regions were obtained. The structure of perovskite solid solution (Ca3-xErx)Co2O6-z has been analyzed by Rietveld refinements. With the increase of Er content, the cell parameters of (Ca3-xErx)Co2O6-z exhibit an decreasing trend in a and b directions and an increasing trend in c direction.
Keywords:
Phase diagram of CaO-CoOx-ErOy system
; Thermoelectric oxide system
; Perovskite and its derived structures
; Structure for (Ca3-xErx)Co2O6-z
1. Introduction
The increasing demand for energy in everyday life, coupled with concerns about climate change, has prompted the scientific community to explore materials for more efficient energy conversion and storage. Perovskite [1,2,3] is a kind of outstanding materials, including metal halides and perovskite oxides, which has a good development prospect as energy materials and can effectively replace traditional materials. In 1839, Russian geologist Lev Perovski discovered the structure of ABO3. Because the perovskite structure was generated by the discovery of the special structure of CaTiO3 in calcium titanate during the study of perovskite, the structure of ABO3 is called the perovskite structure. The perovskite structure is also called the 113 structure because the proportion of the elements in ABO3 is A:B:O=1:1:3. The spatial group of the standard perovskite structure is P m3m. In ABO3, A is a alkaline earth metal or rare earth ion with a relatively large ionic radius, B is a transition metal ion with a relatively small ionic radius, and O is oxygen ion [4,5].
In recent years, perovskite-type thermoelectric materials have made breakthrough progress, but only a few of them have been found to have practical industrial applications due to the low efficiency. To measure the performance of thermoelectric materials the dimensionless figure of merit (zT), given by zT=S2σT/κ [6,7,8], where S is the Seebeck coefficient or thermopower, σ is the electrical conductivity (σ=1/ρ, ρ is electrical resistivity), κ is the thermal conductivity, and T is the absolute temperature, has been used. However, due to the correlation of S, ρ and κ, it is a difficult task to optimize the zT value. High quality thermoelectric materials need to meet the following requirements: high electrical conductivity, high Seebeck coefficient, and low thermal conductivity.
Thermoelectric oxides have been considered as possible candidates for waste heat conversion applications because of their stability at high temperatures. Low-dimensional oxide thermoelectric materials, including chain oxides Ca3Co2O6 [9,10,11] and layered oxides Ca3Co4O9 [12,13,14,15,16,17,18,19,20], NaCo2O4 [21], Bi2Sr2Co2Ox [22] and natural superlattices (Bi,A)OCuSe (A=Pb, Ba, Sr, Ca) [23], are considered as candidates for waste heat conversion applications. Among them, the 2D mismatched layered oxide Ca3Co4O9 exhibited the highest ZT value. Much work has been done to improve the thermoelectric properties of Ca3Co4O9 by doping at Ca or Co sites [24,25,26,27].
Phase equilibrium diagrams which provide blue prints for processing and understanding phase relationships are important for designing and understanding materials properties, phase diagrams of the CaO-CoOx-ROy (R=lanthanide) systems are of interest to the thermoelectric research community. Phase diagrams of CaO-CoOx-ROy systems for R= La [28], Nd [29], Sm [30], Eu [31], Gd [32], Dy [33]and Ho [34] have been reported. In the CaO-CoOx-ROy system, there are Ca3Co4O9, Ca3Co2O6 and RCoO3 phases, all of which have perovskite or its derivative structure and have excellent thermoelectric properties.
In this study, we have established the phase compatibility relationships, crystal chemistry, and crystallography of selected compounds in the CaO-CoOx-ROy systems at 885 ℃ (R=Er in this report), particularly to obtain subsolidus phase relationships in the vicinity of the Ca3Co4O9 and Ca3Co2O6 compounds. Possible formation of (Ca3-xErx)Co4O9-z, (Er1-xCax)CoO3-z and (Ca3-xErx)Co2O6-z solid solutions and the effect of doping on the crystal structure are also discussed. In addition, the phase formation and phase relationships between CaO-CoOx-LaOy [28], CaO-CoOx-DyOy [33], and the CaO-CoOx-ErOy systems are compared. These reference patterns will be included in the ICDD Powder Diffraction File (PDF [35]).
2. Materials and Methods
2.1. Sample preparation
The samples were prepared by high temperature solid-state synthesis technique. Table 1 gives 52 samples prepared from stoichiometric mixtures of CaCO3, Co3O4 and Er2O3 (all with purity greater than 99%). The samples were mixed, pelletized, and sintered at 850 ℃ for 6 hours, its purpose is to calcinate CaCO3 at high temperature and react CaCO3 into CaO. The samples are ground repeatedly, the particles are small after grinding, and the samples are mixed evenly. They were then sintered at 885 ℃ for 6-9 days, with grinding, and the heat treatment process repeated until the powder X-ray diffraction pattern showed no further change.

Table 1.
Fifty-two samples (mole fraction, %) prepared for the phase equilibria study of the CaO-CoOx-ErOy system at 885 °C in air. In this table, Ca=CaO; Co=⅓Co3O4; Er=½Er2O3.
Table 1.
Fifty-two samples (mole fraction, %) prepared for the phase equilibria study of the CaO-CoOx-ErOy system at 885 °C in air. In this table, Ca=CaO; Co=⅓Co3O4; Er=½Er2O3.
| Sample# | Ca | Co | Er |
| #01 | 0.05 | 0 | 0.95 |
| #02 | 0.08 | 0 | 0.92 |
| #03 | 0.1 | 0 | 0.9 |
| #04 | 0.95 | 0 | 0.05 |
| #05 | 0.98 | 0 | 0.02 |
| #06 | 0.05 | 0.2 | 0.75 |
| #07 | 0.2 | 0.2 | 0.6 |
| #08 | 0.55 | 0.24 | 0.21 |
| #09 | 0.65 | 0.25 | 0.1 |
| #10 | 0 | 0.3333 | 0.6667 |
| #11 | 0.3 | 0.3333 | 0.3667 |
| #12 | 0.31 | 0.3333 | 0.3567 |
| #13 | 0.32 | 0.3333 | 0.3467 |
| #14 | 0.3333 | 0.3333 | 0.3334 |
| #15 | 0.35 | 0.3333 | 0.3167 |
| #16 | 0.39 | 0.3333 | 0.2767 |
| #17 | 0.4 | 0.3333 | 0.2667 |
| #18 | 0.42 | 0.3333 | 0.2467 |
| #19 | 0.43 | 0.3333 | 0.2367 |
| #20 | 0.45 | 0.3333 | 0.2167 |
| #21 | 0.5 | 0.3333 | 0.1667 |
| #22 | 0.55 | 0.3333 | 0.1167 |
| #23 | 0.4 | 0.4 | 0.2 |
| #24 | 0.5 | 0.4 | 0.1 |
| #25 | 0.55 | 0.4 | 0.05 |
| #26 | 0.6 | 0.4 | 0 |
| #27 | 0.2 | 0.425 | 0.375 |
| #28 | 0 | 0.5 | 0.5 |
| #29 | 0.1 | 0.5 | 0.4 |
| #30 | 0.15 | 0.5 | 0.35 |
| #31 | 0.16 | 0.5 | 0.34 |
| #32 | 0.17 | 0.5 | 0.33 |
| #33 | 0.18 | 0.5 | 0.32 |
| #34 | 0.19 | 0.5 | 0.31 |
| #35 | 0.2 | 0.5 | 0.3 |
| #36 | 0.21 | 0.5 | 0.29 |
| #37 | 0.22 | 0.5 | 0.28 |
| #38 | 0.25 | 0.5 | 0.25 |
| #39 | 0.28 | 0.5 | 0.22 |
| #40 | 0.3 | 0.5 | 0.2 |
| #41 | 0.25 | 0.5714 | 0.1786 |
| #42 | 0.26 | 0.5714 | 0.1686 |
| #43 | 0.27 | 0.5714 | 0.1586 |
| #44 | 0.28 | 0.5714 | 0.1486 |
| #45 | 0.29 | 0.5714 | 0.1386 |
| #46 | 0.295 | 0.5714 | 0.1336 |
| #47 | 0.3 | 0.5714 | 0.1286 |
| #48 | 0.3572 | 0.5714 | 0.0714 |
| #49 | 0.4143 | 0.5714 | 0.0143 |
| #50 | 0.4286 | 0.5714 | 0 |
| #51 | 0.02 | 0.6 | 0.38 |
| #52 | 0.2 | 0.65 | 0.15 |
2.2. X-ray diffraction
X-ray powder diffraction (XRD) analysis of the samples has been carried out at room temperature using a Rigaku SmartLab diffractometer with Cu Kα radiation (40 kV, 200 mA) and a graphite monochromator at the China University of Geosciences Beijing. A step scan mode was employed with a step width of 2θ=0.02° and a sampling time of 1 s in the range of 15≤2θ≤70°. The compositions in the CaO-CoOx-ErOy system were analyzed by using the Powder Diffraction File (PDF) [35].
2.3. Rietveld refinements
The structural changes of the samples in the solid solution region (Ca3-xErx)Co2O6-z were analyzed by Rietveld refinements [36,37]. X-ray powder diffraction (XRD) analysis of these perovskite crystals has been carried out at room temperature using a Rigaku SmartLab diffractometer with Cu Kα radiation (40 kV, 200 mA) and a graphite monochromator as mentioned above. A step scan mode was employed with a step width of 2θ=0.02° and a sampling time of 1 s in the range of 15≤2θ≤120°.
3. Results
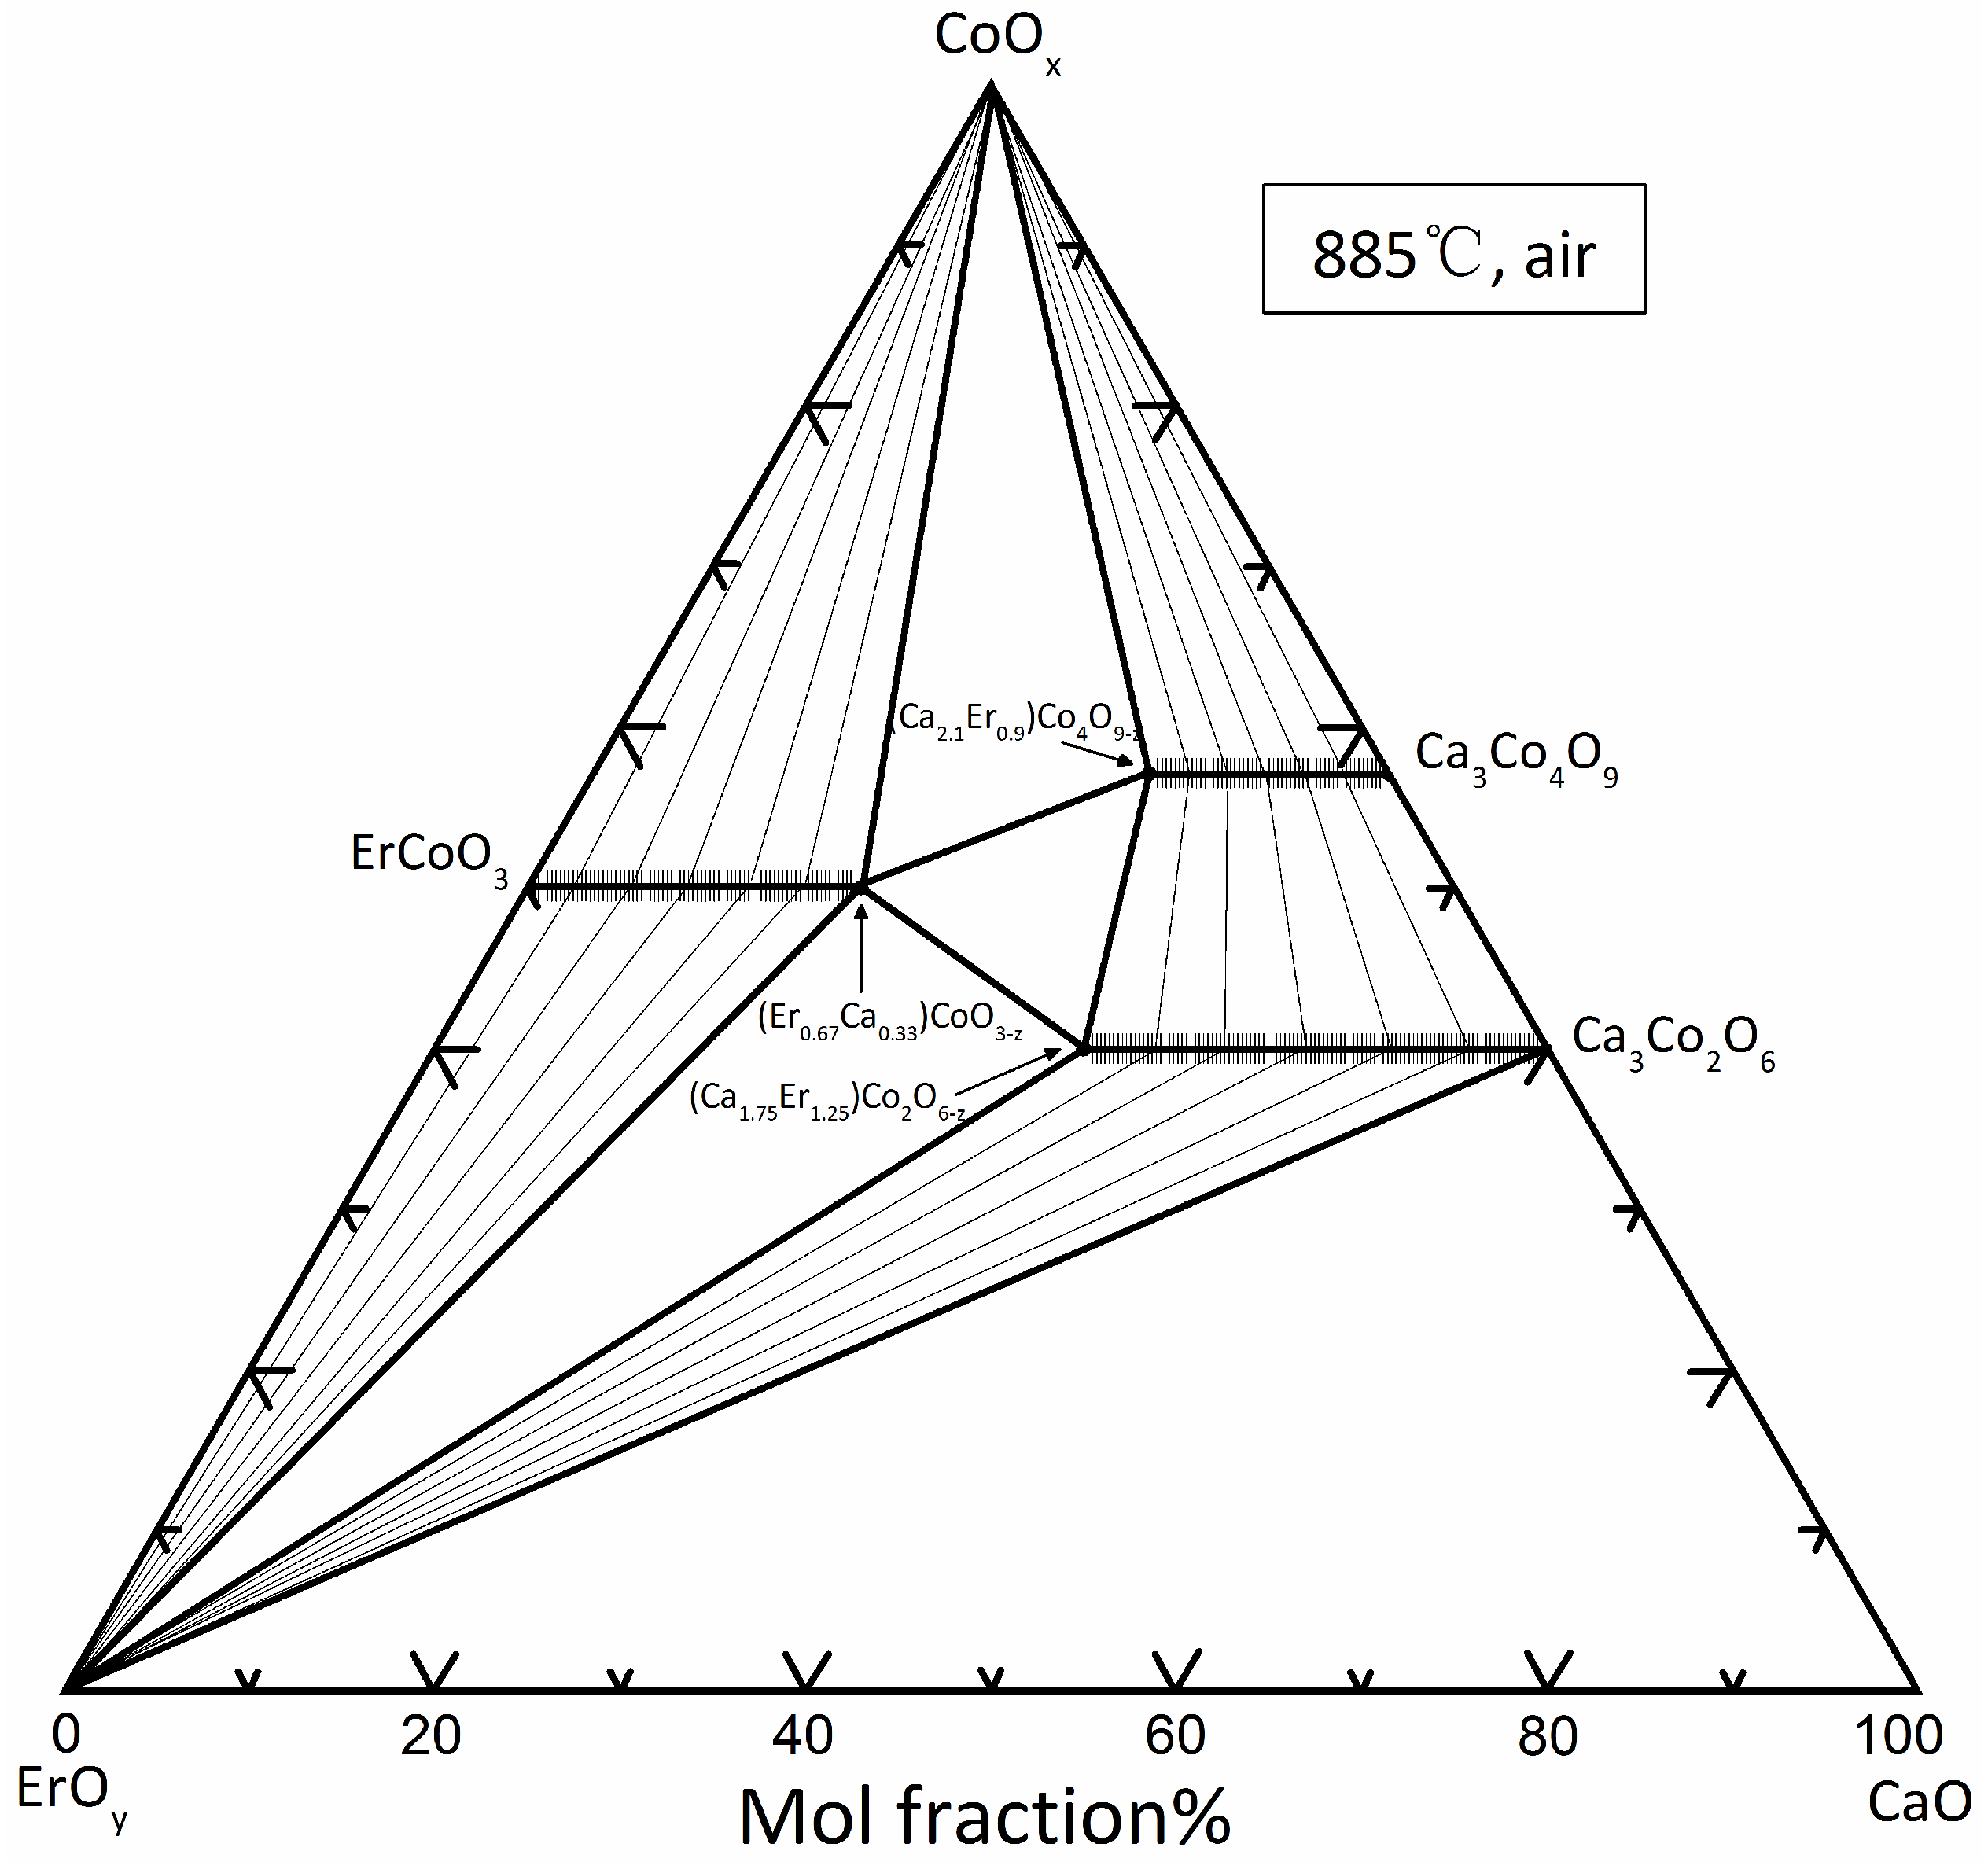
Figure 1 shows the phase diagram of the CaO-CoOx-ErOy system that was determined at 885 ℃. The phase relations between the solid solution and other phases are represented by tie-lines. The phase diagram of CaO-CoOx-ErOy ternary system at 885℃ has 5 two-phase zones, 4 three-phase zones, 8 two-phase contact lines and 3 solid solution zones. The phase diagram of CaO-CoOx-ErOy ternary system at 885℃ shows three solid solution distinctions: (Ca3-xErx)Co4O9-z (0≤x≤0.9), (Ca3-xErx)Co2O6-z (0≤x≤1.25) and (Er1-xCax)CoO3-z (0≤x≤0.33). The crystal chemistry and crystallography of the phases in binary and ternary oxide systems are discussed below.
Figure 1.
Phase diagram of the CaO-CoOx-ErOy system at 885℃ in air, showing the limits of various solid solutions, and the tie-line relationships of various phases.
Figure 1.
Phase diagram of the CaO-CoOx-ErOy system at 885℃ in air, showing the limits of various solid solutions, and the tie-line relationships of various phases.
3.1. Binary oxide systems
3.1.1. CaO-CoOx
Binary CaO-CoOx oxide systems have been studied extensively. In this system, two single-phase structures have been identified: Ca3Co2O6 (Co:Ca=40:60) and Ca3Co4O9 (Co:Ca=57.14:42.86) [12,24]. Both Ca3Co2O6 and Ca3Co4O9 have perovskite-derived structures. It is also confirmed that there are only two single-phase Ca3Co2O6 and Ca3Co4O9 in the binary system under the current high temperature solid-phase synthesis conditions.
Ca3Co4O9 is a mismatched layered oxide with two monocline subsystems, with the same a, c, but different b values. There are two different Co-O layers stacked regularly along the direction of the c-axis, one of which is CoO2 layer, CoO2 layer has a CdI2-type structure, CoO2 layer can be regarded as Co ion in the center, there are six O ions around the central Co ion, the center of the octahedron is Co ion, the apex of the octahedron is O ion. Adjacent octahedrons are connected in the form of common edges; The other layer is Ca2CoO3, formed from Ca-Co-O, which has a halite structure. CoO2 layer can provide charge carriers (holes) needed for conducting electricity, and Co ions in CoO2 layer include Co3+ and Co4+, located at the adjacent O2- midpoint. There is strong interaction between adjacent positive ions. The change of valence of Co ion makes it easy to shift from the center of the octahedron, resulting in the difference in the length of Co-O bond. The bonding mode between ions in Ca2CoO3 layer is ionic bond, and there is no change of valence, so Ca2CoO3 layer does not conduct electricity, and the presence of Ca2CoO3 reduces the thermal conductivity of the material. Higher conductivity σ and lower thermal conductivity κwill make the material have higher thermoelectric value. Therefore, the phase exhibits strong anisotropic thermoelectric properties in the ab plane [33].
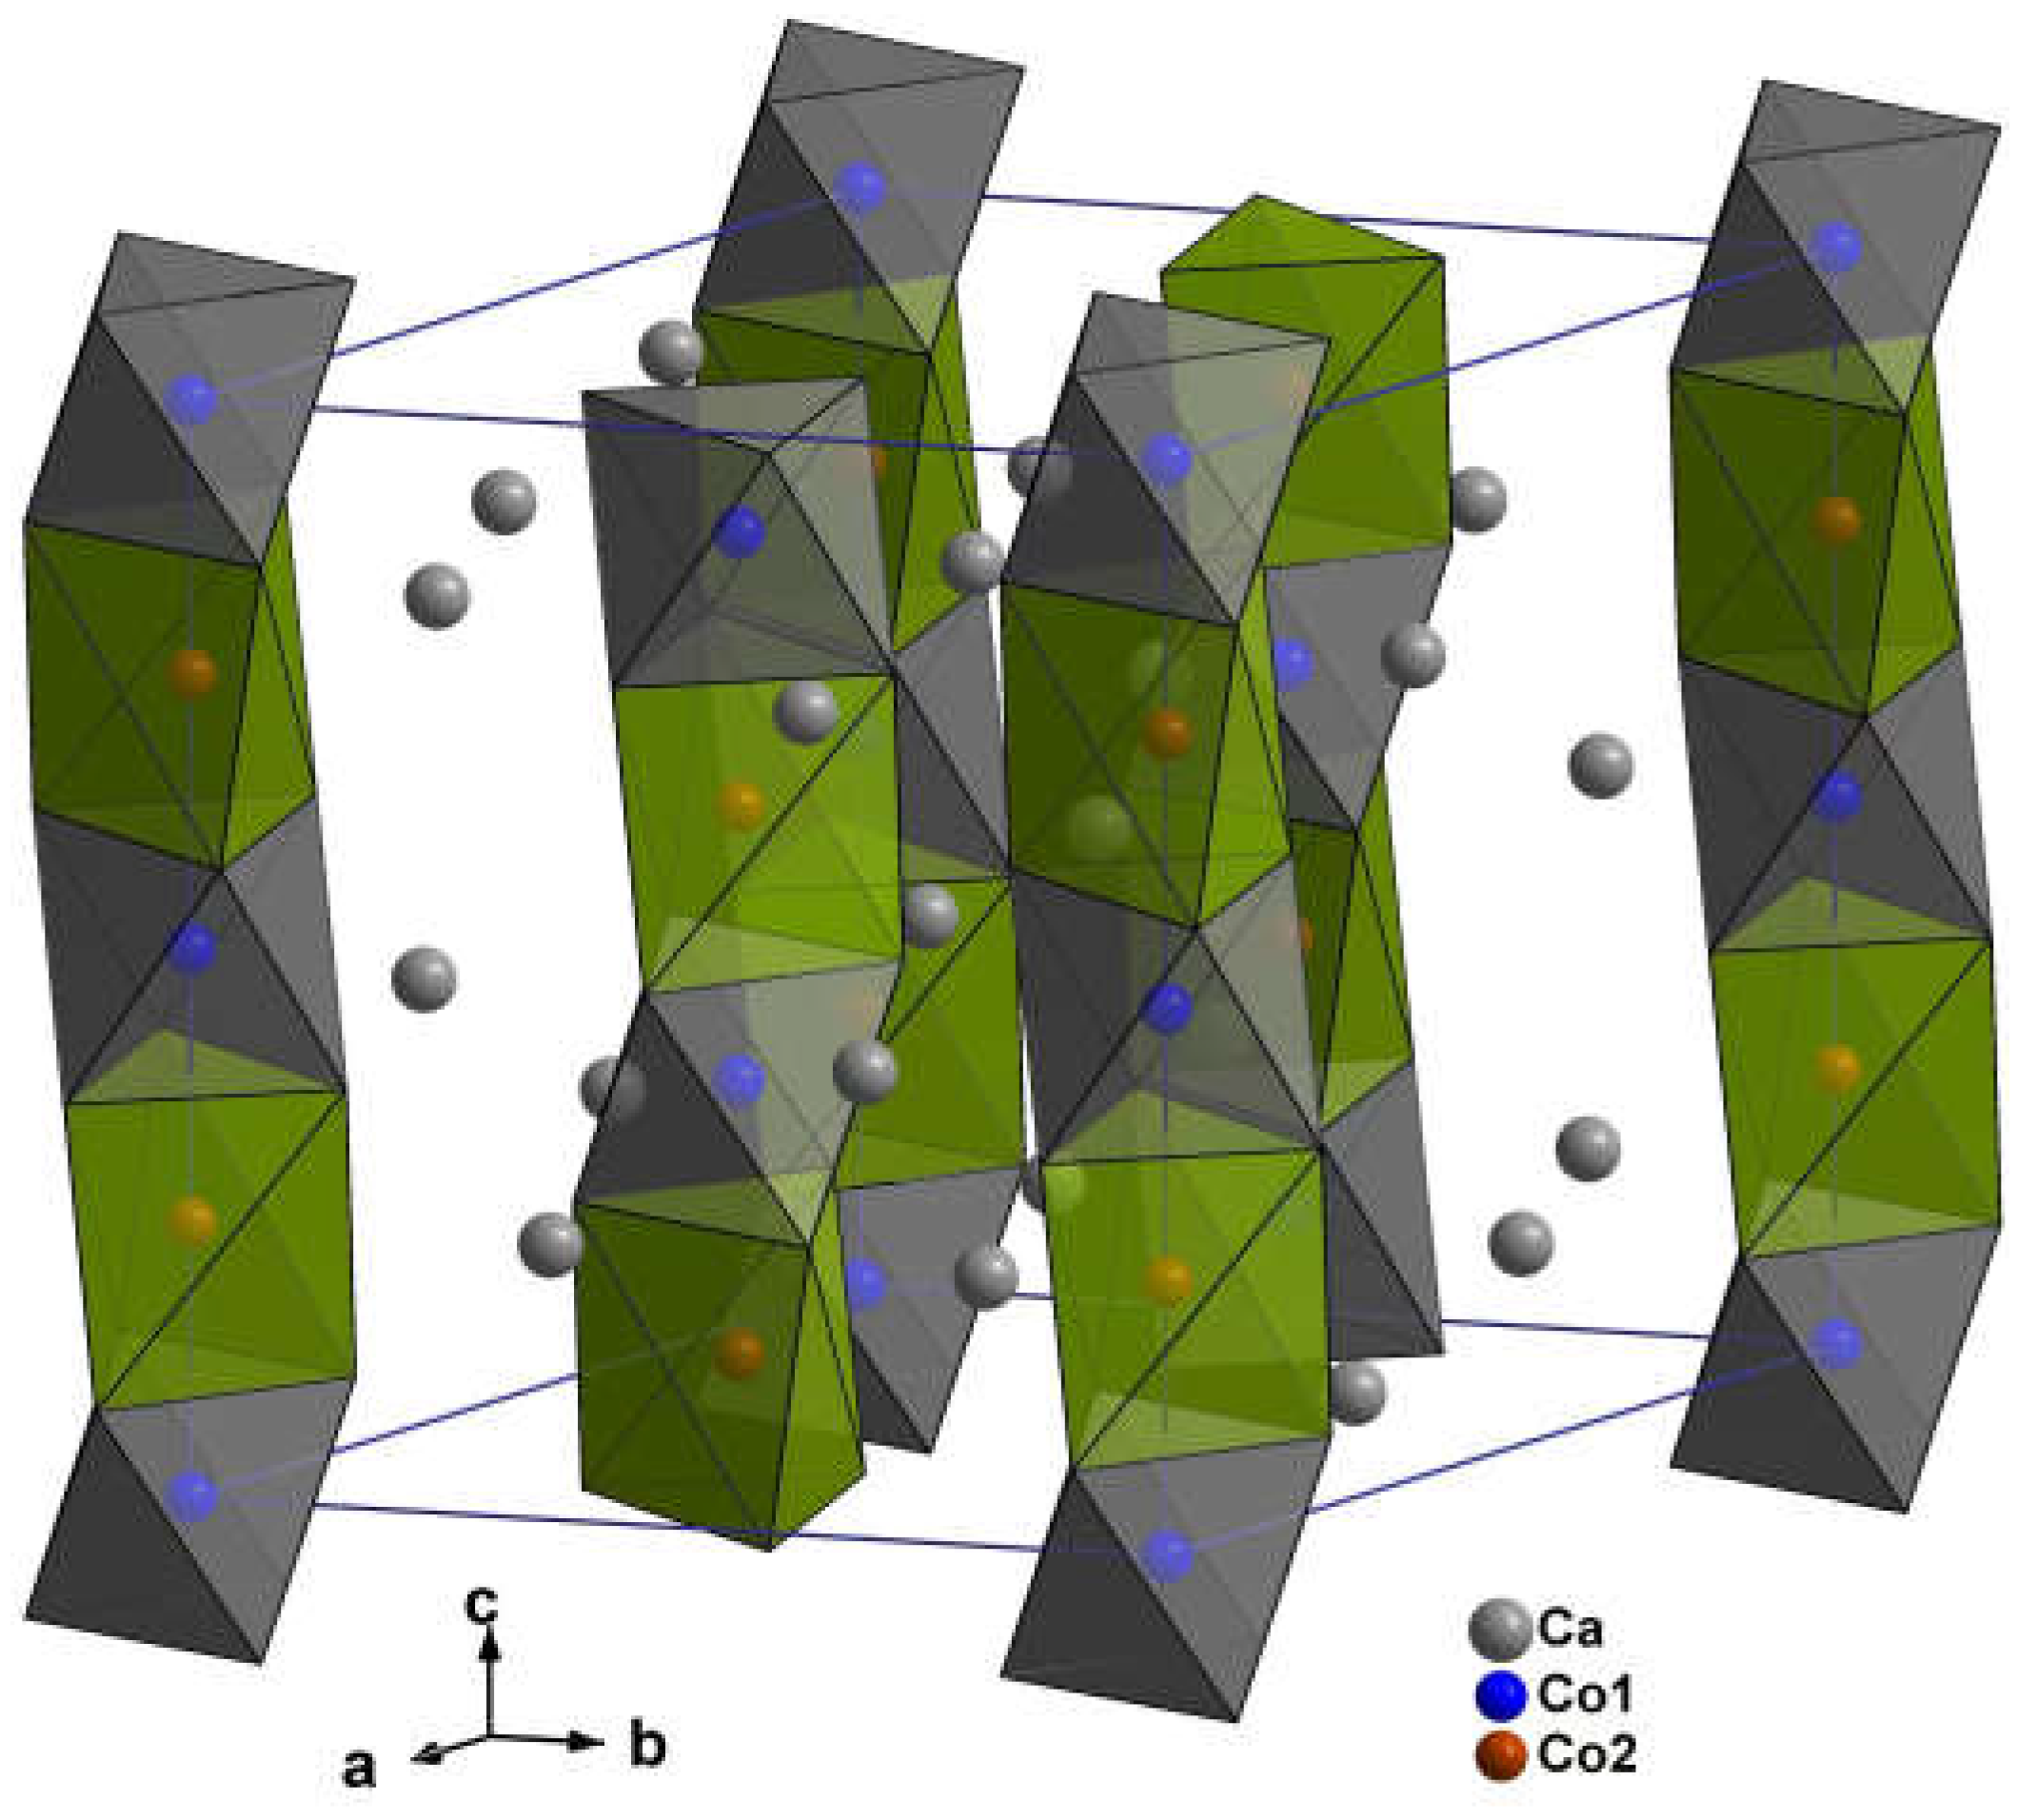
Ca3Co2O6 (R -3c, a=9.0793 (7) Å, c=10.381 (1) Å) is a member of the n=1 of the perovskite-derived series An+2BnB'O3n+3, where the A positions are alkaline earth metals, such as Ca, Sr and Ba, and the B and B' positions are usually transition metal elements. In Ca3Co2O6, the A site is the Ca ion, the B site is the Co ion in the center of the octahedron, and the B 'site is the Co ion in the center of the distorted trigonal prism [34]. Figure 2 shows the structure of Ca3Co2O6. Ca3Co2O6 has a one-dimensional Co-O chain structure. This unique structure makes Ca3Co2O6 obtain excellent thermoelectric properties, magnetic properties and chemical stability. Ca3Co2O6 is suitable for use in moderate and relatively harsh environmental conditions. The Seebeck coefficient of Ca3Co2O6 increases with the increase of temperature, the conductivity of Ca3Co2O6 is semiconductor, and the thermal conductivity of Ca3Co2O6 is relatively low. Therefore, Ca3Co2O6 is a kind of high efficient thermoelectric material with potential to be developed.
Figure 2.
Crystal structure of Ca3Co2O6 showing the linear chain characteristics of Co-O octahedron and Co-O prism, each Co2O66- chain is surrounded by six other chains. These Co2O66- chains are separated by octa-coordinated Ca2+ ions.
Figure 2.
Crystal structure of Ca3Co2O6 showing the linear chain characteristics of Co-O octahedron and Co-O prism, each Co2O66- chain is surrounded by six other chains. These Co2O66- chains are separated by octa-coordinated Ca2+ ions.
3.1.2. CaO-ErOy
Five samples were prepared in the CaO-ErOy binary system to determine the phases form. There is no single phase in the CaO-ErOy binary system, indicating that there is no solid solution near CaO and Er2O3, that is, there is no solid solution zone in the CaO-ErOy binary system.
3.1.3. CoOx-ErOy
At 885 ℃, the only phase found in the ErOx-CoOy system is the ErCoO3 phase, which has the P nma space group perovskite structure. In the CoOx-LaOy binary system of the CaO-CoOx-LaOy [28] phase diagram, La2CoO4 phase was determineds, but in this study the Er2CoO4 phase could not be prepared under the present conditions.
3.2. Ternary oxide systems
Three series of ternary solid solutions were found at 885℃, which were (Ca3-xErx)Co4O9-z (0≤x≤0.9), (Ca3-xErx)Co2O6-z (0≤x≤1.25) and (Er1-xCax)CoO3-z (0≤x≤0.33). We found the solid solution region (Ca3-xErx)Co4O9-z near Ca3Co4O9 and the solid solution region (Er1-xCax)CoO3-z near ErCoO3 are close to the previously reported range in the other CaO-ROx-CoOy systems. The solution region (Ca3-xErx)Co2O6-z was found near Ca3Co2O6, while the solid solution of other lanthanides did not occur at (Ca,R)3Co2O6. Different from the CaO-CoOx-ROy (R=Eu, Gd, Sm) systems as reported previously, the solid solution region of (Er2-xCax)CoO4-z did not exist in the CaO-CoOx-ErOy system at 885℃. The phase relationship of each solid solution zone will be discussed in detail below.
3.2.1. (Ca3-xErx)Co4O9-z
Ca3Co4O9 was found in CaO-CoOx boundary binary system, which is a mismatched layered oxide. Ca3Co4O9 has the perovskite-derived structure. Ca3Co4O9 is a good thermoelectric material and has a splendid prospect in the field of energy. The solid solution region (Ca3-xErx)Co4O9-z forms with the addition of doping element Er. Ten samples were selected near Ca3Co4O9 to explore the boundary of the solid solution region (Ca3-xErx)Co4O9-z, with the dopant of Er, the content of x in the solid solution (Ca3-xErx)Co4O9-z was found to be from 0 to 0.9.
3.2.2. (Ca3-xErx)Co2O6-z
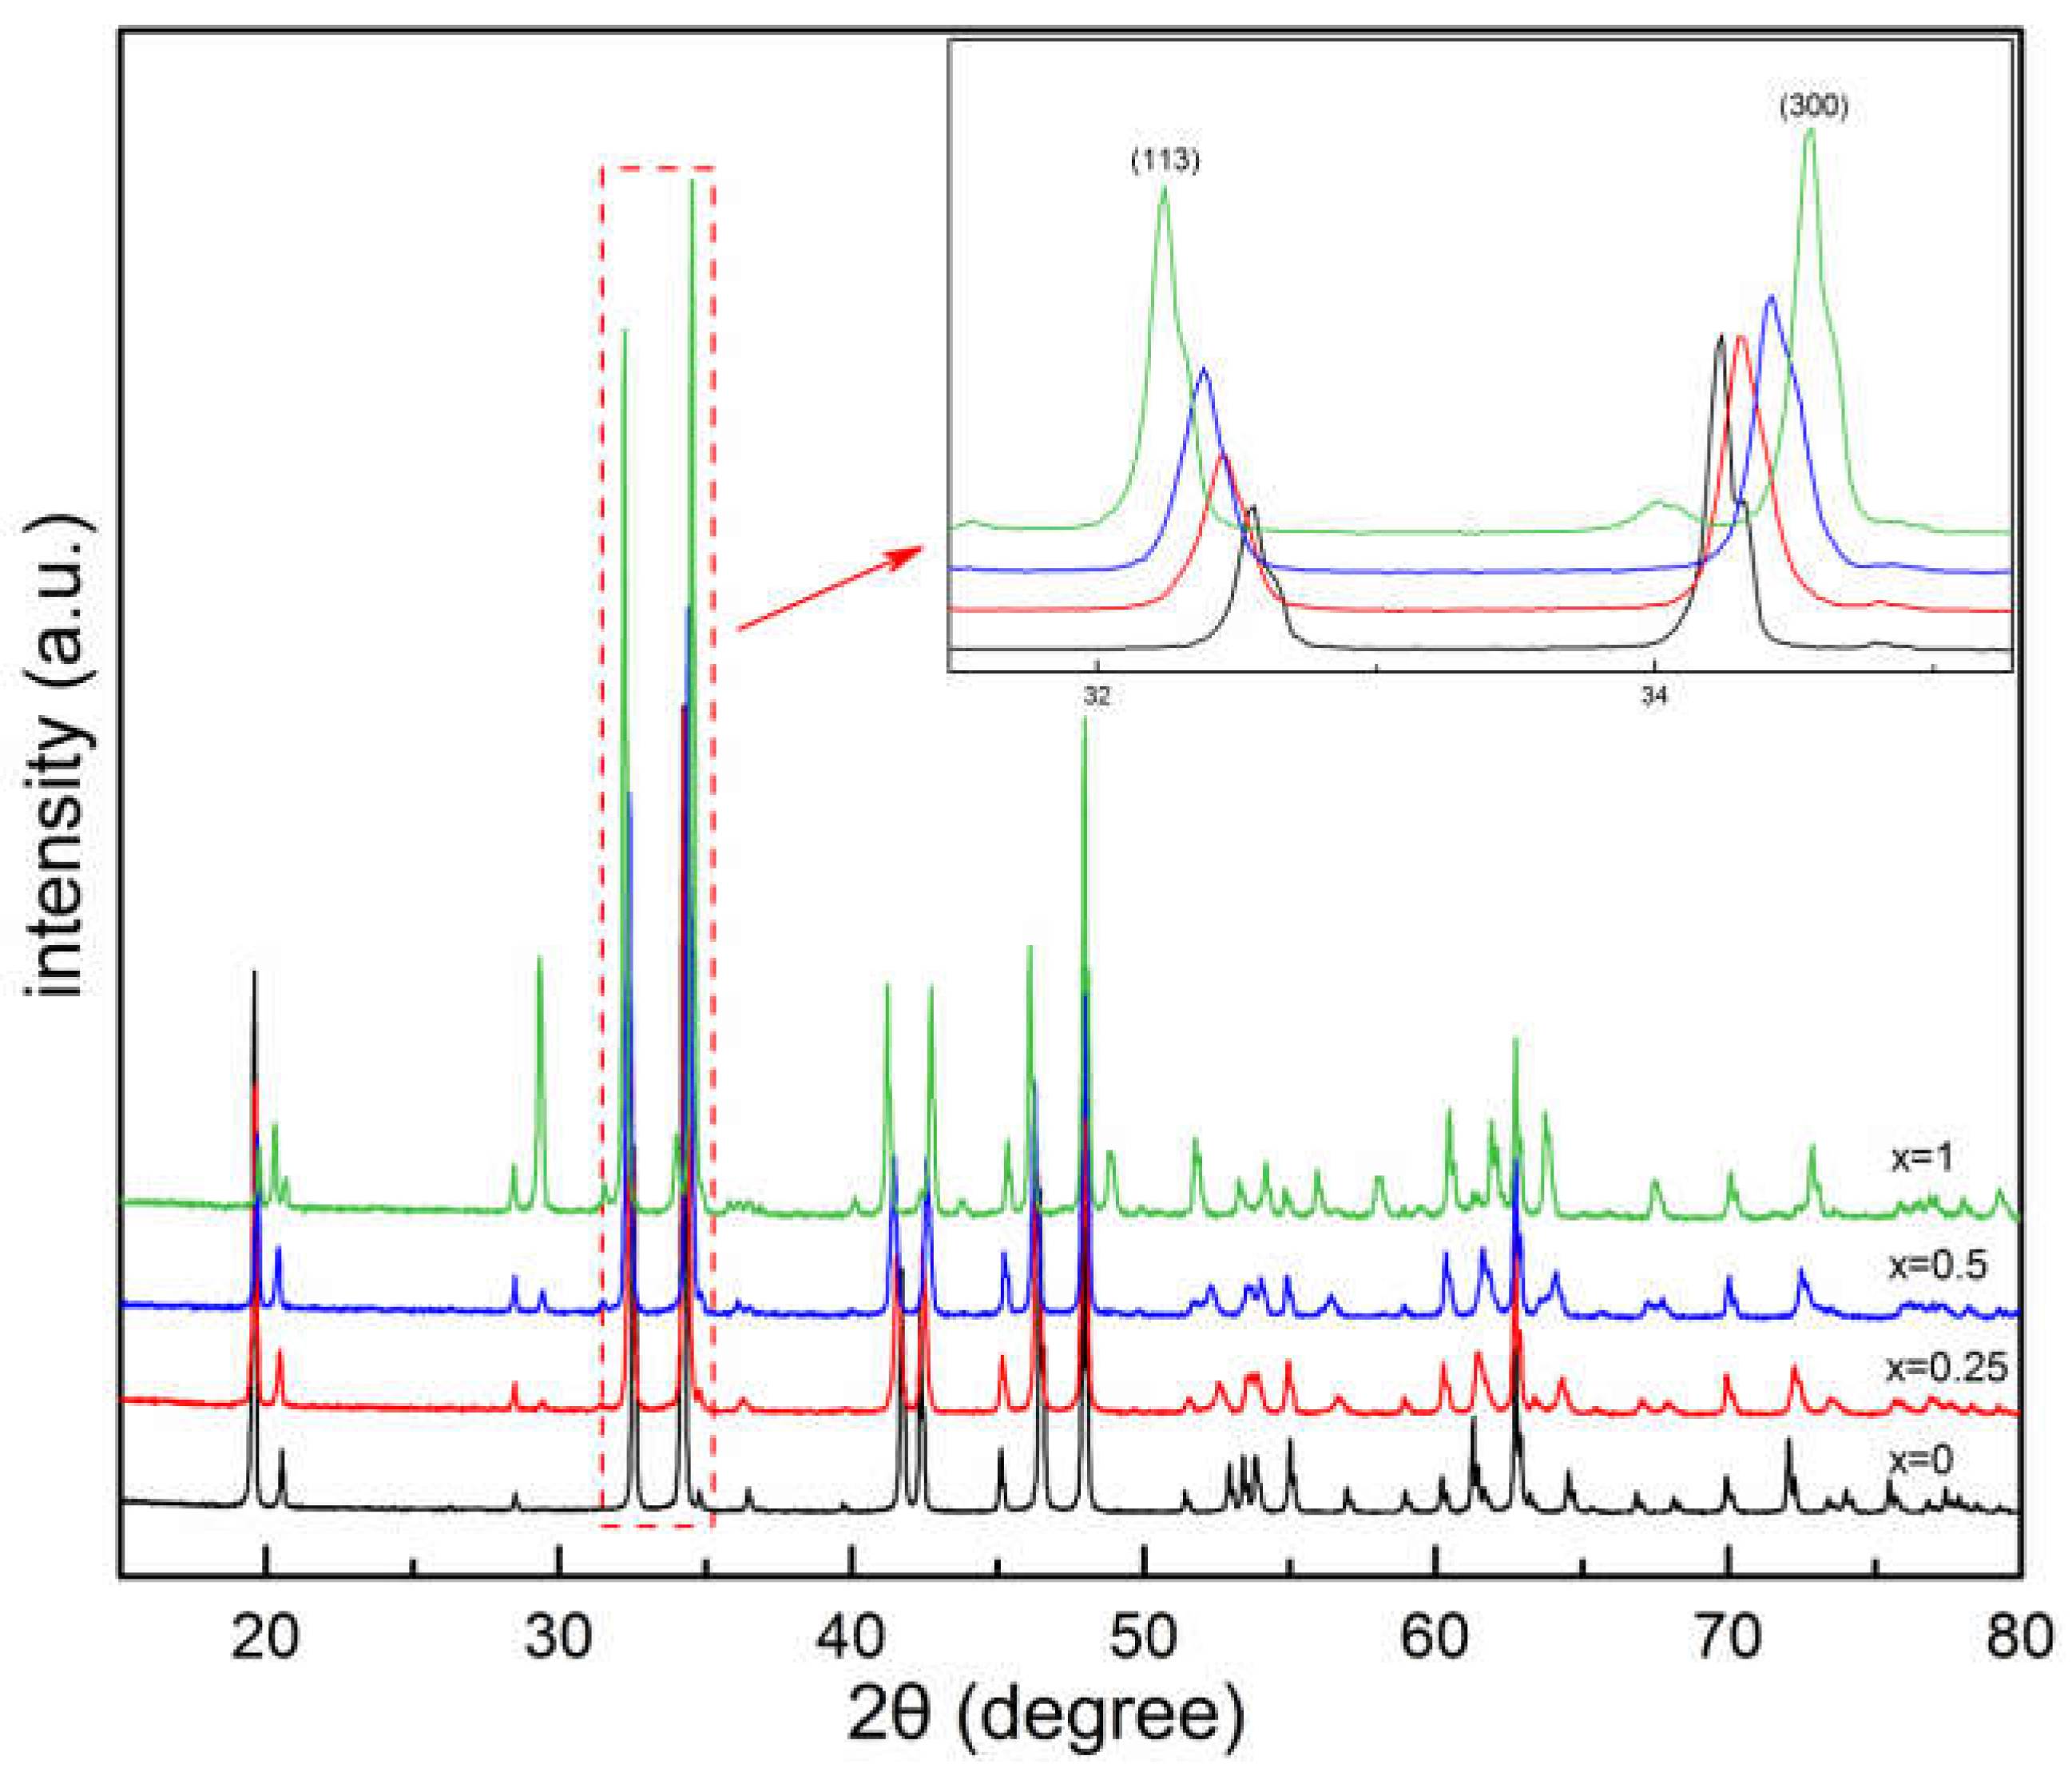
Ca3Co2O6 was found in the CaO-CoOx boundary binary system, the corresponding Co content is 40 at.%. Ca3Co2O6 has the perovskite-derived structure. Ca3Co2O6 is a good thermoelectric material and has a splendid prospect in the field of energy. The solid solution region (Ca3-xErx)Co2O6-z forms with the addition of doping element Er, the solid solution formation appears for (Ca3-xErx)Co2O6-z, with the value of x ranging from 0 to 1.25. The XRD patterns of the sample with 40 at.% Co content and results of MDI Jade show the peak shift systematically with the Er content. As shown in Figure 3, the peaks shift with the amount of Er content in (Ca3-xErx)Co2O6-z, but the directions of peak shiftings are not the same. In Figure 3, it is seen that the crystal plane (113) moves towards a low angle direction, while the crystal plane (300) moves toward a high angle direction, probably due to anisotropic expansion of the unit cell.
Figure 3.
XRD patterns of (Ca3-xErx)Co2O6-z (x=0, 0.25, 0.5, 1).
At 885℃, solid solution was found near Ca3Co2O6. The samples (Ca3-xErx)Co2O6-z (x= 0, 0.25, 0.5, 1) were slowly scanned with XRD followed by Rietveld finishing. The diffraction patterns were analyzed by the Rietveld refinement technique using the Fullprof program. Figure 4 shows the refinement results of (Ca2Er1)Co2O6-z and Ca3Co2O6, respectively, with χ2 of 2.47 and 2.22.
Figure 4.
Rietveld analysis results for (a)(Ca2Er1)Co2O6-z and (b)Ca3Co2O6. Yobs represents the experimental spectrum, Ycalc represents the calculated spectrum, the short vertical line below the diffraction spectrum represents the Bragg diffraction peak position of the corresponding phase, and Yobs-Ycalc represents the difference between the experimental spectrum and the calculated spectrum.
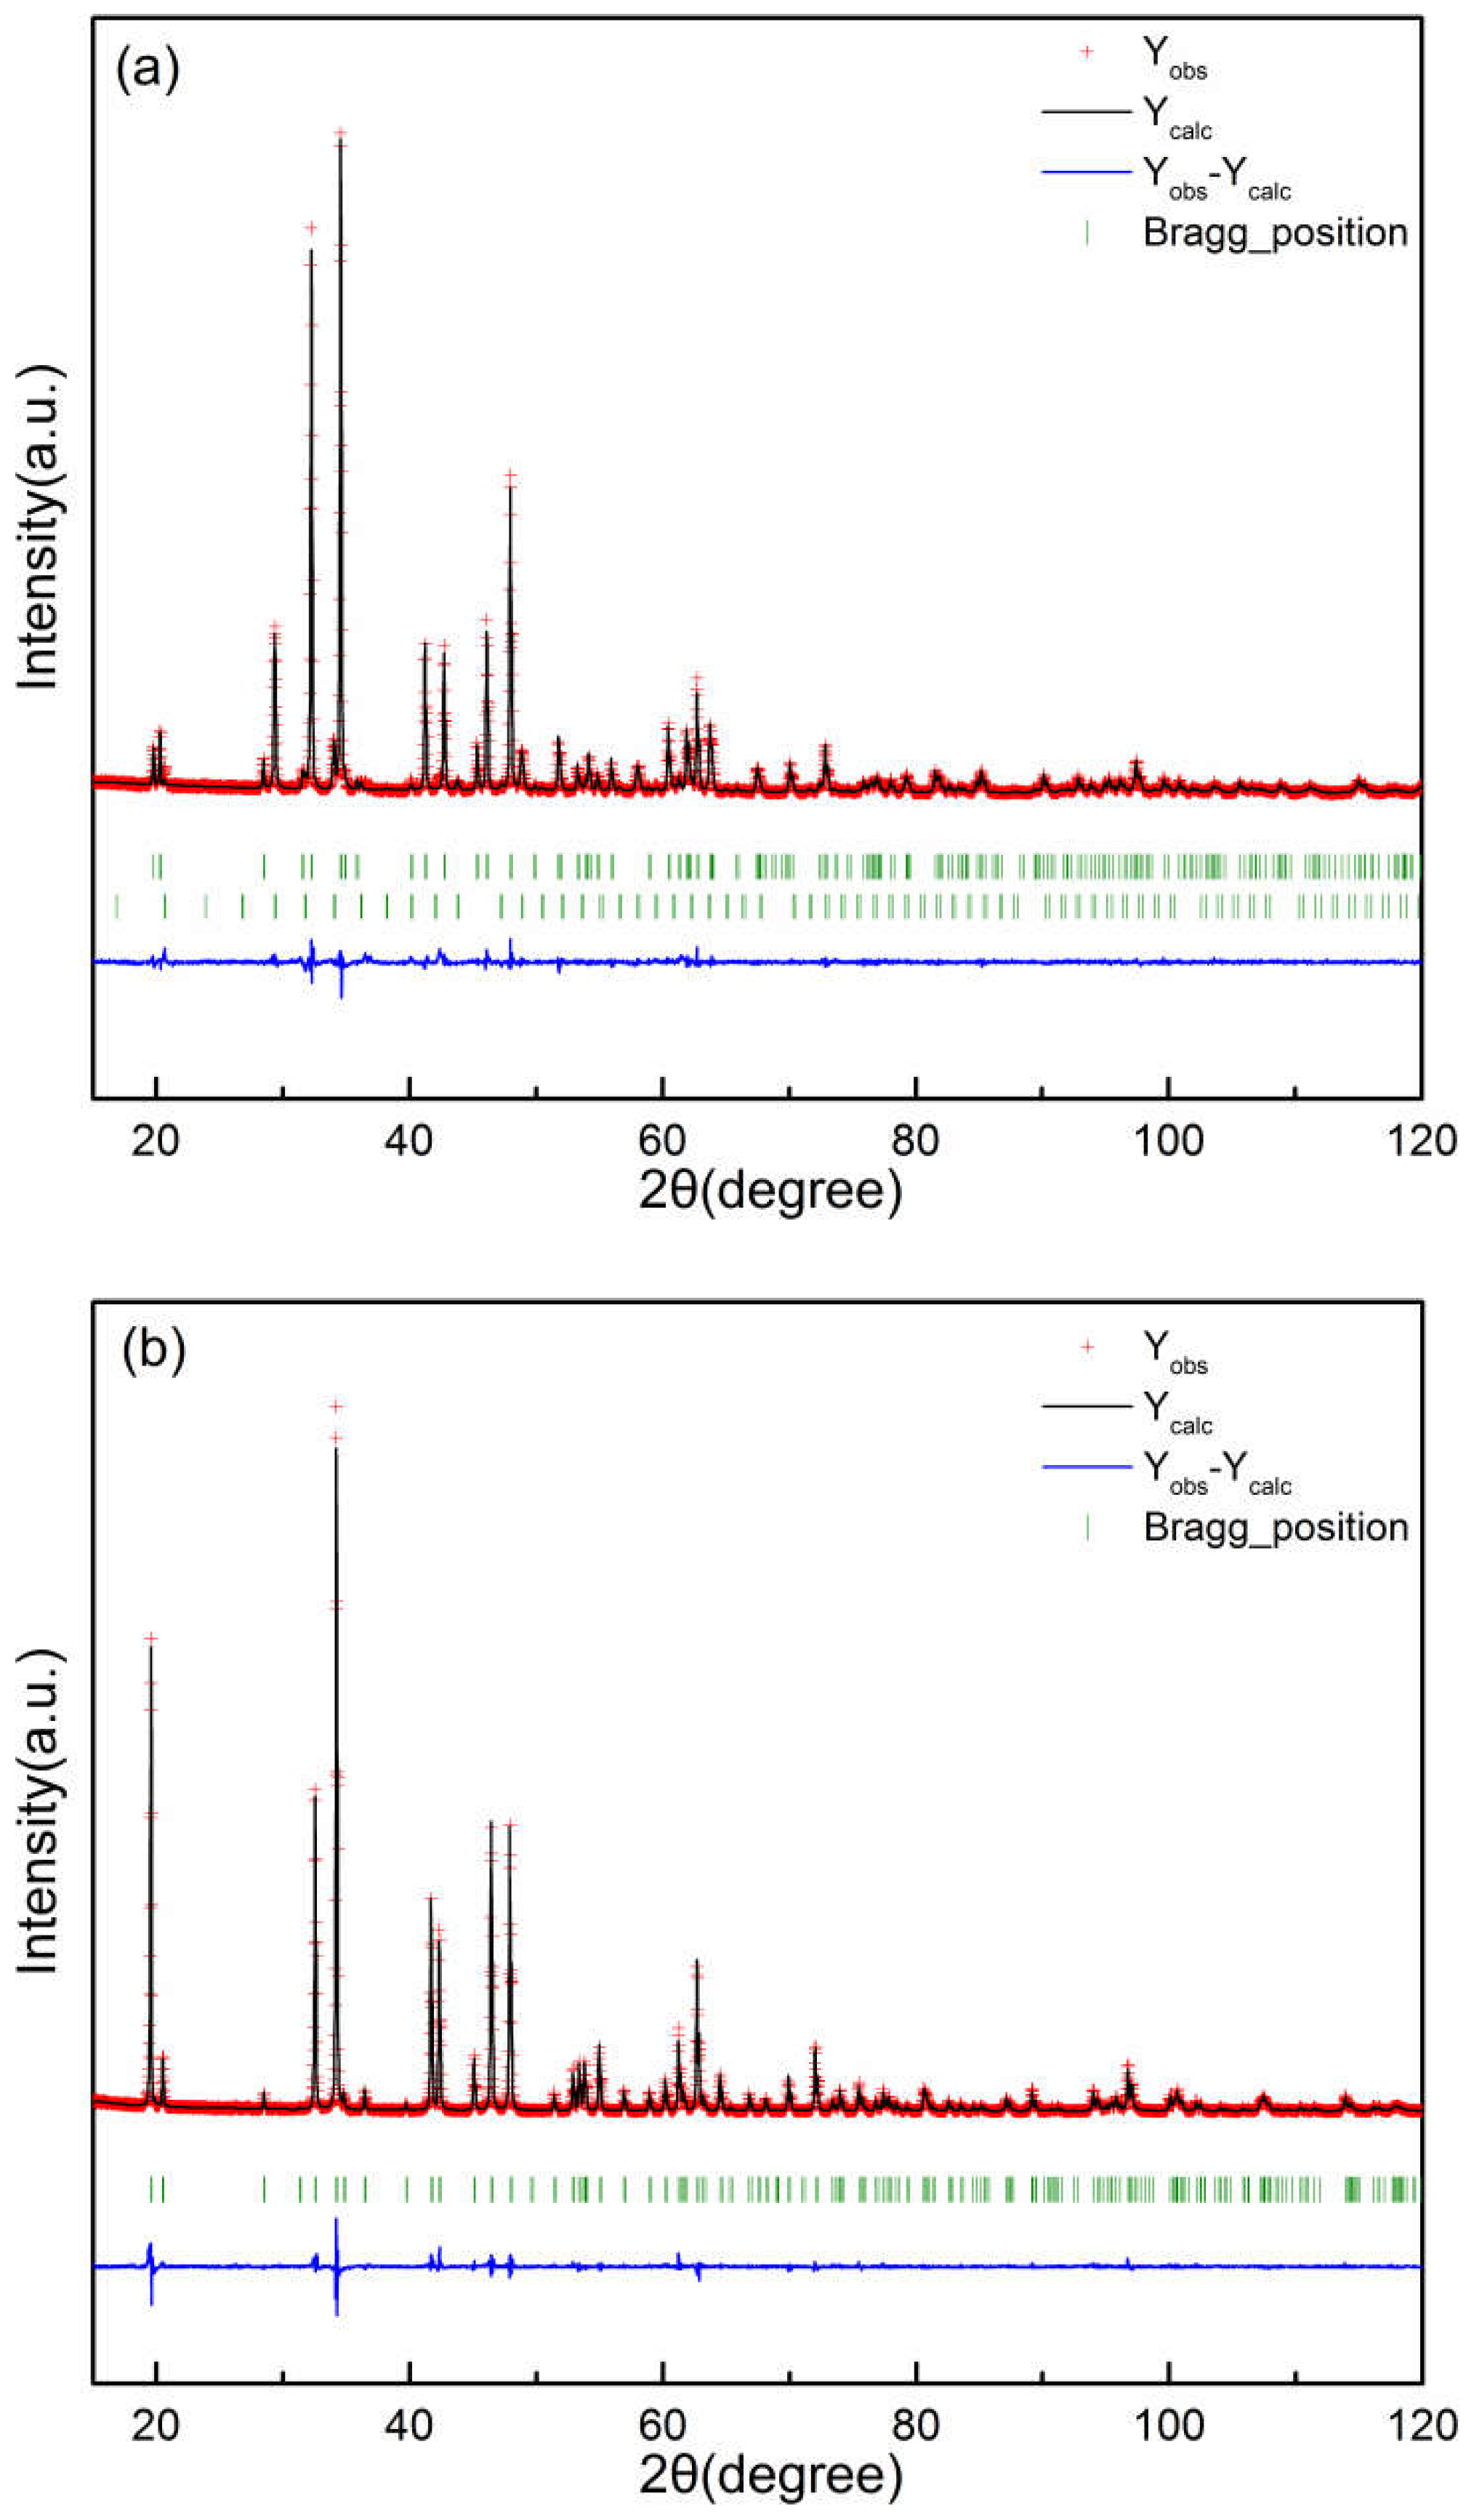
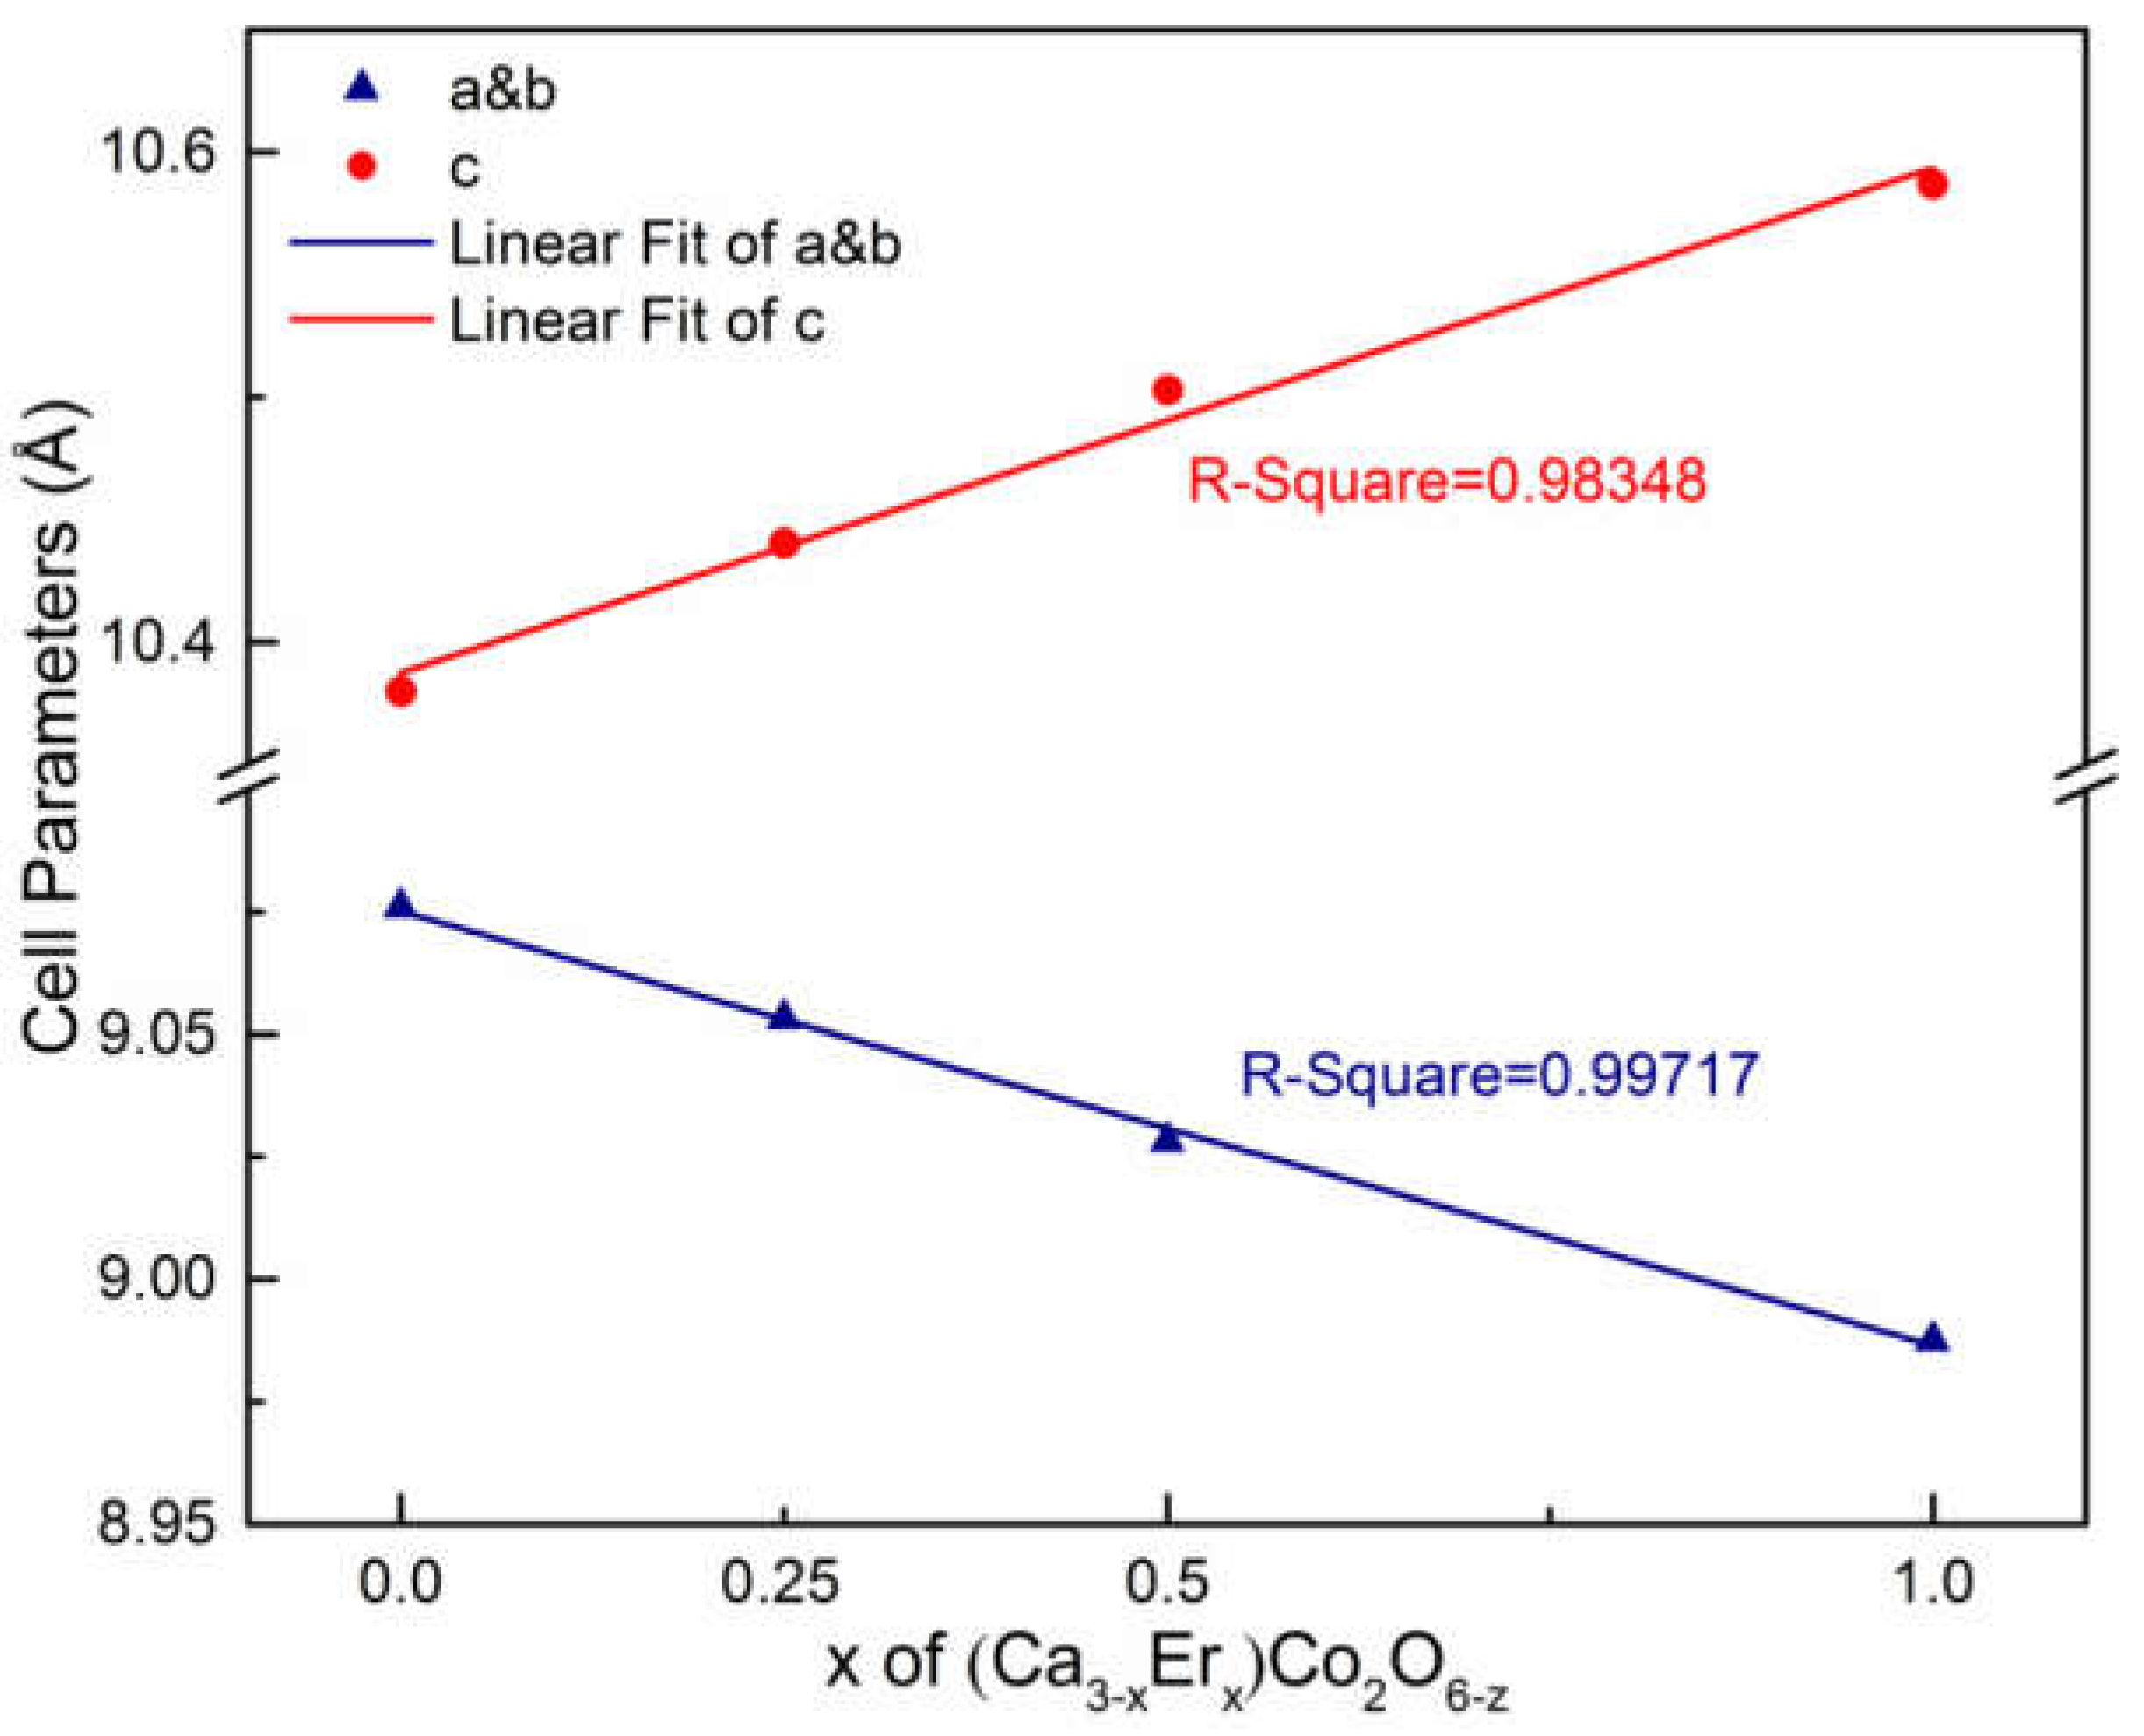
Table 2 and Table 3 provide the refinement parameters and the atomic coordinates of (Ca3-xErx)Co2O6-z (x=0, 0.25, 0.5, 1), respectively. Figure 5 shows the changes of cell parameters of (Ca3-xErx)Co2O6-z (x=0, 0.25, 0.5, 1). With the increase of x, a and b become smaller and c becomes larger, confirming the previous conjecture.
Figure 5.
Cell parameters of (Ca3-xErx)Co2O6-z (x=0, 0.25, 0.5, 1).
The Co-O chain in the Ca3Co2O6 crystal structure is part of a polyhedron chain parallel to the c axis. Figure 6 gives the projection of the regular octahedrons and distorted trigonal prisms of the Co-O chain along the b axis. One can construct various planes using neighboring O ions in the Co-O chain; among these planes, the one perpendicular to the c axis was found to move most significantly with the doping of Er. Table 4 gives the structural parameters of (Ca3-xErx)Co2O6-z. With the increase of Er content, the Ca3Co2O6 structure is lengthened in the c axis direction, mainly due to the lengthening of h2 (shown in Figure 6), or the distorted trigonal prism in the Co-O chain is elongated.
Figure 6.
Projection of the regular and distorted octahedron in the Co-O chain along the b axis, where
h1 is the height of the regular octahedron along the c axis and h2 is the height of the distorted trigonal
prism along the c axis.
Figure 6.
Projection of the regular and distorted octahedron in the Co-O chain along the b axis, where
h1 is the height of the regular octahedron along the c axis and h2 is the height of the distorted trigonal
prism along the c axis.
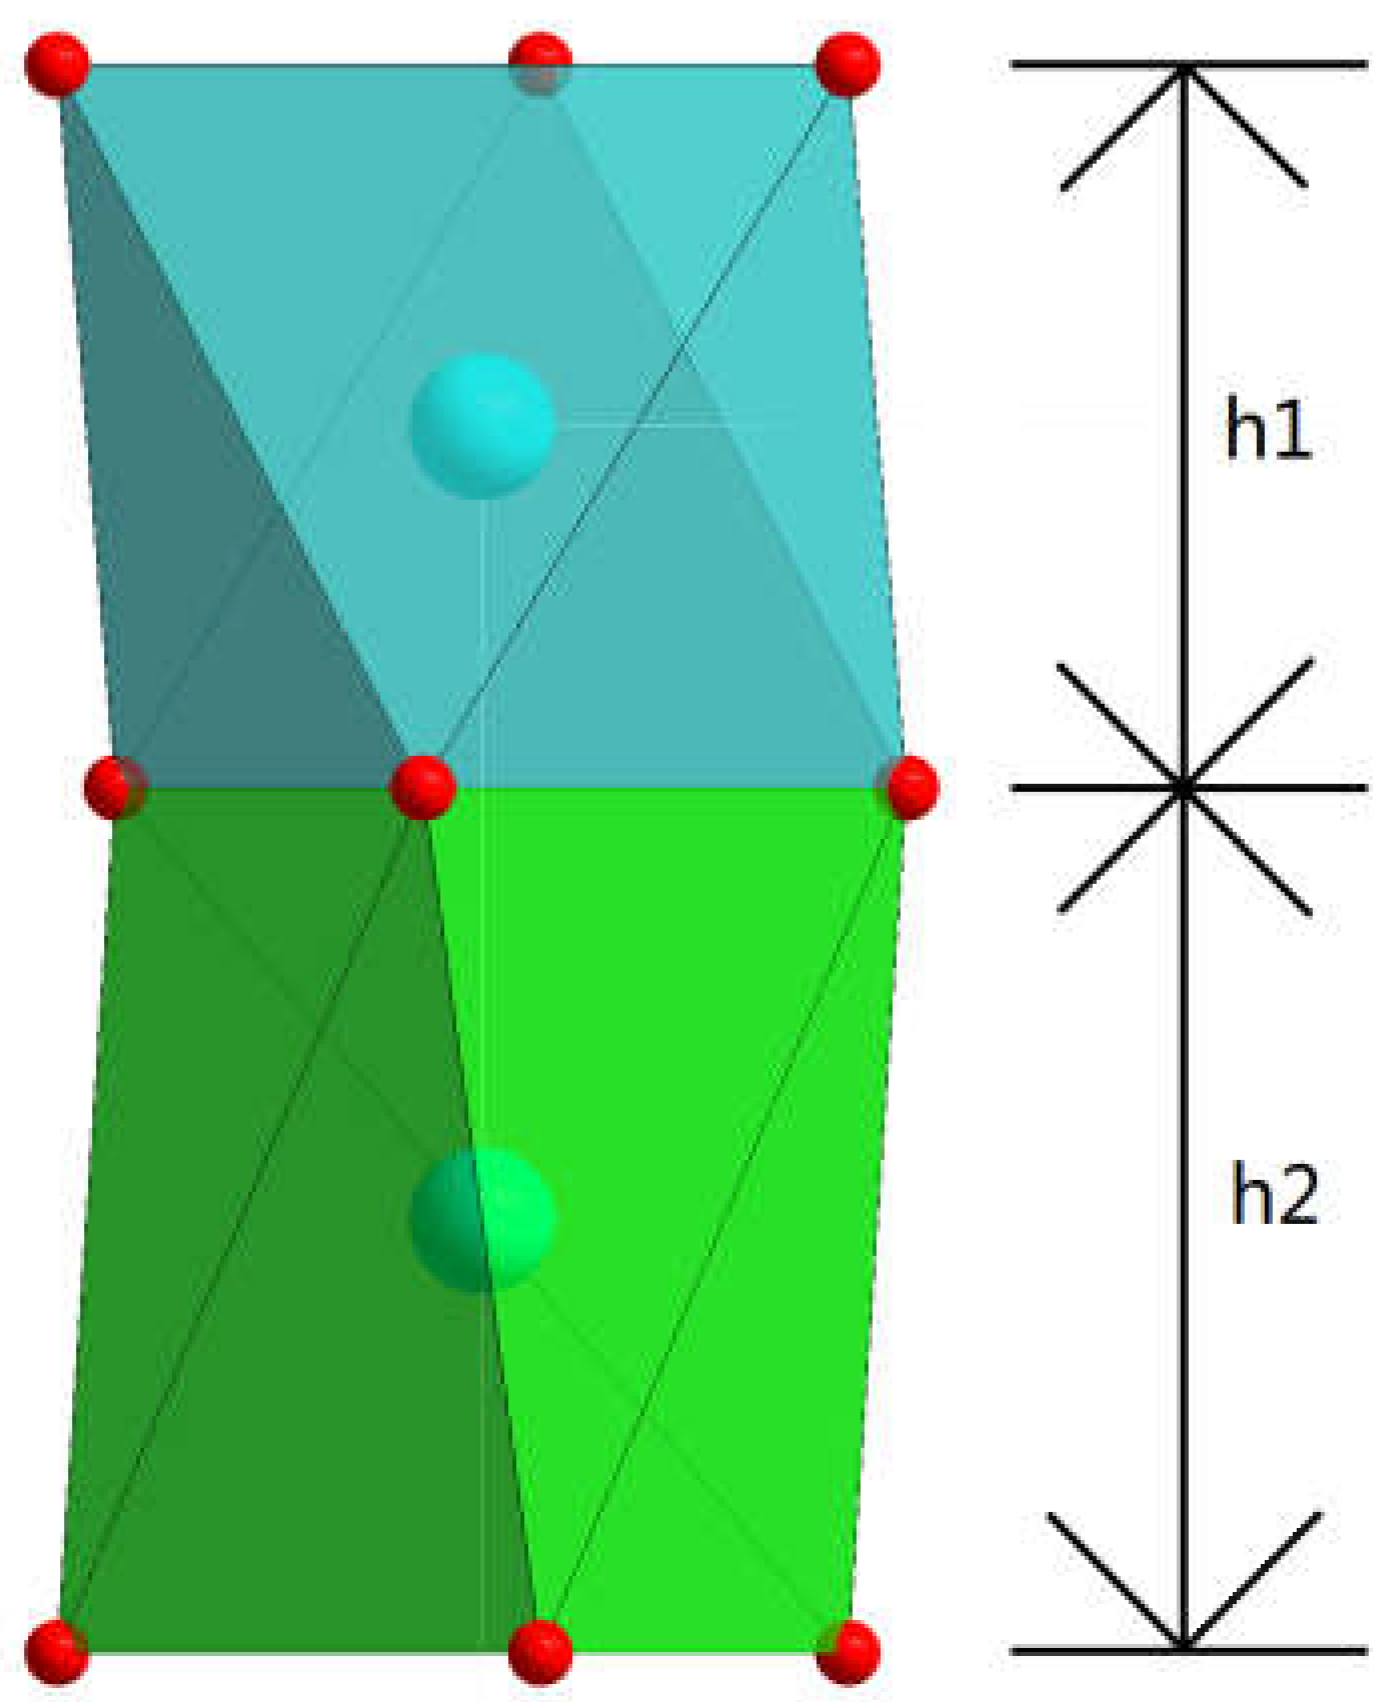
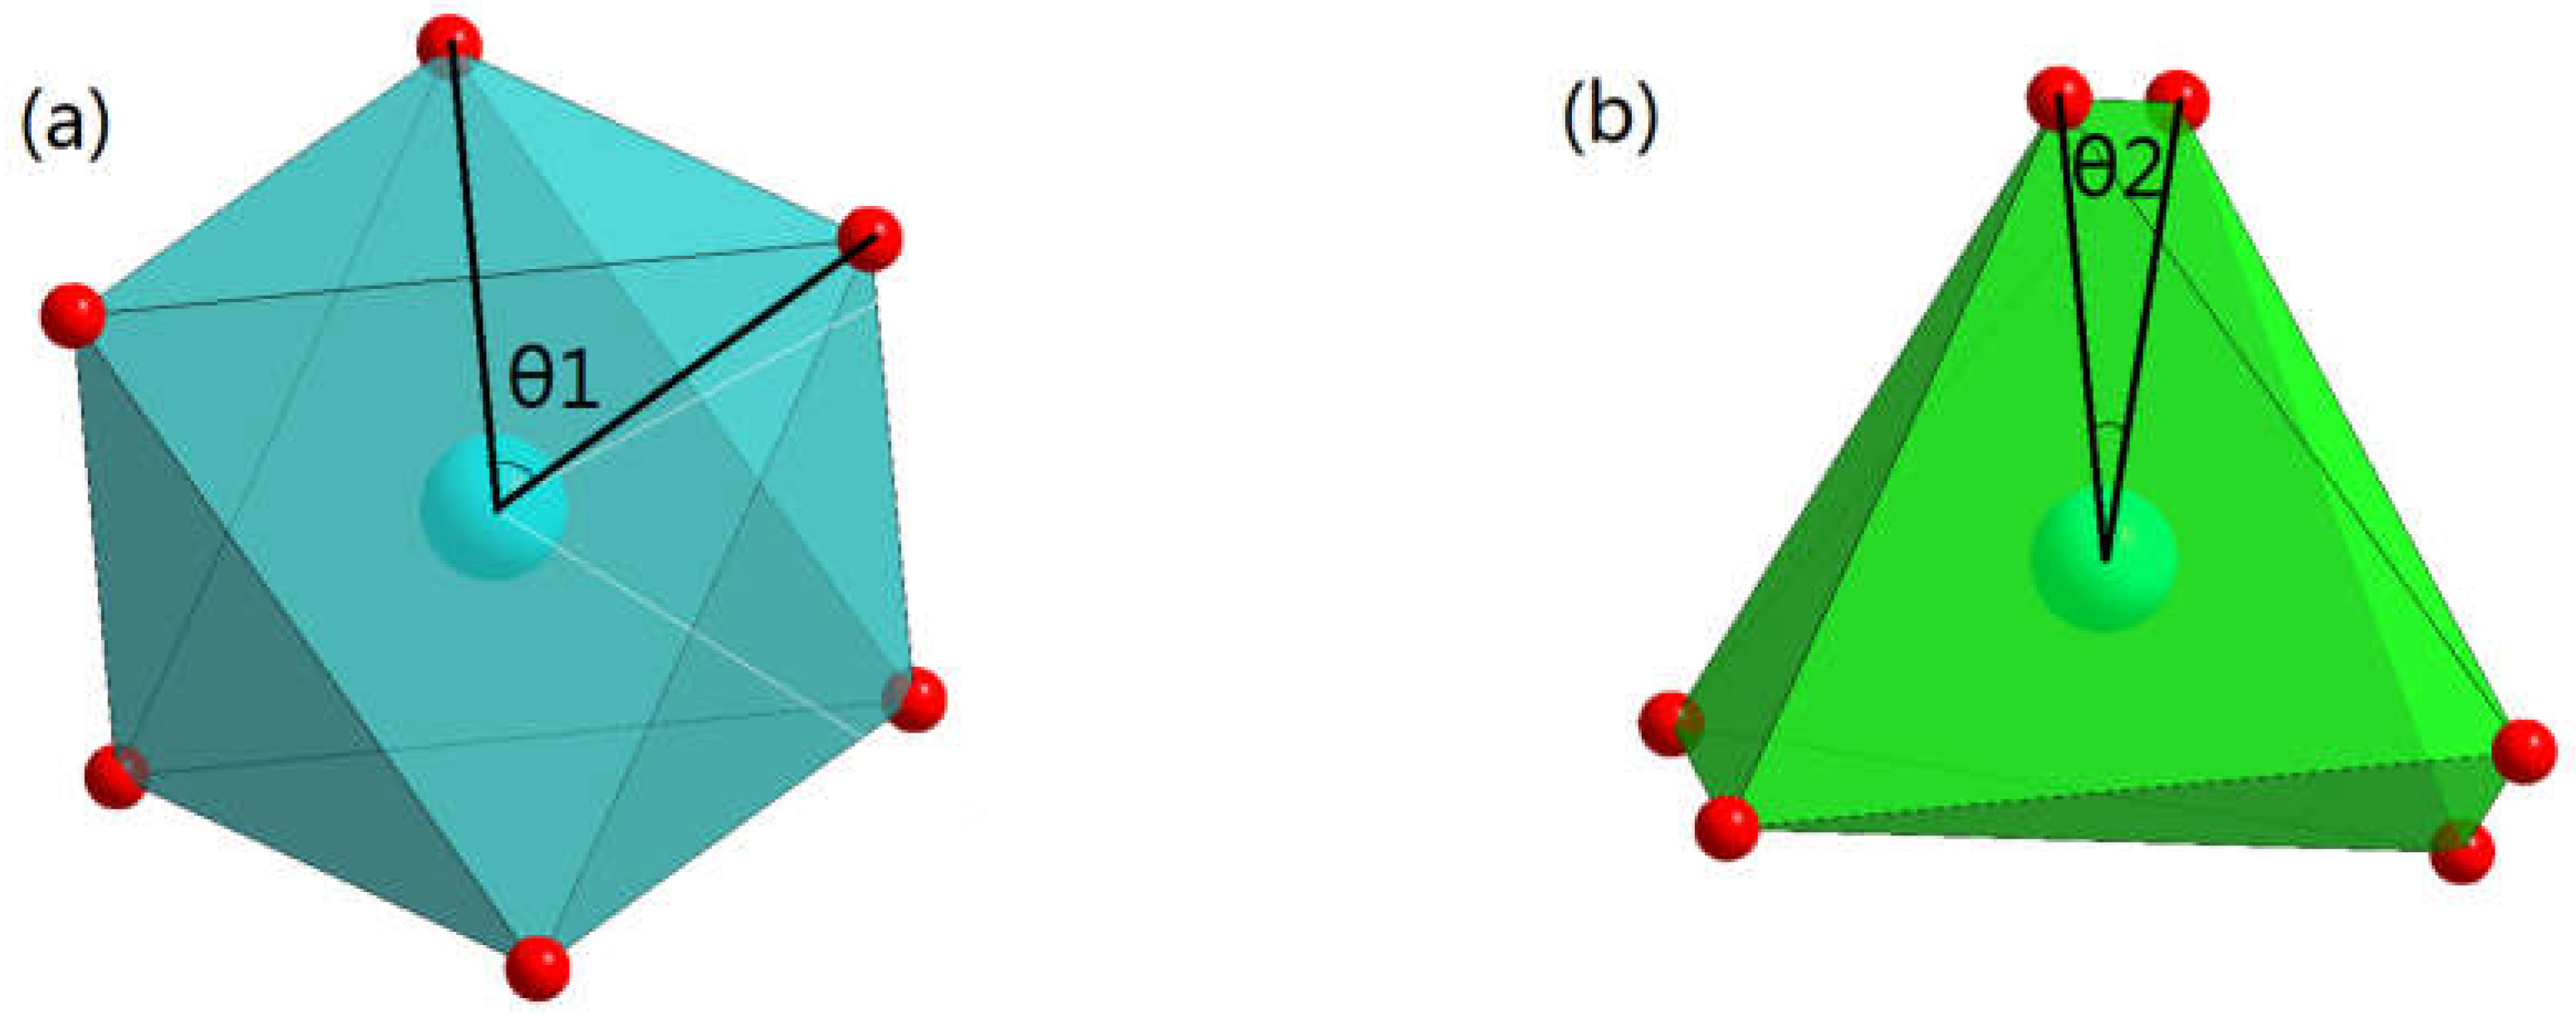
Figure 7.
Projection of the regular octahedron (a) and distorted trigonal prism (b) in the Co-O chain
along the c-axis, θ1 and θ2 in the figure represent the angles in the projection
Figure 7.
Projection of the regular octahedron (a) and distorted trigonal prism (b) in the Co-O chain
along the c-axis, θ1 and θ2 in the figure represent the angles in the projection
Ca ion is replaced by Er ion in (Ca3-xErx)Co2O6-z crystal structure. Since Er ion is positive trivalent and Ca ion is positive bivalent, Er3+ entering (Ca3-xErx)Co2O6-z structure would be less than Ca2+, and causing site vacancy. In Table 4, OccCa and OccEr represent the occupancy of Ca and Er sites, which are in the position of 18e. Moreover, the radius of Er3+ is smaller than that of Ca2+ [39], so the entry of Er ion is expected to lead to the shortening of the crystal structure of (Ca3-xErx)Co2O6-z in the direction of a&b.
In Figure 3, the crystal plane (300) can be used to represent the a&b direction, and the crystal plane (113) can approximately represent the c direction. With the increase of x, the crystal plane (300) moves towards the higher angle direction, which means the crystal structure becomes shorter in the a&b direction, and the crystal plane (113) shifts towards the lower angle direction, which means the crystal structure becomes longer in the c direction.
Figure 7 shows the c axis projection of the regular octahedron and distorted trigonal prism in the Co-O chain, and Table 4 shows the angle of θ in Figure 7. The angle θ1 of the regular octahedron is 60°, while the angle θ2 of the distorted trigonal prism is much less than 60°. With the increase of x, angle θ2 tends to become even smaller. This is the reason why the distorted trigonal prism becomes elongated in the direction of the c axis.
In conclusion, with the increase of x value in (Ca3-xErx)Co2O6-z, the diffraction peak migration direction of Ca3Co2O6 in XRD pattern is inconsistent. The structure analysis of (Ca3-xErx)Co2O6-z series samples shows that with the increase of x value, Er ions in the structure of (Ca3-xErx)Co2O6-z increase, and the radius of Er ion is smaller than that of Ca ion, because Er ion is +3 valence and Ca ion is +2 valence, The valence equilibrium makes the number of incoming Er ions less than the number of replaced Ca ions, so the structure of (Ca3-xErx)Co2O6-z is shortened in the a&b directions; As the x value increases, the Co-O chain becomes longer, so the structure of (Ca3-xErx)Co2O6-z becomes longer in the c direction.
3.2.3. (Er1-xCax)CoO3-z
ErCoO3 was found in the CoOx-ErOy boundary binary system. ErCoO3 has a perovskite structure, it is a perovskite-type oxide, and it has thermoelectric properties. The solid solution region (Er1-xCax)CoO3-z forms with the addition of doping element Ca. thirteen samples were selected near ErCoO3 to explore the boundary of the solid solution region (Er1-xCax)CoO3-z, and the range of x in solution region (Er1-xCax)CoO3-z is from 0 to 0.33.
4. Discussion
It appears that the ionic size of the alkaline-earth and lanthanide ions governs the trend of phase formation, extent of solid solution formation of (R1-xCax)CoO3-z, (R1-xCax)2O3-z, (Ca3-xRx)Co4O9-z and (Ca3-xRx)Co2O6, as well as the tie-line relationships in the CaO-CoOx-ROy systems. Because of different phase formation and different range of solid solutions in the La, Dy, and the Er systems, the tie-line relationships are substantially different, leading to different appearance of the diagrams.
Since the doped element R in CaO-CoOx-ROy series are lanthanide elements, these diagrams are expected to be related. Therefore, the next step of our present study is to compare the ternary phase diagrams of R=La [28], Dy [33] and Er at 885 ℃. Figure 8 and Figure 9 show the CaO-CoOx-ROy ternary phase diagrams of R=La and Dy.
La is the first element in the lanthanide series, and CaO-CoOx-LaOy [28] is the first phase diagram of CaO-CoOx-ROy (R is lanthanide) series at 885℃, therefore CaO-CoOx-LaOy has provided a guide for the entire series of phase diagrams. The phase diagrams of CaO-CoOx-LaOy and CaO-CoOx-ErOy were compared. The solid solution regions of (Ca3-xRx)Co4O9-z and (R1-xCax)CoO3-z existed in both systems. Although both systems contain perovskite RCoO3 phase, LaCoO3 and ErCoO3 have different structures. LaCoO3 phase is rhombohedral and with a space group of R-3c [28], while ErCoO3 phase is orthorhombic with space group Pnma. The difference in size of lanthanide ions (rLa3+>rCa2+>rEr3+) [39] results in the different structures of LaCoO3 and ErCoO3. In the CaO-CoOx-LaOy system in air at 885 ℃, there is no solid solution phenomenon near Ca3Co2O6, which is different from the CaO-CoOx-ErOy system in air at 885 ℃. And in the CaO-CoOx-LaOy system in air at 885 ℃, there is a solid solution phenomenon near La2O3, which is different from the CaO-CoOx-ErOy system in air at 885 ℃.
In the phase diagram of the CaO-CoOx-DyOy and CaO-CoOx-ErOy systems, only one solid solution region is the same, namely (Ca3-xRx)Co4O9-z, but the range of the two solid solution regions is different when R=Dy, 0≤x≤0.6, and R=Er, 0≤x≤0.9. (Ca3-xErx)Co2O6-z is a new solid solution region, and other CaO-CoOx-ROy (R is lanthanide element) phase diagrams do not show solid solution phenomenon at Ca3Co2O6 at 885 ℃.Because of the different phase formation of these three systems, the tie-line relationships are also very different. In the La system, there are four three-phase regions and four two-phase connecting tie-line bundles [28]. In the Dy system, there are four three-phase regions and three two-phase connecting the tie-line bundles [33]. In the Er system, however, due to the addition of the (Ca3-xErx)Co2O6-z phase, there are four three-phase regions and five solid solution tie-line regions.
5. Conclusions
The phase diagram of CaO-CoOx-ErOy system at 885℃ has been drawn. This phase diagram shows the phase relationships between the phases in the CaO-CoOx-ErOy ternary system, which is crucial for knowing and understanding the properties and properties of the materials in the system. There are four three phase zones and five solid solution contact zones in the system. Three series of solid solutions have been found in the CaO-CoOx-ErOy system at 885℃, which are respectively (Er1-xCax)CoO3-z (0≤x≤0.33) with simple perovskite structure, and (Ca3-xErx)Co4O9-z (0≤x≤0.9) and (Ca3-xErx)Co2O6-z (0≤x≤1.25) with perovskite-derived structures. The solid solution phenomenon will lead to changes in the structure of materials, which will lead to changes in the properties and properties of materials. The solid solution of perovskite and its derived structure in the system will affect the properties of materials. Studying the structure of materials will help to understand the changes in material properties, and help to explore the acquisition of materials with more efficient energy conversion and storage. The solid solution is formed near Ca3Co2O6. With the increase of x value in (Ca3-xErx)Co2O6-z, the diffraction peak migration direction of Ca3Co2O6 in XRD pattern is inconsistent. The structural analysis of (Ca3-xErx)Co2O6-z series samples concludes that this difference is the anisotropic expansion of the unit cell.
Author Contributions
Conceptualization, HaoCheng Wang, HaoMing Ning, ZhenJun Fan, GuangYao Liu; resources, ZhenJun Fan, GuangYao Liu; writing original draft preparation, HaoCheng Wang, HaoMing Ning; preparing figures, HaoCheng Wang, HaoMing Ning; review and editing, ZhenJun Fan, GuangYao Liu. All authors have read and agreed to the published version of the manuscript.
Funding
This work was supported by the Chinese Academy of Sciences Strategic Priority Research Program B (Grant No. XDB07010300) and the National Natural Science Foundation of China (Grant No. 11674376).
Data Availability Statement
The data that support the findings of this study are available on request from the corresponding author upon reasonable request.
Conflicts of Interest
The authors declare no conflict of interest.
References
- Xiao Z.W.; Song Z.N.; Yan Y.F. From Lead Halide Perovskites to Lead-Free Metal Halide Perovskites and Perovskite Derivatives. Adv Mater. 2019, 31(47), pp. 1803792. [CrossRef]
- Shen L.N.; Chen R.; Zhang D.; et al. High-Performance Perovskite Photovoltaics by Heterovalent Substituted Mixed Perovskites. Adv. Funct. Mater. 2022, 32(47), pp. 2207911. [CrossRef]
- Wang J.F.; Luo S.Q.; Lin Y.; et al. Templated growth of oriented layered hybrid perovskites on 3D-like perovskites. Nat Commun. 2020, 11, pp. 582. [CrossRef]
- Mohapatra A.; Singh N.; Singh A.; et al. Solution-Processed Perovskite/Perovskite Heterostructure Via a Grafting-Assisted Transfer Technique. ACS Appl Energy Mater. 2021, 4(2), pp. 1962-1971. [CrossRef]
- Clark C.P.; Mann J.E.; Bangsund J.S.; et al. Formation of Stable Metal Halide Perovskite/Perovskite Heterojunctions. ACS Energy Lett. 2020, 5(11), pp. 3443-3451. [CrossRef]
- Riffat S.B.; Ma X. Thermoelectrics: a review of present and potential applications. Appl Therm Eng. 2003, 23(8), pp. 913-935. [CrossRef]
- Ma Z.; Wei J.T.; Song P.S.; et al. Review of experimental approaches for improving zT of thermoelectric materials. Mat Sci Semicon Proc. 2021, 121, pp. 105303. [CrossRef]
- Zhang S.H.; Niu X.B.; Xie Y.Q.; et al. High intrinsic ZT in InP3 monolayer at room temperature. J Phys-Condens Mat. 2019, 31, 365501. [CrossRef]
- Fjellva G.H.; Gulbrandsen E.; Aasland S.; et al. Crystal Structure and Possible Charge Ordering in One-Dimensional Ca3Co2O6. J Solid State Chem. 1996, 124(1), pp. 190-194. [CrossRef]
- Hardy V.; Flahaut D.; Fresard R.; et al. Anisotropic susceptibility of the geometrically frustrated spin-chain compound Ca3Co2O6. J Phys-Condens Mat. 2007, 19(14), pp. 1898-1908. [CrossRef]
- Hardy V.; Lees M.R.; Petrenko O.A.; et al. Temperature and time dependence of the field-driven magnetization steps in Ca3Co2O6 single crystals. Phys Rev B. 2004, 70(6), pp. 064424. [CrossRef]
- Masset A.C.; Michel C.; Maignan A.; et al. Misfit-layered cobaltite with an anisotropic giant magnetoresistance: Ca3Co4O9. Phys Rev B. 2000, 62(1), 166-175. [CrossRef]
- Kenfaui D.; Chateigner D.; Gomina M.; et al. Texture, mechanical and thermoelectric properties of Ca3Co4O9 ceramics. J Appl Ceram Tec. 2009, 490(1), pp. 472-479. [CrossRef]
- Saini S.; Yaddanapudi H.S.; Tian K.; et al. Terbium Ion Doping in Ca3Co4O9: A Step towards High-Performance Thermoelectric Materials. Sci Rep. 2017, 7, pp. 44621. [CrossRef]
- Ren G.K.; Lan J.L.; Zhao L.D.; et al. Layered oxygen-containing thermoelectric materials: Mechanisms, strategies, and beyond. Mater. Today 2019, 29, pp. 68-85. [CrossRef]
- Tanabe K.; Okazaki R.; et al. Optical conductivity of layered calcium cobaltate Ca3Co4O9. J Phys-Condens Mat. 2016, 085601. [CrossRef]
- Li S.W.; Funahashi R.; Matsubara I.; et al. Synthesis and thermoelectric properties of the new oxide ceramics Ca3-xSrxCo4O9+δ (x=0.0-1.0). Ceram Int. 2001, 27(3), pp. 321-324. [CrossRef]
- Bhattacharya S.; Aswal D.K.; Singh A.; et al. Anisotropic electrical transport studies of Ca3Co4O9 single crystals grown by the flux method. J Cryst Growth. 2005, 277(1-4), pp. 246-251. [CrossRef]
- Wolf M.; Rehder L.; Steinbach F.; et al. Combination of Laser and Thermal Sintering of Thermoelectric Ca3Co4O9 Films. Chem Ing Tech. 2021, 94(1), pp. 177-185. [CrossRef]
- Li Y.N.; Wu P.; Zhang S.P.; Pei Y.L.; et al. Enhanced thermoelectric properties of Ca3Co4O9 by adding nano MoSi2. Ceram Int. 2022, 48(22), pp. 33967-33975. [CrossRef]
- Terasaki I.; Sasago Y.; et al. Large thermoelectric power in NaCo2O4 single crystals. Phys Rev B. 1997, 56(20), R12685–R12687. [CrossRef]
- Wang S.F.; Venimadhav A.; Guo S.M.; et al. Structural and thermoelectric properties of Bi2Sr2Co2Oy thin films on LaAlO3 (100) and fused silica substrates. Appl Phys Lett. 2009, 94(2), pp. R12685. [CrossRef]
- Wong-Ng W.; Yan Y.; Kaduk J.A.; Tang X.F. X-ray powder diffraction reference patterns for Bi1-xPb(x)OCuSe. Power Diffr. 2006, 0885. [CrossRef]
- Wong-Ng W.; Liu G.Y.; Martin J.; et al. Phase compatibility and thermoelectric properties of compounds in the Sr–Ca–Co–O system. J Appl Phys. 2010, 107(3), pp. 188-488. [CrossRef]
- Wong-Ng W.; Luo T.; Xie W.; et al. Phase diagram, crystal chemistry and thermoelectric properties of compounds in the Ca-Co-Zn-O system. J Solid State Chem. 2011, 184(8), pp. 2159-2166. [CrossRef]
- Li S.W.; Funahashi R.; Matsubara I.; et al. Synthesis and Thermoelectric Properties of the New Oxide Materials Ca3-xBixCo4O9+δ (0.0 < x < 0.75). Chem Mater. 2000, 31(47), pp. 2424-2427. [CrossRef]
- Thorogood G.J.; Orain P.Y.; Ouvry M.; Piriou B.; Tedesco T.; Wallwork K.S.; Herrmann J.; James M. Structure, crystal chemistry and magnetism of rare earth calcium-doped cobaltates: Ln2-xCaxCoO4+δ (Ln= Pr, Nd, Sm, Eu and Gd). Solid State Sci. 2011, 13(12), pp. 2113-2123. [CrossRef]
- Wong-Ng W.; Laws W.J.; Yan Y.G. Phase diagram and crystal chemistry of the La-Ca-Co-O system. Solid State Sci. 2013, 17, pp. 107–110. [CrossRef]
- Wong-Ng W.; Laws W.J.; Lapidus S.H.; et al. Phase equilibria and crystal chemistry of the CaO-Nd2O3-CoOz system at 885℃ in air. Solid State Sci. 2014, 215, pp. 128-134. [CrossRef]
- Wong-Ng W.; Laws W.J.; Lapidus S.H.; et al. Phase equilibria and crystal chemistry of the CaO-Sm2O3-CoOz system at 885℃ in air. Solid State Sci. 2015, 48, pp. 31-38. [CrossRef]
- Wong-Ng W.; Laws W.J.; Kaduk J.A. Crystal chemistry and phase equilibria of the CaO-Eu2O3-CoOz system at 885℃ in air. Solid State Sci. 2016, 2558(16), pp. 30391. [CrossRef]
- Wong-Ng W.; Laws W.J.; Lapidus S.H.; et al. Phase equilibria and crystal chemistry of the CaO-Gd2O3-CoOz system at 885℃ in air. Solid State Sci. 2017, 72, pp. 128-134. [CrossRef]
- Wong-Ng W.; Laws W.J.; Kaduk J.A. Crystal chemistry and phase equilibria of the CaO-Dy2O3-CoOz system at 885℃ in air. Solid State Sci. 2018, 88, pp. 57-62. [CrossRef]
- Wong-Ng W.; Laws W.J.; Huang Q.; et al. Crystal chemistry and phase equilibria of the CaO-Ho2O3-CoOz system at 885℃ in air. Solid State Sci. 2020, 107, pp. 106348. [CrossRef]
- Gates-Rector S.D.; Blanton T.N. The Powder Diffraction File: A quality Materials Characterization Database. Powder Diffr. 2019, 34, pp. 352–360.
- Rietveld H.M. A method for including the line profiles of neutron powder diffraction peaks in the determination of crystal structures. Acta Crystallogr. 1966, 229, pp. 151.
- Rodriguez-Carvajal J.L. Recent advances in magnetic structure determination by neutron powder diffraction. Physica B. 1993, 19255. [CrossRef]
- Jain A.; Singh S.; Yusuf S.M. Structural and magnetic properties of spin chain compounds Ca3Co2-xFexO6, Phys.Rev.B 2006, 74 pp. 174419. [CrossRef]
- Shannon R.D. Revised Effective Ionic Radii and Systematic Studies of Interatomie Distances in Halides and Chaleogenides. Acta Cryst. 1976, A32, pp. 751-767. [CrossRef]
Figure 8.
Phase diagram of the CaO-CoOx-LaOy system at 885 °C in air [28].
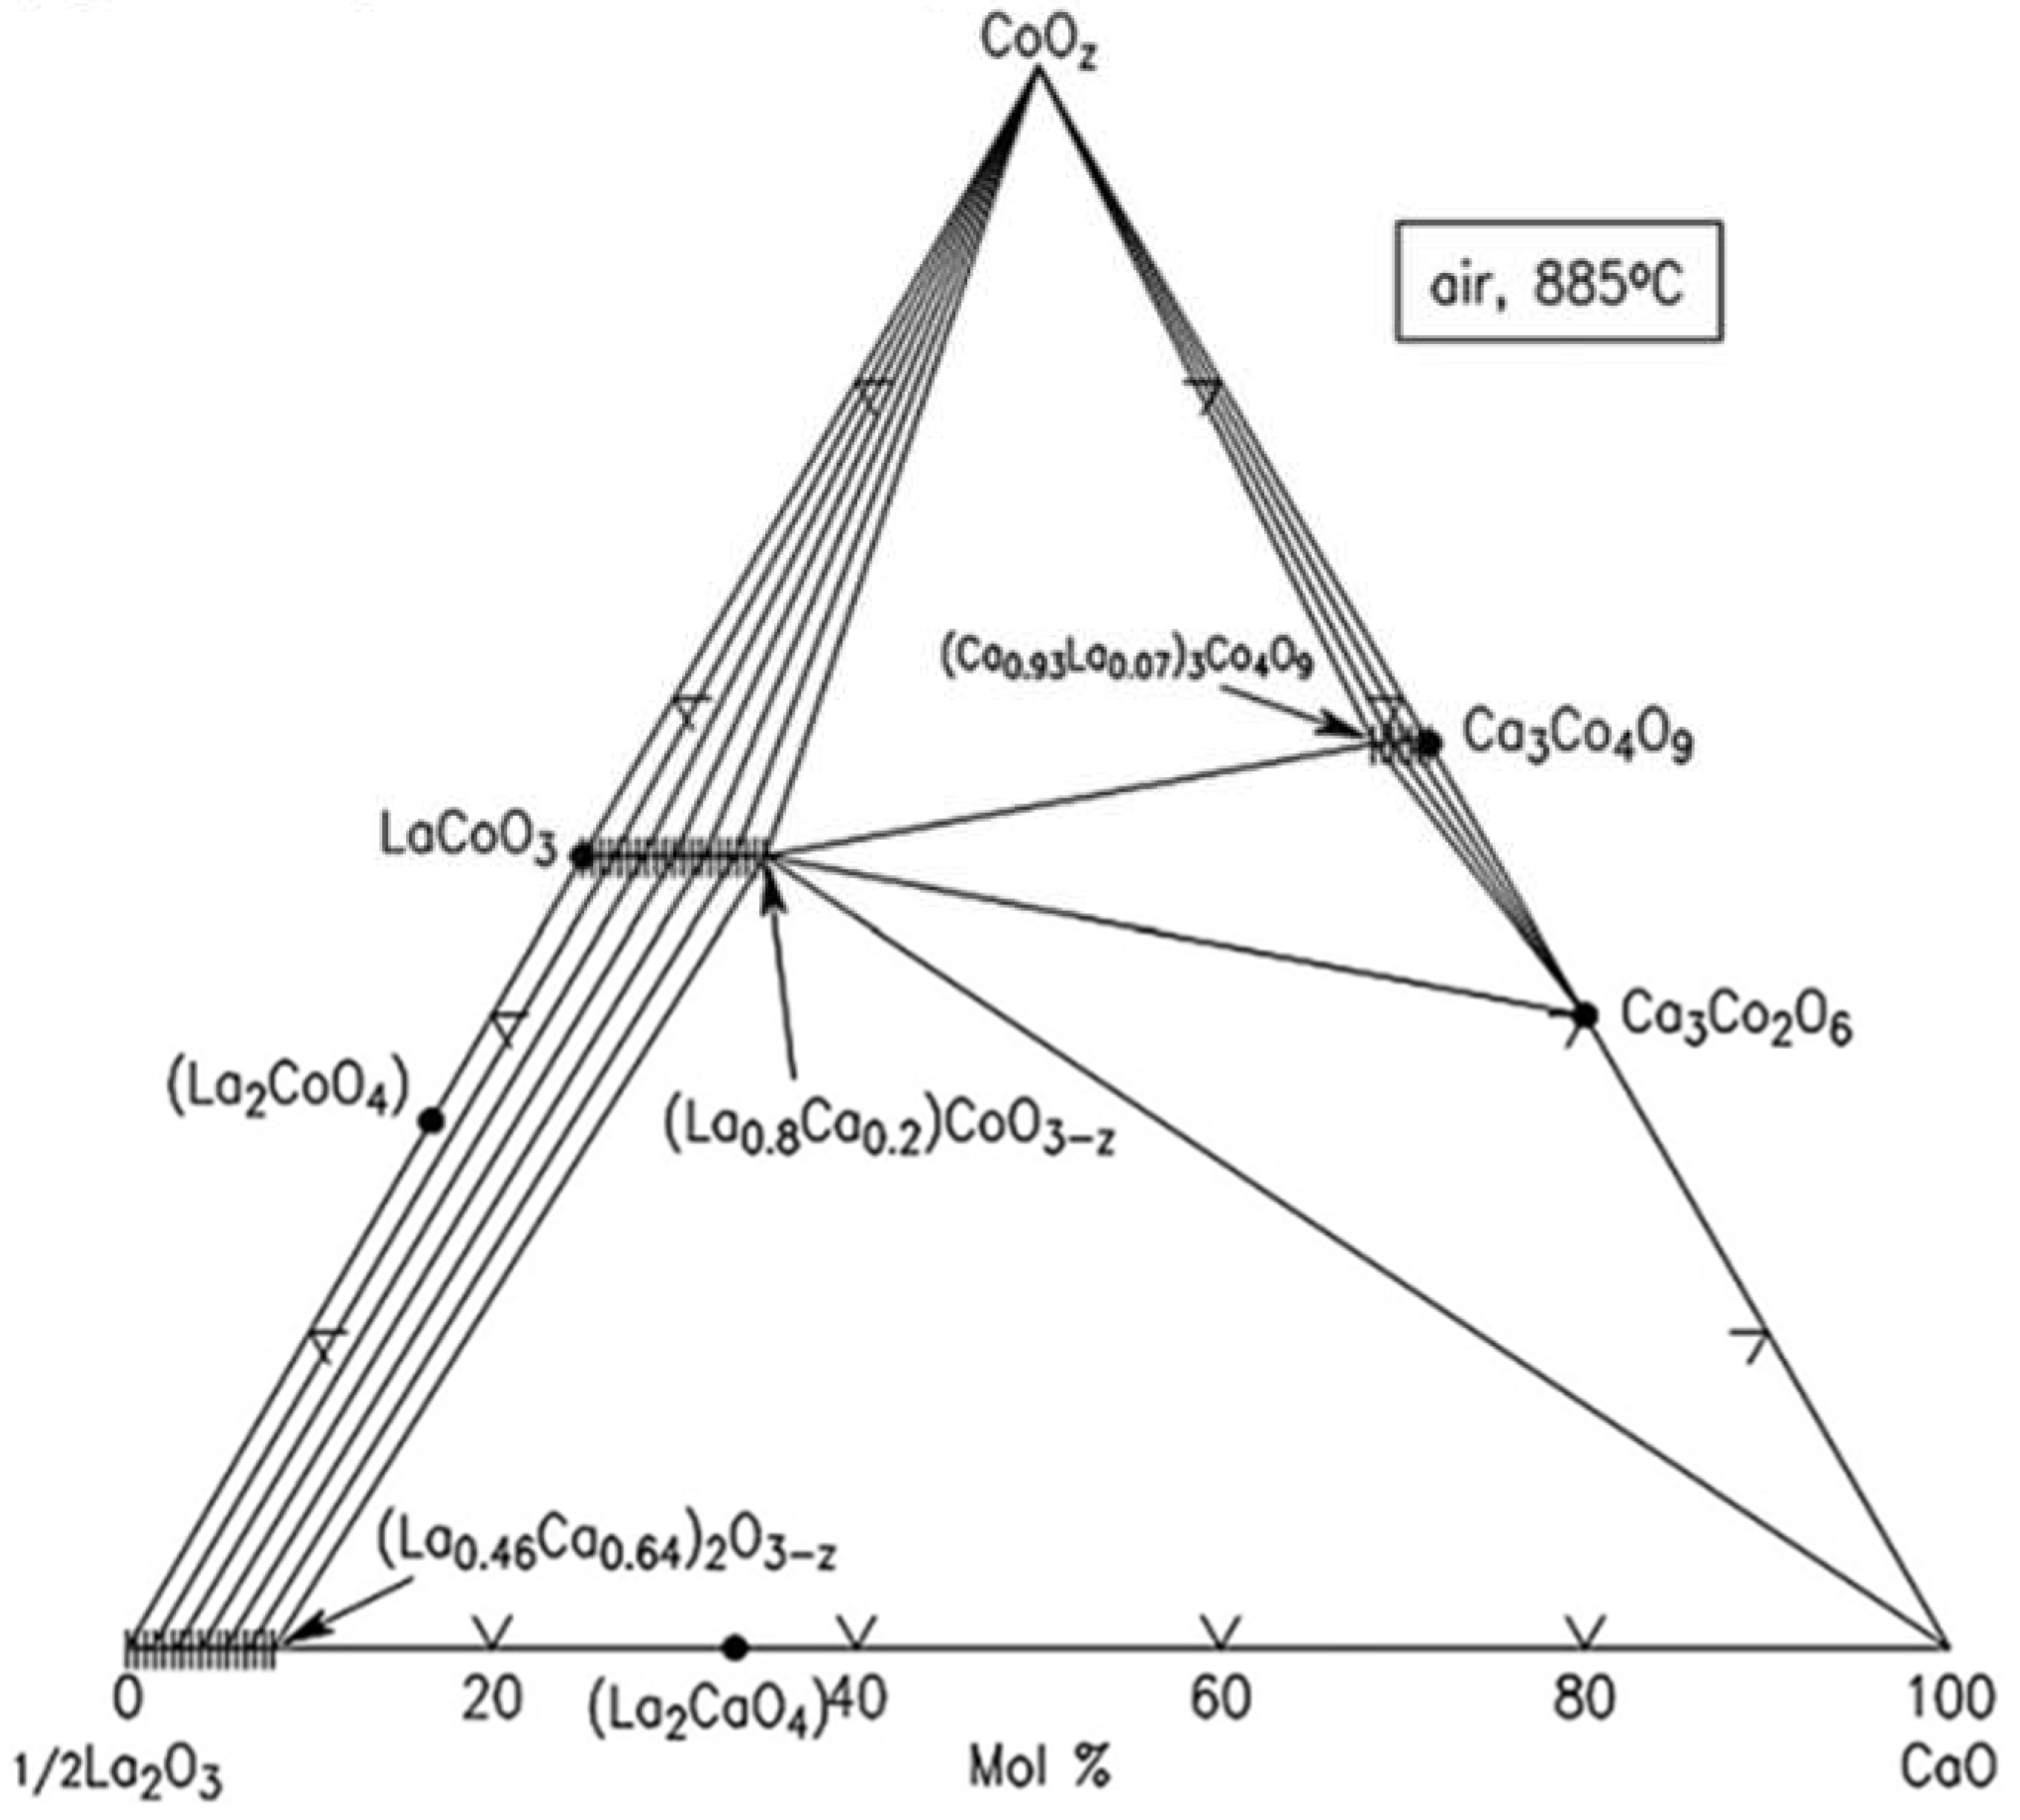
Figure 9.
Phase diagram of the CaO-CoOx-DyOy system at 885 °C in air [33].
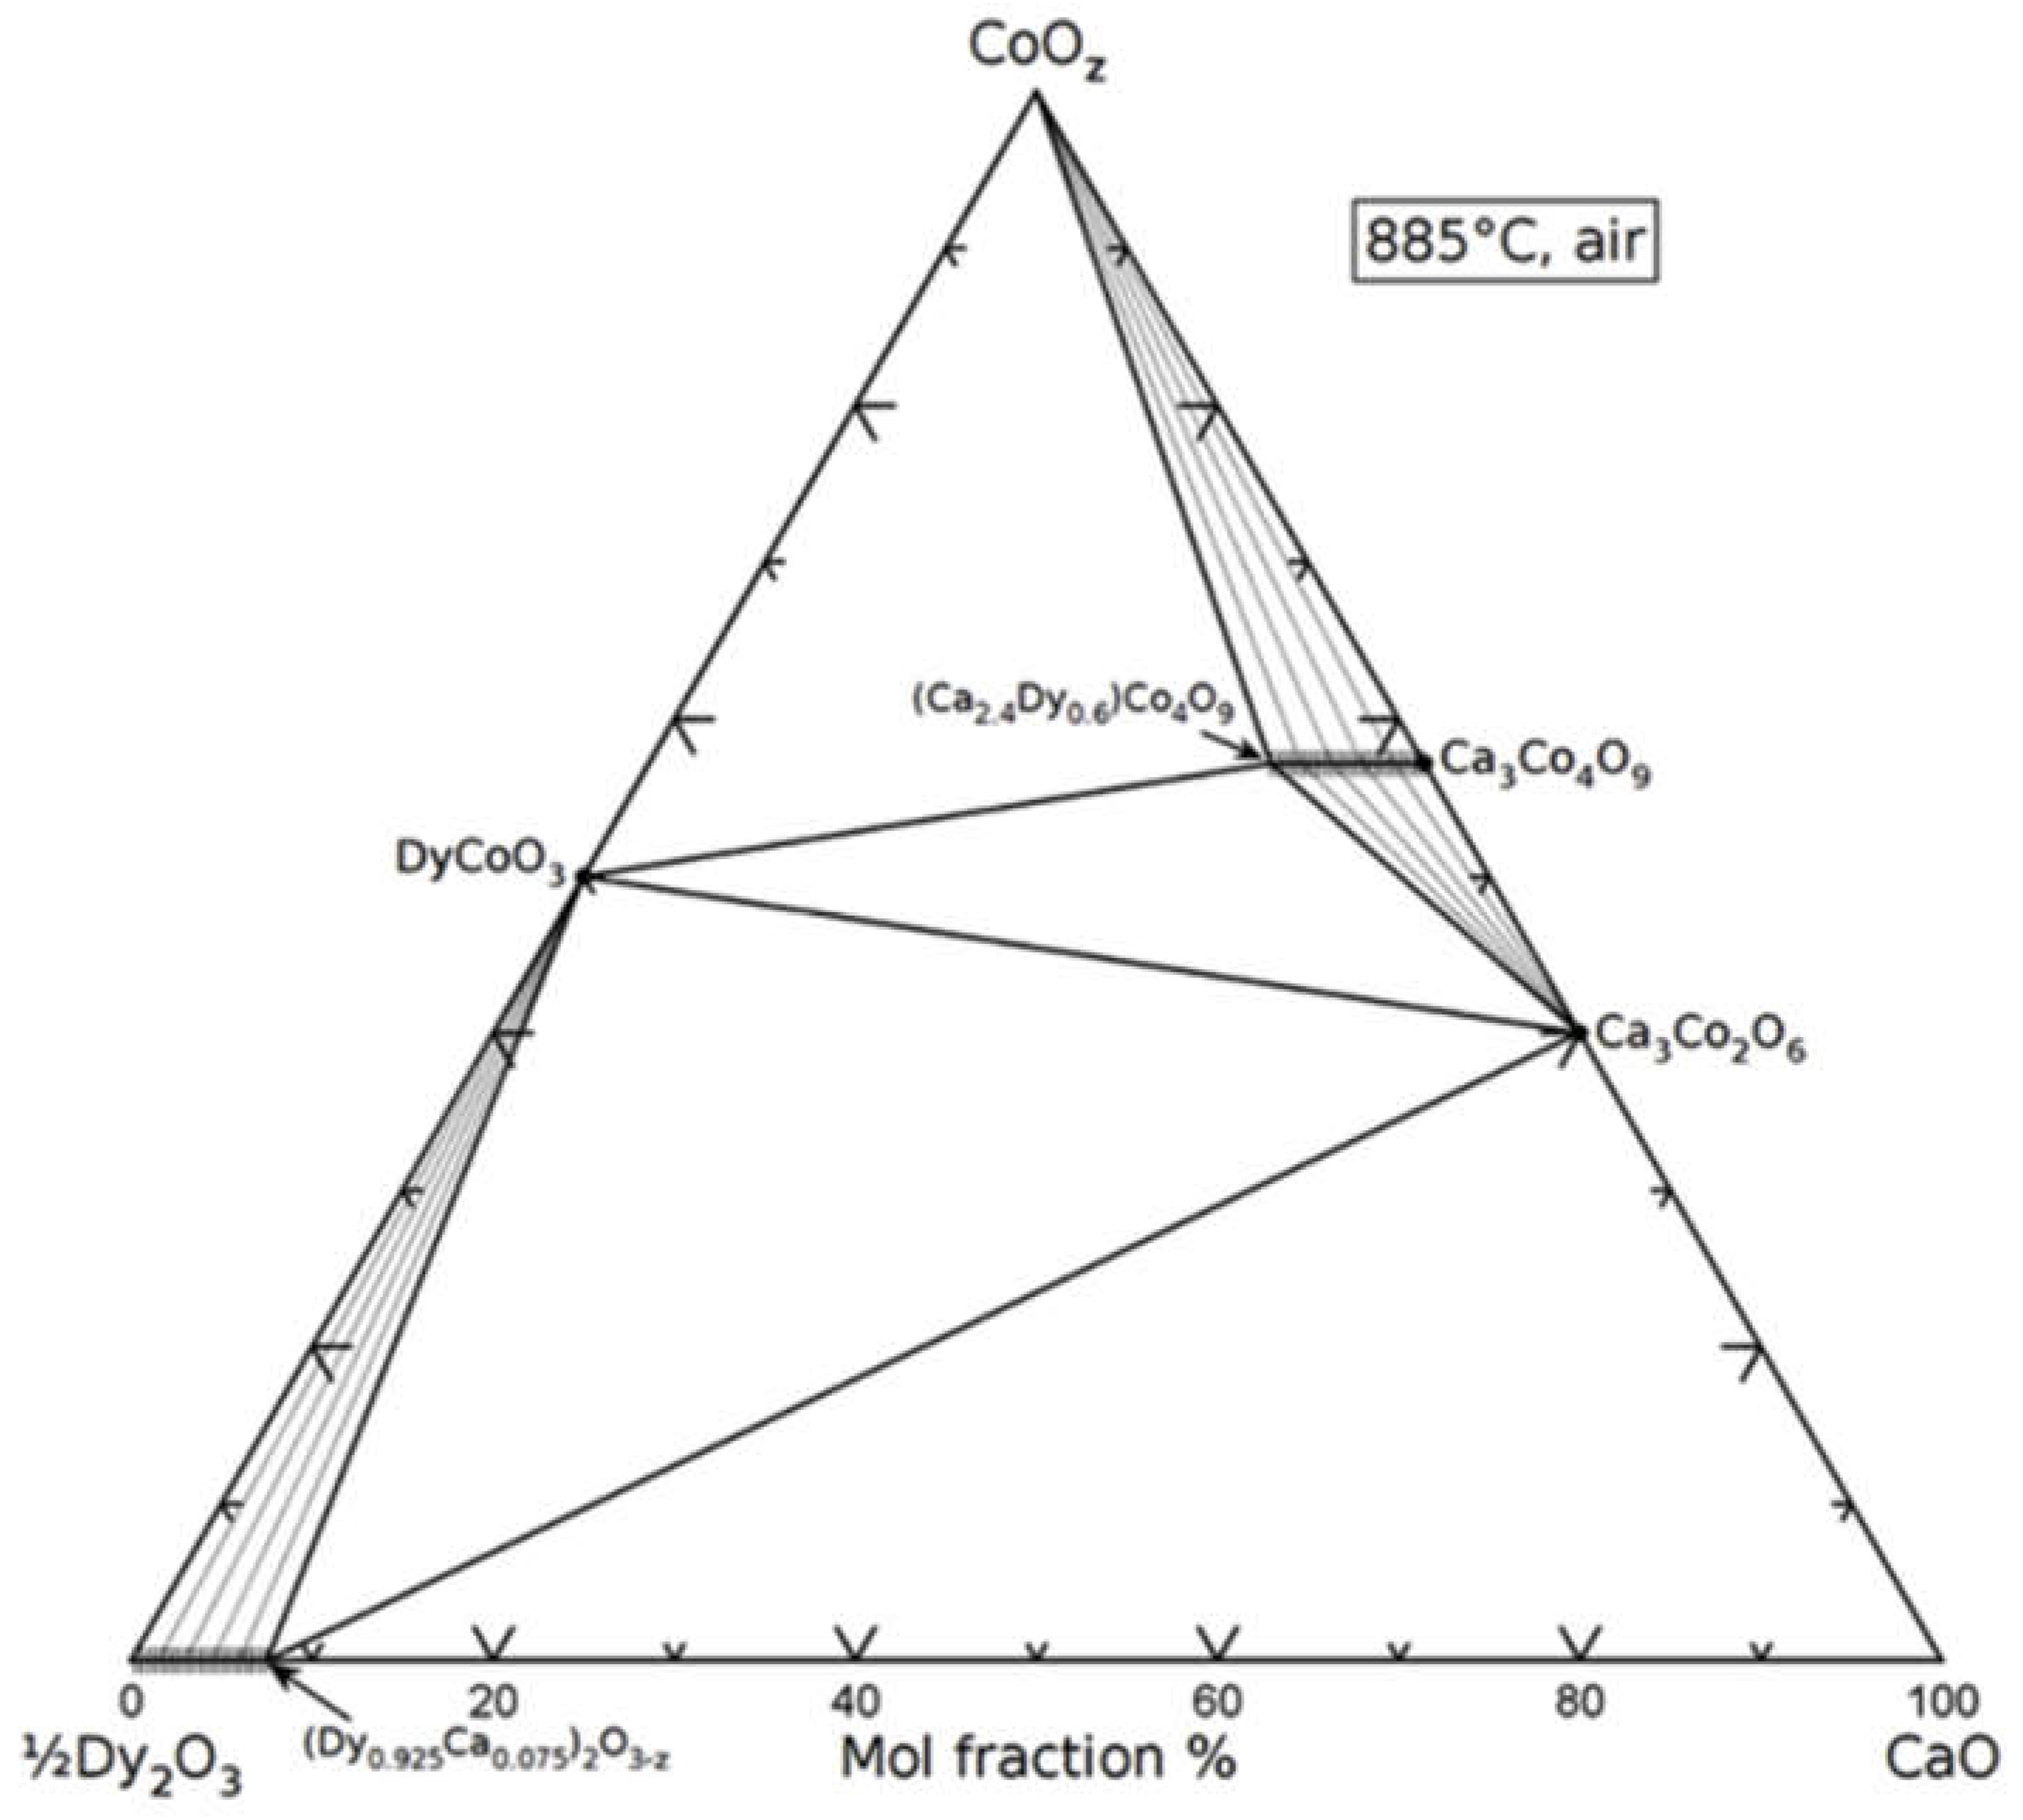
Table 2.
Refinement parameters of (Ca3-xErx)Co2O6-z (x=0, 0.25, 0.5, 1). The bracketed values represent standard deviations.
Table 2.
Refinement parameters of (Ca3-xErx)Co2O6-z (x=0, 0.25, 0.5, 1). The bracketed values represent standard deviations.
| x | a&b (Å) | c (Å) | Rwp | χ2 |
| 0 | 9.07628(8) | 10.38005(12) | 11.0 | 2.22 |
| 0.25 | 9.05344(21) | 10.44059(28) | 10.8 | 3.53 |
| 0.5 | 9.02907(22) | 10.50383(28) | 9.57 | 3.43 |
| 1 | 8.98770(12) | 10.58704(17) | 6.79 | 2.47 |
Table 3.
Atomic coordinates and displacement parameters for (Ca3-xErx)Co2O6-z. The bracketed values represent standard deviation.The numerical error of Bios obtained by XRD is relatively large, so the neutron diffraction Bios [38] is used in the finishing.
Table 3.
Atomic coordinates and displacement parameters for (Ca3-xErx)Co2O6-z. The bracketed values represent standard deviation.The numerical error of Bios obtained by XRD is relatively large, so the neutron diffraction Bios [38] is used in the finishing.
| x | y | z | Biso [38] | ||
| Ca3Co2O6 | |||||
| Ca | 0.36986(2) | 0 | 0.25 | 0.39 | |
| Co1 | 0 | 0 | 0 | 0.37 | |
| Co2 | 0 | 0 | 0.25 | 0.48 | |
| O | 0.17804(6) | 0.02561(8) | 0.11402(5) | 0.53 | |
| (Ca2.75Er0.25)Co2O6-z | |||||
| Ca/Er | 0.36834(3) | 0 | 0.25 | 0.39 | |
| Co1 | 0 | 0 | 0 | 0.37 | |
| Co2 | 0 | 0 | 0.25 | 0.48 | |
| O | 0.17787(11) | 0.02463(13) | 0.11268(7) | 0.53 | |
| (Ca2.5Er0.5)Co2O6-z | |||||
| Ca/Er | 0.36773(3) | 0 | 0.25 | 0.39 | |
| Co1 | 0 | 0 | 0 | 0.37 | |
| Co2 | 0 | 0 | 0.25 | 0.48 | |
| O | 0.17959(12) | 0.02464(14) | 0.11238(8) | 0.53 | |
| (Ca2Er1)Co2O6-z | |||||
| Ca/Er | 0.36688(2) | 0 | 0.25 | 0.39 | |
| Co1 | 0 | 0 | 0 | 0.37 | |
| Co2 | 0 | 0 | 0.25 | 0.48 | |
| O | 0.18265(12) | 0.02475(13) | 0.11010(7) | 0.53 | |
Table 4.
Structural parameters of (Ca3-xErx)Co2O6-z. In this table, h1 and h2 represent the distance between the planes of oxygen ion perpendicular to the c-axis (Figure 6). Columns OccCa and OccEr represent the occupancy of Ca and Er ions, which are in the position of 18e. θ1 and θ2 are the angles in the projection of Figure 7, the bracketed values represent standard deviation.
| x | h1(Å) | h2(Å) | h1+h2(Å) | OccCa | OccEr | θ1(degree) | θ2(degree) |
| 0 | 2.367 | 2.823 | 5.19 | 1 | 0 | 60.000(44) | 15.290(39) |
| 0.25 | 2.3529 | 2.8674 | 5.2203 | 0.916 | 0.076 | 60.000(53) | 14.683(52) |
| 0.5 | 2.3608 | 2.8911 | 5.2519 | 0.834 | 0.16 | 60.000(51) | 14.540(52) |
| 1 | 2.3312 | 2.9623 | 5.2935 | 0.666 | 0.298 | 60.000(45) | 14.349(38) |
Disclaimer/Publisher’s Note: The statements, opinions and data contained in all publications are solely those of the individual author(s) and contributor(s) and not of MDPI and/or the editor(s). MDPI and/or the editor(s) disclaim responsibility for any injury to people or property resulting from any ideas, methods, instructions or products referred to in the content. |
© 2023 by the authors. Licensee MDPI, Basel, Switzerland. This article is an open access article distributed under the terms and conditions of the Creative Commons Attribution (CC BY) license (http://creativecommons.org/licenses/by/4.0/).
Copyright: This open access article is published under a Creative Commons CC BY 4.0 license, which permit the free download, distribution, and reuse, provided that the author and preprint are cited in any reuse.


