Submitted:
04 May 2023
Posted:
22 May 2023
You are already at the latest version
Abstract
The unsolved problem in three-dimensional surgical planning for patients with facial deformity, dysgnathia, or asymmetry is the lack of a normative database of “norm skulls” that can be used as treatment objectives. A study was conducted on 90 Eurasian persons (46 male and 44 female adults) with normal and balanced facial appearance, skeletal Class I pattern, and proper interincisal relationship with normal occlusion. Cone-beam computed tomography was performed. 18 landmarks were digitized and 3D cephalometric measurements of overall facial features, skull, midface and mandible were performed and analyzed by means of proportions calculated from the landmarks. Male and female skulls were analyzed as well as subdivisions revealed by cluster analysis. The data showed that four subtypes of skulls were distinguishable with statistical significance (p< 0,05). A male and a female type subdivided in a brachiocephalic and dolichocephalic phenotype could be identified. For each type then a mean shape was calculated by a Procrustes transformation, which in turn was used to create four template skulls from a male and a female skull by means of a thin plate spline transformation. The normative data of the subtypes can individually serve as a guide for orthodontic surgery, especially helpful in 3D plan-ning and execution of craniofacial operations.
Keywords:
3D cephalometry
; norm skull
; skull anatomy
; Procrustes analysis
1. Introduction
3D technologies now form the basis for a significant expansion of diagnostic and treatment options in dentistry and oral surgery. These include devices such as the intraoral scanner, imaging techniques such as computed tomography (CT), cone beam computed tomography (CBCT) and magnetic resonance imaging (MRI) as well as the corresponding treatment planning software and CAD/CAM systems. They pave the way for clinicians to significantly improve patient care while reducing treatment planning time [1,2]. These technologies allow the precise three-dimensional reproduction of anatomical structures. However, conventional orthognathic surgery planning is up to now commonly done on computer assisted two-dimensional surgical simulation systems, which rely on photographs and cephalograms [3,4]. Additionally, a facebow and bite records are used in order to adequately register the patients’ bite and the jaw position in an articulator. In this way, surgical displacements can be simulated using the patients’ cast models, as it is required for surgical splint manufacturing. Also, the lateral cephalometric x-ray is still used for planning of orthognathic surgery, although this obviously only provides a two-dimensional image and is not true to scale. While these methods are well established, the use of a mechanical articulator and two-dimensional imaging for planning of three-dimensional procedures can lead to imprecisions. Geometrical distortions in craniofacial malformations, craniofacial asymmetries, structural overlap, and incorrect positioning of the head can affect the accuracy of the two-dimensional assessment [5,6].
Today, in orthodontics and orofacial orthopedics, the cephalometric 3D analysis is an important tool. In fact, for some of the above problems in two-dimensional design, three-dimensional simulation systems using CBCT data have proven to be a solution. Such 3D cephalometry allows for a more detailed analysis of the craniofacial structure [7]. With this approach, it is possible not only to detect more easily but also to quantify craniofacial malformations, asymmetries, longitudinal growth and small occlusal changes. 3D images have been shown to more accurately capture anatomical information and provide more precise quantitative measurements compared to 2D images [8]. Since most common cephalometric measurements have been shown to be compatible with 3D volumetric images, there is an effort to obtain a standardized reference for the craniofacial structure of normal dentofacial patterns in a population. In a 3D approach, craniofacial and maxillofacial segments can be defined and positioned by translation with respect to the three spatial axes (x, y, and z), and adjustments are made by rotation about these axes, representing "roll," "pitch," and "yaw." [9,10]. Whereas the technique of segmentation and movement is technically solved and can be easily performed, the unsolved problem in three-dimensional planning is the lack of a normative database of “norm skulls”, as these skulls can be used as the positioning data of jaw movements. Until now, digital surgical planning in terms of a definitive jaw position has been based more on "eye measurement". Normative values of 3D cephalometry were obtained for different ethnic groups. Different facial characteristics and average values were found between ethnic groups, which should be taken into account in treatment planning. [11,12,13,14,15]. Personalized medicine tends to incorporate intrinsic features in the planning of therapy. The question arises whether the overlay of norm-skulls can be applicated more precisely to the phenotypic pattern of individual skulls. As no one to date has analyzed whether skulls with normal and balanced facial appearance, skeletal Class I pattern, and proper interincisal relationship with normal occlusion can be subdivided and clustered in groups, we aimed to investigated 3D landmark positions biostatistically.
2. Materials and Methods
Anonymized Cone beam computed tomography (CBCT) of physiological human skulls of 90 Eurasian persons (46 male and 44 female adults) with normal and balanced facial appearance, skeletal Class I pattern, and proper interincisal relationship with normal occlusion were used for the study. In addition, the Medical Faculty of the University of Münster provided one male and one female skull, that have been scanned with a computed tomography (CT) in highest resolution, in order to be a template skull for further investigations in our study. The following parameters have been used for: CBCT: 576x576 pixel, pixel spacing 0.4x0.4mm, slice thickness 0.4 mm; CT: 512x512 pixel, pixel spacing 0.36 x 0.36 mm; slice thickness 0.4 mm.
DICOM data were saved and subsequently imported into the open source software 3D Slicer (version 4.11.2021, www.slicer.org). In order to create a virtual model of the facial skull, automatic threshold-based segmentation was performed. Artifacts triggered by prosthodonttic and conservative restorations were manually corrected in affected slices by using the tools “scissor” and “erase” in coronal view. Pseudo foramina were closed using the “paint” tool. The mesh was exported as an STL file and imported into MeshLab open source software (version 2022.02, www.meshlab.net). Remaining artifacts of the created models were removed. The created data sets were exported to PLY format.
Evaluating sexual Dimorphism
To analyze the gender-specific characteristics of the skulls, shapes were first defined on the basis of the recorded landmarks. For this purpose, the landmarks were arranged in an arbitrary but fixed order and registered by means of a Procrustes transformation through translation, rotation and scaling. After a test for normal distribution (Kolmogorov-Smirnov), the distributions of the proportions defined in Table 3 were compared by means of a t-test for both groups. P-values were adjusted by a Benjamini-Hochberg correction. For the evaluation of the collected data the statistic software “R” (version 4.2.2, www.r-project.org) was used.
Identifying Sub-Phenotypes within the Sex-Specific Groups
For both sexes a cluster analysis was performed to identify possible sub phenotypes. This task was carried out by k-means clustering with the “R”-package “factoextra”. The number of clusters were set to two, both for practical consideration and in accordance with the outcome of the elbow-criterion for determining the optimal number of classes. Again, the proportions for the sub-group of each sex were compared using pairwise t-test.
Creating Template Skulls
To create the template skull, mean shapes were calculated for each of the groups identified in the previous analyses using generalized Procrustes analysis. Thus, two shape templates were calculated for both male and female skulls. As source material for the standard skulls to be created, one female and one male skull each were taken from the collection of the Medical Faculty of the University of Münster. These skulls were scanned using Computed Tomography and the images were segmented and converted into polygon models using Mimics (version 23, Materialise NV, Leuven, Belgium) and 3D Slicer software. Finally, for each of the two models, two morphed versions were created via thin plate spline (“R” package “Morpho”) by mapping the landmarks identified on them to the landmarks of the four mean-value shapes.
3. Results
Figure 2 shows the age distributions of the male (mean: 39,4 y) and female (mean: 33,9 y) test persons. For each person a shape consisting of the 18 landmarks defined in Table 3 was determined. In Figure 3 the mean shapes for both sexes as revealed by a Procrustes transformation are displayed. The distributions of the individual proportions (Table 3) were compared for male and female skulls (Figure 4). Kolmogorov-Smirnov-tests showed that all distributions could be assumed normal. Subsequently, male and female proportions were compared using t-tests. The results (Table 4) showed that out of the eight investigated proportion five were significantly different.
Next, for each sex a k-means cluster analysis of the respective proportions with two clusters was carried out. The statistical comparison of these clusters is shown in Figure 5 for the male proportions and in Figure 6 for the female ones, resp. The numerical results of the t-tests are listed in Table 5 (male) and Table 6 (female) revealing that in case of the male shapes 7 out of 8 proportions differ significantly, while this is the case for 6 out of 8 in case of the female ones.
4. Discussion
The study was aimed to evaluate the phenotypical variance in the adult Eurasian population. A special objective of our study was to analyze whether skulls can be distinguished according to parameters like gender or growth pattern subtypes. As an overlay of one unaffected norm skull to a diseased one is currently in use to define the final jaw treatment position, we aimed to improve the overlay strategy by having more individualized facial phenotypes.
Dental and maxillofacial patient evaluation and treatment planning is based on an individual dental, skeletal and soft tissue assessment. The implementation of new 3D techniques opened new possibilities in craniofacial research and clinics as the 3D space mirrors the patients’ situation much more realistic then the 2D environment. CT and CBCT scans are important new tools in dentomaxillofacial diagnostics [16]. The advancement in imaging and the elaboration of new software systems have made 3D facial model reconstruction and 3D cephalometric measurement possible, being a more precise data base. The alternative of conventional 2D cephalometric or anthropometric analysis is limited in all asymmetric patient situations. Different studies show, that linear and angular measurements on 3D image models are accurate and reliable when compared with 2D cephalometric analysis [17,18]. Therefore, 3D technologies have become the modern method for evaluation of morphology or deformity.
3D cephalometric standards are different in specific ethnical groups. Additionally, there is a range of variability in the normal anatomy of the craniofacial region. Some landmarks on the 2D and 3D system can be defined as similar points (especially in the lateral view), but the identification of the points in the 3D environment is more extensive. We defined and digitized all hard and soft tissue landmarks according to the definition by Swennen et al. for skeletal and Farkas for soft tissue [10,19]. These landmarks (Table 1) can be reliably set on the skeletal models in 3D CBCT or CT scans. They can be easily defined in the most appropriate planar CT or CBCT slice in the axial, coronal, and sagittal views. Accurate landmark identification was achieved both for external (e.g. porion, gonion.) and internal (e.g. sella, basion) surface points. As some internal points are more complex to identify (e.g. sella point) the views of axial, coronal and sagittal images were used.
One of the most commonly used 3D cephalometric analysis is based on the work of Gateno et al. [21]. He included six different sections and parameters, that are all relevant in surgical planning of jaw movements (symmetry, transverse, vertical, pitch, anteroposterior, and shape). This concept of 3D cephalometric analysis was the basis of the presented work. We refined the reference system to evaluate the cranial skeleton in our study. As this form of landmark definition and cephalometric analysis is in broad use, the data in our study are valid for research and clinical application in a Eurasian population.
The statistical significance of the mean shape differences between male and female subjects in this study was a special finding. Whereas a number of studies reported a marked sexual dimorphism in size and shape [22,23,24,25], no study up to now has shown that the phenotypical differences are statistically significant.
Our analysis revealed significant differences in most parameters between the genders. Studies from other authors in various ethnical groups confirm our findings [12,13,14,15]. Gender variances in our study were present mainly in linear measurement. We found, that some parameters (skeletal and soft tissue vertical height) as well as the upper and lower lip length, were larger in our male samples. Our study confirms findings of 3D phenotype norms in Hong Kong, as well as in the Korean and Turkish population [10,12,15]. The findings, that wider sagittal and transversal midfacial parameters were similar among Chinese in Hong Kong, Beijing and Korea were also seen in our study, contrasting findings from the North Karnataka population [26]. Males in our study had a more prominent midface, assessed by the coronal plane through sella turcica, a phenotypical characteristic that was also presented by Cheung et al. [12]. Concerning the lower facial region, a significantly longer mandibular ramus, mandibular body length and a wider gonial width were seen in our male subjects, matching results of other cephalometric norm studies.
In addition to the gender related differences we found also significant differences in subgroups of the male and female Procrustes mean shapes. Our cluster analysis retained four biologically interpretable components. They are based on the orthodontically well known types of growth pattern (dolichofacial vs. brachyfacial) and the sagittal expression of phenotype (maxillary and mandibular prognathism or mandibular retrognathism).
From a developmental, biological and clinical (surgical) point of view, different craniofacial components can be separated: the skull, the midface (with the skull base separating both) and the mandible. With the finding of only four skeletal norm phenotypes (two in each gender group) it becomes more easy to plan craniofacial and orthognathic surgeries. Whereas separation (segmentation) of facial bones is an individual decision, the treatment goal can be defined through placement of bones in the individual norm skull phenotype.
There are other classification systems that divide phenotypes into three classes, e.g. based on the cephalic index. However, this index is based only on one proportion. It only captures the ratio of skull width to skull length in the neurocranial region, while our normative skulls are based on 8 proportions derived from 18 landmarks. Therefore, it should be easier to fit them to a patient skull using, for example, a Procrustes transformation. The development of a suitable approach to adapt the template to the current patient situation is the subject of an ongoing research project. One possibility under investigation is the superposition based on landmarks in regions least affected by the planned interventions by means of a Procrustes transformation.
The findings of our study must be interpreted in light of the limitation of our study (age and ethnicity). As different populations and ethnic groups have different facial features and averages that should be considered in the treatment planning.
5. Conclusions
This is the first determination and statistical evaluation of 3D cephalometric standards based on CBCT in a Eurasian population. The data obtained can be used to optimize workflow for structural analysis, diagnosis, treatment planning, monitoring and outcome assessment of any given case. The dataset with only four subtypes of skulls, identified by the gender and the growth type helps to serve as a reference and guide for maxillofacial treatment in individual cases, useful for orthodontic treatment, 3D planning of orthognathic surgery and outcome assessment.
Author Contributions
Conceptualization, U.M. and D.D.; methodology, U.M. and D.D.; software, D.D.; validation, C.R. and H.V.; investigation, L.L. and C.P.; writing—original draft preparation, L.L and U.M..; writing—review and editing, C.R and H.V. All authors have read and agreed to the published version of the manuscript.
Funding
This research received no external funding
Institutional Review Board Statement
The study was conducted in accordance with the Declaration of Helsinki, and approved by the Ethics Committee of the Medical Faculty of the University of Münster, Germany (2022-448-f-S, 07-26-2022).
Informed Consent Statement
Patient consent was waived due to use of anonymized data only.
Conflicts of Interest
The authors declare no conflict of interest.
References
- Meyer, U. (edit). Fundamentals of craniofacial malformations. 2021, Springer. [Google Scholar]
- Kerkfeld V, Schorn L, Depprich R, Lommen J, Wilkat M, Kübler N, Rana M, Meyer U. Simultaneous PSI-Based Orthognathic and PEEK Bone Augmentation Surgery Leads to Improved Symmetric Facial Appearance in Craniofacial Malformations. J Pers Med. 2022, 12, 1653. [CrossRef]
- Proffit WR, Fields HW, Sarver DM. Contemporary orthodonticse-book. Elsevier Health Sciences; 2014.
- Broadbent, BH. A new X-ray technique and its application to orthodontia. Angle Orthod 1981, 51, 93e114. [Google Scholar]
- van Vlijmen OJ, Maal TJ, Berge SJ, Bronkhorst EM, Katsaros C, Kuijpers-Jagtman AM. A comparison between two-dimensional and three-dimensional cephalometry on frontal radiographs and on cone beam computed tomography scans of human skulls. Eur J Oral Sci 2009, 117, 300e5. [CrossRef]
- Yitschaky O, Redlich M, Abed Y, Faerman M, Casap N, Hiller N. Comparison of common hard tissue cephalometric measurements between computed tomography 3D reconstruction and conventional 2D cephalometric images. Angle Orthod 2011, 81, 11e6. [CrossRef]
- Devanna, R. Two-dimensional to three-dimensional: a new three-dimensional cone-beam computed tomography cephalometric analysis. J Orthod Res 2015, 3, 30e7. [Google Scholar] [CrossRef]
- Jacobson A, Jacobson RL, Khoury F, Antoun H, Missika P, Sclar AG. Radiographic cephalometry: from basics to 3-D imaging. New Malden: Quintessence Publishing; 2007. [CrossRef]
- Swennen GR, Schutyser F. Three-dimensional cephalometry: spiral multi-slice vs cone-beam computed tomography. Am J Orthod Dentofacial Orthop 2006, 130, 410e6. [CrossRef]
- Swennen GRJ, Schutyser FAC, Hausamen JE. Three-dimensional cephalometry: a color atlas and manual. Heidelberg: Springer; 2005. [CrossRef]
- Bayome M, Park JH, Kook YA. New three-dimensional cephalometric analyses among adults with a skeletal class I pattern and normal occlusion. Korean J Orthod 2013, 43, 62e73. [CrossRef]
- Cheung LK, Chan YM, Jayaratne YS, Lo J. Three-dimensional cephalometric norms of Chinese adults in Hong Kong with balanced facial profile. Oral Surg Oral Med Oral Pathol Oral Radiol Endod 2011, 112, e56e73. [CrossRef]
- Vahdettin L, Aksoy S, Oz U, Orhan K. Three-dimensional cephalometric norms of Turkish Cypriots using CBCTimages reconstructed from a volumetric rendering program in vivo. Turk J Med Sci 2016, 46, 848e61. [CrossRef]
- Gu Y, McNamara Jr JA, Sigler LM, Baccetti T. Comparison of craniofacial characteristics of typical Chinese and Caucasian young adults. Eur J Orthod 2011, 33, 205e11. [CrossRef]
- Hwang HS, Kim WS, McNamara Jr JA. Ethnic differences in the soft tissue profile of Korean and European-American adults with normal occlusions and well-balanced faces. Angle Orthod 2002, 72, 72e80. [CrossRef]
- Celebi AA, Tan E, Gelgor IE, Colak T, Ayyildiz E. Comparison of soft tissue cephalometric norms between Turkish and European-American adults. ScientificWorldJournal 2013, 2013, 806203. [CrossRef]
- Mozzo P, Procacci C, Tacconi A, Martini PT, Andreis IA. A new volumetric CT machine for dental imaging based on the conebeamtechnique: preliminary results. Eur Radiol 1998, 8, 1558e64. [CrossRef]
- Lopes PM, Moreira CR, Perrella A, Antunes JL, Cavalcanti MG. 3-D volume rendering maxillofacial analysis of angular measurements by multislice CT. Oral Surg Oral Med Oral Pathol Oral Radiol Endod 2008, 105, 224e30. [CrossRef]
- Farkas LG, Tompson B, Phillips JH, Katic MJ, Cornfoot ML. Comparison of anthropometric and cephalometric measurements of the adult face. J Craniofac Surg 1999, 10, 18–25. [CrossRef]
- Oz U, Orhan K, Abe N. Comparison of linear and angular measurements using two-dimensional conventional methods and three-dimensional cone beam CT images reconstructed from a volumetric rendering program in vivo. Dentomaxillofac Radiol 2011, 40, 492e500. [CrossRef]
- Gateno J, Xia JJ, Teichgraeber JF. New 3-dimensional cephalometric analysis for orthognathic surgery. J Oral Maxillofac Surg 2011, 69, 606e22. [CrossRef]
- Ursi WJ, Trotman CA, McNamara JA Jr, et al. Sexual dimorphism in normal craniofacial growth. Angle Orthod 1993, 63, 47–56. [CrossRef]
- Humphrey, LT. Growth patterns in the modern human skeleton. Am J Phys Anthropol 1998, 105, 57–72. [Google Scholar] [CrossRef]
- Rosas A, Bastir M. Thin-plate spline analysis of allometry and sexual dimorphism in the human craniofacial complex. Am J Phys Anthropol 2002, 117, 236–245. [CrossRef]
- Bastir, M. A systems-model for the morphological analysis of integration and modularity in human craniofacial evolution. J Anthropol Sci 2008, 86, 37–58. [Google Scholar] [PubMed]
- Wang RH, Ho CT, Lin HH, Lo LJ. Three-dimensional cephalometry for orthognathic planning: Normative data and analyses. Journal of the Formosan Medical Association 2020, 119, 191e203. [CrossRef]
Figure 1.
Landmarks and distances used for classification of the skull as described in Table 1 and 2.
Figure 1.
Landmarks and distances used for classification of the skull as described in Table 1 and 2.
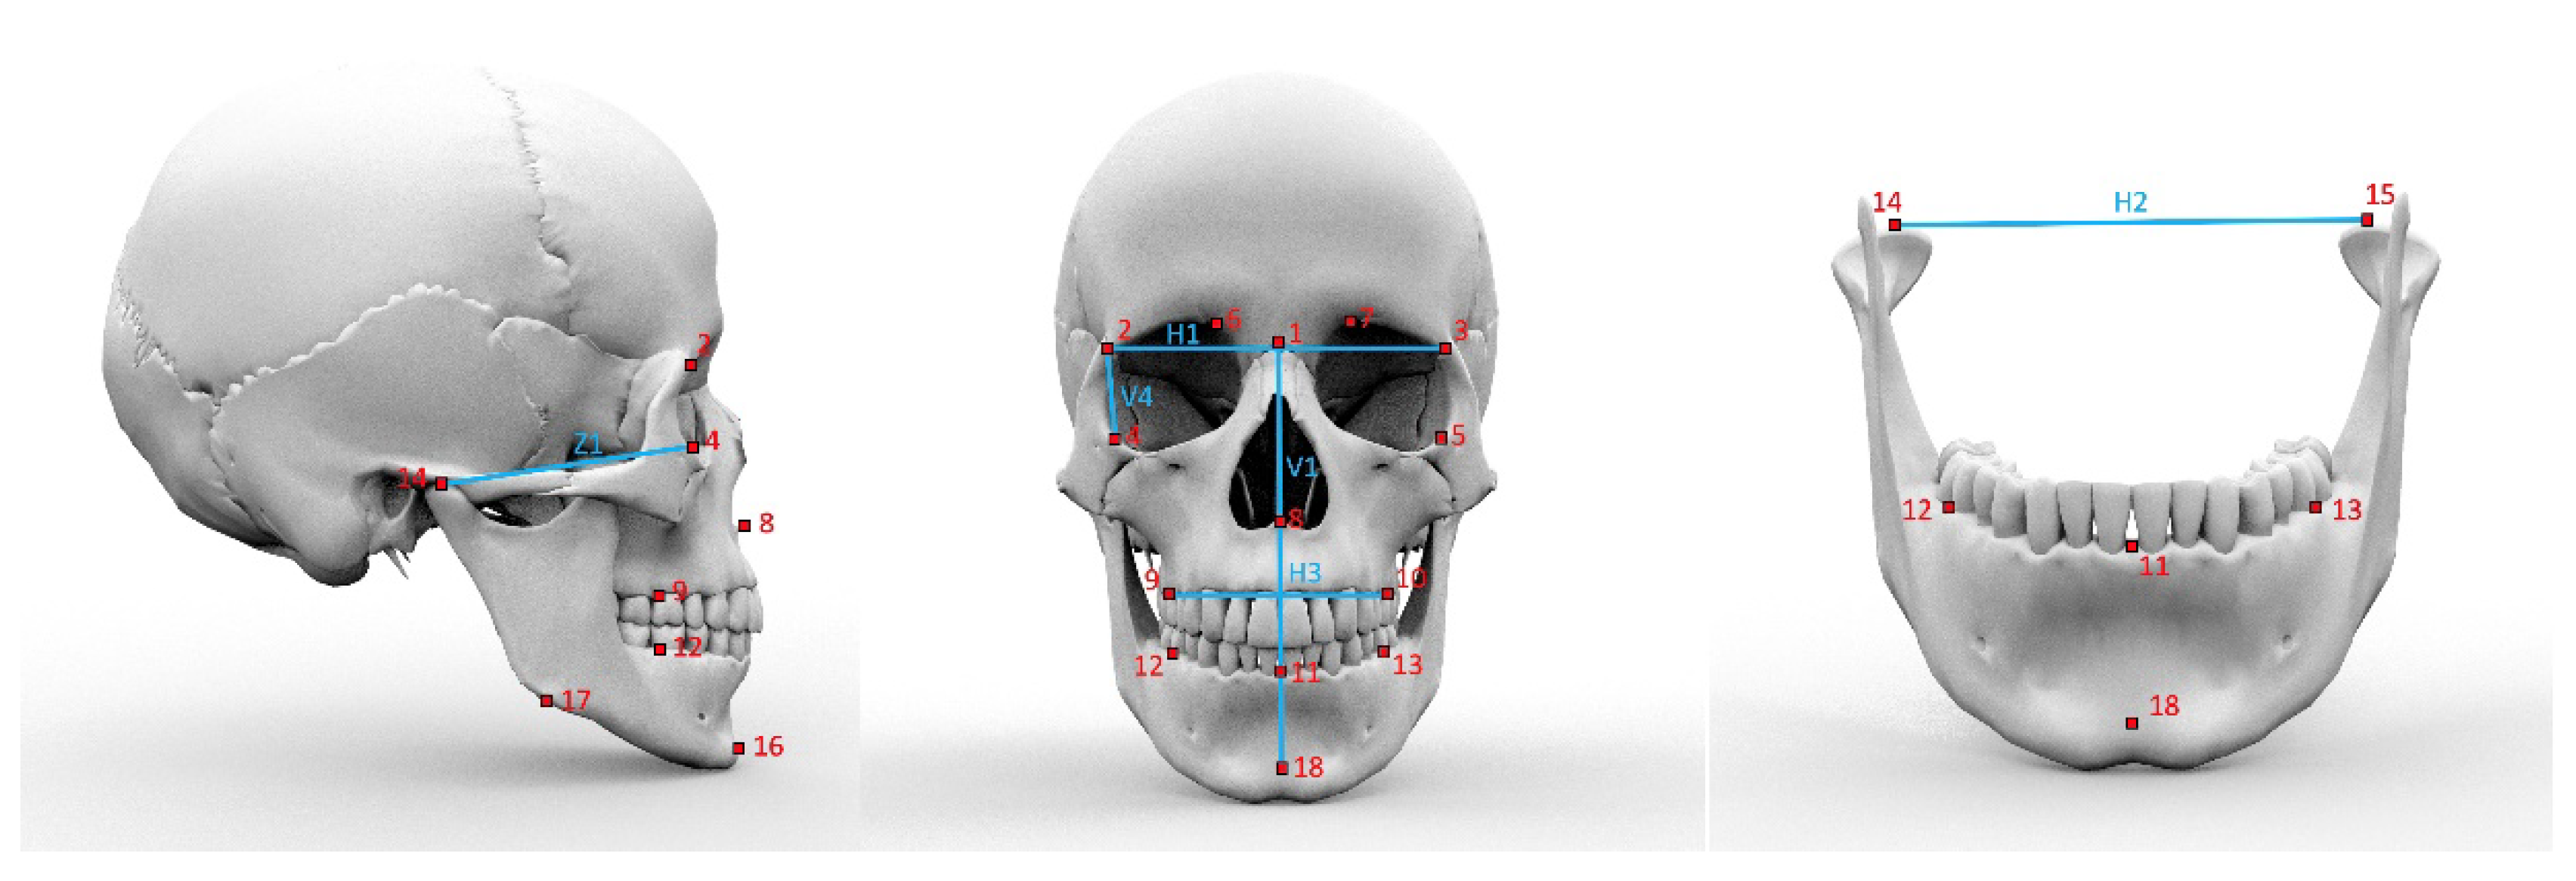
Figure 2.
Age distribution of female (f) and male (m) test persons. Black dot denotes the mean value.
Figure 2.
Age distribution of female (f) and male (m) test persons. Black dot denotes the mean value.
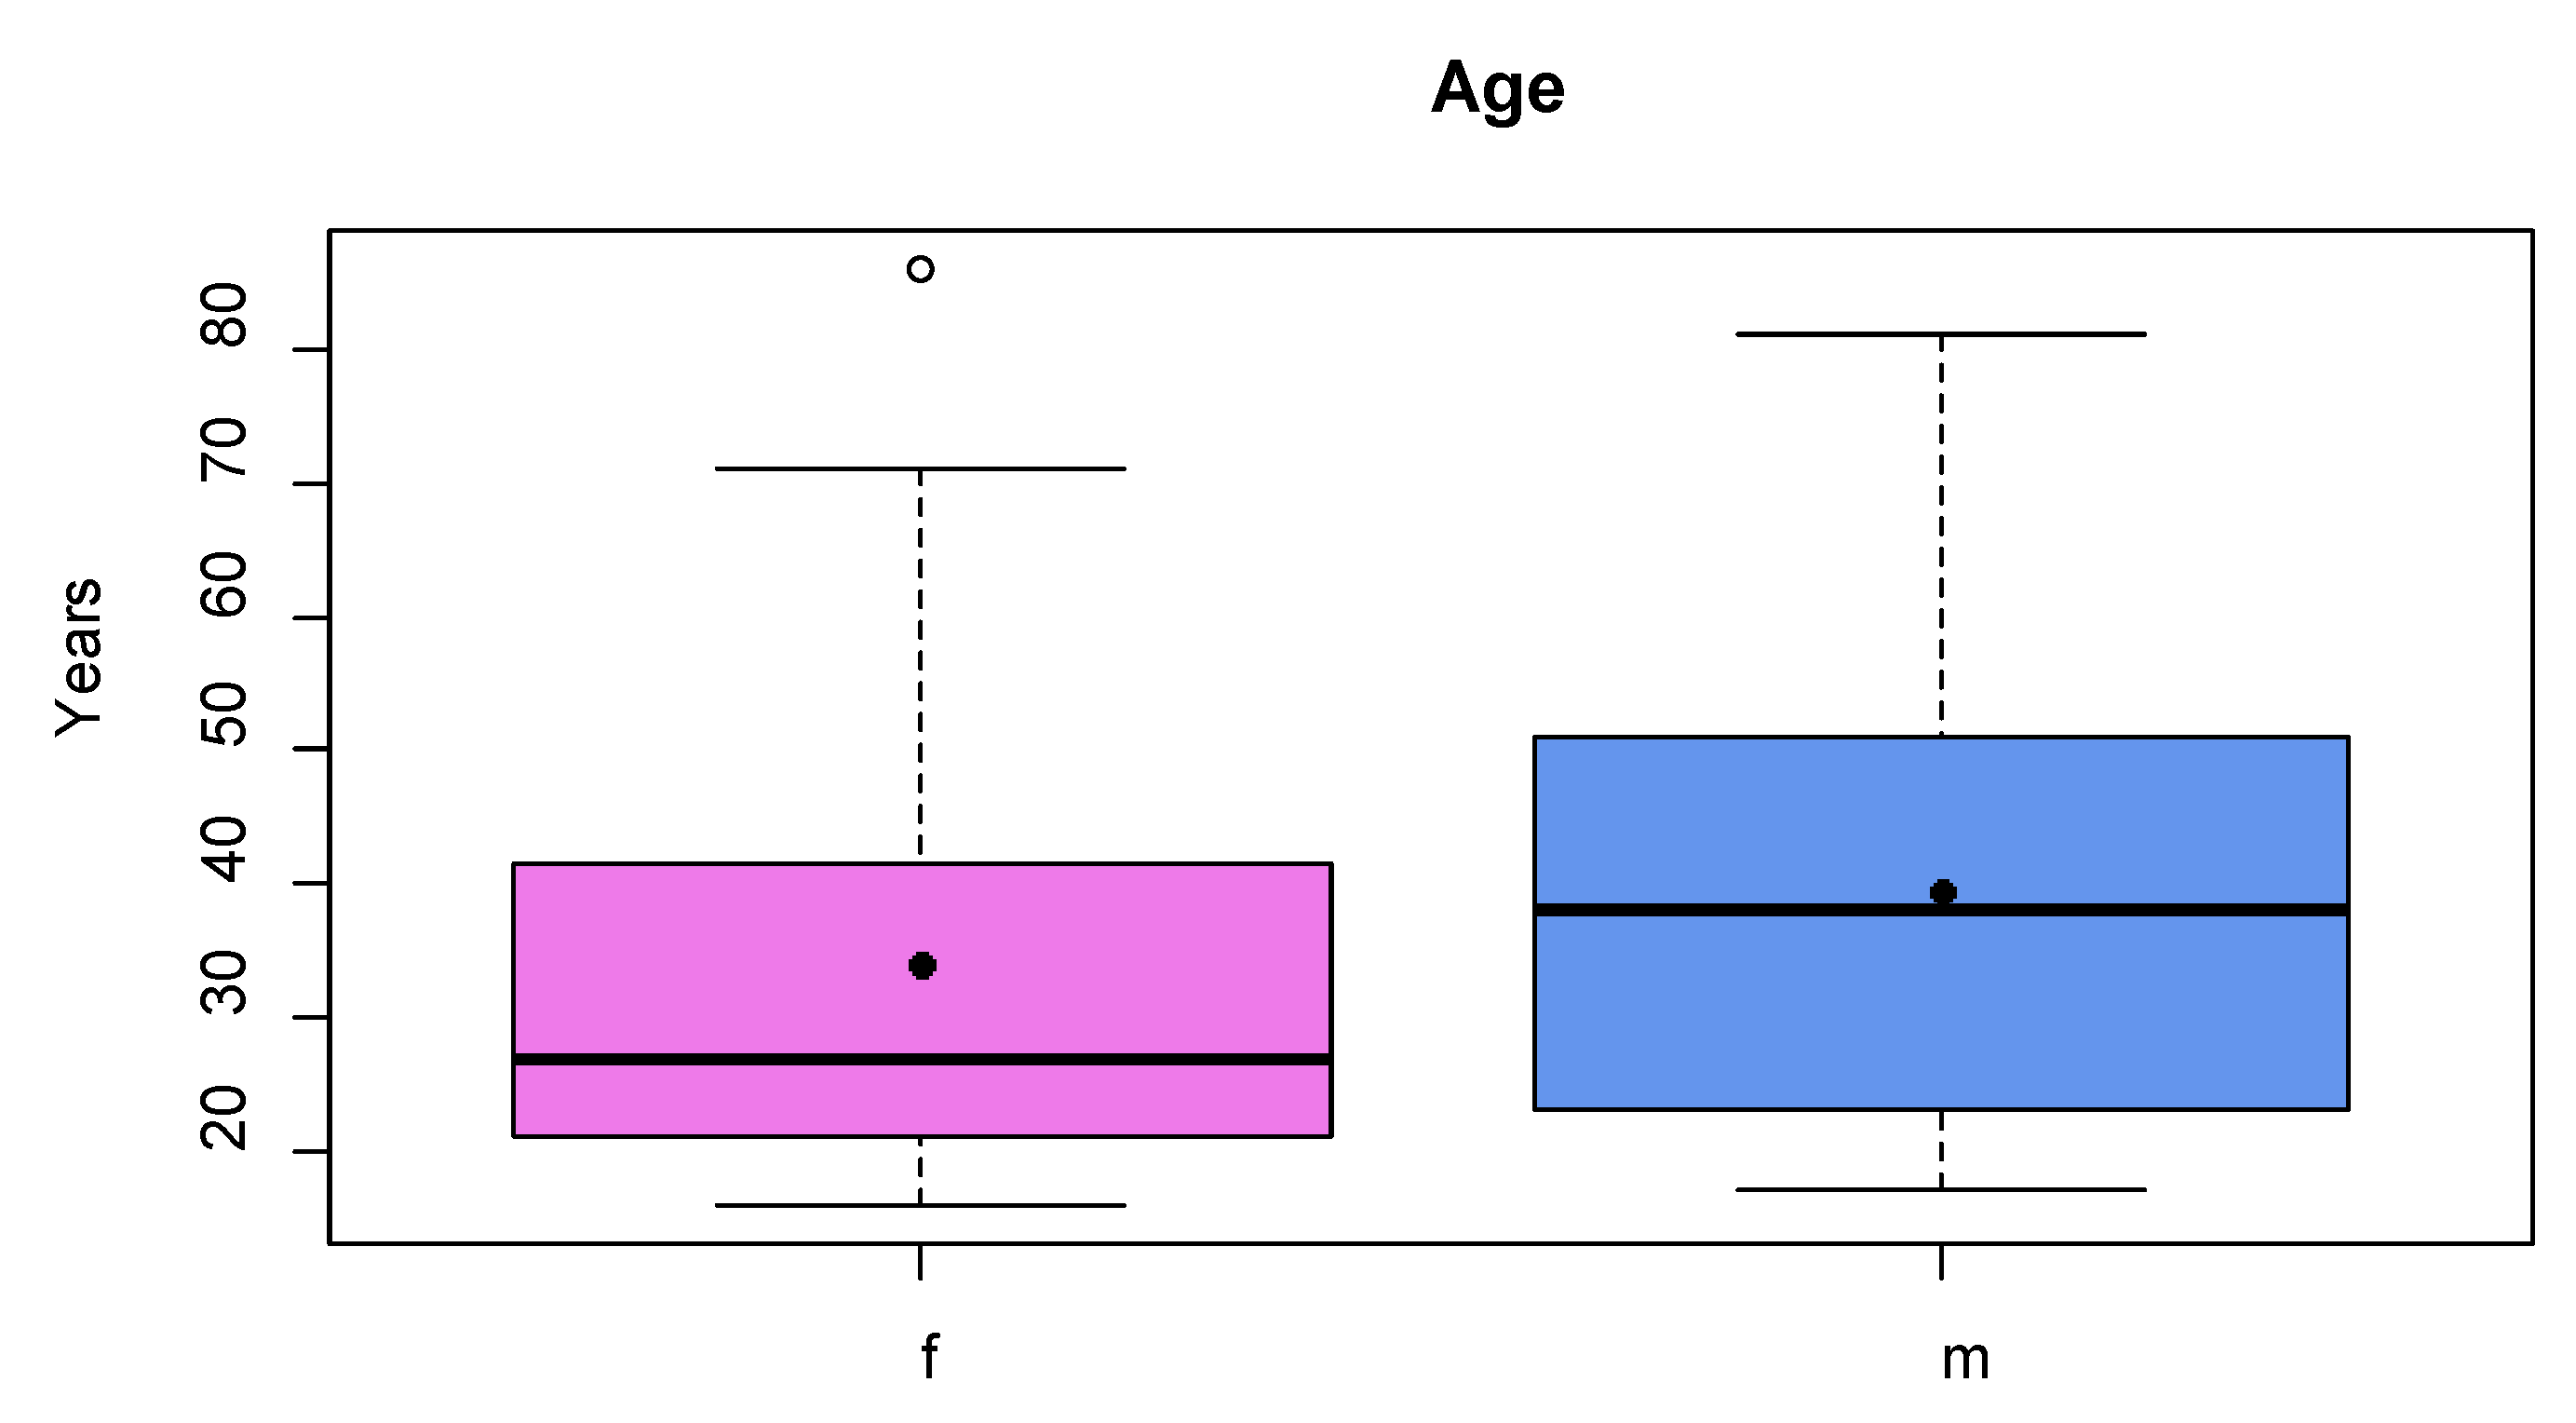
Figure 3.
Mean shapes calculated from female (purple) and male (blue) landmarks (attached to a skull model for illustration).
Figure 3.
Mean shapes calculated from female (purple) and male (blue) landmarks (attached to a skull model for illustration).
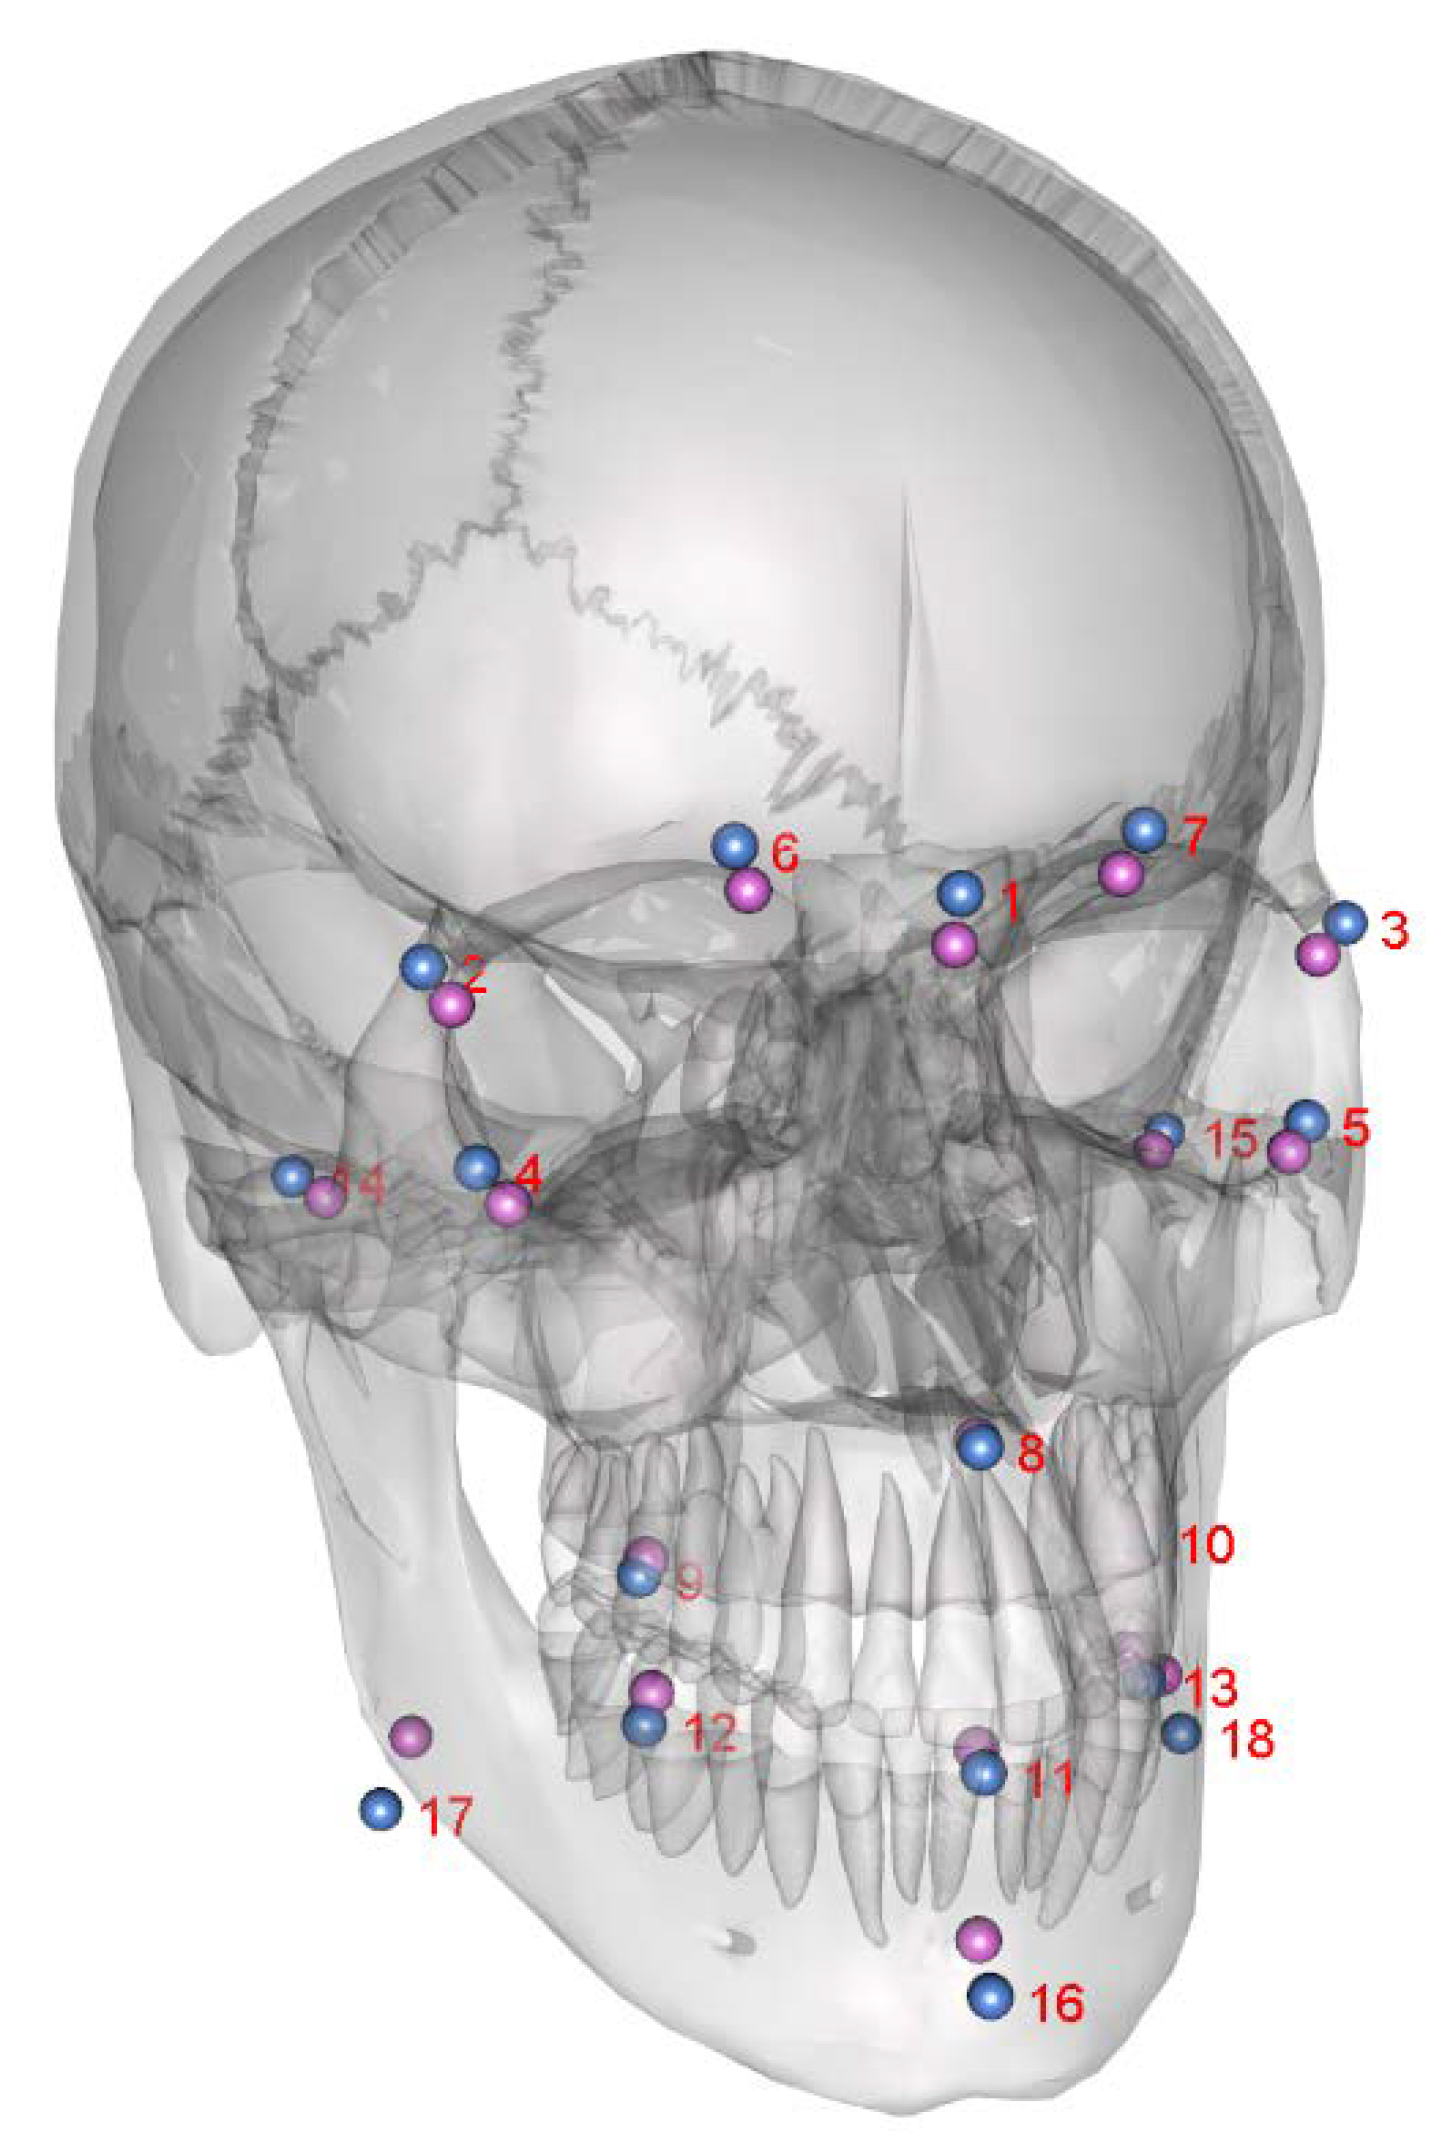
Figure 4.
Female (f) and male (m) proportions calculated from shapes (landmarks 1-18). Black dots denote the mean value.
Figure 4.
Female (f) and male (m) proportions calculated from shapes (landmarks 1-18). Black dots denote the mean value.
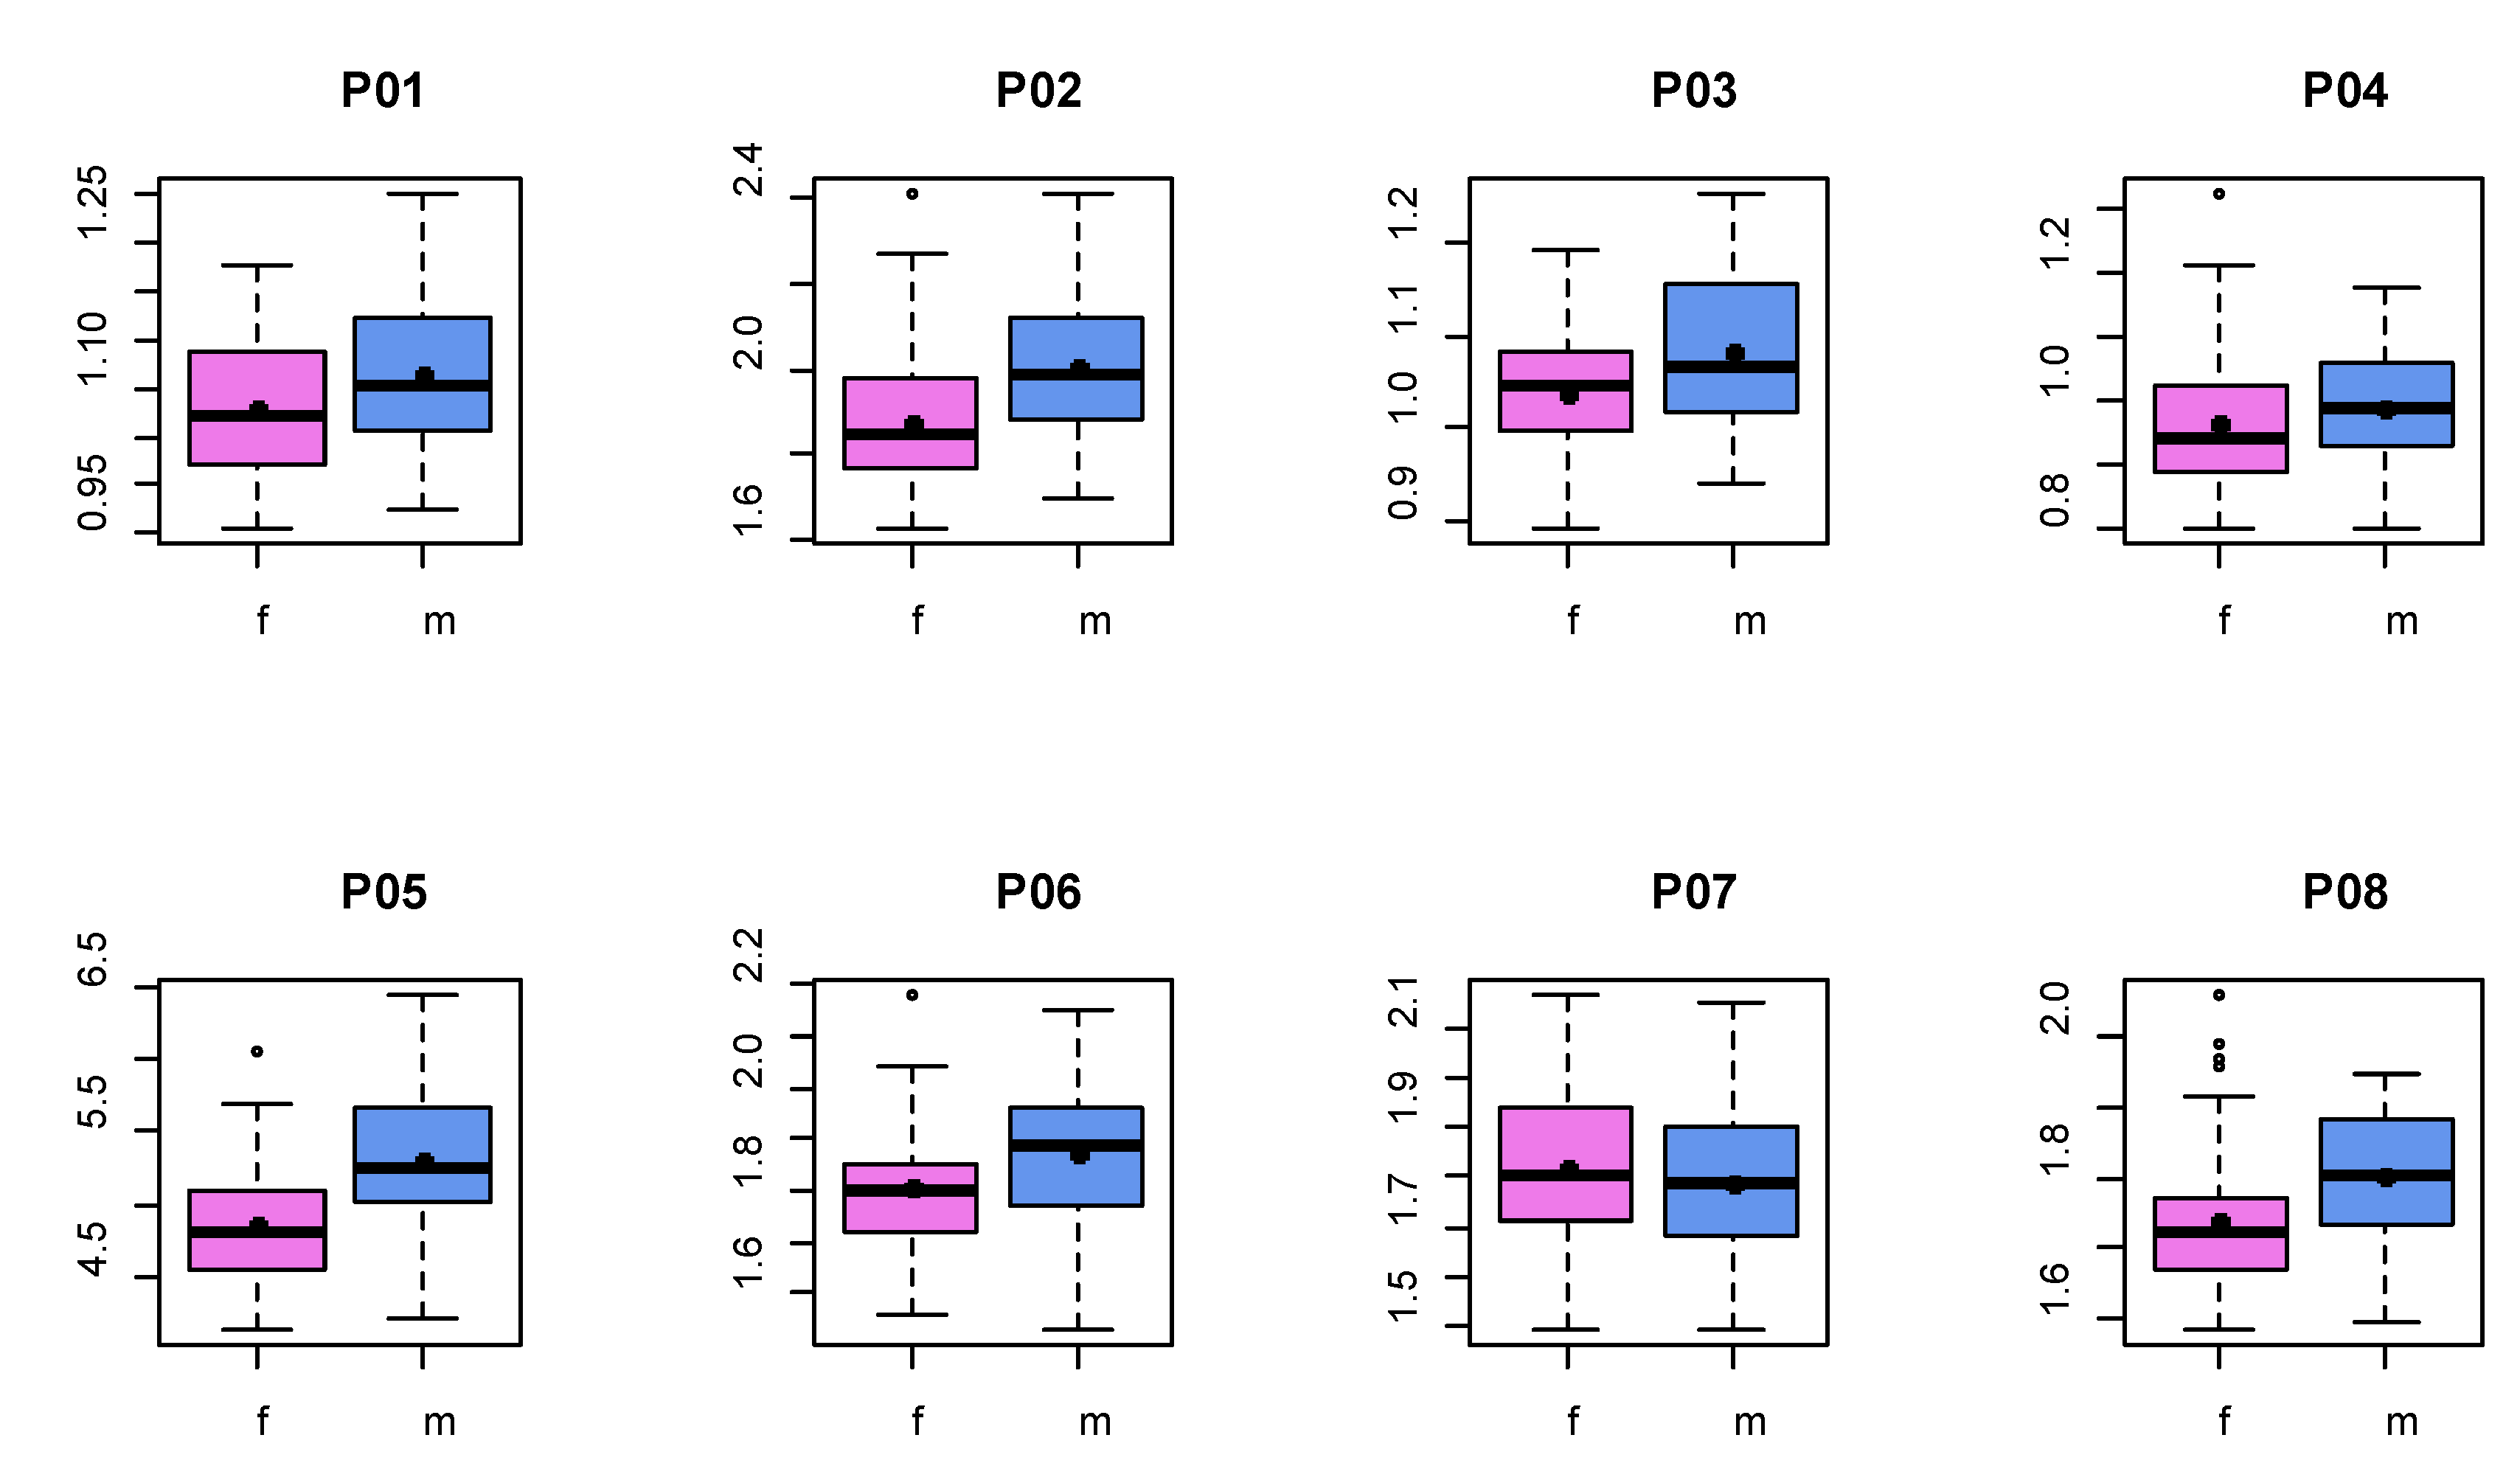
Figure 5.
Male proportions calculated from shapes (landmarks 1-18) divided into two clusters. Black dot denotes the mean value.
Figure 5.
Male proportions calculated from shapes (landmarks 1-18) divided into two clusters. Black dot denotes the mean value.
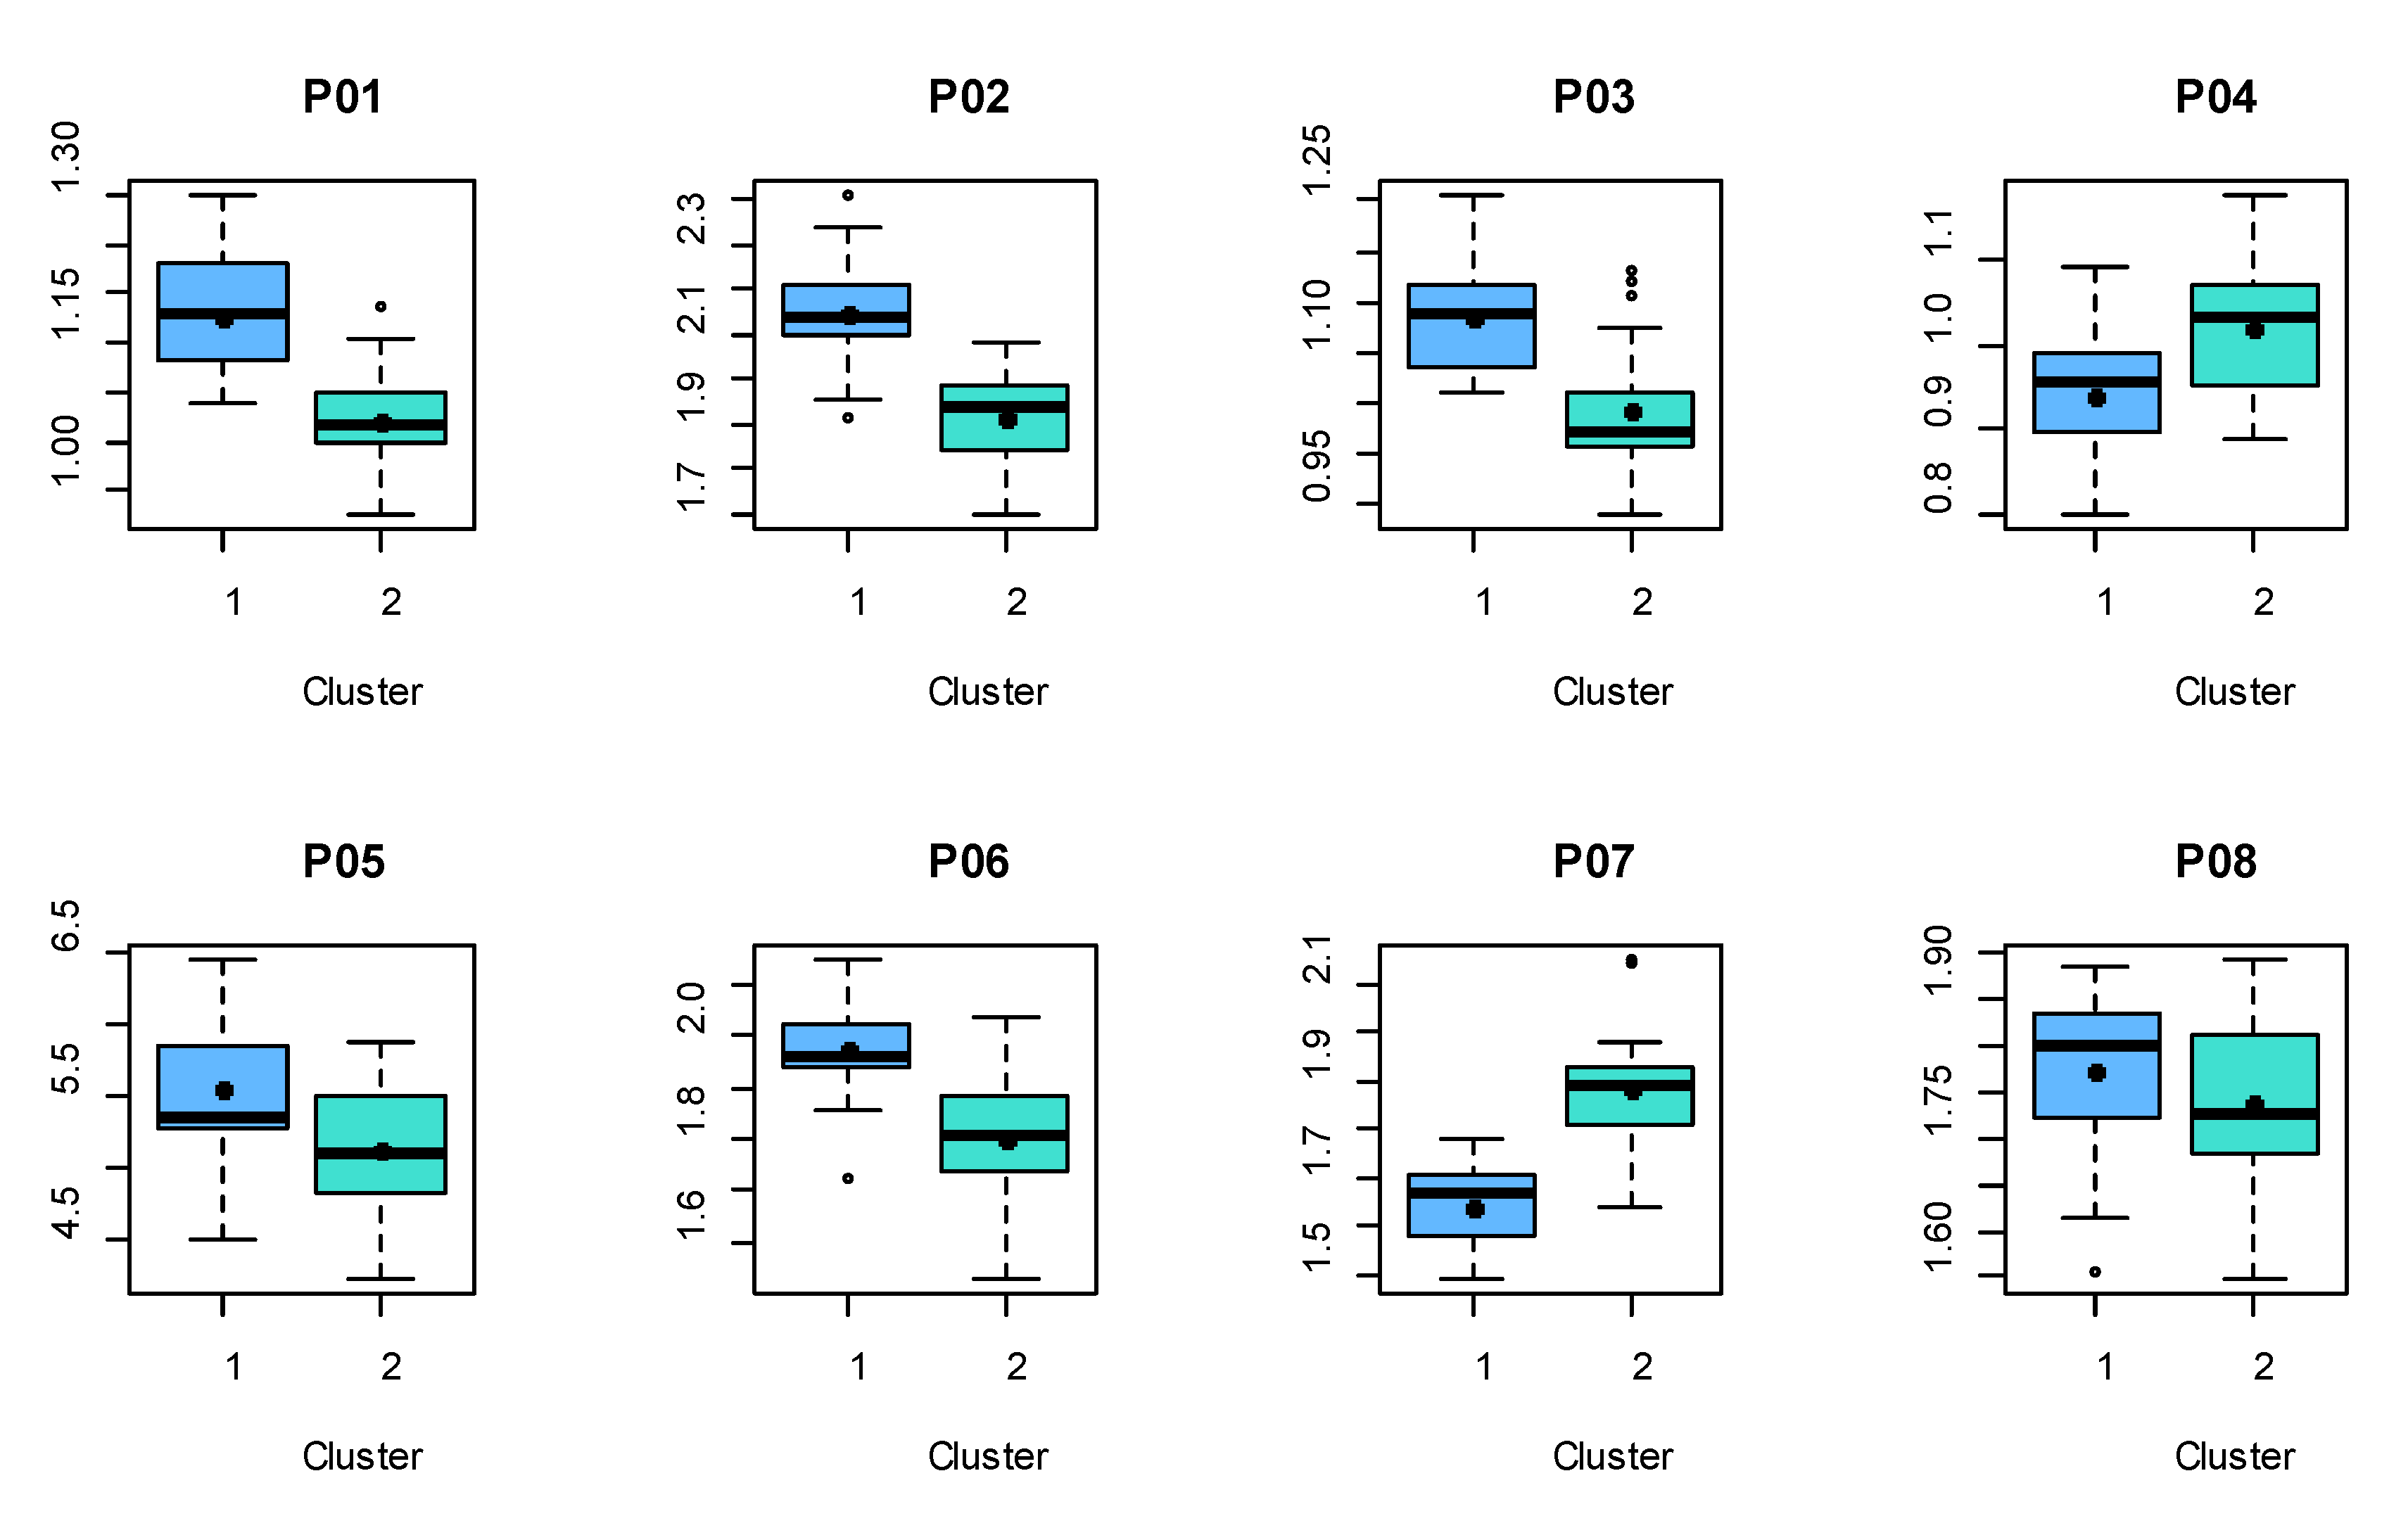
Figure 6.
Female proportions calculated from shapes (landmarks 1-18) divided into two clusters. Black dot denotes the mean values.
Figure 6.
Female proportions calculated from shapes (landmarks 1-18) divided into two clusters. Black dot denotes the mean values.
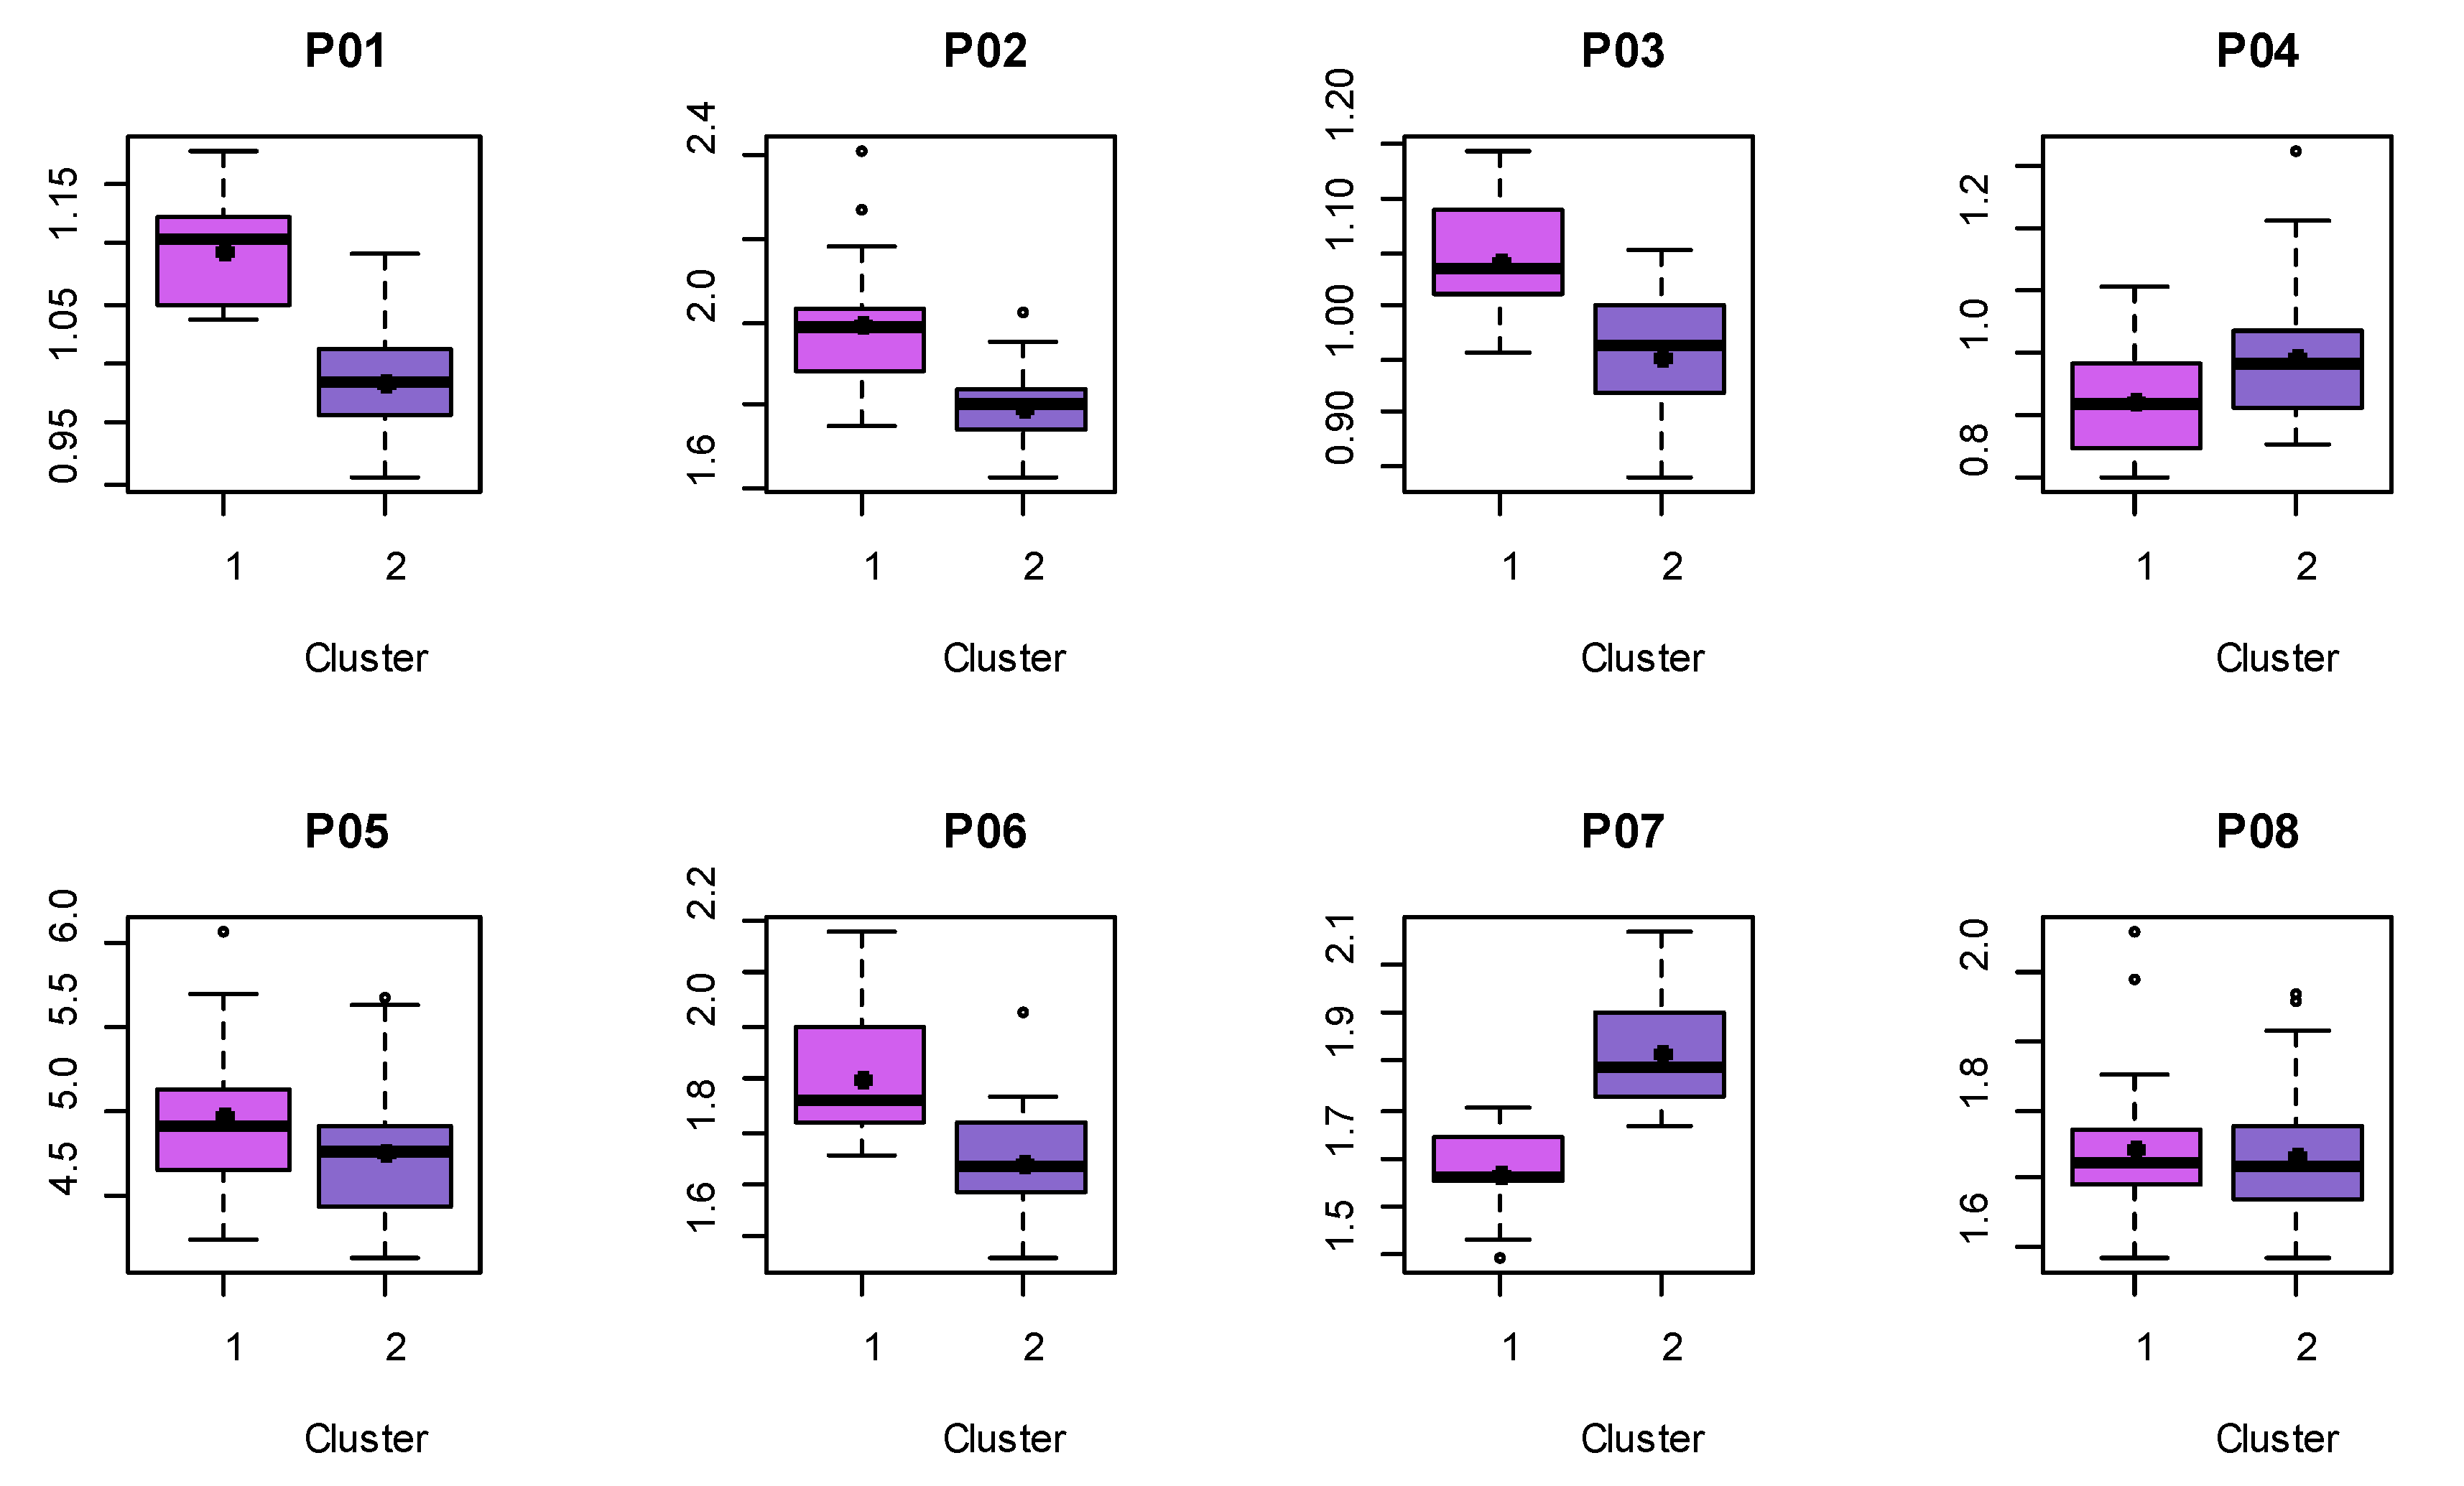
Figure 7.
Male template skull morphed with mean shape of cluster 1 of male shapes (a) and cluster 2 of male shapes (b).
Figure 7.
Male template skull morphed with mean shape of cluster 1 of male shapes (a) and cluster 2 of male shapes (b).
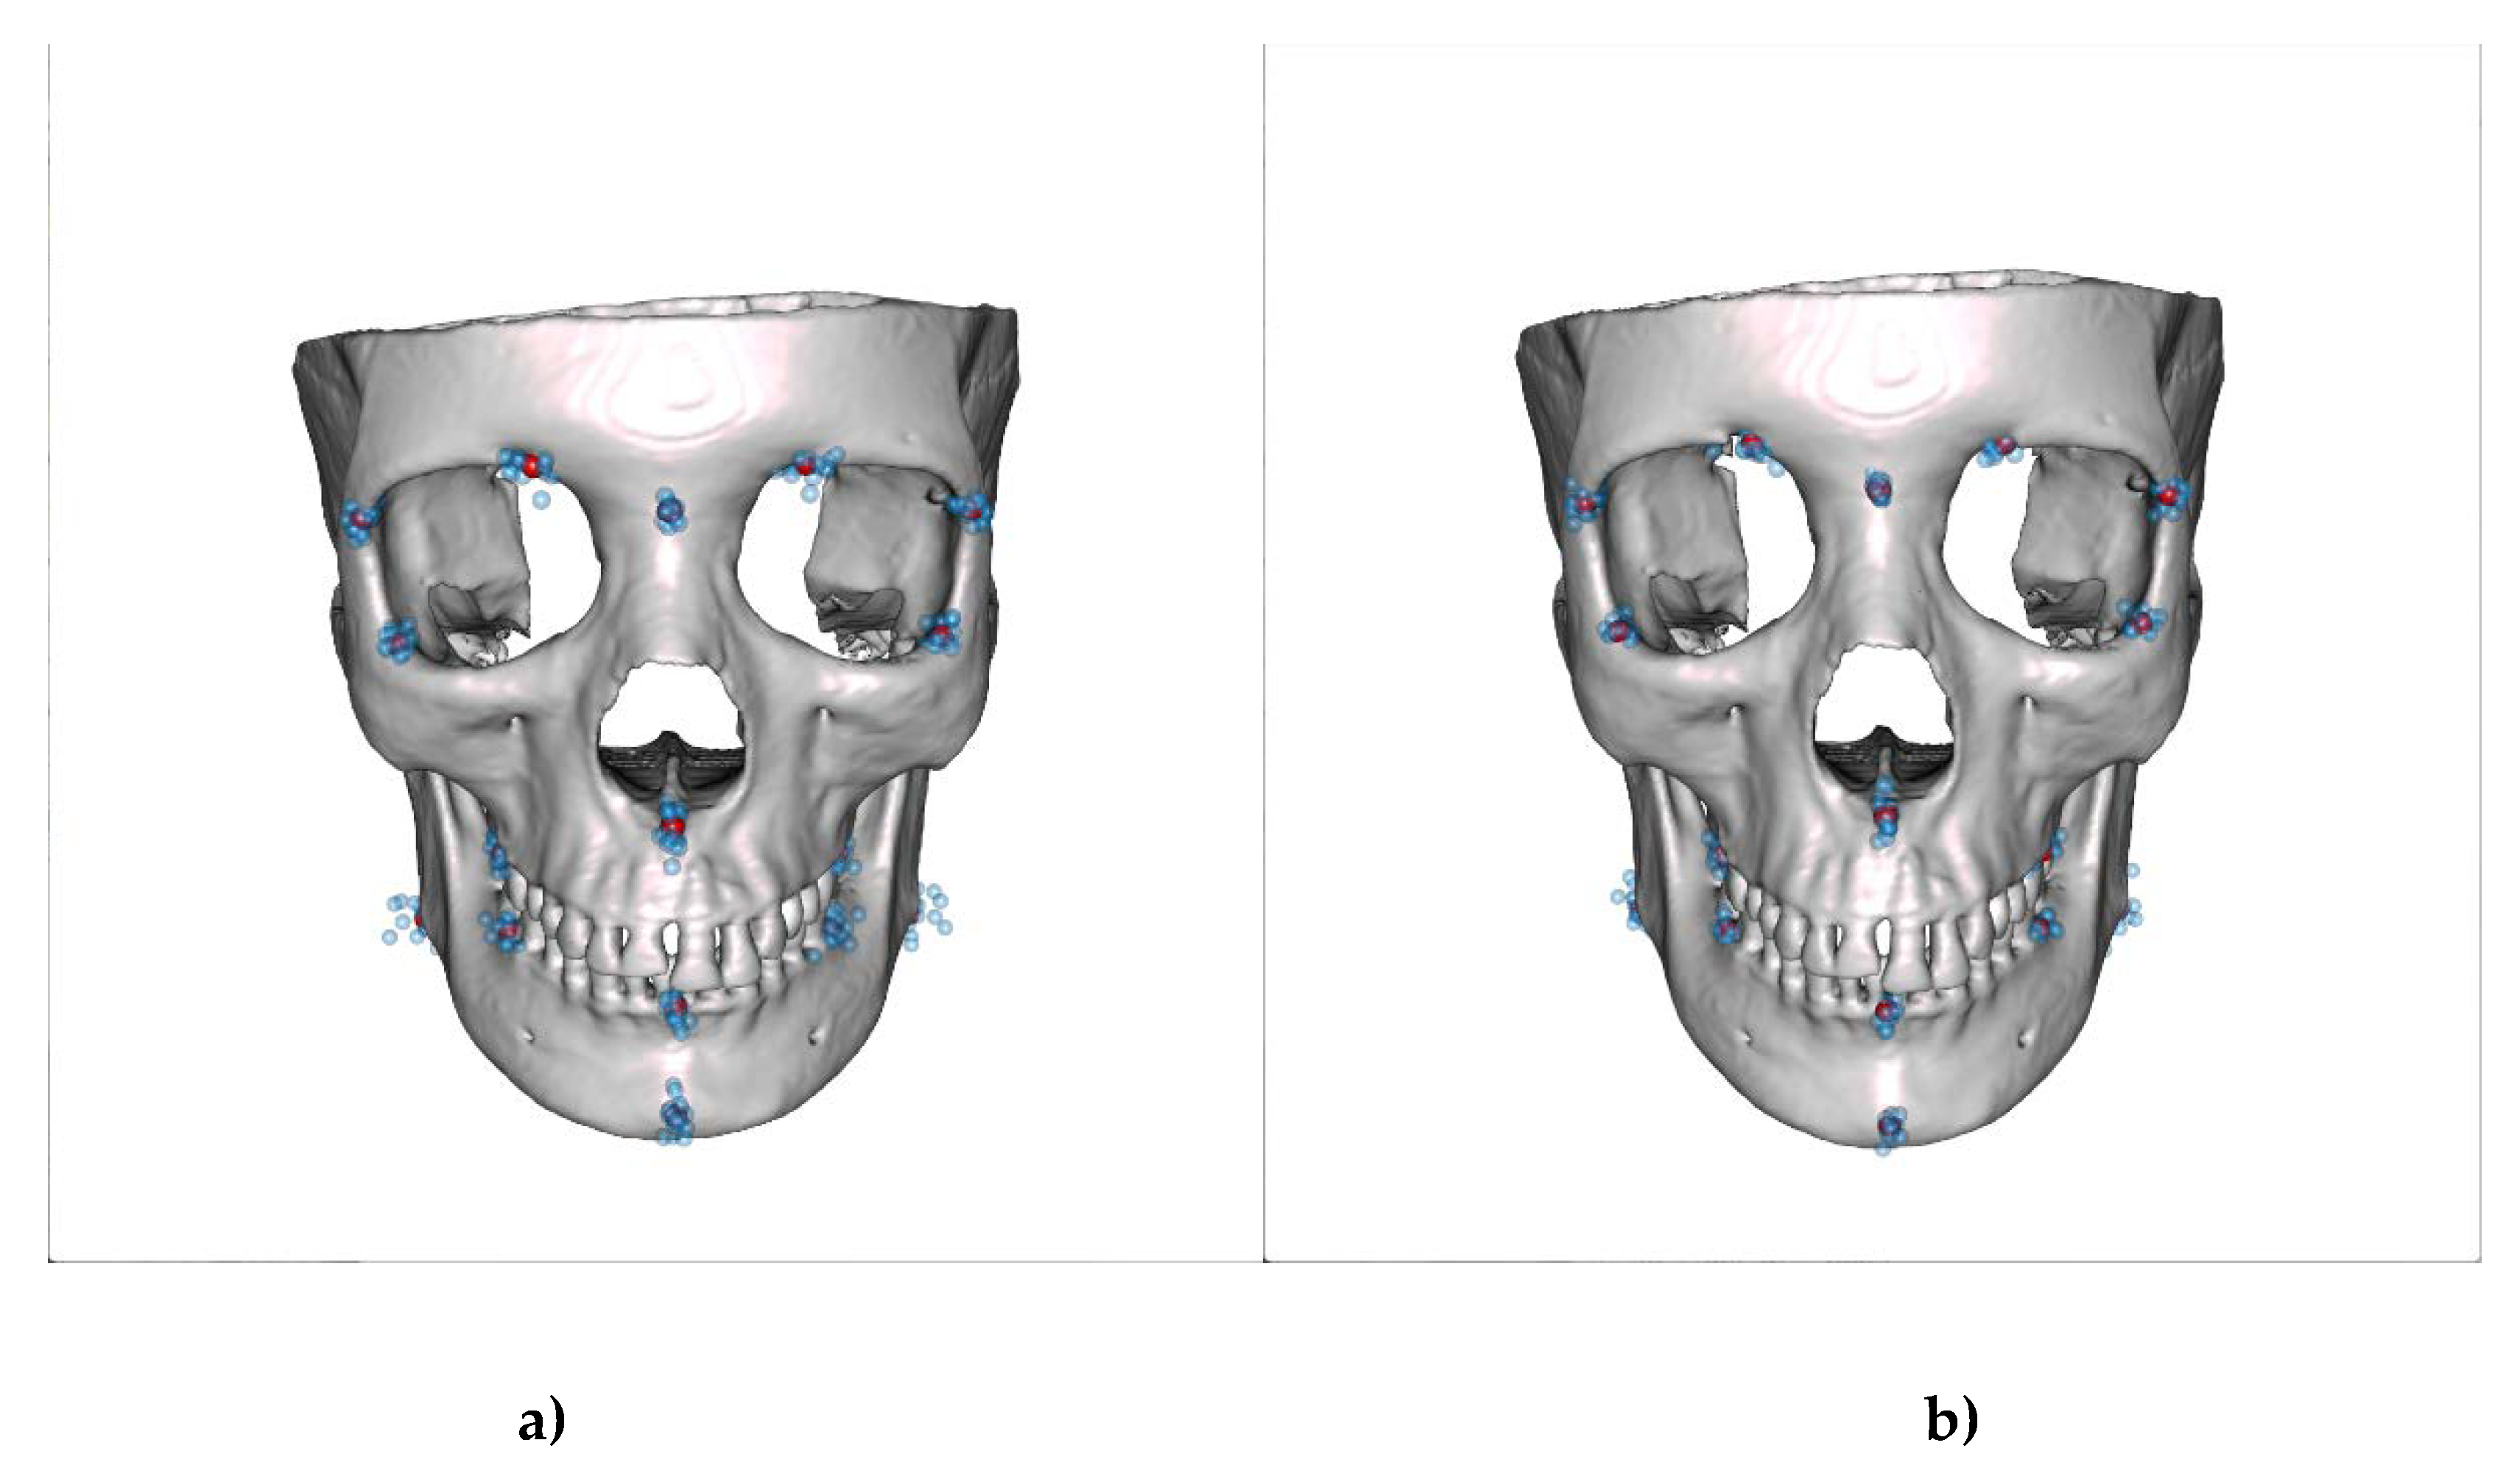
Figure 8.
Female template skull morphed with mean shape of cluster 1 of female shapes (a) and cluster 2 of female shapes (b).
Figure 8.
Female template skull morphed with mean shape of cluster 1 of female shapes (a) and cluster 2 of female shapes (b).
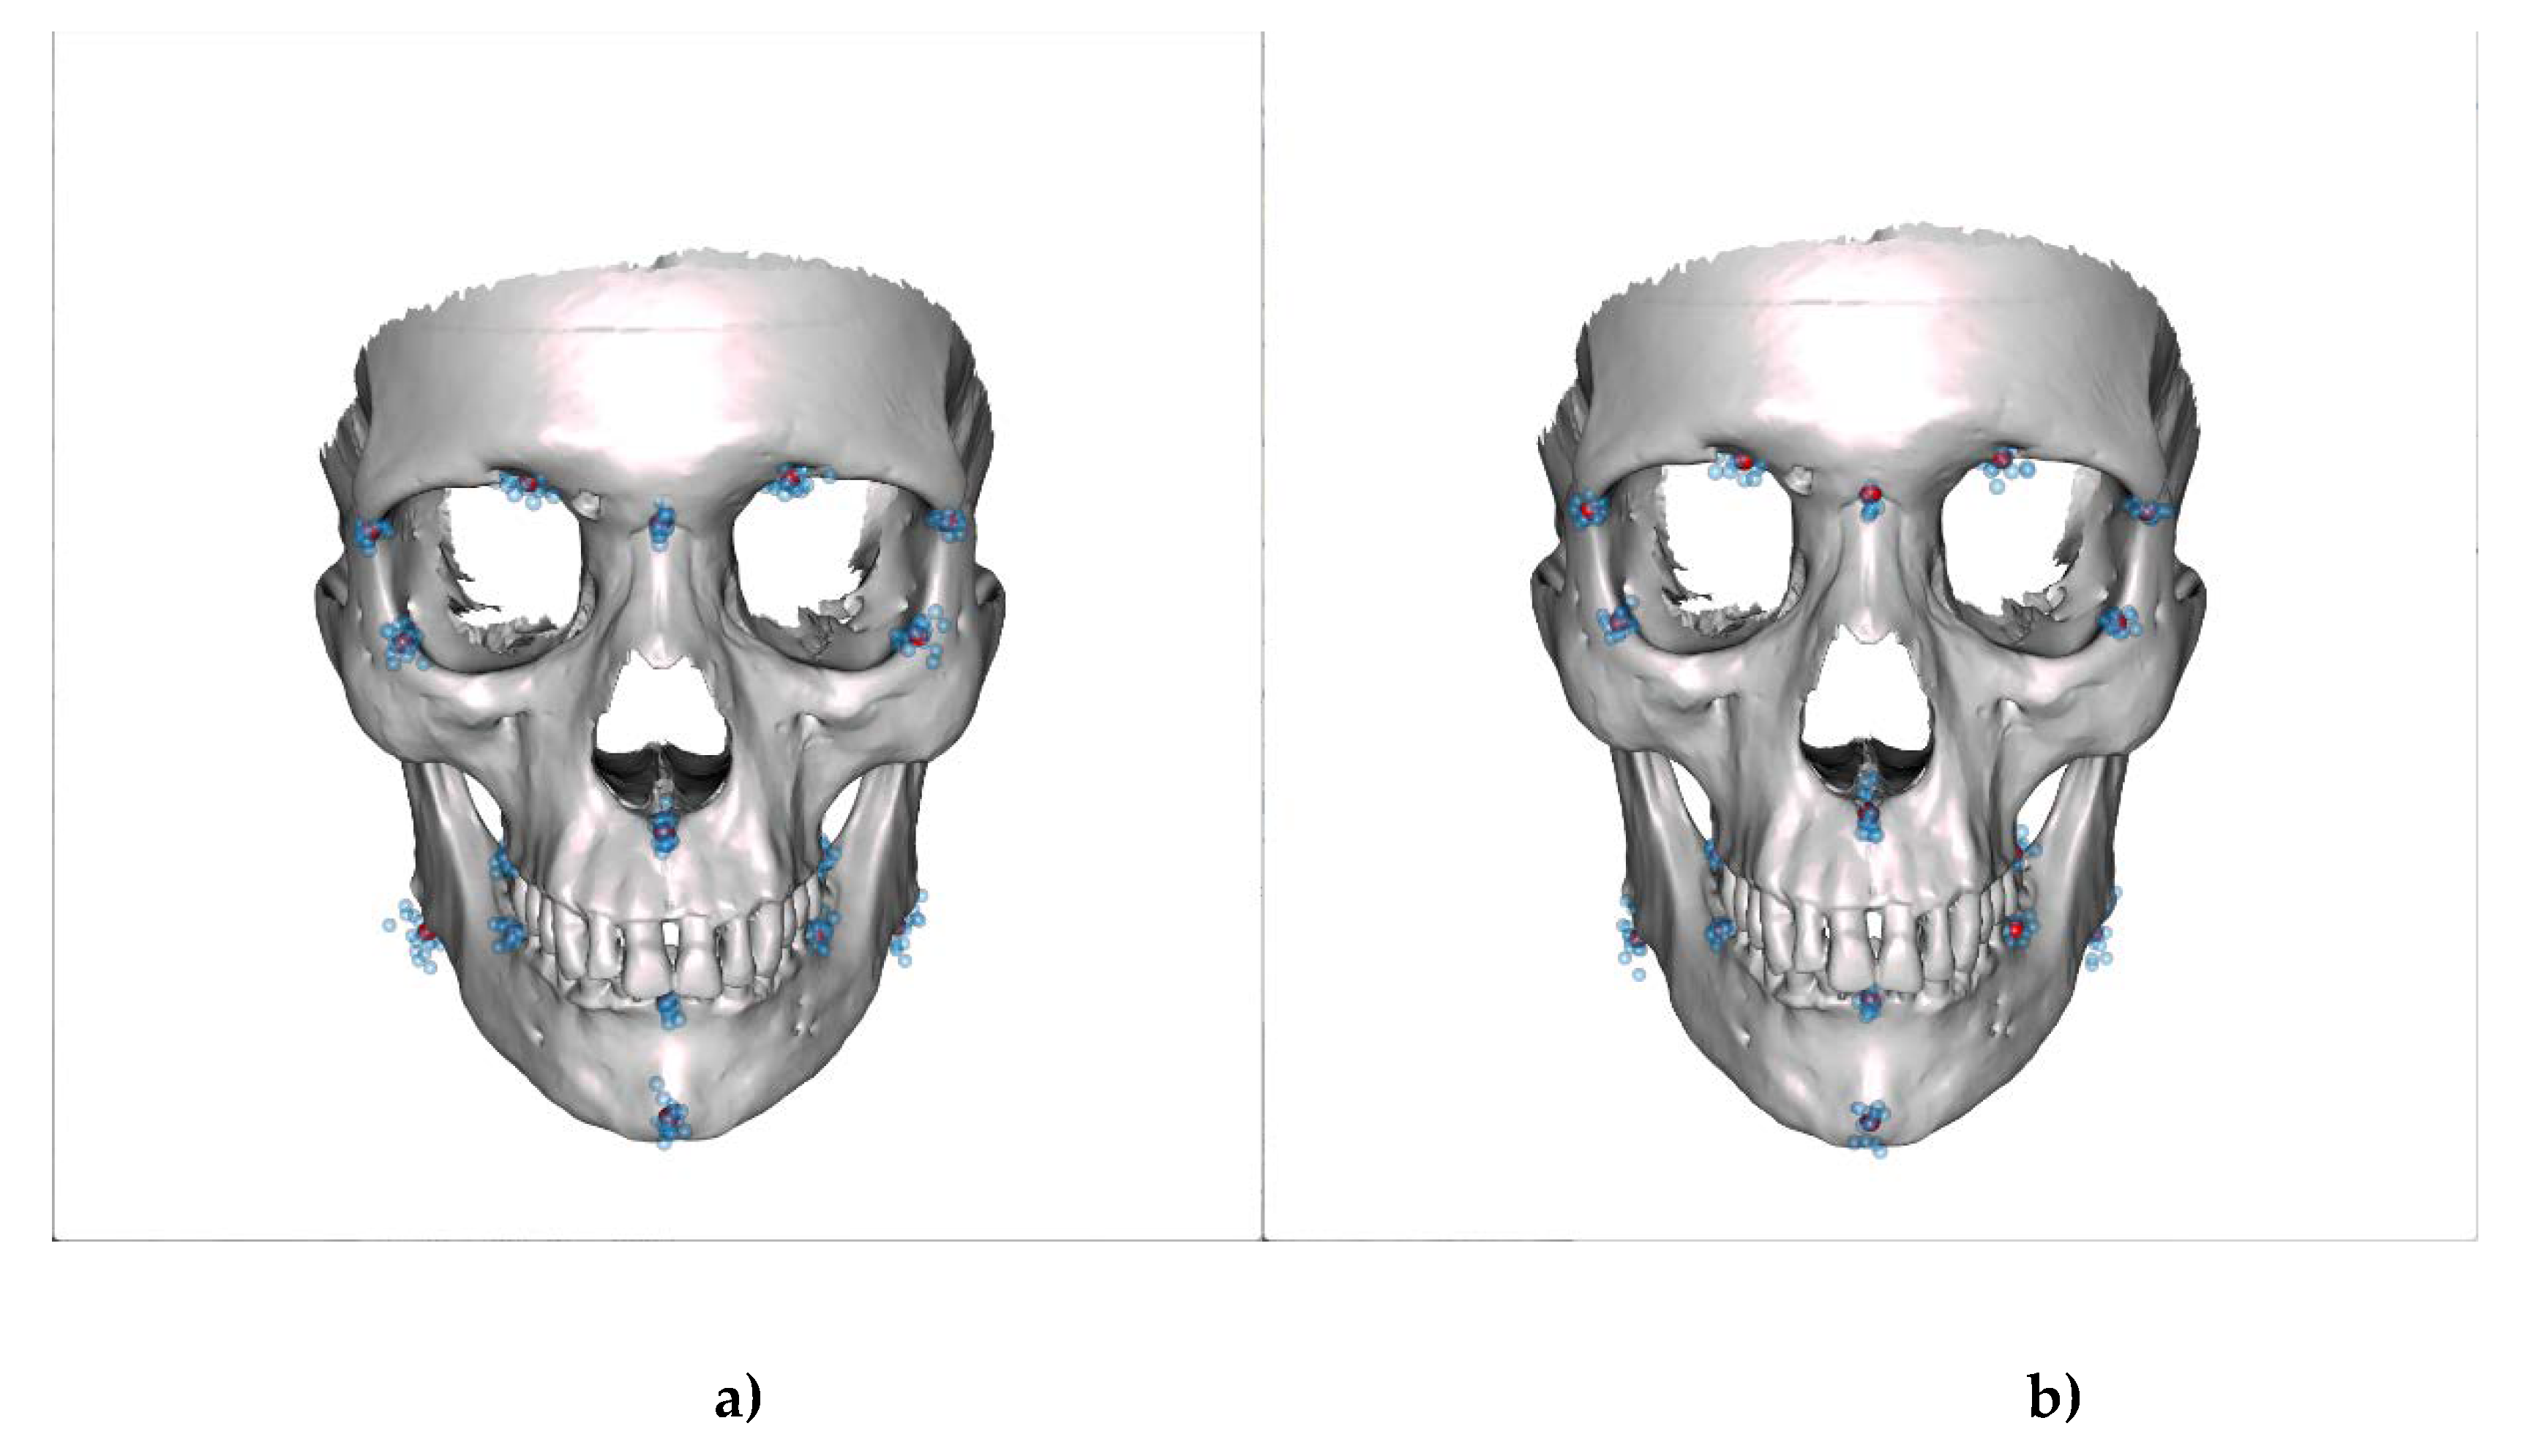

Table 1.
List of the anatomical features used as landmarks.
| No | Landmark | Abbreviation | Definition |
|---|---|---|---|
| 1 | Nasion | N | Intersection point of frontonasal and internasal suture |
| 2 | Frontoorbital suture right | FOS r | Intersection midpoint of processus zygomaticus and OS frontale |
| 3 | Frontoorbital suture left | FOS l | Intersection midpoint of proceccus zygomaticus and Os frontale |
| 4 | Inferior Orbital edge right | IOE r | Midpoint in the curvature of the lateral orbita right |
| 5 | Inferior Orbital edge left | IOE l | Midpoint in the curvature of the lateral orbita left |
| 6 | Incisura frontalis right | IF r | Medial border of the incisura frontalis right |
| 7 | Incisura frontalis left | IF l | Medial border of the incisura frontalis left |
| 8 | Spina nasalis anterior | SPA | The point on the tip of the Spina |
| 9 | First Upper Molar distobuccal root bone level right | 1 UpMdbrbl r | Crestal edge of the upper right first molar distobuccal root |
| 10 | First Upper Molar distobuccal root bone level left | 1 UpMdbrbl l | Crestal edge of the upper left first molar distobuccal root |
| 11 | Lower incisor bone level | LIbl | Crestal midpoint between lower first incisor roots |
| 12 | First Lower Molar distal root bone level right | 1 LoMdbrbl r | Crestal edge of the lower right first molar distal root |
| 13 | First Lower Molar distal root bone level left | 1 LoMdbrbl l | Crestal edge of the lower left first molar distal root |
| 14 | Condyle right | Co r | Most superior point on the midline of the condyle right |
| 15 | Condyle left | Co l | Most superior point on the midline of the condyle left |
| 16 | Pogonion | Po | Most anterior point of the mandibular symphysis |
| 17 | Posterior inferior mandibular point right | Pom r | Most caudal and most posterior point of the right mandibular |
| 18 | Posterior inferior mandibular point left | Pom l | Most caudal and most posterior point of the left mandibular |
Table 2.
List of distances determined from the landmarks.
| Abbr | Distance |
|---|---|
| V1 | Nasion (1) – Pogonion (16) |
| V2 | Nasion (1) – SPA (8) |
| V3 | SPA (8) – Pogonion (16) |
| V4 | FOS r (2) – IOE r (4) |
| H1 | FOS r (2) – FOS l (3) |
| H2 | Co r (14) – Co l (15) |
| H3 | UpMdbrbl r (9) - 1 UpMdbrbl l (10) |
| Z1 | IOE r (4) – Co r (14) |
Table 3.
List of proportions calculated from the measured distances.
| P | Proportion |
|---|---|
| 1 | V1 / H1 |
| 2 | V1 / H3 |
| 3 | V1 / H2 |
| 4 | V1 / V3 |
| 5 | V1 / V6 |
| 6 | V1 / Z1 |
| 7 | V3 – H1 |
| 8 | H1 / H3 |
Table 4.
Mean values of female and male proportions. P-values of t-test adjusted with BenjaminiHochberg correction for multiple tests.
Table 4.
Mean values of female and male proportions. P-values of t-test adjusted with BenjaminiHochberg correction for multiple tests.
| Proportion | Female | Male | Adj. p-value |
|---|---|---|---|
| P01 | 1,08 | 1,115 | 0,031 |
| P02 | 1,877 | 2,008 | 0,001 |
| P03 | 1,04 | 1,082 | 0,015 |
| P04 | 0,962 | 0,986 | 0,275 |
| P05 | 4,851 | 5,293 | 0 |
| P06 | 1,806 | 1,874 | 0,031 |
| P07 | 1,816 | 1,785 | 0,344 |
| P08 | 1,738 | 1,802 | 0,009 |
Table 5.
Mean values of two clusters of male proportions. P-values of t-test adjusted with Benjamini-Hochberg correction for multiple tests.
Table 5.
Mean values of two clusters of male proportions. P-values of t-test adjusted with Benjamini-Hochberg correction for multiple tests.
| Proportion | Cluster m1 | Cluster m2 | Adj. p-value |
|---|---|---|---|
| P01 | 1,178 | 1,071 | 0 |
| P02 | 2,146 | 1,912 | 0 |
| P03 | 1,136 | 1,043 | 0 |
| P04 | 0,94 | 1,019 | 0,005 |
| P05 | 5,535 | 5,123 | 0,007 |
| P06 | 1,977 | 1,802 | 0 |
| P07 | 1,643 | 1,884 | 0 |
| P08 | 1,823 | 1,786 | 0,197 |
Table 6.
Mean values of two clusters of female proportions. P- values of t-test adjusted with Benjamini-Hochberg correction for multiple tests.
Table 6.
Mean values of two clusters of female proportions. P- values of t-test adjusted with Benjamini-Hochberg correction for multiple tests.
| Proportion | Cluster f1 | Cluster f2 | Adj. p-value |
|---|---|---|---|
| P01 | 1,164 | 1,034 | 0 |
| P02 | 2,001 | 1,791 | 0 |
| P03 | 1,092 | 1,003 | 0 |
| P04 | 0,921 | 0,989 | 0,039 |
| P05 | 4,979 | 4,763 | 0,147 |
| P06 | 1,9 | 1,742 | 0 |
| P07 | 1,67 | 1,917 | 0 |
| P08 | 1,746 | 1,733 | 0,713 |
Disclaimer/Publisher’s Note: The statements, opinions and data contained in all publications are solely those of the individual author(s) and contributor(s) and not of MDPI and/or the editor(s). MDPI and/or the editor(s) disclaim responsibility for any injury to people or property resulting from any ideas, methods, instructions or products referred to in the content. |
© 2023 by the authors. Licensee MDPI, Basel, Switzerland. This article is an open access article distributed under the terms and conditions of the Creative Commons Attribution (CC BY) license (http://creativecommons.org/licenses/by/4.0/).
Copyright: This open access article is published under a Creative Commons CC BY 4.0 license, which permit the free download, distribution, and reuse, provided that the author and preprint are cited in any reuse.


