Submitted:
18 May 2023
Posted:
19 May 2023
Read the latest preprint version here
Abstract
In the last two decades, our knowledge of synaptic proteomes and their relationship to normal brain function and neuropsychiatric disorders has been expanding rapidly through the use of more powerful neuroproteomics approaches. However, mass spectrometry (MS) based neuroproteomics studies of synapses still need cell-type, spatial, and temporal proteome information. With the advancement of sample preparation and MS techniques, we have just begun to identify and understand proteomes within a given cell type, subcellular compartment, and cell-type-specific synapse. Here, we review the progress and limitations of MS-based neuroproteomics of synapses and highlight the recent applications of these approaches in studying neuropsychiatric disorders such as major depressive disorder and substance use disorders. Combining neuroproteomics findings with other omics studies can generate an in-depth, comprehensive map of synaptic proteomes and possibly identify new therapeutic targets and biomarkers of several central nervous system disorders.
Keywords:
Neuroproteomics
; synapse
; neurological and psychiatric disorders
; cell-type specificity
1. Introduction
The application of proteomic analyses in neuroscience has significantly increased in the past two decades [1,2]. Historically, genomic and transcriptomic analyses were extensively used to search for mutations in patients‘ genomes or changes in gene expression in neuropsychiatric disorders such as autism spectrum disorder, Alzheimer‘s disease, and schizophrenia [3]. However, due to the molecular complexity and heterogeneity of each of these disorders and the lack of strong coincidence between mRNA and protein expression levels, genetic and transcriptomic findings fail to fully explain the pathophysiological mechanisms of these syndromes. This discrepancy raises the need for an alternative omics approach, such as proteomics, to directly examine levels of individual proteins under these conditions.
Proteomics is the study of the proteome, the comprehensive set of proteins expressed by a genome in a cell, and neuroproteomics is the study of proteomes in the nervous system [4]. Unlike the proteomic analysis of other tissues, neuroproteomics is particularly challenging due to the need for cell-type-, region-, and temporal-specific analyses. To identify proteins in the central nervous system (CNS), understand their interactions, identify posttranslational modifications, and discover potential biomarkers, neuroproteomics investigations require the conjunction of many biochemical techniques, including sample separation, gel electrophoresis, liquid chromatography, and mass spectrometry, and bioinformatics analyses. Several excellent reviews cover the applications and limitations of several neuroproteomics techniques [1,5,6,7,8]. This review will focus on mass spectrometry (MS)-based neuroproteomics of synapses.
Synapses interconnect ~86 billion neurons in a human brain into neural circuits [9], and mediate neuronal communication and resulting behavioral function. There are two different types of synapses, electrical and chemical, but the large majority of mammalian synapses are chemical and use neurotransmitters and neuropeptides [9]. A chemical synapse is generally composed of three main constituents, a presynaptic terminal, a synaptic cleft, and a postsynaptic compartment. It contains 1000-1500 distinct proteins with a turnover rate of 0.7% per hour [10].
Two decades of MS-based synaptic neuroproteomics studies have identified over 1000 synaptic proteins, tens of thousands of phosphorylation sites, and transient and time-resolved information on protein-protein interactions and structures. In 2019, synapse-specific gene ontology (SynGo) classification was established using published, expert-curated annotations. SynGo contains 87 synaptic locations and 179 synaptic processes and showed that genes that encode synaptic proteins are exceptionally well conserved and less tolerant to mutations than other genes [11]. Overall, MS-based synaptic neuroproteomics studies have significantly expanded our understanding of synapses not only in normal brain function but also in the pathophysiology of CNS disorders [12], especially based on the unbiased nature of these approaches [13,14,15,16]. However, there are several limitations to these studies.
We still lack cell-type-, subcellular compartment-, and synapse-cell-type-specific proteome information, with neuroproteomics studies of cell types, subcellular compartments, and cell-type-specific synapses now only just beginning [16,17,18,19,20]. Here, we focus on advances in MS-based neuroproteomics studies of chemical synapses. We highlight the recent application of these methods to specific cell types and subcellular compartments and to cell-type-specific synapses in the context of CNS disorders. Integrating neuroproteomics approaches with other omics will improve our understanding of synapses and lead ultimately to identification of biomarkers or new therapeutic targets.
2. Synapses
At chemical synapses, depolarizing electrical signals are rapidly converted into chemical signals by opening voltage-dependent Ca2+ channels [21,22,23]. Both small clear neurotransmitter vesicles filled with small molecule neurotransmitters, and large dense-core vesicles filled with neuropeptides, are released through synaptic vesicle (SV) fusion with the nerve terminal plasma membrane [24,25]. Once released, neurotransmitters activate ligand-gated channels or G protein-coupled receptors (GPCRs), on the postsynaptic plasma membrane to mediate or modulate excitatory or inhibitory postsynaptic currents in the postsynaptic cell [22,26,27].
2.1. Structure of Synapses
Synapses are structurally complex despite being small. Classically, synapses were described as bipartite, containing pre- and postsynaptic compartments [9]. Now, with advancements in understanding the bidirectional communication between neurons and astrocytes and the role of the extracellular matrix (ECM) in regulating synaptic functions, tripartite [28,29] and tetrapartite [30,31,32] synapses, in addition to bipartite synapses, have been widely studied. A tripartite synapse is one with pre- and postsynaptic neuronal compartments plus astrocytes, while a tetrapartite synapse includes the ECM as well. At these synapses, astrocytes and the ECM regulate both structural and functional aspects of synaptic plasticity. An in-depth discussion of tripartite and tetrapartite synapses is beyond the scope of this review in which we focus mainly on bipartite synapses.
As noted, bipartite synapses contain three components, a presynaptic nerve terminal, a postsynaptic compartment, and a synaptic cleft. The presynaptic terminal includes its plasma membrane which contains an active zone (Figure 1A) where vesicle mobilization, docking, priming, exocytosis, and endocytosis occur [33]. Both excitatory and inhibitory presynaptic terminals contain similar structures. Differences primarily lie in neurotransmitter-synthesizing enzymes and transporters. Within the presynaptic terminal, numerous synaptic proteins, such as the soluble NSF attachment protein receptor (SNARE) complex and synaptotagmins, mediate the fusion of vesicles with the plasma membrane and are expressed in both excitatory and inhibitory synapses [34]. The postsynaptic compartment includes the postsynaptic plasma membrane containing the postsynaptic density (PSD). PSDs are where cell surface proteins, neurotransmitter receptors, cell-adhesion molecules, intracellular signaling molecules, and cytoskeletal filaments are densely present [35]. Unlike presynaptic terminals, postsynaptic compartments of excitatory and inhibitory synapses are more intrinsically different. In excitatory postsynaptic compartments, which typically represent the heads of dendritic spines, PSD95, SHANK, HOMER, inotropic glutamate receptors (AMPA, NMDA, and kainite-type receptors), and calcium-calmodulin-dependent protein kinase 2 (CaMK2), among many other proteins, are present [35]. By contrast, in inhibitory postsynaptic compartments, which typically occur on dendritic shafts, gephyrin, collybistin, and ionotropic GABA receptors, among many other proteins, are expressed [36]. Lastly, the synaptic cleft—the space between the pre- and postsynaptic compartments—is a protein-rich environment whose components can drive synaptogenesis and modulate synaptic maturation and transmission [37]. However, biochemical isolation of the synaptic cleft is very complicated. With advances in electron microscopy, proteomics, biotin labeling, and other biochemical approaches, researchers identified numerous proteins, including synapse-organizing adhesion proteins, such as ephrin, cadherin, and neurexins, which reside in the synaptic cleft, and uncovered differences between excitatory glutamatergic and inhibitory GABAergic synaptic clefts [38,39]. Glutamatergic synaptic clefts contain NIGN1, LRRTM1, and LRRTM2 [40,41], while GABAergic synaptic clefts contain SLITRK3 and NLGN2 [42,43,44].
2.2. Isolation of Synapses
Biochemical isolation of synapses or of SVs followed by neuroproteomics analysis is commonly utilized to understand the architecture of synapses and the molecular mechanisms of synaptic transmission in brain [45].
Synaptosomes are “pinched-off nerve endings” composed of several cellular fragments, including a presynaptic nerve terminal with its active zone, mitochondria, SVs, plus the associated postsynaptic membrane with its PSD (Figure 1B) [34]. To prepare synaptosomes, brain tissue is first homogenized in an isotonic sucrose solution. The homogenate is centrifuged at various speeds to remove nuclei, cytosol, and cellular debris. Then, depending on the type of experiment, crude synaptosomes are further purified using discontinuous sucrose [46,47], ficoll [48,49], or percoll [50] gradient ultracentrifugation to remove mitochondria and myelin. Crude synaptosomes can be further fractionated to obtain synaptic sub-compartments, such as presynaptic nerve terminals, postsynaptic membranes, PSDs, and synaptic cytosol. Synaptosomes have limitations. They are viable for only a few hours, so they must be used on the same day of preparation. The average synaptosome diameter ranges from 0.5 to 0.9 µm [45], which makes fluorescence imaging challenging. Also, commonly used molecular techniques, such as transfections of tagged genes or RNAi knockdown, cannot be applied to synaptosomes. Instead, synaptic protein manipulation must be done prior to brain tissue collection. Synaptosomes also need to be depolarized by chemicals, since they are not sufficiently responsive to field stimulation [45]. Despite these limitations, synaptosomes are widely used, especially in neuroproteomics studies. In Wilhelm et al., approximately 300,000 proteins molecules, including multiple copies of numerous transporters, receptors, and ion channels, along with 60 types of vesicle trafficking proteins (e.g., SNAP25, VAMP2, and syntaxin1) and other presynaptic proteins critical for exocytosis (e.g., SEC1/MUNC18 [SM] proteins, MUNC13, and synaptotagmin), were detected in a single synaptosome [51].
SVs are essential organelles in the presynaptic terminal and a great model of synaptic function and pathophysiology (Figure 1C) [18]. SVs are filled with neurotransmitters, neuropeptides, or neurohormones, and understanding the composition of SVs and their trafficking mechanisms is essential to understanding synaptic transmission. In neuroproteomics and other biochemical studies, three different SV isolation protocols are widely used. One involves subcellular fractionation of crude synaptosomes, and the other involves direct isolation of SVs from brain homogenates using differential and density-gradient centrifugation [52,53]. Since the 1960s, centrifugation methods used to isolate SVs have evolved to improve the yield and purity of SVs. However, today’s centrifugation methods still suffer from low final yields, low purity, and longer preparation time. Due to the small size of SVs, approximately 40-50 nm in diameter, their purification using centrifugation takes ~24 hr. Recently, immunoprecipitation (IP) has been more favorable in isolating SVs, using an SV tag, such as RHO1D4, synaptotagmin1, or SV glycoprotein 2A/B/C [18,54]. The IP method only takes ~2 hr and is more selective than centrifugation [18]. With these advancements, several studies have successfully identified SV proteomes.
With the advent of single-cell and cell-type-specific transcriptomic techniques, neuroproteomics is now shifting toward identifying proteome changes with spatial and temporal information. While starting with a specific brain region provides some spatial resolution, this fails to provide the cell-type- and synapse-cell-type-specific and temporal information. For this reason, we focus here on these efforts to accomplish the latter.
3. Advancements in Neuroproteomics
Most neuroproteomics studies to date start with the entire brain region or large sections of brain and therefore yield averaged proteome changes. Because more precise analyses are essential to understand a protein’s role in the CNS, the field is pursuing numerous technical innovations as described below.
3.1. Isolation of Cell Types, Subcellular Compartments, and Cell-Type-Specific Synapses
3.1.1. Transgenic Animals
By crossbreeding fluorophore loxP “floxed” mice [55,56,57] or rats [57,58,59,60] with neuronal cell-type-specific Cre-expressing mice [61,62,63] or rat [64,65,66], we can label cell-type-specific synapses for MS-based neuroproteomics analyses and other biochemical assays (Figure 2A). In addition, Cre-dependent viruses can be applied to a specific brain region of neuron-specific Cre animals to label a subcellular compartment of synapses [54]. A list of available fluorophore expressing loxP “floxed” and Cre recombinase animals can be found on the Jackson Laboratory website (https://www.jax.org/research-and-faculty/resources/cre-repository) and the Rat Resource and Research Center in the US (https://www.rrrc.us/).
3.1.2. Laser Capture Microdissection (LCM)
LCM allows the isolation of a subpopulation of cells from tissue slices under direct microscopic visualization (Figure 2B) [67]. With 20 µm spatial resolution, it can isolate cells and specific subcellular compartments [68]. For example, LCM can dissect neuromelanin granules from substantia nigra [69], and separate neurons and amyloid plaques from Alzheimer‘s disease brain tissue [70]. LCM is well-validated and commonly used in transcriptomic studies but is yet to be widely used in neuroproteomics analysis, with its application limited primarily to human postmortem brain tissue [71,72,73,74,75]. Recently, LCM was applied to rat hippocampus to examine spatial proteomic changes [76]. do Canto et al. identified new signaling pathways and proteins present in specific layers and regions of the dentate gyrus. With micro-proteomics, which requires only 5000 cells [77] or nanoPOTs (see Single-cell mass spectrometry), LCM has great potential for future neuroproteomics studies.
3.1.3. Magnetic-Activated Cell Sorting (MACS)
MACS, known as immunomagnetic cell separation, isolates specific cell types using tiny paramagnetic beads coupled to antibodies, enzymes, lectins, or streptavidin (Figure 2C) [78]. It is one of the most common, inexpensive, user-friendly cell separation techniques. It does not require specialized training like fluorescence-activated cell sorting (FACS) and eliminates the need for fluorophores [79]. However, it involves bulk isolation compared to FACS, which provides cell-by-cell isolation [80]. Since 1990, MACS has been widely used in neuroscience to purify several CNS cell types (neurons, astrocytes, oligodendrocytes, and microglia) from rodent brain [19,79,81]. MACS is particularly favorable for astrocytes [82,83]. Holt et al. showed that astrocytes isolated by MACS are significantly more morphologically complex than those isolated by FACS, suggesting that MACS is gentler than FACS [79]. However, isolating neurons from adult rodent brain using MACS results in significant contamination [79]. This major limitation of MACS has made FACS much more commonly used for neuronal neuroproteomics studies.
3.1.4. Fluorescence-Activated Cell Sorting (FACS)
FACS is a high throughput technique to isolate a homogeneous population from a heterogeneous cell population (Figure 2D). Samples are placed in a fluid stream, enter the flow cell in a cell-by-cell form through a nozzle, pass by a set of lasers, and the light scattering and fluorescence signals of each particle passing by are detected [84]. Then, individual cell types are collected into homogeneous fractions. FACS can isolate cells based on their surface marker, size, and granularity, and it allows the enrichment of even low abundant subpopulations with high purity. Nevertheless, FACS has several limitations. It can only sort suspended cells and requires several hundreds of microliters to milliliters of sample [85]. Also, it highly depends on fluorescence signal intensity, so fluorescence compensation is necessary to sort cells accurately. Despite these limitations, FACS is commonly used in neuroproteomics and preferred over MACS for studies of neurons and synaptosomes.
Because synaptosomes are heterogenous, an additional isolation step is necessary to isolate cell-type-specific synaptosomes. However, synaptosomes are much more challenging to sort than cells: they are an order of magnitude smaller than an average cell. To successfully conduct fluorescence-activated synaptosome sorting (FASS), size standards, a non-light scattering-dependent detection method, and longer sorting times are required [86,87]. Biesemann et al. successfully isolated glutamatergic synaptosomes using FASS and identified 163 enriched proteins in sorted glutamatergic synaptosomes [87]. Moreover, Paget-Blanc et al. successfully characterized dopaminergic (DA) synapses, with 57 proteins specifically enriched, and revealed “DA hub synapses”—those adhered to glutamatergic, GABAergic, or cholinergic synapses [16]. FACS combined with highly sensitive MS is the most widely used approach to study cell-type specific synapses.
3.1.5. Tandem Affinity Purification
The specificity of affinity reagents, such as antibodies, peptides, and ligands, limits the isolation of synapses with affinity methods [88,89,90,91,92,93]. The recovery of the native complex is also low and potentially includes more contaminants. To overcome these weaknesses, a tandem affinity purification (TAP) tag was developed [94]. TAP is an IP-based purification technique (Figure 2E). Initially, it was made with two IgG binding domains of Straphylococus aureus protein A (ProtA), tobacco etch virus (TEV) protease cleavage site, and calmodulin binding peptide (CBP) [94]. ProtA binds tightly to an IgG matrix, requiring TEV protease to elute material under native conditions. Then, elutants are incubated with calmodulin-coated beads in the presence of calcium, allowing the CBP of TAP to bind to the beads. After going through multiple washes, EGTA is used for elution. Having a protease cleavage site between two affinity tags allows the rapid purification under native conditions of complexes. Despite its strength, the original TAP tag has disadvantages. The calmodulin affinity step was inefficient since endogenous calmodulin in mammalian cells interferes with the binding of the target, causing poor protein recovery. Also, the chelating agent in elution can irreversibly interfere with the function of cation-dependent proteins. Lastly, the original TAP tag is relatively large, 21 kDa, and can impair protein function [95]. 30 alternative TAP tags with different combinations of affinity handles and lower kDa are now available [95]. Both C- and N-terminus TAP tags are available to isolate the protein of interest (with its associated proteins) without impairing protein function [96]. Moreover, transgenic mice lines with TAP tags have been developed for decade to study protein-protein interactions in disease models and signaling complexes of synapses. For example, TAP-tagged PSD95 knockin and PSD95 conditional TAP mice have been used to isolate postsynaptic compartments of synapses and perform proteomic analysis of PSD-95-associated complexes in forebrain [96] and hippocampus and its CA3 subfield [97].
3.1.6. Protein Labeling
To overcome limitations of MACS and FACS, numerous protein-labeling techniques have been developed to conduct subcellular compartment and cell-type-specific proteomics analysis [98]. The two most commonly used are metabolic and proximity labeling.
Bio-orthogonal non-canonical amino acid tagging (BONCAT) is a metabolic label that enriches cell-specific proteomes. A mutant methionyl-tRNA synthetase (MetRSL274G) labels newly translated proteins with the non-canonical amino acid [99]. This tool is very powerful in labeling newly synthesized proteins in a cell-type-specific manner when applied with Cre-loxP transgenic animals. Following copper-catalyzed azide-alkyne ligation (CLICK chemistry), labeled proteins can be isolated and analyzed by MS. Alvarez-Castelao et al. developed a protocol that labels, purifies, and identifies cell-type-specific proteomes in a Cre-recombinase-inducible mouse line expressing a mutant L274GMetRS. The authors successfully detected 2,384 distinct proteins in hippocampal excitatory neurons and 1,687 distinct proteins in cerebellum inhibitory neurons [100,101].
An alternative protein labeling approach is proximity labeling[102]. Genetically-encoded labeling enzymes such as BioID [103], TurboID [104], APEX2 [105], and horse radish peroxidase (HRP) [38,106,107] can be expressed and localized to a specific subcellular compartment and modify a freely diffusing biotin (Figure 2F). In situ biotinylation occurs rapidly from minutes to hours for TurboID and within seconds for APEX2 [108]. Then, with streptavidin affinity purification, labeled proteins can be isolated.
Although these methods extensively examine both cell-type- and subcellular-specific proteomes, several limitations must be addressed. Proximity labeling requires expression of an exogenous enzyme and uses a transfection method or knockin mouse line [38]. Also, endogenous biotinylation must be considered [109]. Currently, the application of BioID [110,111] or TurboID [112,113] to brain of transgenic mice is very limited. To map activity-dependent changes at the proteome level, APEX2, known as fast proximity labeling, combined with Cre transgenic animals is more favorable [108,114,115]. Despite the toxicity of biotin-phenol, H2O2, and the ex vivo application of APEX2 and HRP-mediated biotinylation, APEX2 and HRP labelings help to identify neuroproteome changes in a cell-type, subcellular-compartment-, and activity-dependent manner. Hobson et al. examined the DA presynaptic proteome using synaptosomes purified from striatum of DAT-IRES-CRE mice expressing APEX2NES. From striatal synaptosomes with APEX2 expression in midbrain DA neurons, they identified 1,533 proteins, including those involved in DA synthesis, release, reuptake, and degradation. Moreover, Suster et al. showed an efficient ex vivo cell surface biotinylation in brain using Cre-dependent expression of a membrane-targeted HRP. ARMH4 was identified as a critical cell-surface protein required for Purkinje cell dendrite arborization in the cerebellum [107].
3.2. Advancements in MS Approaches
The development of MS-based neuroproteomics allowed the possibility of characterizing and quantifying brain proteomes in a high throughput manner. MS-based proteomics is divided into two approaches: bottom-up vs. top-down (Figure 3A). The main difference is the digestion step.
Bottom-up proteomics uses proteases, such as trypsin, to digest proteins into peptides, which are analyzed by MS (Figure 3A). The mass-to-charge ratio and predicted sequences of peptides are then used to search in a protein database to characterize the open-reading frame these isolated peptides are from. The pros of using bottom-up proteomics are that peptides are more easily separated by reverse phase liquid chromatography, ionize well, and fragment in a more predictable manner [116]. However, the extensive use of proteases brings caveats. Peptides identified in bottom-up proteomics are often not specific to a single protein. Data must be filtered to identify unique peptides for a given protein to accurately identify and quantify that protein. Also, the method only covers the partial sequence of a protein. Despite these limitations, bottom-up proteomics is the most commonly used MS approach, especially in neuroproteomics [99,117].
Top-down proteomics uses intact proteins and thereby eliminates issues caused by focusing on peptides. Intact proteins are fractionated and run on high-resolution MS, where proteoform, all of the different molecular forms in which the protein product of a single gene can be found including genetic variations, alternatively spliced RNA transcripts and post-translational modifications [118], is selected and analyzed (Figure 3A). This approach allows for 100% sequence coverage and complete characterization of proteomes, including genetic variation, alternative splicing, and post-translational modification [119]. However, several challenges, such as protein solubility, detection of low-abundance proteins, and proteome complexity, need to be addressed and, for these reasons, it is less favorable than bottom-up proteomics. With ongoing improvements in solubilizing membrane proteins and ECM, enriching low-abundance proteins, and separating intact proteins before MS analysis [120], the application of top-down proteomics in neuroproteomics will undoubtfully increase.
Since the mid-1990s, numerous proteomics methods have been developed and widely applied in a cell-type-specific manner in neuroscience [121]. Here, we highlight the two most trending methods of MS: imaging and single-cell MS.
3.2.1. Direct in situ Spatial Proteomics
Imaging mass spectrometry (IMS), such as matrix-assisted laser desorption/ionization IMS (MALDI-MS), provides a spatial distribution of molecules present in a sample (Figure 3B). MALDI-MS uses brain tissue embedded in a matrix allowing the ionization of molecules in situ with a laser. Although suitable for de novo spatial proteome discovery, MALDI-MS suffers from shallow depth [2]. Proteins and peptides are challenging to ionize in this manner. Therefore, IMS is more applicable to studies of metabolites and lipids.
Imaging mass cytometry (IMC) with IMS is another approach that can be used to study cell types, subcellular compartments, and cell-type-specific synapses [2]. IMC uses antibodies coupled to heavy metal species to label proteins, allowing the simultaneous imaging of up to 40 different proteins simultaneously, with labeled proteins identified by IMS [122,123]. In Van Deusen et al., protein-based cell atlases of the developing mouse telencephalon, diencephalon, mesencephalon, and rhombencephalon were mapped using this approach. They quantified 85 molecularly distinct cell populations, including neurons and myelin [123].
3.2.2. Single-Cell Mass Spectrometry
Single-cell transcriptomics has transformed our understanding of the brain. However, mRNA and protein expression are often not consistent [19,124,125,126]. This gap led to the development of single-cell mass spectrometry (scMS)[127]. Comparing the results of single-cell transcriptomics with single-cell proteomics can yield new insights into the mechanisms of circuit formation and function. With the advancement in liquid chromatography (LC), tandem mass spectrometry (MS/MS), and sample preparation, scMS has just begun to be applied in neuroproteomics.
Current MS-based proteomic approaches require samples containing a minimum of thousands of cells to provide in-depth profiling [77]. Because proteomics does not allow for amplification steps like PCR-based transcriptomics, many cells are required for proteomic analysis, which is the biggest hurdle of scMS. To overcome this, nanoPOTS, nanodroplet process in one pot for trace samples, was developed [68]. nanoPOTS consists of two glass pieces, a slide and a spacer, which are micropatterned with hydrophilic nanowells surrounded by a hydrophobic surface. Nanowells serve as microreactors for cells or other protein samples. They can undergo chemical treatments to extract, reduce, alkylate, and digest in volumes as small as 200 nl while avoiding sample loss due to surface exposure. Using LCM and nanoPOTS, the quantitative profiling of >3,000 proteins was achieved from ten HeLa cells [68]. Also, nearly 1,000 proteins were detected from a 100 µm diameter section of a 12 µm thick slice of rat cerebral cortex [68].
scMS with multiplexed isobaric tandem mass tags (TMTs), including single cell proteomics by mass spectrometry (ScoPE-MS) [128] and improved boosting to amplify signal with isobaric labeling (iBASIL) strategy [129], are, so far, the most successful approaches used for single cell, cell-type-specific proteomics analysis (Figure 3C). These methods enhance protein detection and minimize sample surface losses of labeled samples by using a pool of cells or standard peptides from proteins of interest, known as “carrier” or “boosting.” Both carrier and single cells are labeled with TMTs, adding the same total mass to the peptides but having a different isotope composition. This results in one isobaric mass signal on MS1 spectra, but once the peptide precursors are fragmented, the difference is found in the low m/z region in the MS2 or MS3 spectrum [130]. Then, the ratio of those reported ions from single cells quantifies the previously labeled sample. These methods allow the more accurate quantification of detected proteins compared to label-free proteomics analysis. However, quantifying proteins using these tags requires optimizing a carrier signal. Larger carrier proteomes may promote losses in quantifying low-abundance peptides. Furthermore, co-eluting and co-fragmented peptide signals may interfere with quantifying a peptide of interest. So far, these scMS efforts with TMTs have not been readily applied to study neural cells. Combining these with other cell-type-specific isolation techniques, such as FACS, will help characterize single brain cells [130]. Unbiased classification of neuron types by large-scale scMS, and combining results with other available omics, should improve quantification of brain proteomes.
4. Application of Neuroproteomics Analysis to Neuropsychiatric Disorders
Disordered functioning of synapses is known to contribute to a wide range of neuropsychiatric disorders [99]. Thus, an in-depth understanding of the molecular and functional organization of synapses and synaptic dysfunction in these neuropsychiatric disorders is essential.
Many high-throughput genomic and transcriptomic studies of such disorders have examined mutations in patient genomes or changes in their transcriptomes, yielding numerous key discoveries [131]. However, these approaches fail to offer a complete picture of disease states because they cannot detect the abundance of proteins and examine their networks. To fill this gap, neuroproteomics is being increasingly utilized to discover biomarkers and explore underlying pathological mechanisms. Indeed, synaptic proteomic changes have been identified for several psychiatric disorders [132,133,134]. Here, we highlight studies in across several disorders that use proteomic analysis of synapses to further refine the mechanisms of various disease states and identify new targets for possible treatments.
4.1. Autism Spectrum Disorder
Neurodevelopmental disorders are multifaceted conditions characterized by impairments in cognition, communication, behavior, and/or motor skills resulting from abnormal brain development [135]. Autism spectrum disorders (ASDs) are among the most well-studied neurodevelopmental disorders in neuroproteomics. ASDs are highly heritable, heterogeneous disorders characterized by impairments in social communication and sensory perception, often accompanied by repetitive behaviors [136]. Due to varied genetic underpinnings of ASDs, the contribution of identified de novo mutations and rare or common variants found in ASDs is not always clear. Genetic variations associated with ASDs are highly enriched in genes encoding synaptic proteins such as group 1 mGLURs, NMDARs, and SHANK, to name a few [136]. To further understand the signaling network of ASDs, various neuroproteomics approaches have been used [132,137,138,139,140,141,142,143]. For example, SHANK3 is a large scaffold protein that organizes the PSD of glutamatergic synapses [142]. Mutation of SHANK3 is hypothesized to perturb synaptic transmission in neural circuits throughout the brain and cause diverse neuropsychiatric phenotypes. With improvements in biochemical subcellular fractionation of synapses, the effect of Shank3 mutations was examined in striatal and hippocampal PSDs in Shank3 mutant mice [132]. Reim et al. identified changes in 55 and 61 proteins, out of a total of ~2,500, in striatal PSDs and hippocampal PSDs, respectively, from Shank3 mutants [132]. Findings of this study mirrored results from previous work using two different ASD mouse models, Pten mutant [144] and Fmr1 knockout [137] mice. Together, the work highlights the value of unbiased and comprehensive screening of subcellular synapse anatomy in ASD-associated brain regions to understand the molecular consequences of the corresponding mutation and big picture of ASD pathology [132]. Recently, using BioID and MS-based neuroproteomics approaches, protein-protein interaction (PPI) networks for 41 ASD risk genes were identified. The PPI network revealed the convergent pathways of ASDs as well as other pathways that are affected in only a subset of ASDs [143].
4.2. Alzheimer‘s Disease
Alzheimer‘s disease (AD), the most common form of progressive, age-related dementia, is a neurodegenerative disorder involving the gradual loss of synapses and the accumulation of amyloid β (Aβ) oligomers [145,146]. Soluble Aβ oligomers cause synaptic and cognitive dysfunction by inhibiting long-term potentiation (LTP) and accelerating neuronal cell death in AD [147,148]. Despite the well-known genetic underpinnings and molecular hallmarks of AD, AD treatments remain limited. Recent neuroproteomics analysis of AD synapses suggest new potential therapeutic targets.
Neuroproteomics analysis of synaptosomes from human AD postmortem hippocampus and inferior temporal gyrus was first reported in 2013 [149]. Chang et al. identified expression changes in several synaptic proteins, such as synaptotagmin 1 and V-ATPase, a protein located at the SV membrane. Kadoyama et al. later detected V-ATPase components in hippocampus of bicuculline-treated Apposk-Tg mice, a transgenic mouse model of AD. Moreover, the synaptic vulnerability caused by the genetic factor of sporadic AD, apolipoprotein E 4 alleles (APOE4), was identified using neuroproteomics analysis of superior temporal gyrus (BA41/42) and primary visual cortex (BA17) from human APOE4+ brain tissue. 5,500 differentially expressed proteins important for synaptic and mitochondrial function, neuroimmune interactions, and intracellular signaling were detected [150]. Cafeliello et al. is another exemplary study utilizing synaptosomes to identify local translation in TgCRND8 mice—another mouse model of AD. Using radioisotope labeling and BONCAT, this study showed that amyloid precursor protein (APP), which yields Aβ, is synaptically synthesized in the cerebral cortex and cerebellum of TgCRND8 mice. Overall, the use of neuroproteomics analysis in AD studies has shone new light on AD pathophysiology, and has suggested bicuculline, a GABAA receptor blocker, as a potential treatment to improve cognition [151].
4.3. Schizophrenia
Schizophrenia (SCZ) is a heterogeneous psychotic disorder characterized by delusions, hallucinations, disorganized speech or behavior, and impaired cognitive ability [152]. The pathophysiology of SCZ is complex, and many factors are yet to be discovered [153]. SCZ involves numerous genetic loci and is highly pleiotropic [154]. A reduction in synaptic densities and abnormalities in neurotransmission are reported as pathophysiological signatures of SCZ [155,156,157,158,159]. Neuroproteomics analysis of human SCZ postpartum brain revealed PSD proteins, such as SHANK3, MAPK3, and SNYPO, differentially expressed in SCZ [160]. Moreover, protein-protein interaction analysis of primary hippocampal neurons suggested that neurotransmitter release in SCZ may be affected owing to subtle dysregulation via an indirect upstream gene regulatory mechanism rather than dysregulation of the involved proteins per se [159]. These findings complemented genomic analysis of schizophrenia risk genes that encode PSD proteins [141,161] and, most importantly, highlighted the need for neuroproteomics studies to identify the network of protein changes.
4.4. Major Depressive Disorder
Major depressive disorder (MDD) is one of the most common mental disorders worldwide. In 2020, about 8.4% of all U.S. adults had at least one major depressive episode, and the lifetime prevalence is 17% [162]. It is also a multifactorial disorder. Studies suggest that MDD is caused by a combination of genetic predisposition (~35%) and environmental factors [163]. Our understanding of MDD pathophysiology remains incomplete. Since up to 50% of MDD patients are not fully treated with available therapies, there is a tremendous unmet need for new therapeutics.
Proteome changes in MDD have been extensively studied. Postmortem anterior cingulate cortex [164], frontal cortex [165], and dorsolateral prefrontal cortex (DLPFC) [166] from MDD patients were analyzed with proteomics approaches. These studies highlighted proteins involved in energy metabolism, such as carbonic anhydrase, aldolase C, histidine triad nucleotide-binding proteins, and several subunits of oxidative phosphorylation complexes, as being differently expressed in MDD. Also, adenosine triphosphatase (ATPase) levels were lower in MDD [166]. Phosphoproteomics study of DLPFC in MDD brains revealed differential phosphorylation levels of numerous synaptic proteins, including SNARE, SNAP25, and synapsin I [167]. Neuroproteomics analyses of cerebrospinal fluid [168] and plasma [169] from MDD patients identified potential biomarkers in MDD patients. The discovery of biomarkers to that identifies subtypes of MDD patients would be a major advance in the field.
4.5. Substance Use Disorders
The persistence of addiction is thought to be mediated by drug-induced changes in the physiology of reward-processing brain regions. Dysregulated signaling within brain reward regions, such as the nucleus accumbens (NAc), medial prefrontal cortex (mPFC), and basolateral amygdala (BLA), appears to play an especially critical role in promoting drug-seeking and relapse [20,170,171,172,173]. Determining these changes will reveal more effective targets for treating drug addiction and relapse. However, our understanding of the molecular mechanisms underlying these adaptations and alterations of signaling remains incomplete.
A broad-scale investigation of molecular alterations in brain reward regions through proteomics will help capture the biological basis of addiction-related behaviors. Recent neuroproteomics work proves that addiction-related behaviors emerge from converging subtle molecular changes. Bosch et al. showed 84 differentially regulated protein changes, including proteins with known roles in SVs and cytoskeleton in dorsal striatum synaptosomes of methamphetamine self-administering rats [174]. Furthermore, utilizing labeling techniques such as TMT and fluorophore, Lull et al. compared the PFC proteome in cocaine self-administering rats and identified 20 significant changes, such as heat shock protein 73 and SNAP25 [175]. Recently, Puig et al. identified changes in 56 and 161 proteins from synaptosomes of postmortem NAc and DLPFC, respectively, of opioid use disorder patients. In NAc synaptosomes, proteins involved in inflammatory, mitochondria, and metabolic signaling pathways were identified. In contrast, proteins involved in inflammatory signaling, serotonergic, DA, cholinergic, and oxytocin neurotransmission were identified in DLPFC synaptosomes [176]. In both brain regions, proteins involved in GABAergic and glutamatergic synaptic functions as well as circadian rhythms were demonstrated, suggesting molecular disruption of circadian regulation of synaptic signaling in human brain as a critical factor in opioid addiction [176]. Although these neuroproteomics studies successfully identified critical intracellular signaling [177] and circuit-level networks [178] in synapses associated with drug-seeking, we still need to gain an understanding of neuronal cell-type-specific synaptic changes.
5. Limitation and Future Perspectives
With improvements in sample preparation and MS, MS-based proteomics has become an even more powerful tool in recent years. However, several limitations must be considered, especially examining the proteomic landscape of synapses in a cell-type-specific manner.
Unlike genomic technologies which can capture the vast majority of all expressed RNAs, our ability to detect proteins remains limited. Out of perhaps tens of thousands of distinct types of proteins that are expressed in a given tissue, the best proteomics method can detect several thousand, with low-abundance proteins especially difficult to detect. This lack of sensitivity with proteomics is due to the inability to amplify signals as routinely performed for RNAs. Because only partial protein sequence is used in most proteomic studies, proteins with low abundance, alternative splicing, alternative translation initiation sites, and point mutations are much more difficult to detect. Also, a relatively large quantity of sample is needed in neuroproteomics studies. This is the biggest hurdle for conducting neuroproteomics of cell-type-specific synapses in a specific brain region. The top-down MS approach, in which intact proteins instead of peptides are analyzed, helps to overcome some of these issues regarding partial sequence coverage. However, in top-down MS, it is difficult to accurately determine the monoisotopic mass and identify proteins larger than 50 kDa [99]. Further advancement in the sensitivity and resolution of MS technology, and associated enrichment and purification techniques, may close the gap between proteomics and other omics analyses.
Conducting cell-type-specific neuroproteomics is essential to advance the field. For example, in the NAc, two populations of medium spiny neurons (MSNs) generally exert opposite effects on behavior. D1-MSNs promote positive reinforcement and increase the formation of cocaine reward-context associations, whereas D2-MSNs appear to produce aversion and decrease cocaine reward [179,180]. Likewise, acute cocaine administration enhances D1-MSN and suppresses D2-MSN activity [181]. These cell types work in a subregion-dependent, complex, interweaving manner to drive drug-seeking and relapse behavior in NAc [182,183,184]. To further understand substance-induced synaptic proteome changes in the brain’s reward circuitry, it is necessary to examine cocaine-induced D1- and D2-MSN-specific synaptic proteome changes in NAc. Such proteomic adaptations will likely drive reciprocal interactions between drug-induced transcriptional responses and synaptic dysfunction, perpetuating the “addiction cycle.” Delineating these complex reciprocal interactions will reveal more effective targets for treating drug addiction and relapse. Such advances will require technological improvements since current methods would require D1- or D2-MSNs isolated from transgenic mice where D1- or D2-MSNs with a fluorophore for deep neuroproteomics analysis. Our lab has generated D1- or D2-MSNs labeled transgenic animals and isolated not only bipartite synapses of D1- or D2-MSNs but also tripartite synapses using FACS. By completing this study, we aim to demonstrate cell-type-specific synaptic changes in both bipartite and tripartite synapses.
With advances in imaging and genetic labeling methods, the spatiotemporal organization of synaptic proteins can now be visualized by identifying synaptic proteins at single-synapse resolution across mouse brain regions [185]. PSD95 positive synapses have been characterized proteomically for 20 different human brain regions [186], and for mouse brain from postnatal day 1 to 18 months [187]. These studies help to understand the diversity of synapses as brain regions become dissimilar and how the protein constituents and architecture of synapses change through development. These studies also connect transcriptomic and neuroproteomics analyses to structural synaptic development and plasticity within the subcellular compartment.
By integrating transcriptomics, translatomics, neuroproteomics, and super-resolution structural imaging, we are now at the next step of investigating the mechanistic links between behavioral changes, psychological function, and synaptic pathology of specific gene mutations in a specific brain region with cell-type-specificity and temporal information. Deep learning methods offer exciting promise for linking multi-omics and spatial data across cell types and structural organization [188]. An in-depth, comprehensive understanding of synaptic proteomes, especially in a cell-type-specific manner, links between mRNA-protein, local protein synthesis regulation, and changes in the subsynaptic molecular organization will expand potential therapeutic targets of synapse-linked diseases by not only correcting abnormal neurotransmitter-mediated signaling but also changing the translational perspectives of synaptic proteins.
Author Contributions
Y.YY. wrote the article; and E.J.N. and Y.YY. reviewed and edited the article before submission.
Acknowledgments
All figures are created with BioRender.com. Some figures are adapted from BioRender templates, including electrical synapses vs. chemical synapses, magnetic sorting of leukocytes, FACS sorting principle, and types of proteomics workflows.
Conflicts of Interest
The authors declare no conflict of interest.
References
- Xu, Y.; Song, X.; Wang, D.; Wang, Y.; Li, P.; Li, J. Proteomic insights into synaptic signaling in the brain: the past, present and future. Mol Brain 2021, 14, 37. [CrossRef]
- Marcassa, G.; Dascenco, D.; de Wit, J. Proteomics-based synapse characterization: From proteins to circuits. Curr Opin Neurobiol 2023, 79, 102690. [CrossRef]
- Lake, J.; Storm, C.S.; Makarious, M.B.; Bandres-Ciga, S. Genetic and Transcriptomic Biomarkers in Neurodegenerative Diseases: Current Situation and the Road Ahead. Cells 2021, 10. [CrossRef]
- Husain, I.; Ahmad, W.; Ali, A.; Anwar, L.; Nuruddin, S.M.; Ashraf, K.; Kamal, M.A. Functional Neuroproteomics: An Imperative Approach for Unravelling Protein Implicated Complexities of Brain. CNS Neurol Disord Drug Targets 2021, 20, 613-624. [CrossRef]
- Alzate, O. Neuroproteomics. In Neuroproteomics, Alzate, O., Ed.; Frontiers in Neuroscience; Boca Raton (FL), 2010.
- Bai, F.; Witzmann, F.A. Synaptosome proteomics. Subcell Biochem 2007, 43, 77-98. [CrossRef]
- Bayes, A.; Grant, S.G. Neuroproteomics: understanding the molecular organization and complexity of the brain. Nat Rev Neurosci 2009, 10, 635-646. [CrossRef]
- Murtaza, N.; Uy, J.; Singh, K.K. Emerging proteomic approaches to identify the underlying pathophysiology of neurodevelopmental and neurodegenerative disorders. Mol Autism 2020, 11, 27. [CrossRef]
- Caire, M.J.; Reddy, V.; Varacallo, M. Physiology, Synapse. In StatPearls; Treasure Island (FL), 2023.
- Landgraf, P.; Antileo, E.R.; Schuman, E.M.; Dieterich, D.C. BONCAT: metabolic labeling, click chemistry, and affinity purification of newly synthesized proteomes. Methods Mol Biol 2015, 1266, 199-215. [CrossRef]
- Koopmans, F.; van Nierop, P.; Andres-Alonso, M.; Byrnes, A.; Cijsouw, T.; Coba, M.P.; Cornelisse, L.N.; Farrell, R.J.; Goldschmidt, H.L.; Howrigan, D.P.; et al. SynGO: An Evidence-Based, Expert-Curated Knowledge Base for the Synapse. Neuron 2019, 103, 217-234 e214. [CrossRef]
- van Gelder, C.; Altelaar, M. Neuroproteomics of the Synapse: Subcellular Quantification of Protein Networks and Signaling Dynamics. Mol Cell Proteomics 2021, 20, 100087. [CrossRef]
- Natividad, L.A.; Buczynski, M.W.; McClatchy, D.B.; Yates, J.R., 3rd. From Synapse to Function: A Perspective on the Role of Neuroproteomics in Elucidating Mechanisms of Drug Addiction. Proteomes 2018, 6. [CrossRef]
- Martins-de-Souza, D. Proteomics, metabolomics, and protein interactomics in the characterization of the molecular features of major depressive disorder. Dialogues Clin Neurosci 2014, 16, 63-73. [CrossRef]
- Abul-Husn, N.S.; Devi, L.A. Neuroproteomics of the synapse and drug addiction. J Pharmacol Exp Ther 2006, 318, 461-468. [CrossRef]
- Paget-Blanc, V.; Pfeffer, M.E.; Pronot, M.; Lapios, P.; Angelo, M.F.; Walle, R.; Cordelieres, F.P.; Levet, F.; Claverol, S.; Lacomme, S.; et al. A synaptomic analysis reveals dopamine hub synapses in the mouse striatum. Nat Commun 2022, 13, 3102. [CrossRef]
- Sapkota, D.; Kater, M.S.J.; Sakers, K.; Nygaard, K.R.; Liu, Y.; Koester, S.K.; Fass, S.B.; Lake, A.M.; Khazanchi, R.; Khankan, R.R.; et al. Activity-dependent translation dynamically alters the proteome of the perisynaptic astrocyte process. Cell Rep 2022, 41, 111474. [CrossRef]
- Bradberry, M.M.; Mishra, S.; Zhang, Z.; Wu, L.; McKetney, J.M.; Vestling, M.M.; Coon, J.J.; Chapman, E.R. Rapid and Gentle Immunopurification of Brain Synaptic Vesicles. J Neurosci 2022, 42, 3512-3522. [CrossRef]
- Sharma, K.; Schmitt, S.; Bergner, C.G.; Tyanova, S.; Kannaiyan, N.; Manrique-Hoyos, N.; Kongi, K.; Cantuti, L.; Hanisch, U.K.; Philips, M.A.; et al. Cell type- and brain region-resolved mouse brain proteome. Nat Neurosci 2015, 18, 1819-1831. [CrossRef]
- Scofield, M.D.; Li, H.; Siemsen, B.M.; Healey, K.L.; Tran, P.K.; Woronoff, N.; Boger, H.A.; Kalivas, P.W.; Reissner, K.J. Cocaine Self-Administration and Extinction Leads to Reduced Glial Fibrillary Acidic Protein Expression and Morphometric Features of Astrocytes in the Nucleus Accumbens Core. Biol Psychiatry 2016, 80, 207-215. [CrossRef]
- Schoch, S.; Gundelfinger, E.D. Molecular organization of the presynaptic active zone. Cell Tissue Res 2006, 326, 379-391. [CrossRef]
- Sudhof, T.C. The synaptic vesicle cycle. Annu Rev Neurosci 2004, 27, 509-547. [CrossRef]
- Zhai, R.G.; Bellen, H.J. Hauling t-SNAREs on the microtubule highway. Nat Cell Biol 2004, 6, 918-919. [CrossRef]
- Pang, Z.P.; Sudhof, T.C. Cell biology of Ca2+-triggered exocytosis. Curr Opin Cell Biol 2010, 22, 496-505. [CrossRef]
- Park, Y.; Kim, K.T. Short-term plasticity of small synaptic vesicle (SSV) and large dense-core vesicle (LDCV) exocytosis. Cell Signal 2009, 21, 1465-1470. [CrossRef]
- Dresbach, T.; Qualmann, B.; Kessels, M.M.; Garner, C.C.; Gundelfinger, E.D. The presynaptic cytomatrix of brain synapses. Cell Mol Life Sci 2001, 58, 94-116. [CrossRef]
- Sudhof, T.C. Neurotransmitter release: the last millisecond in the life of a synaptic vesicle. Neuron 2013, 80, 675-690. [CrossRef]
- Perea, G.; Navarrete, M.; Araque, A. Tripartite synapses: astrocytes process and control synaptic information. Trends Neurosci 2009, 32, 421-431. [CrossRef]
- Farhy-Tselnicker, I.; Allen, N.J. Astrocytes, neurons, synapses: a tripartite view on cortical circuit development. Neural Dev 2018, 13, 7. [CrossRef]
- Chelini, G.; Pantazopoulos, H.; Durning, P.; Berretta, S. The tetrapartite synapse: a key concept in the pathophysiology of schizophrenia. Eur Psychiatry 2018, 50, 60-69. [CrossRef]
- Kruyer, A.; Chioma, V.C.; Kalivas, P.W. The Opioid-Addicted Tetrapartite Synapse. Biol Psychiatry 2020, 87, 34-43. [CrossRef]
- Chaves Filho, A.J.M.; Mottin, M.; Los, D.B.; Andrade, C.H.; Macedo, D.S. The tetrapartite synapse in neuropsychiatric disorders: Matrix metalloproteinases (MMPs) as promising targets for treatment and rational drug design. Biochimie 2022, 201, 79-99. [CrossRef]
- Murthy, V.N.; De Camilli, P. Cell biology of the presynaptic terminal. Annu Rev Neurosci 2003, 26, 701-728. [CrossRef]
- Yim, Y.Y.; Zurawski, Z.; Hamm, H. GPCR regulation of secretion. Pharmacol Ther 2018, 192, 124-140. [CrossRef]
- Lepeta, K.; Lourenco, M.V.; Schweitzer, B.C.; Martino Adami, P.V.; Banerjee, P.; Catuara-Solarz, S.; de La Fuente Revenga, M.; Guillem, A.M.; Haidar, M.; Ijomone, O.M.; et al. Synaptopathies: synaptic dysfunction in neurological disorders - A review from students to students. J Neurochem 2016, 138, 785-805. [CrossRef]
- Sheng, M.; Kim, E. The postsynaptic organization of synapses. Cold Spring Harb Perspect Biol 2011, 3. [CrossRef]
- Sudhof, T.C. Towards an Understanding of Synapse Formation. Neuron 2018, 100, 276-293. [CrossRef]
- Loh, K.H.; Stawski, P.S.; Draycott, A.S.; Udeshi, N.D.; Lehrman, E.K.; Wilton, D.K.; Svinkina, T.; Deerinck, T.J.; Ellisman, M.H.; Stevens, B.; et al. Proteomic Analysis of Unbounded Cellular Compartments: Synaptic Clefts. Cell 2016, 166, 1295-1307 e1221. [CrossRef]
- Biederer, T.; Kaeser, P.S.; Blanpied, T.A. Transcellular Nanoalignment of Synaptic Function. Neuron 2017, 96, 680-696. [CrossRef]
- Song, J.Y.; Ichtchenko, K.; Sudhof, T.C.; Brose, N. Neuroligin 1 is a postsynaptic cell-adhesion molecule of excitatory synapses. Proc Natl Acad Sci U S A 1999, 96, 1100-1105. [CrossRef]
- Linhoff, M.W.; Lauren, J.; Cassidy, R.M.; Dobie, F.A.; Takahashi, H.; Nygaard, H.B.; Airaksinen, M.S.; Strittmatter, S.M.; Craig, A.M. An unbiased expression screen for synaptogenic proteins identifies the LRRTM protein family as synaptic organizers. Neuron 2009, 61, 734-749. [CrossRef]
- Chih, B.; Gollan, L.; Scheiffele, P. Alternative Splicing Controls Selective Trans-Synaptic Interactions of the Neuroligin-Neurexin Complex. Neuron 2006, 51, 171-178. [CrossRef]
- Takahashi, H.; Katayama, K.-i.; Sohya, K.; Miyamoto, H.; Prasad, T.; Matsumoto, Y.; Ota, M.; Yasuda, H.; Tsumoto, T.; Aruga, J.; et al. Selective control of inhibitory synapse development by Slitrk3-PTPδ trans-synaptic interaction. Nature Neuroscience 2012, 15, 389-398. [CrossRef]
- Varoqueaux, F.; Jamain, S.; Brose, N. Neuroligin 2 is exclusively localized to inhibitory synapses. European Journal of Cell Biology 2004, 83, 449-456. [CrossRef]
- Dunkley, P.R.; Robinson, P.J. Synaptosome Preparations: Which Procedure Should I Use? In Synaptosomes; Neuromethods; 2018; pp. 27-53.
- Gray, E.G.; Whittaker, V.P. The isolation of nerve endings from brain: an electron-microscopic study of cell fragments derived by homogenization and centrifugation. J Anat 1962, 96, 79-88.
- Dodd, P.R.; Hardy, J.A.; Oakley, A.E.; Edwardson, J.A.; Perry, E.K.; Delaunoy, J.P. A rapid method for preparing synaptosomes: comparison, with alternative procedures. Brain Res 1981, 226, 107-118. [CrossRef]
- Cotman, C.W.; Matthews, D.A. Synaptic plasma membranes from rat brain synaptosomes: isolation and partial characterization. Biochim Biophys Acta 1971, 249, 380-394. [CrossRef]
- Booth, R.F.; Clark, J.B. A rapid method for the preparation of relatively pure metabolically competent synaptosomes from rat brain. Biochem J 1978, 176, 365-370. [CrossRef]
- Dunkley, P.R.; Jarvie, P.E.; Robinson, P.J. A rapid Percoll gradient procedure for preparation of synaptosomes. Nat Protoc 2008, 3, 1718-1728. [CrossRef]
- Wilhelm, B.G.; Mandad, S.; Truckenbrodt, S.; Krohnert, K.; Schafer, C.; Rammner, B.; Koo, S.J.; Classen, G.A.; Krauss, M.; Haucke, V.; et al. Composition of isolated synaptic boutons reveals the amounts of vesicle trafficking proteins. Science 2014, 344, 1023-1028. [CrossRef]
- Ahmed, S.; Holt, M.; Riedel, D.; Jahn, R. Small-scale isolation of synaptic vesicles from mammalian brain. Nat Protoc 2013, 8, 998-1009. [CrossRef]
- Hell, J.W.; Maycox, P.R.; Stadler, H.; Jahn, R. Uptake of GABA by rat brain synaptic vesicles isolated by a new procedure. EMBO J 1988, 7, 3023-3029. [CrossRef]
- Chantranupong, L.; Saulnier, J.L.; Wang, W.; Jones, D.R.; Pacold, M.E.; Sabatini, B.L. Rapid purification and metabolomic profiling of synaptic vesicles from mammalian brain. Elife 2020, 9. [CrossRef]
- Muzumdar, M.D.; Tasic, B.; Miyamichi, K.; Li, L.; Luo, L. A global double-fluorescent Cre reporter mouse. genesis 2007, 45, 593-605. [CrossRef]
- De Gasperi, R.; Rocher, A.B.; Sosa, M.A.G.; Wearne, S.L.; Perez, G.M.; Friedrich Jr, V.L.; Hof, P.R.; Elder, G.A. The IRG mouse: A two-color fluorescent reporter for assessing Cre-mediated recombination and imaging complex cellular relationships in situ. genesis 2008, 46, 308-317. [CrossRef]
- Igarashi, H.; Koizumi, K.; Kaneko, R.; Ikeda, K.; Egawa, R.; Yanagawa, Y.; Muramatsu, S.-i.; Onimaru, H.; Ishizuka, T.; Yawo, H. A Novel Reporter Rat Strain That Conditionally Expresses the Bright Red Fluorescent Protein tdTomato. PLOS ONE 2016, 11, e0155687. [CrossRef]
- Ma, Y.; Yu, L.; Pan, S.; Gao, S.; Chen, W.; Zhang, X.; Dong, W.; Li, J.; Zhou, R.; Huang, L.; et al. CRISPR/Cas9-mediated targeting of the Rosa26 locus produces Cre reporter rat strains for monitoring Cre–loxP-mediated lineage tracing. The FEBS Journal 2017, 284, 3262-3277. [CrossRef]
- Bryda, E.C.; Men, H.; Davis, D.J.; Bock, A.S.; Shaw, M.L.; Chesney, K.L.; Hankins, M.A. A novel conditional ZsGreen-expressing transgenic reporter rat strain for validating Cre recombinase expression. Scientific Reports 2019, 9, 13330. [CrossRef]
- Sato, Y.; Endo, H.; Ajiki, T.; Hakamata, Y.; Okada, T.; Murakami, T.; Kobayashi, E. Establishment of Cre/LoxP recombination system in transgenic rats. Biochemical and Biophysical Research Communications 2004, 319, 1197-1202. [CrossRef]
- Kim, H.; Kim, M.; Im, S.-K.; Fang, S. Mouse Cre-LoxP system: general principles to determine tissue-specific roles of target genes. lar 2018, 34, 147-159. [CrossRef]
- Harris, J.A.; Hirokawa, K.E.; Sorensen, S.A.; Gu, H.; Mills, M.; Ng, L.L.; Bohn, P.; Mortrud, M.; Ouellette, B.; Kidney, J.; et al. Anatomical characterization of Cre driver mice for neural circuit mapping and manipulation. Frontiers in Neural Circuits 2014, 8. [CrossRef]
- Shcholok, T.; Eftekharpour, E. Cre-recombinase systems for induction of neuron-specific knockout models: a guide for biomedical researchers. Neural Regen Res 2023, 18, 273-279. [CrossRef]
- Zhang, H.; Zheng, Q.; Chen-Tsai, R.Y. Establishment of a Cre-rat resource for creating conditional and physiological relevant models of human diseases. Transgenic Research 2021, 30, 91-104. [CrossRef]
- Witten, Ilana B.; Steinberg, Elizabeth E.; Lee, Soo Y.; Davidson, Thomas J.; Zalocusky, Kelly A.; Brodsky, M.; Yizhar, O.; Cho, Saemi L.; Gong, S.; Ramakrishnan, C.; et al. Recombinase-Driver Rat Lines: Tools, Techniques, and Optogenetic Application to Dopamine-Mediated Reinforcement. Neuron 2011, 72, 721-733. [CrossRef]
- Liu, Z.; Brown, A.; Fisher, D.; Wu, Y.; Warren, J.; Cui, X. Tissue Specific Expression of Cre in Rat Tyrosine Hydroxylase and Dopamine Active Transporter-Positive Neurons. PLOS ONE 2016, 11, e0149379. [CrossRef]
- Espina, V.; Wulfkuhle, J.D.; Calvert, V.S.; VanMeter, A.; Zhou, W.; Coukos, G.; Geho, D.H.; Petricoin, E.F.; Liotta, L.A. Laser-capture microdissection. Nature Protocols 2006, 1, 586-603. [CrossRef]
- Zhu, Y.; Piehowski, P.D.; Zhao, R.; Chen, J.; Shen, Y.; Moore, R.J.; Shukla, A.K.; Petyuk, V.A.; Campbell-Thompson, M.; Mathews, C.E.; et al. Nanodroplet processing platform for deep and quantitative proteome profiling of 10–100 mammalian cells. Nature Communications 2018, 9, 882. [CrossRef]
- Plum, S.; Steinbach, S.; Attems, J.; Keers, S.; Riederer, P.; Gerlach, M.; May, C.; Marcus, K. Proteomic characterization of neuromelanin granules isolated from human substantia nigra by laser-microdissection. Scientific Reports 2016, 6, 37139. [CrossRef]
- Drummond, E.; Wisniewski, T. The use of localized proteomics to identify the drivers of Alzheimer’s disease pathogenesis. Neural Regeneration Research 2017, 12.
- Nijholt, D.A.T.; Stingl, C.; Luider, T.M. Laser Capture Microdissection of Fluorescently Labeled Amyloid Plaques from Alzheimer’s Disease Brain Tissue for Mass Spectrometric Analysis. In Clinical Proteomics: Methods and Protocols, Vlahou, A., Makridakis, M., Eds.; Springer New York: New York, NY, 2015; pp. 165-173.
- Garcia-Berrocoso, T.; Llombart, V.; Colas-Campas, L.; Hainard, A.; Licker, V.; Penalba, A.; Ramiro, L.; Simats, A.; Bustamante, A.; Martinez-Saez, E.; et al. Single Cell Immuno-Laser Microdissection Coupled to Label-Free Proteomics to Reveal the Proteotypes of Human Brain Cells After Ischemia. Mol Cell Proteomics 2018, 17, 175-189. [CrossRef]
- Hashimoto, M.; Bogdanovic, N.; Nakagawa, H.; Volkmann, I.; Aoki, M.; Winblad, B.; Sakai, J.; Tjernberg, L.O. Analysis of microdissected neurons by 18O mass spectrometry reveals altered protein expression in Alzheimer’s disease. Journal of Cellular and Molecular Medicine 2012, 16, 1686-1700. [CrossRef]
- MacDonald, M.L.; Favo, D.; Garver, M.; Sun, Z.; Arion, D.; Ding, Y.; Yates, N.; Sweet, R.A.; Lewis, D.A. Laser capture microdissection–targeted mass spectrometry: a method for multiplexed protein quantification within individual layers of the cerebral cortex. Neuropsychopharmacology 2019, 44, 743-748. [CrossRef]
- Griesser, E.; Wyatt, H.; Ten Have, S.; Stierstorfer, B.; Lenter, M.; Lamond, A.I. Quantitative Profiling of the Human Substantia Nigra Proteome from Laser-capture Microdissected FFPE Tissue*. Molecular & Cellular Proteomics 2020, 19, 839-851. [CrossRef]
- do Canto, A.M.; Vieira, A.S.; A, H.B.M.; Carvalho, B.S.; Henning, B.; Norwood, B.A.; Bauer, S.; Rosenow, F.; Gilioli, R.; Cendes, F.; et al. Laser microdissection-based microproteomics of the hippocampus of a rat epilepsy model reveals regional differences in protein abundances. Sci Rep 2020, 10, 4412. [CrossRef]
- Bensaddek, D.; Narayan, V.; Nicolas, A.; Brenes Murillo, A.; Gartner, A.; Kenyon, C.J.; Lamond, A.I. Micro-proteomics with iterative data analysis: Proteome analysis in C. elegans at the single worm level. PROTEOMICS 2016, 16, 381-392. [CrossRef]
- Kaur, R.P.; Ludhiadch, A.; Munshi, A. Chapter 9 - Single-Cell Genomics: Technology and Applications. In Single-Cell Omics, Barh, D., Azevedo, V., Eds.; Academic Press: 2019; pp. 179-197.
- Holt, L.M.; Olsen, M.L. Novel Applications of Magnetic Cell Sorting to Analyze Cell-Type Specific Gene and Protein Expression in the Central Nervous System. PLoS One 2016, 11, e0150290. [CrossRef]
- Rayaprolu, S.; Gao, T.; Xiao, H.; Ramesha, S.; Weinstock, L.D.; Shah, J.; Duong, D.M.; Dammer, E.B.; Webster, J.A., Jr.; Lah, J.J.; et al. Flow-cytometric microglial sorting coupled with quantitative proteomics identifies moesin as a highly-abundant microglial protein with relevance to Alzheimer’s disease. Mol Neurodegener 2020, 15, 28. [CrossRef]
- Jungblut, M.; Tiveron, M.C.; Barral, S.; Abrahamsen, B.; Knöbel, S.; Pennartz, S.; Schmitz, J.; Perraut, M.; Pfrieger, F.W.; Stoffel, W.; et al. Isolation and characterization of living primary astroglial cells using the new GLAST-specific monoclonal antibody ACSA-1. Glia 2012, 60, 894-907. [CrossRef]
- Stokum, J.A.; Shim, B.; Huang, W.; Kane, M.; Smith, J.A.; Gerzanich, V.; Simard, J.M. A large portion of the astrocyte proteome is dedicated to perivascular endfeet, including critical components of the electron transport chain. Journal of Cerebral Blood Flow & Metabolism 2021, 41, 2546-2560. [CrossRef]
- Rangaraju, S.; Dammer, E.B.; Raza, S.A.; Gao, T.; Xiao, H.; Betarbet, R.; Duong, D.M.; Webster, J.A.; Hales, C.M.; Lah, J.J.; et al. Quantitative proteomics of acutely-isolated mouse microglia identifies novel immune Alzheimer’s disease-related proteins. Molecular Neurodegeneration 2018, 13, 34. [CrossRef]
- Maes, E.; Cools, N.; Willems, H.; Baggerman, G. FACS-Based Proteomics Enables Profiling of Proteins in Rare Cell Populations. Int J Mol Sci 2020, 21. [CrossRef]
- Gross, A.; Schoendube, J.; Zimmermann, S.; Steeb, M.; Zengerle, R.; Koltay, P. Technologies for Single-Cell Isolation. Int J Mol Sci 2015, 16, 16897-16919. [CrossRef]
- Postupna, N.O.; Latimer, C.S.; Keene, C.D.; Montine, K.S.; Montine, T.J.; Darvas, M. Flow cytometric evaluation of crude synaptosome preparation as a way to study synaptic alteration in neurodegenerative diseases. Neuromethods 2018, 141, 297-310. [CrossRef]
- Biesemann, C.; Gronborg, M.; Luquet, E.; Wichert, S.P.; Bernard, V.; Bungers, S.R.; Cooper, B.; Varoqueaux, F.; Li, L.; Byrne, J.A.; et al. Proteomic screening of glutamatergic mouse brain synaptosomes isolated by fluorescence activated sorting. EMBO J 2014, 33, 157-170. [CrossRef]
- Husi, H.; Ward, M.A.; Choudhary, J.S.; Blackstock, W.P.; Grant, S.G.N. Proteomic analysis of NMDA receptor–adhesion protein signaling complexes. Nature Neuroscience 2000, 3, 661-669. [CrossRef]
- Dosemeci, A.; Makusky, A.J.; Jankowska-Stephens, E.; Yang, X.; Slotta, D.J.; Markey, S.P. Composition of the synaptic PSD-95 complex. Mol Cell Proteomics 2007, 6, 1749-1760. [CrossRef]
- Klemmer, P.; Smit, A.B.; Li, K.W. Proteomics analysis of immuno-precipitated synaptic protein complexes. Journal of Proteomics 2009, 72, 82-90. [CrossRef]
- Paulo, J.A.; Brucker, W.J.; Hawrot, E. Proteomic Analysis of an α7 Nicotinic Acetylcholine Receptor Interactome. Journal of Proteome Research 2009, 8, 1849-1858. [CrossRef]
- Farr, C.D.; Gafken, P.R.; Norbeck, A.D.; Doneanu, C.E.; Stapels, M.D.; Barofsky, D.F.; Minami, M.; Saugstad, J.A. Proteomic analysis of native metabotropic glutamate receptor 5 protein complexes reveals novel molecular constituents. Journal of Neurochemistry 2004, 91, 438-450. [CrossRef]
- Collins, M.O.; Husi, H.; Yu, L.; Brandon, J.M.; Anderson, C.N.G.; Blackstock, W.P.; Choudhary, J.S.; Grant, S.G.N. Molecular characterization and comparison of the components and multiprotein complexes in the postsynaptic proteome. Journal of Neurochemistry 2006, 97, 16-23. [CrossRef]
- Rigaut, G.; Shevchenko, A.; Rutz, B.; Wilm, M.; Mann, M.; Séraphin, B. A generic protein purification method for protein complex characterization and proteome exploration. Nature Biotechnology 1999, 17, 1030-1032. [CrossRef]
- Li, Y. The tandem affinity purification technology: an overview. Biotechnol Lett 2011, 33, 1487-1499. [CrossRef]
- Fernandez, E.; Collins, M.O.; Uren, R.T.; Kopanitsa, M.V.; Komiyama, N.H.; Croning, M.D.; Zografos, L.; Armstrong, J.D.; Choudhary, J.S.; Grant, S.G. Targeted tandem affinity purification of PSD-95 recovers core postsynaptic complexes and schizophrenia susceptibility proteins. Mol Syst Biol 2009, 5, 269. [CrossRef]
- Zhu, F.; Collins, M.O.; Harmse, J.; Choudhary, J.S.; Grant, S.G.N.; Komiyama, N.H. Cell-type-specific visualisation and biochemical isolation of endogenous synaptic proteins in mice. Eur J Neurosci 2020, 51, 793-805. [CrossRef]
- Stone, S.E.; Glenn, W.S.; Hamblin, G.D.; Tirrell, D.A. Cell-selective proteomics for biological discovery. Curr Opin Chem Biol 2017, 36, 50-57. [CrossRef]
- Fingleton, E.; Li, Y.; Roche, K.W. Advances in Proteomics Allow Insights Into Neuronal Proteomes. Front Mol Neurosci 2021, 14, 647451. [CrossRef]
- Alvarez-Castelao, B.; Schanzenbacher, C.T.; Hanus, C.; Glock, C.; Tom Dieck, S.; Dorrbaum, A.R.; Bartnik, I.; Nassim-Assir, B.; Ciirdaeva, E.; Mueller, A.; et al. Cell-type-specific metabolic labeling of nascent proteomes in vivo. Nat Biotechnol 2017, 35, 1196-1201. [CrossRef]
- Alvarez-Castelao, B.; Schanzenbacher, C.T.; Langer, J.D.; Schuman, E.M. Cell-type-specific metabolic labeling, detection and identification of nascent proteomes in vivo. Nat Protoc 2019, 14, 556-575. [CrossRef]
- Mathew, B.; Bathla, S.; Williams, K.R.; Nairn, A.C. Deciphering Spatial Protein-Protein Interactions in Brain Using Proximity Labeling. Mol Cell Proteomics 2022, 21, 100422. [CrossRef]
- Kim, D.I.; Jensen, S.C.; Noble, K.A.; Kc, B.; Roux, K.H.; Motamedchaboki, K.; Roux, K.J. An improved smaller biotin ligase for BioID proximity labeling. Molecular Biology of the Cell 2016, 27, 1188-1196. [CrossRef]
- Branon, T.C.; Bosch, J.A.; Sanchez, A.D.; Udeshi, N.D.; Svinkina, T.; Carr, S.A.; Feldman, J.L.; Perrimon, N.; Ting, A.Y. Efficient proximity labeling in living cells and organisms with TurboID. Nature Biotechnology 2018, 36, 880-887. [CrossRef]
- Lam, S.S.; Martell, J.D.; Kamer, K.J.; Deerinck, T.J.; Ellisman, M.H.; Mootha, V.K.; Ting, A.Y. Directed evolution of APEX2 for electron microscopy and proximity labeling. Nature Methods 2015, 12, 51-54. [CrossRef]
- Cijsouw, T.; Ramsey, A.M.; Lam, T.T.; Carbone, B.E.; Blanpied, T.A.; Biederer, T. Mapping the Proteome of the Synaptic Cleft through Proximity Labeling Reveals New Cleft Proteins. Proteomes 2018, 6. [CrossRef]
- Shuster, S.A.; Li, J.; Chon, U.; Sinantha-Hu, M.C.; Luginbuhl, D.J.; Udeshi, N.D.; Carey, D.K.; Takeo, Y.H.; Xie, Q.; Xu, C.; et al. In situ cell-type-specific cell-surface proteomic profiling in mice. Neuron 2022, 110, 3882-3896 e3889. [CrossRef]
- Dumrongprechachan, V.; Salisbury, R.B.; Soto, G.; Kumar, M.; MacDonald, M.L.; Kozorovitskiy, Y. Cell-type and subcellular compartment-specific APEX2 proximity labeling reveals activity-dependent nuclear proteome dynamics in the striatum. Nat Commun 2021, 12, 4855. [CrossRef]
- Brewer, K.D.; Shi, S.M.; Wyss-Coray, T. Unraveling protein dynamics to understand the brain - the next molecular frontier. Mol Neurodegener 2022, 17, 45. [CrossRef]
- Uezu, A.; Kanak, D.J.; Bradshaw, T.W.A.; Soderblom, E.J.; Catavero, C.M.; Burette, A.C.; Weinberg, R.J.; Soderling, S.H. Identification of an elaborate complex mediating postsynaptic inhibition. Science 2016, 353, 1123-1129. [CrossRef]
- Spence, E.F.; Dube, S.; Uezu, A.; Locke, M.; Soderblom, E.J.; Soderling, S.H. In vivo proximity proteomics of nascent synapses reveals a novel regulator of cytoskeleton-mediated synaptic maturation. Nature Communications 2019, 10, 386. [CrossRef]
- Rayaprolu, S.; Bitarafan, S.; Santiago, J.V.; Betarbet, R.; Sunna, S.; Cheng, L.; Xiao, H.; Nelson, R.S.; Kumar, P.; Bagchi, P.; et al. Cell type-specific biotin labeling in vivo resolves regional neuronal and astrocyte proteomic differences in mouse brain. Nat Commun 2022, 13, 2927. [CrossRef]
- Takano, T.; Wallace, J.T.; Baldwin, K.T.; Purkey, A.M.; Uezu, A.; Courtland, J.L.; Soderblom, E.J.; Shimogori, T.; Maness, P.F.; Eroglu, C.; et al. Chemico-genetic discovery of astrocytic control of inhibition in vivo. Nature 2020, 588, 296-302. [CrossRef]
- Hobson, B.D.; Choi, S.J.; Mosharov, E.V.; Soni, R.K.; Sulzer, D.; Sims, P.A. Subcellular proteomics of dopamine neurons in the mouse brain. Elife 2022, 11. [CrossRef]
- Nguyen, T.M.T.; Kim, J.; Doan, T.T.; Lee, M.-W.; Lee, M. APEX Proximity Labeling as a Versatile Tool for Biological Research. Biochemistry 2020, 59, 260-269. [CrossRef]
- Dupree, E.J.; Jayathirtha, M.; Yorkey, H.; Mihasan, M.; Petre, B.A.; Darie, C.C. A Critical Review of Bottom-Up Proteomics: The Good, the Bad, and the Future of this Field. Proteomes 2020, 8. [CrossRef]
- Zhang, Y.; Fonslow, B.R.; Shan, B.; Baek, M.C.; Yates, J.R., 3rd. Protein analysis by shotgun/bottom-up proteomics. Chem Rev 2013, 113, 2343-2394. [CrossRef]
- Smith, L.M.; Kelleher, N.L.; Linial, M.; Goodlett, D.; Langridge-Smith, P.; Ah Goo, Y.; Safford, G.; Bonilla*, L.; Kruppa, G.; Zubarev, R.; et al. Proteoform: a single term describing protein complexity. Nature Methods 2013, 10, 186-187. [CrossRef]
- Catherman, A.D.; Skinner, O.S.; Kelleher, N.L. Top Down proteomics: facts and perspectives. Biochem Biophys Res Commun 2014, 445, 683-693. [CrossRef]
- Melby, J.A.; Roberts, D.S.; Larson, E.J.; Brown, K.A.; Bayne, E.F.; Jin, S.; Ge, Y. Novel Strategies to Address the Challenges in Top-Down Proteomics. J Am Soc Mass Spectrom 2021, 32, 1278-1294. [CrossRef]
- Wilson, R.S.; Nairn, A.C. Cell-Type-Specific Proteomics: A Neuroscience Perspective. Proteomes 2018, 6. [CrossRef]
- Giesen, C.; Wang, H.A.O.; Schapiro, D.; Zivanovic, N.; Jacobs, A.; Hattendorf, B.; Schüffler, P.J.; Grolimund, D.; Buhmann, J.M.; Brandt, S.; et al. Highly multiplexed imaging of tumor tissues with subcellular resolution by mass cytometry. Nature Methods 2014, 11, 417-422. [CrossRef]
- Amy, L.V.D.; Sarah, M.G.; Corey, M.W.; Austin, B.K.; Kristen, I.F.; Irene, C.; Christopher, D.D.; Eli, R.Z. A developmental atlas of the mouse brain by single-cell mass cytometry. bioRxiv 2022, 2022.2007.2027.501794. [CrossRef]
- Zhang, B.; Gaiteri, C.; Bodea, L.G.; Wang, Z.; McElwee, J.; Podtelezhnikov, A.A.; Zhang, C.; Xie, T.; Tran, L.; Dobrin, R.; et al. Integrated systems approach identifies genetic nodes and networks in late-onset Alzheimer’s disease. Cell 2013, 153, 707-720. [CrossRef]
- Vogel, C.; Marcotte, E.M. Insights into the regulation of protein abundance from proteomic and transcriptomic analyses. Nature Reviews Genetics 2012, 13, 227-232. [CrossRef]
- de Sousa Abreu, R.; Penalva, L.O.; Marcotte, E.M.; Vogel, C. Global signatures of protein and mRNA expression levels. Molecular BioSystems 2009, 5, 1512-1526. [CrossRef]
- Mansuri, M.S.; Williams, K.; Nairn, A.C. Uncovering biology by single-cell proteomics. Commun Biol 2023, 6, 381. [CrossRef]
- Budnik, B.; Levy, E.; Harmange, G.; Slavov, N. SCoPE-MS: mass spectrometry of single mammalian cells quantifies proteome heterogeneity during cell differentiation. Genome Biol 2018, 19, 161. [CrossRef]
- Tsai, C.F.; Zhao, R.; Williams, S.M.; Moore, R.J.; Schultz, K.; Chrisler, W.B.; Pasa-Tolic, L.; Rodland, K.D.; Smith, R.D.; Shi, T.; et al. An Improved Boosting to Amplify Signal with Isobaric Labeling (iBASIL) Strategy for Precise Quantitative Single-cell Proteomics. Mol Cell Proteomics 2020, 19, 828-838. [CrossRef]
- Goto-Silva, L.; Junqueira, M. Single-cell proteomics: A treasure trove in neurobiology. Biochim Biophys Acta Proteins Proteom 2021, 1869, 140658. [CrossRef]
- Han, G.; Sun, J.; Wang, J.; Bai, Z.; Song, F.; Lei, H. Genomics in neurological disorders. Genomics Proteomics Bioinformatics 2014, 12, 156-163. [CrossRef]
- Reim, D.; Distler, U.; Halbedl, S.; Verpelli, C.; Sala, C.; Bockmann, J.; Tenzer, S.; Boeckers, T.M.; Schmeisser, M.J. Proteomic Analysis of Post-synaptic Density Fractions from Shank3 Mutant Mice Reveals Brain Region Specific Changes Relevant to Autism Spectrum Disorder. Front Mol Neurosci 2017, 10, 26. [CrossRef]
- Al Shweiki, M.R.; Oeckl, P.; Steinacker, P.; Barschke, P.; Dorner-Ciossek, C.; Hengerer, B.; Schonfeldt-Lecuona, C.; Otto, M. Proteomic analysis reveals a biosignature of decreased synaptic protein in cerebrospinal fluid of major depressive disorder. Transl Psychiatry 2020, 10, 144. [CrossRef]
- Pennington, K.; Beasley, C.L.; Dicker, P.; Fagan, A.; English, J.; Pariante, C.M.; Wait, R.; Dunn, M.J.; Cotter, D.R. Prominent synaptic and metabolic abnormalities revealed by proteomic analysis of the dorsolateral prefrontal cortex in schizophrenia and bipolar disorder. Mol Psychiatry 2008, 13, 1102-1117. [CrossRef]
- Mullin, A.P.; Gokhale, A.; Moreno-De-Luca, A.; Sanyal, S.; Waddington, J.L.; Faundez, V. Neurodevelopmental disorders: mechanisms and boundary definitions from genomes, interactomes and proteomes. Transl Psychiatry 2013, 3, e329. [CrossRef]
- Lord, C.; Elsabbagh, M.; Baird, G.; Veenstra-Vanderweele, J. Autism spectrum disorder. Lancet 2018, 392, 508-520. [CrossRef]
- Tang, B.; Wang, T.; Wan, H.; Han, L.; Qin, X.; Zhang, Y.; Wang, J.; Yu, C.; Berton, F.; Francesconi, W.; et al. Fmr1 deficiency promotes age-dependent alterations in the cortical synaptic proteome. Proc Natl Acad Sci U S A 2015, 112, E4697-4706. [CrossRef]
- Yi, J.J.; Paranjape, S.R.; Walker, M.P.; Choudhury, R.; Wolter, J.M.; Fragola, G.; Emanuele, M.J.; Major, M.B.; Zylka, M.J. The autism-linked UBE3A T485A mutant E3 ubiquitin ligase activates the Wnt/beta-catenin pathway by inhibiting the proteasome. J Biol Chem 2017, 292, 12503-12515. [CrossRef]
- Matic, K.; Eninger, T.; Bardoni, B.; Davidovic, L.; Macek, B. Quantitative phosphoproteomics of murine Fmr1-KO cell lines provides new insights into FMRP-dependent signal transduction mechanisms. J Proteome Res 2014, 13, 4388-4397. [CrossRef]
- Collins, M.O.; Yu, L.; Coba, M.P.; Husi, H.; Campuzano, I.; Blackstock, W.P.; Choudhary, J.S.; Grant, S.G. Proteomic analysis of in vivo phosphorylated synaptic proteins. J Biol Chem 2005, 280, 5972-5982. [CrossRef]
- Li, J.; Wilkinson, B.; Clementel, V.A.; Hou, J.; O’Dell, T.J.; Coba, M.P. Long-term potentiation modulates synaptic phosphorylation networks and reshapes the structure of the postsynaptic interactome. Sci Signal 2016, 9, rs8. [CrossRef]
- Amal, H.; Barak, B.; Bhat, V.; Gong, G.; Joughin, B.A.; Wang, X.; Wishnok, J.S.; Feng, G.; Tannenbaum, S.R. Shank3 mutation in a mouse model of autism leads to changes in the S-nitroso-proteome and affects key proteins involved in vesicle release and synaptic function. Mol Psychiatry 2020, 25, 1835-1848. [CrossRef]
- Murtaza, N.; Cheng, A.A.; Brown, C.O.; Meka, D.P.; Hong, S.; Uy, J.A.; El-Hajjar, J.; Pipko, N.; Unda, B.K.; Schwanke, B.; et al. Neuron-specific protein network mapping of autism risk genes identifies shared biological mechanisms and disease-relevant pathologies. Cell Rep 2022, 41, 111678. [CrossRef]
- Tilot, A.K.; Bebek, G.; Niazi, F.; Altemus, J.B.; Romigh, T.; Frazier, T.W.; Eng, C. Neural transcriptome of constitutional Pten dysfunction in mice and its relevance to human idiopathic autism spectrum disorder. Mol Psychiatry 2016, 21, 118-125. [CrossRef]
- Zhang, H.; Ma, Q.; Zhang, Y.W.; Xu, H. Proteolytic processing of Alzheimer’s beta-amyloid precursor protein. J Neurochem 2012, 120 Suppl 1, 9-21. [CrossRef]
- Lee, H.; Kim, K.; Lee, Y.C.; Kim, S.; Won, H.H.; Yu, T.Y.; Lee, E.M.; Kang, J.M.; Lewis, M.; Kim, D.K.; et al. Associations between vascular risk factors and subsequent Alzheimer’s disease in older adults. Alzheimers Res Ther 2020, 12, 117. [CrossRef]
- Shankar, G.M.; Li, S.; Mehta, T.H.; Garcia-Munoz, A.; Shepardson, N.E.; Smith, I.; Brett, F.M.; Farrell, M.A.; Rowan, M.J.; Lemere, C.A.; et al. Amyloid-beta protein dimers isolated directly from Alzheimer’s brains impair synaptic plasticity and memory. Nat Med 2008, 14, 837-842. [CrossRef]
- Lambert, M.P.; Barlow, A.K.; Chromy, B.A.; Edwards, C.; Freed, R.; Liosatos, M.; Morgan, T.E.; Rozovsky, I.; Trommer, B.; Viola, K.L.; et al. Diffusible, nonfibrillar ligands derived from Abeta1-42 are potent central nervous system neurotoxins. Proc Natl Acad Sci U S A 1998, 95, 6448-6453. [CrossRef]
- Chang, R.Y.; Nouwens, A.S.; Dodd, P.R.; Etheridge, N. The synaptic proteome in Alzheimer’s disease. Alzheimers Dement 2013, 9, 499-511. [CrossRef]
- Hesse, R.; Hurtado, M.L.; Jackson, R.J.; Eaton, S.L.; Herrmann, A.G.; Colom-Cadena, M.; Tzioras, M.; King, D.; Rose, J.; Tulloch, J.; et al. Comparative profiling of the synaptic proteome from Alzheimer’s disease patients with focus on the APOE genotype. Acta Neuropathol Commun 2019, 7, 214. [CrossRef]
- Kadoyama, K.; Matsuura, K.; Takano, M.; Otani, M.; Tomiyama, T.; Mori, H.; Matsuyama, S. Proteomic analysis involved with synaptic plasticity improvement by GABA(A) receptor blockade in hippocampus of a mouse model of Alzheimer’s disease. Neurosci Res 2021, 165, 61-68. [CrossRef]
- Patel, K.R.; Cherian, J.; Gohil, K.; Atkinson, D. Schizophrenia: overview and treatment options. P T 2014, 39, 638-645.
- Luvsannyam, E.; Jain, M.S.; Pormento, M.K.L.; Siddiqui, H.; Balagtas, A.R.A.; Emuze, B.O.; Poprawski, T. Neurobiology of Schizophrenia: A Comprehensive Review. Cureus 2022, 14, e23959. [CrossRef]
- Owen, M.J.; Sawa, A.; Mortensen, P.B. Schizophrenia. Lancet 2016, 388, 86-97. [CrossRef]
- Brisch, R.; Saniotis, A.; Wolf, R.; Bielau, H.; Bernstein, H.G.; Steiner, J.; Bogerts, B.; Braun, K.; Jankowski, Z.; Kumaratilake, J.; et al. The role of dopamine in schizophrenia from a neurobiological and evolutionary perspective: old fashioned, but still in vogue. Front Psychiatry 2014, 5, 47. [CrossRef]
- Harrison, P.J.; Weinberger, D.R. Schizophrenia genes, gene expression, and neuropathology: on the matter of their convergence. Mol Psychiatry 2005, 10, 40-68; image 45. [CrossRef]
- Osimo, E.F.; Beck, K.; Reis Marques, T.; Howes, O.D. Synaptic loss in schizophrenia: a meta-analysis and systematic review of synaptic protein and mRNA measures. Mol Psychiatry 2019, 24, 549-561. [CrossRef]
- Birnbaum, R.; Weinberger, D.R. Genetic insights into the neurodevelopmental origins of schizophrenia. Nat Rev Neurosci 2017, 18, 727-740. [CrossRef]
- Rosato, M.; Stringer, S.; Gebuis, T.; Paliukhovich, I.; Li, K.W.; Posthuma, D.; Sullivan, P.F.; Smit, A.B.; van Kesteren, R.E. Combined cellomics and proteomics analysis reveals shared neuronal morphology and molecular pathway phenotypes for multiple schizophrenia risk genes. Mol Psychiatry 2021, 26, 784-799. [CrossRef]
- Focking, M.; Lopez, L.M.; English, J.A.; Dicker, P.; Wolff, A.; Brindley, E.; Wynne, K.; Cagney, G.; Cotter, D.R. Proteomic and genomic evidence implicates the postsynaptic density in schizophrenia. Mol Psychiatry 2015, 20, 424-432. [CrossRef]
- Li, J.; Zhang, W.; Yang, H.; Howrigan, D.P.; Wilkinson, B.; Souaiaia, T.; Evgrafov, O.V.; Genovese, G.; Clementel, V.A.; Tudor, J.C.; et al. Spatiotemporal profile of postsynaptic interactomes integrates components of complex brain disorders. Nat Neurosci 2017, 20, 1150-1161. [CrossRef]
- Administration., S.A.a.M.H.S. Key substance use and mental health indicators in the United States: Results from the 2020 National Survey on Drug Use and Health (HHS Publication No. PEP21-07-01-003, NSDUH Series H-56). 2021.
- Martins-de-Souza, D. Comprehending depression through proteomics. Int J Neuropsychopharmacol 2012, 15, 1373-1374. [CrossRef]
- Beasley, C.L.; Pennington, K.; Behan, A.; Wait, R.; Dunn, M.J.; Cotter, D. Proteomic analysis of the anterior cingulate cortex in the major psychiatric disorders: Evidence for disease-associated changes. Proteomics 2006, 6, 3414-3425. [CrossRef]
- Johnston-Wilson, N.L.; Sims, C.D.; Hofmann, J.P.; Anderson, L.; Shore, A.D.; Torrey, E.F.; Yolken, R.H. Disease-specific alterations in frontal cortex brain proteins in schizophrenia, bipolar disorder, and major depressive disorder. The Stanley Neuropathology Consortium. Mol Psychiatry 2000, 5, 142-149. [CrossRef]
- Martins-de-Souza, D.; Guest, P.C.; Harris, L.W.; Vanattou-Saifoudine, N.; Webster, M.J.; Rahmoune, H.; Bahn, S. Identification of proteomic signatures associated with depression and psychotic depression in post-mortem brains from major depression patients. Transl Psychiatry 2012, 2, e87. [CrossRef]
- Martins-de-Souza, D.; Guest, P.C.; Vanattou-Saifoudine, N.; Rahmoune, H.; Bahn, S. Phosphoproteomic differences in major depressive disorder postmortem brains indicate effects on synaptic function. Eur Arch Psychiatry Clin Neurosci 2012, 262, 657-666. [CrossRef]
- Ditzen, C.; Tang, N.; Jastorff, A.M.; Teplytska, L.; Yassouridis, A.; Maccarrone, G.; Uhr, M.; Bronisch, T.; Miller, C.A.; Holsboer, F.; et al. Cerebrospinal fluid biomarkers for major depression confirm relevance of associated pathophysiology. Neuropsychopharmacology 2012, 37, 1013-1025. [CrossRef]
- Xu, H.B.; Zhang, R.F.; Luo, D.; Zhou, Y.; Wang, Y.; Fang, L.; Li, W.J.; Mu, J.; Zhang, L.; Zhang, Y.; et al. Comparative proteomic analysis of plasma from major depressive patients: identification of proteins associated with lipid metabolism and immunoregulation. Int J Neuropsychopharmacol 2012, 15, 1413-1425. [CrossRef]
- See, R.E. Neural substrates of conditioned-cued relapse to drug-seeking behavior. Pharmacol Biochem Behav 2002, 71, 517-529. [CrossRef]
- Everitt, B.J.; Wolf, M.E. Psychomotor stimulant addiction: a neural systems perspective. J Neurosci 2002, 22, 3312-3320, doi:20026356.
- Jasinska, A.J.; Chen, B.T.; Bonci, A.; Stein, E.A. Dorsal medial prefrontal cortex (MPFC) circuitry in rodent models of cocaine use: implications for drug addiction therapies. Addict Biol 2015, 20, 215-226. [CrossRef]
- Van den Oever, M.C.; Spijker, S.; Smit, A.B.; De Vries, T.J. Prefrontal cortex plasticity mechanisms in drug seeking and relapse. Neurosci Biobehav Rev 2010, 35, 276-284. [CrossRef]
- Bosch, P.J.; Peng, L.; Kivell, B.M. Proteomics Analysis of Dorsal Striatum Reveals Changes in Synaptosomal Proteins following Methamphetamine Self-Administration in Rats. PLoS One 2015, 10, e0139829. [CrossRef]
- Lull, M.E.; Erwin, M.S.; Morgan, D.; Roberts, D.C.; Vrana, K.E.; Freeman, W.M. Persistent proteomic alterations in the medial prefrontal cortex with abstinence from cocaine self-administration. Proteomics Clin Appl 2009, 3, 462-472. [CrossRef]
- Puig, S.; Xue, X.; Salisbury, R.; Shelton, M.A.; Kim, S.M.; Hildebrand, M.A.; Glausier, J.R.; Freyberg, Z.; Tseng, G.C.; Yocum, A.K.; et al. Uncovering circadian rhythm disruptions of synaptic proteome signaling in prefrontal cortex and nucleus accumbens associated with opioid use disorder. bioRxiv 2023. [CrossRef]
- Scofield, M.D.; Heinsbroek, J.A.; Gipson, C.D.; Kupchik, Y.M.; Spencer, S.; Smith, A.C.; Roberts-Wolfe, D.; Kalivas, P.W. The Nucleus Accumbens: Mechanisms of Addiction across Drug Classes Reflect the Importance of Glutamate Homeostasis. Pharmacol Rev 2016, 68, 816-871. [CrossRef]
- Koob, G.F.; Volkow, N.D. Neurobiology of addiction: a neurocircuitry analysis. Lancet Psychiatry 2016, 3, 760-773. [CrossRef]
- Lobo, M.K.; Covington, H.E., 3rd; Chaudhury, D.; Friedman, A.K.; Sun, H.; Damez-Werno, D.; Dietz, D.M.; Zaman, S.; Koo, J.W.; Kennedy, P.J.; et al. Cell type-specific loss of BDNF signaling mimics optogenetic control of cocaine reward. Science 2010, 330, 385-390. [CrossRef]
- Kravitz, A.V.; Tye, L.D.; Kreitzer, A.C. Distinct roles for direct and indirect pathway striatal neurons in reinforcement. Nat Neurosci 2012, 15, 816-818. [CrossRef]
- Calipari, E.S.; Bagot, R.C.; Purushothaman, I.; Davidson, T.J.; Yorgason, J.T.; Pena, C.J.; Walker, D.M.; Pirpinias, S.T.; Guise, K.G.; Ramakrishnan, C.; et al. In vivo imaging identifies temporal signature of D1 and D2 medium spiny neurons in cocaine reward. Proc Natl Acad Sci U S A 2016, 113, 2726-2731. [CrossRef]
- Lutz, P.E.; Kieffer, B.L. The multiple facets of opioid receptor function: implications for addiction. Curr Opin Neurobiol 2013, 23, 473-479. [CrossRef]
- Turner, B.D.; Kashima, D.T.; Manz, K.M.; Grueter, C.A.; Grueter, B.A. Synaptic Plasticity in the Nucleus Accumbens: Lessons Learned from Experience. ACS Chem Neurosci 2018, 9, 2114-2126. [CrossRef]
- Chartoff, E.H.; Connery, H.S. It’s MORe exciting than mu: crosstalk between mu opioid receptors and glutamatergic transmission in the mesolimbic dopamine system. Front Pharmacol 2014, 5, 116. [CrossRef]
- Zhu, F.; Cizeron, M.; Qiu, Z.; Benavides-Piccione, R.; Kopanitsa, M.V.; Skene, N.G.; Koniaris, B.; DeFelipe, J.; Fransen, E.; Komiyama, N.H.; et al. Architecture of the Mouse Brain Synaptome. Neuron 2018, 99, 781-799 e710. [CrossRef]
- Curran, O.E.; Qiu, Z.; Smith, C.; Grant, S.G.N. A single-synapse resolution survey of PSD95-positive synapses in twenty human brain regions. Eur J Neurosci 2021, 54, 6864-6881. [CrossRef]
- Cizeron, M.; Qiu, Z.; Koniaris, B.; Gokhale, R.; Komiyama, N.H.; Fransen, E.; Grant, S.G.N. A brainwide atlas of synapses across the mouse life span. Science 2020, 369, 270-275. [CrossRef]
- Minehart, J.A.; Speer, C.M. A Picture Worth a Thousand Molecules-Integrative Technologies for Mapping Subcellular Molecular Organization and Plasticity in Developing Circuits. Front Synaptic Neurosci 2020, 12, 615059. [CrossRef]
Figure 1.
Architecture of synapses. (A). At chemical synapses, depolarizing electrical signals are rapidly converted into chemical signals by neurotransmitters, which are released through exocytosis from the presynaptic terminal. Once released they activate receptors and channels on the postsynaptic membrane to initiate excitatory or inhibitory postsynaptic currents in postsynaptic cells. (B) A synaptosome is a “pinched-off nerve ending” consisting of a presynaptic terminal with its active zone, synaptic cleft, and postsynaptic membrane with its postsynaptic density (PSD). (C) Synaptic vesicles, the carrier of neurotransmitters, contain numerous proteins, such as V-ATPase, neurotransmitter transporter, cysteine string protein (CSP), RAB, synaptophysin, synaptotagmin, and synaptobrevin (Witzmann et al. 2005). Created with BioRender.com.
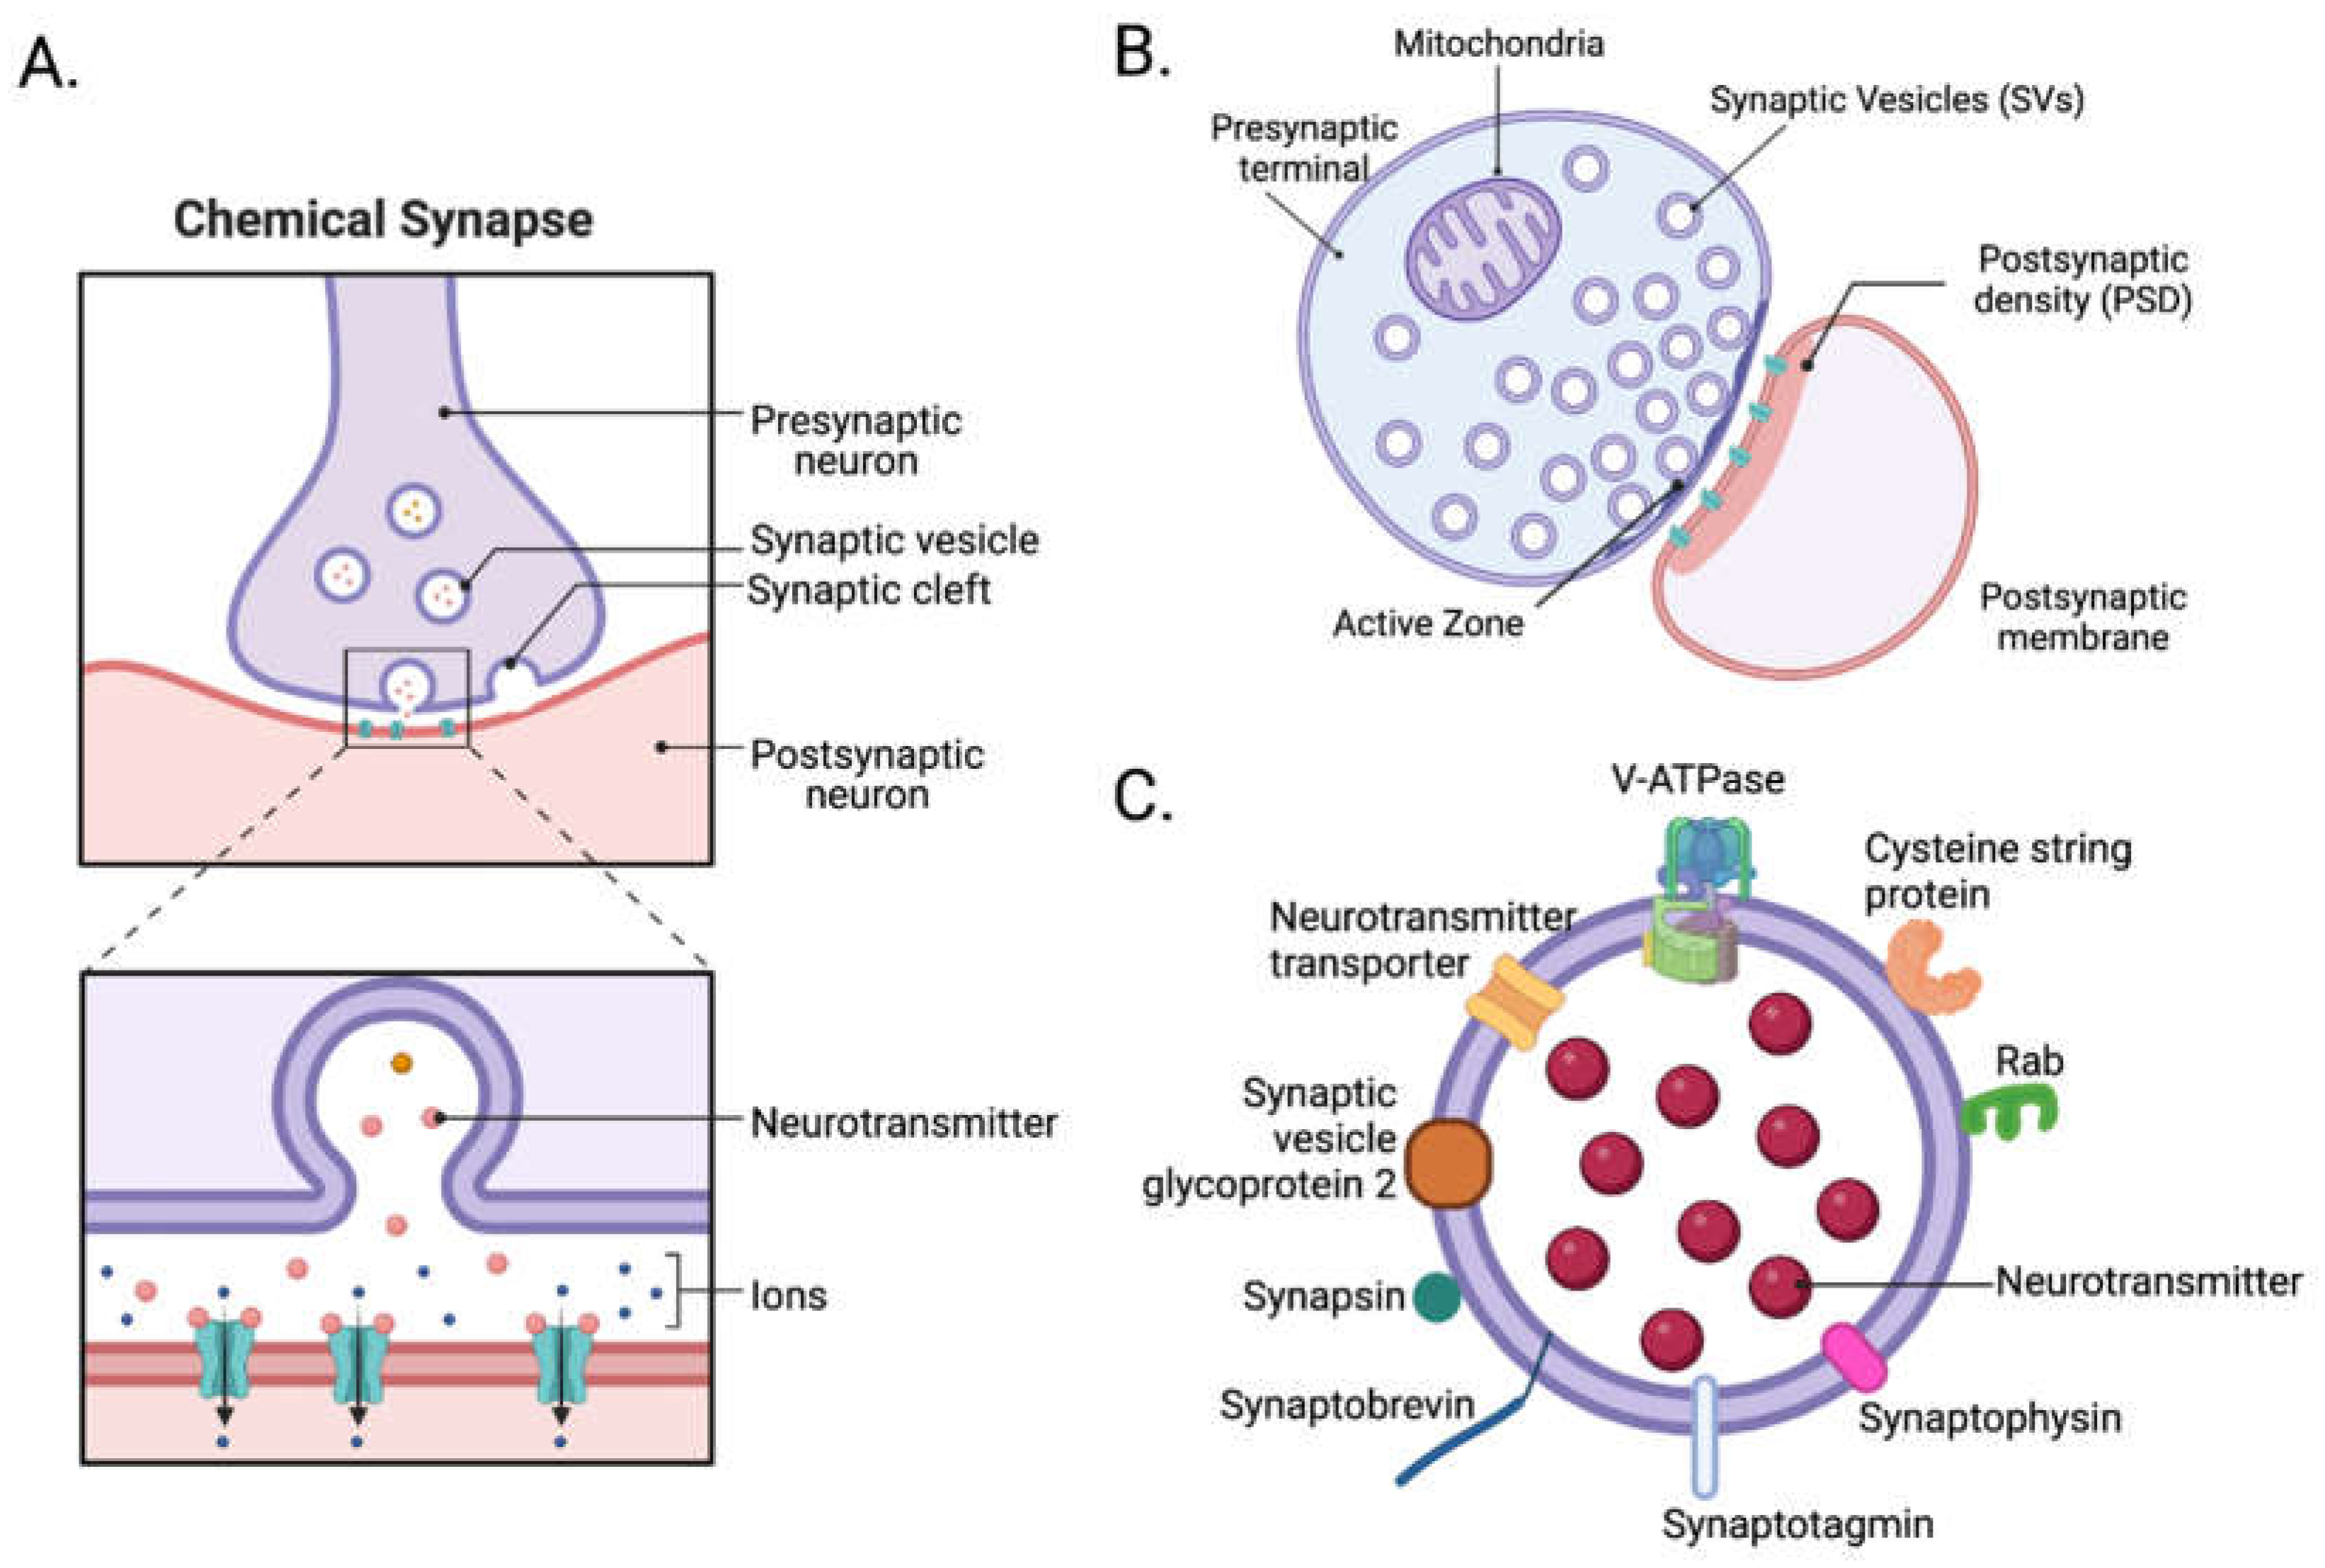
Figure 2.
Isolation and enrichment of chemical synapses. (A) Crossbreeding a loxP “floxed” rodent with Cre driver rodent labels cell-type-specific synapses with fluorophores such as TdTomato. (B) Laser capture microdissection (LCM) can isolate a subpopulation of cells from a brain slice. (C) Magnetic-activated cell sorting (MACS) is a bulk isolation technique utilizing magnetic and cell surface markers. (D) Fluorescence-activated cell sorting (FACS) isolates cells and synaptosomes using a surface marker, size, and granularity. (E) Tandem affinity purification (TAP) uses TEV protease, and IgG and calmodulin beads, to isolate not only a bait but also proteins interacting with a bait. (F) BioID and APEX2 proximity labeling techniques can label proteins in an activity-dependent manner. These labelings help to identify neuroproteome changes and their interactions in a cell-type, subcellular-compartment, and activity-dependent manner. Created with BioRender.com.
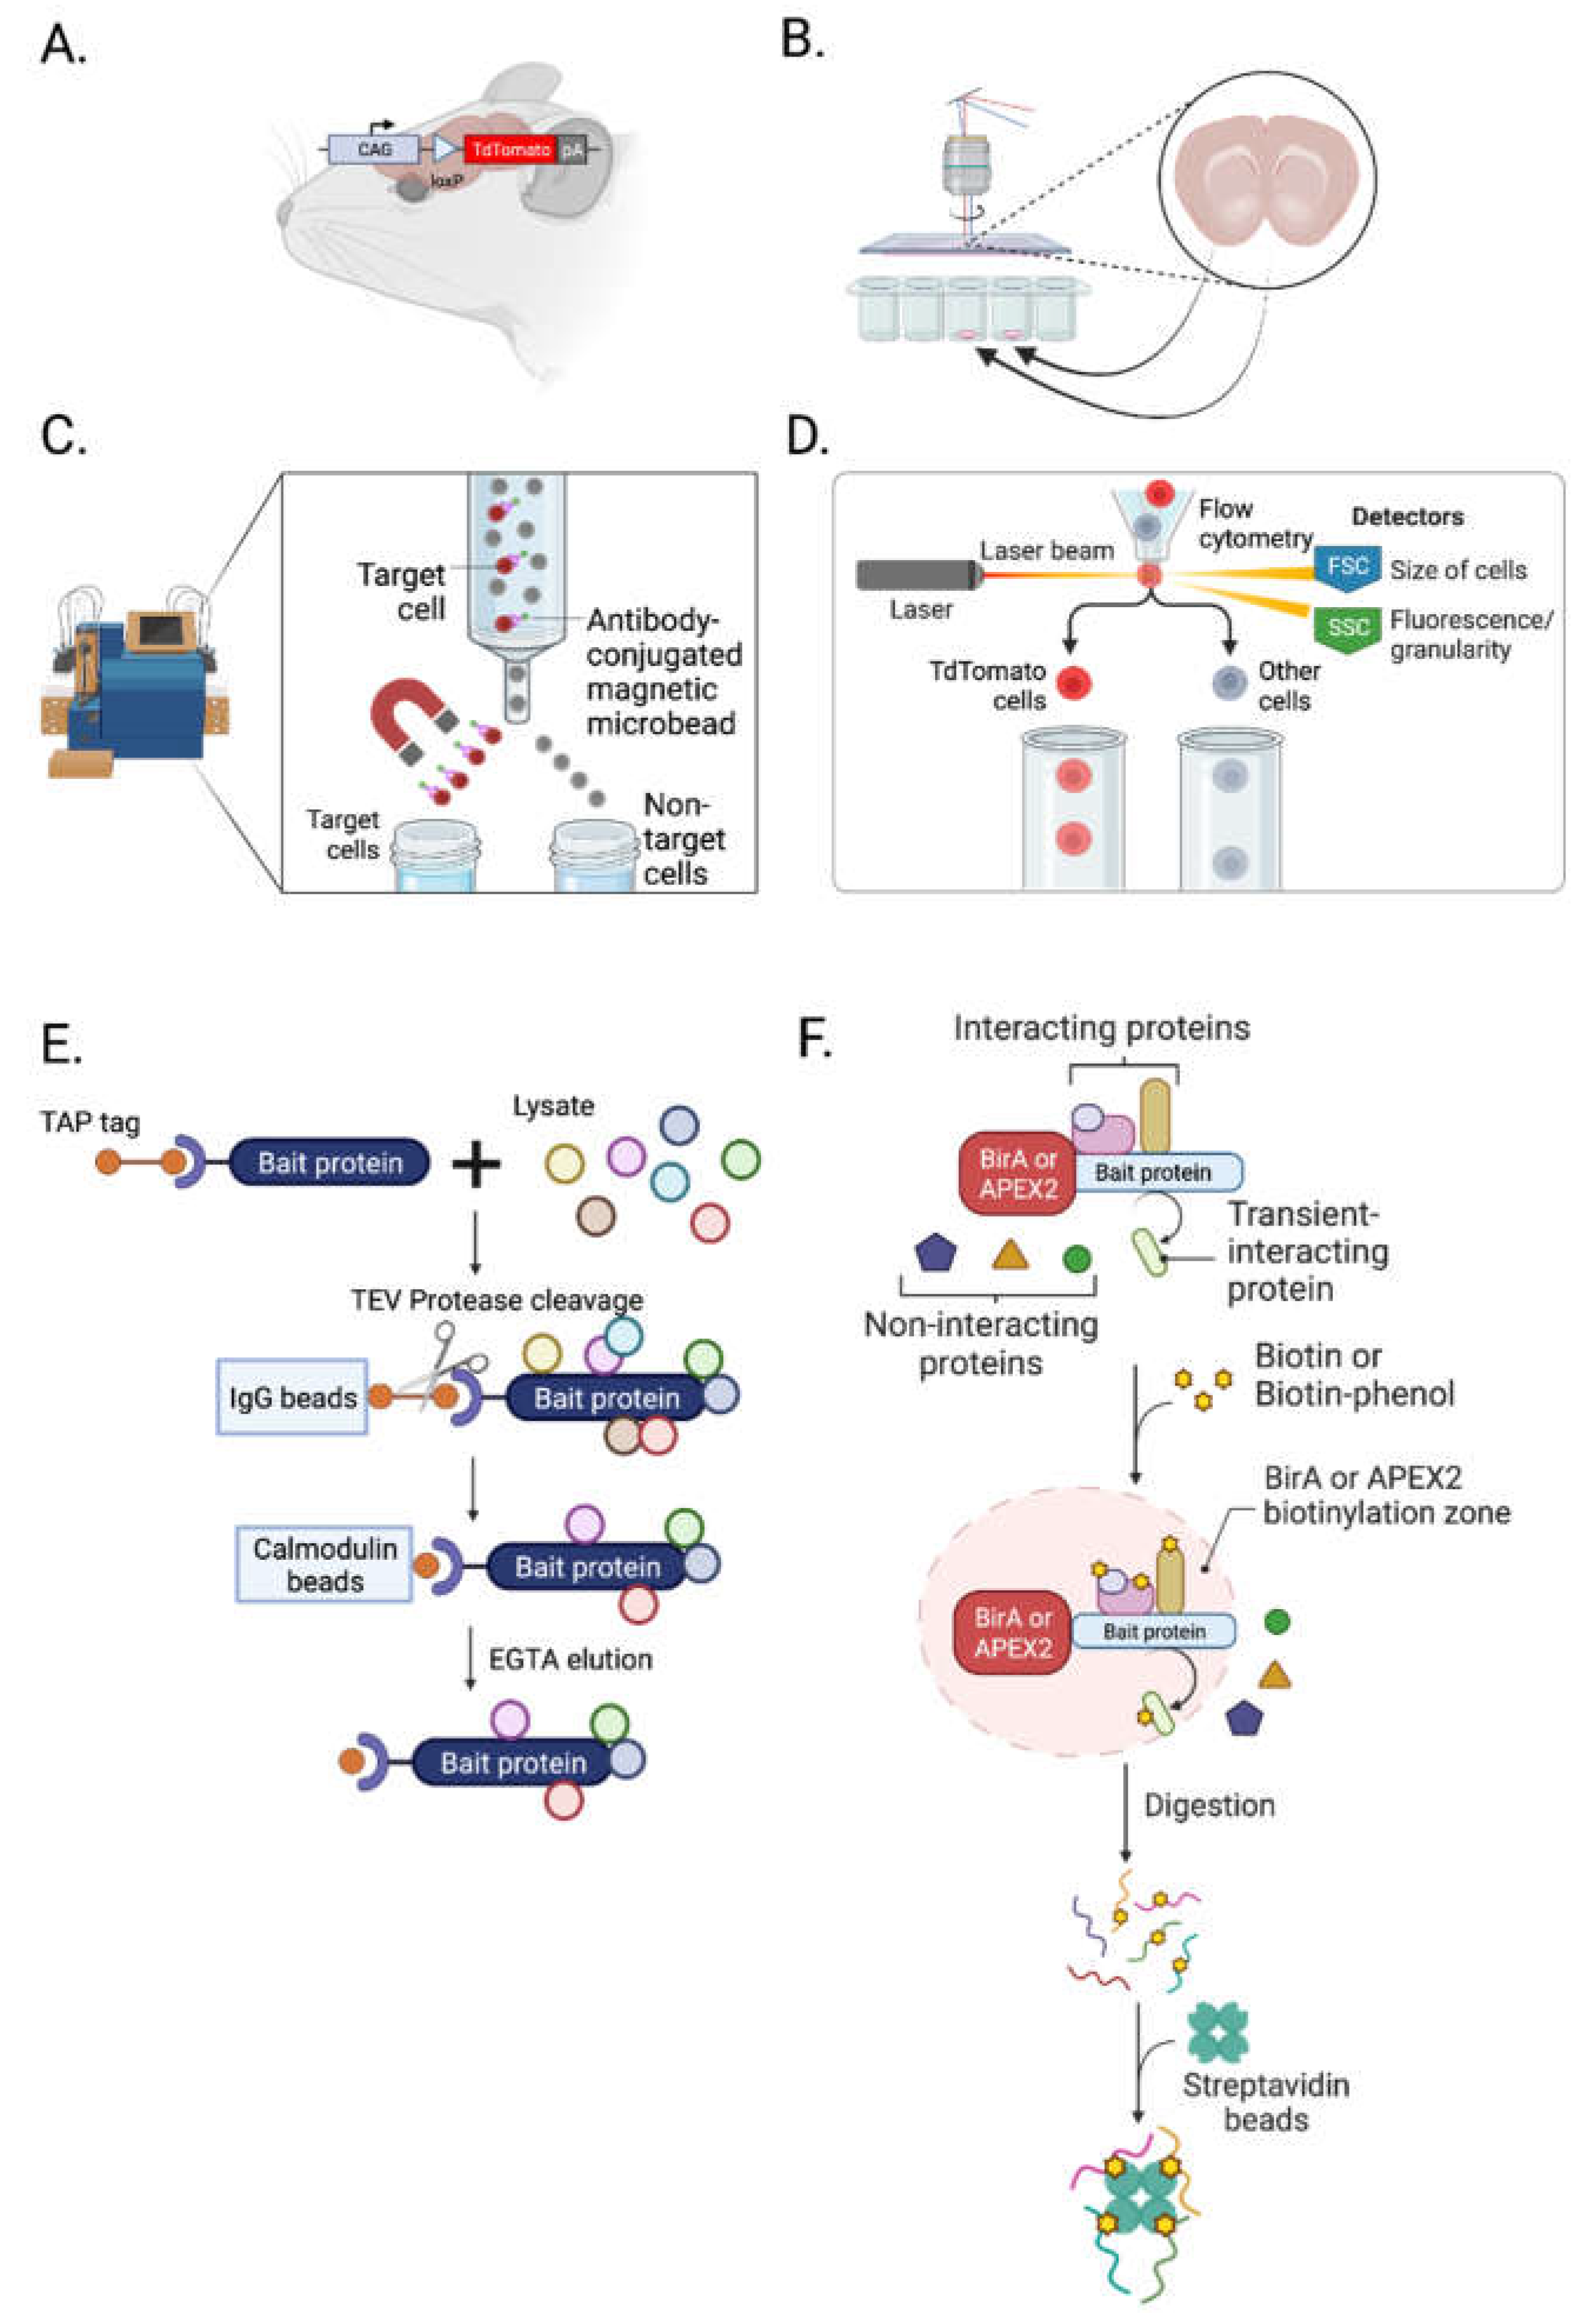
Figure 3.
Advancement in mass spectrometry techniques. (A) MS-based proteomics is largely divided into bottom-up and top-down approaches. Bottom-up proteomics analyzes peptides, while top-down proteomics analyzes intact proteins. (B) Imaging mass spectrometry (IMS) provides a spatial distribution of molecules present in a tissue sample. (C) Single-cell mass spectrometry (scMS) with NanoPOTs and FACS helps to unbiasedly study proteomes in single brain cells. Created with BioRender.com.
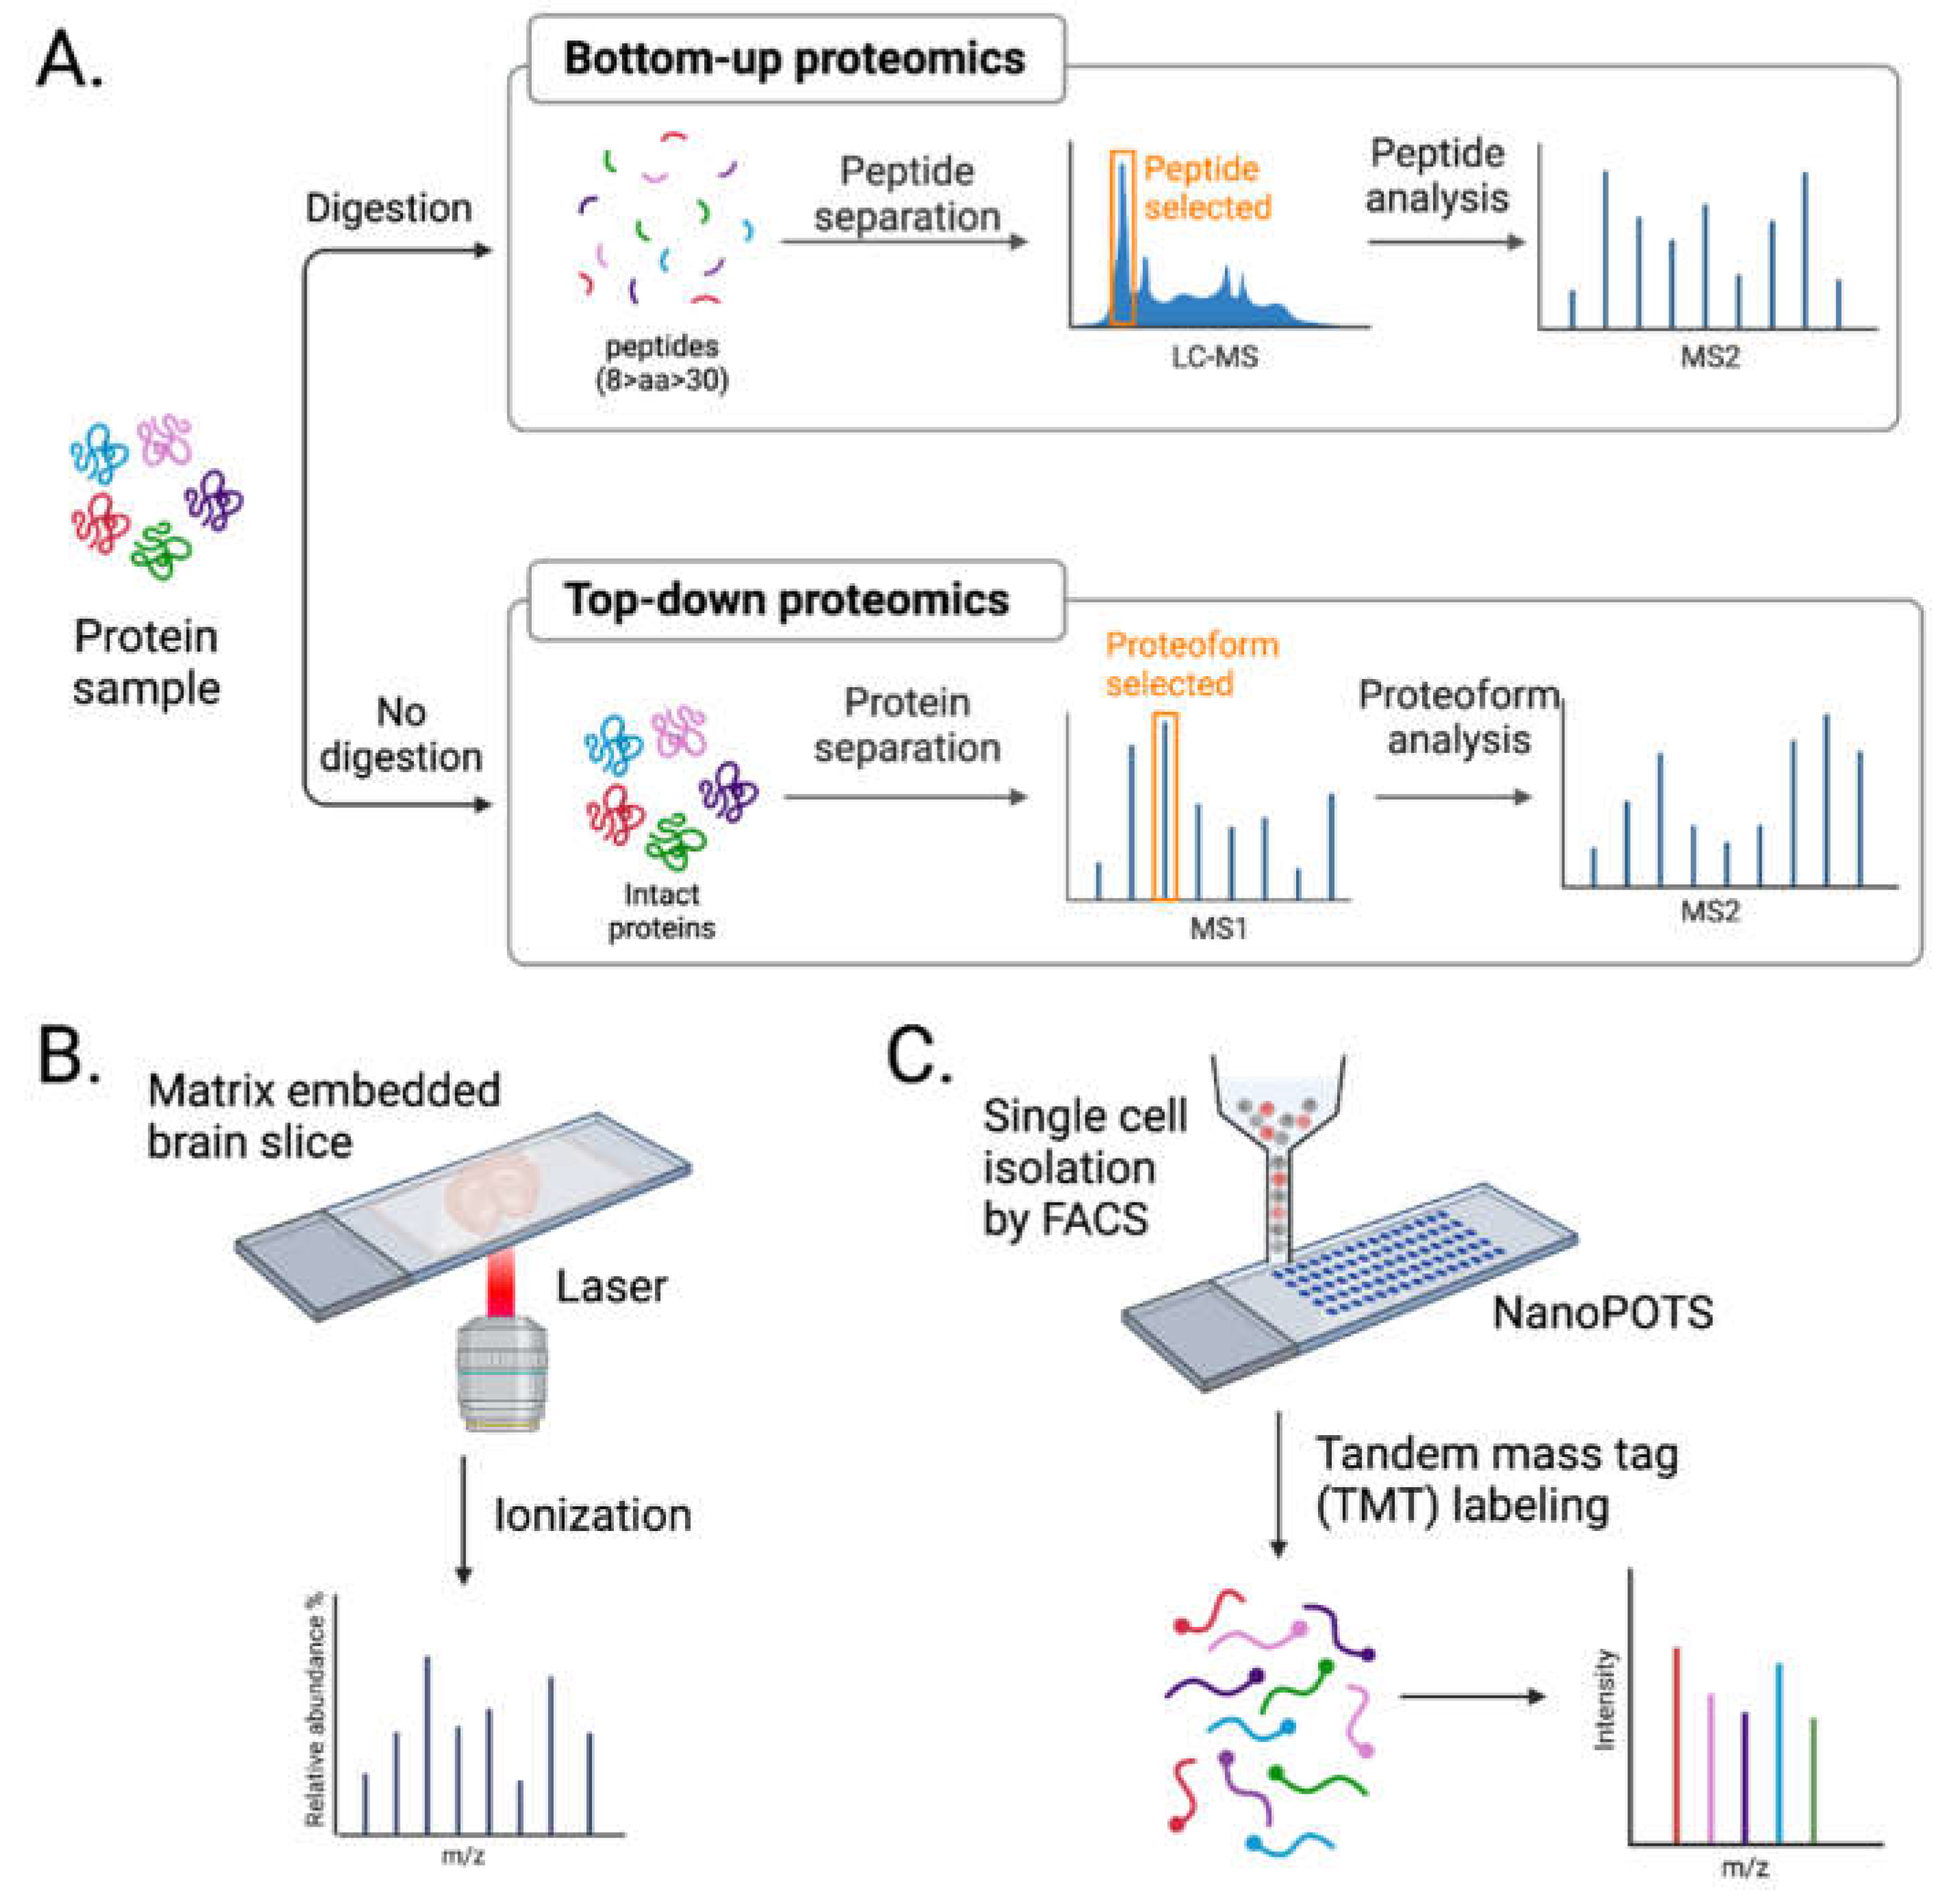
Disclaimer/Publisher’s Note: The statements, opinions and data contained in all publications are solely those of the individual author(s) and contributor(s) and not of MDPI and/or the editor(s). MDPI and/or the editor(s) disclaim responsibility for any injury to people or property resulting from any ideas, methods, instructions or products referred to in the content. |
© 2023 by the authors. Licensee MDPI, Basel, Switzerland. This article is an open access article distributed under the terms and conditions of the Creative Commons Attribution (CC BY) license (http://creativecommons.org/licenses/by/4.0/).
Copyright: This open access article is published under a Creative Commons CC BY 4.0 license, which permit the free download, distribution, and reuse, provided that the author and preprint are cited in any reuse.


