
Submitted:
17 May 2023
Posted:
18 May 2023
You are already at the latest version
Abstract
Chronoamperometric curves of the oxidation of a ferrocenyl derivative by the potential step showed diffusion controlled-like currents less than the Cottrell's equation at a platinum wire electrode. The lower deviation cannot be explained by the Butler-Volmer heterogeneous kinetics, but was ascribed to the negatively capacitive current associated with the redox reaction. The deviation at the fully oxidized potential corresponds to the non-zero concentration at the electrode surface, which cannot be predicted from the Nernst equation. The Nernst equation expresses the relationship of the potential with the activity at the electrode surface rather than the concentration. The diffusion equation provides the relation of the current with the surface concentration rather than the activity. The negative capacitance or the non-zero concentration may arise from structure formation on the electrode owing to the dipole-dipole interaction, which is similar to the generation of the double layer capacitance including frequency dispersion. On this concept, we derive here expressions for the lowered diffusion-controlled current and the time-dependent surface concentration. The negatively capacitive current shows the time-dependence of t-0.9, which is similar to the decay of the double layer capacitive currents. The surface concentration decays with the t-0.4-dependence.
Keywords:
heterogeneous kinetics
; Butler-Vomer type
; delay of the double layer capacitance
; frequency dispersion
; chnoroanperometry
; ferrocenyl derivative
; lowered diffusion-controlled current
; time-dependent surface concentration
; negatively capacitive current
1. Introduction
A double layer capacitance (DLC) has exhibited frequency dispersion, which can be characterized as a deviation from an ideal capacitance. The dispersion belongs to a general phenomenon caused by relaxing the dielectric response from one polarized structure to another [1,2]. It has been represented quantitatively with the constant phase element [3,4,5,6,7] and the power-law of the frequency [8,9,10]. The former has been used practically for a measure of the deviation from ideal, electrolytic capacitors, whereas the latter has been explained mathematically with the time-derivative of the charge, CV, [10] where C is the capacitance and V is the time-dependent voltage. The dispersion has been observed in such a wide frequency range from 0.01 Hz to 10 kHz [7,11] that it cannot be ascribed to inversion of a dipole orientation by externally electric field. A single dipole can be oriented only at 1 GHz [12]. The experimental response at much lower frequency may result from complicated interactions by a huge number of dipoles, called cooperative phenomena [13,14]. An externally applied electric field seems to orient solvent dipoles in the uniform direction to decrease the electrostatic energy, as illustrated in Figure 1(A). However, the interaction energy of hydrogen bonds on the electrode is much larger than the field-oriented energy [15], so that neighboring water dipoles are oriented alternately, as shown in Figure 1(B). A part of dipoles oriented by the field overcoming thermal fluctuation can participate in the DLC, as shown in Figure 1(C).
A charge transfer reaction is necessarily associated with electrical neutralization by counterions to yield a dipole, called a redox dipole (-…+ in Figure 1(D)). The dipole is oriented in the direction opposite to that of the field-oriented solvent dipoles [16]. Therefore, the redox dipole works to suppress the DLC in Figure 1(D). When its contribution overcomes the DLC current, the observed capacitance takes a negative value [10,17,18,19,20,21,22,23]. Since it takes an unpredictably long time to establish the stable, macroscopic, two-dimensional structure of oriented dipoles, redox reactions may have relaxation similar to the delay of the DLC.
A heterogeneous kinetics, i.e., a delay until attaining the Nernst equilibrium, has been expressed with a Tafel equation or a Butler-Volmer equation, in which a reaction rate or the current varies exponentially with an applied voltage. The exponential dependence means that the rate-determining step is a transfer of electrons through the electric field followed by the transition state theory [24,25,26], without any influence of alterations of charge neutralization, solvation, chemical complications or adsorption. These influences have been taken into account by introducing reorganization energy to reaction-free energy curves [27,28]. However, evaluated charge transfer rate constants have depended on practical conditions such as measurement techniques [29], curve-fitting methods [30] and sometimes research groups. In fact, reported rate constants of ferrocene in acetonitrile have ranged over four digits [31]. Fast scan voltammetry has provided heterogeneous rate constants of the order of 0.01 cm s-1 including much ambiguity, while steady state voltammetry at ultra-micro electrodes has given too fast rates to be determined [32]. The inconsistency of the observed rates has been explained in terms of solvent reorientation dynamics or solvent friction effects [33]. For example, rates of 1,4-phenylenediamine have varied linearly with the inverse of the dielectric relaxation time [34], as has been supported theoretically [35,36]. Rates of redox species have been related with solvent dynamics [29,37], hydrodynamic radius [38], and viscosity [39]. Since the other effects such as the neutralization are obviously slower than the motion of electrons through the electric fields, the exponential dependence is not likely to be a true rate but overall rates may be controlled with a time-depending pre-exponential factor. It is necessary to suggest a new heterogeneous kinetics that includes time variables rather than the exponential dependence.
Not only the DLC (Figure 1(C)) but also a charge transfer reaction (Figure 1(D)) participates in dipole-dipole interactions. The former can be characterized by the frequency dispersion, while the latter be by the negative capacitance [17,18,19,20,21,22,23]. The two interactions on an electrode surface provides a delay for stabilizing surface structure over the whole surface, spending the time much longer than the time of orientation of one dipole. There is a resemblance between them for the delay relevant to dipole interactions on the electrode. We describe here the detailed concept of the resemblance, derive equations for chronoamperometry, make potential step experiment of a ferrocenyl derivative, and analyze the experimental data.
2. Theory
A concept of the delay or the negative capacitance is outlined here. When an oxidation potential is applied to an electrode in redox species-included solution, the Nernst equation determines activity of the redox species on the electrode surface. If the activity is equivalent to a concentration on the electrode, the difference between the surface concentration and the bulk one causes diffusion, of which flux is observed as current. The current values are specific to applied potentials. This logic is valid on the assumption of the equivalence of the activity to the concentration. The activity is a measure of such an effective concentration that the energetical balance is satisfied formally with the Nernst equation. In contrast, concentration is the number density of the redox species without any energetical concept. It is concentration rather than activity that can control diffusion equations.
If dipole-dipole interaction of solvents, for example hydrogen bonding energy, is larger than the standard chemical potential term (actually, the product of the chemical potential times the exchanged charge), the activity in the Nernst equation is different from concentration. Figure 2 shows an illustrative example of the difference when a redox species Fc is partially oxidized to Fc+ by applying an oxidation potential. The oxidation is associated with the charge neutrality by a counterion (Cl-) to form a redox dipole (indicated as two parallel arrows). Water dipoles neighboring the Fc+-Cl- are oriented in the direction opposite to the orientation of Fc+-Cl- (in imaginary cells (a) and (a’)) in order to decrease the dipole-dipole interaction energy. Those next to (a) should be directed toward the electrode in (b), which can participate in formation of the DLC. The dipolar structure in (a’) is similar to that in (a). If Fc+ in (a’) is not oxidized, the neutral form of Fc has no effect on the orientation of the neighboring water diploes in (b’), which may be thermally fluctuated to give the sum of the dipoles the zero dipole moment in (b’). Then the interaction energy in [A] is the same as that in [B] as for the dipole-dipole interaction, resulting in the same chemical potential in [A] as in [B]. Consequently, the concentration on the electrode is different from the activity controlled by the Nernst equation.
We describe here the time-dependence of the DLC, which is not only reflected in the heterogeneous kinetics but also helpful for subtracting the DLC component from the observed ones. When voltage V is applied in a step form to the DLC, the chronoamperometric current density at t > 0.3 ms is given by [40]
where C1s is the DLC per area at t = 1s, and λ is the number close to 0.1. It is not the form of exp(-t/RsC) for a solution resistance, Rs and the DLC, C, because it is deviated largely from an ideal capacitance owing to the frequency dispersion. Since no point of zero charge has been found at platinum an electrode in various aqueous solutions [9,41], V is a step voltage independent of the formal potential of a redox species. Although the decay speed (t-0.9) is larger than the Cottrell’s decay (t-0.5), the DLC current is still survived even at 1 s. This long relaxation caused by the power-law may be involved in the heterogeneous kinetics through the dipole interaction.
jdl = λVC1stλ-1
We consider a faradaic current by a one-electron transferring Nernstian redox couple dissolved in solution. The mass transport of the redox species is assumed to be controlled by time-dependent one-dimensional (x-) diffusion with the diffusion coefficient, D, common to the reduced and the oxidized species. When a potential is stepped from a fully reduced domain to a given oxidized potential E, a solution of the diffusion equation provides the relation between the surface concentration, cs, and the observed current density, job [42] through
cs = c* - F-1(πD)-1/2 ∫0t job(u)(t-u)-1/2 du
The observed current density is the Cottrell’s current density, jC, subtracting the negatively capacitive one, jN,
where
job(t) = jC - jN
jC = c*F(D/πt)1/2
jN = μVCrxtμ-1
Here, μ is a positive number close to zero, and Crx is the capacitance associate with a redox reaction. The functional form of jN is assumed to be similar to that of DLC (Eq. (1)) because of similarity of the current source by the dipole-dipole interaction. Inserting Eq. (3) into Eq. (2) and carrying out the integrations by use of the formula of the Beta function [43], we have
where Γ is the Gamma function. This equation states that the surface concentration decreases with the tμ-1/2-dependence. However sufficiently oxidized potential is applied to the electrode, the concentration of the reduced species may not become zero instantaneously. The observed currents less than the Cottrell’s current make the concentration on the electrode be detectable values.
cs(t) = (μVCrx/FD1/2){Γ(μ)/Γ(μ+1/2)}tμ-1/2
Observed currents always include the DLC current, i.e., IC-IN+Idl. Each contribution is examined here in order to find which current contributes mainly to cs. Chronoamperometric curves were calculated from Eq. (1), (4) and (5) for our experimental values of c*, D, λ and μ, where the gamma functions were evaluated with use of the approximate equation [44]. They are shown in Figure 3(A), and their Cottrell plots (I vs. t-1/2) are shown in Figure 3(B). The lower deviation of the current, IC-IN, from the Cottrell equation is noticeable at time shorter than 0.1 s (t-1/2 > 3 in Figure 3(B)). This is the kinetic effect. The time-dependent current necessarily includes the DLC current (c). The observed current, IC-IN+Idl, is predicted to be curve (d), which is close to the Cottrell equation without the capacitive current. When c* is less than 0.1 mM, values of IC-IN are close to those of Idl. Thus, pulse voltammetric currents for low redox concentrations always suffer from capacitive currents [45,46,47].
Of interest is comparison of the negative capacitance with the Butler-Volmer kinetics, which is expressed in the chronoamperometry as [48]
jBV = c*FD1/2 Λ exp(Λ2t) erfc(Λt1/2)
where Λ = koD-1/2{exp[β(Edc-Eo)F/RT] + exp[-α(Edc-Eo)F/RT]}
Here, ko is the standard rate constant for the charge transfer reaction, α and β are the cathodic and the anodic transfer coefficient, respectively. Figure 4 shows (A) Cottrell plots and (B) their logarithmic plots calculated from Eq. (3) and Butler-Volmer kinetics for three values of Edc-Eo. The Cottrell plots for the Butler-Volmer kinetics exhibit a convex shape for Edc-Eo < 0.10 V, while those for the negative capacitance fall on each line with almost zero intercepts. The two kinds of the kinetics can be discriminated for the logarithmic plots more clearly than for Cottrell plots at the two points: (i) the plots for the negative capacitance show a line, and (ii) the slopes of the lines are independent of Edc.
3. Experimental
The potentiostat used for the cyclic voltammetry and chronoamperometry was a Compactstat (Ivium, the Netherlands). A working electrode was the platinum wire 0.5 mm in diameter of which tip was inserted into the solution 1 mm long. This structure has an advantage of keeping an exposed electrode area without floating capacitance caused by crevice between an electrode and its insulator for the area-control. The accurate length was controlled with a Z-stage with a help of an optical microscope. The counter electrode was a platinum wire with the area 100 times larger that of the working electrode, and the reference electrode was Ag|AgCl in saturated KCl solution. The test solutions were deareated for 15 min before each experimental measurement.
All the chemicals were of analytical grade. Aqueous solutions of 1 mM (mM=10-3 mol dm-3) (ferrocenylmethyl)trimethyl ammonium (FcTMA) and 0.5 M KCl were prepared in distilled and then ion-exchanged water by means of an ultrapure water system, CPW-100 (Advance, Tokyo, Japan). All the measurements were made at a room temperature.
4. Results and Discussion
Figure 5 shows Cottrell plots for the observed chronoamperometric curves in solutions (a) with and (b) without FcTMA when the potential was stepped from the reduced domain (0.26 V) to the limiting domain (Edc = 0.489 V). The linear sweep voltammogram is shown in the inset to specify the potential domain. The solution resistance was evaluated with Nyquist plots by ac-impedance to be 100 Ω. If 4 mV of IR-drop is allowed to be involved in applied voltage, the effectively maximum current, 40 μA, corresponds to the chronoamperometric time 0.006 s by the Cottrell equation for D = 0.7×10⁻⁵ cm2 s-1. On the other hand, the efficiently longest time deviated from the Cottrell equation is the time of the incidence of cylindrical diffusion. The current at a cylindrical electrode in radius a is expressed approximately as a(πDt)-1/2+ 0.422 [49]. If 3% errors are allowed to be involved in the current, the longest time, tL, satisfying a(πDtL)-1/2 > 0.422×0.03 is tL < 0.2 s. Consequently, the time domain for the analysis is 0.006 s < t < 0.2 s.
The observed chronoamperometric current in the Cottrell plots exhibited a linear relationship with passing through the origin (a). Since the DLC current (b) was as much as 1/10 of the observed current (a), it was subtracted from the observed one to be shown as (c) in Figure 5. The subtracted current shows still linearity with t-1/2. The Cottrell plot theoretically calculated for c* = 1 mM and D = 0.7×10⁻⁵ cm s-1 is shown in Figure 5 (d). The DLC-included current (a) is ironically close to the Cottrell current (d), indicating that the contribution of the kinetics should be numerically similar to the DLC current accidentally. The difference of (d) from (c) seems to be contribution of the negative capacitance. This resembles the deviation of the plots of the peak current against the square-root of potential scan rates in cyclic voltammetry [21].
Eq. (5) predicts that the negatively capacitive current, which can be evaluated from IN = IC+Idl-Iob, has the tμ-1-dependence. In order to examine the power law in IN, we plotted logarithmically IN against t in Figure 6 for two values of E. All the points at each E fell on each line, of which slopes were common and determined to be μ = 0.1. Values of VCrx were obtained from the intercept in Figure 6, and were plotted against E in Figure 7. They fell on a line, of which slope means Crx, according to Eq. (5). The value was Crx = 67 μF cm-2, which is close to 64 μF cm-2 [18] obtained by ac-impedance and 60 μF cm-2 [21] by fast cyclic voltammetry.
We evaluated cs numerically from Eq. (6) for the determined values of μ and Crx at c* = 1 mM. Figure 8 shows the calculated time-variation of cs and a dotted line averaged over t < 0.2. A value of cs might be almost zero without any interaction. The averaged concentration is 0.1 mM, as if it were ineffective to the oxidation. Although the potential is in the limiting current domain, the concentration of the reduced species on the electrode does not take zero, as illustrated in Figure 1(D). The oxidation energy is consumed by decreasing the dipole-dipole interaction on the electrode until the interaction becomes stable. This interaction is also a source of the negative capacitance, and hence the non-zero surface concentration is equivalent to the negative capacitance. The times at which the concentration at the surface becomes 5% and 2% of the bulk concentration are 0.5 s and 5 s, respectively. This slow relaxation is close to the frequency dispersion of the DLC.
Since the linearity of the experimental data in Figure 6 is inconsistent with the convex variation for the Butler-Volmer kinetics in Figure 4, it is obvious that the Butler-Volmer kinetics fails to elucidate our experimental time-dependence. It is interesting to know which kinds of values of ko can be obtained if the Butler-Volmer kinetics is applied to the present chronoamperograms in the light of the time-dependence. The When the approximate equation for the error function [50],
is applied to Eq. (7), the current-time curve can be expressed through a simple calculation as
where
exp(x2) erfc(x) = (2/√π)/{x+(x2+4/π)1/2}
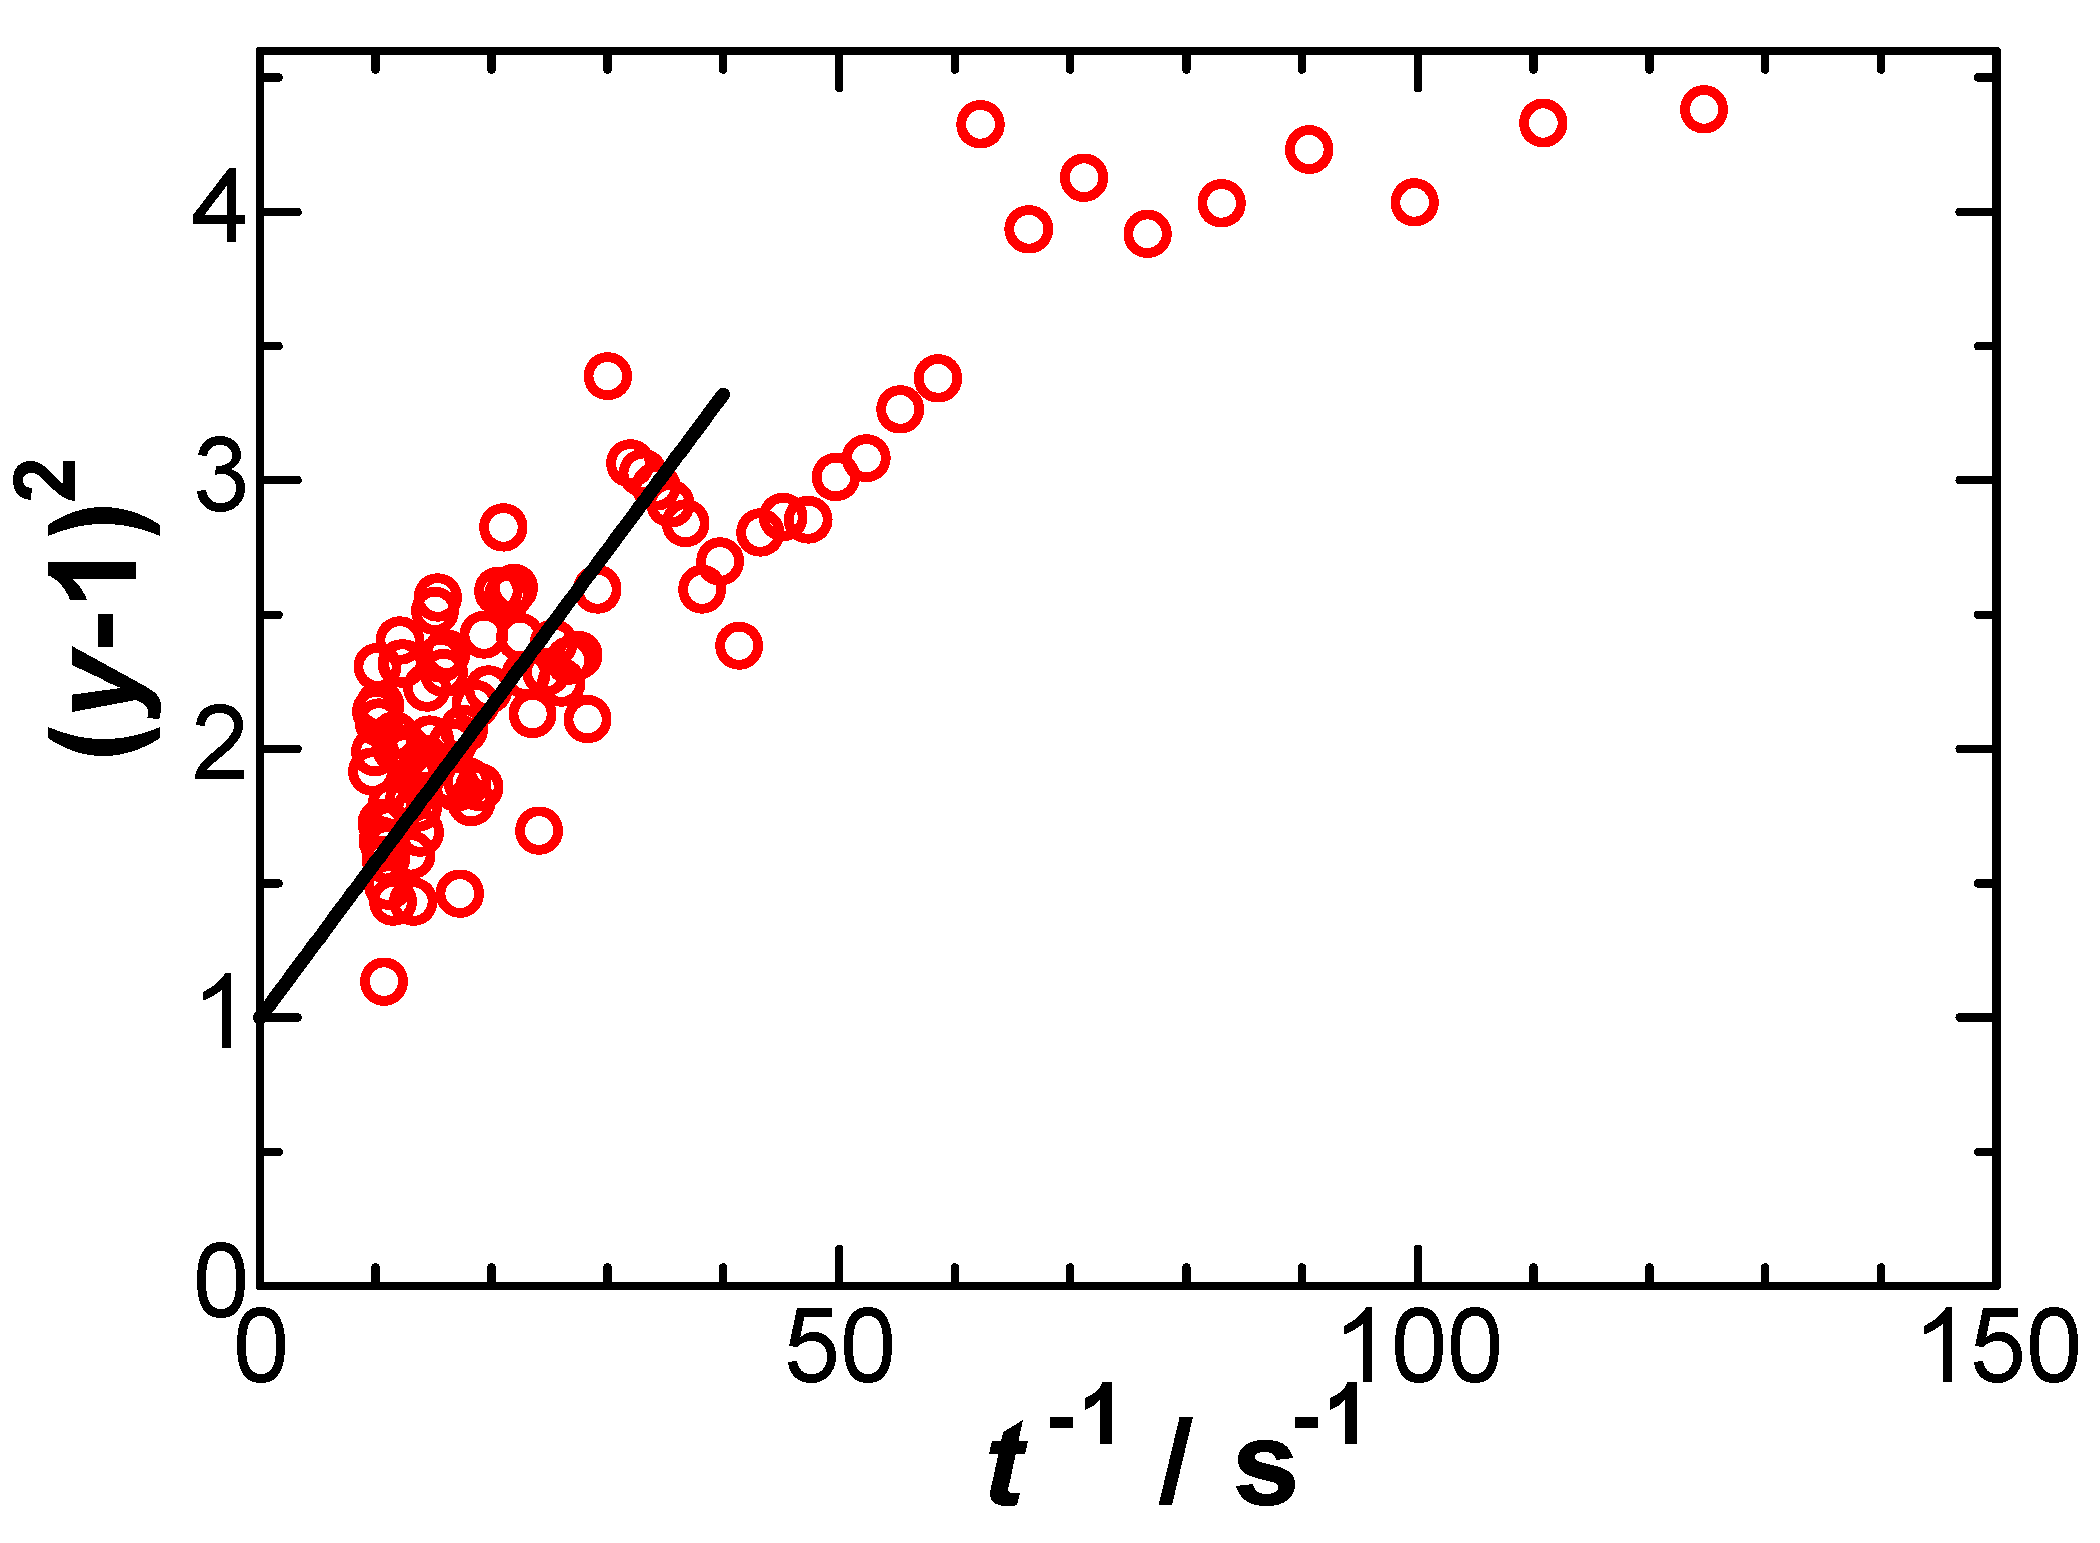
(y-1)2= 1 + 4/πΛ2t
y = 2c*F(D/πt)1/2 / jBV
We evaluated y from experimental data, and plotted (y-1)2 against 1/t in Figure 9 at E = 0.393 V. Some data ranging from 10 s-1 < t-1 < 60 s-1 fell on a line, of which intercept was forced to pass through 1, according to Eq. (10). The slope provided Λ and ko = 3×10⁻⁴ cm s-1 through Eq. (8) for α = β = 0.5. However, the plot in Figure 8 does not justify a linear variation in that the slopes decrease at longer time. Values of ko thus obtained decreased with an increase in E, and became negative for E < 0.42 V. Since they were not determined uniquely, they are physiochemically insignificant.
5. Conclusions
A new heterogeneous kinetics is presented here, which is revealed in the amount of the depression of the current from the Cottrell current. This amount, being proportional to the power of the time, corresponds to the negatively capacitive current brought about by the redox reaction in the physical meaning. The kinetic parameters are the power number and the negative capacitance, which has almost the same form as in the DLC caused by solvent dipole-dipole interaction. The similarity indicates that the kinetics should be ascribed to the dipole-dipole interaction activated by the generation of the redox dipole, whereas the DLC is activated with the applied electric field. Since the dipole interaction ranges widely on the electrode and thermally fluctuated, it takes a macroscopic time rather than a microscopic inversion time of one dipole to establish the stable structure both for the kinetics and the DLC.
Diffusion current is controlled with the surface concentration which can be expected to be determined by electrode potential on the assumption of the equivalence of the concentration to the activity. If electrostatic energy at the electrode is consumed mostly by structure formation of solvent dipoles through their orientation, surface concentration is not followed sufficiently enough by the potential to depress the diffusion current. The deviation of the concentration from the activity in the Nernst equation is caused by the interaction of the redox dipoles with the solvent dipoles, whereas the negative capacitance is brought about with the redox dipoles sustained by solvent dipoles. The similarity indicates that the model of the negative capacitance may be equivalent to the deviation of the concentration from the activity.
The slowly relaxed solvent interaction triggered by the redox reaction also occurs when electric field is applied to the electrode. Then the redox reaction shows slow relaxation similar to that the DLC does. Therefore, both the redox reaction and the DLC present the similar power-law of the time.
The Butler-Volmer kinetics failed in determination of the heterogeneous rate constants, being invalid even in the linearity of the time-dependent plots. The rate constant forced to be determined was much smaller than values predicted from cyclic voltammetry.
References
- Gerhardt, R. Impedance Spectroscopy and Mobility Spectra. In Encyclopedia of Condensed Matter Physics; Elsevier: Amsterdam, The Netherlands, 2005; pp. 350–363. [Google Scholar] [CrossRef]
- Frolov, D.S.; Zubkov, V.I. Frequency dispersion of capacitance–voltage characteristics in wide bandgap semiconductor-electrolyte junctions. Semicond. Sci. Technol. 2016, 31, 125013. [Google Scholar] [CrossRef]
- Lasia, A. Modern Aspects of Electrochemistry, 32; White, R.E. , Conway, B.E., Bockris, J.O.’M., Eds.; Kluwer Academic/Plenum Publishers: New York, NY, USA, 1999; p. 143. [Google Scholar]
- Brug, G.J.; Van Den Eeden, A.L.G.; Sluyters-Rehbach, M.; Sluyters, J.H. The analysis of electrode impedances complicated by the presence of a constant phase element. J. Electroanal. Chem. Interfacial. Electrochem. 1984, 176, 275–295. [Google Scholar] [CrossRef]
- Nyikos, L.; Pajkossy, T. Fractal dimension and fractional power frequency-dependent impedance of blocking electrodes. Electrochim. Acta 1985, 30, 1533–1540. [Google Scholar] [CrossRef]
- Zoltowski, P. On the electrical capacitance of interfaces exhibiting constant phase element behaviour. J. Electroanal. Chem. 1998, 443, 149–154. [Google Scholar] [CrossRef]
- Schalenbach, M.; Durmus, Y.E.; Robinson, S.A.; Tempel, H.; Kungl, H.; Eichel, R.-A. Physicochemical Mechanisms of the Double-Layer Capacitance Dispersion and Dynamics: An Impedance Analysis. J. Phys. Chem. C 2021, 125, 5870–5879. [Google Scholar] [CrossRef]
- Hou, Y.; Aoki, K.J.; Chen, J.; Nishiumi, T. Solvent Variables Controlling Electric Double Layer Capacitance at the Metal–Solution Interface. J. Phys. Chem. C 2014, 118, 10153–10158. [Google Scholar] [CrossRef]
- Aoki, K.; Hou, Y.; Chen, J.; Nishiumi, T. Resistance associated with measurements of capacitance in electric double layers. J. Electroanal. Chem. 2012, 689, 124–129. [Google Scholar] [CrossRef]
- Aoki, K.J.; Chen, J. Effects of the dipolar double layer on elemental electrode processes at micro- and macro-interfaces. Faraday Discuss. 2018, 210, 219–234. [Google Scholar] [CrossRef]
- Schalenbach, M.; Durmus, Y.E.; Tempel, H.; Kungl, H.; Eichel, R.-A. Double layer capacitances analysed with impedance spectroscopy and cyclic voltammetry: Validity and limits of the constant phase element parameterization. Phys. Chem. Chem. Phys. 2021, 23, 21097–21105. [Google Scholar] [CrossRef]
- Atkins, P.; de Paula, J. Physical Chemistry, 10th ed.; Oxford University Press: Oxford, UK, 2014; pp. 664–665. [Google Scholar]
- Chen, Z.; Wasson, M.C.; Drout, R.J.; Robison, L.; Idrees, K.B.; Knapp, J.G.; Son, F.A.; Zhang, X.; Hierse, W.; Kühn, C.; et al. The state of the field: From inception to commercialization of metal–organic frameworks. Faraday Discuss. 2020, 225, 9–69. [Google Scholar] [CrossRef]
- Kikuchi, R. A Theory of Cooperative Phenomena. Phys. Rev. 1951, 81, 988–1003. [Google Scholar] [CrossRef]
- Aoki, K.J. Molecular interaction model for frequency-dependence of double layer capacitors. Electrochim. Acta 2016, 188, 545–550. [Google Scholar] [CrossRef]
- Griffiths, D.J. Introduction to Electrodynamics, 2nd ed.; Prentice Hall: Hoboken, NJ, USA, 1989; pp. 158–164. [Google Scholar]
- Aoki, K.J.; Chen, J.; Zeng, X.; Wang, Z. Decrease in the double layer capacitance by faradaic current. RSC Adv. 2017, 7, 22501–22509. [Google Scholar] [CrossRef]
- Aoki, K.J.; Chen, J.; Tang, P. Capacitive Currents Flowing in the Direction Opposite to Redox Currents. J. Phys. Chem. C 2018, 122, 16727–16732. [Google Scholar] [CrossRef]
- Aoki, K.J.; Chen, J.; Wang, R. Stripped Charge of Ag Less than Deposited one Owing to Negative Capacitance Caused by Redox Reactions. Electroanalysis 2019, 31, 2303–2310. [Google Scholar] [CrossRef]
- Tang, P.; Aoki, K.J.; Chen, J. Reduction Charge Smaller than the Deposited One in Cathodic Stripping Voltammograms of AgCl. Am. J. Anal. Chem. 2019, 10, 286–295. [Google Scholar] [CrossRef]
- Aoki, K.J.; Chen, J.; Liu, Y.; Jia, B. Peak potential shift of fast cyclic voltammograms owing to capacitance of redox reactions. J. Electroanal. Chem. 2020, 856, 113609. [Google Scholar] [CrossRef]
- Aoki, K.J.; Taniguchi, S.; Chen, J. Participation in Negative Capacitance of Diffusion-Controlled Voltammograms of Hemin. ACS Omega 2020, 5, 29447–29452. [Google Scholar] [CrossRef]
- Liu, Y.; Aoki, K.J.; Chen, J. A Loss of Charge at Reduction of Hydrogen Ion by Fast Scan Voltammetry. J. Electrochem. Soc. 2022, 169, 036510. [Google Scholar] [CrossRef]
- Atkins, P.; de Paula, J. Atkins’ Physical Chemistry, 10th ed.; Oxford University Press: Oxford, UK, 2014; pp. 894–901. [Google Scholar]
- Compton, R.G.; Banks, C.E. Understanding Voltammetry, 2nd ed.; Imperial College Press: London, UK, 2010. [Google Scholar]
- Weaver, M.J. Redox reactions at metal–solution interfaces. Weaver, M.J. In Electrode Kinetics: Reactions; Compton, R.G., Ed.; Elsevier Science: Amsterdam, The Netherlands, 1988. [Google Scholar]
- Marcus, R.; Sutin, N. Electron transfers in chemistry and biology. Biochim. Biophys. Acta 1985, 811, 265–322. [Google Scholar] [CrossRef]
- Hush, N. Electron transfer in retrospect and prospect 1: Adiabatic electrode processes. J. Electroanal. Chem. 1999, 470, 170–195. [Google Scholar] [CrossRef]
- Fawcett, W.R.; Opallo, M. The Kinetics of Heterogeneous Electron Transfer Reaction in Polar Solvents. Chem. Int. Ed. Engl. 1994, 33, 2131–2143. [Google Scholar] [CrossRef]
- Henstridge, M.C.; Laborda, E.; Wang, Y.; Suwatchara, D.; Rees, N.; Molina, A.; Martínez-Ortiz, F.; Compton, R.G. Giving physical insight into the Butler–Volmer model of electrode kinetics: Application of asymmetric Marcus–Hush theory to the study of the electroreductions of 2-methyl-2-nitropropane, cyclooctatetraene and europium(III) on mercury microelectrodes. J. Electroanal. Chem. 2012, 672, 45–52. [Google Scholar] [CrossRef]
- Clegg, A.D.; Rees, N.; Klymenko, O.; Coles, B.A.; Compton, R.G. Marcus theory of outer-sphere heterogeneous electron transfer reactions: High precision steady-state measurements of the standard electrochemical rate constant for ferrocene derivatives in alkyl cyanide solvents. J. Electroanal. Chem. 2005, 580, 78–86. [Google Scholar] [CrossRef]
- Aoki, K.J.; Zhang, C.; Chen, J.; Nishiumi, T. Heterogeneous reaction rate constants by steady-state microelectrode techniques and fast scan voltammetry. J. Electroanal. Chem. 2013, 706, 40–47. [Google Scholar] [CrossRef]
- Henstridge, M.C.; Laborda, E.; Rees, N.V.; Compton, R.G. Marcus–Hush–Chidsey theory of electron transfer applied to voltammetry: A review. Electrochim. Acta 2012, 84, 12–20. [Google Scholar] [CrossRef]
- Opałło, M. The solvent effect on the electro-oxidation of 1,4-phenylenediamine. The influence of the solvent reorientation dynamics on the one-electron transfer rate. Chem. Soc. Faraday Trans. I 1986, 82, 339–347. [Google Scholar] [CrossRef]
- Alexandrov, I. Physical aspects of charge transfer theory. Chem. Phys. 1980, 51, 449–457. [Google Scholar] [CrossRef]
- Calef, D.F.; Wolynes, P.G. Classical solvent dynamics and electron transfer. 1. Continuum theory. J. Phys. Chem. 1983, 87, 3387–3400. [Google Scholar] [CrossRef]
- Weaver, M.J. Dynamical solvent effects on activated electron-transfer reactions: Principles, pitfalls, and progress. Chem. Rev. 1992, 92, 463–480. [Google Scholar] [CrossRef]
- Clegg, A.D.; Rees, N.V.; Klymenko, O.V.; Coles, B.A.; Compton, R.G. Marcus Theory of Outer-Sphere Heterogeneous Electron Transfer Reactions: Dependence of the Standard Electrochemical Rate Constant on the Hydrodynamic Radius from High Precision Measurements of the Oxidation of Anthracene and Its Derivatives in Nonaqueous Solvents Using the High-Speed Channel Electrode. J. Am. Chem. Soc. 2004, 126, 6185–6192. [Google Scholar] [CrossRef] [PubMed]
- Zhang, X.; Yang, H.; Bard, A.J. Variation of the heterogeneous electron-transfer rate constant with solution viscosity: Reduction of aqueous solutions of [(EDTA)chromium(III)]- at a mercury electrode. J. Am. Chem. Soc. 1987, 109, 1916–1920. [Google Scholar] [CrossRef]
- Aoki, K.J.; Chen, J.; He, R. Potential Step for Double-Layer Capacitances Obeying the Power Law. ACS Omega 2020, 5, 7497–7502. [Google Scholar] [CrossRef] [PubMed]
- Hou, Y.; Aoki, K.J.; Chen, T.N.J. Invariance of Double Layer Capacitance to Polarized Potential in Halide Solutions. Univers. J. Chem. 2013, 1, 162–169. [Google Scholar] [CrossRef]
- Matsuda, H.; Ayabe, Y.; Elekt, Z. The theory of the cathode-ray polarography of Randles-Sevcik. Phys. Chem. 1955, 59, 494–503. [Google Scholar]
- M. Abramowitz and I. A. Stegun, Handbook of mathematical functions, National Bureau of Standards, Applied Mathematics Series - 55, Tenth Printing,1972, Eq. (6.2.1). p. 257.
- M. Abramowitz and I. A. Stegun, Handbook of mathematical functions, National Bureau of Standards, Applied Mathematics Series - 55, Tenth Printing,1972, p. 257, Eq. (6.1.35).
- Osteryoung, R.A.; Osteryoung, J.; Albery, W.J.; Rogers, G.T. Pulse voltammetric methods of analysis. Phisl. Trans. R. Lond. A 1981, 302, 315–326. [Google Scholar] [CrossRef]
- Lovrić, M.; Osteryoung, J. Theory of differential normal pulse voltammetry. Electrochimica Acta 1982, 27, 963–968. [Google Scholar] [CrossRef]
- Stojek, Z. Pulse Voltammetry. In Electroanalytical Methods; Springer: Berlin/Heidelberg, Germany, 2005; pp. 99–110. [Google Scholar] [CrossRef]
- Bard, A.J.; Faulkner, L.R. Electrochemical Methods, 2nd ed.; Kohn Wiley & Sons: New York, NY, USA, 2001; pp. 191–192. [Google Scholar]
- Aoki, K.; Honda, K.; Tokuda, K.; Matsuda, H. Voltammetry at microcylinder electrodes. Part II. Chronoamperometry. J. Electroanal. Chem. Interfacial Electrochem. 1985, 186, 79–86. [Google Scholar] [CrossRef]
- M. Abramowitz and I. A. Stegun, Handbook of Mathematical Functions, National Bureau of Standards, Applied Mathematics Series - 55, Eq. (7.1.13), Tenth Printing, 1972, p. 298.
Figure 1.
Illustrations of orientation of solvent dipoles responding to positive voltage at an electrode when (A) the interaction among the dipoles is neglected, (B) it is stronger than the field-orientation energy, (C) it is balanced with the latter energy and thermally fluctuated, and (D) a redox species is oxidized (+) with a help of a counterion (-).
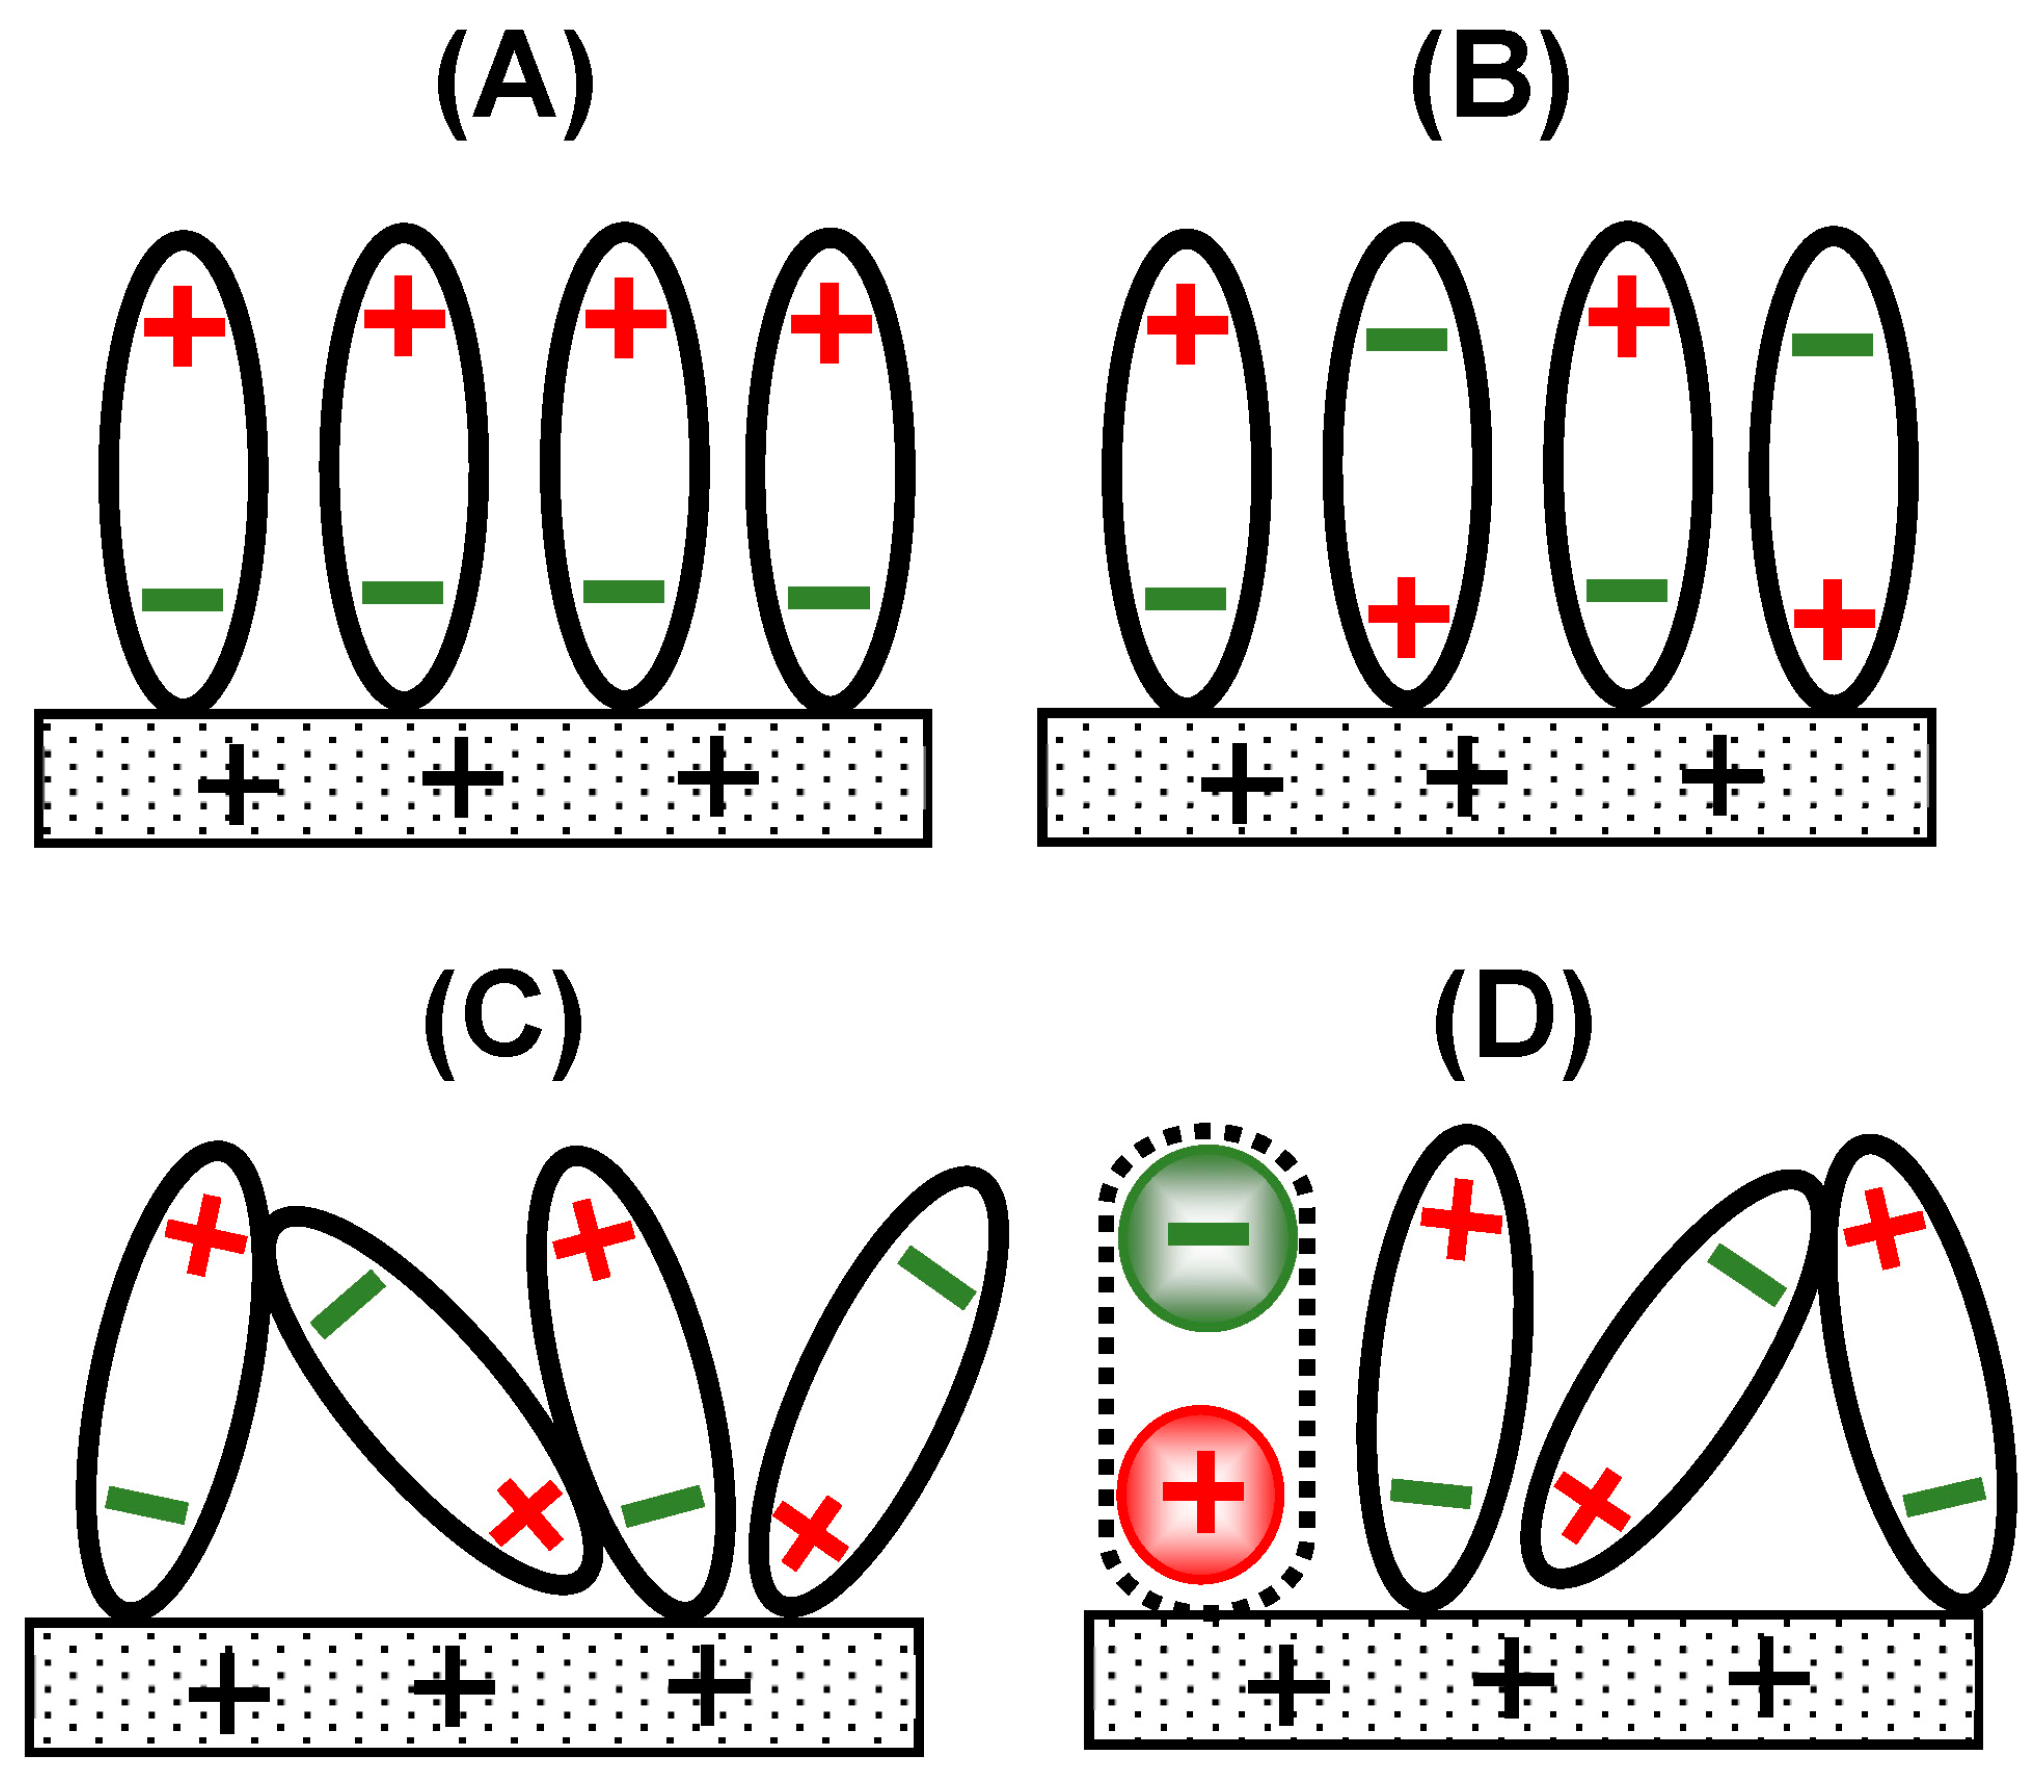
Figure 2.
Arrangements of redox dipoles (black arrows) and solvent ones (blue). Since the dipole interactions are cancelled (a, a’) with the solvent dipoles, the dipole interaction of [A] is the same as of [B]. The activity of [A] is the same as [B]. Dipoles of (b, b’) wok as the DLC.
Figure 2.
Arrangements of redox dipoles (black arrows) and solvent ones (blue). Since the dipole interactions are cancelled (a, a’) with the solvent dipoles, the dipole interaction of [A] is the same as of [B]. The activity of [A] is the same as [B]. Dipoles of (b, b’) wok as the DLC.
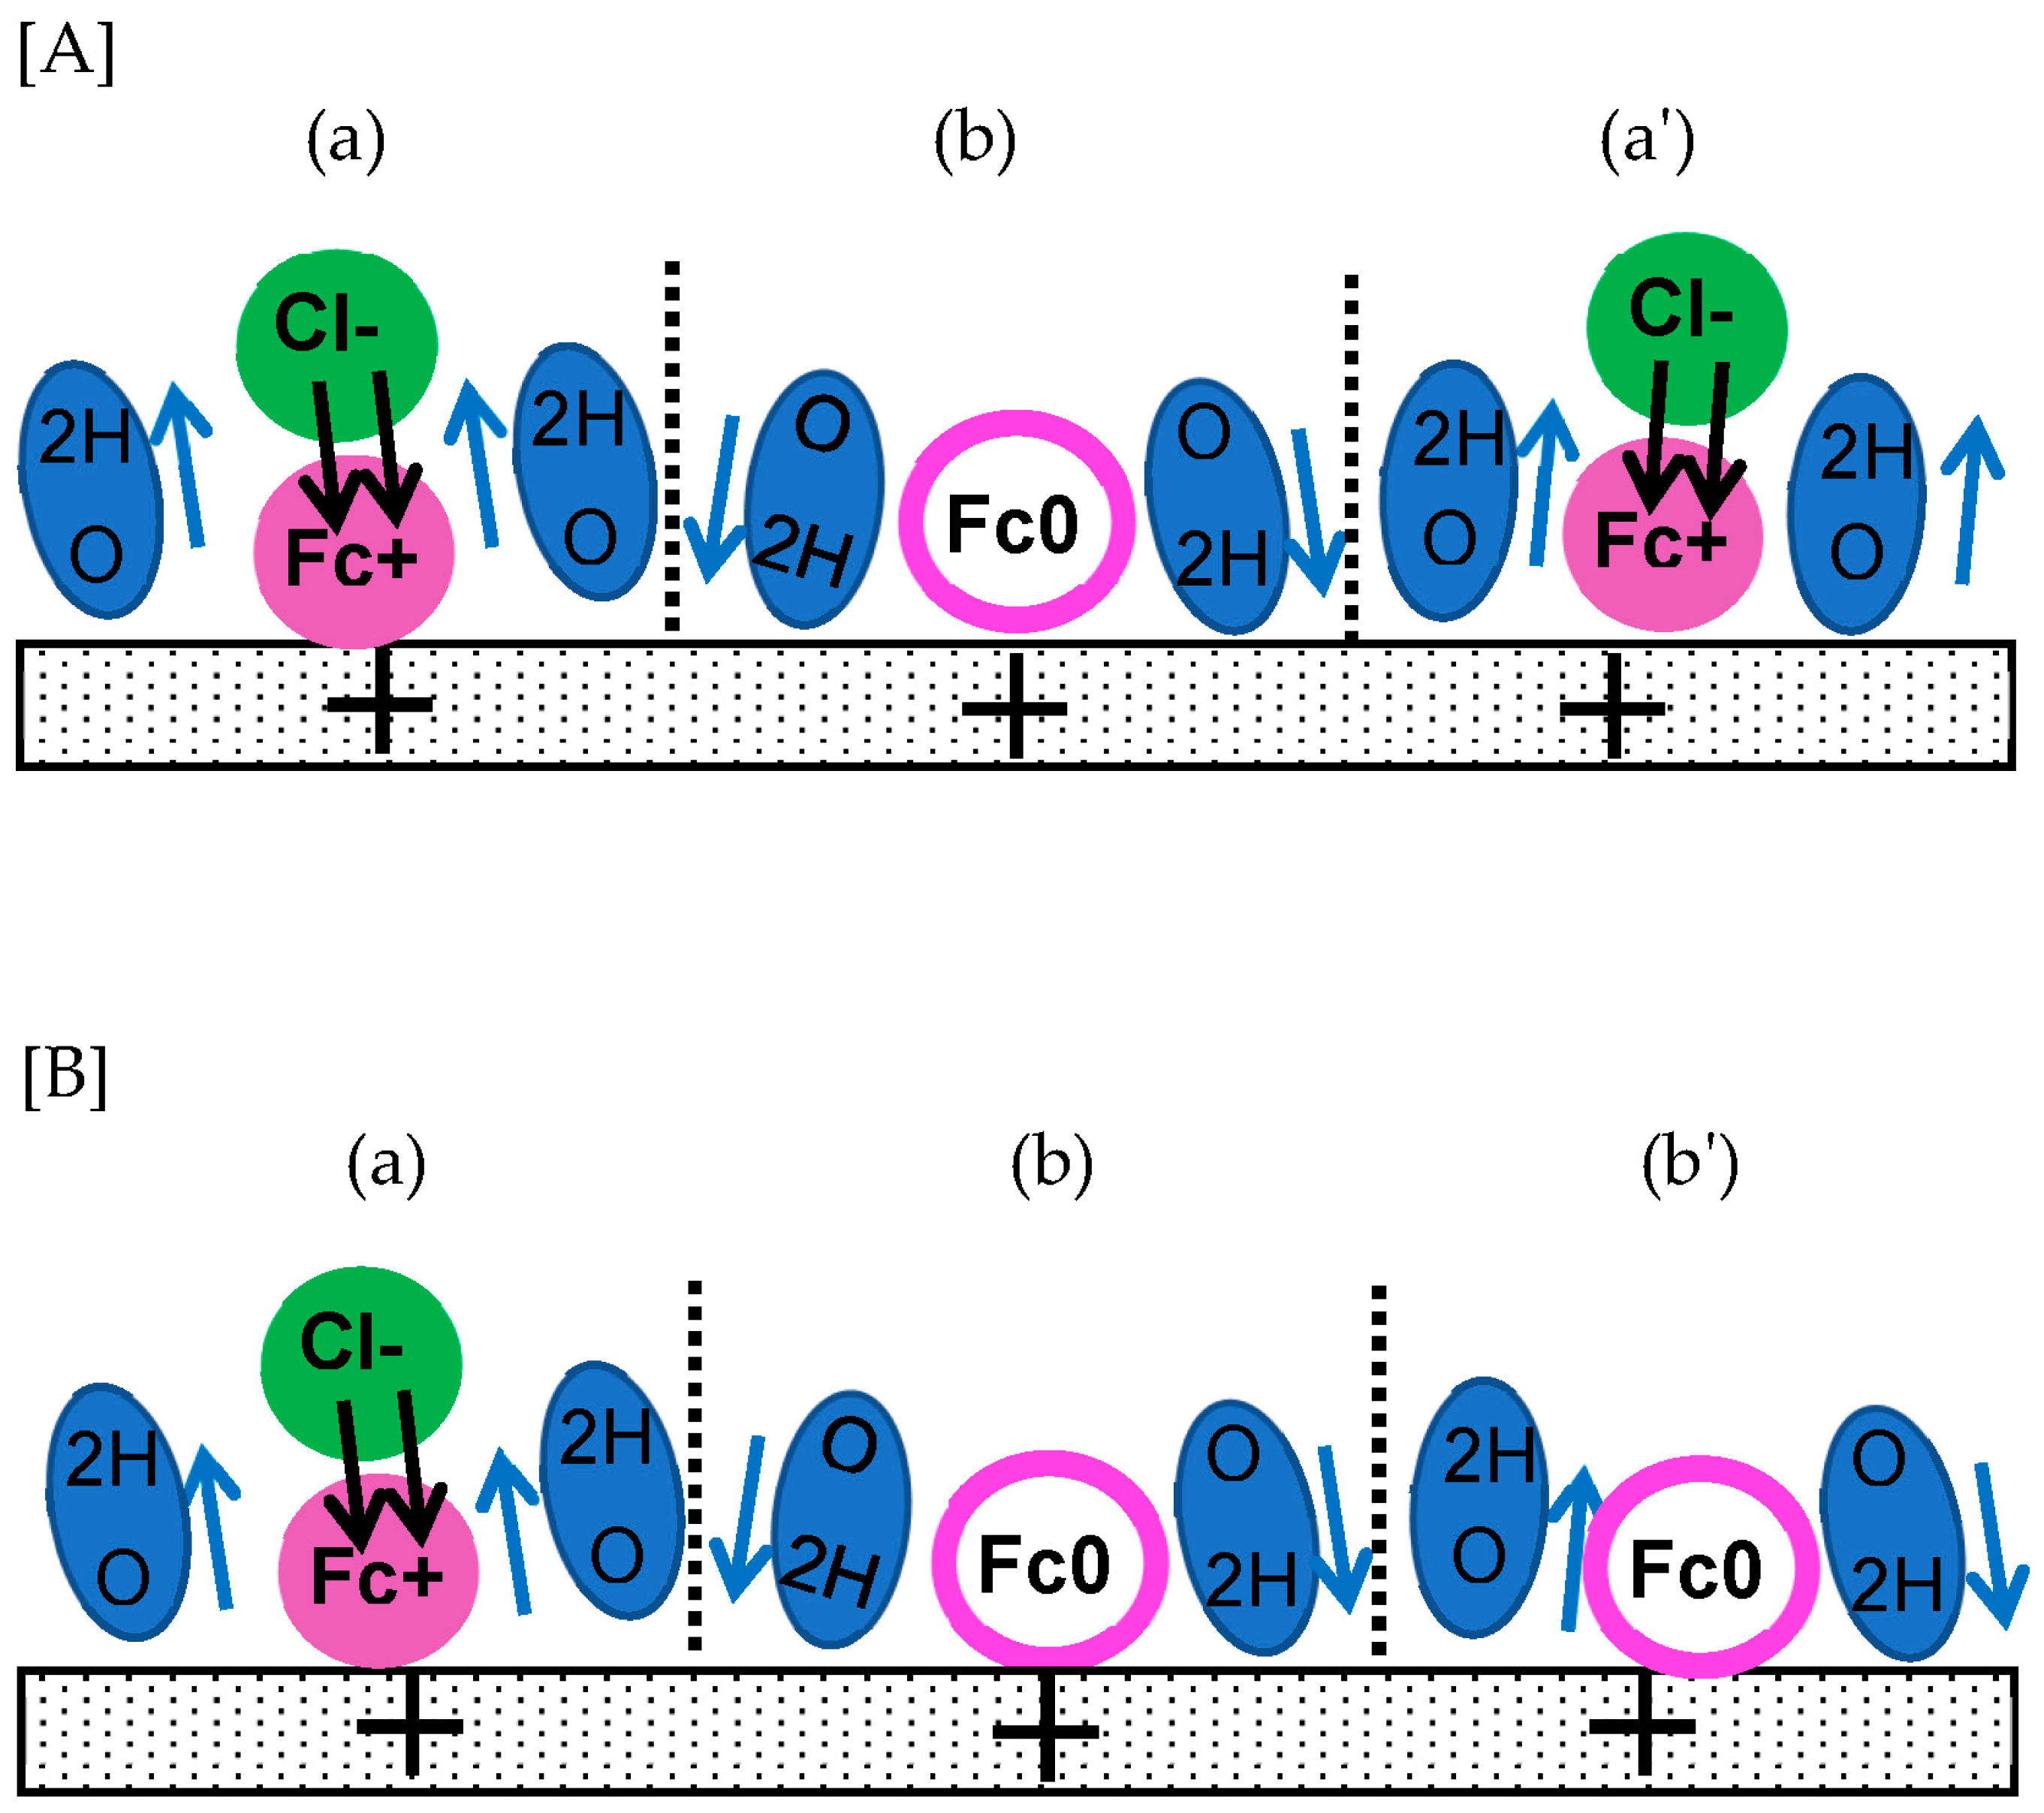
Figure 3.
Chronoamperometric curves (A) and their variations with t-1/2 (B) for (a) IC, (b) IC-IN, (c) Idl, (d) IC-IN+Idl, calculated from Eq. (1), (4) and (5) at c*= 1 mM, D = 0.7’10-5 cm2 s-1, μ = 0.1, λ = 0.1, V = 0.2 V, C1s = 30 μF cm-2, Crx = 70 μF cm-2 and the electrode area 1.77 mm2.
Figure 3.
Chronoamperometric curves (A) and their variations with t-1/2 (B) for (a) IC, (b) IC-IN, (c) Idl, (d) IC-IN+Idl, calculated from Eq. (1), (4) and (5) at c*= 1 mM, D = 0.7’10-5 cm2 s-1, μ = 0.1, λ = 0.1, V = 0.2 V, C1s = 30 μF cm-2, Crx = 70 μF cm-2 and the electrode area 1.77 mm2.
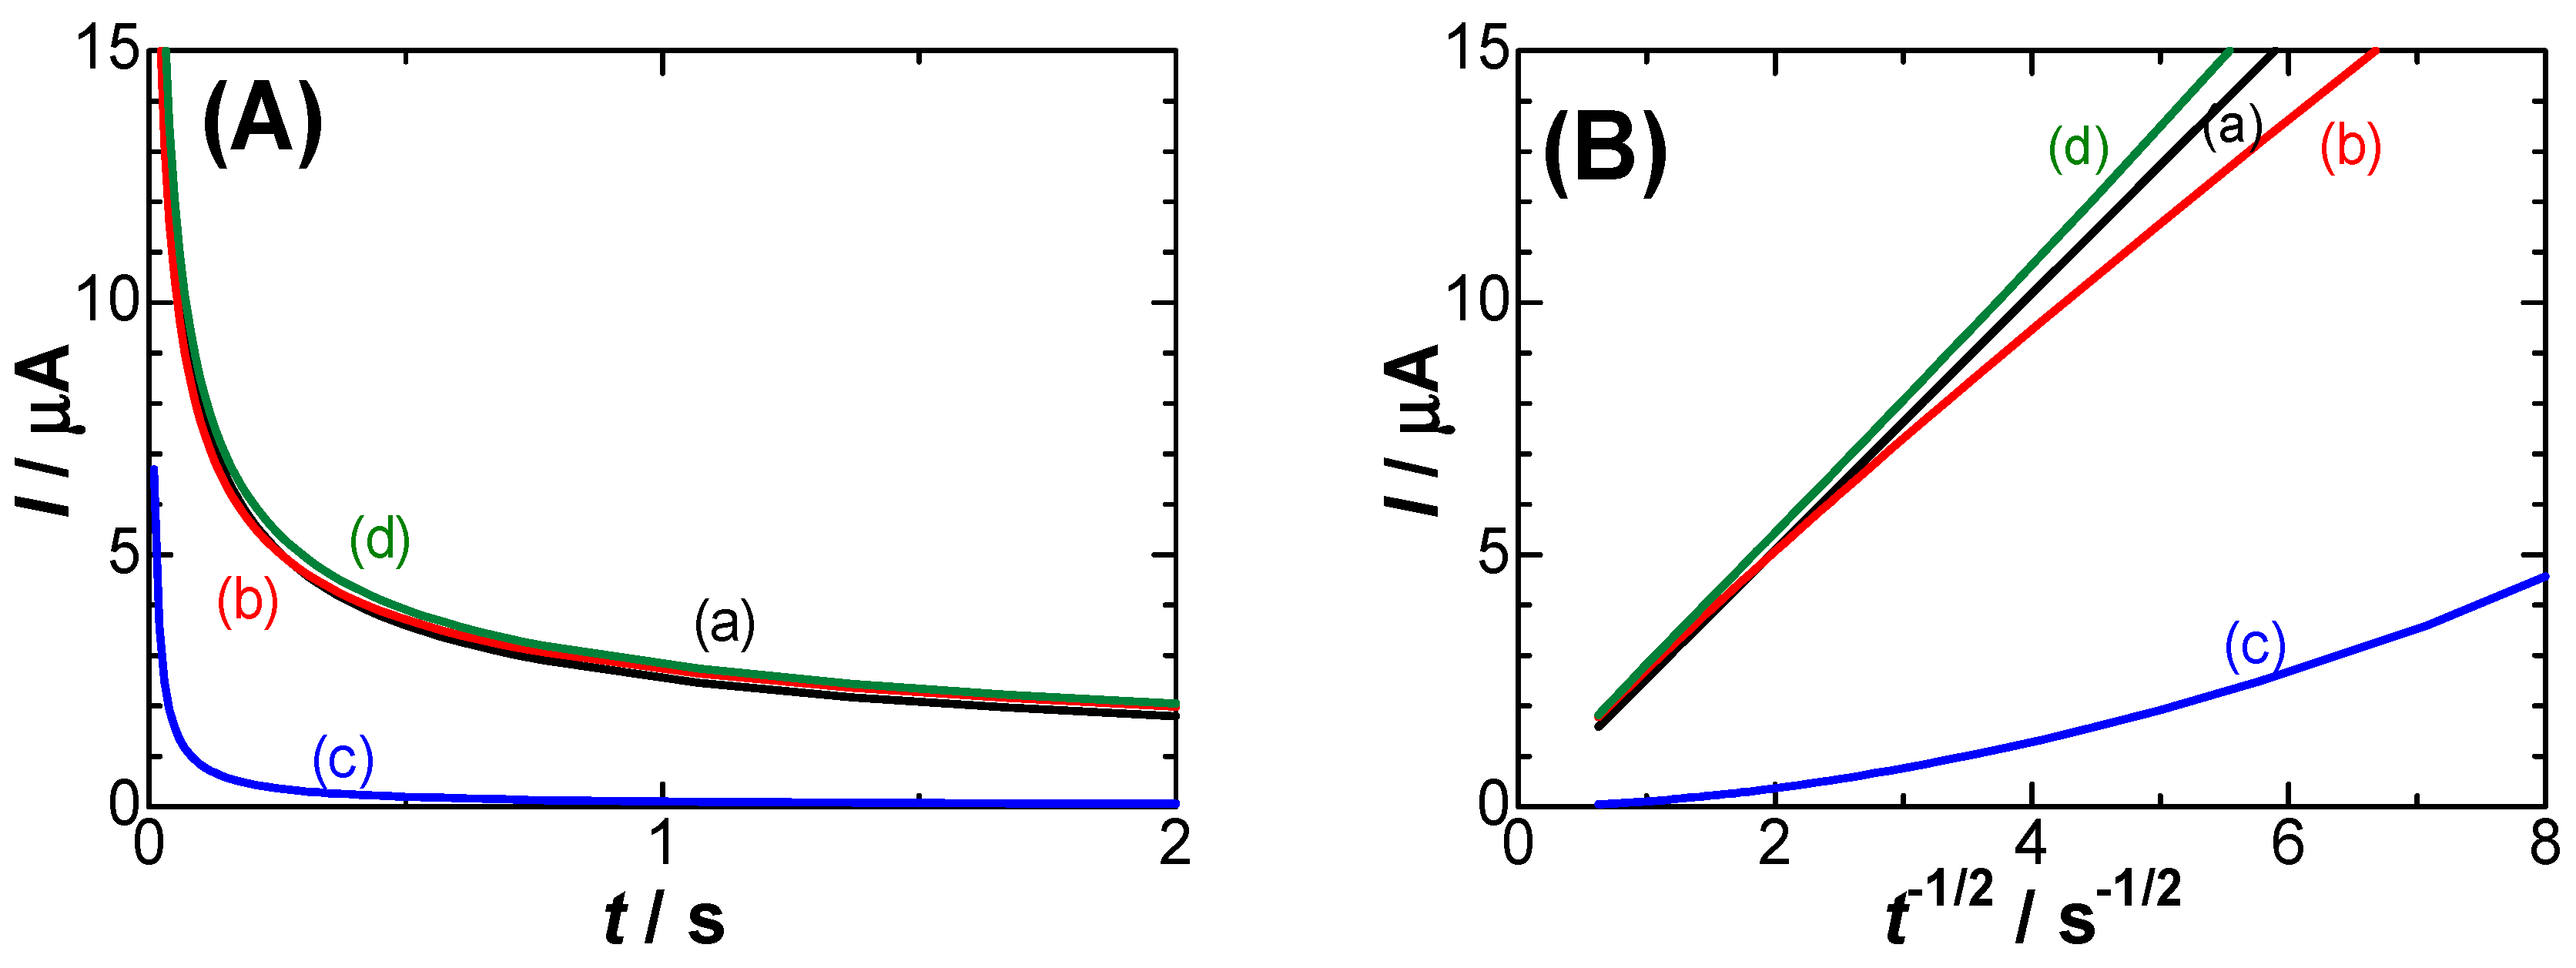
Figure 4.
Variations of (A) IBV (bold solid curves) and IC-IN (dashed ones) with t-1/2 for Edc -Eo = (a) 0.15, (b) 0.05 and (c) 0.0 V, and (B) their logarithmic plots when ko = 0.005 cm s-1, α = β = 0.5.
Figure 4.
Variations of (A) IBV (bold solid curves) and IC-IN (dashed ones) with t-1/2 for Edc -Eo = (a) 0.15, (b) 0.05 and (c) 0.0 V, and (B) their logarithmic plots when ko = 0.005 cm s-1, α = β = 0.5.
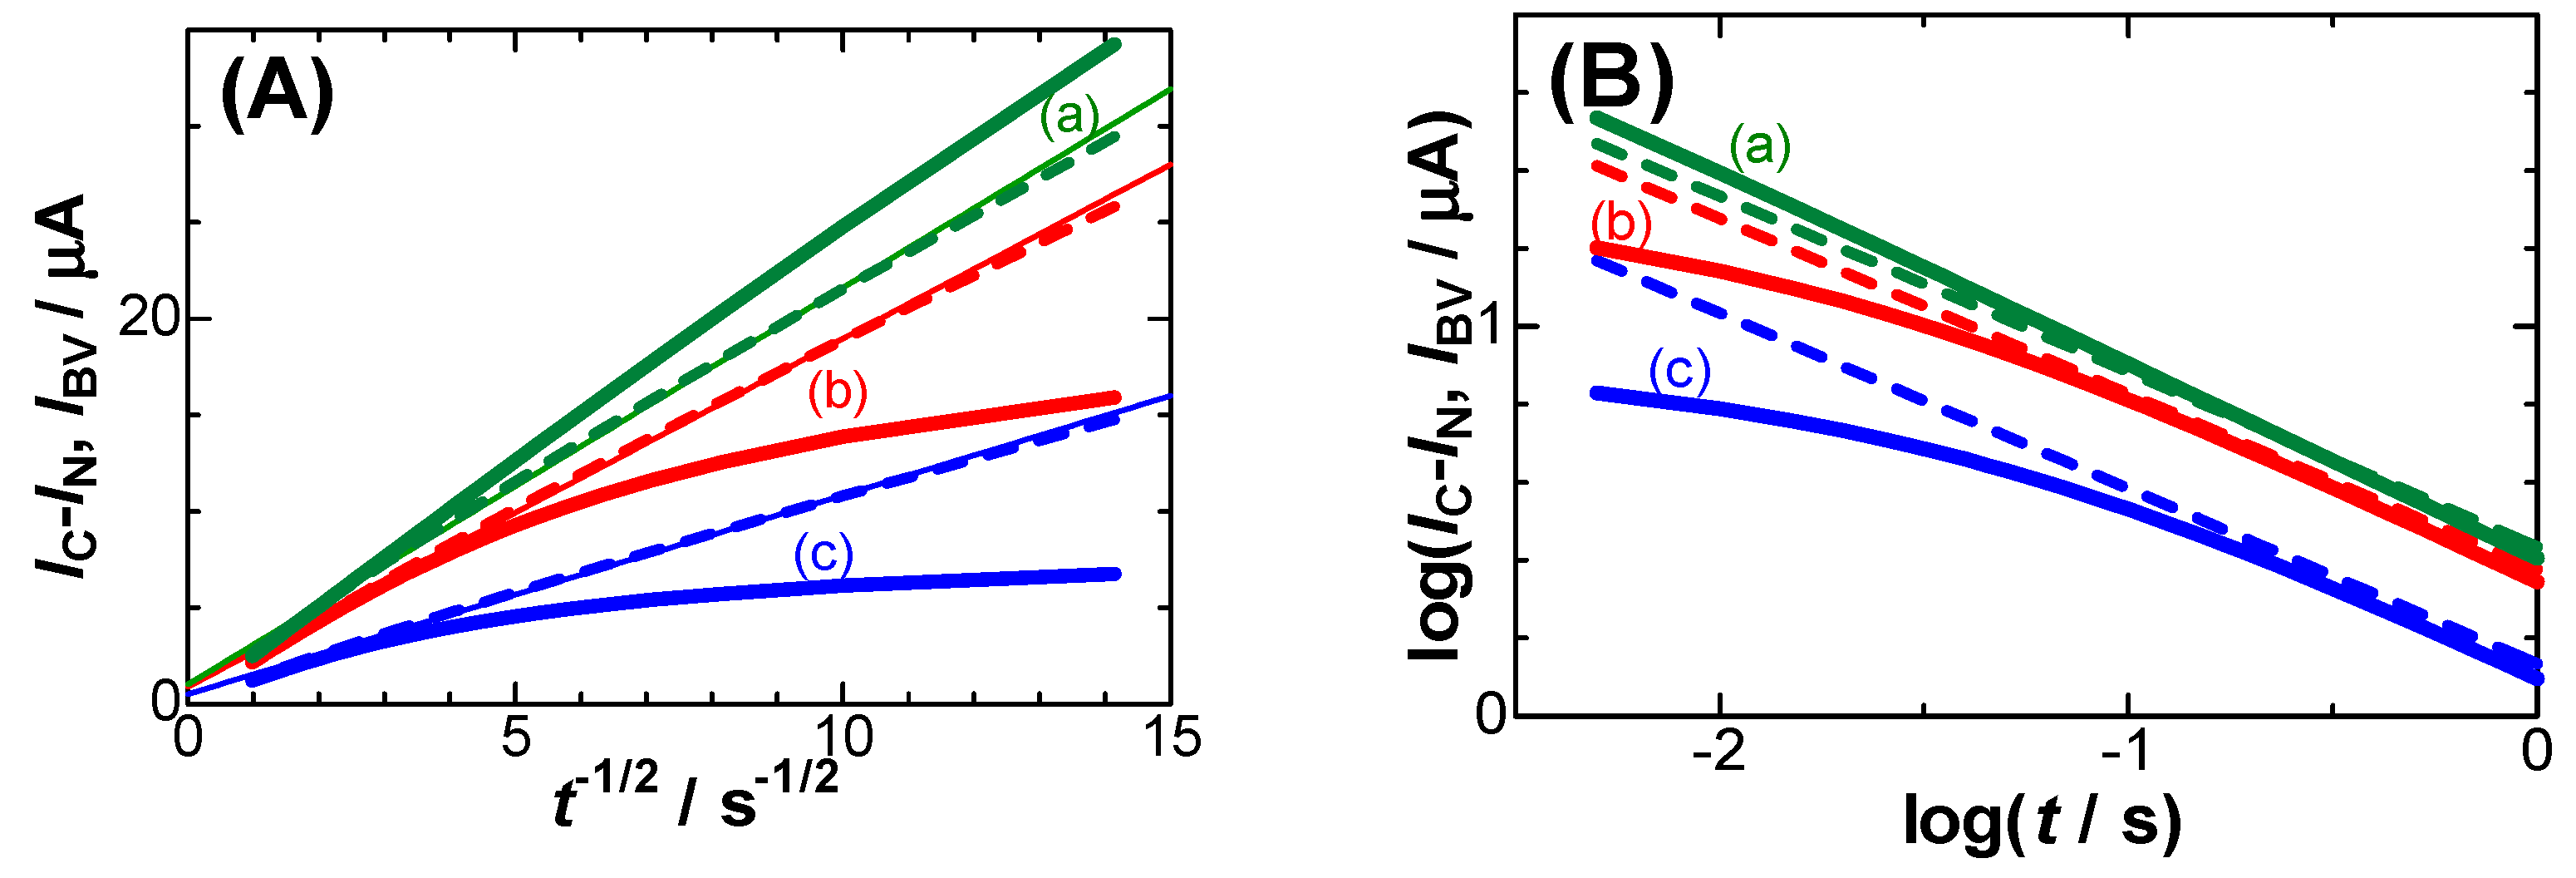
Figure 5.
Cottrell plots of the observed chronoamperograms in the solution of 0.5 M KCl (a) with and (b) without 1 mM FcTMA for the potential stepped from 0.26 V to 0.489 V and of (d) calculated one for D = 0.7×10⁻⁵ cm2s-1. Plots for the subtracted-current against t-1/2 were shown in (c). The inset is current-voltage curve in the solution of 1 mM FcTMA and 0.5 M KCl at the scan rate 0.015 Vs-1. The arrow means that plots (b) follow the right ordinate.
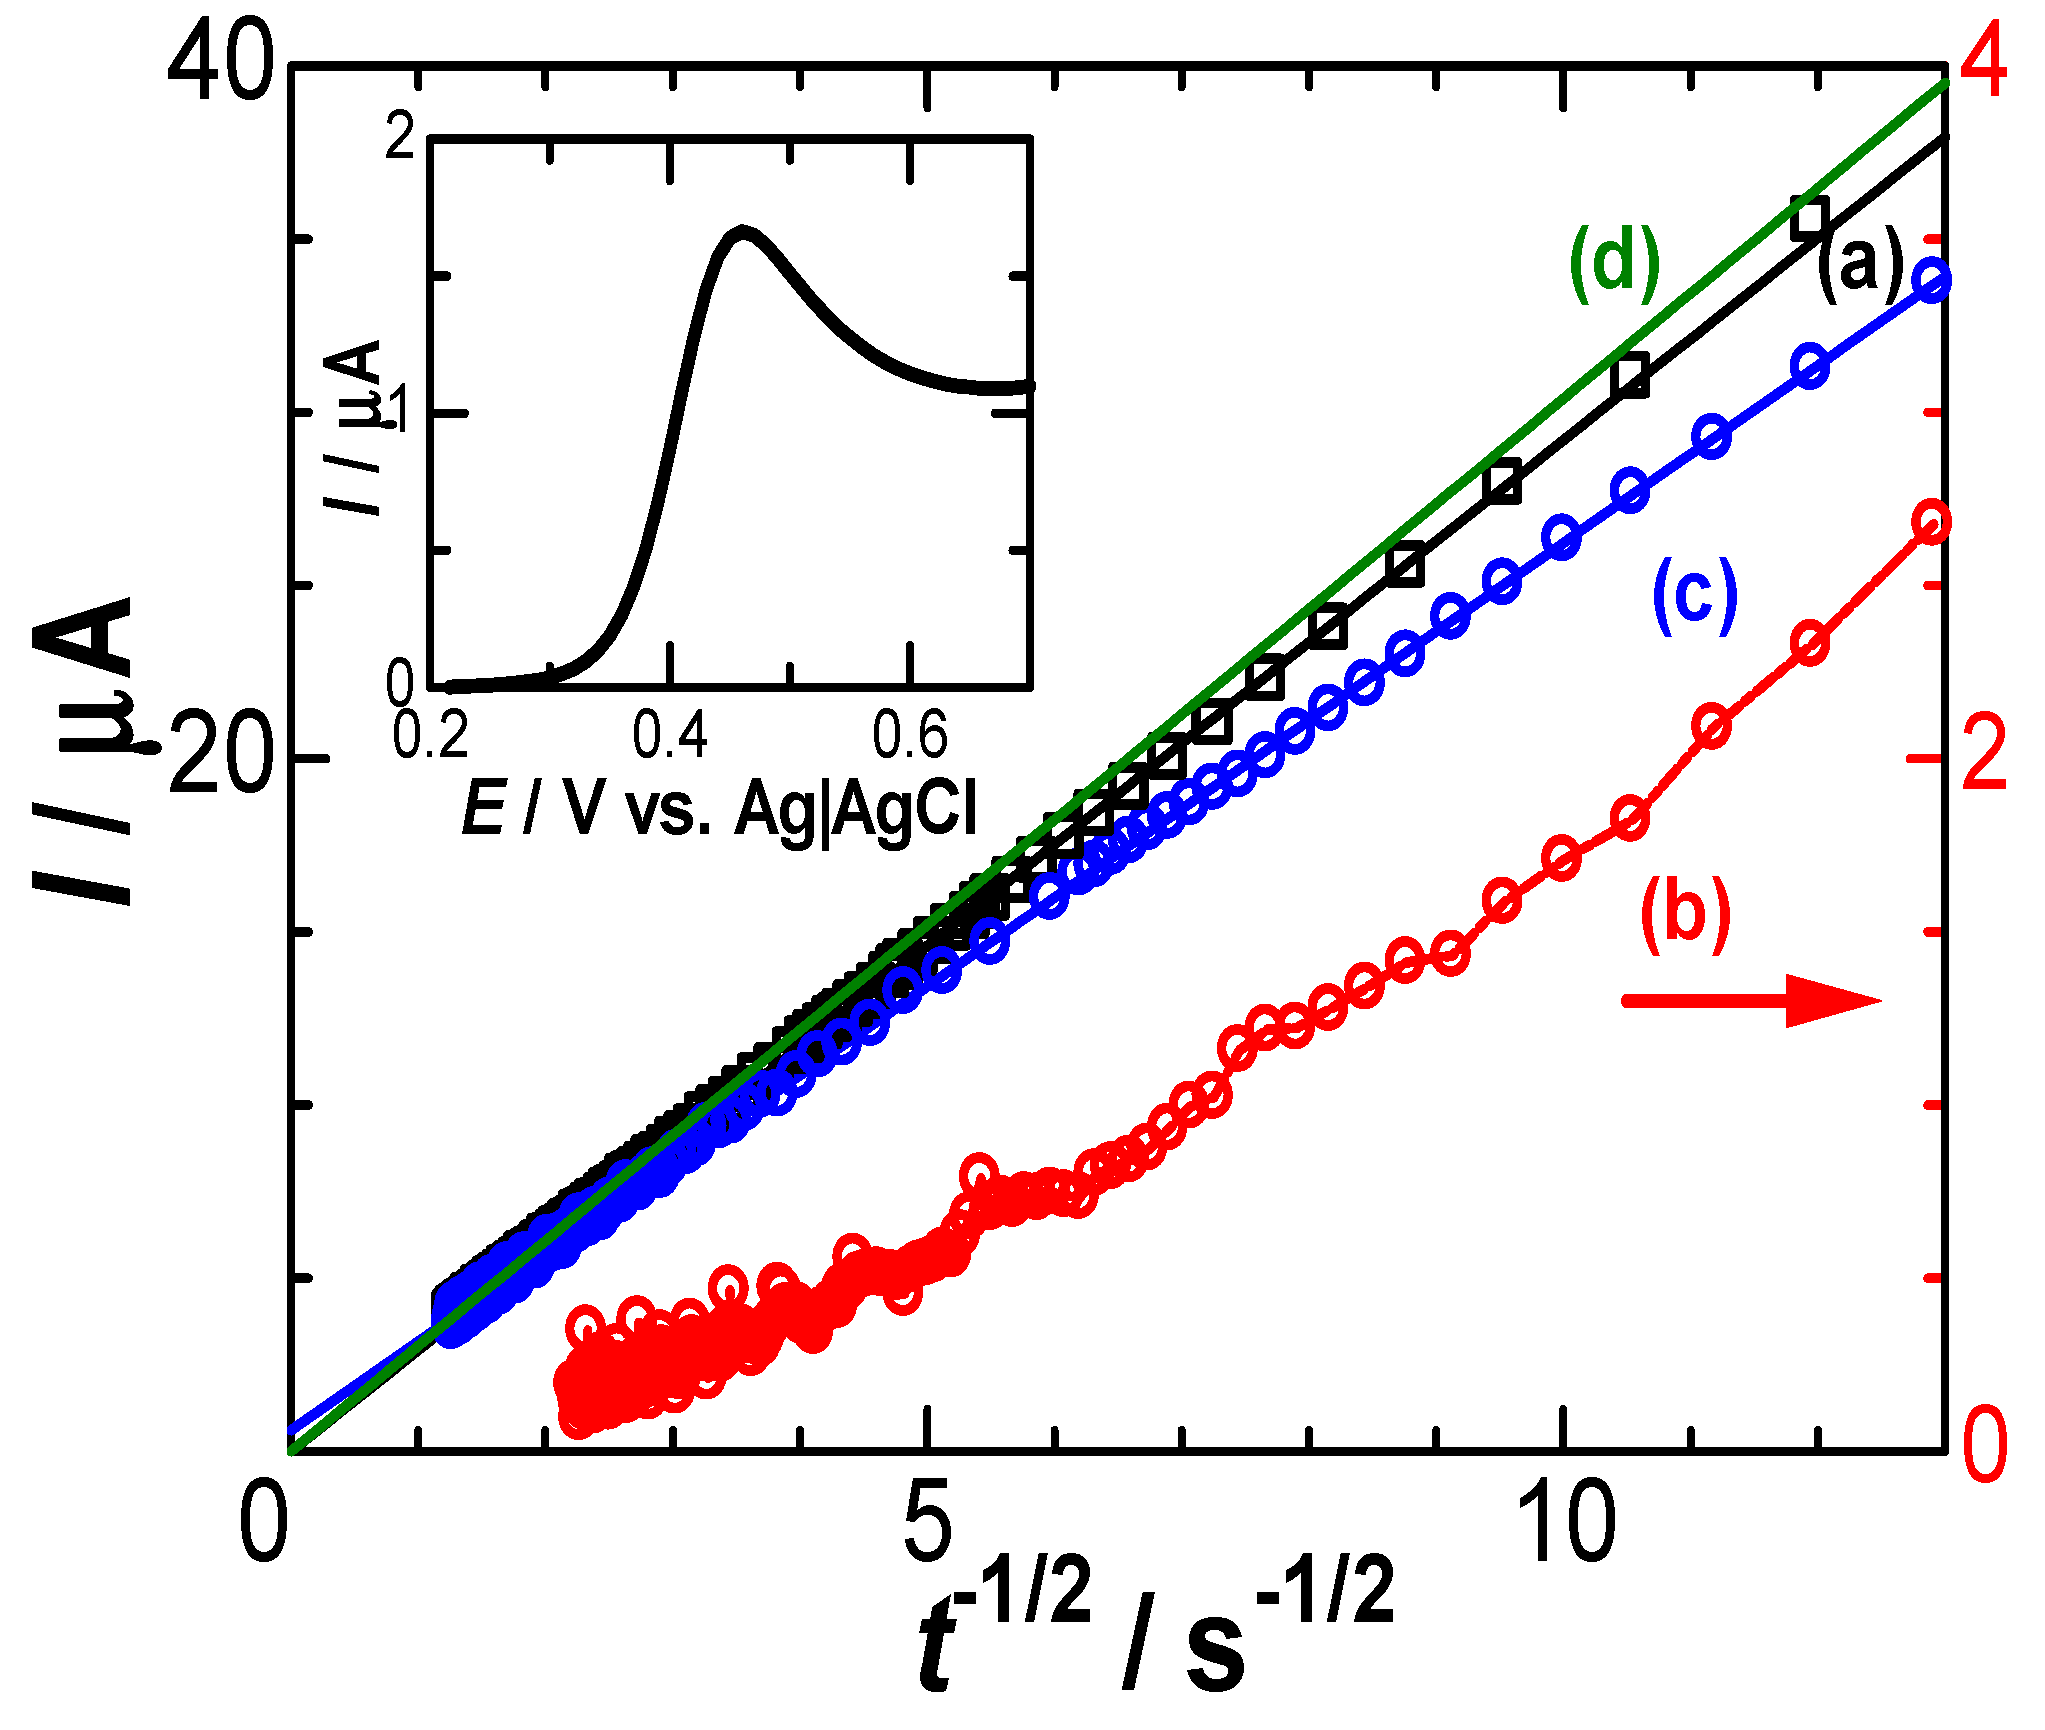
Figure 6.
Logarithmic plots of the negatively capacitive current against time for the current-time curves observed at the stepped potential from 0.26 V to Edc = (a) 0.440 and (b) 0.489 V.
Figure 6.
Logarithmic plots of the negatively capacitive current against time for the current-time curves observed at the stepped potential from 0.26 V to Edc = (a) 0.440 and (b) 0.489 V.
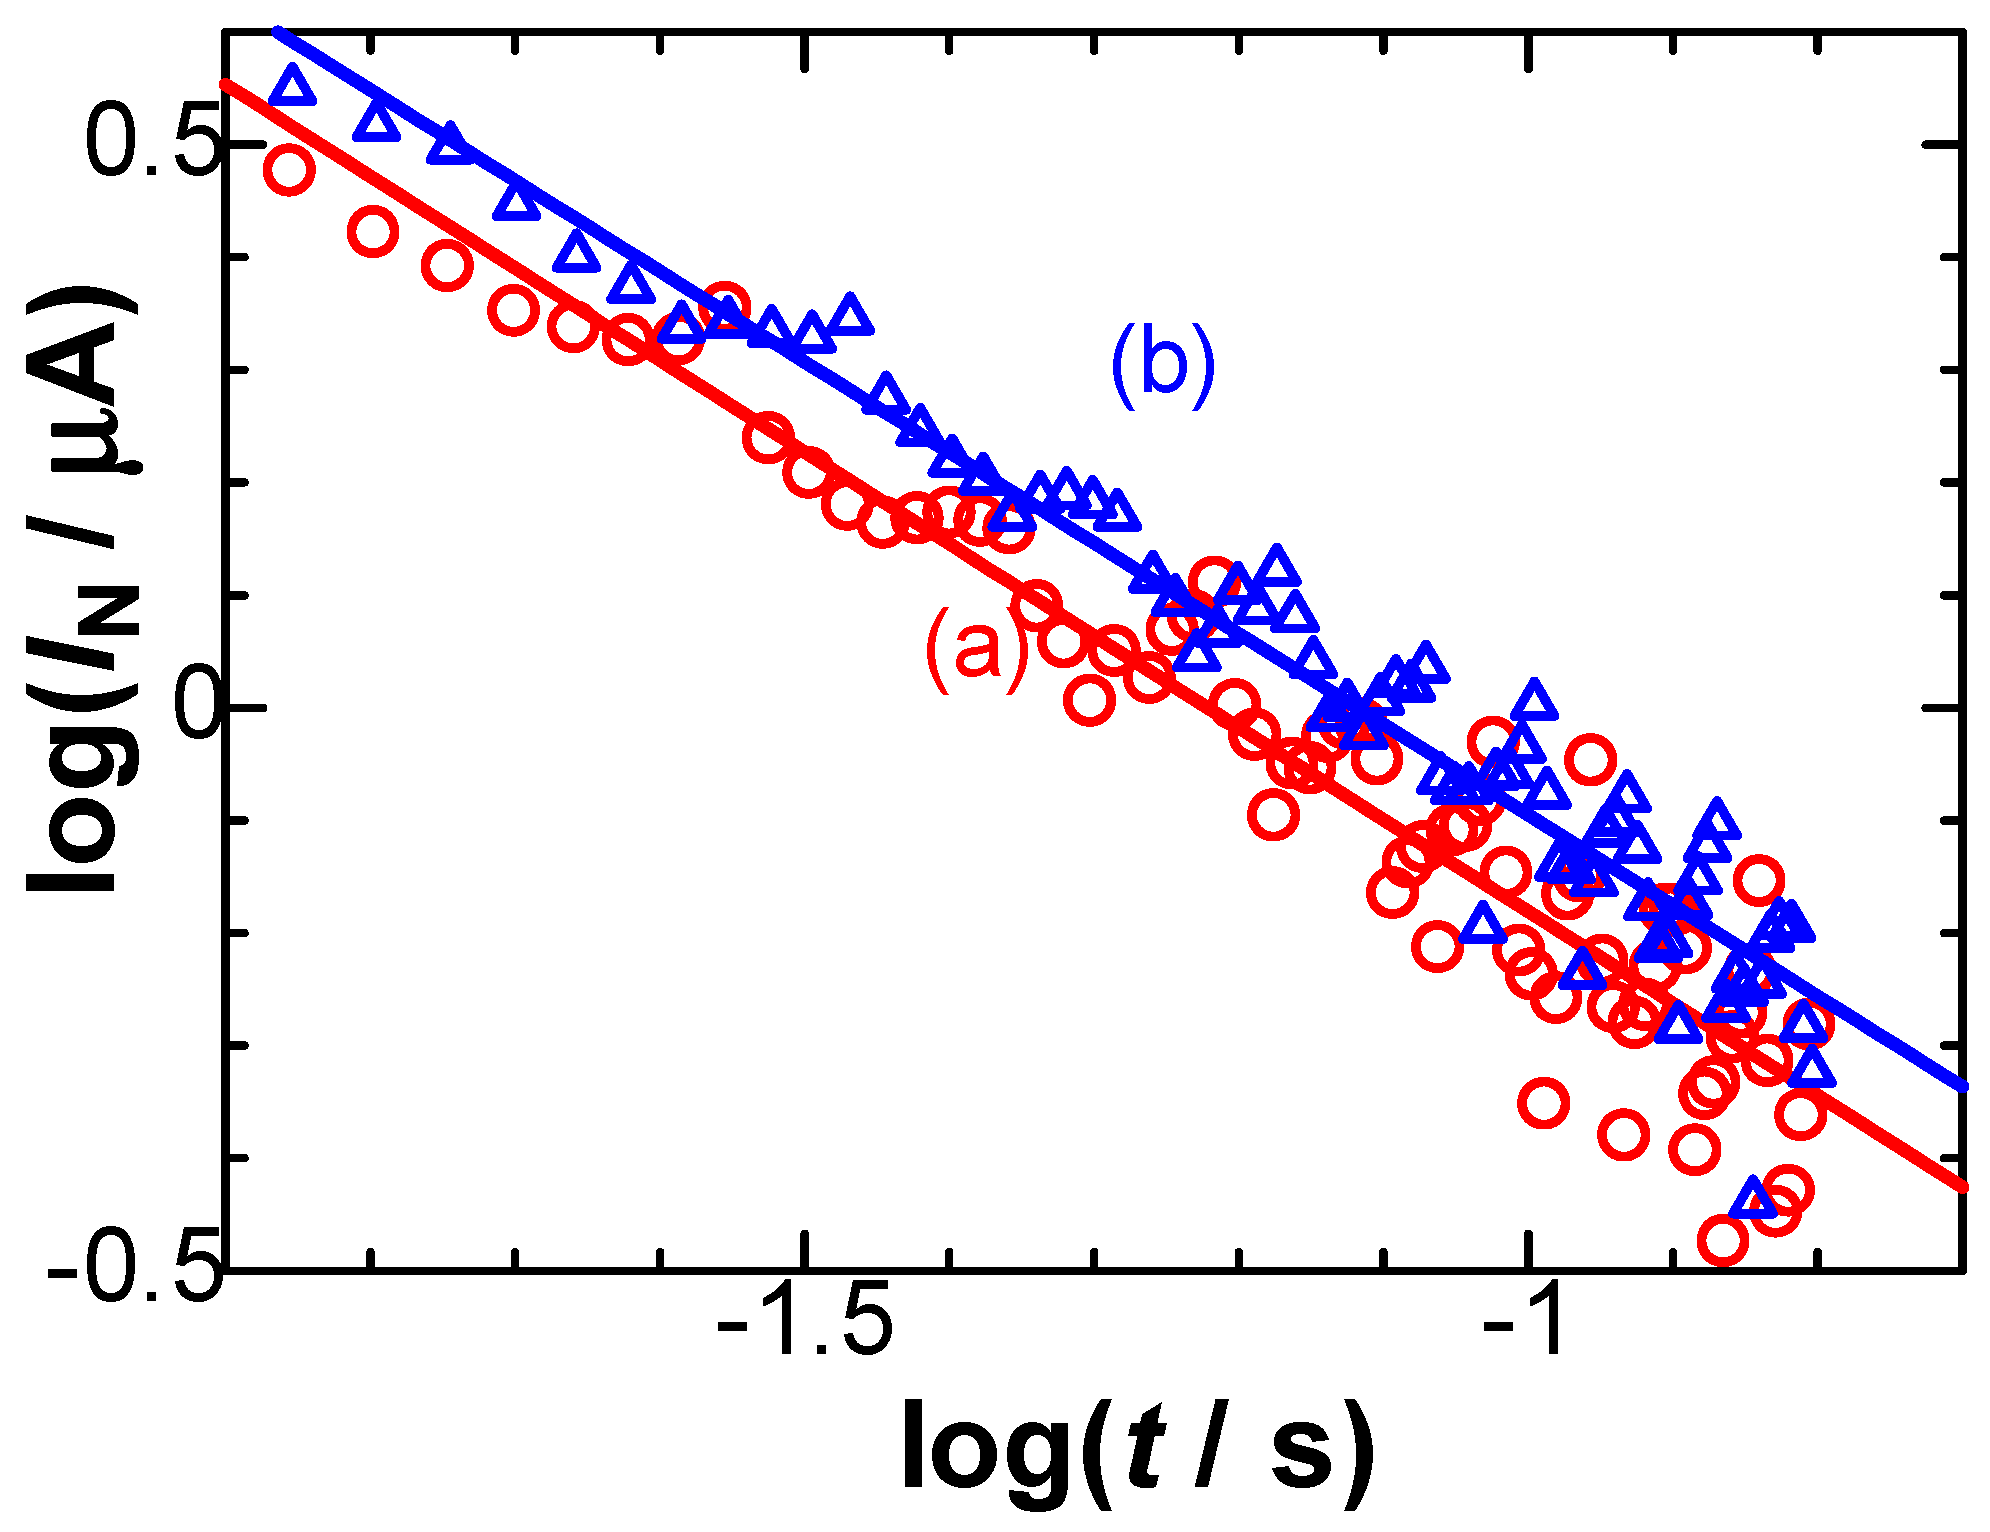
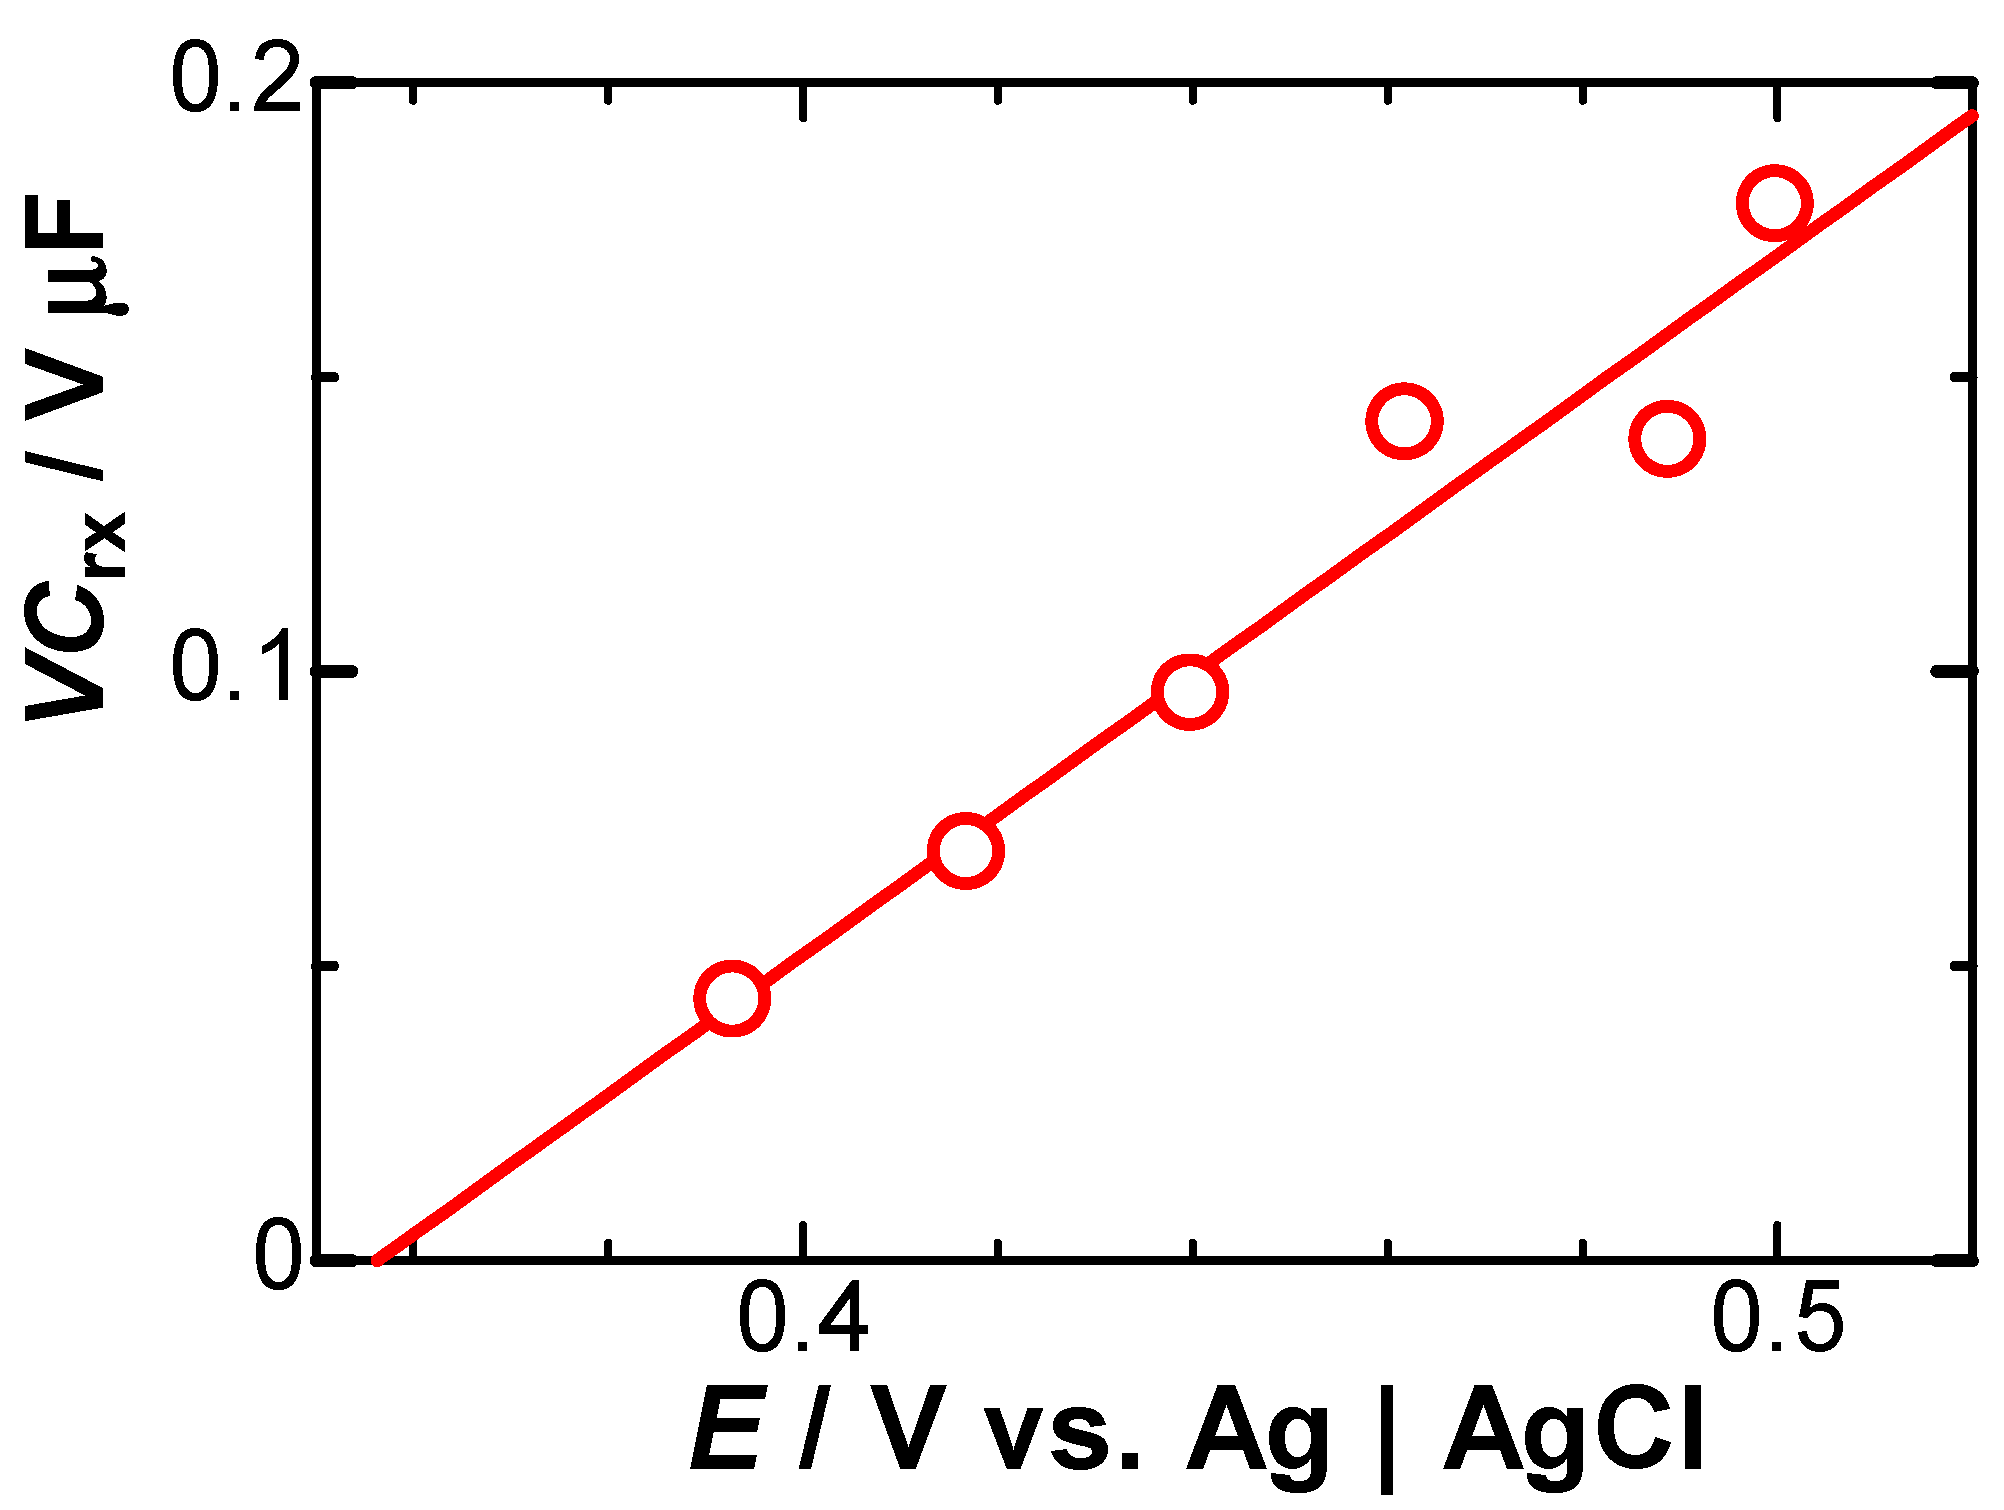
Figure 8.
Time-variation of the concentration on the electrode surface, calculated from Eq. (6) for μ = 0.1, Crx = 67 μF cm-2 and D = 0.7×10⁻⁵ cm2 s-1 at E = 0.489 V vs. Ag|AgCl. The dashed line is the concentration averaged for 0 < t < 0.2 s.
Figure 8.
Time-variation of the concentration on the electrode surface, calculated from Eq. (6) for μ = 0.1, Crx = 67 μF cm-2 and D = 0.7×10⁻⁵ cm2 s-1 at E = 0.489 V vs. Ag|AgCl. The dashed line is the concentration averaged for 0 < t < 0.2 s.
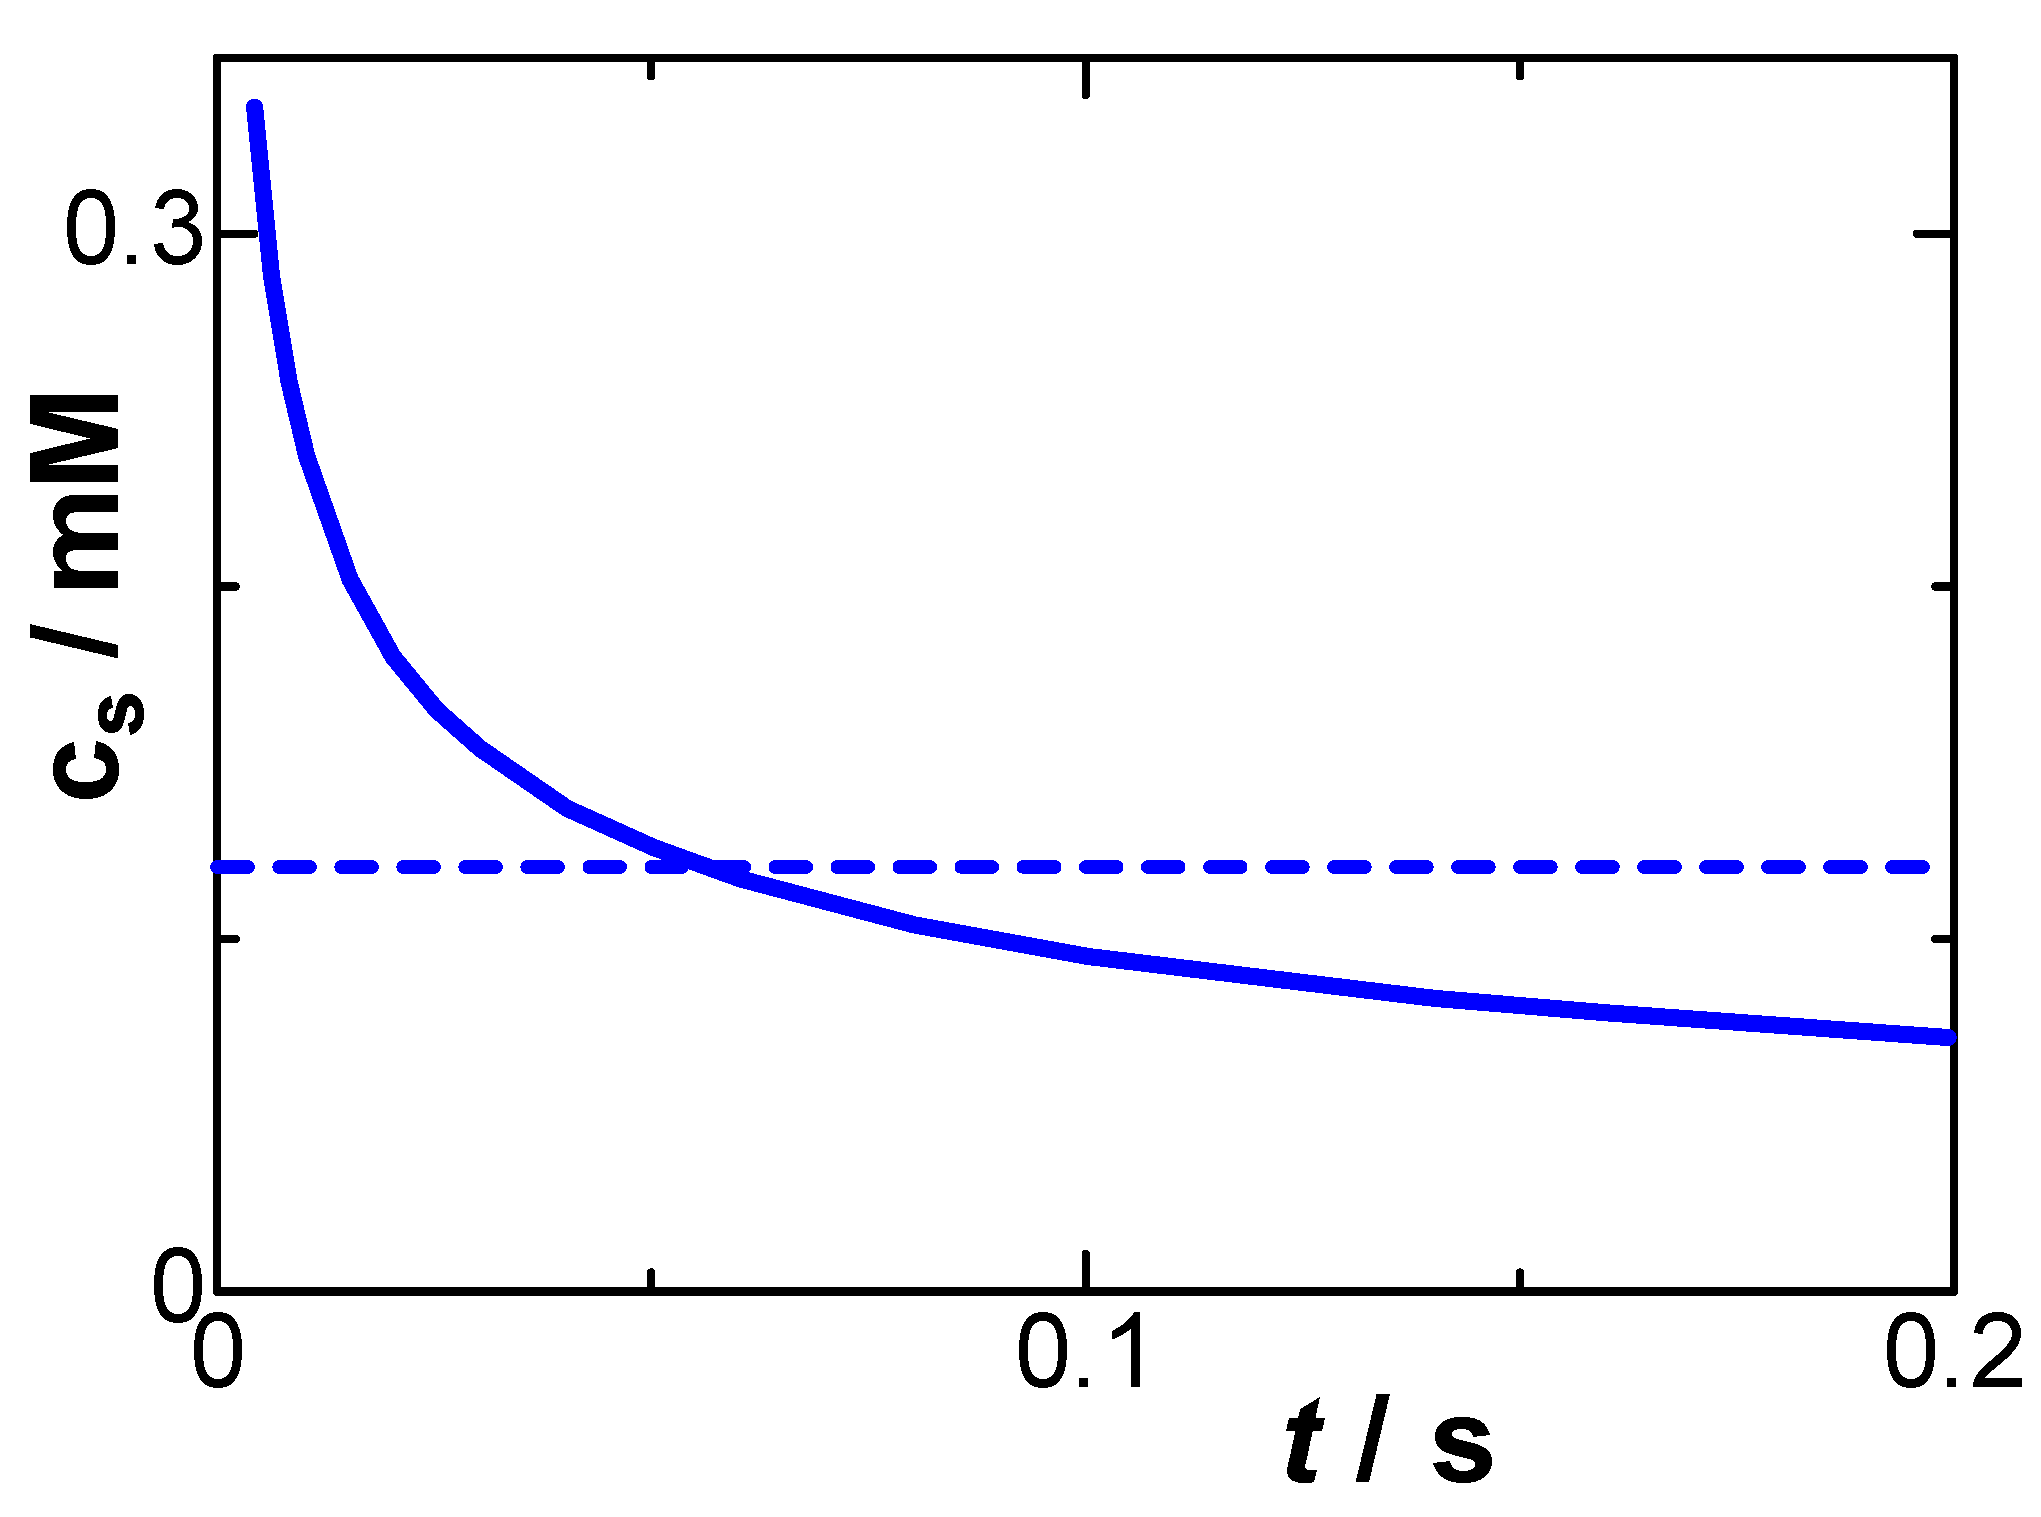
Figure 9.
Plots of y of Eq. (9) against 1/t to determine Λ at E = 0.393 V when the BV kinetics is applied.
Figure 9.
Plots of y of Eq. (9) against 1/t to determine Λ at E = 0.393 V when the BV kinetics is applied.
Disclaimer/Publisher’s Note: The statements, opinions and data contained in all publications are solely those of the individual author(s) and contributor(s) and not of MDPI and/or the editor(s). MDPI and/or the editor(s) disclaim responsibility for any injury to people or property resulting from any ideas, methods, instructions or products referred to in the content. |
© 2023 by the authors. Licensee MDPI, Basel, Switzerland. This article is an open access article distributed under the terms and conditions of the Creative Commons Attribution (CC BY) license (http://creativecommons.org/licenses/by/4.0/).
Copyright: This open access article is published under a Creative Commons CC BY 4.0 license, which permit the free download, distribution, and reuse, provided that the author and preprint are cited in any reuse.


