
Submitted:
17 May 2023
Posted:
18 May 2023
You are already at the latest version
Abstract
Advancements in Parametric Design, Generative Design, and automation in Building Information Modelling (BIM) have opened new opportunities for architects and engineers working on complex buildings, such as offices. These developments allow designers to enhance their designs, increase project efficiency, improve performance, and reduce project time and costs. To address conflicting objectives that arise during the design process, genetic algorithms with multi-objective optimization (MOO) have been employed in architectural design. The GENIUS project aims to optimize building shape, apertures, and shading systems in the concept and design stages, with a focus on energy and daylight performance. The project integrates BIM and visual programming tools with Artificial Intelligence techniques like Genetic Algorithms and RBFOpt model-based optimization. Optimization algorithms are used to identify the best solutions that meet all design objectives, helping architects optimize their designs and achieve desired outcomes. The workflow was tested on a case study of a large office building, with MOO focused on maximizing daylight performance using Spatial Daylight Autonomy metric and minimizing energy consumption using Energy Use Intensity metric. The project provides architects with a method to improve their designs using Algorithm Aided Design tools, which help identify the best solutions for complex design problems.
Keywords:
RBFOpt model-based optimization
; genetic algorithms
; multi-objective optimization
; Energy Use Intensity optimization
; spatial Daylight Autonomy optimization
; office building
; layout optimization
1. Introduction
The integration of Parametric Design, Generative Design, as well as automation in Building Information Modelling (BIM) tools and processes, represents a new development that provides architects and engineers with novel opportunities when working on complex buildings, such as an office building. These advancements enable designers to optimize their designs, increase project efficiency, improve performance, and reduce time and project costs.
This integration can be represented by the Algorithm-Aided Design (AAD) paradigm, that uses algorithms to generate models. AAD describes the complexity of the physical world through numerical and mathematical functions and enables it to explore uncharted territories. By analysing the factors influencing the design project, AAD translates them into data and employs them to inform the design process, optimizing the output based on predefined fitness criteria [1]. AAD offers an advantage in managing and leveraging vast amounts of data that traditional graphic representation cannot handle effectively. The AAD paradigm is based on techniques such as Parametric Design [2], which generates complex geometries using a set of relatively straightforward rules and relationships. Additionally, Generative Design with optimization methods [3] is used in AAD as well, which employs fitness functions to evaluate various performance criteria and guide the search process. This process allows designers to achieve automation in the design process and can be integrated with BIM tools like Autodesk Revit and visual algorithm editors like Grasshopper or Dynamo.
Parametric Design (PD) refers to a process where a design is created using algorithms and mathematical formulas. This approach enables designers to create complex geometries and shapes that may be challenging to achieve manually [4,5]. Additionally, it enables designers to easily update and modify their designs based on changes in the project parameters. There are two key benefits to using the parametric approach in design. Firstly, it simplifies the creation of variations and customized adaptations by exposing the critical parameters that drive these variations, enabling designers to generate different versions automatically by changing these parameters [6]. Secondly, a well-structured parametric model is more flexible and adaptable to change over time, as the design is defined by a set of operations that can be easily modified to accommodate changing conditions, without needing to rebuild the model from scratch every time [7]. Parametric design software has been developed by numerous firms and software developers, including Catia, 3D MAX, 3D Maya, Rhinoceros 3D with Grasshopper, Autodesk Revit with Dynamo, and GenerativeComponents. Among these options, Grasshopper and Dynamo are the most widely utilized software for parametric design due to their provision of multiple plugins in various fields.
Generative Design (GD) takes this a step further, enabling designers to input various parameters, constraints, and objectives into a software program, which then uses algorithms to generate a range of design options. This approach enables designers to explore and iterate many design possibilities quickly, ultimately arriving at the most optimized solution that is further evaluated by the designer in the decision-making process [8,9,10]. GD stands out as a prominent technique that involves the utilization of evolutionary search or optimization algorithms to analyse a parametric design [8]. The primary objective of this technique is to determine the input parameters that best align with a given set of objectives. Subsequently, the system performs the optimization process and provides a collection of the most favourable solutions. In situations where there are multiple objectives, the optimal solutions are several, depending on the amalgamation of objectives that optimizes each result. The collection of optimal solutions offered by the system can be done by using Pareto-based, multi-objective algorithms, which are often Generative Algorithms [11]. In the domain of design optimization, particularly those reliant on computationally intensive simulations such as energy and daylighting simulations of buildings, Radial Basis Function Multi-Objective Optimization (RBFOpt) is a prominent method. Employing advanced machine learning techniques, RBFOpt facilitates the identification of high-performing solutions with minimal function evaluations or simulations [12]. RBFOpt model-based optimization tool aims at architectural design optimization, and it especially applies to problems that involve time-intensive simulations, for instance, daylighting and energy simulations of buildings [12]. This algorithm uses hypervolume as a measure for the volume of the trade-off space covered by a Pareto front [13] to identify the most efficient solutions. Generative Design software has been developed by numerous software developers. We can identify the following main single- and multi-objective optimization plugins for Rhinoceros 3D with a Grasshopper platform: Galapagos, Octopus, Opossum, Wallacei and Optimus. For Autodesk Revit and Dynamo environments, the Generative Design plugin is available.
Besides the notable improvements in terms of process efficiency, the AAD process can also be applied during the conceptual stage of a project to enhance the building's performance. In the case of office buildings, energy efficiency and daylight are the most significant components that need to be considered to create sustainable and energy-efficient architecture. Due to the special need for daylighting in workspaces, it is crucial to emphasize the importance of natural light in promoting a healthy, comfortable, and productive workplace [14,15]. Furthermore, natural daylight has a beneficial impact on people's activities that require concentration [16]. Most countries have implemented regulations that emphasize the significance of ensuring that building interiors receive enough natural light, such as European Standard EN 17037:2022 – Daylight in buildings. In addition, access to sunlight and natural light has a notable impact on different aspects of how a building operates, such as temperature regulation, air conditioning, and the use of artificial lighting [17]. According to [18], lighting energy usage in public and commercial buildings accounts for as much as 40% of the total energy consumption. Proper design of building envelopes and apertures is crucial for overall energy consumption [19]. Effective use of shading systems can help reduce heating and cooling loads [20]. To design buildings that achieve appropriate daylight levels while limiting energy consumption, it is necessary to implement efficient analysis methods and tools from the beginning of the design process. To evaluate the energy performance of buildings, certain building metrics must be used for comparison. The Energy Use Intensity (EUI) is one such standardized metric, measured in kWh/m2/year and calculated by dividing the total energy consumption by the total floor area of the building over a year [21]. Lower EUI values indicate better performance, but there are internal and external factors such as weather, schedules, and building types that may affect energy consumption, resulting in some buildings having a higher EUI than others [21]. To evaluate daylight performance in buildings, the Spatial Daylight Autonomy (sDA) metric is one of the best metrics to describe annual daylight sufficiency in a space [22]. sDA defines how much daylight of the desired illuminance (e.g., 300 lux) is received by the indoor environment during more than half of its occupied hours.
During the design process of buildings, conflicting objectives often arise, such as balancing energy demand reduction with maximizing daylight. Genetic algorithms with multi-objective optimization (MOO) have been frequently employed in architectural design to solve such problems. These algorithms are computational models rooted in evolutionary theory and begin with a population of potential solutions based on randomly selected parameters. With the use of parametric design, it is now possible to simulate numerous potential outcomes more efficiently than before [23]. MOO integrated with energy and daylight simulations is a promising method to study trade-offs. As competing objectives prevent a single best solution, MOO instead seeks to find a group of "Pareto-optimal" solutions that offer the most favourable trade-offs between the competing objectives. One promising method for MOO with time-consuming evaluations is the use of model-based algorithms. These algorithms approximate the shape of fitness landscapes [24], which is a metaphor for the relationships between variables and an objective function. For instance, in the context of building design, fitness landscapes would represent the relationships between a parametric model and its simulated performance in terms of daylighting or energy use. By utilizing statistical and machine learning techniques, model-based algorithms construct increasingly accurate approximations of the fitness landscape during the optimization process, which in turn are employed by MOO algorithms to expedite convergence [12]. RBFOpt, a model-based algorithm that utilizes Radial Basis Functions, has been demonstrated to be efficient and effective in MOO of structural, energy, daylight, and glare simulations. It has surpassed traditional metaheuristics such as genetic algorithms and simulated annealing in terms of performance [24,25]. Additionally, it has also outperformed a hypervolume estimation algorithm for multi-objective optimization, in a problem with competing and costly-to-simulate objectives of annual daylight and glare [11]. RBFMOpt optimizes a sequence of weighted sums by iterating between a surrogate model that represents the fitness landscape of each weighted sum and the actual simulated performance. The optimum of each weighted sum corresponds to a point on the Pareto front [12]. RBFMOpt has demonstrated remarkable performance on mathematical test functions when compared to other algorithms such as Nondominated Sorting Genetic Algorithm-II (NSGA-II) [26] and Multi-Objective Evolutionary Algorithm based on Decomposition (MOEA/D) [27,28].
2. Related Work
The GENIUS algorithm optimizes building shape, apertures, and shading systems in the early design phase by minimizing energy demand and maximizing natural daylight. The optimization algorithm identifies the fittest solution, which is then used for further design refinement. This involves determining the best desk layout in places with good natural light and creating office spaces with rooms in areas with less daylight. The goal is to create a workspace that maximizes the use of natural light while minimizing energy consumption, resulting in a sustainable and comfortable environment for building occupants.
The application of MOO to solving complex design problems is well-known and used in architecture. Recent studies have focused on the parametric optimization approach to daylight and energy performance in different non-residential building types [29,30,31,32,33]. These studies indicate that optimization algorithms and simulation can be adopted to find the best building designs by modifying design parameters. Toutou [29] used MOO to define the most appropriate shape of the plane and building configurations that optimize daylight performance and reduce energy consumption in office tower buildings. A case study of a hospital building in Algeria [30] demonstrated how the implementation of parametric design with evolutionary algorithms can be considered a reliable strategy to reach optimum solutions to building performance problems in the early design stage. The results of this study revealed that the adaptive façade system can improve daylight and energy performance simultaneously compared to the conventional shading system. Zhang et al. [31] conducted a study in a school building in China, where they used a MOO approach to find the optimal trade-off between minimizing energy use for heating and lighting, reducing summer discomfort time, and maximizing the Useful Daylight Illuminance (UDI). The results of the study indicate that the energy demand for heating and lighting can be reduced by 24–28% and summer thermal discomfort by 9–23% while the UDI can simultaneously increase by 15–63%. Hinkle et al. [32] conducted research using a parametric approach and optimization studies on building façade design aimed at improving energy efficiency. They found that using dynamic material optimization saved energy by up to 19%. Elghandour et al. [33] proposed a parametric approach for a façade's skin design to enhance the indoor distribution of daylight by achieving the requirements of daylight metrics of both LEED V4 and IES metrics. Sun et al. [34] investigated the MOO approach integrated with an artificial neural network (ANN) to optimize the EUI, sDA, UDI and Building Envelope Cost of a public library building. Through the integration of ANN, the optimization time was notably reduced. De Luca and Wortmann [12] performed a MOO to analyse the balance between maximizing natural daylight and minimizing overall energy consumption in the TalTech hall building, and they assessed the effectiveness of various MOO algorithms.
Building shape and space planning should be considered for the optimization of daylight and energy performance. Many researchers have shown that space layouts can have a significant impact on the improvement of energy performance [35,36,37,38]. Moreover, having a compact building shape is important to reduce the expenses and energy usage related to heating and cooling a building. However, an excessively compact building can compromise both architectural integrity and natural daylight utilization, resulting in a significant increase in electricity consumption, particularly in office buildings [39]. Catalina et al.'s study [39] revealed that a rectangular shape provides over 30% better lighting and visual comfort than a cubical shape, and a more compact shape can reduce heating demand by 6-10%. The combination of the automatic generation of space layout and the optimization of energy performance is expected to be a powerful approach for the development of an energy-efficient design in the early design phase. A comprehensive historical overview of the evolution of automated methods for space planning in architecture, with a particular focus on the utilization of genetic algorithms, is presented in [40]. Nagy et al. [41] presented a flexible workflow for generative design applied to architectural space planning. They presented six objectives (adjacency preference, work style preference, buzz, productivity, daylight, and views-to-outside) to evaluate office layout designs based on architectural performance and worker preferences. A multi-objective genetic algorithm was used to search for optimal designs, aided by visualization tools for design selection. Cheng et al. [42] proposed a design loop for optimizing building sustainability through a parametric virtual design approach. The methodology involves the automated linkage of architectural models with sustainability assessment tools and optimization through a genetic algorithm, demonstrating a fully automated design-through-analysis-optimization workflow. Autodesk University presented the project [43] that demonstrates the utilization of algorithms to perform parametric studies on the generative space plan and optimize the automatic generation of a 3D BIM model. Through macro and micro generation, various options for flow optimization of people and goods in a pharmacy were evaluated while conducting qualitative and logistic analyses. The outcome of this project was an enhanced architectural configuration for the hospital pharmacy, resulting in an improved working environment.
Many researchers in the field of architecture have adopted MOO to address complex design problems, particularly those concerning energy efficiency and daylight performance. However, the workflows proposed in these studies do not always utilize BIM models and do not typically employ the optimized solution for the automatic generation of office layouts. Additionally, the impact of building shape and shading systems on office buildings has not been extensively studied. This article proposes a BIM-to-BIM workflow that identifies the optimal solution for energy and daylight performance using Honeybee and Ladybug tools for Grasshopper, which can then be used to design office layouts that ensure sufficient natural light according to the EN 17037:2022 standard.
3. Methodology
3.1. The GENIUS project
The GENIUS project aims to identify the most appropriate solution for optimizing office space and desk layouts while considering both building daylight and energy performance. The algorithm will evaluate multiple variables and criteria to generate the most effective solution for maximizing natural light and energy efficiency, as well as optimizing office space and desk layout. By employing this workflow, the resulting design will provide an environmentally sustainable and comfortable workspace for building occupants.
The main objective of this study is to create an AAD workflow using a multi-objective algorithm approach. This BIM-to-BIM workflow involves generating an original office-building concept in BIM software and optimizing it using the RBFOpt model-based optimization tool in the Grasshopper platform. The optimized solutions are analysed by a designer using the PowerBI tool. The best solution is recreated by the algorithm and then automatically transferred back to the BIM software, where the office layout can be optimized using Dynamo and Generative Design tools.
The GENIUS algorithm can provide support to designers by enabling:
- Building design that allows for the creation of parametrically different building shapes by varying their dimensions and configurations while keeping the area fixed.
- Energy and daylight simulations and optimization with a focus on Energy Use Intensity, Daylight Autonomy, and Spatial Daylight Autonomy.
- Office design that optimizes room layouts in areas with poor daylight and desk layouts in areas with optimal illuminance levels.
- Data analytics that allow for the analysis of data from optimization studies directly in Power BI.
- The GENIUS algorithm can be applied in both the concept and design phases. In the concept design phase, it can be used to:
- Optimize building layouts while considering energy and daylight performance.
- Optimize window and shading designs as well as Window-Wall Ratio (WWR) while considering energy and daylight performance.
- Define the best room and/or desk layout configuration in the office based on daylight simulations.
- In the design phase, it can be used by designers to:
- Validate the energy and daylight performance of the office arrangement.
- Define the best desk layout configuration in areas with good illuminance, considering the surrounding office space (existing rooms).
3.2. Design process and workflow
This paper presents a two-phase AAD approach to the sustainable building design process. In the first phase (as shown in Figure 1), this approach involves extracting information from an architectural BIM model, performing automated optimization of building sustainability in terms of daylight and energy performance, evaluating data through interactive data visualization, and creating the optimized solution as a new BIM model using Revit-aware components that can create native Revit elements.
In the second phase (as shown in Figure 2), the process involves using a Dynamo platform to accelerate generative design workflows for space planning. This is achieved by a 2D packing algorithm that fits office rooms into a larger container known as a department. Additionally, a pathfinding algorithm is used to calculate the distance from each desk to the exit door to comply with fire safety standards and define the maximum number of approved desks. Using the Generative Design tool, the office space can be optimized. The generated solutions are then evaluated through interactive data visualization, and the selected solution automatically updates the BIM model. The overall aim of this phase is to optimize space utilization while ensuring compliance with safety regulations and access to daylight. By implementing this approach, we aim to establish a more efficient and sustainable building design loop, which enables architects to make conscious decisions and quickly make changes to the design based on simulation and optimization results.
The GENIUS MOO optimization process includes ten subprocesses which are presented in the workflow in Figure 3.
- Optimization Design Problem Determination: The designer must establish the goals for optimization, variables for decision-making, and constraints based on the specific conditions and requirements of the building design project. In the presented case study, two objectives were identified to improve energy and daylight performance: minimize Energy Use Intensity (EUI) and maximize spatial Daylight Autonomy (sDA).
- Parametric modelling: The parametric model was created in Grasshopper based on the decision variables and objectives. The base model, which was imported from BIM software, has an L-shape with two core blocks containing lifts, stairs, and technical rooms. To allow for parametric representation and the ability to change shape (e.g., cross-shape, T-shape, etc.), two rectangular cuboids with core blocks were created that can move in relation to each other. The potential shape configurations are illustrated in Figure 4. Additionally, surrounding buildings (context) can be added to the model, and the building model can be placed on a lot. The position of the building model on the lot can be an additional variable to determine the optimal location relative to the context and to enhance energy and daylight performance.
- Simulations: The energy and daylight simulations were conducted using Honeybee and Ladybug plugins within the Grasshopper platform. The OpenStudio component with the EnergyPlus engine was used for energy simulations, which provided outputs such as total heating and cooling loads, energy balance, and EUI. Annual daylight simulations were performed using the Daysim component, with outputs including Daylight Autonomy (DA) and sDA. For the optimization process, EUI and sDA metrics were considered.
- Multi-objective optimization: MOO was performed considering two objectives: minimize EUI and maximize sDA. The Opossum plugin was used on the Grasshopper platform to run the optimization. This plugin was chosen since it uses RBFOpt model-based optimization. According to [11,12], RBFOpt is considered the fastest optimization algorithm with good results, especially if applied to problems that involve time-intensive simulations like daylight and energy simulations. BFOpt employs advanced machine learning methods to discover effective solutions with a minimal number of simulations. The optimization process comprises three primary steps: (1) scanning the model to identify a promising solution for evaluation, (2) executing simulations on the selected solution, and (3) refining the model based on the outcome of the simulations. Consequently, model-based approaches constantly boost the accuracy of the model [11].
- Post-processing: Design variables and simulation output data were recorded for each optimization run in two ways: directly in the Opossum plugin and through the data recorder component linked to each variable and simulation output. These data were automatically transferred to an Excel file using a Grasshopper script. Using PowerBI, an interactive data visualization tool, a dashboard was created to allow designers to evaluate different solutions easily. Two ranking metrics were used to identify the most performing solutions: hypervolume, which measures the volume of the trade-off space covered by a Pareto front, and the average of normalized data for EUI and sDA, ranging from 0 to 1.
- Automated Creation of the BIM model: After identifying the most performing solution, the designer can automatically create a new BIM model in the original file that includes the base model. This is achieved using a Grasshopper script with Revit-aware components capable of creating native Revit elements. It is important to note that the new BIM model must be manually saved under a new name and the base model deleted. The new model can then be used for further building design.
- Office layout design: This subprocess is carried out in Revit, a BIM software, and the Dynamo platform. The script consists of two parts: (1) placing rooms in departments with Daylight Autonomy (DA) values below 50%, and (2) placing desks in an open space area with DA values of 50% or higher. This rule ensures a comfortable workspace with adequate natural light according to the EN 17037:2022 standard. The standard specifies that an illuminance level of at least 300 lux should cover at least 50% of the building for at least half of the daylight hours in a year. The Refinery Toolkit package's 2D packing algorithm was adopted for room placement. Rooms are packed using a rectangular packer that offers three distinct strategies: packing based on rectangle area, long side, or short side. Each strategy results in a unique layout. Desk placement is based on grid object placement methods, allowing the designer to set parameters such as the number of desks in a cluster and the distance between rows and desks. The Space Analysis package's pathfinding algorithm was used to evaluate the distance between each desk and exits, to comply with fire safety standards and determine the maximum number of approved desks.
-
Multi-objective optimization: The office space can be optimized using the Generative Design tool in the Dynamo platform. Optimization can be carried out at two levels: room and desk placement. In the first case, the optimization goals are:
- Compactness ratio, indicating the percentage of the department's area that is occupied by rooms.
- Packing ratio, indicating the percentage of packed rooms versus rooms that are supposed to be packed.
- Column-room collision ratio is a metric that shows the impact of collisions between columns and rooms in the department.
For the first two metrics, a higher percentage yields better results, while the third metric should be minimized.In the second case, the optimization goals are:- A number of desks with an approved distance for the fire evacuation path.
- The average distance from a desk to an exit.
The first metric can be maximized or minimized based on the design goal, and the second metric should be minimized. - Post-processing: This subprocess is like point (5). Since the optimization process is performed for five objectives, a radar chart is used to display the scores for each objective. A larger filled area on the chart indicates a better solution.
- Automated BIM model update: After identifying the most effective solution, the designer can set up initial parameters for the selected solution in the script and automatically create objects in Revit software. The script enables the designer to create a desk layout automatically. While the rooms can also be created automatically, we believe that the architect should always review the room layout and treat the automated solution as a concept that needs further elaboration.
4. The GENIUS algorithm
4.1. Energy and daylight optimization algorithm
The energy and daylight optimization algorithm are developed in Rhino/Grasshopper with the integration of Honeybee/Ladybug plugins as well as other plugins needed to fulfil the objectives of the study. The algorithm is composed of eight main parts, as shown in Figure 5:
- Import of BIM geometry to Rhino/Grasshopper: the base geometry of the office building is done in Revit. With the Rhino.Inside.Revit plugin for Revit, it's easy to directly access the Rhino/Grasshopper platform and develop a daylight and energy optimization algorithm. This plugin guarantees full integration between two platforms. Revit-aware components can be used to import Revit elements and data, such as rooms, floor height, window dimensions, number of windows, topography (building lot) and surrounding buildings.
- Building geometry: The geometry and data from point 1 are used to create parametrically the building model composed of two rectangular cuboids and core blocks. Additional buildings can be added to the model to enhance its surroundings, and it can be placed on a specific lot for further analysis.
- Building model for energy and daylight simulations: In this part of the script, programs, loads, and schedules are assigned to building zones. As a building program, a large office was utilized with two room programs: open office and stair, which are default settings provided by Honeybee based on ASHRAE 90.1 standards. To identify the indoor walls of core blocks, the adjacency problem (???) was solved. Subsequent parts of the script focus on defining the Wall-to-Window Ratio (WWR), HVAC system, building components, and creating windows and shading systems to produce the final building model for simulations.
- Energy simulation: This part of the script conducts an annual energy simulation using the OpenStudio component, which can calculate EUI, cooling loads, heating loads, and balance charts as output data. The EUI values are utilized for optimization purposes.
- Daylight simulation: This part of the script conducts annual daylight simulations using the Daysim component, following procedures outlined in the EN 17037:2022 standard. The simulations are conducted for an illuminance level of 300 lux with low-quality Radiance parameters. Although there may be some differences in output values when using different quality parameters, we opted for lower quality to maintain a fast and acceptable computation time. As output data, sDA and DA values are calculated. The DA values are necessary for defining building areas with values greater than or equal to 50% (acceptable for workstations) and values less than 50%.
- Multi-objective optimization: The MOO is performed using the Opossum plugin, which utilizes the RBFOpt model-based optimization method. The optimization component is linked to the input variables and fitness functions, which, in the case study, involve the maximization of sDA and the minimization of EUI.
- Data export to Excel: In this section, the script records data, including variables and output data, from the simulations conducted during the optimization process. The data is then sorted and scored. For EUI and sDA values scores are calculated by taking the average of the normalized data, which ranges from 0 to 1. The data are properly prepared and exported to an Excel file, to which the rank (hypervolume) from the optimization run in the Opossum plugin is manually added at the end. The Excel file can then be utilized in Power BI to analyse various design solutions generated by the optimization process.
- Automated generation of the BIM model: The final part of the script transfers the geometry of the optimized solution from Grasshopper to Revit, along with the geometry data related to the daylight simulation (DA) using Rhino.Inside.Revit plugin. This is accomplished using Revit-aware components. An example is shown in Figure 6. The optimised solution must be saved manually as a new Revit file.
4.2. Office layout optimization algorithm
The office layout optimization algorithm was developed using the Revit/Dynamo platform, and it requires the integration of the Refinery Toolkit and Space Analysis plugins to achieve the study's objectives. Before using the algorithm, the architect should apply some design procedures to the BIM model. However, the algorithm has some limitations, and certain rules must be followed to run it properly. The following rules should be adopted:
- Macro-division of the building space: The algorithm can only analyse space enclosed in rectangular or T-shaped polygons, so the architect must divide the building into macro departments based on orientation (north, west, south, east). It's important to note that the macro-department area should include exit doors to calculate the path from the desk to the exit door. Additionally, the macro-department area should include all areas with DA faces previously imported from Grasshopper as a result of daylight simulation. Macro departments can be designed using a model line in Revit. Some examples of possible macro-division of the building space are presented in Figure 7.
- Department circulation: Design the circulation path for the department divisions.
- Columns: Design columns and fire exit doors for the office building.
- Desk: Import a desk family that will be used for desk layout optimization. It should be a single desk.
Once the BIM model is prepared, the architect can access the Dynamo platform and algorithm. The architect can decide whether to focus on room layout optimization first and then desk layout optimization or do both simultaneously. When the algorithm is opened for the first time, it's necessary to import BIM geometry to Dynamo nodes, such as grid points and DA face values, exit doors, lines delimiting macro departments in each orientation, circulation path lines, a single desk, columns, and so on. The algorithm can analyse one macro department at a time, so at the beginning, the designer needs to select which orientation to analyse first, specify the macro department shape (rectangular or T-shape), and select the exit doors that should be considered for optimization. Afterwards, all input parameters related to desk and room placement should be set up, and the algorithm is ready to run. Using Generative Design, the designer can perform the optimization process. The generated solutions can be exported to a CSV file. The goals of each solution are scored and properly prepared to be exported to an Excel file for Power BI, where the designer can evaluate all solutions using an interactive dashboard. The architect can then select the most effective solution and reproduce it in the optimization algorithm by setting up the input parameters properly. The geometry of this solution can be created automatically in the BIM model.
The algorithm is composed of two main parts: room placement and desk placement. Each part follows its own workflow. Figure 8 shows step-by-step how the room placement is done, while Figure 9 shows the workflow for the desk placement.
A more detailed view of the Dynamo algorithm is presented in Figure 10 where its main parts are described.
5. Case study
5.1. Referenced Building
This case study focuses on an office building situated in Bolzano City, Italy. For the simulation goal, a single floor with an area of 5669.80 m2 was chosen as a base model. The building is L-shaped and consists of two core blocks, as shown in Figure 11. The building features a total of 40 evenly distributed windows, each measuring 1.8 by 2.7 meters. With a WWR of 0.308, the windows create a significant proportion of the façade and allow ample natural light to enter the interior. The Grasshopper platform was used to create a parametric model based on the Revit geometry. The floor and roof are considered adiabatic surfaces as only one floor is being simulated. The model parameters allow the designer to alter the building's dimensions while maintaining the same area, change the building's shape, modify the percentage of WWR on each façade, and add shading systems (such as overhangs, horizontal and vertical louvres, and extruded borders) to each window on each façade. The window dimensions and sill height can also be adjusted. The parametric model incorporates variations in the window and shading systems into the daylight and energy models. In the case study, the building shape and WWR were only considered as variables.
5.2. Energy model
The parametric model incorporates energy simulations via the Honeybee plugin, which utilizes the EnergyPlus simulation engine through the OpenStudio component. Weather data from ASHRAE Climatic Design Conditions 2009 for Bolzano City were used for the energy simulation. The building was divided into two zones for simulation purposes, each with corresponding programs, loads, and schedules. Based on ASHRAE 90.1 standards, the building was classified as a large office and consisted of two-zone programs: the open office for the office space and the stair for the core blocks (refer to Table 1 and Table 2 for details).
The building's walls and windows were designed to meet the high thermal transmittance standards of the Passive House Institute. Details on the wall’s layers and thermal properties can be found in Table 3 and Table 4. The external wall's thermal transmittance is U = 0.13 W/(m²K), as calculated according to ISO 6946. Additionally, the window transmittance has been assumed to be U = 0.85 W/(m²K).
5.3. Daylight model
The daylight model is realized using the Daysim plugin for Grasshopper. Daysim, which is an annual daylight simulation tool with Radiance as its engine, allows for sDA and DA calculations. The daylight model was created following procedures outlined in the EN 17037:2022 standard. The analysis grid is located 0.85 m from the floor, presents a cell size of 1.5m, and is offset from the wall by 0.5 m. Interior material properties and Radiance parameters are presented in Table 5 and Table 6. No external obstructions (e.g., surrounding buildings) were considered. The simulations and MOO are conducted for an illuminance level of 300 lux with low-quality Radiance parameters.
5.4. Parameters and Variables of the case study
The GENIUS project involves a two-level optimization process for an office building, considering both energy and daylight performance. The first level of optimization focuses on the building as a whole, considering parameters such as its shape and WWR. Once the best building design is identified, the second level of optimization focuses on defining the most efficient office layout, including rooms and workstations. Due to the size of the project and the difficulty of presenting all results, we have chosen to focus on the first level of optimization, specifically on building (shape and window) optimization through maximizing sDA and minimizing EUI.
After configuring the programs, loads, schedule, HVAC, building components, and shading system, input variables and parameters were established in the parametric and energy models of the building to initiate the MOO process. Input parameters introduce data into the model that does not affect optimization and remains fixed. Variables, on the other hand, are used in the optimization process as input data that can vary within a specific range during the search for the optimal solution.
In the case study for which results are presented, we focused on optimizing the building model without varying its dimensions and considering the shading system. The parametric model consists of two rectangles, each with dimensions of 52.5 x 20 meters. The optimization can also be performed for the model with the shading system, in which case the designer can choose the type of shading system as a parameter. The designer can then select which of the following input data will be treated as parameters and variables based on the study's goals: depth, shade count, and shade inclination angle.

Table 7.
Parameters used for defining the building model in the optimization process of the case study.
Table 7.
Parameters used for defining the building model in the optimization process of the case study.
| Model | Parameters | Settings |
|---|---|---|
| Parametric | Length and width of the Rectangle 1 | 23x60.5 m* |
| Width and length of the Rectangle 2 | 60.5x23 m** | |
| Energy | Window height | 2.7 m |
| Sill height | 0.15 m |
* It corresponds to real dimensions of 20 x 52.5 m. ** It corresponds to real dimensions of 52.5 x 20 m.
Table 8.
Variables used for the optimization process of the case study.
| Model | Variables | Range |
|---|---|---|
| Parametric | Moving point of the Rectangle 1 | 0-16 |
| Moving point of the Rectangle 2 | ||
| Energy | WWR north | 0.2-0.8 |
| WWR east | ||
| WWR south | ||
| WWR west |
6. Results
The optimization of the office building case study was conducted using the Opossum plugin. The optimization goal was to minimize EUI and maximize sDA. The computation time for energy simulation was around 1 minute, and for daylight simulation, around 2 minutes, considering the following computer parameters: processor CPU 11th Gen Intel(R) Core (TM) i7-11850H @ 2.50GHz, RAM 64 GB, memory DDR4 3200 MHz. Considering this, we decided to set up the optimization for 200 iterations with the RBFOpt algorithm. As a result, we obtained a rank with hypervolume and values for each goal (Figure 12). Simultaneously, for each iteration, variables and output data (goals) were recorded using a recording component. EUI and sDA values were scored by calculating the average of the normalized data, which ranges from 0 to 1. The data were exported to an Excel file, as shown in Figure 13, to display the data and geometry of the optimized solution in PowerBI. The PowerBI tool was used to create a dashboard with all the results obtained from the optimization process (Figure 14). Architects can decide, based on the building configuration, which ranking metric to use. The hypervolume and normalized data of EUI and sDA offer different solutions. Based on the design criteria that the architect wants to follow; they can find the most suitable solution. Table 9 reports output data and ranking values for the three best solutions identified through hypervolume and normalized EUI and sDA scores. Figure 15 shows the building configuration for these three best solutions for each ranking type.
The non-dominated solutions from all 200 optimization iterations produced EUI and sDA results ranging from 66.265 kWh/m2/year to 82.701 kWh/m2/year for EUI values and 53.78% to 100% for sDA, with a median value of 74.7115 kWh/m2/year and 90.83%, respectively. The base building model, imported from BIM software, reported a EUI of 69.297 kWh/m2/year and an sDA of 81.28%, indicating already good energy and daylight performance similar to the optimized solutions calculated by the RBFOpt algorithm. It is important to note that the base model served as a starting point to explore different building shapes and WWR percentages to minimize EUI and maximize sDA.
The best solution identified by both rankings shows that the distribution of EUI over the year requires the highest energy consumption from June to August due to the highest outdoor temperature, which requires cooling. The highest energy consumption for heating occurs from November to February. The energy consumption is show in Figure 16.
Regarding the building shape, the T-shaped and L-shaped buildings were identified as achieving the best results. The WWR varied for the northern façade between 0.42 and 0.5, for the eastern façade between 0.34 and 0.37, for the façade between 0.33 and 0.42, and for the western façade between 0.3 and 0.42.
7. Conclusion
This paper demonstrated the AAD workflow using a multi-objective algorithm approach. The workflow is a BIM-to-BIM process that optimizes the building shape and WWR of an original office-building concept in BIM software. The MOO is carried out to optimize the building model by minimizing EUI and maximizing sDA using the RBFOpt model-based optimization tool in the Grasshopper platform. The optimized solutions are analysed by a designer using the PowerBI tool. The best solution is recreated by the algorithm and then automatically transferred back to the BIM software, where the office layout can be optimized using Dynamo and Generative Design tools. These optimizations allow designers to identify the most efficient solutions that provide an environmentally sustainable and comfortable workspace for building occupants.
The GENIUS project offers two levels of optimization. The first level of optimization focuses on the building, considering parameters such as its shape, WWR and shading system and it optimizes a building by finding a good balance between energy and daylight performance. Once the optimal building design is determined, the second stage of optimization focuses on creating an efficient office layout that includes individual rooms and workstations.
For the case study, we chose to focus on the first level of office building optimization to illustrate the workflow. This involved optimizing the building's shape and windows with the goal of maximizing sDA and minimizing EUI. The presented case study had already achieved a good balance between energy and daylight performance. Nevertheless, we aimed to explore different building shapes and WWR values to identify potential solutions that could be considered during the project's conceptual phase.
The optimization process revealed that the sDA could be improved compared to the base-case model. The base model had an sDA of 81.28%, while the optimized solutions ranged between 88.67% and 91.29%, indicating an improvement of 7.39% to 10.01%. This improvement was achieved by increasing the WWR, which increased by an average of 0.154 for the northern facade, 0.045 for the eastern facade, 0.057 for the southern facade, and 0.06 for the western facade. By improving the sDA, the EUI remained at a balanced level, ensuring good energy performance. The RBFOpt algorithm used for MOO gradually improved daylight and energy performance over 200 iterations. From the non-dominated solutions, the selected optimum solutions were identified by hypervolume and normalized score ranking. Through this study, we demonstrate that the GENIUS approach can be a reliable strategy for achieving optimal building environmental performance during the conceptual phase for designers.
Finally, the limitations include the fact that the office building was optimized considering variables such as building shape and WWR. Although the shading system was not presented in this paper, it can still be optimized using the same algorithm. Additionally, it would be interesting to conduct studies on minimizing EUI and maximizing sDA for different window and shading system designs. Moreover, the optimization process can be further improved. Currently, the second level of the optimization process is performed using the Dynamo platform. However, the process could potentially be more efficient if it were executed using the Grasshopper platform instead. In future research, the building model algorithm will also be extended to analyse other building shapes, such as H-shape, U-shape, courtyard, etc.
Author Contributions
Conceptualization, Julia Ratajczak and Dietmar Siegele; methodology, Julia Ratajczak and Dietmar Siegele; software, Julia Ratajczak; validation, Julia Ratajczak and Dietmar Siegele; formal analysis Julia Ratajczak and Dietmar Siegele; investigation, Julia Ratajczak; resources, Julia Ratajczak; data curation, Julia Ratajczak; writing—original draft preparation, Julia Ratajczak; writing—review and editing, Julia Ratajczak, Dietmar Siegele and Elias Niederwieser; visualization, Julia Ratajczak; supervision, Dietmar Siegele and Elias Niederwieser; project administration, Dietmar Siegele and Elias Niederwieser. All authors have read and agreed to the published version of the manuscript.
Conflicts of Interest
The funders had no role in the design of the study; in the collection, analyses, or interpretation of data; in the writing of the manuscript; or in the decision to publish the results.
References
- Tedesch, A.; Lombardi, D. The algorithms-aided design (AAD). In Book Informed Architecture; Hemmerling, M.; Cocchiarella, L.; Springer Cham, July 2017 pp. pp.33-38.
- Zboinska, M.A. Hybrid CAD/E platform supporting exploratory architectural design, Computer-Aided Design, 59, 2015, pp. 64-84. [CrossRef]
- Bukhari, Fakhri A. A. Hierarchical Evolutionary Algorithmic Design (HEAD) system for generating and evolving building design models. Diss. Queensland University of Technology, 2011.
- Eastman, C. M.; Teicholz, P.; Sacks, R.; Liston, K. BIM handbook: A guide to building information modeling for owners, managers, designers, engineers and contractors. John Wiley & Sons, USA, 2011.
- Eltaweel, A., Su, Y., Parametric design and daylighting: a literature review. Renew. Sustain. Energy Rev. 2017, 73, pp. 1086-1103. [CrossRef]
- Elghazi, Y.; Wagdy, A.; Mohamed, S.; Hassan, A. Daylighting Driven Design: Optimizing Kaleidocycle Façade For Hot Arid Climate. In Proceedings of the 5th German-Austrian IBPSA Conference: RWTH Aachen University, Aachen, Germany, September 22-24, 2014.
- Burry, M. Scripting Cultures: Architectural Design and Programming. John Wiley & Sons, UK, 2011.
- Khan, S.; Awan, M.J. A generative design technique for exploring shape variations. Adv. Eng. Inform. 2018, 38, pp. 712–724. [CrossRef]
- Nagy, D.; Villaggi, L. Generative Design for Architectural Space Planning. Autodesk University. 2020. Available online: https://www.autodesk.com/autodesk-university/article/Generative-Design-Architectural-Space-Planning-2020 (accessed on 15 June 2020).
- Singh, V.; Gu, N. Towards an integrated generative design framework. Des. Stud. 2012, 33, pp.185–207. [CrossRef]
- Wortmann, Thomas. Opossum-introducing and evaluating a model-based optimization tool for grasshopper. In Proceedings of the 22nd International Conference of the Association for Computer-Aided Architectural Design Research in Asia (CAADRIA), pp. 283-293, Hong Kong, April 5-8, 2017.
- De Luca, F.;Wortmann, T. Multi-Objective Optimization for Daylight Retrofit. In Proceedings of the 38th Conference on Education and Research in Computer Aided Architectural Design in Europe, Berlin, Germany, September 16-18, 2020.
- Emmerich, MTM; Deutz, AH. A tutorial on multiobjective optimization: fundamentals and evolutionary methods, Nat. Comput., 2018, 17(3), pp. 585–609. [CrossRef]
- Leder, S.; Newsham, G.R.; Veitch, J.A.; Mancini, S.; Charles, K.E. Effects of office environment on employee satisfaction: a new analysis. Build. Res. Inf., 2016, 44, pp. 34-50.
- Al Horr, Y.; Arif, M.; Kaushik, A.; Mazroei, A.; Katafygiotou, M.; Elsarrag, E. Occupant productivity and office indoor environment quality: a review of the literature. Build. Environ., 2016, 105, pp. 369-389. [CrossRef]
- Andersen, M, Mardaljevic, J and Lockley. A framework for Predicting the Non-visual Effects of Daylight - Part I: Photobiology-based model, Lighting Research & Technology, 2012, 44(1), pp. 37-53. [CrossRef]
- De Luca, F; Voll, H.; Thalfeldt, M. Comparison of Static and Dynamic Shading Systems for Office Buildings Energy Consumption and Cooling Load Assessment, Management of Envinron. Quality: An Int. Journal, 2018, 29(5), pp. 978-998. [CrossRef]
- Nazaroff, WW. Illumination, lighting technologies, and indoor environmental quality, Indoor Air, 2014, 24(3), pp. 225-226.
- Haase, M.; Grynning, S. Optimized Façade Design – Energy Efficiency, Comfort and Daylight in Early Design Phase, En. Procedia, 2017, 132, pp. 484-489.
- De Luca, F.; Voll, H.; Thalfeldt, M. Horizontal or Vertical Windows’ layout selection for shading devices optimization, Management of Envinron. Quality: An Int. Journal, 2016, 27(6), pp. 623-633. [CrossRef]
- Yang, F. Optimization of Daylighting and Energy Performance Using Parametric Design, Simulation Modeling, and Genetic Algorithms. Ph.D. Dissertation, Faculty of North Carolina State University, Raleigh, NC, USA, 2017.
- Heschong, L.; Mahone, D. Windows and offices: A study of office worker performance and the indoor environment. California Energy Commission, 2003, pp. 1-5.
- Niclas, N.R. Using genetic algorithms in parametric building façade design to create different atmospheres. Ph.D. Dissertation, Aalborg University, Aalborg, Denmark, 28 May 2019.
- Wortmann, T. Genetic Evolution vs. Function Approximation: Benchmarking Algorithms for Architectural Design Optimization, JCDE, 2019, 6(3), pp. 414-428. [CrossRef]
- Waibel, C.; Wortmann, T.; Evins, R.; Carmeliet, J. Building energy optimization: An extensive benchmark of global search algorithms. Energy and Buildings, 2019, 187, pp. 218-240. [CrossRef]
- Deb, K.; Pratap, A.; Agarwal, S.; Meyarivan, T. A fast and elitist multiobjective genetic algorithm: NSGA-II’, IEEE Trans. Evol. Comput., 2002, 6(2), p. 182–197. [CrossRef]
- Zhang, Q.; Li, H. MOEA/D: A Multiobjective Evolutionary Algorithm Based on Decomposition, IEEE Trans. Evol. Comput., 2007, 11(6), p. 712–731. [CrossRef]
- Ko, R. Tuning and Benchmarking a Blackbox Optimization Algorithm, Master’s Thesis, Yale, 2019.
- Toutou, A.M.Y. Parametric approach for multi-objective optimization for daylighting and energy consumption in early stage design of office tower in new administrative capital city of Egypt. Academic Research Community Publication; IEREK: London, UK, 2019; 3, pp. 1–13. [CrossRef]
- Besbas, S.; Nocera, F.; Zemmouri, N.; Khadraoui, M.A.; Besbas, A. Parametric-Based Multi-Objective Optimization Workflow: Daylight and Energy Performance Study of Hospital Building in Algeria. Sustainability, 2022, 14, 12652. [CrossRef]
- Zhang, A.; Bokel, R.; van den Dobbelsteen, A.; Sun, Y.; Huang, Q.; Zhang, Q. Optimization of thermal and daylight performance of school buildings based on a multi-objective genetic algorithm in the cold climate of China, Energy and Buildings, 2017, 139, pp. 371-384. [CrossRef]
- Hinkle, L.E.; Wang, J.; Brown, N.C. Quantifying potential dynamic façade energy savings in early design using constrained optimization, Building, and Environment. Build. Environ. 2022, 221, 109265. [CrossRef]
- Elghandour, A.; Saleh, A.; Aboeineen, O.; Elmokadem, A. Using Parametric Design To Optimize Building’s Façade Skin To Improve Indoor Daylighting Performance. In the Proceedings of the 3rd IBPSA-England Conference BSO 2016, Great North Museum, Newcastle, 12th-14th September 2016.
- Sun, C.; Liu, Q. Yunsong, H. Many-Objective Optimization Design of a Public Building for Energy, Daylighting and Cost Performance Improvement. Applied Sciences. 2020, 10, 2435. [CrossRef]
- Musau, F.; Steemers, K. Space Planning and Energy Efficiency in Office Buildings: The Role of Spatial and Temporal Diversity, Architectural Science Review, 2008, 51(2), pp. 133-145. [CrossRef]
- Yi, H. User-Driven Automation for Optimal Thermal-Zone Layout during Space Programming Phases. Architectural Science Review, 2016, 59(4), pp. 279–306. [CrossRef]
- Rodrigues, E.; Adélio, R.G.; Álvaro, G. An Approach to the Multi-Level Space Allocation Problem in Architecture Using a Hybrid Evolutionary Technique. Automation in Construction, 2013, 35, pp. 482–98.
- Michalek, J.; Ruchi C.; Panos P. Architectural Layout Design Optimization. Engineering Optimization, 2002, 34(5), pp. 37–41.
- Catalina, T.; Virgone, J.; Iordache V. Study on the impact of the building form on the energy consumption. In Proceedings of Building Simulation 2011: 12th Conference of International Building Performance Simulation Association, Sydney, Australia, 14-16 November 2011.
- Liggett, R.S. Automated facilities layout: past, present and future. Automation in construction, 2000, 9(2), pp. 197-215. [CrossRef]
- Nagy, D.; Lau, D.; Locke, J.; Stoddart, J.; Villaggi, L.; Wang, R.; Zhao, D.; Benjamin, D. Project Discover: An Application of Generative Design for Architectural Space Planning. In Proceedings of the Symposium on Simulation for Architecture and Urban Design, 2017, 7, pp. 1–8.
- Cheng, C.; Ninić, J.; Tizani, W. Parametric Virtual Design-Based Multi-Objective Optimization for Sustainable Building Design. Intelligent Computing in Engineering and Architecture, 2018.
- Autodesk University. Generative Design for Complex Buildings: Optimizing Spaces and Flows with Dynamo and Refinery. Available online: https://medium.com/autodesk-university/generative-design-for-complex-buildings-optimizing-spaces-and-flows-with-dynamo-and-refinery-98881be34fa7 (accessed on 11th April 2023).
Figure 1.
The AAD design process with coupled software and plugins for defining the optimized solution in terms of energy and daylight performance.
Figure 1.
The AAD design process with coupled software and plugins for defining the optimized solution in terms of energy and daylight performance.
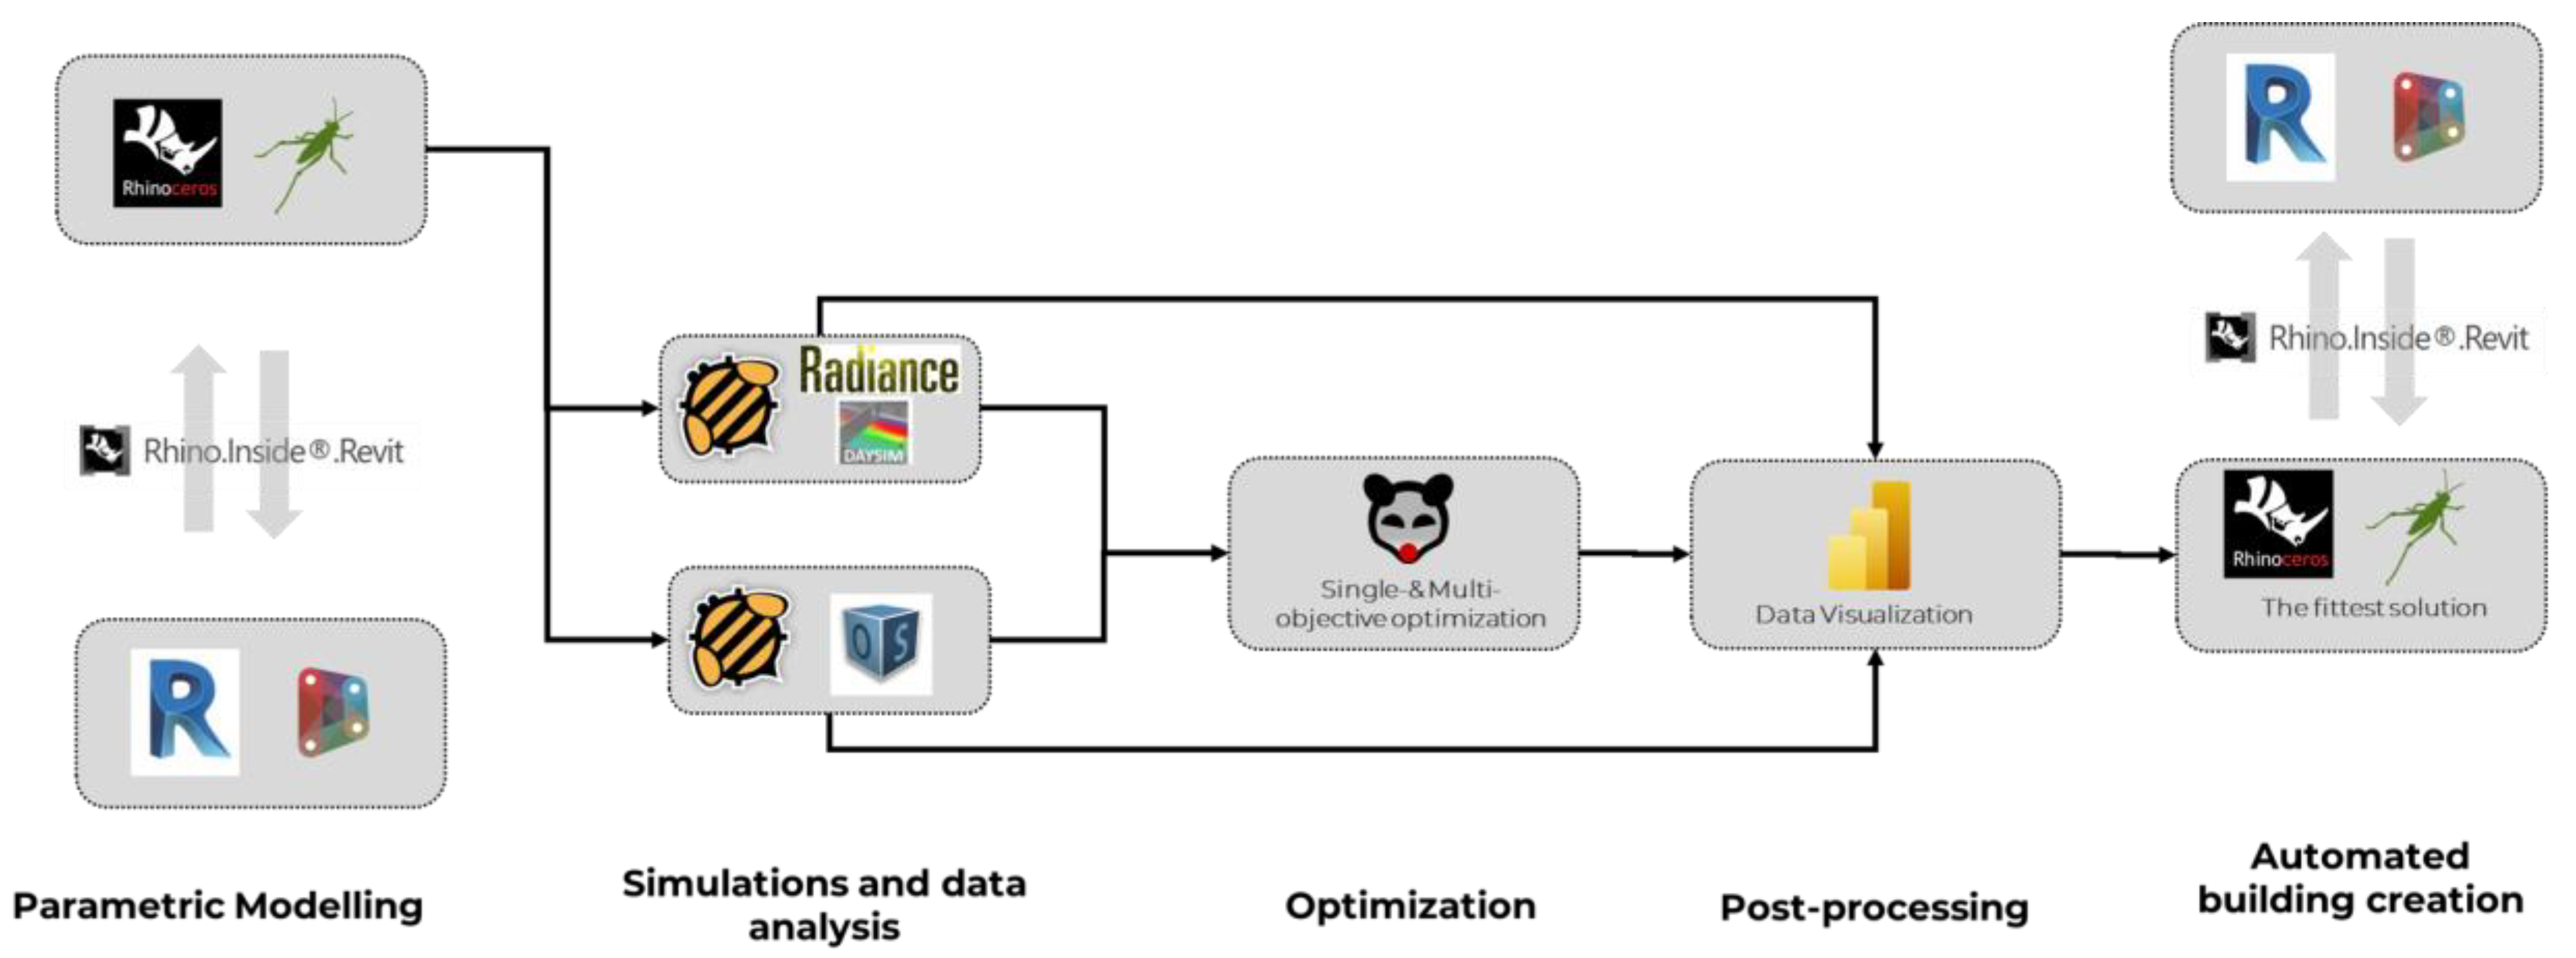
Figure 2.
The AAD design process with coupled software and plugins for defining the optimized solution of the office building layout.
Figure 2.
The AAD design process with coupled software and plugins for defining the optimized solution of the office building layout.

Figure 3.
Design workflow of generation, optimization and automated creation of a building office based on defined energy and daylight objectives.
Figure 3.
Design workflow of generation, optimization and automated creation of a building office based on defined energy and daylight objectives.
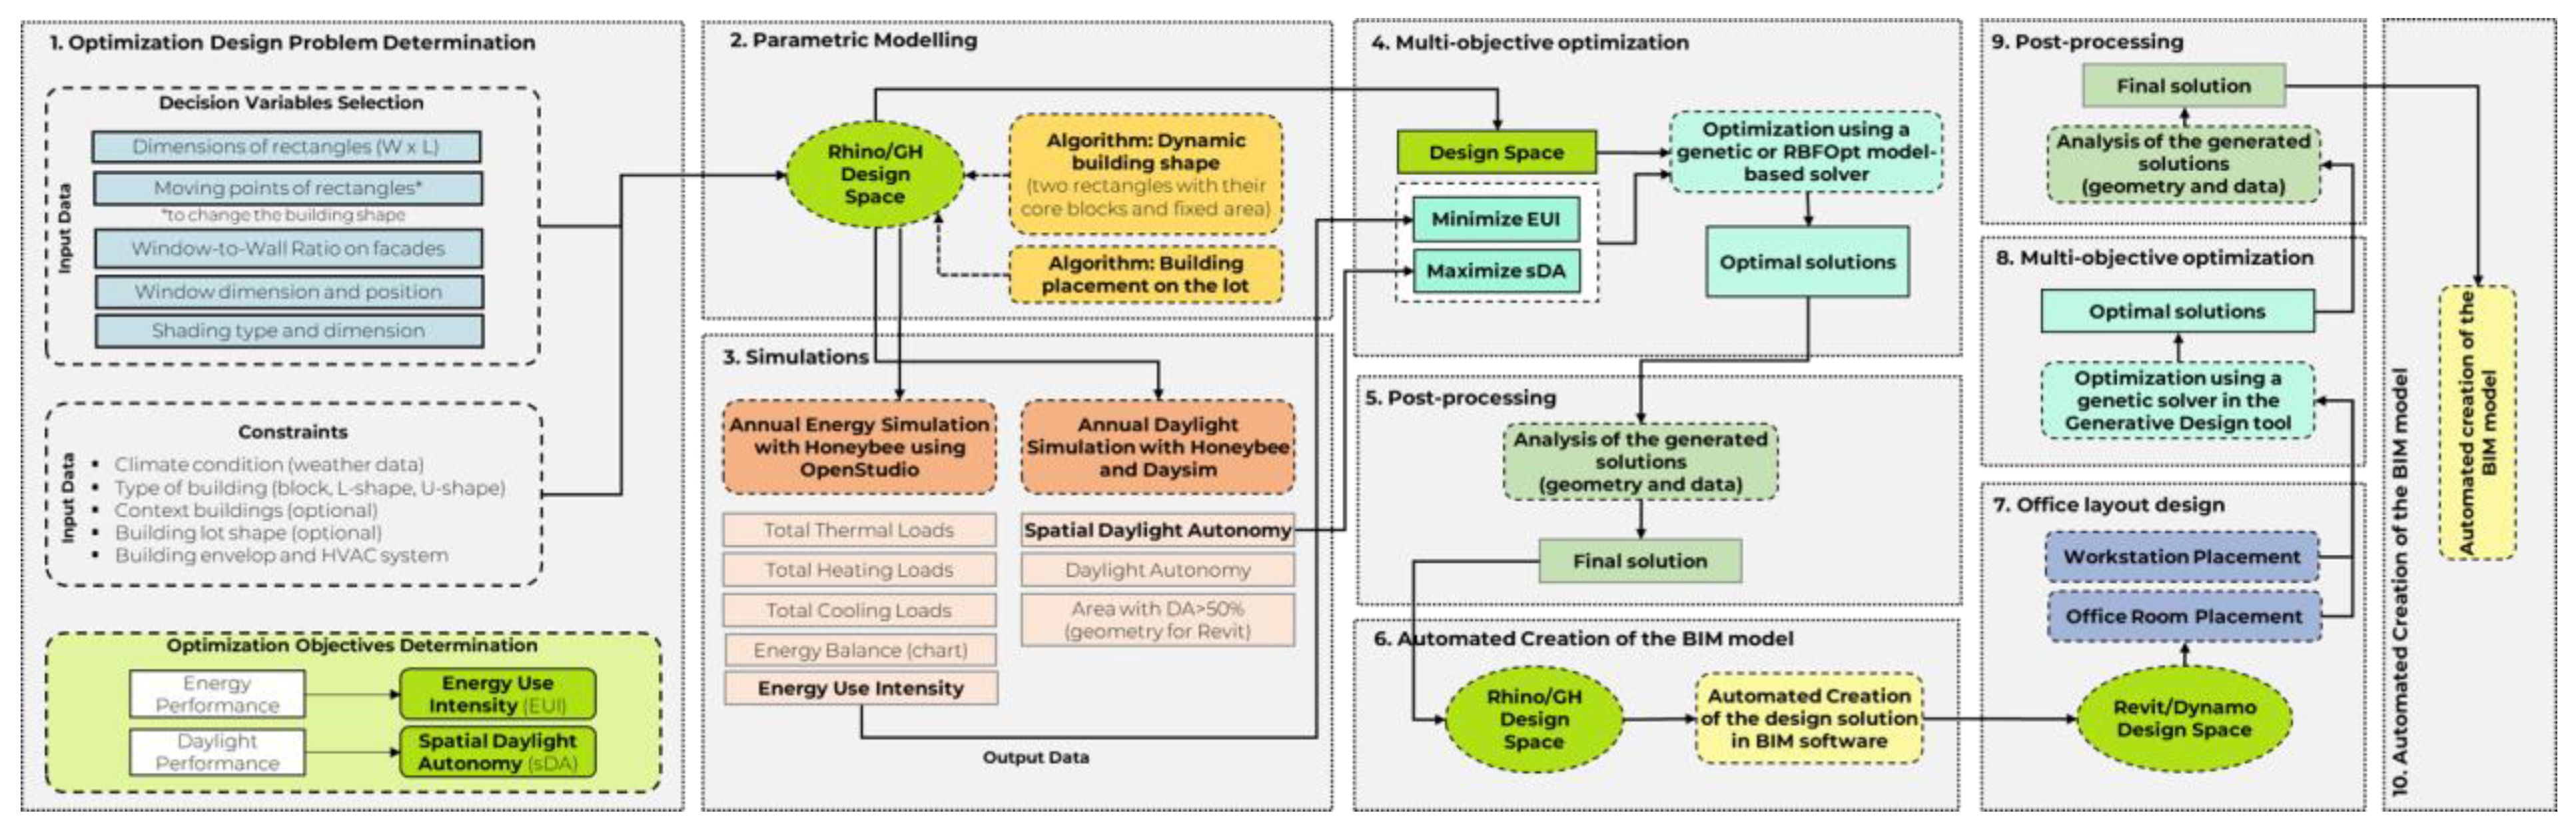
Figure 4.
A possible building shape configuration by changing the position of rectangular cuboids.
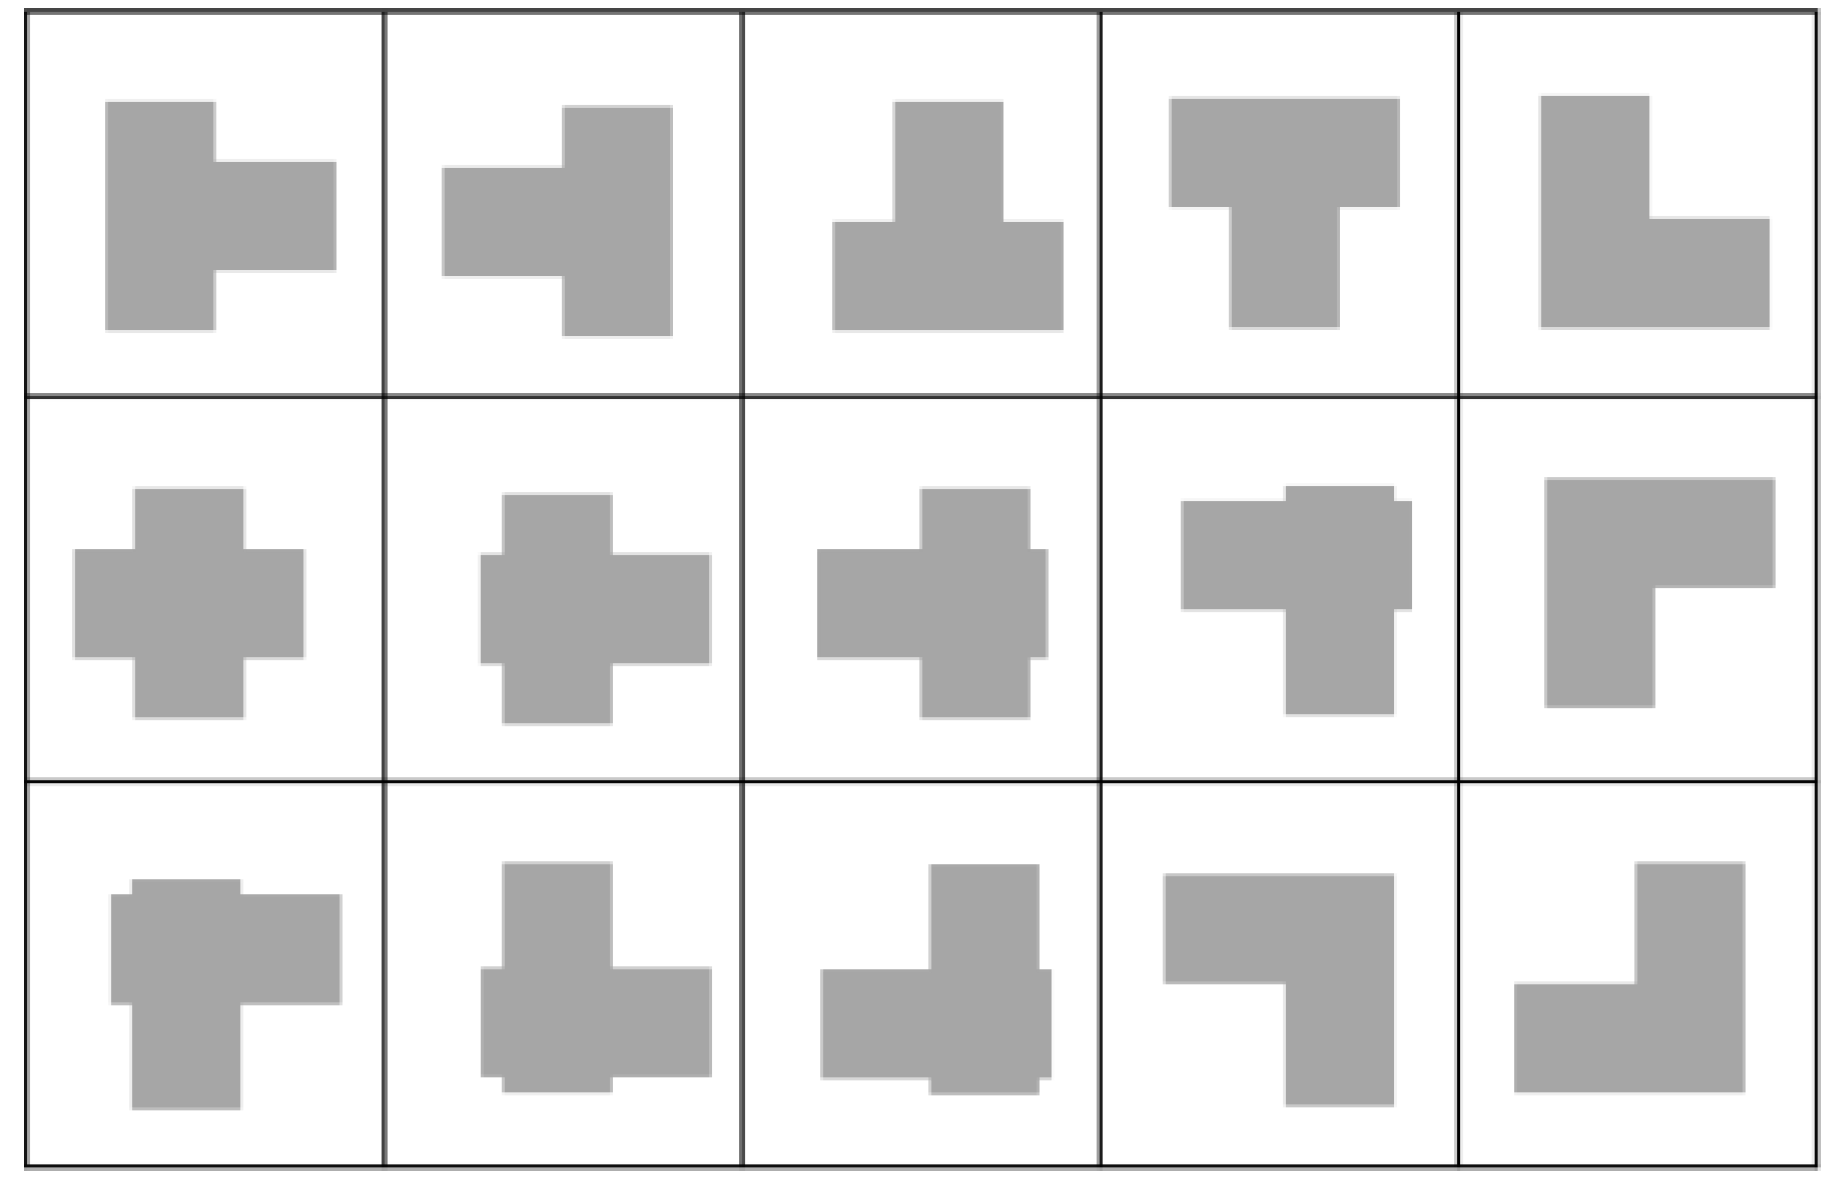
Figure 5.
Algorithmic workflow design with Grasshopper for energy and daylight optimization.
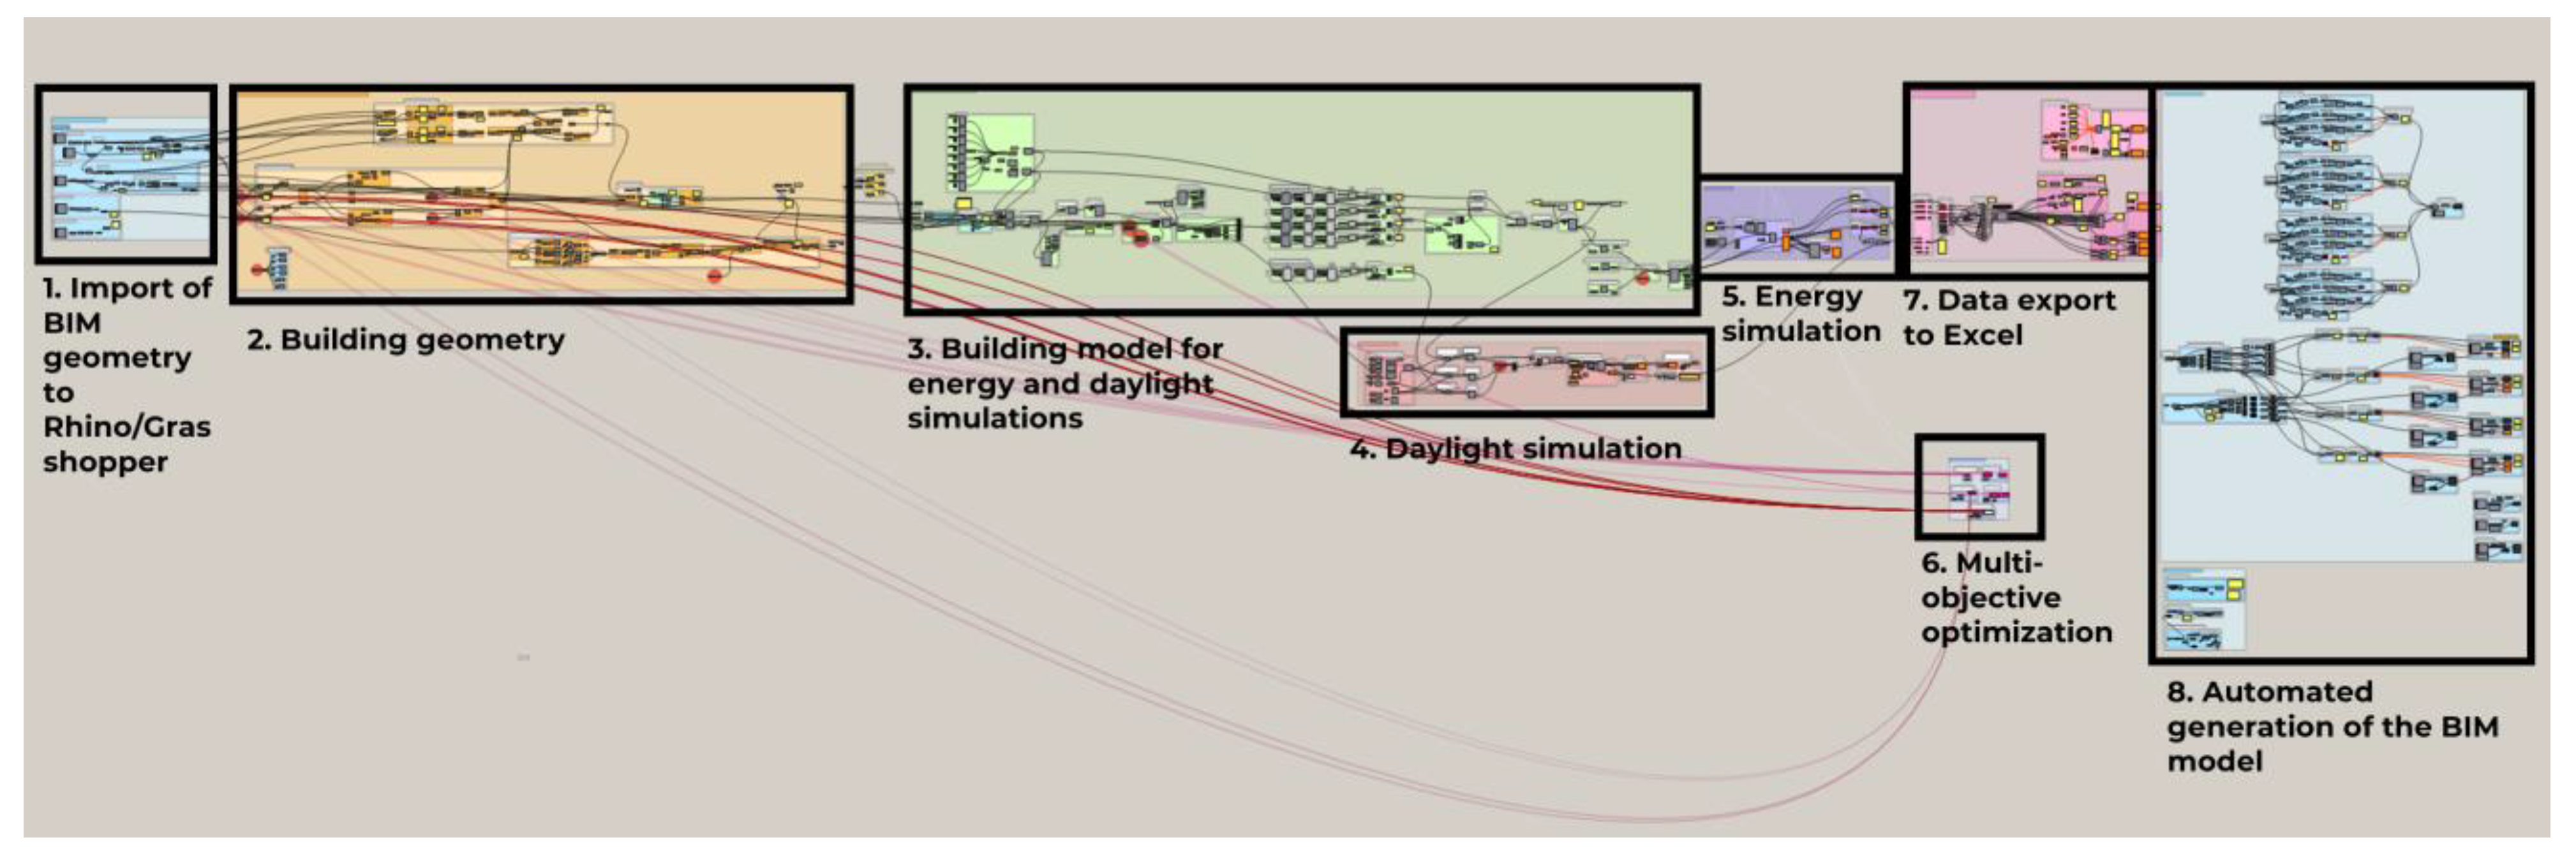
Figure 6.
The automated creation of Revit geometry in Grasshopper using Rhino.Inside Revit plugin.
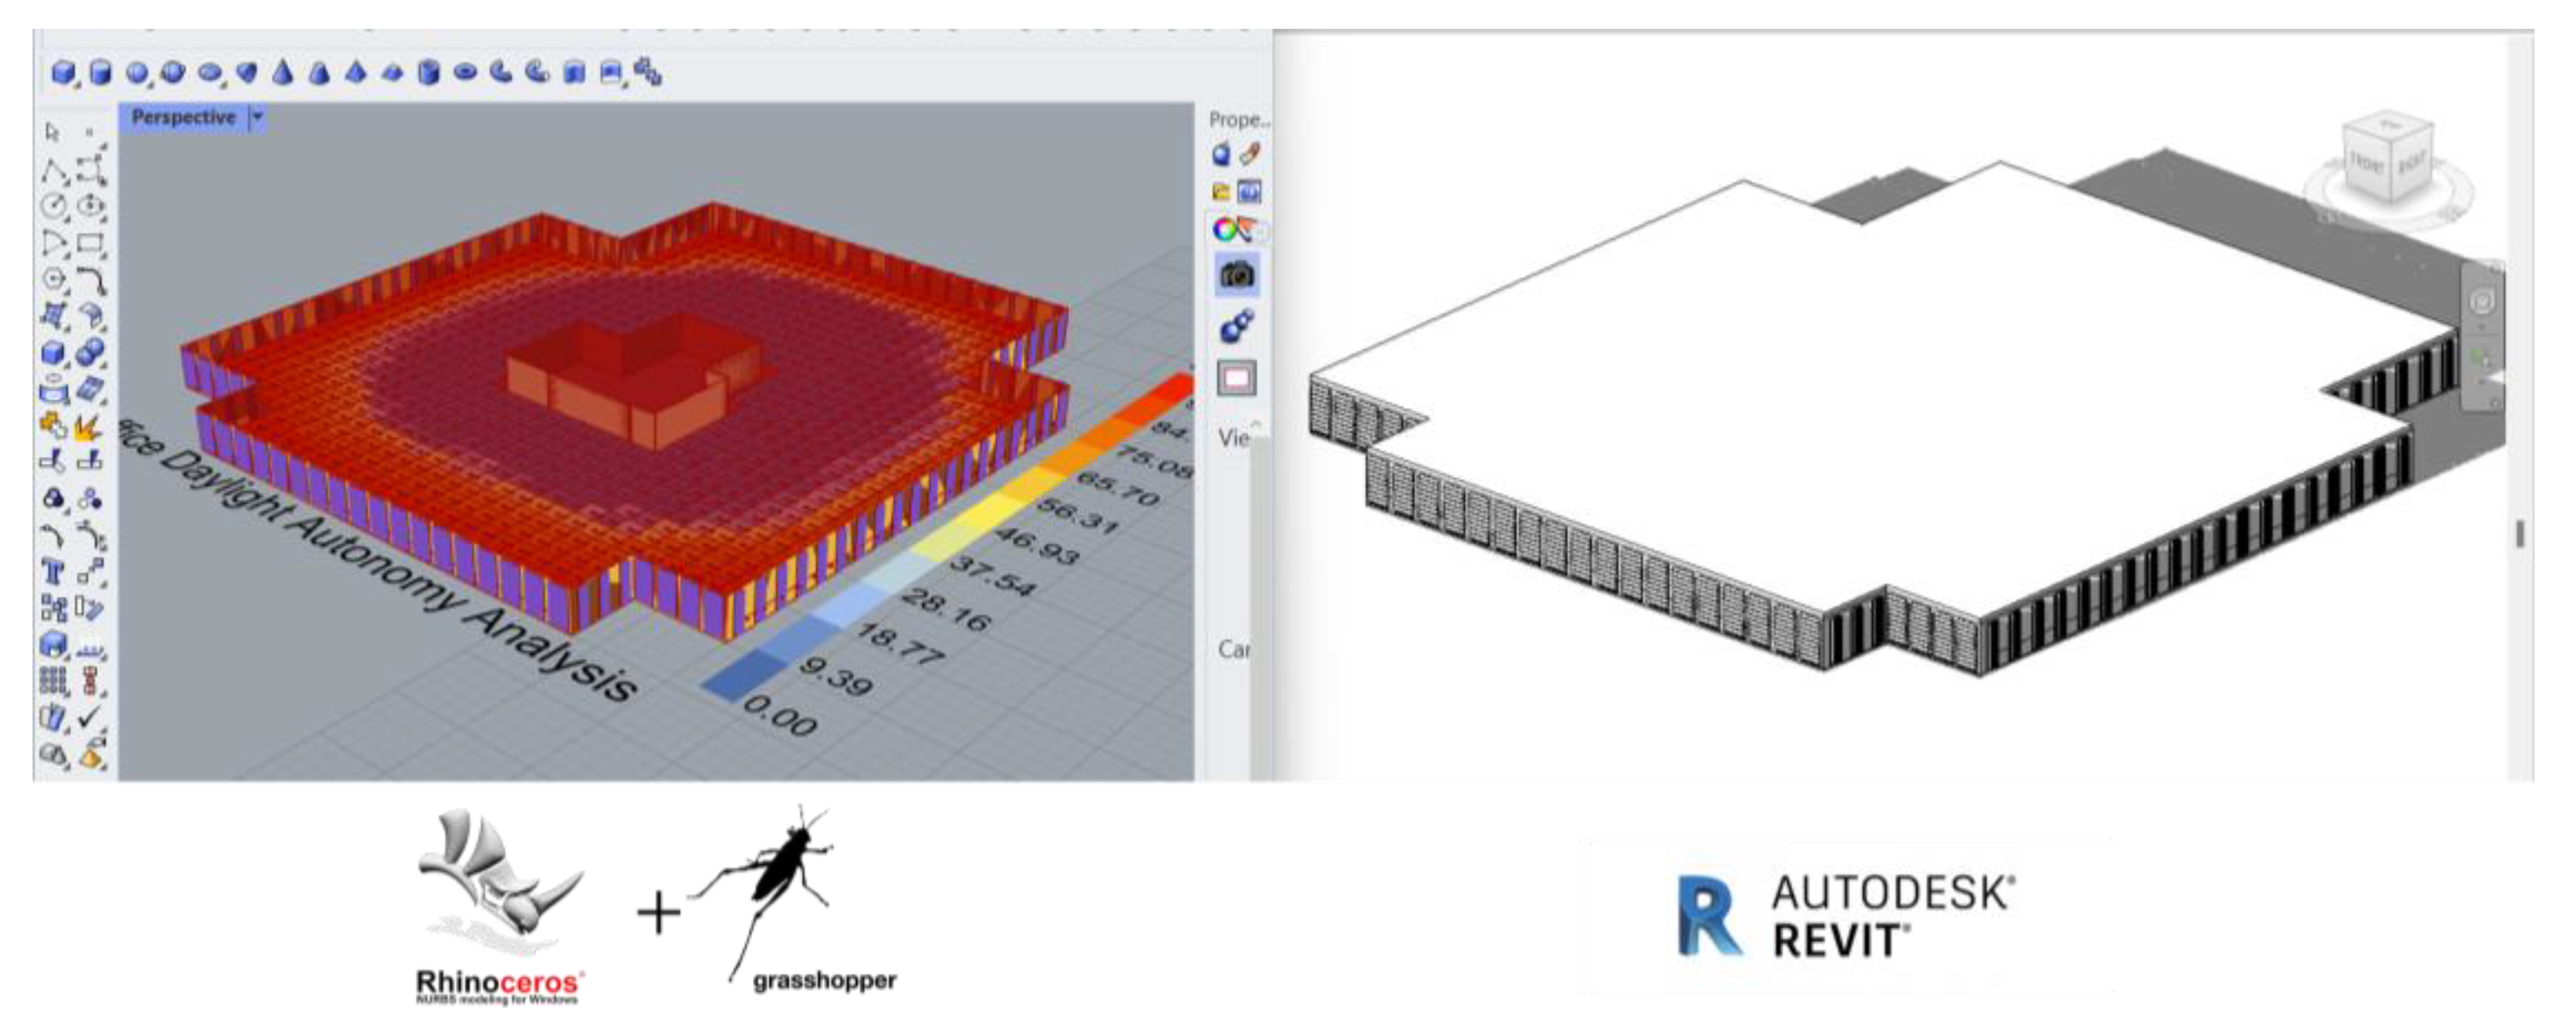
Figure 7.
Examples of the macro-division of the building space based on the orientation.
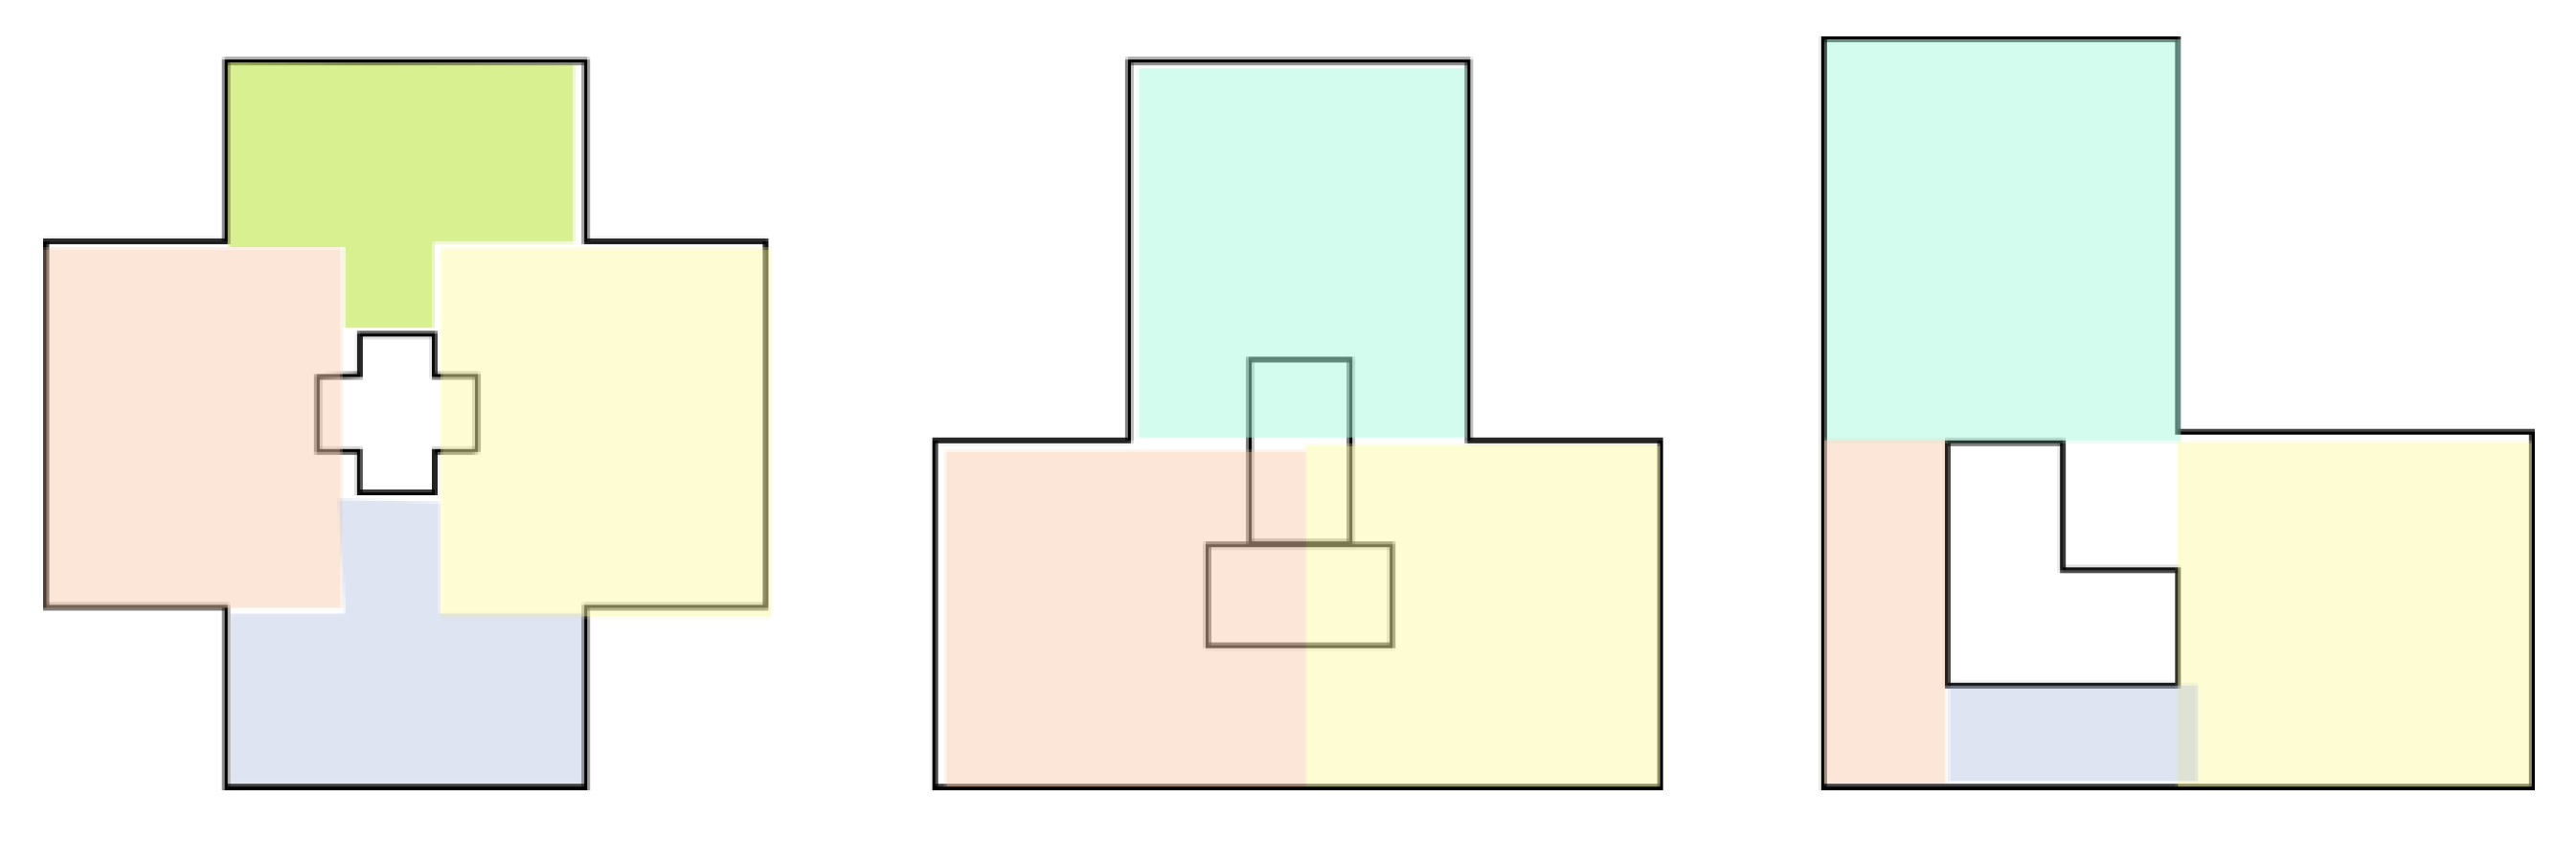
Figure 8.
The algorithm workflow for the room placement.
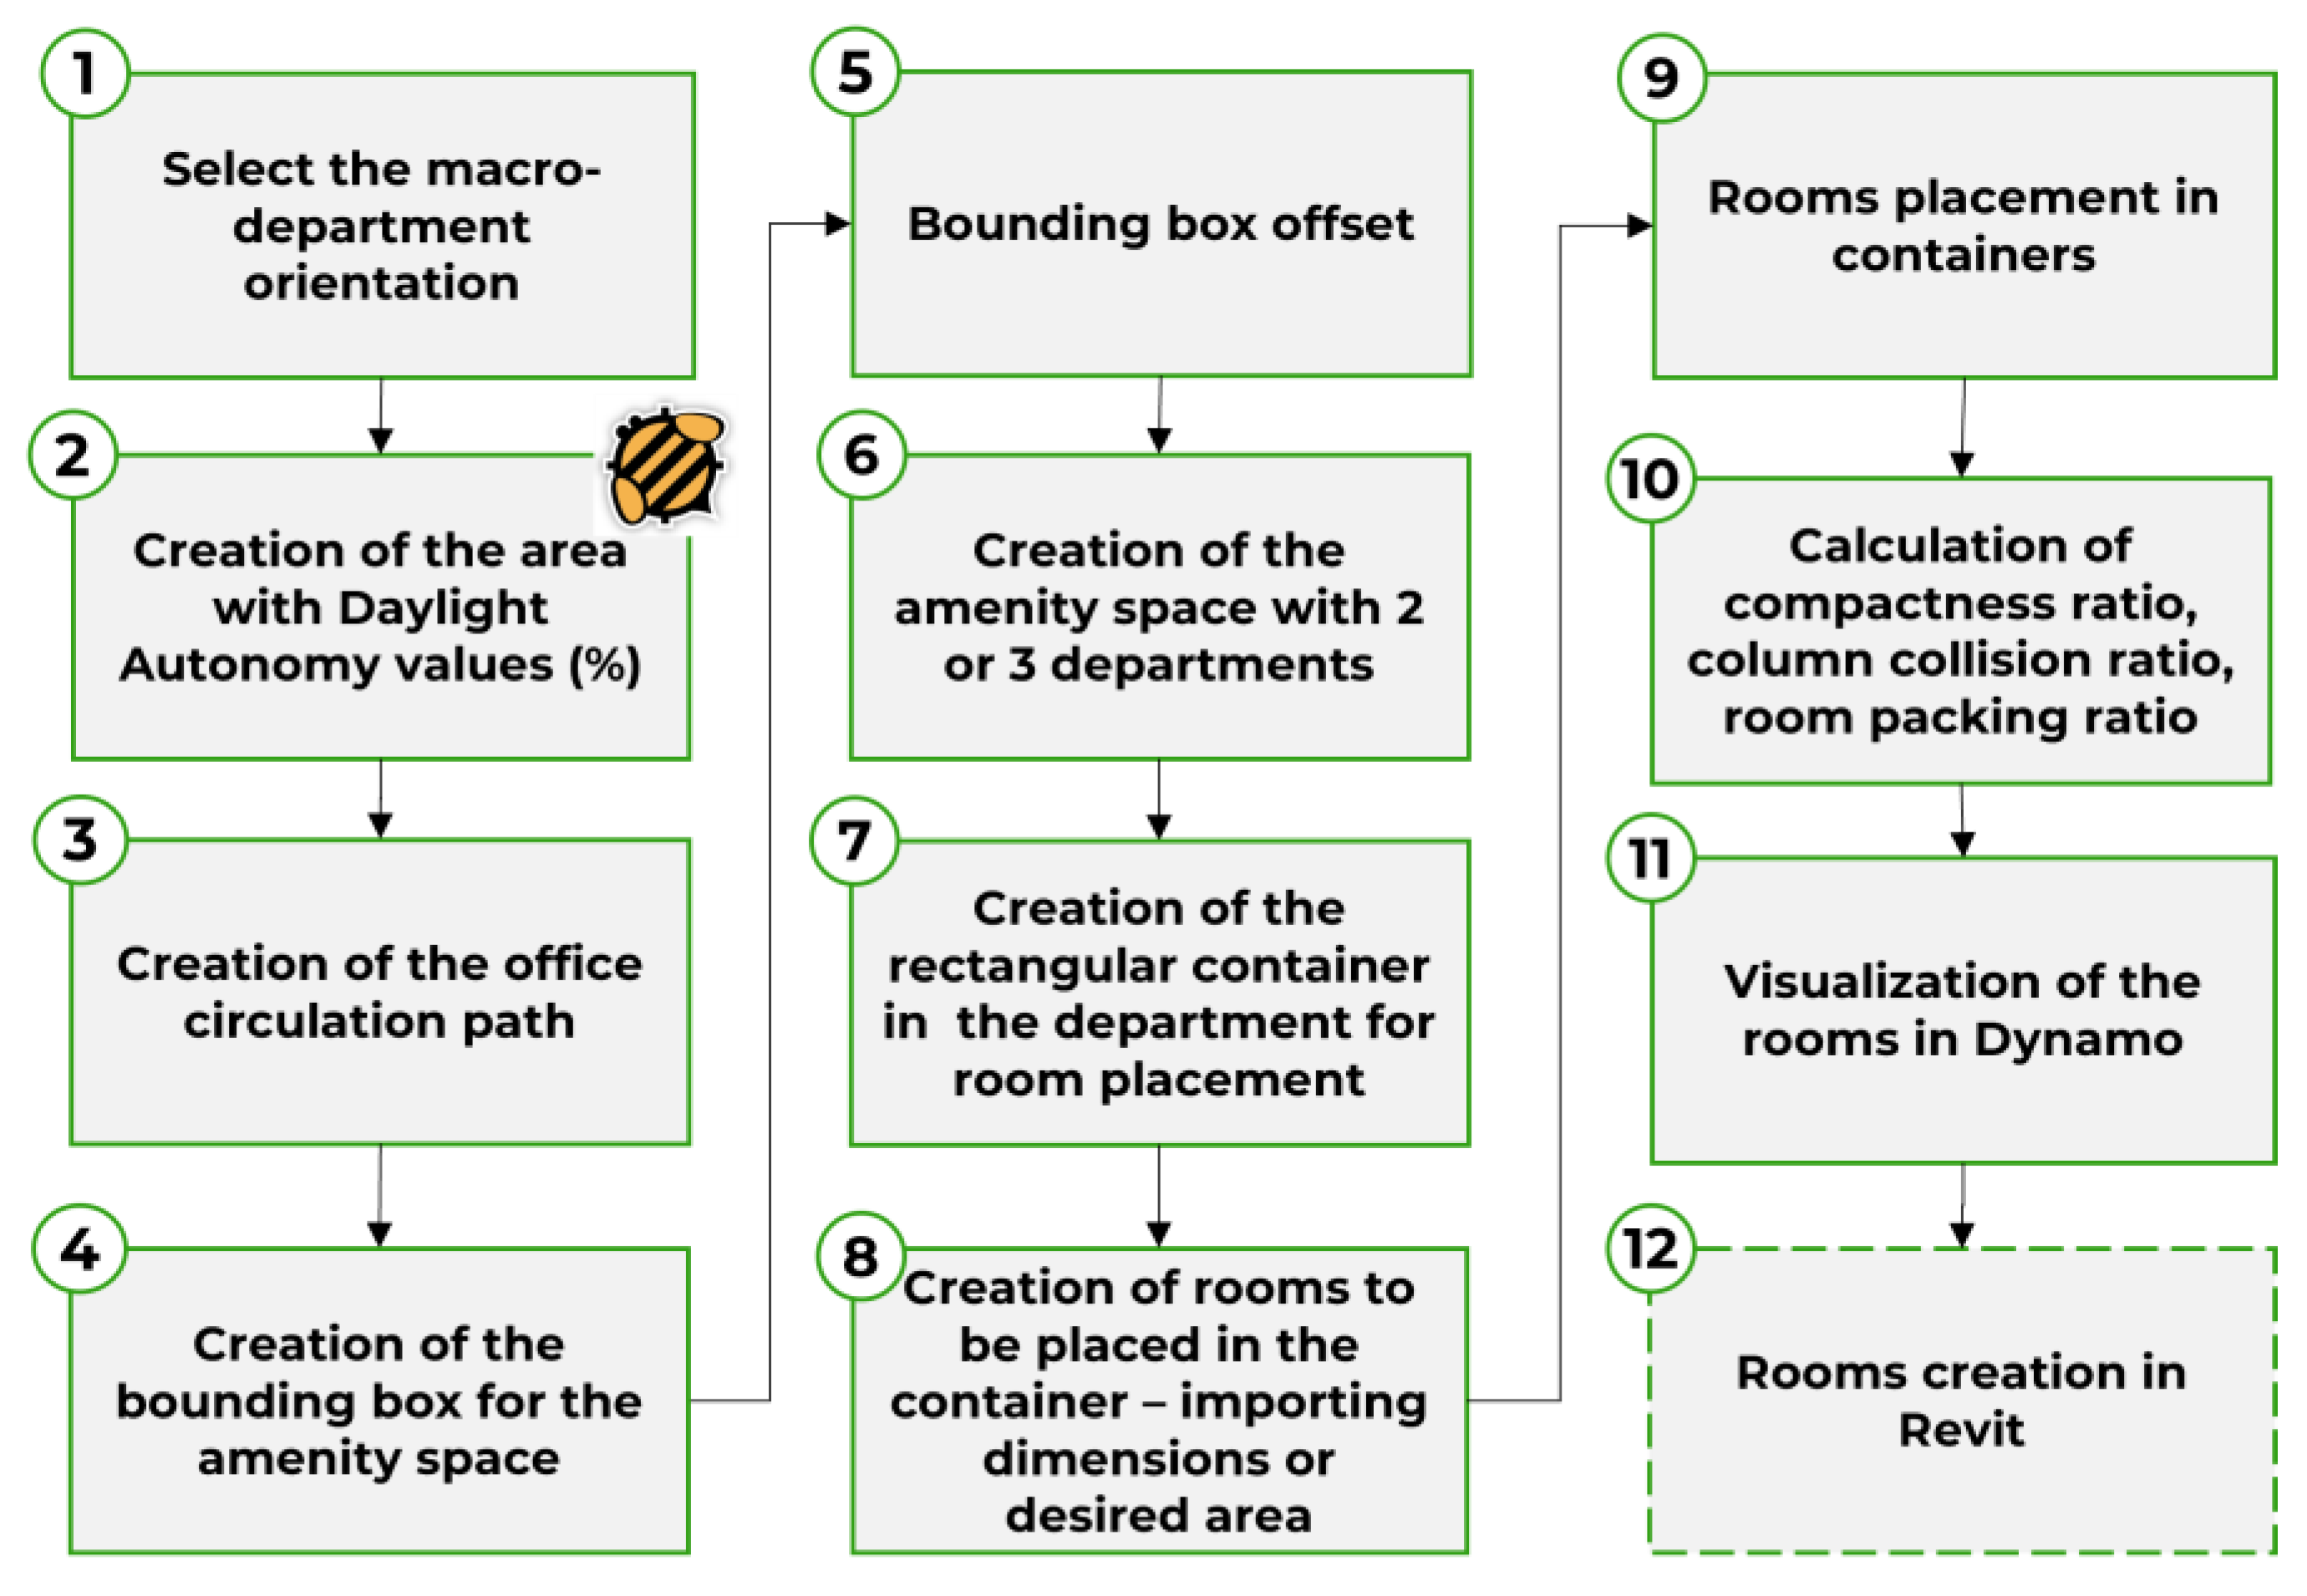
Figure 9.
The algorithm workflow for the desk placement.
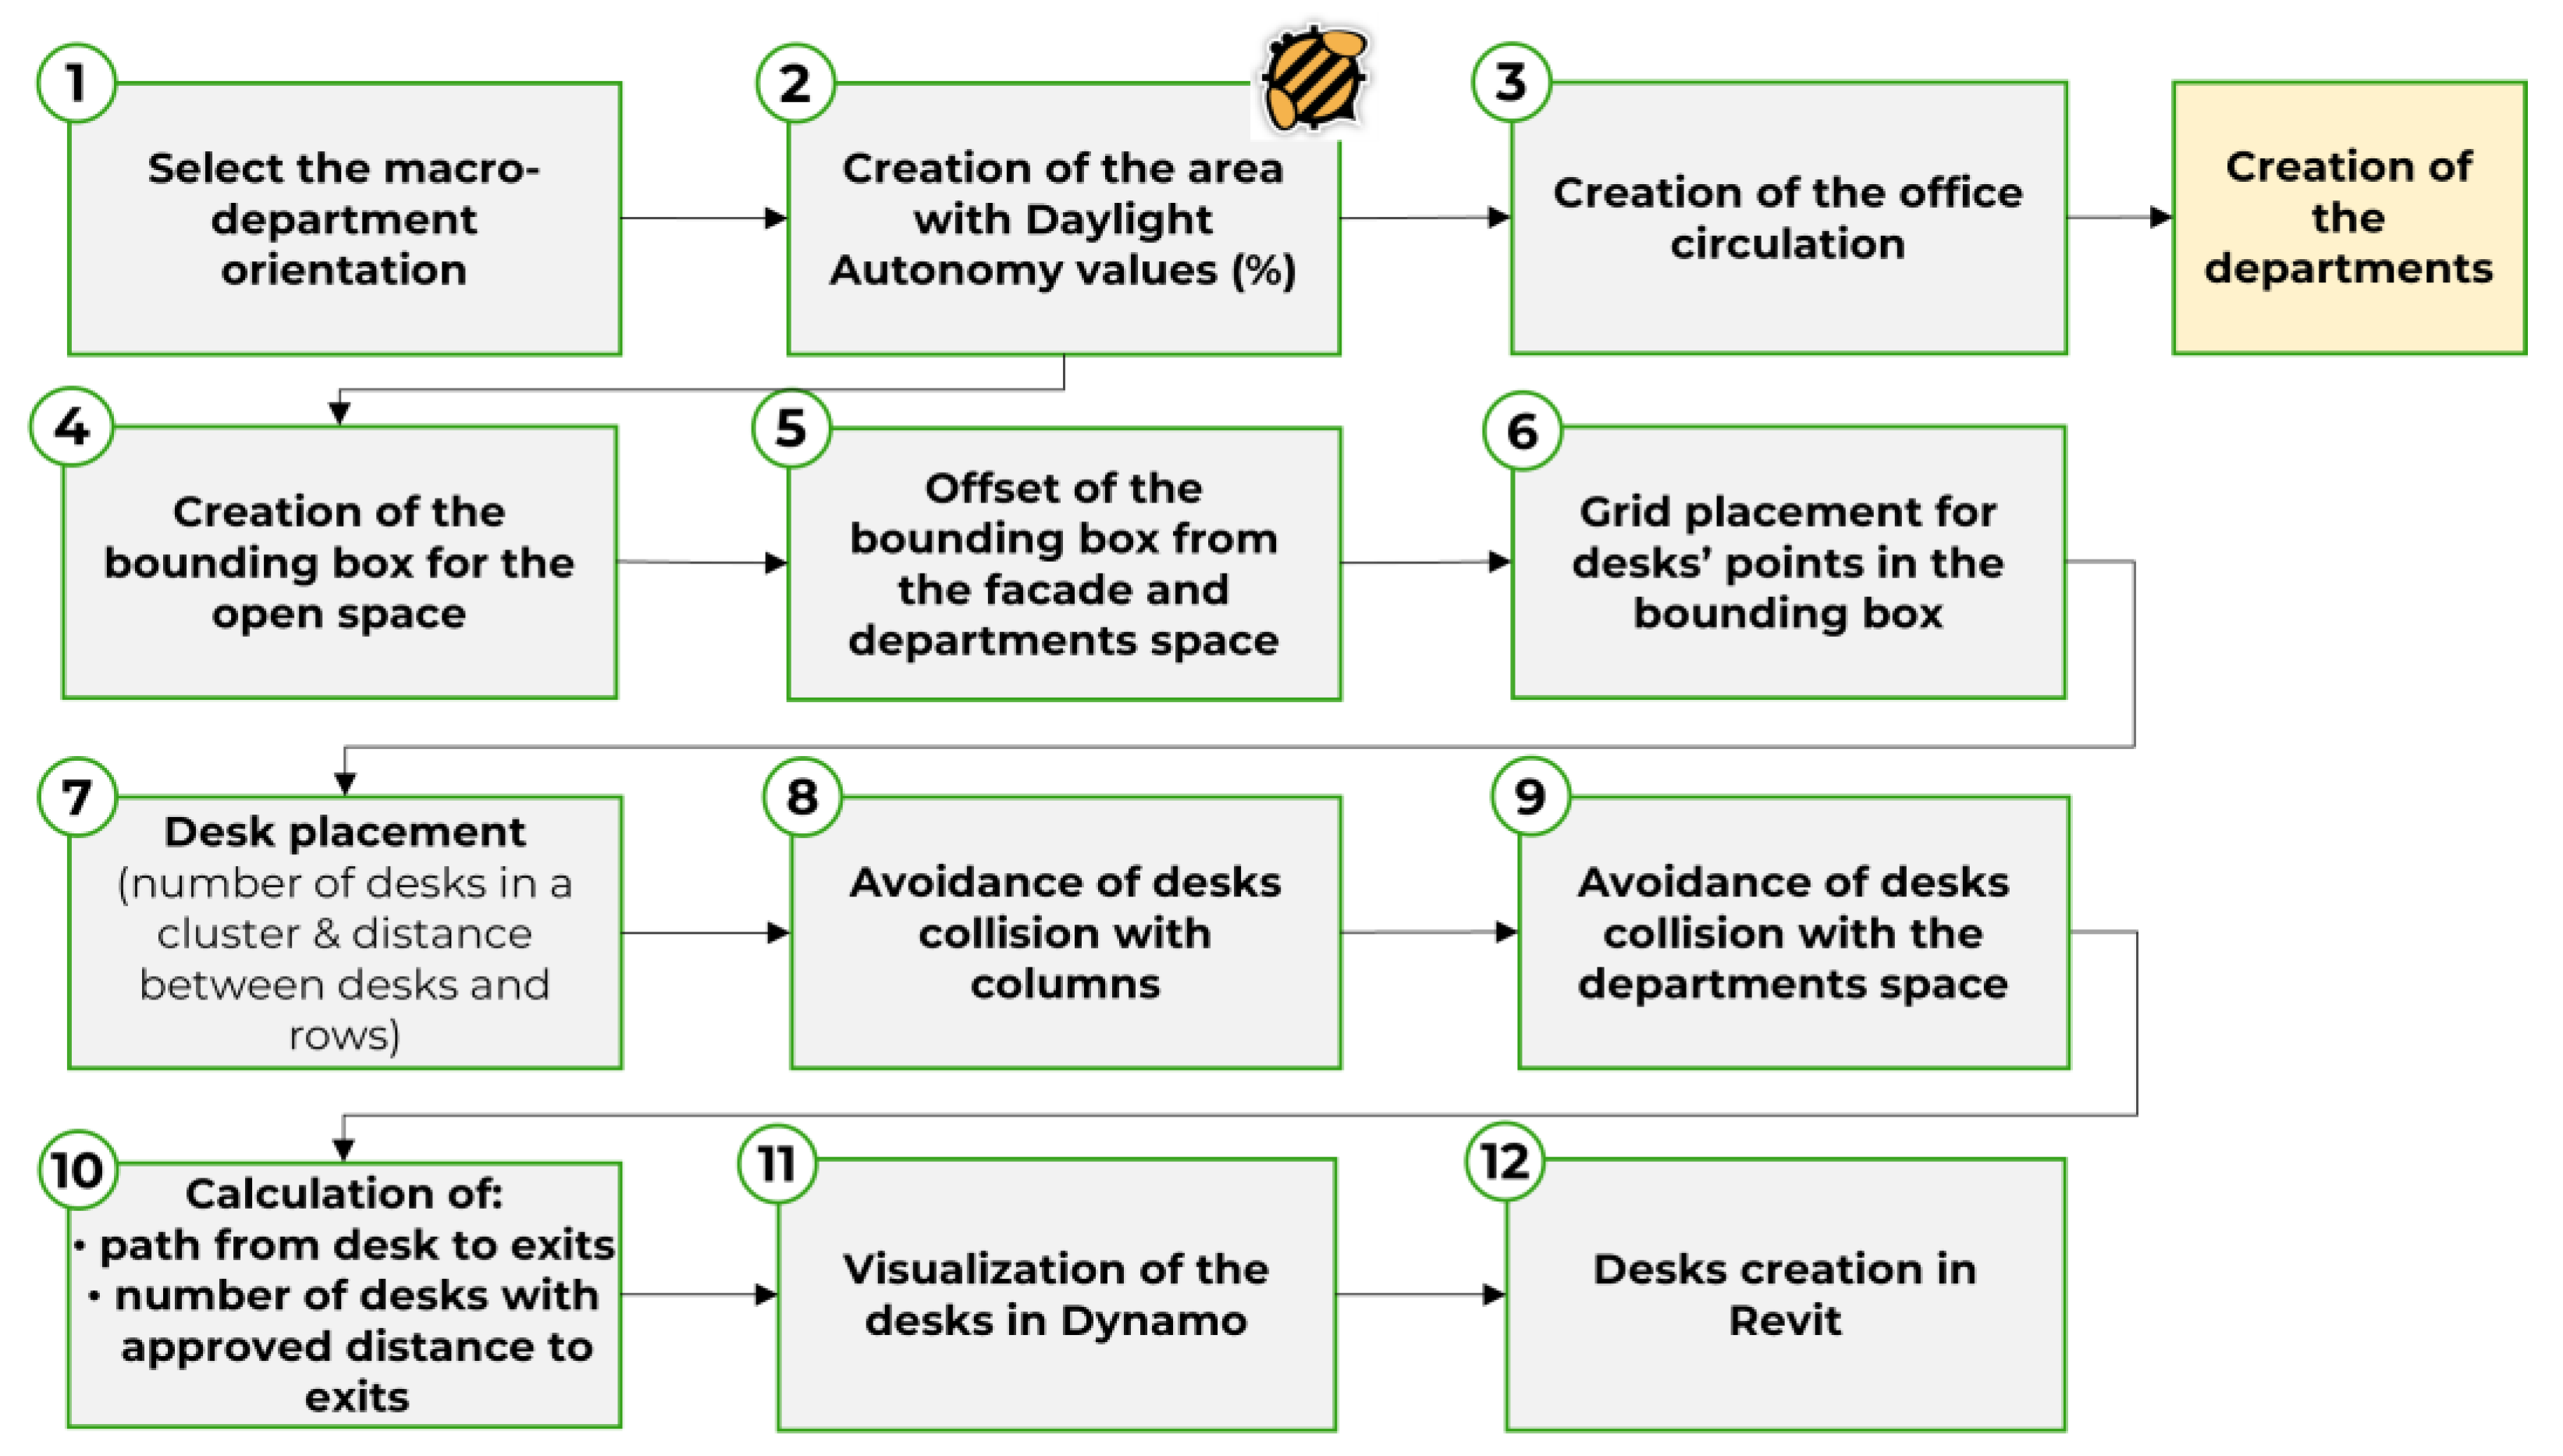
Figure 10.
Algorithmic workflow design with Dynamo for office layout optimization considering daylight.
Figure 10.
Algorithmic workflow design with Dynamo for office layout optimization considering daylight.
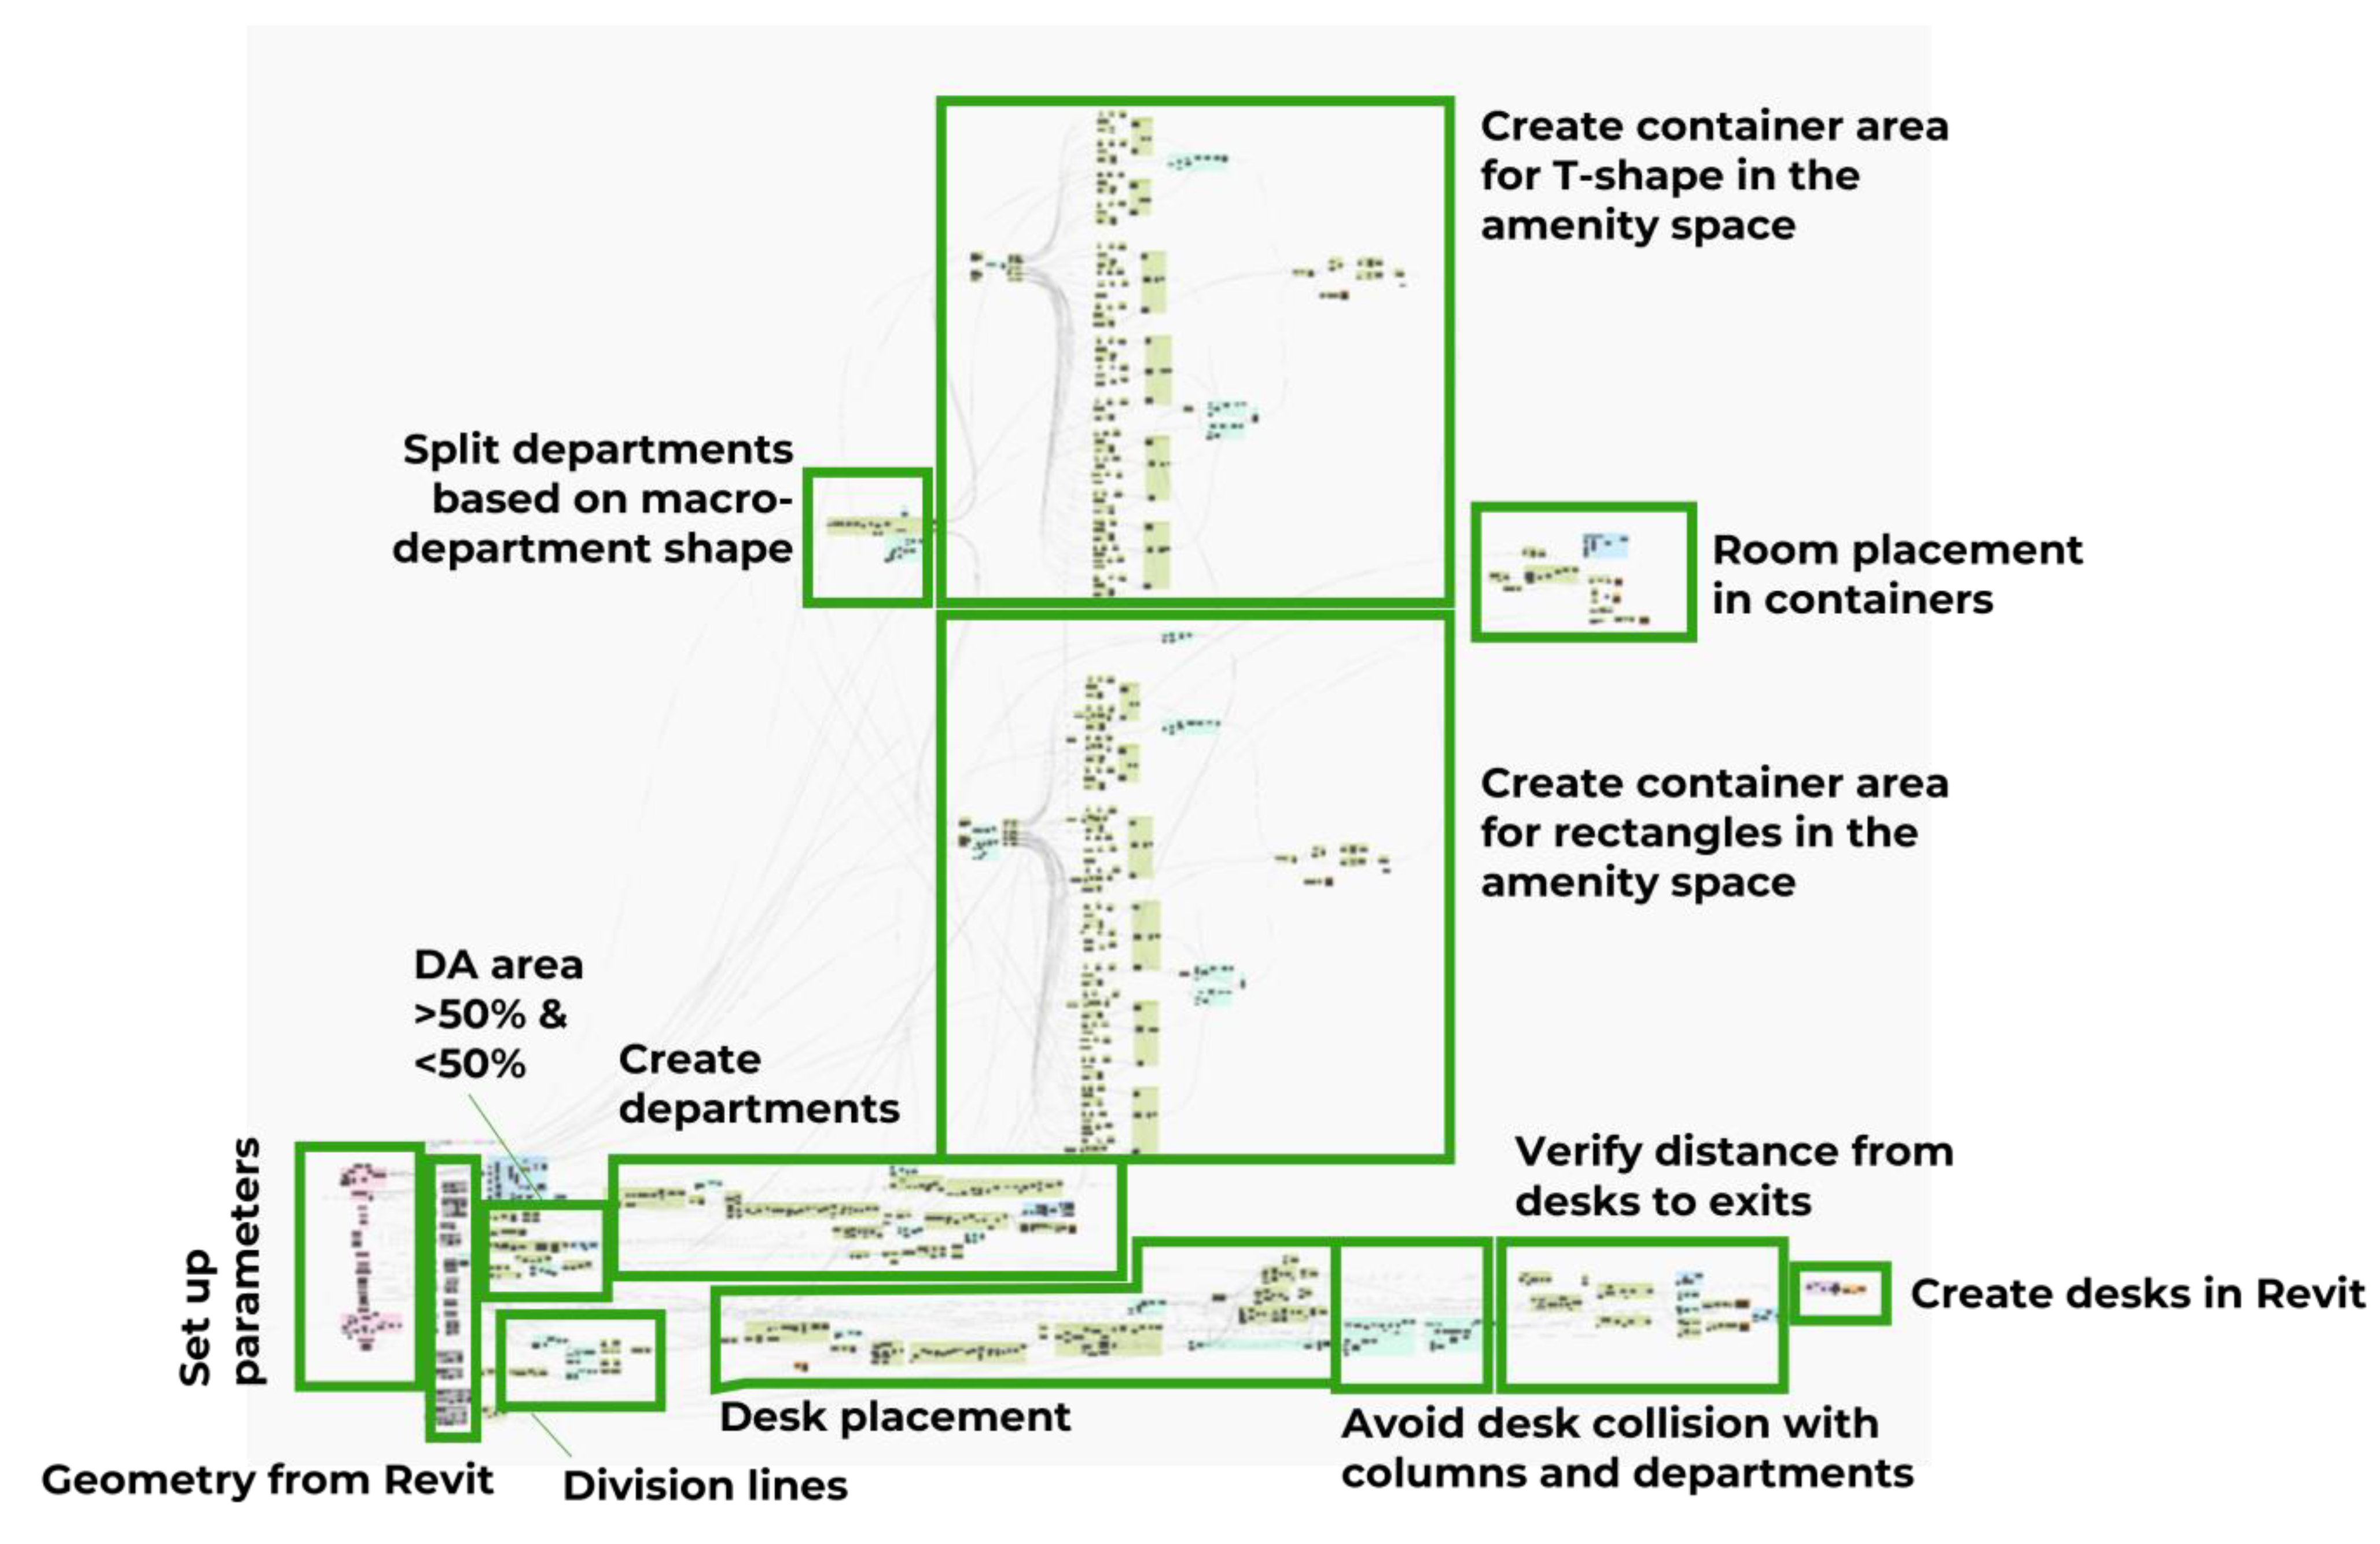
Figure 11.
Case study building.
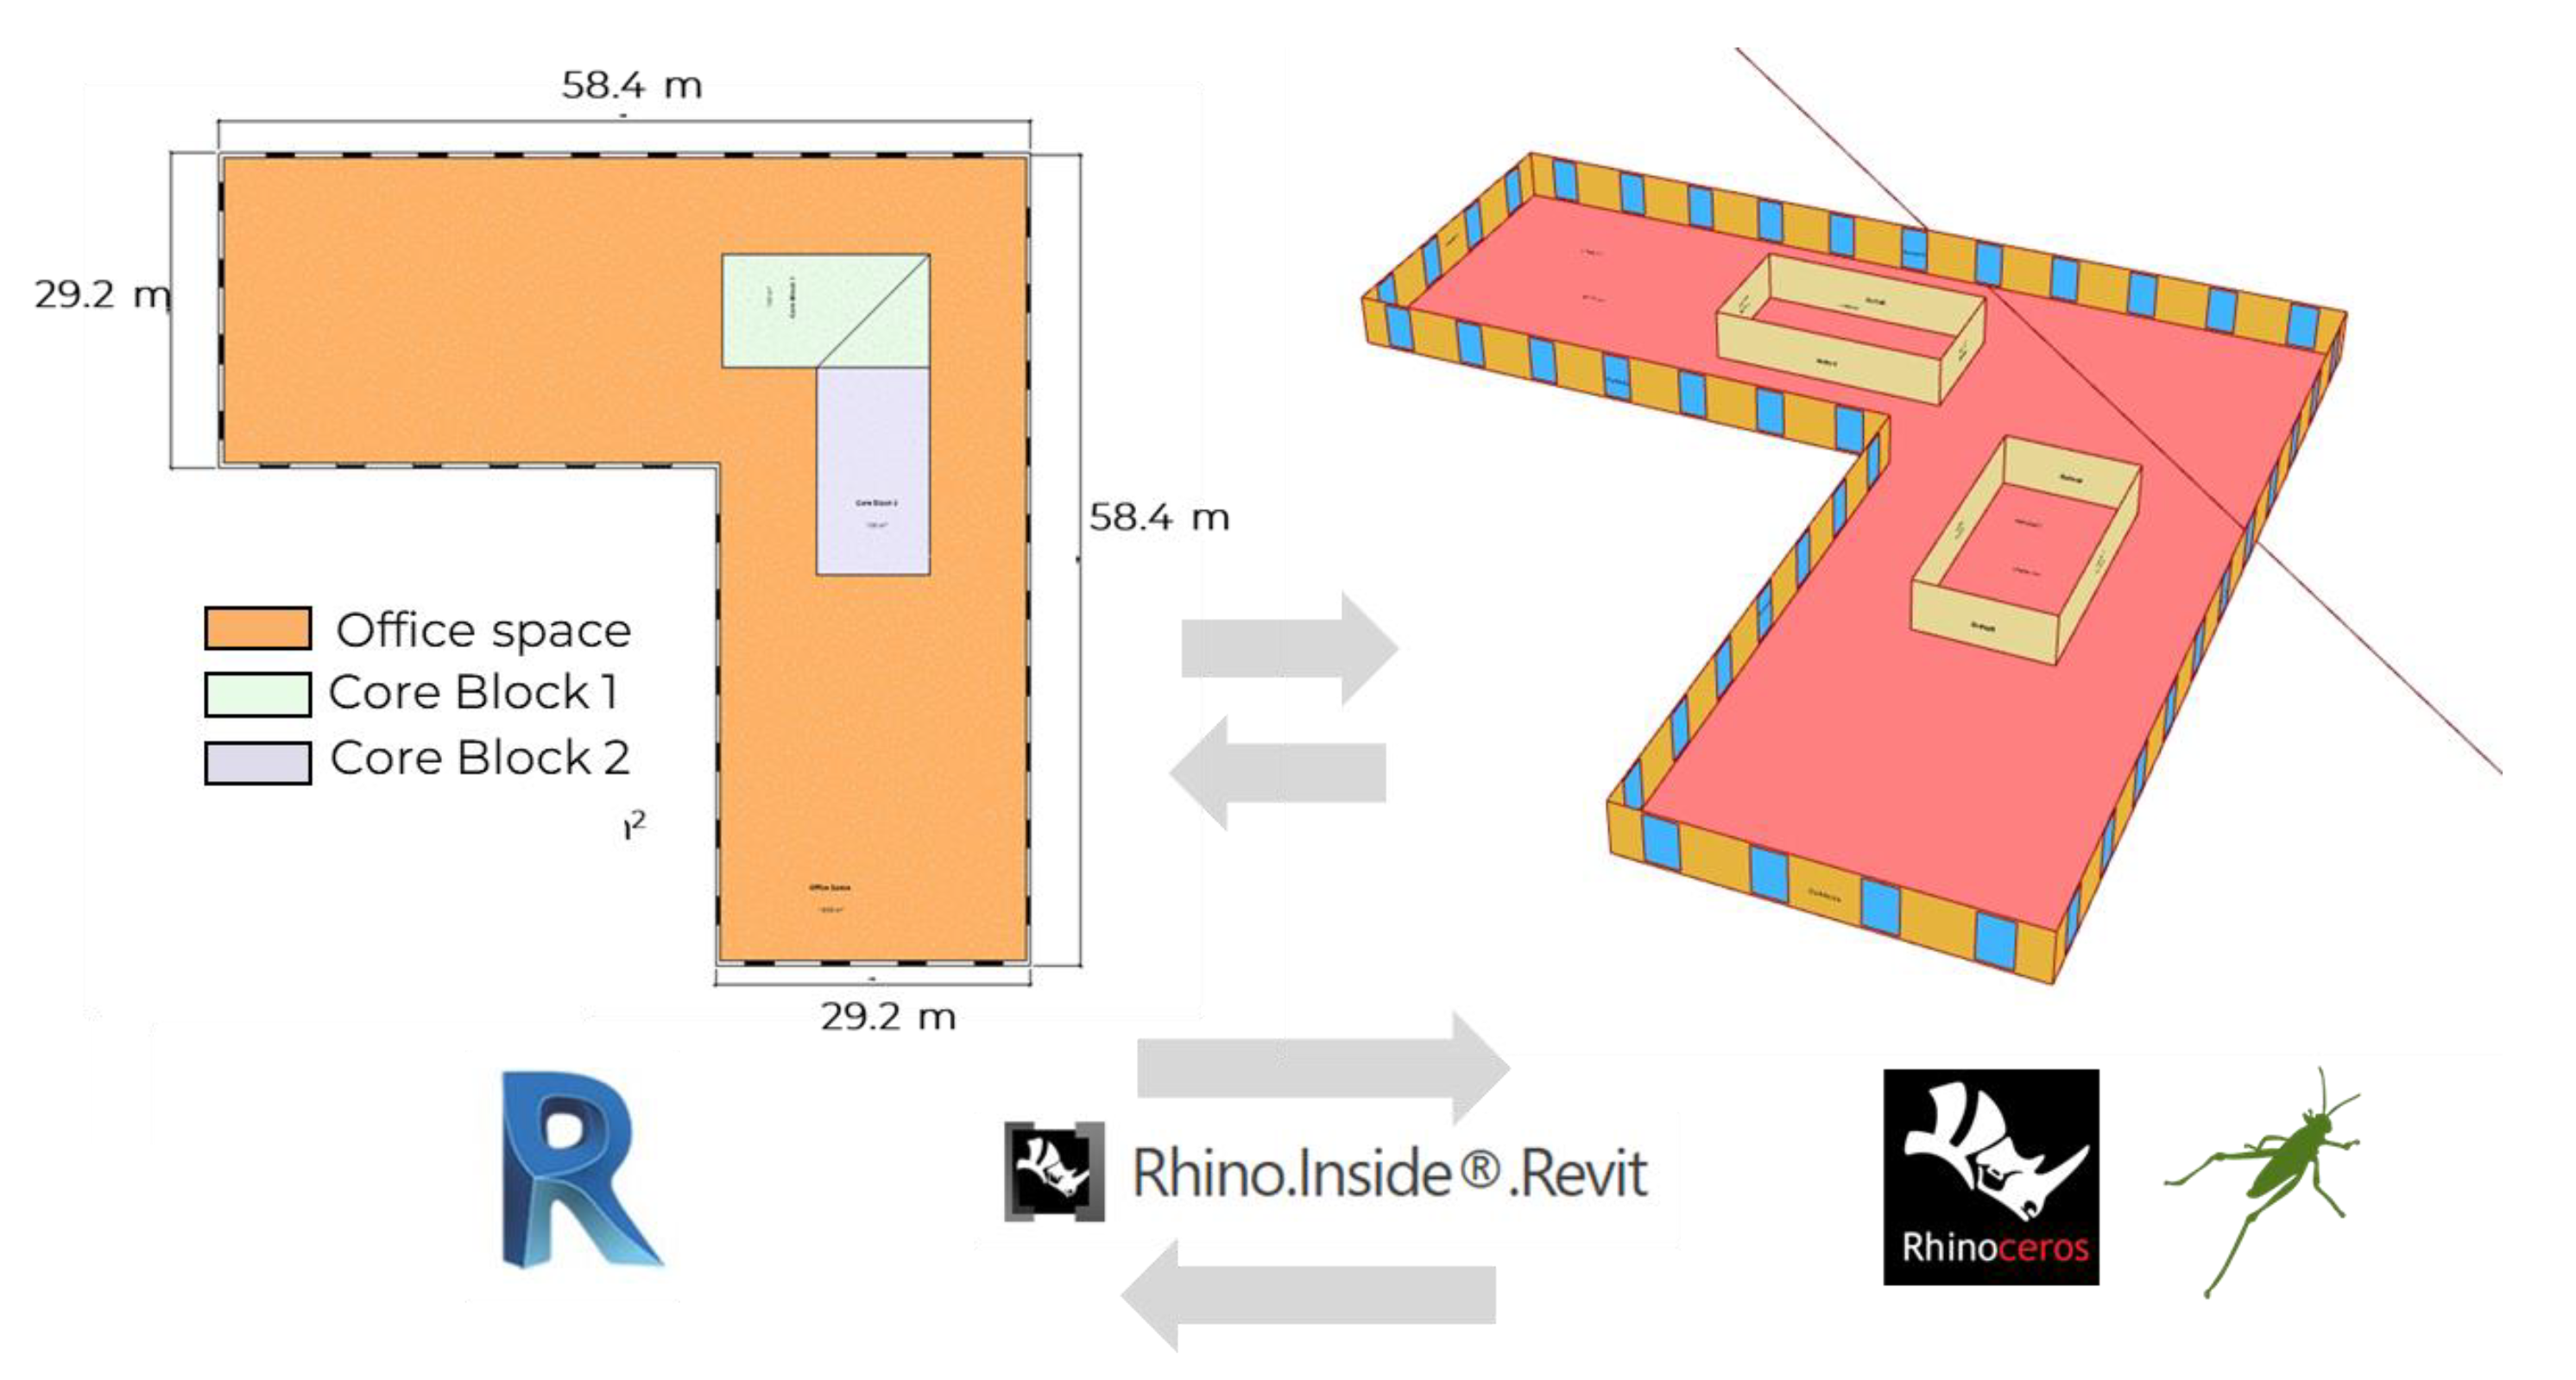
Figure 12.
MOO optimization with Opossum plugin.
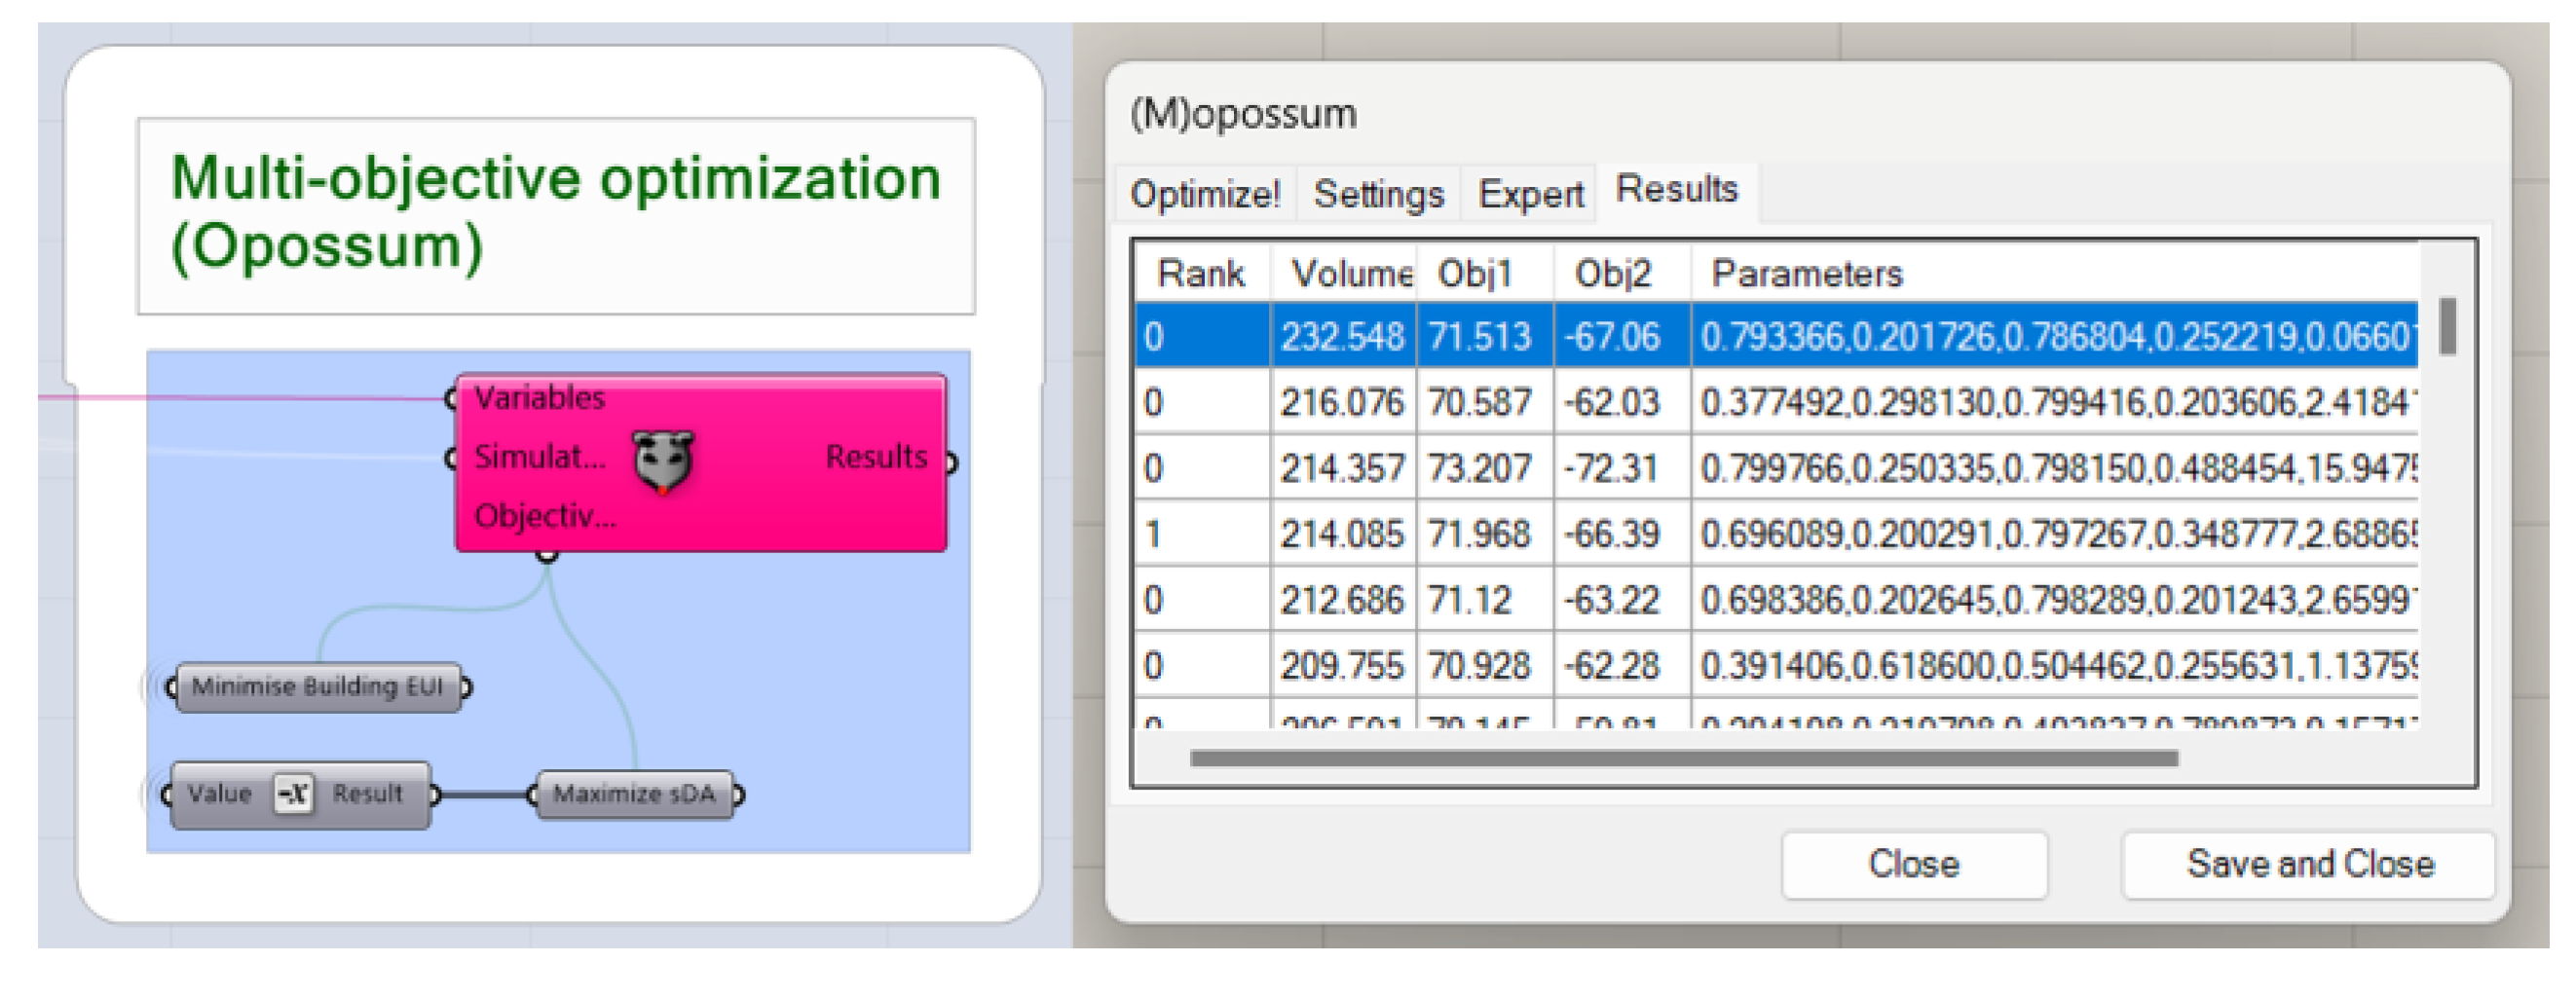
Figure 13.
Excel file with the optimization data exported from Grasshopper.
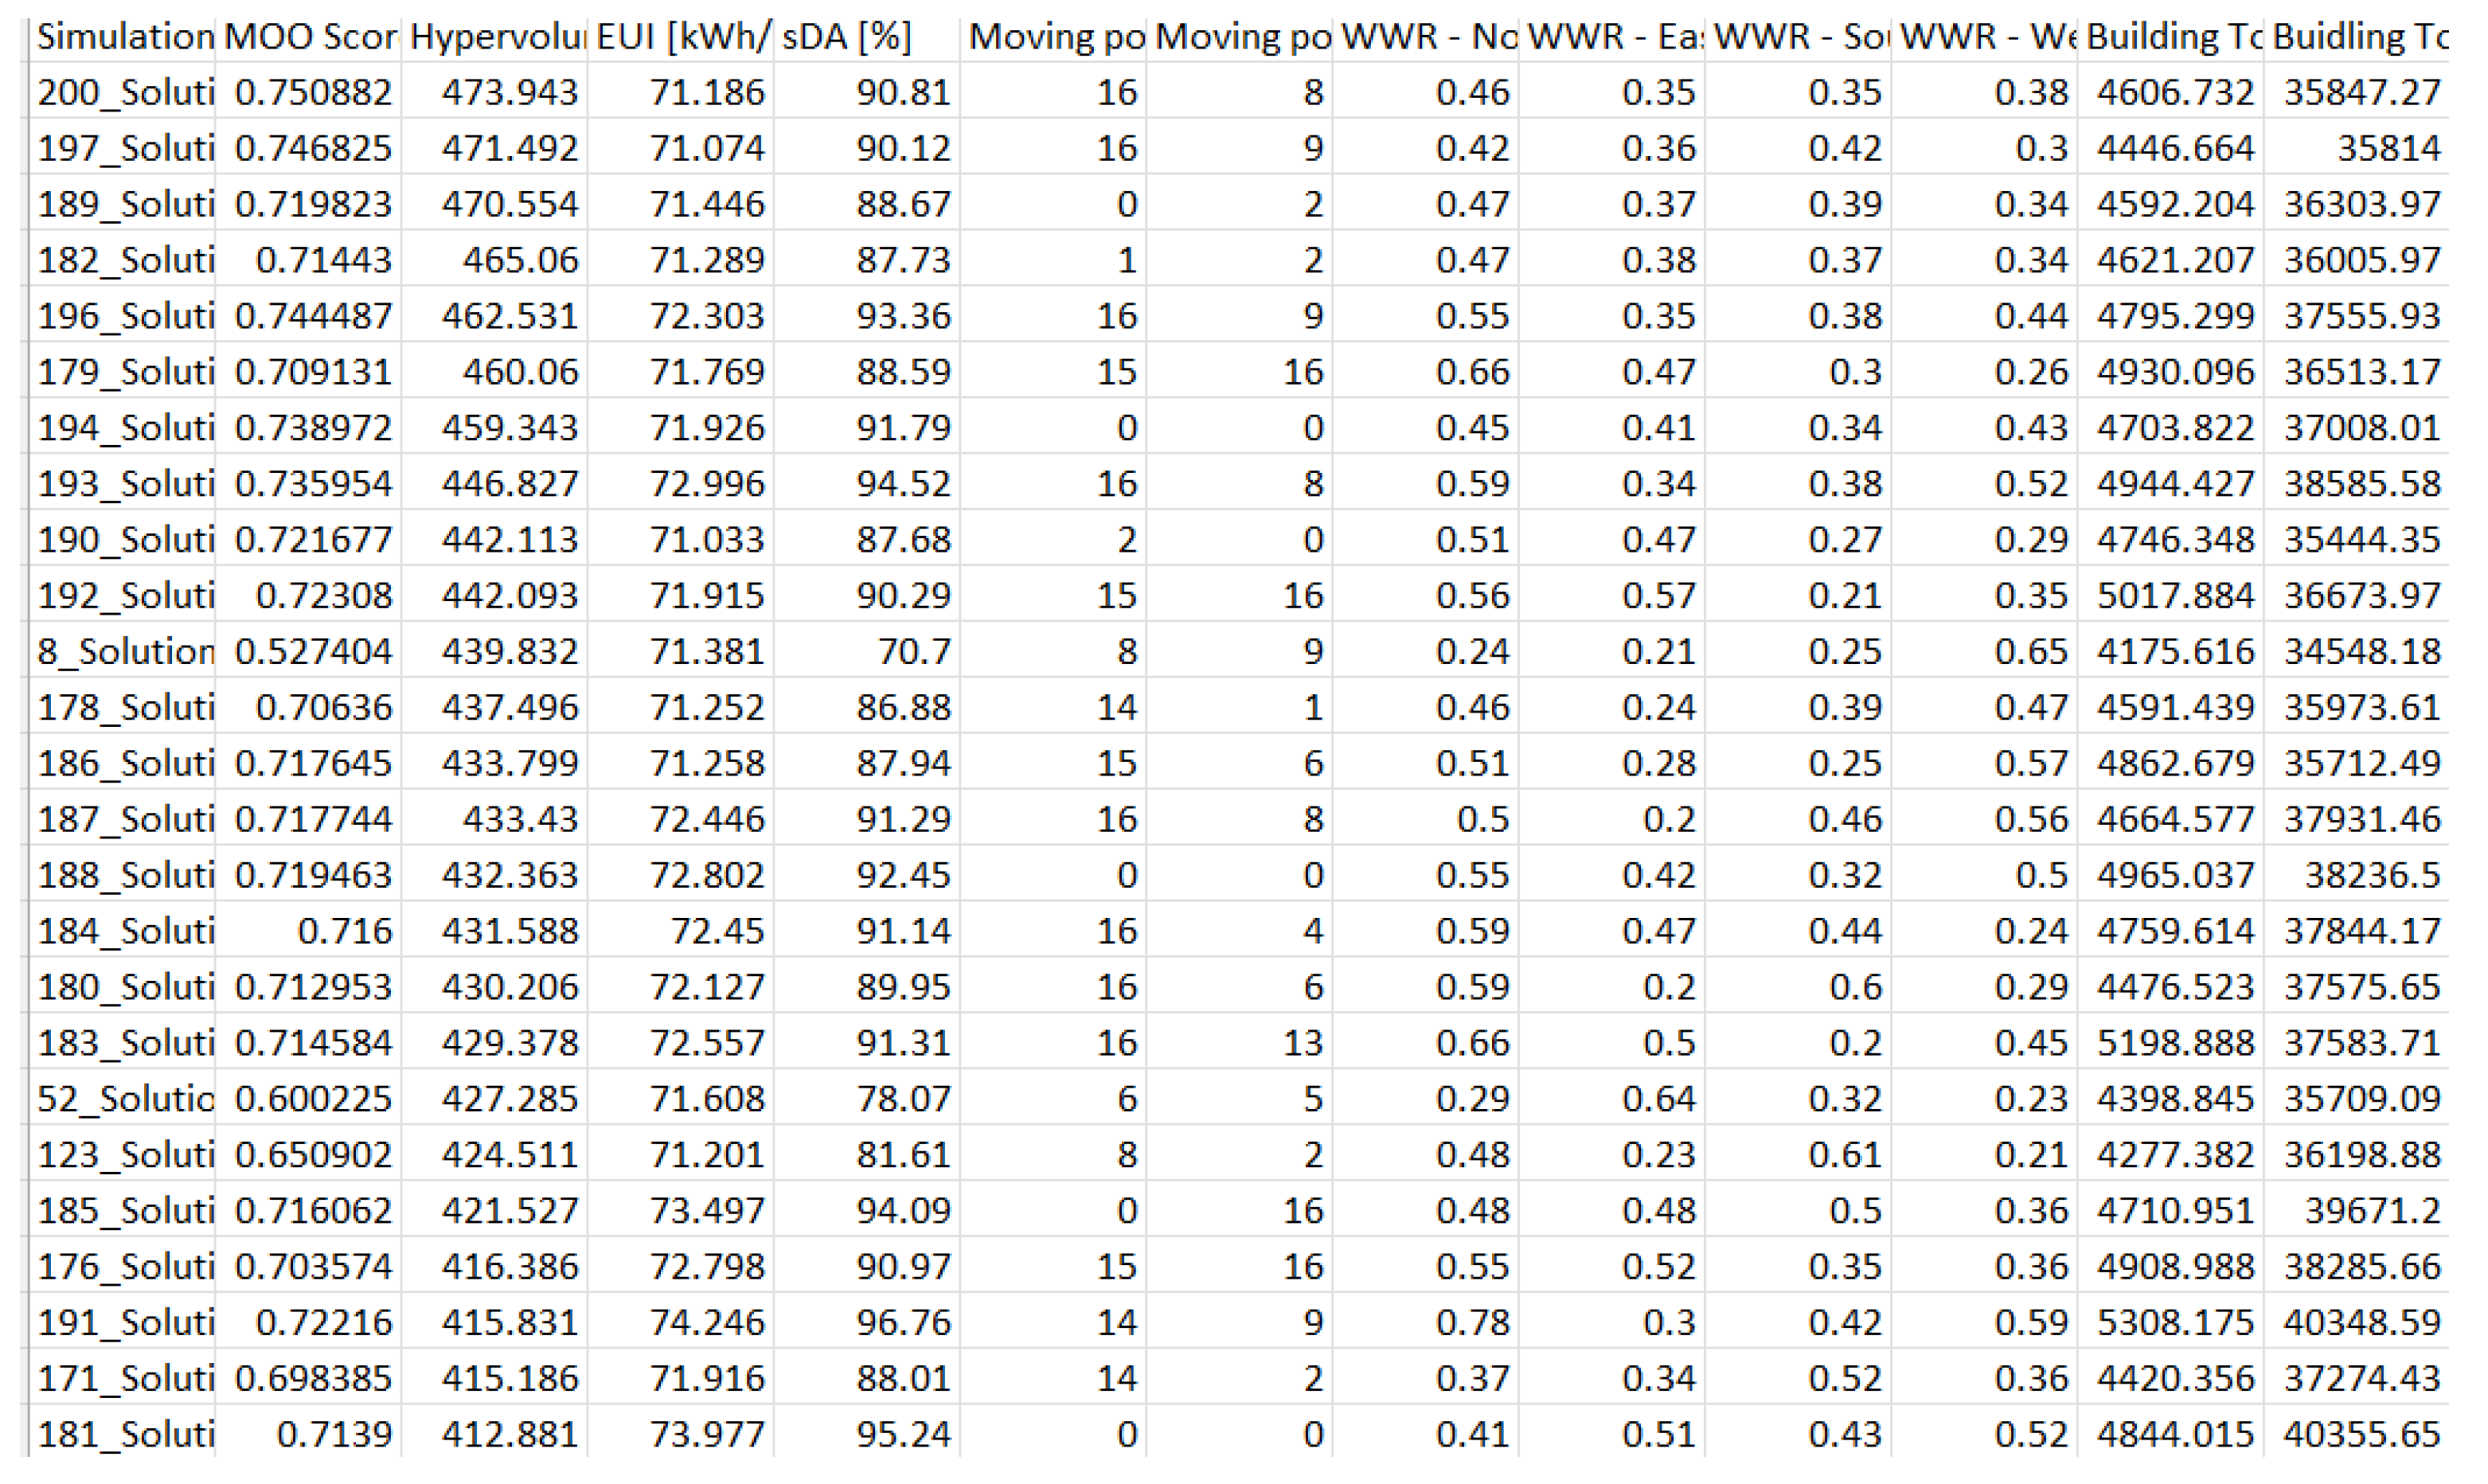
Figure 14.
The interactive dashboard in PowerBI to analyse the optimized solutions.
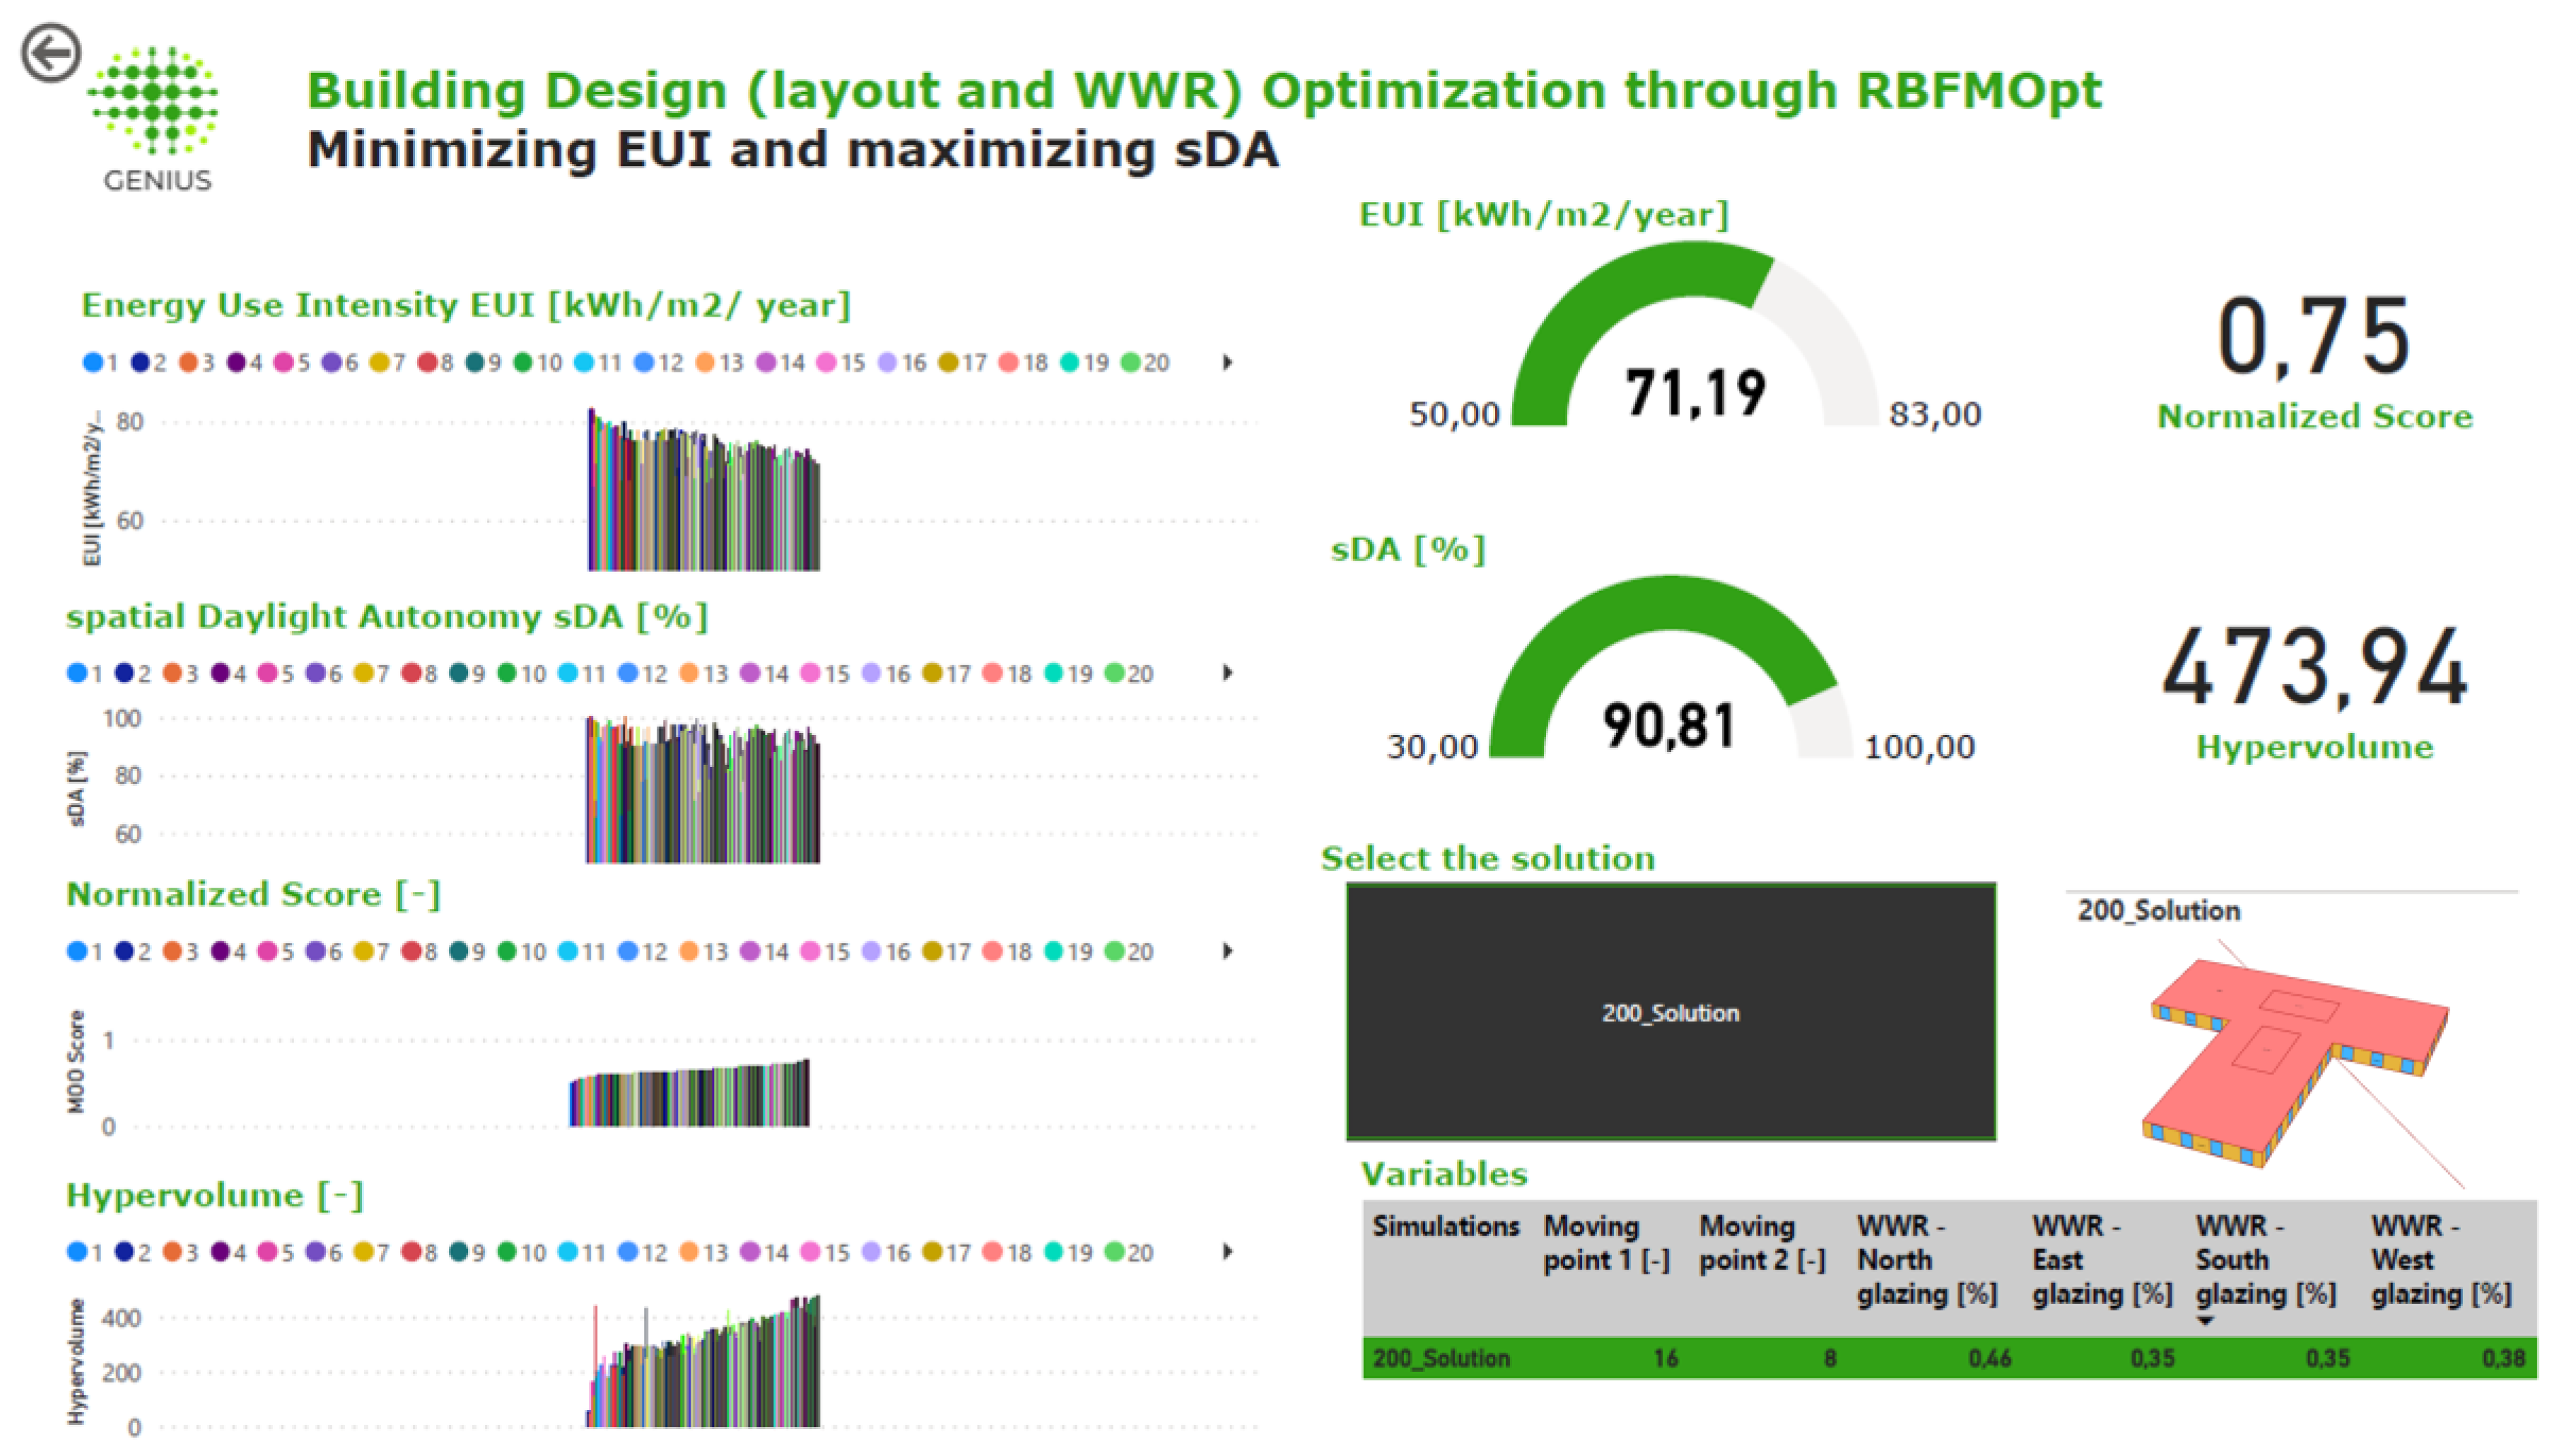
Figure 15.
Optimized building shape using two types of ranking: hypervolume and normalized score.
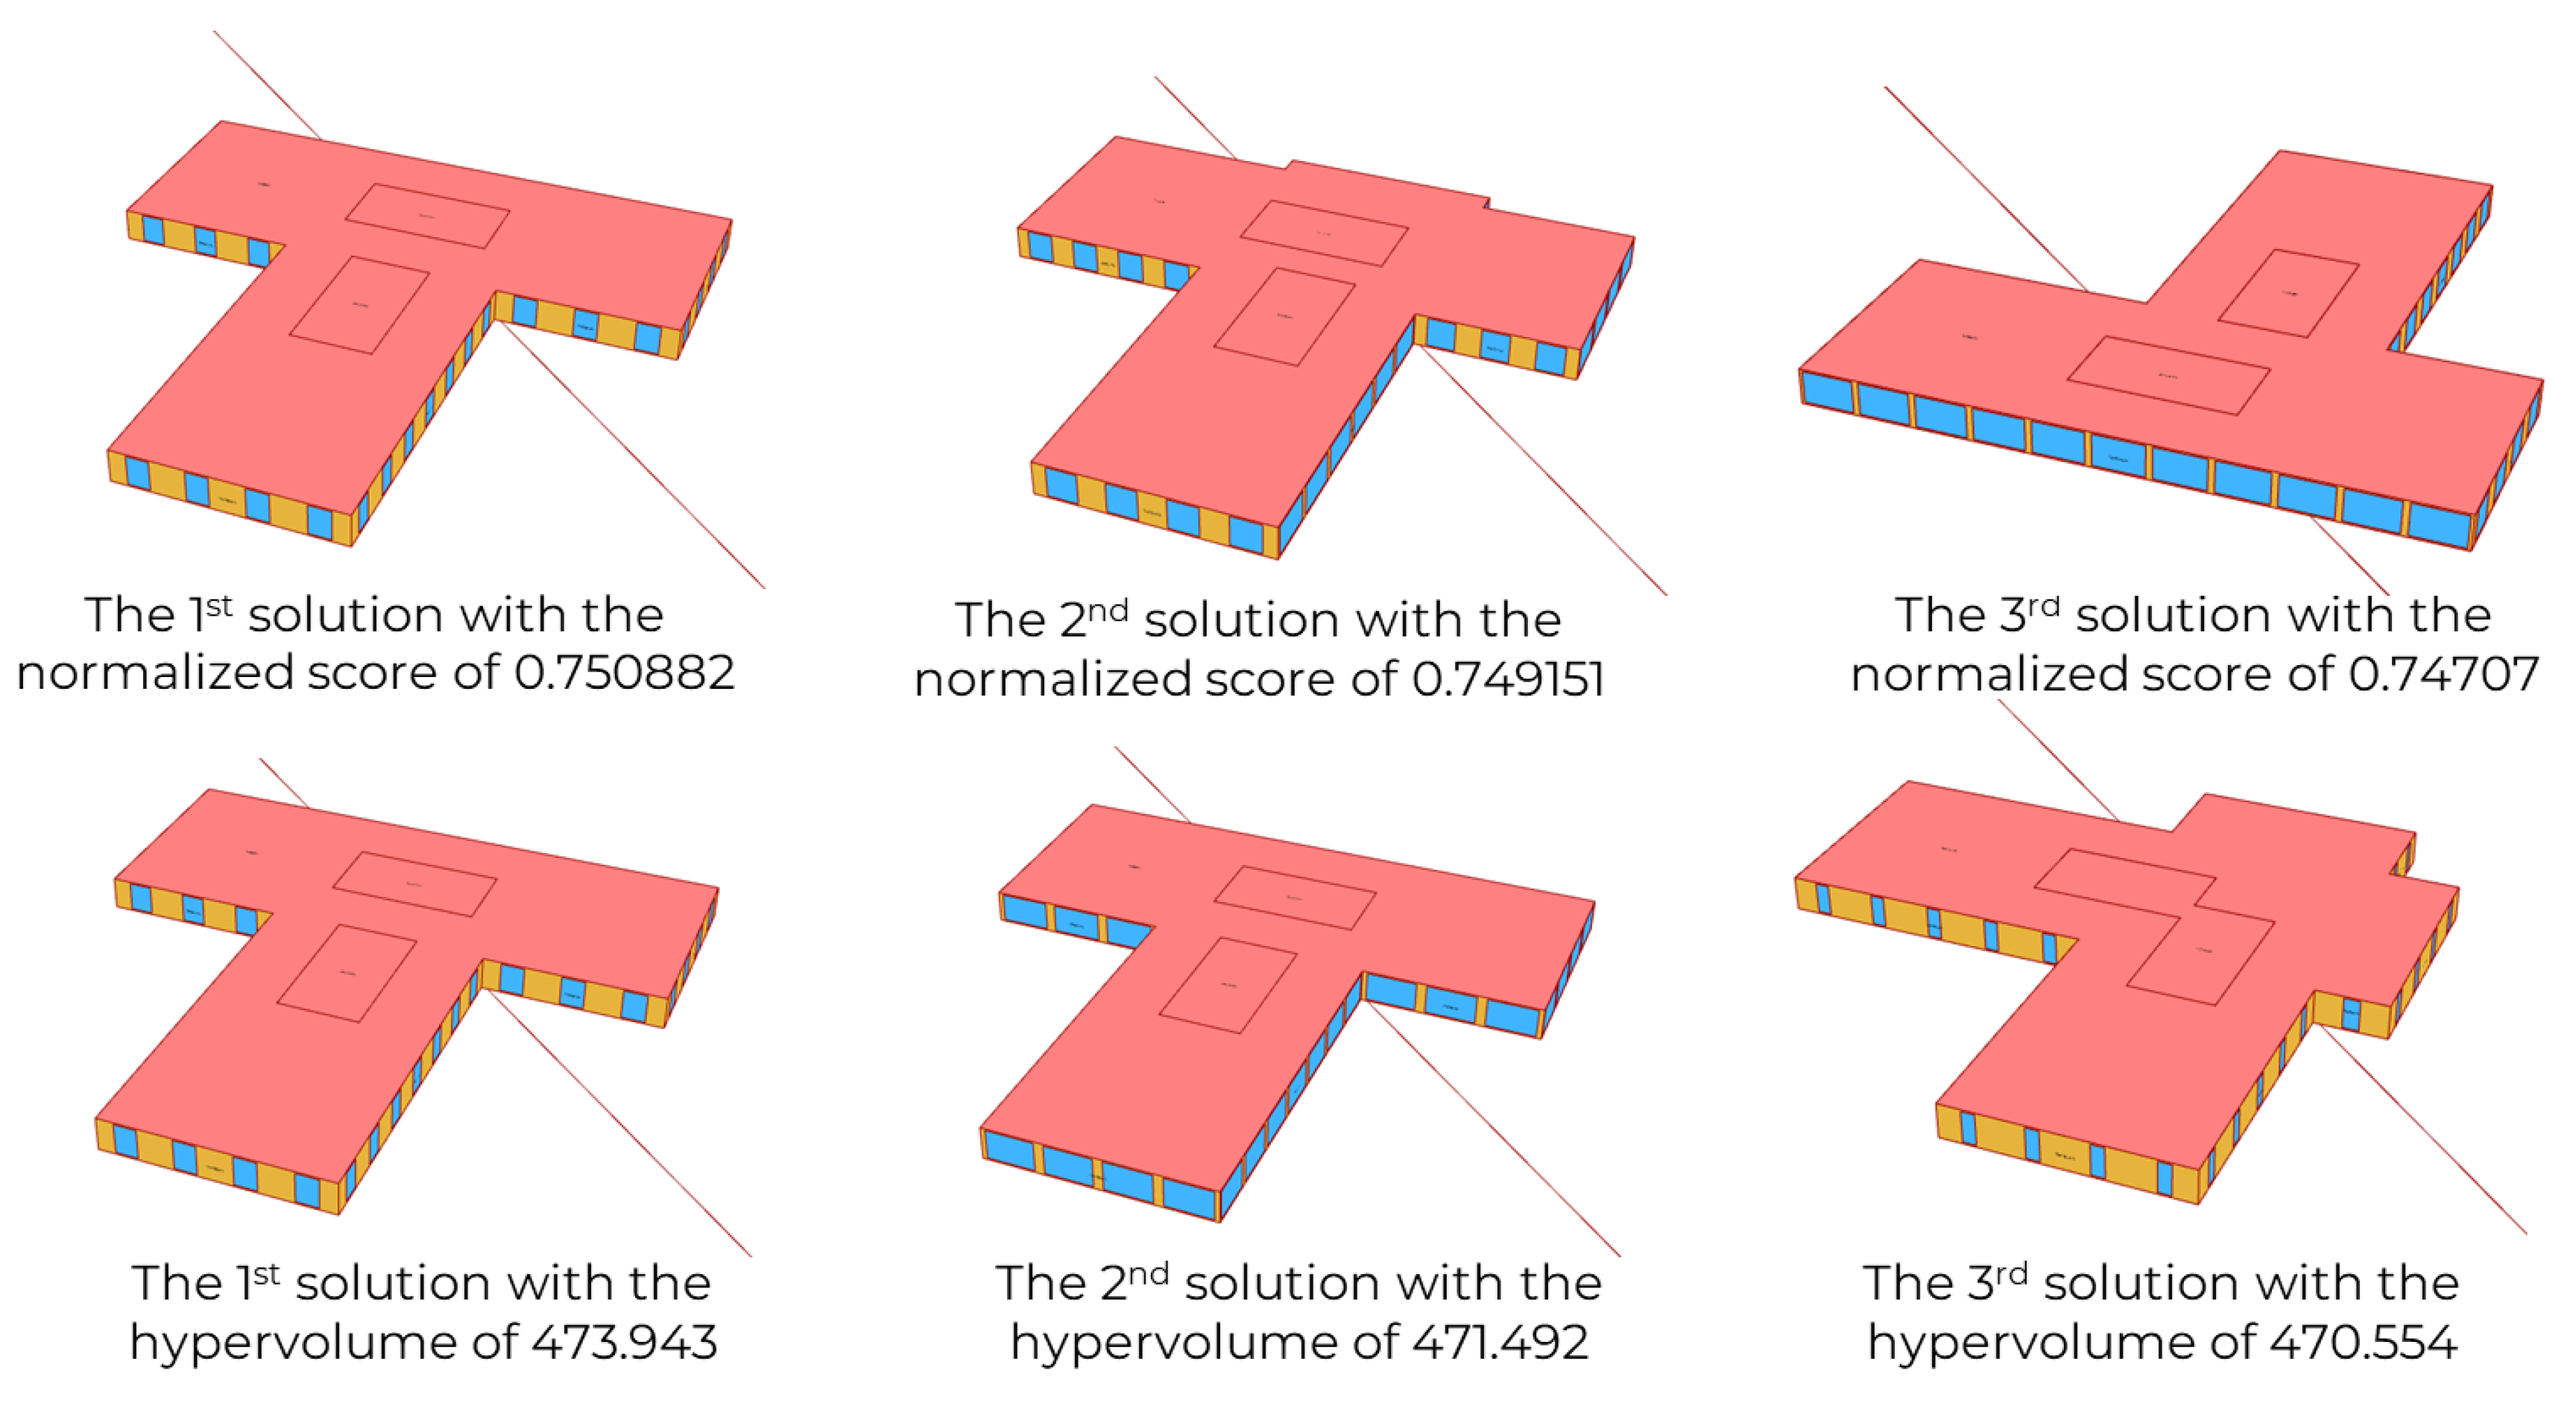
Figure 16.
Annual EUI Energy Use Intensity consumption for cooling and heating.
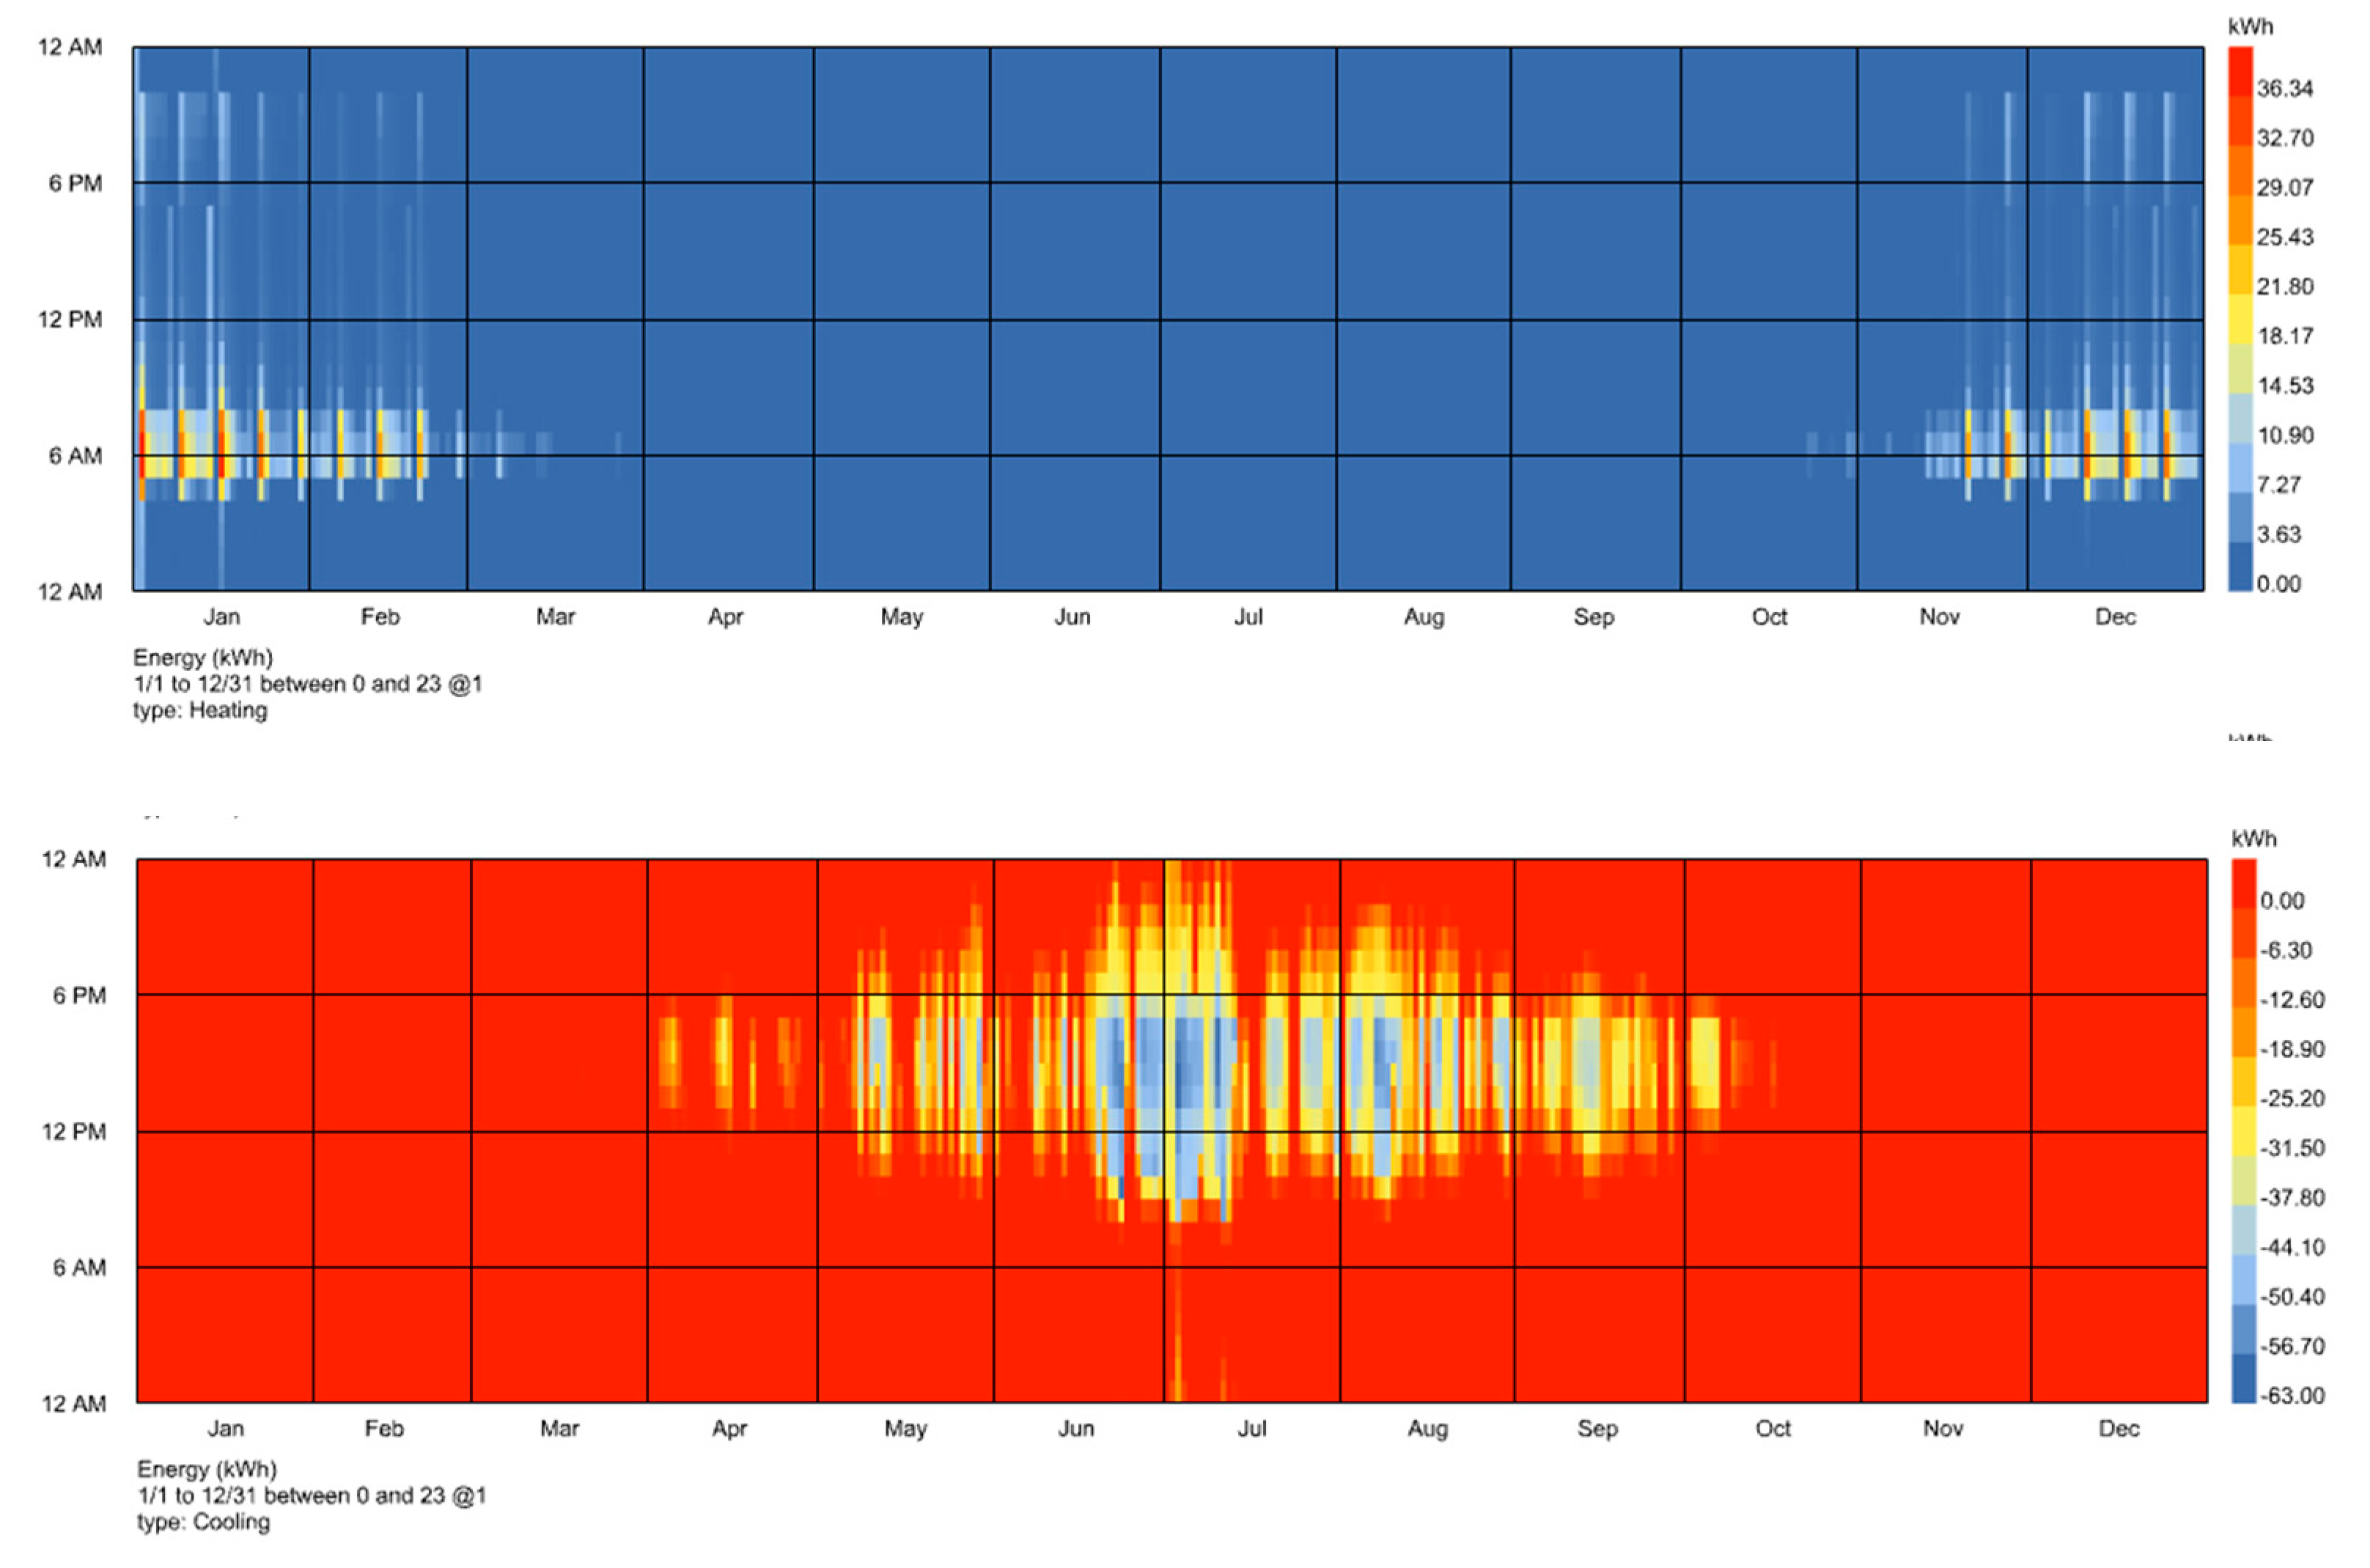
Table 1.
Thermal zone settings for the open office zone in a large office program.
| Thermal zone settings: Open office | |
|---|---|
| People | 0.057 people/m2 |
| Lighting | 6.6 W/m2 |
| Electric Equipment | 7.6 W/m2 |
| Infiltration | 0.000227 m3/s-m2 |
| Ventilation | 0.0024 m3/s-person |
| Setpoint | H: 21 ºC, C:24 ºC |
Table 2.
Thermal zone settings for the stair zone in a large office program.
| Thermal zone settings: Stair | |
|---|---|
| People | - |
| Lighting | 5.3 W/m2 |
| Electric Equipment | - |
| Infiltration | 0.000227 m3/s-m2 |
| Ventilation | - |
| Setpoint | H: 21 ºC, C:24 ºC |
Table 3.
Thermal properties of the external wall.
| Wall 01 | Layers | Thickness [mm] | Thermal conductivity [W/(m*K) |
|---|---|---|---|
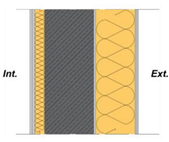 |
Interior finishing (plaster) | 10 | 0.8 |
| Gypsum fibreboard | 25 | 0.36 | |
| Insulation (Rockwool) | 50 | 0.033 | |
| Concrete wall | 250 | 2.3 | |
| Adhesive | 10 | 0.16 | |
| Insulation (Rockwool)Basecoat | 2006 | 0.0350.16 | |
| Exterior finishing (plaster) | 10 | 0.8 |
Table 4.
Thermal properties of the internal wall.
| Wall 02 | Layers | Thickness [mm] | Thermal conductivity [W/(m*K) |
|---|---|---|---|
 |
Interior finishing (plaster) | 10 | 0.8 |
| Concrete wall | 250 | 2.3 | |
| Exterior finishing (plaster) | 10 | 0.8 |
Table 5.
Interior material properties.
| Materials | Int. wall | Ext. wall | Floor | Ceiling | Ground plane | Shading system | Windows |
|---|---|---|---|---|---|---|---|
| Reflectance [%] | 50 | 20 | 20 | 70 | 20 | 70 | - |
| Transmissivity [%] | - | - | - | - | - | - | 70 |
Table 6.
Low-quality Radiance parameters.
| Radiance parameters | -aa | -ab | -ad | -ar | -as |
|---|---|---|---|---|---|
| Low | 0.25 | 3 | 5000 | 16 | 128 |
Table 9.
Optimization output data for the three best solutions for each ranking type.
| Ranking | Solution | Ranking value | EUI [kWh/m2/year] |
sDA [%] |
WWR North | WWR - East | WWR - South | WWR - West |
|---|---|---|---|---|---|---|---|---|
| Hypervolume | 1 | 473.943 | 71.186 | 90.81 | 0.46 | 0.35 | 0.35 | 0.38 |
| 2 | 471.492 | 71.074 | 90.12 | 0.42 | 0.36 | 0.42 | 0.3 | |
| 3 | 470.554 | 71.446 | 88.67 | 0.47 | 0.37 | 0.39 | 0.34 | |
| Normalized EUI and sDA | 1 | 0.750882 | 71.186 71.186 |
90.81 | 0.46 | 0.35 | 0.35 | 0.38 |
| 2 | 0.749151 | 90.65 | 0.46 | 0.35 | 0.35 | 0.38 | ||
| 3 | 0.74707 | 71.482 | 91.29 | 0.5 | 0.34 | 0.33 | 0.43 |
Disclaimer/Publisher’s Note: The statements, opinions and data contained in all publications are solely those of the individual author(s) and contributor(s) and not of MDPI and/or the editor(s). MDPI and/or the editor(s) disclaim responsibility for any injury to people or property resulting from any ideas, methods, instructions or products referred to in the content. |
© 2024 by the authors. Licensee MDPI, Basel, Switzerland. This article is an open access article distributed under the terms and conditions of the Creative Commons Attribution (CC BY) license (https://creativecommons.org/licenses/by/4.0/).
Copyright: This open access article is published under a Creative Commons CC BY 4.0 license, which permit the free download, distribution, and reuse, provided that the author and preprint are cited in any reuse.


