Submitted:
12 May 2023
Posted:
15 May 2023
You are already at the latest version
Abstract
Our previous studies showed pure blue (B) spectra from LEDs can promote shade avoidance responses (SARs). However, it is unknown whether SARs vary among different peak wavelengths (λpeak) of B or how they compare with other photomorphologically-important wavebands, such as ultraviolet-A and far-red. To answer these questions, mustard (Brassica juncea, ‘Ruby Streaks’) and arugula (Brassica eruca, ‘Rocket’) seedlings, grown to the cotyledon unfolding stage under the following narrowband spectrum treatments: UVA (λpeak = 385 nm), B1 (λpeak = 404 nm), B2 (λpeak = 440 nm), B3 (λpeak = 455 nm), and FR (λpeak = 730 nm). Both red (R, λpeak = 660 nm) and dark (D) were used as control treatments. The spectrum treatments were provided at 50 μmol m−2 s−1 on a continuous basis. There were no differences among the B treatments except for reduced mustard fresh weight (FWt) in B3. Compared with R, the B treatments promoted hypocotyl elongation, reduced cotyledon size, and increased petiole length in arugula and B1 increased petiole length in mustard. Compared with the B treatments, UVA inhibited hypocotyl and petiole elongation, similar to or greater than R in both species. Compared with the other LED treatments, seedlings grown under FR generally had the lowest hypocotyl and petiole elongation and the smallest cotyledons. Compared to the LED treatments, D substantially promoted hypocotyl elongation and reduced cotyledon size, except compared to FR in arugula. Among the spectrum treatments, the three B treatments had the greatest SAR promotion effects in both species. Despite having the lowest phytochrome activity, FR inhibited SARs normally associated with high FR environments. Legacy parameters used to estimate SAR-promoting effects of spectrum treatments may not be appropriate for characterizing narrowband spectra from LEDs – new approaches must be developed.
Keywords:
hypocotyl length
; petiole length
; cotyledon size
; photomorphogenesis
; skotomorphogenesis
1. Introduction
Plant phytochromes exist in two interconvertible forms, whereby their relative proportion in plant tissues is greatly influenced by the lighting environment, particularly spectrum. Active phytochrome is associated with compact morphology whereas inactive phytochrome is associated with elongation of plant tissues (e.g., hypocotyls, stems, and petioles) and other morphological attributes collectively known as shade avoidance responses (SARs) (Smith and Whitelam, 1990; Smith and Whitelam, 1997) [1,2]. Wavelengths of red (R, 600 nm to 700 nm) and far-red (FR, 700 nm to 800 nm) radiation have the greatest impact on phytochrome activity levels however, photons from blue (B, 400 to 500 nm), ultraviolet-A (UVA, 315 nm to 400 nm), and ultraviolet-B (UVB, 280 nm to 315 nm) wavebands can also influence the balance of active and inactive phytochrome in plant tissues. The relationship between wavelength and phytochrome activity level has been quantified as the phytochrome photostationary state (PPS), which is an estimate of the relative proportion of active phytochrome induced by a spectrum distribution (Sager et al., 1988; Stutte, 2009) [3,4]. In general, higher PPS are associated with higher phytochrome activity, resulting in the inhibition of SARs (Kusuma and Bugbee, 2021; Park and Runkle, 2018) [5,6]. Under narrowband spectra, the PPS shows local maxima in R and UVA (e.g., ≈ 0.90 between 550 nm and 660 nm and ≈ 0.80 between 350 nm and 380 nm, respectively) and local minima in FR and B (e.g., ≈ 0.05 between 730 nm and 750 nm and ≤ 0.45 between 415 nm and 440 nm, respectively) (Sager et al., 1988) [3].
Under broad-spectrum natural lighting environments (e.g., outdoors and in greenhouses), R and FR are the predominant wavebands that normally influence phytochrome activity (Casal and Smith, 1989) [7]. Photosynthetic tissues efficiently absorb R while a much greater proportion of FR is transmitted and reflected, generally making areas adjacent to or below vegetation relatively enriched in FR (Smith, 1982; Smith, 2000) [8,9]. Therefore, in natural environments the ratio of R to FR (i.e., R:FR) is considered a good indicator of phytochrome activity (Park and Runkle, 2018) [6]. Under natural daylight conditions, the R:FR (based on photon flux units) is normally ≈ 1.1 (Llewellyn et al., 2013) [10], whereas it can drop to ≤ 0.9 during twilight periods and be as low as 0.1 under vegetated shade environments, depending on the degree of shading (Smith, 1982) [8].
In contrast to outdoors and in greenhouses, the R:FR may not be a good estimate of phytochrome activity in indoor environments electric lighting technologies are used to illuminate crops. Kusuma and Bugbee (2020) [11] suggested adopting the reciprocal ratio (FR:R) to characterize phytochrome activity under natural and electric lighting, because it positively correlates with SARs. However, under some narrowband LED spectrum distributions, the proportions of the total photon flux arising from the R and FR wavebands can both be independently very high, very low, or even completely absent. Further, spectrum distributions that are totally lacking R and FR wavebands can still mediate phytochrome activity. In these conditions, the PPS may be a more appropriate parameter for characterizing phytochrome activity, since it covers phytochrome responses over the entire 300 nm to 800 nm waveband (Sager et al., 1988) [3]. However, some legacy studies have given uncertain results when relating estimated phytochrome activity of spectrum treatments with SARs. For example, despite generally having substantially lower estimated PPS, many prior works had indicated that B vs. R treatments inhibit elongation of plant tissues in many species (Appelgren, 1991; Brown et al., 1995; Cosgrove, 1994; Hoenecke et al., 1992; Kong et al., 2012; Wheeler et al., 1991) [12,13,14,15,16,17]. While B-mediated cryptochrome may play a role in inhibiting stem elongation in some spectral combinations (Park and Runkle, 2018) [6], spectrum treatments in older studies were also normally produced using selective filters to manipulate the spectrum of broad-band light sources. This generally results in impure spectrum treatments whereby the target spectrum also contains contamination from other wavelengths (Bergstrand et al., 2014) [18].
The development of high-power, narrowband LED technologies has provided researchers with tools to more accurately study plant photobiology and opportunities to re-evaluate the effects and mechanisms of narrowband spectra on plant growth and development. However, even with narrowband LEDs, contradictory results have been reported on plant responses to B vs. R spectrum treatments. Some LED studies have reported that pure B vs. R inhibited plant elongation responses (e.g., Kook et al., 2013; Lee et al., 2010; Wollaeger and Runkle, 2014a,b; Wollaeger and Runkle, 2015) [19,20,21,22,23] , supporting the results of prior works with broader-band light sources. Many other studies have elicited very strong SARs in plants grown under pure B (e.g., Hata et al., 2013; Hernández and Kubota, 2016; Hirai et al., 2006; Kim et al., 2014; Schwend et al., 2015) [24,25,26,27,28]. Based on a series of LED experiments on bedding plants, microgreens, and arabidopsis mutants, our lab has concluded that the promotion effects of pure B on plant elongation responses were related to low phytochrome activity (Kong et al., 2018; Kong et al., 2019a,b; Kong et al., 2020; Kong and Zheng, 2020a; Kong and Zheng, 2021) [29,30,31,32,33,34]. We also found that pure B spectrum treatments can modify the activity of the primarily B photoreceptors (e.g., reduced cryptochrome and increased phototropin activities) (Kong and Zheng, 2020b; Kong and Zheng, 2022) [35,36]. Since low levels from other wavebands can completely change plant responses to pure B (Kong et al., 2020) [32], we believe spectral contamination from adjacent plots may have gone undetected in some studies that purported enhancement of compact growth under ostensibly pure B spectra.
The pure B treatments in our previous studies came from LEDs with peak wavelengths (λpeak) from a narrow range: between 440 nm to 455 nm. However, the estimated PPS of narrowband spectra is very dynamic across the entire B waveband; ranging from > 0.60 at both 400 nm and 500 nm, dropping to < 0.50 at intermediate wavelengths with a minima of ≈ 0.41 at 425 nm (Sager et al., 1988) [3]. Further, PPS increases as wavelength extends below 400 nm into the UVA waveband to a local maximum of 0.82 at 385 nm, which is similar to the PPS in most of the R waveband (Sager et al., 1988) [3]. A study using B LEDs with λpeak ranging from 432 nm to 466 nm indicated that green perilla (Perilla frutescens) elongation increased as λpeak decreased below 446 nm (Lee et al., 2014) [37]. While their spectrum treatments were not well characterized in terms of actual spectral distribution or PPS, the increased plant elongation under lower λpeak may have been related to decreased phytochrome activity, since the PPS decreases from 0.55 to 0.42 over the range of B λpeak they tested (Stutte, 2009) [4]. Consequently, it is possible that the promotion effects on plant elongation and associated SAR will vary with different λpeak of B LEDs. Further, since there is evidence of a threshold PPS value in the 0.65 to 0.60 range that induces SAR in narrowband spectrum treatments (Kong and Zheng, 2021; Kong et al., 2020b) [34,35], the influence of different narrow wavebands of B on plant elongation merits further investigation.
The addition of UVA inhibited the promotion effects of B on microgreens’ elongation (Kong et al., 2019b) [31], possibly due to the higher PPS in B+UVA vs. B (i.e., 0.58 vs. 0.49). Since wavelengths of pure UVA generally have higher PPS than pure B or B mixed with UVA (Stutte, 2009) [4], pure UVA spectra may enhance active phytochrome responses in plants. Therefore, pure UVA may have greater inhibitory effects on plant elongation than B, but relatively less inhibitory effects on plant elongation than R. This speculation also warrants further investigation.
Enriched levels of FR in natural light environments, such as under vegetated shade or during twilight, can also promote stem elongation as SARs by decreasing phytochrome activity (Demotes-Mainard et al., 2016) [38]. Given the low R:FR (i.e., ≈ 0) and low PPS (< 0.2), it would be expected that narrowband FR should strongly invoke SARs. However, some of the few studies that have investigated the effects of narrowband FR on plant elongation and associated SARs have shown the opposite: strong inhibitory effects on SARs (Maloof et al, 2001; Razzak et al., 2017) [39,40]. Given the importance of the FR waveband on phytochrome activity, this phenomenon is a curiosity that requires further confirmation.
Arugula (Brassica eruca) and mustard (Brassica juncea) are commonly commercially grown as microgreens. Arugula showed more pronounced SAR vs. mustard under pure B treatments in our previous studies (Kong et al., 2019a; Kong et al., 2019b; Kong et al., 2020; Kong and Zheng, 2020a; Johnson et al., 2020) [30,31,32,33,41]. In these cases, photomorphogenesis, rather than photosynthesis, mainly contributed to lighting effects on stem elongation of microgreens (Kong et al., 2018; Kong et al., 2019a; Johnson et al., 2020) [28,29,41]. Therefore, comparing effects of spectrum treatments both within (e.g., B and R) and outside (e.g., FR and UVA) the range of photosynthetically active radiation (PAR, 400 nm to 700 nm) on hypocotyl elongation and associated SARs may be less complicated at the seedling stage than in fully autotrophic plants. Furthermore, dark-germinated seedlings moved to light have shown inhibited stem elongation by switching from skotomorphogenic to photomorphogenic growth (Alabadí and Blázquez, 2009; Chaiwanon et al., 2016; Chen et al., 2004; McNellis and Deng, 1995) [42,43,44,45]. Therefore, when investigating the action of narrowband spectra on SARs elongation, spectrum treatment effects should be compared to both R and darkness. This also makes it possible to compare light-mediated SARs to dark-triggered skotomorphogenesis, despite promoted hypocotyl elongation in both processes.
The objective of this study was to explore the effects of narrowband spectra on plant growth and morphology in two microgreen species. By growing arugula and mustard microgreens under continuous lighting of narrowband spectrum treatments, the following hypotheses were tested: (1) all narrowband spectra, from UVA to FR can inhibit plant elongation relative to darkness, (2) seedling morphology will vary under the different narrowband LED treatment spectra, (3) estimated phytochrome activity parameters do not accurately predict seedling growth and morphology responses under all narrowband spectrum treatments.
2. Materials and Methods
2.1. Plant materials and Growing Conditions
The experiment was performed in a 29 m2 growth chamber at the University of Guelph (Guelph, ON, Canada). Seeds of arugula (Brassica eruca, ‘Rocket’, Suba Seeds Company S.P.A., Longiano, FC, Italy) and mustard (Brassica juncea, ‘Ruby Streaks’, Johnny’s Selected Seeds, Winslow, ME, USA) were sown ≈ 0.5 cm deep in a growing medium (Sunshine Mix No. 5; Sun Gro Horticulture, Agawam, MA, USA), in pre-filled plug trays (PL-288-1.25, T.O. Plastics Inc., Clearwater, MN, USA). The 12 × 24-cell plug trays were cut down to 10 × 20-cell configurations. Arugula and mustard seeds were each sown in one half of each tray (i.e., in a 10 × 10 configuration), at a rate of one seed per cell. Single trays were immediately placed under each of the spectrum treatments (described below) and grown under continuous lighting until harvest at 7 and 8 days after sowing (DAS) for arugula and mustard, respectively. The seedlings were sub-irrigated with nutrient solution according to the methods in Kong and Zheng (2020a) [33]. The air temperature and relative humidity (RH) set points were 23 °C and 65% for the duration of the experiment and there was no supplemental CO2. The chamber temperature, RH, and CO2 concentration were monitored continuously with the environmental controller (Titan Omni-Sensor, Argus Control Systems, Surrey, BC, Canada) and 15-min averages were recorded. The air temperature and relative humidity of each plot were recorded on 10-min intervals by data loggers (HOBO U12, Onset Computer Corporation, MA, USA) which were covered with radiation shields (Table 1).
2.2. Experimental Design and Treatments
A randomized complete block design was used for this experiment with three consecutive replications starting on 7 Nov., 21 Nov., and 5 Dec., 2019, respectively. Treatments included darkness (D) and narrowband spectra from UVA, B (B1, B2 and B3), R, and FR wavebands. Both D and R treatments were considered as controls. The treatments were randomly allocated to seven compartments (i.e., plots) in the growth chamber, which were separated by opaque curtains to prevent neighbouring light effects. The locations of the spectrum treatments were randomized for each replication by moving the LED fixtures accordingly, among the plots. The target photon flux density (PFD) for each LED treatment was 50 μmol m−2 s−1 at the surface of the tray. The PFDs were achieved using dimmers and by adjusting the hang height of the LED arrays. Spectra and PFDs were characterized using a radiometrically-calibrated spectrometer (Flame-S-XR, Ocean Optics, Inc., Dunedin, FL, USA) tethered to a 1.9 m × 400 µm fibre optic cable with a CC3 cosine corrector. Measurements were made on a regular 3 × 3 grid (i.e., n = 9) that encompassed the perimeter of the trays plus the centre point. Graphical representations of the relative spectral photon flux distribution for the spectrum treatments are presented in Figure 1. Descriptions of the individual LED lighting sources and summary data on peak shapes, PFD, and calculated PPS are presented in Table 1. The PPS value of each spectrum treatment was determined according Sager et al. (1988) [3] using a calculation tool developed by Mah et al. (2019) [46] and superimposed on the PPS curve from Sager et al. (1988) [3] (see Figure S1). There was no photon flux recorded in the R treatment at wavelengths > 700 nm, so the R:FR is undefined. Because the FR LED spectrum peak tails slightly into the R waveband, the R:FR in the FR treatment was 0.05.
2.2. Growth and Morphology Measurements
For each replicate, the germination percentages were investigated for all treatments 4 DAS by counting every cell for each species that had a seedling visibly emerged above the growing medium surface. Hypocotyl length (HL) was measured 5 DAS (HLi) and again at harvest (HLf) on the same 36 randomly-selected seedlings for each species × treatment combination by measuring from the growing medium surface to the top of the hypocotyl with a ruler. Stem extension rate (SER; cm/day) was calculated by SER= (HLf – HLi) / t, where t is the number of days between HL measurements.
Prior to harvest, side-view digital images of representative plants from each treatment were taken with a camera (Nova; Huawei, Dongguan, China). Then, 10 randomly selected seedlings from each species × treatment combination were harvested for determination of biomass accumulation and aboveground partitioning. The harvested seedlings were cut at the growing medium surface, and after measuring total aerial fresh weight (FWt, mg/plant) of each plant, the aerial parts were separated into cotyledons (including petioles) and hypocotyls. Then, they were oven-dried separately at 65 °C to constant weight to determine the dry weight (DW) of cotyledons (DWc, mg/plant) and hypocotyls (DWh, mg/plant). The total aerial dry weight (DWt, mg/plant) was calculated by DWt = DWc + DWh. The DW allocation of hypocotyl (DAh, %) was calculated by DAh = (DWh / DWt) × 100.
Six randomly selected seedlings from the remaining plants from each species × treatment combination were characterized for their hypocotyl and cotyledon morphology following the methods in Kong et al. (2019a) [30]. Briefly, plants were cut at the root-stem junction and hypocotyls and cotyledons (with petioles) of each plant were laid flat on white paper using transparent tape with the adaxial sides facing outward. These tissues were then scanned (CanoScan LiDE 25; Canon Canada Inc., Brampton, ON, Canada) as digital images (600 dpi) to measure morphological parameters and quantify coloration. From the digital images, HL, hypocotyl diameter, petiole length, cotyledon area (Ac, cm2/plant), and maximum cotyledon blade length and width were determined using ImageJ 1.52 software (https://imagej.nih.gov/ij/) following the methods of O’Neal et al. (2003) [47]. Blade length was measured from the proximal end of the petiole to the most distal part of the cotyledon (i.e., farthest lateral distance from the petiole); blade width was perpendicular to length. The cotyledon and hypocotyl tissues were separated digitally and average pixel values for R, G, and B for the respective tissues were also obtained by ImageJ. Hue angles of these tissues were calculated from the RBG values based on method of Karcher and Richardson (2003) [48] after a calibration between the scanned and actual colors using Munsell color chips. Hue angle is defined as an angle on a continuous, circular scale whereby: 0° = red, 60° = yellow, 120° = green, 180° = cyan, 240° = blue, and 300° = magenta (Karcher and Richardson, 2003) [48]. Leaf mass per unit area (LMA, mg cm-2) was calculated on a per-plant basis using: LMA = DWc / Ac.
2.3. Statistical Analysis
Individual harvested plants in each species × treatment × replicate combination were treated as a subsamples for the purposes of statistical analysis with the means of each measured parameter being evaluated statistically across the 3 replications (i.e., n = 3). Data were subjected to one-way analysis of variance using the Data Processing System Software (DPS V7.05; Refine Information Tech. Co., Hangzhou, China) and were presented as means ± SE (standard error; n = 3). Separation of means was performed using Duncan’s new multiple range test at the P ≤ 0.05 level.
3. Results
The temperature and relative humidity within each plot in the growth chamber were similar between consecutive replications (Table 2). The CO2 concentrations of three replicates were (mean ± SD) 434 ± 15.4, 433 ± 12.5, and 429 ± 18.3 respectively.
While the germination rates of arugula were higher and more consistent across treatments than those of mustard, the only spectrum treatment effect on seed germination rate was a higher germination rate under UVA vs. FR in mustard. (Figure S2).
All spectrum treatments had reduced stem extension rates (SER) compared with dark in both species, but the magnitude of the reductions in SER were greater in mustard vs. arugula (Figure 2a). There were no differences in SER among B1, B2, and B3 within either species. Relative to the other LED treatments, the three B treatments in both species and R in mustard had the highest SER. Compared with R, SER was reduced under UVA and FR in mustard but was increased under B1, B2 and B3 in arugula. Relative to the three B treatments, the SER was reduced under UVA and FR in both species.
Compared with D, there were no LED treatment effects on total aerial FW (FWt) in either species (Figure 2b). However, compared with D, the plants grown under the LED treatments had increased total aerial DW (DWt) except under FR in mustard and under B1, B3, and FR in arugula (Figure 2c). Compared with D, all LED treatments reduced dry weight allocation of the hypocotyl (DAh) in both species (Figure 2d). Compared with R, FWt under B3 and FR were reduced in both species and DWt was reduced under FR in mustard. Among the three B treatments FWt in mustard was reduced under B3. UVA had comparable effects on FWt, DWt, and DAHd as the three B treatments in both species. The FR treatment reduced FWt and DWt compared with B1 in mustard and B2 in both species and had similar effects on DAh as the three B treatments in both species.
Compared with D, hypocotyl length (HL) was reduced under almost all LED treatments, but the magnitudes of the reductions in HL were generally the least under the three B treatments in both species (Figure 3a). Compared with R, HL was reduced under UVA and FR in mustard and increased under the three B treatments in arugula. There were no differences in HL among the three B treatments in either species. The UVA treatment reduced HL compared with B1 and B2 in both species and under B3 in arugula. Compared with the three B treatments, HL was reduced under FR in both species. Plant height responses to the spectrum treatments in the images of plants of both species at harvest (Figure 3b,c) were consistent with the measured responses of HL (Figure 3a) and SER (Figure 2a). There were no spectrum treatment effects on hypocotyl diameter in either species (Figure S3).
Compared with D, petiole length increased under all LED treatments, except for under UVA and FR in arugula, but the magnitude of the increase in petiole length was generally greatest in the three B treatments in both species (Figure 4a). Compared with R, petiole length was reduced under FR in both species and was increased under B1 in both species and under B2 and B3 in arugula. Among the three B treatments, petiole length was higher under B1 than B2 in mustard. Compared with the three B treatments, petiole length was reduced under UVA and FR in both species.
Cotyledon area increased under all LED treatments compared with D, except for arugula under FR. The magnitude of the promotion effects on cotyledon area among the LED treatments was smallest under FR in both species (Figure 4b). Compared with R, cotyledon area was reduced under FR in mustard and in all other LED treatments in arugula. There were no treatment effects on cotyledon area among the three B treatments or UVA in either species. Maximum cotyledon blade length and width responses to the spectrum treatments followed similar trends as cotyledon area except for increased maximum blade width under FR relative to D in arugula (Figure 4c,d).
Compared with D, leaf mass per unit area (LMA) was reduced under all LED treatments in both species, except under FR in arugula (Figure 4e). Compared with R, there were no spectrum treatment effects on LMA in all other LED treatments in either species. There were also no differences in LMA between the three B treatments, UVA, and FR in either species.
Compared with D, hypocotyl hue angle decreased in all LED treatments in mustard (Figure 5a) and under FR in arugula (Figure 5b). There were no spectrum treatment effects on hypocotyl hue angle in the remaining LED treatments in either species. Compared with D, cotyledon hue angle decreased under R in mustard, indicating increased redness, and increased under all LED treatments in arugula, indicating increased greenness (Figure 5b). Compared with R, mustard cotyledon hue angle increased under UVA, B1, and FR, indicating decreased redness under these spectrum treatments. There were no treatment effects on cotyledon hue angle among the three B treatments in either species. Mustard cotyledon hue angle increased under UVA vs. B2, indicating decreased redness.
4. Discussion
The advent of narrowband LEDs has revealed new insights into plant responses to unique and varied spectral environments. These revelations are inspiring a reexamination of some commonly used parameters may not be appropriate for characterizing plant responses to narrowband lighting environments. Under broad-band lighting sources (e.g., direct or filtered sunlight and legacy electric lighting technologies), SARs have been generally shown to be inversely related to the estimated PPS (Kusuma and Bugbee, 2021; Park and Runkle, 2018; Kusuma and Bugbee, 2020) [5,6,11]. However, plant responses to some pure, narrowband sources do not fit this pattern. For example, under mixed spectra containing various proportions of B, R and FR, Kong et al. (2020) [32] showed the typical trend of increasing SARs with decreasing PPS, however neither pure R nor B adhered to this trend. Broadening the range of different narrowband spectrum treatments is necessary to further explore the variability of growth responses of different plant species to unique spectra. The results of such studies can serve as a springboard for additional studies to postulate and then investigate potential mechanisms that give rise to observed results.
Relative to the D treatment, all LED spectrum treatments generally increased biomass, reduced hypocotyl elongation, increased petiole elongation, and produced thinner, larger cotyledons. The elongated hypocotyls, short petioles, and smaller leaves in the D treatment are consistent with typical responses of etiolated seedlings that are reliant on energy reserves in the seed for growth. Conversely, the aerial DW responses of the LED treatments, except FR, clearly demonstrate that photosynthesis played an important role in biomass accumulation. Even the UVA and FR treatments, which are broadly defined as being outside of the photosynthetically active radiation spectrum (PAR, 400 to 700 nm), showed some evidence of photosynthetic activity. The aerial DW of both species under UVA were similar to the R and B treatments. While the aerial DW under FR were lower than some of the other LED treatments, which concurs with its lower quantum efficiency (Sager et al., 1988) [3], the arugula cotyledons were still greener than the etiolated cotyledons of the D treatment.
The SARs were generally more pronounced in arugula vs. mustard, which concurred with observations in prior studies on these microgreens species (Kong et al., 2019a; Kong and Zheng, 2020a) [30,33]. The red coloring in mustard is primarily due to ≈ 10× higher foliar anthocyanin concentrations (Jones-Baumgardt et al., 2020; Ying et al., 2020) [49,50]. The lower plasticity of phytochrome-mediated responses in mustard vs. arugula may have been related to interference with mustard’s more intense pigmentations, including intra-foliar spectral distortion (Kusuma and Bugbee, 2021) [5]; however, the potential levels of spectral distortion under narrowband spectra is still unknown.
Among PAR treatments (i.e., B and R), it was anticipated that the magnitude of SARs would be strongly related to their respective PPS because phytochromes are believed to be the major photoreceptors responsible for mediating SARs (Kong and Zheng, 2021) [34]. Within this context, we expected that the magnitude of SARs treatments would decrease in the order of: B 1> B2 > B3 > R. However, the only observed SAR differences were longer petioles in B1 vs. B2 in mustard and reduced hypocotyl and petiole elongation and increased cotyledon elongation under R in arugula. The magnitudes of these treatment effects were generally consistent with the estimated PPS values and with results reported in prior studies (Kong et al., 2018; Kong et al., 2019a; Kong et al., 2020; Johnson et al., 2020) [29,30,32,41].
Except for aerial FW in mustard, there were no differences among the three B LED treatments in any of the other measured plant traits in either species, despite PPS values being below the estimated threshold for invoking SARs (≈ 0.6; Kong et al., 2020; Kong and Zheng, 2021) [32,34] and ranging from 0.58 to 0.48. To further establish the effects of different wavelengths of narrowband B on SARs, future trials should include narrowband B treatment with λpeak ≈ 425 nm (i.e., at the local PPS minima of ≈ 0.41; Sager et al., 1988 [3]).
Relative to B, UVA generally inhibited elongation responses in both species, with inhibitory effects similar to R in arugula and greater than R in mustard. While the UVA vs. B responses are generally consistent with their PPS values (Table 1), UVA may have activated both phytochrome and cryptochrome (Kong and Zheng, 2022) [36], leading to inhibition of SARs, especially in mustard. It is also possible that the decreased redness in mustard cotyledons under UVA vs. R relatively enhanced the SAR-inhibiting effects of this high-PPS spectrum due to reduced interference in phytochrome responses from other foliar pigments (Kusuma and Bugbee, 2021) [5].
FR inhibited elongation responses compared with B in both species. Even more surprising were the greater inhibitory effects of FR relative to R and UVA (both with PPS > 0.7), except for hypocotyl elongation of arugula. The FR-inhibited hypocotyl elongation observed in the present study starkly contrasts to the normal SAR (e.g., promoted hypocotyl elongation) induced by high-proportions of FR in natural conditions (Smith and Whitelam, 1997) [2]. However, inhibition of elongation responses under narrowband FR has been observed in other studies (Maloof et al., 2001; Razzak et al., 2017) [39,40]. Furthermore, both species had reduced cotyledon area under FR vs. all other LED treatments, showing typical cotyledon responses to FR-enriched vegetated shade (Kutschera and Briggs, 2013) [51]. The FR treatment may have been perceived as being similar to a deep vegetated shade environment, where plants switch strategies from stem elongation for penetrating deeper into the canopy to capture more light to other responses for adapting to survival in deep shade (e.g., reducing organ size to save energy); phytochrome A plays a key role in this process (Gommers et al., 2013; Sheerin and Hiltbrunner, 2017; Yang et al., 2018) [52,53,54]. The contrasting effects on plant elongation responses under “enhanced” vs. “pure” spectrum distributions in both B and FR wavebands need further study to elucidate the mechanisms involved in these unexpected behaviors.
Although B and darkness both promoted stem elongation, the similarities and differences between light-mediated SARs and darkness-triggered skotomorphogenesis must be considered. In the present study, darkness promoted stem elongation, increased biomass allocation to the hypocotyl, reduced cotyledon size, and decreased cotyledon greenness or redness, which are similar to SARs (Smith and Whitelam, 1997; Kutschera and Briggs, 2013) [2,51]. However, relative to the LED treatments, darkness increased LMA and reduced petiole length due to skotomorphogenic-inhibition of cotyledon unfolding (Fankhauser and Chory, 1997; Seluzicki et al., 2017; Von Arnim and Deng, 1996) [55,56,57]. These contrast with normal SARs in leaves (Smith and Whitelam, 1997; Kutschera and Briggs, 2013) [2,51]. Consequently, the B-promoted elongation effects as SARs differ from darkness-promoted elongation effects associated with skotomorphogenesis.
The contrasting effects of B on SARs between our studies and some earlier studies using either filtered light sources (e.g., Appelgren, 1991; Brown et al., 1995; Cosgrove, 1994; Hoenecke et al., 1992; Kong et al., 2012; Wheeler et al., 1991) [12,13,14,15,16,17]or narrowband LEDs (e.g., Kook et al., 2013; Wollaeger and Runkle, 2014a,b; Wollaeger and Runkle, 2015; Lee et al., 2010) [19,21,22,23,37] illustrates the absolute necessity to ensure the “purity” of the spectrum treatments in experimental plots. This is especially critical when conducting research using narrowband spectrum distributions. Researchers are encouraged to diligently evaluate spectral contamination in experimental plots by taking measurements in ostensibly dark plots (i.e., with a given plot’s target lighting turned off) with lighting from all other plots turned on. Evaluations of spectral contamination must be omnidirectional in nature because stray light is most likely to arise from plot boundaries (e.g., edge gaps, reflection off floors under benches, etc.). Researchers must also be aware of the dynamic range of their spectral sensors; these are often designed to measure full sunlight intensity (i.e. ≤ 2,000 μmol m−2 s−1) and may not be capable of resolving stray light levels, which may still have photobiological effects at intensities below 0.2 μmol m−2 s−1 (i.e., more than 104 times lower).
5. Conclusions
Narrowband LED spectrum treatments represent unique lighting environments that can have unexpected impacts on plant growth and morphology responses. For arugula and mustard microgreens grown under continuous LED lighting, stem elongation was similar under three narrow-band B treatments with peak wavelengths at 405 nm, 440 nm, and 455 nm, respectively. Among the LED spectrum treatments, the promotion effects on SARs was generally the greatest in the B treatments. Overall, this study illustrates that neither R:FR nor PPS can reliably predict plant elongation and growth responses when grown under narrowband spectrum treatments. In fact, plants grown under the LED treatment with the lowest PPS (and very low R:FR) also exhibited the most strongly inhibited SARs. Additional narrowband spectrum studies are needed, including different species and growth stages, to characterize plant responses elucidate mechanisms.
Supplementary Materials
The following supporting information can be downloaded at the website of this paper posted on Preprints.org, Figure S1: Estimated phytochrome photostationary state (PPS) of the following narrowband LED spectrum treatments: UVA (λpeak= 385 nm), B1 (λpeak= 404 nm), B2 (λpeak= 440 nm), B3 (λpeak= 453 nm), R (λpeak= 659 nm), and FR (λpeak= 729 nm) superimposed on the PPS spectrum, from monochromatic wavelengths, based on the data from Sager et al. (1988) [3]. The open circles represent the calculated PPS values based on the actual spectral distributions of the different spectrum treatments, rather than their peak wavelengths. Figure S2: Germination percentages of mustard and arugula microgreens under narrowband lights with different peak wavelengths. R (λpeak= 660 nm), UVA (λpeak= 385 nm), B1 (λpeak= 405 nm), B2 (λpeak= 440 nm), B3 (λpeak= 455 nm), FR (λpeak= 730 nm), D is dark. Data are means ± SE (n = 3). Within the same species, means bearing the same letter are not significantly different at P ≤ 0.05 according to Duncan’s new multiple range test. Figure S3: Hypocotyl diameters of two species of mustard and arugula microgreens under narrowband lights with different peak wavelengths. R (λpeak= 660 nm), UVA (λpeak= 385 nm), B1 (λpeak= 405 nm), B2 (λpeak= 440 nm), B3 (λpeak= 455 nm), FR (λpeak= 730 nm), D is dark. Data are means ± SE (n = 3). Within the same species, means bearing the same letter are not significantly different at P ≤ 0.05 according to Duncan’s new multiple range test.
Author Contributions
All authors participated in experimental design. DL and QL set up the lighting treatments. QL and YK performed the experiments and collected the data. QL, YK and YZ analyzed the data. QL, DL, and YK drafted the manuscript. All authors revised the manuscript. YZ was the principal investigator. All authors approved the final manuscript.
Funding
Financial support awarded to Dr. Youbin Zheng by the Natural Sciences and Engineering Research Council of Canada (CRDPJ505238-16) and to Dr. Qingming Li by the National Natural Science Foundation of China (31872154, 31902092) funded this research.
Data Availability
The raw data supporting the conclusions of this article will be made available by the authors, without undue reservation.
Acknowledgements
Thanks to Qinglu Ying and Devdutt Kamath for their technical assistance. Thanks to Heliospectra, Lumigrow, and Yunustech for donating LED lighting technologies.
Conflicts of Interest
The authors declare that the research was conducted in the absence of any commercial or financial relationships that could be construed as a potential conflict of interest.
References
- Smith, H., Whitelam G.C. Phytochrome, a family of photoreceptors with multiple physiological roles. Plant Cell Environ. 1990,13, 695–707.
- Smith, H., Whitelam, G.C. The shade avoidance syndrome: multiple responses mediated by multiple phytochromes. Plant Cell Environ. 1997, 20, 840–844.
- Sager, J.C., Smith, W.O., Edwards, J.L., Cyr, K.L. Photosynthetic efficiency and phytochrome photoequilibria determination using spectral data. Trans. ASAE. 1988, 31, 1882–1889.
- Stutte, G.W. Light-emitting diodes for manipulating the phytochrome apparatus. HortScience 2009, 44, 231–234.
- Kusuma, P., Bugbee, B. Improving the predictive value of phytochrome photoequilibrium: Consideration of spectral distortion within a leaf. Front. Plant Sci. 2021, 12, 596943.
- Park, Y., Runkle, E.S. Far-red radiation and photosynthetic photon flux density independently regulate seedling growth but interactively regulate flowering, Env. Expt. Bot. 2018, 155, 206–216.
- Casal, J., Smith, H. The function, action and adaptive significance of phytochrome in light-grown plants. Plant Cell Environ. 1989, 12, 855–862.
- Smith, H. Light quality, photoperception, and plant strategy. Annual Rev. Plant Phys. 1982, 33, 481–518.
- Smith, H. Phytochromes and light signal perception by plants - An emerging synthesis. Nature 2000, 407, 585–591.
- Llewellyn, D., Zheng, Y., Dixon. M.Survey of how hanging baskets influence the light environment at lower crop level in ornamental greenhouses in Ontario. HortTechnology 2013, 23, 823–829.
- Kusuma, P., Bugbee, B. Far-red fraction: An improved metric for characterizing phytochrome effects on morphology. J. Am. Soc. Hort. Sci. 2020, 146, 3–13.
- Appelgren, M. Effects of light quality on stem elongation of Pelargonium in vitro. Sci. Hort. 1991, 45, 345–351.
- Brown, C.S., Schuerger, A.C., Sager, J.C. Growth and photomorphogenesis of pepper plants under red light-emitting diodes with supplemental blue or far-red lighting. J. Am. Soc. Hort. Sci. 1995, 120, 808–813.
- Cosgrove, D.J. Photomodulation of growth. In Photomorphogenesis in Plants; Kendrick, R.E., Kronenberg, G.H.M. Eds.; Kluwer Academic Publishers: Dordrecht, The Netherlands, 1994; pp. 631–658.
- Hoenecke, M.E., Bula, R.J., Tibbitts, T.W. Importance of 'blue' photon levels for lettuce seedlings grown under red-light-emitting diodes. HortScience 1992, 27, 427–430.
- Kong, Y., Wang, S., Chen, J., Chen, Q., Yao, Y. Effect of supplemental lighting with red and blue light on the characters of container-growing seedlings of muskmelon. Acta Hort. 2012, 944, 141–146.
- Wheeler, R.M., Mackowiak, C.L., Sager, J.C. Soybean stem growth under high-pressure sodium with supplemental blue lighting. Agron. J. 1991, 83, 903–906.
- Bergstrand, K.J., Asp, H., Schüssler, H.K. Development and acclimatisation of horticultural plants subjected to narrowband lighting. Eur. J. Hort. Sci. 2014, 79, 45–51.
- Kook, H.S., Park, S.H., Jang, Y.J., Lee, G.W., Kim, J.S., Kim, H.M., Oh, B.T., Chae, J.C., Lee, K.J. Blue LED (light-emitting diodes)-mediated growth promotion and control of Botrytis disease in lettuce, Acta Agriculturae Scandinavica 2013, 63, 271–277.
- Lee, N.Y., Lee, M.J., Kim, Y.K., Park, J.C., Park, H.K., Choi, J.S., Hyun, J.N., Kim, K.J., Park, K.H., Ko, J.K., Kim, J.G. Effect of light emitting diode radiation on antioxidant activity of barley leaf. J. Korean Soc. Appl. Biol. Chem. 2010, 53, 685–690.
- Wollaeger, H., Runkle, E. Growth of impatiens, petunia, salvia, and tomato seedlings under blue, green, and red light-emitting diodes. HortScience 2014a, 49, 734–740.
- Wollaeger, H., Runkle, E. Producing commercial-quality ornamental seedlings under sole-source LED lighting. Acta Hort. 2014b. 1037, 269–276.
- Wollaeger, H., Runkle, E. Growth and acclimation of impatiens, salvia, petunia, and tomato seedlings to blue and red light. HortScience 2015, 50, 522–529.
- Hata, N., Hayashi, Y., Ono, E., Satake, H., Kobayashi, A., Muranaka, T., Okazawa, A. Differences in plant growth and leaf sesamin content of the lignan-rich sesame variety ‘Gomazou’under continuous light of different wavelengths. Plant Biotechnol. 2013, 30, 1–8.
- Hernández, R., Kubota, C. Physiological responses of cucumber seedlings under different blue and red photon flux ratios using LEDs. Environ. Exp. Bot. 2016, 121, 66–74.
- Hirai, T., Amaki, W., Watanabe, H. Action of blue or red monochromatic light on stem internodal growth depends on plant species. Acta Hort. 2006, 711, 345–350.
- Kim, E.Y., Park, S.A., Park, B.J., Lee, Y., Oh, M.M. Growth and antioxidant phenolic compounds in cherry tomato seedlings grown under monochromatic light-emitting diodes. Hort. Environ. Biotechnol. 2014, 55, 506–513.
- Schwend, T., Prucker, D., Mempel, H. Red light promotes compact growth of sunflowers. Eur. J. Hort. Sci. 2015, 80, 56–61.
- Kong, Y., Stasiak, M., Dixon, M.A., Zheng, Y. Blue light associated with low phytochrome activity can promote elongation growth as shade-avoidance response: a comparison with red light in four bedding plant species. Environ. Exp. Bot. 2018, 155, 345–359.
- Kong, Y., Kamath, D., Zheng, Y. Blue versus red light can promote elongation growth independent of photoperiod: a study in four Brassica microgreens species. HortScience 2019a, 54, 1955–1961.
- Kong, Y., Schiestel, K., Zheng, Y. Pure blue light effects on growth and morphology are slightly changed by adding low-level UVA or far-red light: A comparison with red light in four microgreen species. Environ. Exp. Bot. 2019b, 157, 58–68.
- Kong, Y., Schiestel, K., Zheng, Y. Maximum elongation growth promoted as a shade-avoidance response by blue light is related to deactivated phytochrome: a comparison with red light in four microgreen species. Can. J. Plant Sci. 2020, 100, 314–326.
- Kong, Y., Zheng, Y. Growth and morphology responses to narrowband blue light and its co-action with low-level UVB or green light: A comparison with red light in four microgreen species. Environ. Exp. Bot. 2020a,178, 104189.
- Kong, Y., Zheng., Y. Phytochrome contributes to blue-light-mediated stem elongation and flower initiation in mature Arabidopsis thaliana plants. Can. J. Plant Sci. 2021, 102, 449–458.
- Kong, Y., Zheng, Y. Phototropin is partly involved in blue-light-mediated stem elongation, flower initiation, and leaf expansion: A comparison of phenotypic responses between wild Arabidopsis and its phototropin mutants. Environ. Exp. Bot. 2020b, 171, 104189.
- Kong, Y., Zheng, Y. Low-activity cryptochrome 1 plays a role in promoting stem elongation and flower initiation of mature Arabidopsis under blue light associated with low phytochrome activity. Can. J. Plant Sci. 2022, 102, 755–759.
- Lee, J.S., Ae, C., Lee, Y., Kim, H., Song, J.Y. Shorter wavelength blue light promotes growth of green perilla (Perilla frutescens). Int. J. Agric. Biol. Eng. 2014, 16, 1177–1182.
- Demotes-Mainard, S., Péron, T., Corot, A., Bertheloot, J., Le, G.J., Pelleschi-Travier, S., Crespel, L., Morel, P., Huché-Thélier, L., Boumaza, R., Vian, A., Guérin, V., Leduc, N., Sakr, S. Plant responses to red and far-red lights, applications in horticulture. Environ. Exp. Bot. 2016. 121, 4–21.
- Maloof, J., Borevitz, J., Dabi, T. Lutes, J., Nehring, R., Redfern, J., Trainer, G., Wilson, J., Asami, T., Berry, C., Weigel, D., Chory, J. Natural variation in light sensitivity of Arabidopsis. Nat. Genet. 2021, 29, 441–446.
- Razzak, A., Ranade, S.S., Strand, Å., García-Gil, M.R. Differential response of Scots pine seedlings to variable intensity and ratio of red and far-red light. Plant Cell Environ. 2017, 40, 1332–1340.
- Johnson, R.E., Kong, Y., Zheng, Y.J.E., Botany, E. Elongation growth mediated by blue light varies with light intensities and plant species: A comparison with red light in arugula and mustard seedlings. Environ. Exp. Bot. 2020, 169, 1–9.
- Alabadí, D., Blázquez, M.A. Molecular interactions between light and hormone signaling to control plant growth. Plant Mol. Biol. 2009, 69, 409–417.
- Chaiwanon, J., Wang, W., Zhu, J.Y., Oh, E., Wang, Z.Y. Information integration and communication in plant growth regulation. Cell 2016, 164, 1257–1268.
- Chen, M., Chory, J., Fankhauser, C. Light signal transduction in higher plants. Annu. Rev. Genet. 2004, 38, 87–117.
- McNellis, T.W., and Deng, X.-W. Light control of seedling morphogenetic pattern. Plant Cell 1995, 7, 1749–1761.
- Mah, J.J., D. Llewellyn, Y. Zheng. Protocol for converting spectrometer radiometric data to photon flux units [Microsoft Excel Spreadsheet]. Guelph, University of Guelph. 2019. Available from: https://cesrf.uoguelph.ca/technotes/ [right click on “TechNote 001-2019” and use “save link as” to save file, last accessed: 19 April, 2023].
- O’Neal, M., Landis, D., Isaacs, R. An inexpensive, accurate method for measuring leaf area and defoliation through digital image analysis. J. Economic Entomology 2003, 95, 1190–1194.
- Karcher, D.E., Richardson, M.D. Quantifying turfgrass color using digital image analysis. Crop Sci. 2003, 43, 943–951.
- Jones-Baumgardt, C., Ying, Q., Zheng, Y., Bozzo, G. The growth and morphology of microgreens is associated with modified ascorbate and anthocyanin profiles in response to the intensity of sole-source light-emitting diodes. Can. J. Plant Sci. 2020, 101, 212–228.
- Ying, Q., Jones-Baumgardt, C., Zheng, Y., Bozzo, G. The proportion of blue light from light-emitting diodes alters microgreen phytochemical profiles in a species-specific manner. HortScience 2020, 56, 1–8.
- Kutschera, U., Briggs, W.R. Seedling development in buckwheat and the discovery of the photomorphogenic shade-avoidance response. Plant Biol. 2013, 15, 931–940.
- Gommers, C.M., Visser, E.J., St, K.R., Voesenek, L.A., Pierik, R. Shade tolerance: when growing tall is not an option. Trends Plant Sci. 2013, 18, 65–71.
- Sheerin, D.J., Hiltbrunner, A. Molecular mechanisms and ecological function of far-red light signalling. Plant Cell Environ. 2017, 40, 2509–2529.
- Yang, C., Xie, F., Jiang, Y., Li, Z., Huang, X., Li, L. Phytochrome A negatively regulates the shade avoidance response by increasing auxin/indole acidic acid protein stability. Dev. Cell. 2018, 44, 29–41.
- Fankhauser, C., Chory, J. Light control of plant development. Annu Rev. Cell Dev. Biol. 1997, 13, 203–229.
- Seluzicki, A., Burko, Y., Chory, J. Dancing in the dark: darkness as a signal in plants. Plant Cell Environ. 2017, 40, 2487–2501.
- Von Arnim, A., Deng, X.W. Light control of seedling development. Annu. Rev. Plant Physiol. Plant Mol. Biol. 1996, 47, 215–243.
Figure 1.
Relative spectral photon flux distribution of the narrowband light emitting diodes (LED) treatments: UVA (λpeak= 385 nm), B1 (λpeak= 405 nm), B2 (λpeak= 440 nm), B3(λpeak= 455 nm), R (λpeak= 660 nm), and FR (λpeak= 730 nm).
Figure 1.
Relative spectral photon flux distribution of the narrowband light emitting diodes (LED) treatments: UVA (λpeak= 385 nm), B1 (λpeak= 405 nm), B2 (λpeak= 440 nm), B3(λpeak= 455 nm), R (λpeak= 660 nm), and FR (λpeak= 730 nm).
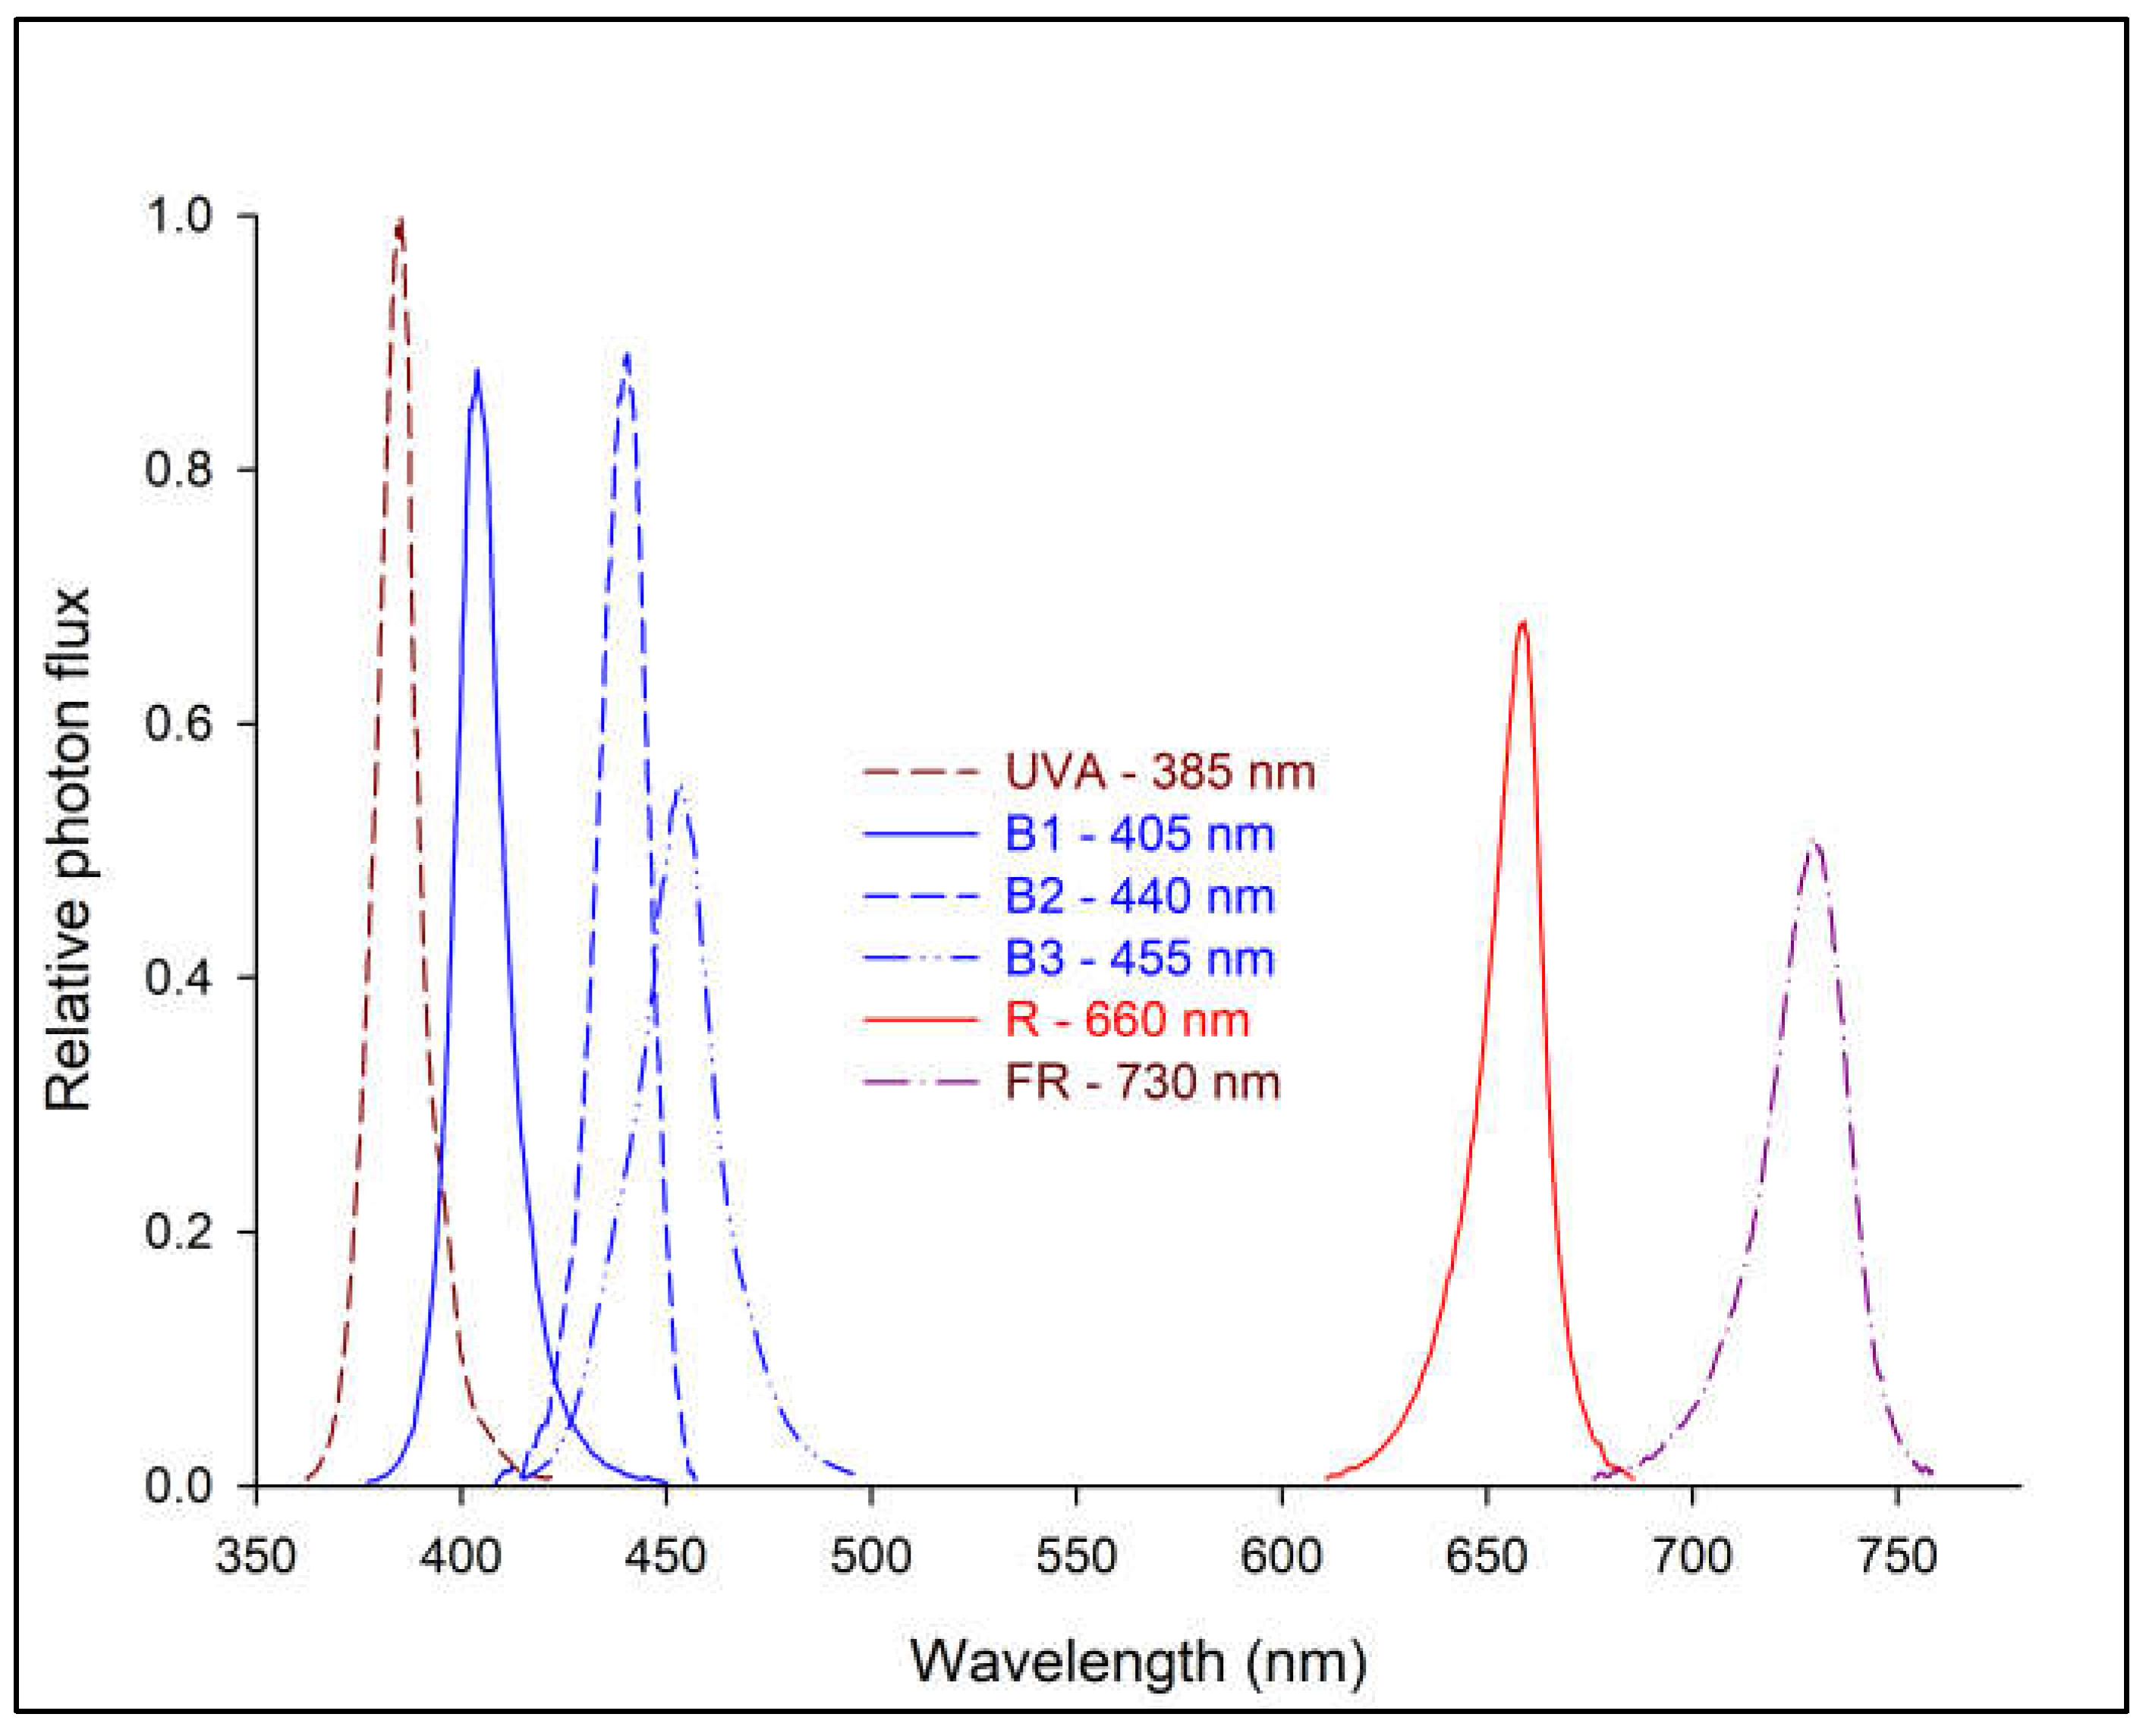
Figure 2.
Stem extension rate (SER), and per-plant biomass accumulation and allocation of mustard and arugula microgreens grown under narrowband LED treatments and in the dark. Data are means ± SE (n = 3) in the following spectrum treatments: R (λpeak= 660 nm), UVA (λpeak= 385 nm), B1 (λpeak= 405 nm), B2 (λpeak= 440 nm), B3 (λpeak= 455 nm), FR (λpeak= 730 nm), D is dark. Within each species, means bearing the same letter are not significantly different at P ≤ 0.05 according to Duncan’s new multiple range test.
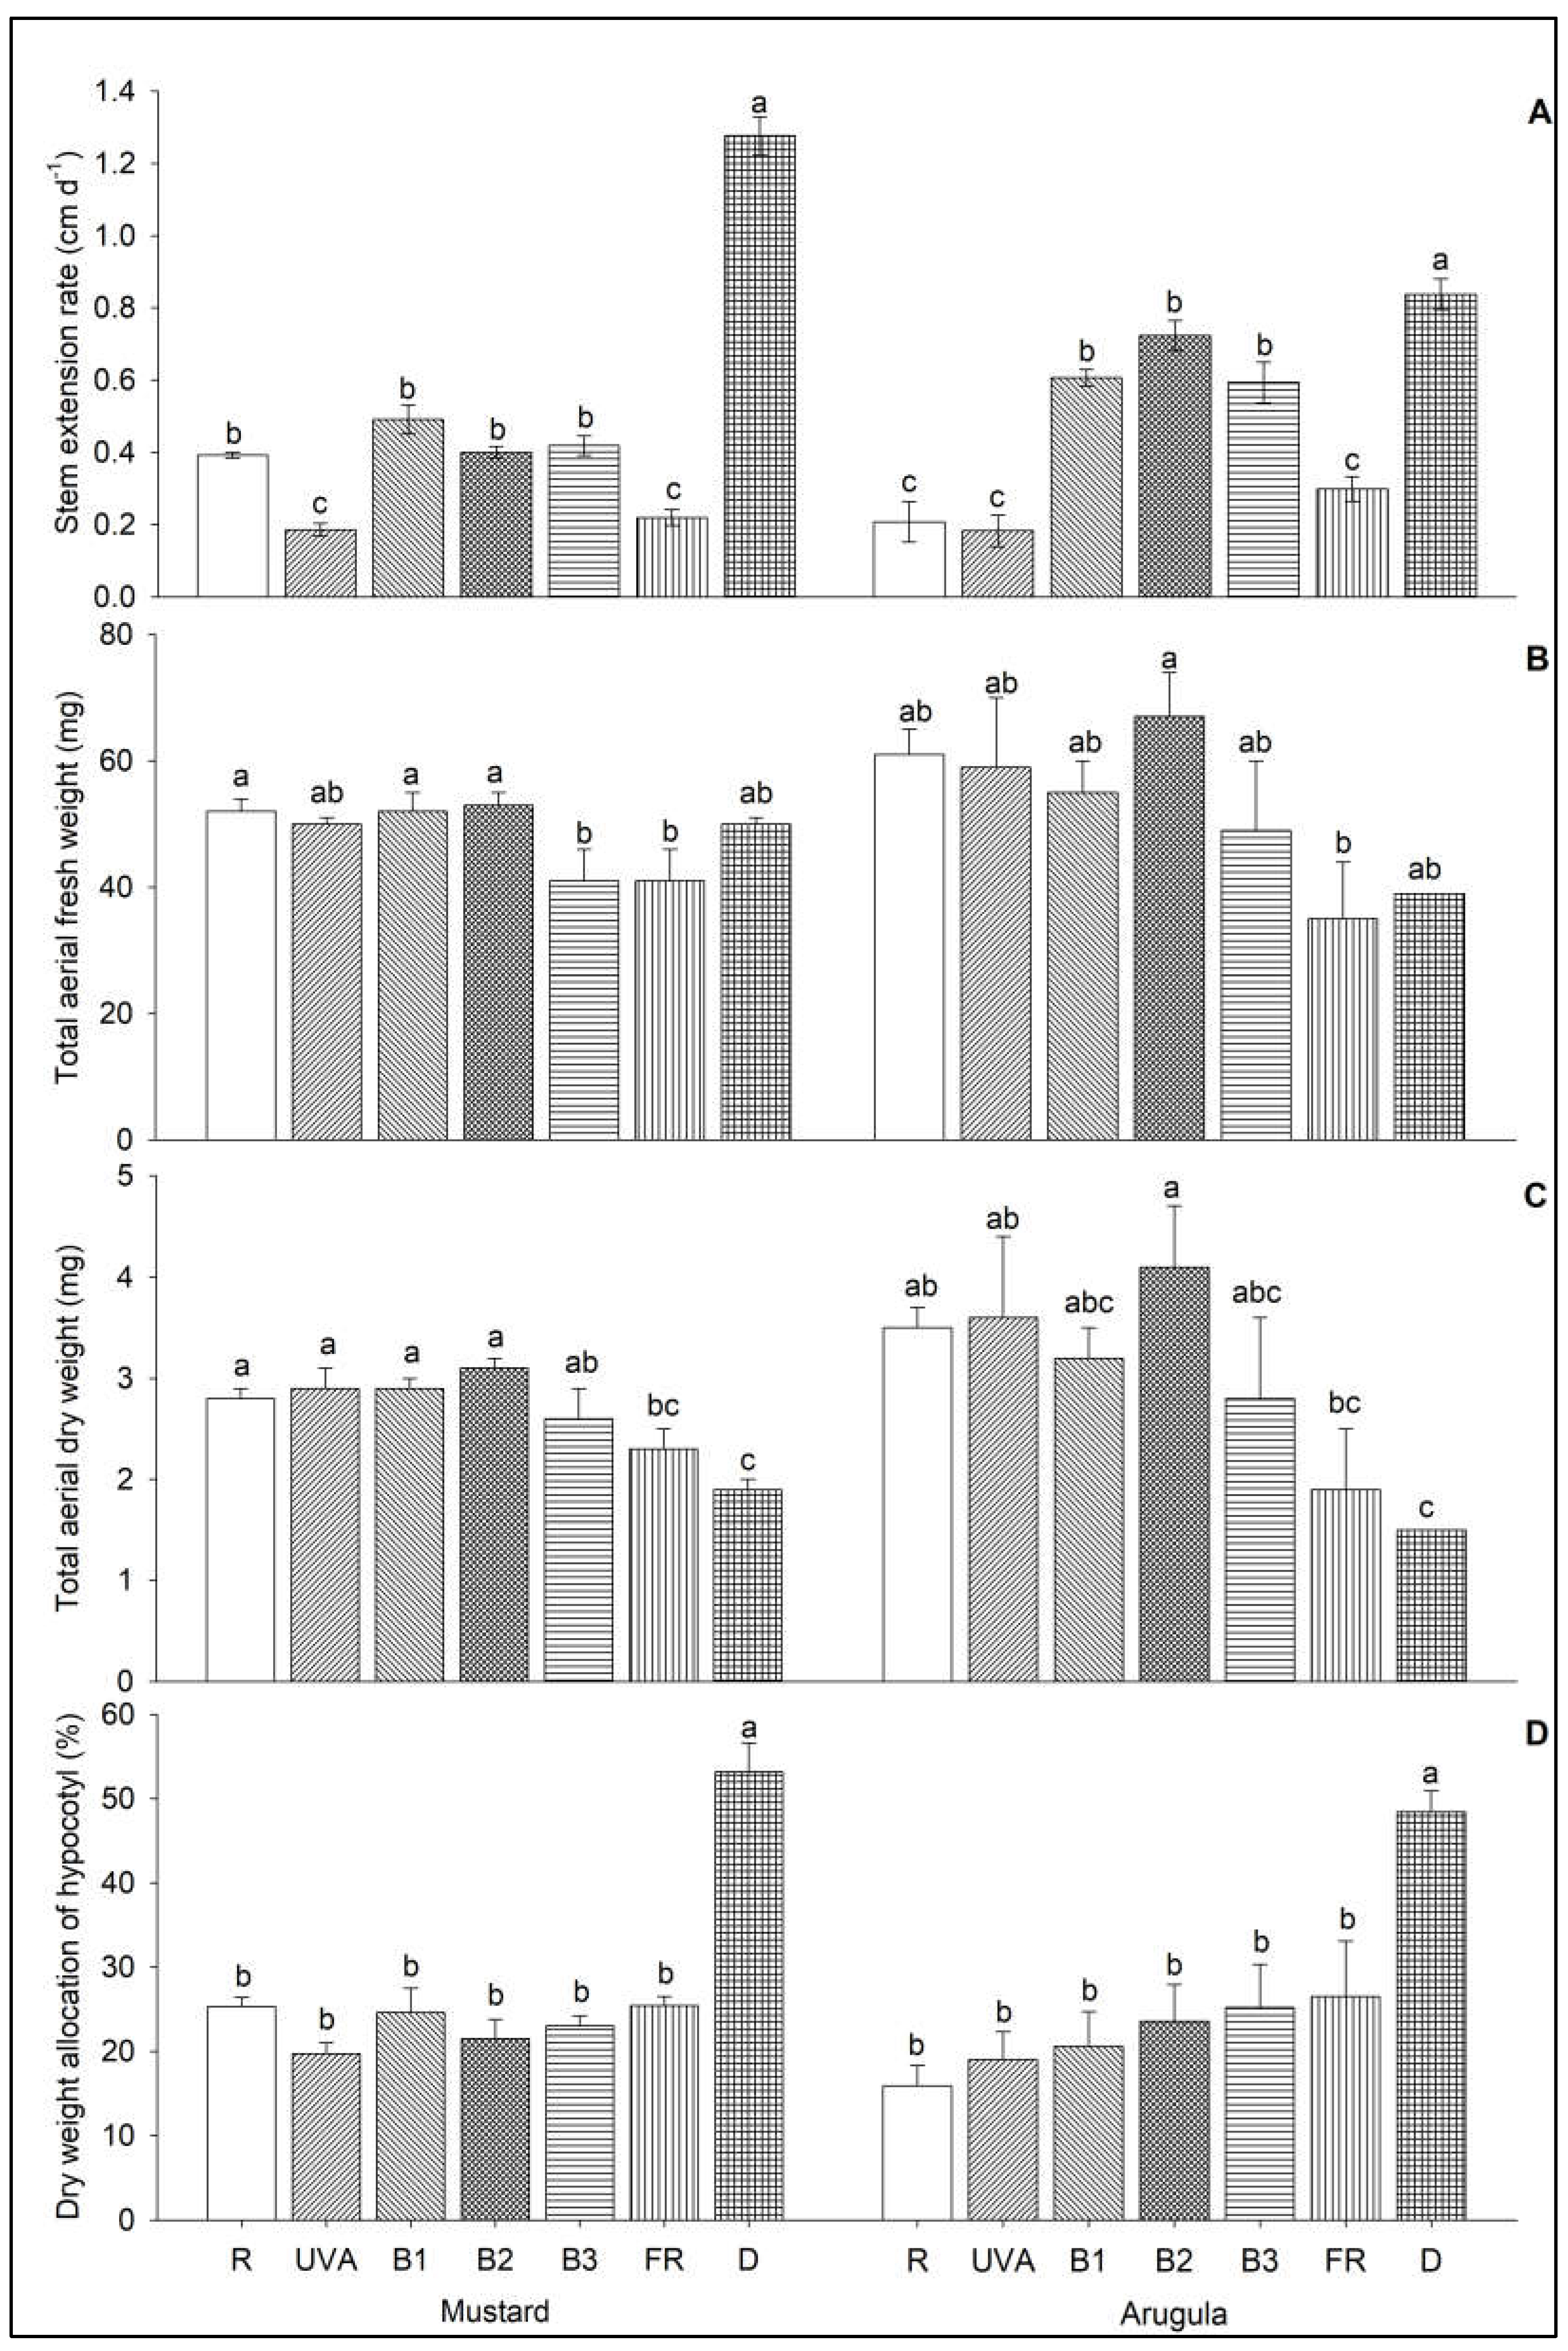
Figure 3.
Hypocotyl length in both species (A) and plant appearance of mustard (B) and arugula (C) microgreens under narrowband LED spectra with different peak wavelengths and in the dark. Pictures were taken at 7th and 8th day after light treatments were initiated for mustard and arugula, respectively. Data in (A) are means ± SE (n = 3). R (λpeak= 660 nm), UVA (λpeak= 385 nm), B1 (λpeak= 405 nm), B2 (λpeak= 440 nm), B3 (λpeak= 455 nm), FR (λpeak= 730 nm), D is dark. Within each species, means bearing the same letter are not significantly different at P ≤ 0.05 according to Duncan’s new multiple range test.
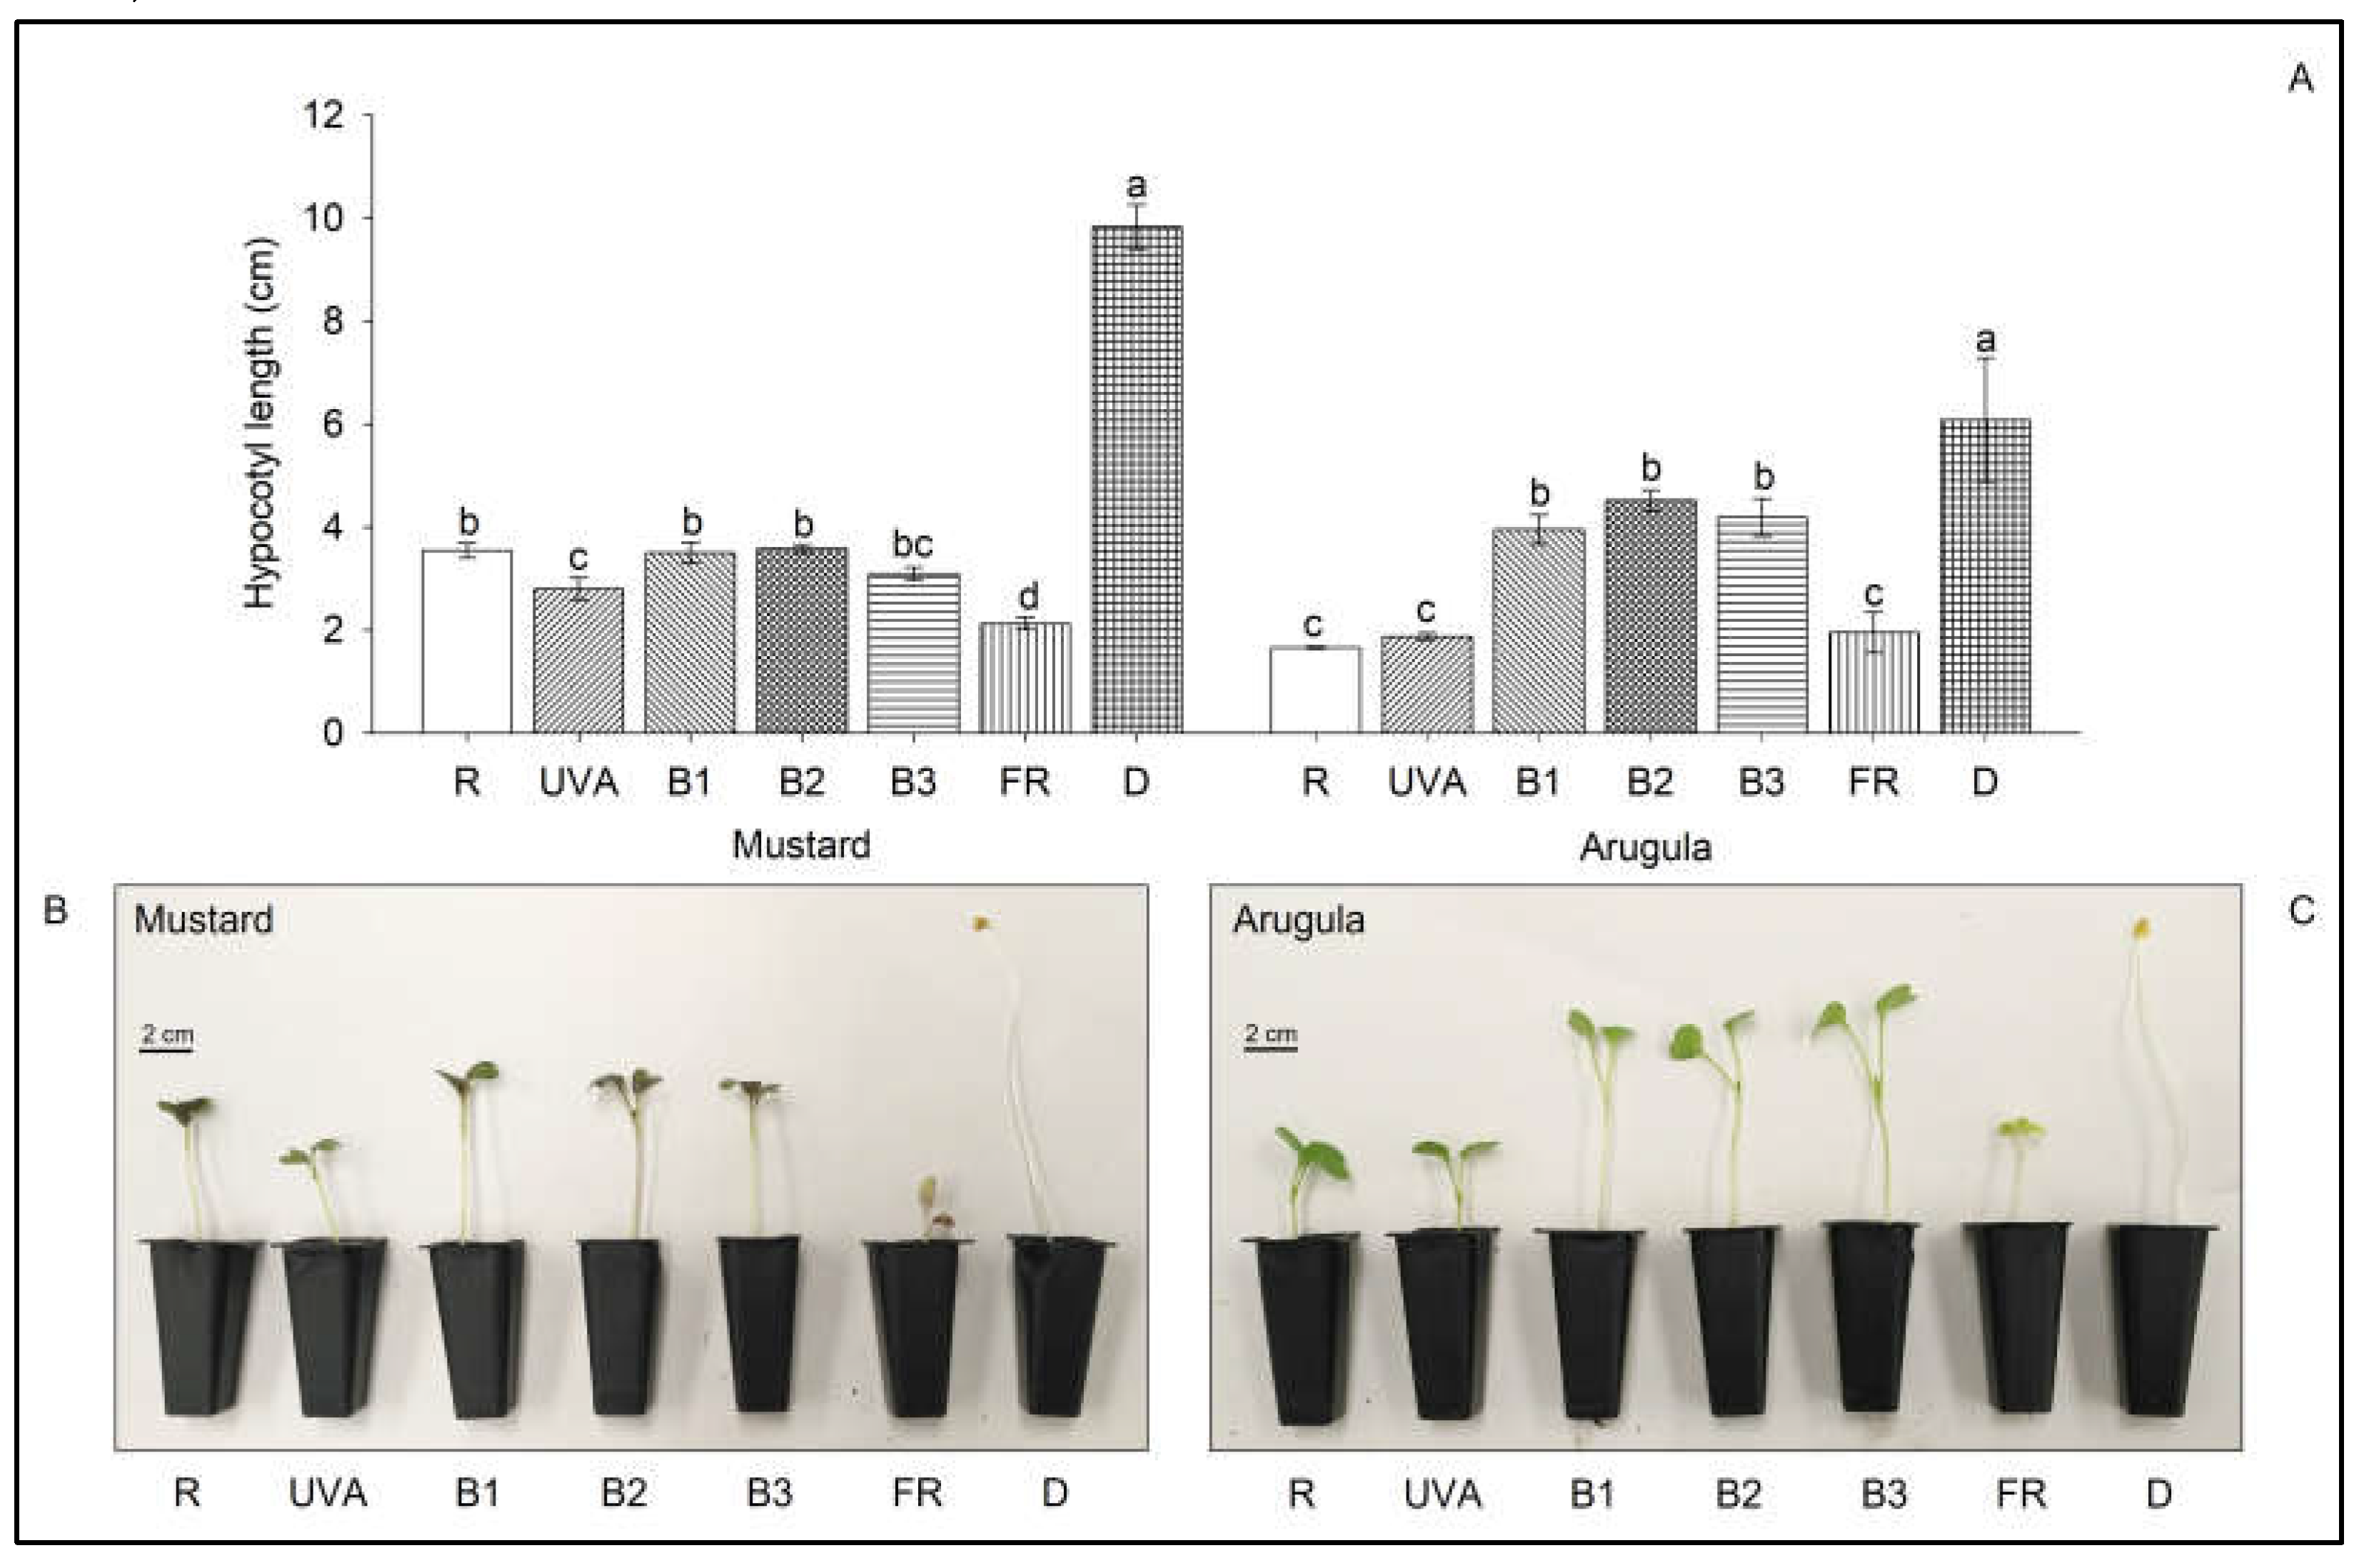
Figure 4.
Petiole length, cotyledon area, maximum blade length and width, and leaf mass per unit area (LMA) of mustard and arugula microgreens under narrowband LED spectra with different peak wavelengths and in the dark. Data are means ± SE (n = 3). R (λpeak= 660 nm), UVA (λpeak= 385 nm), B1 (λpeak= 405 nm), B2 (λpeak= 440 nm), B3 (λpeak= 455 nm), FR (λpeak= 730 nm), D is dark. Within the same species, means bearing the same letter are not significantly different at P ≤ 0.05 according to Duncan’s new multiple range test.
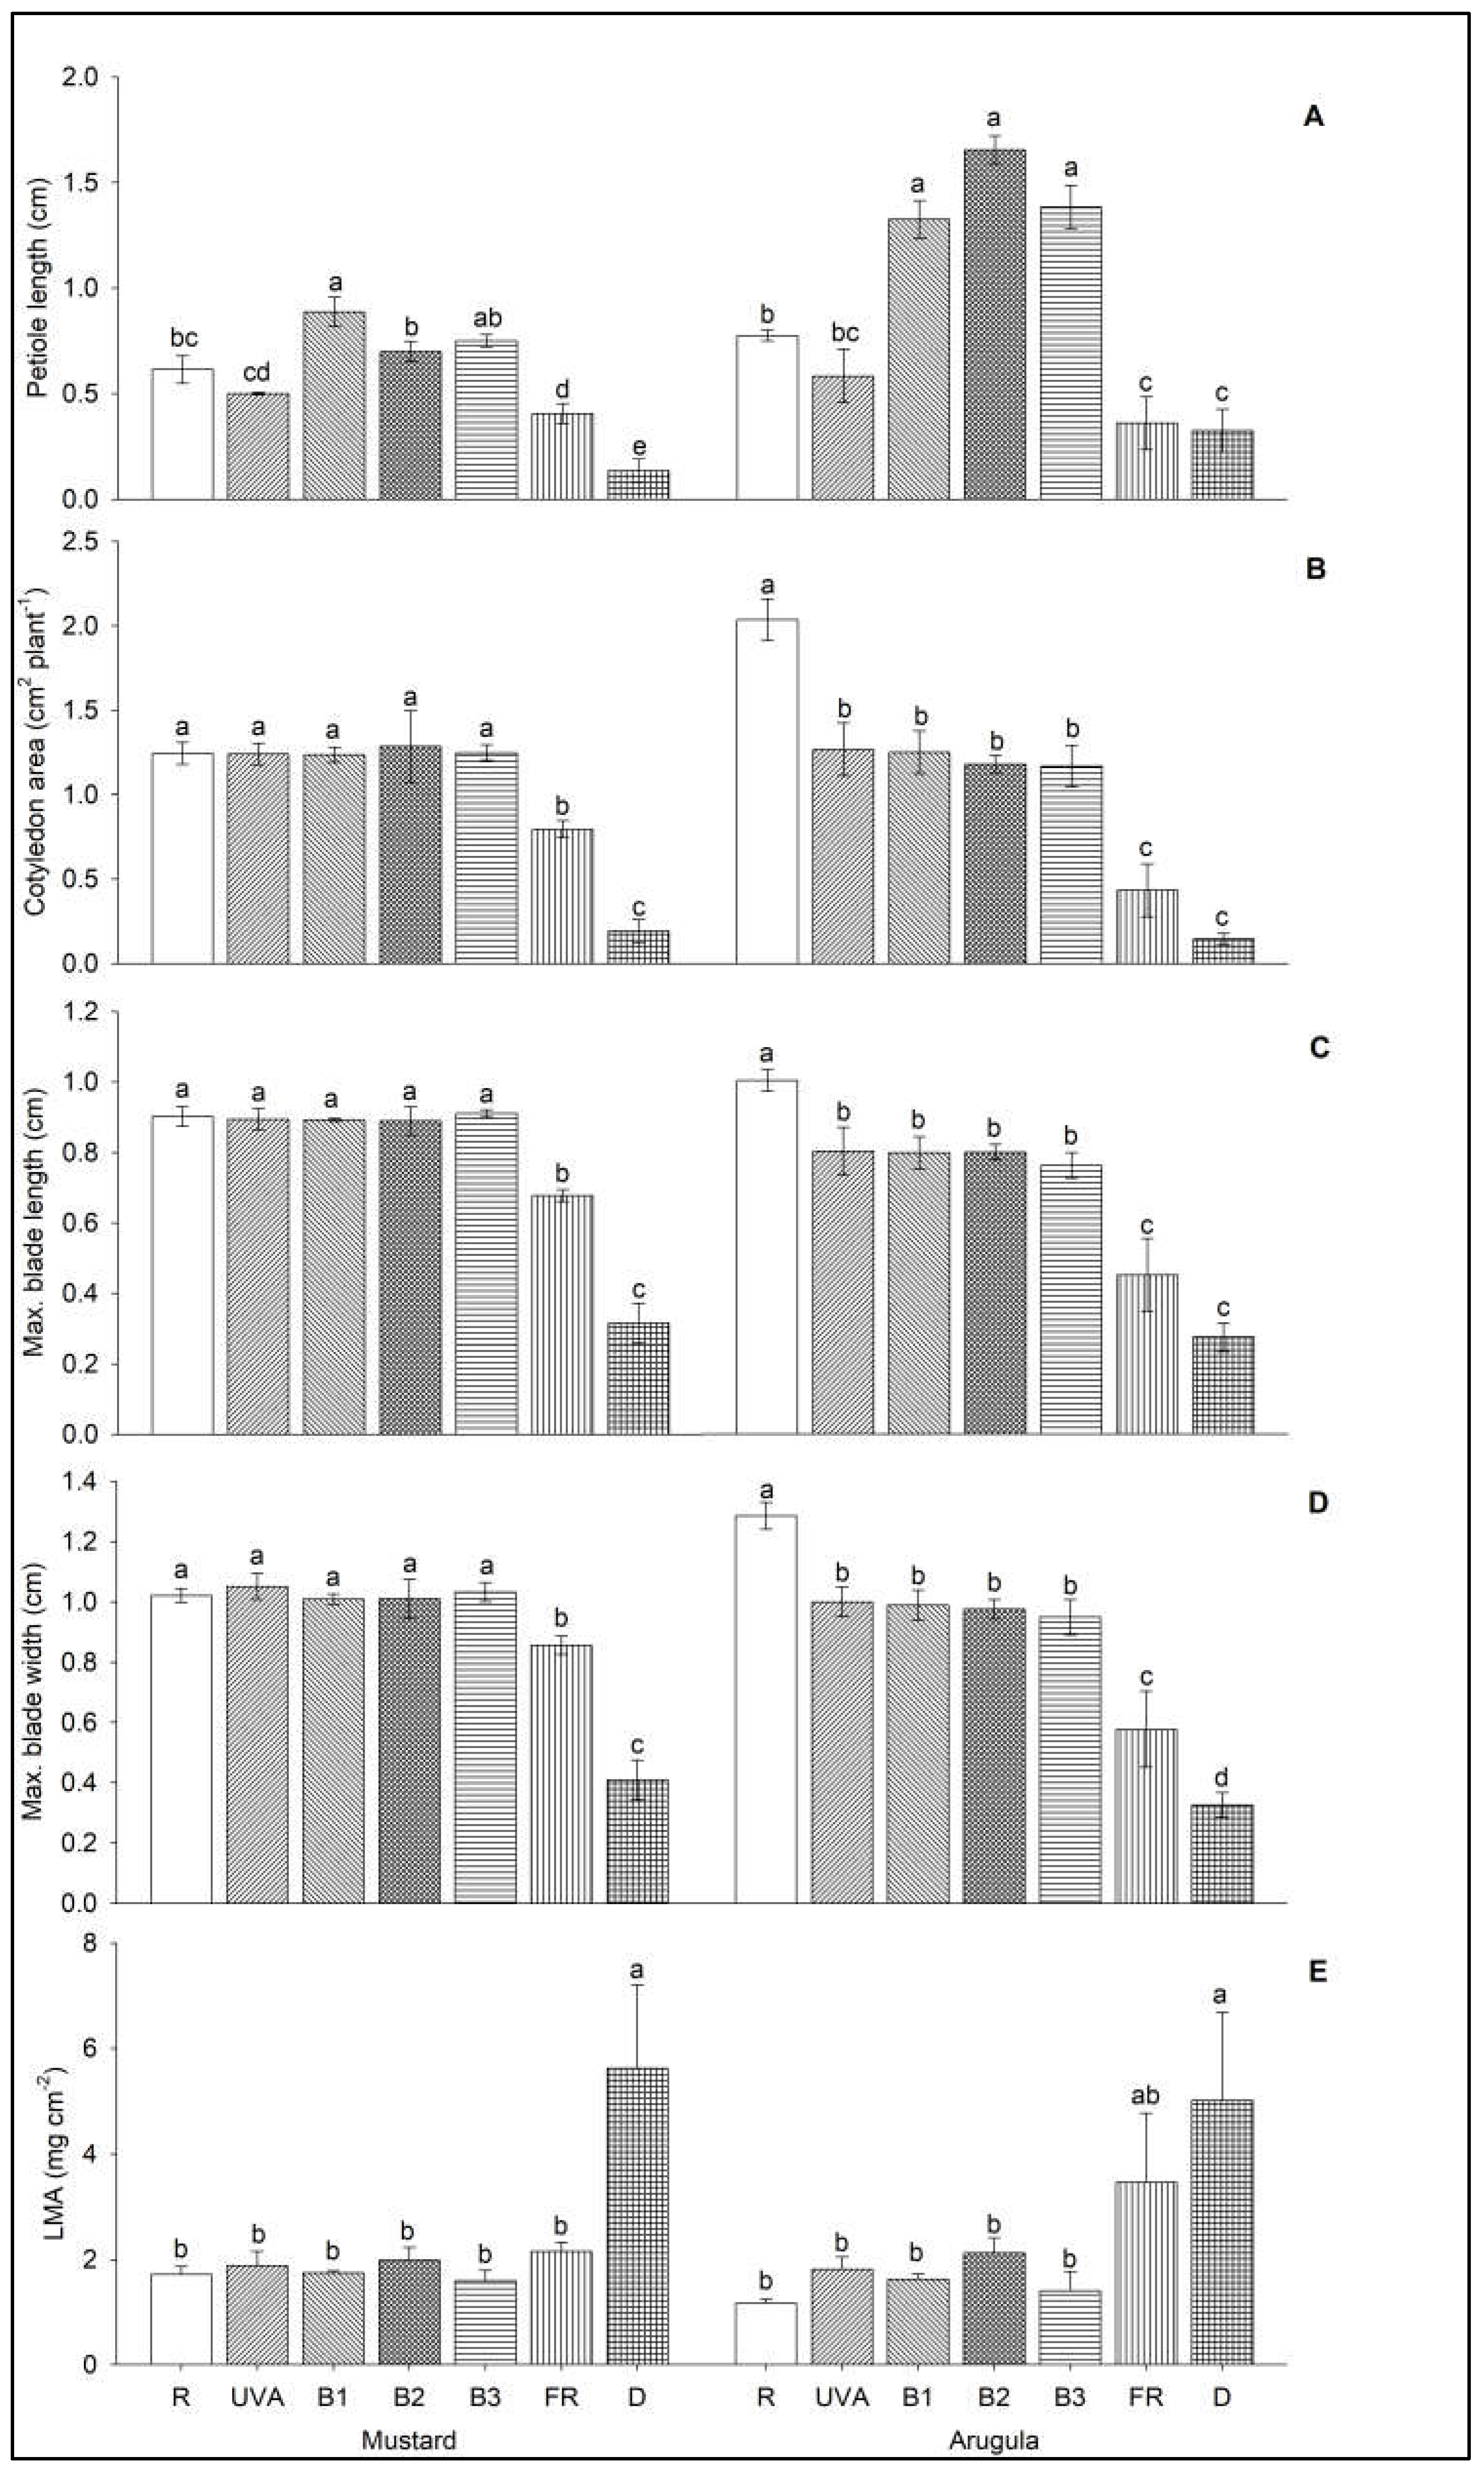
Figure 5.
Seedling color of mustard and arugula microgreens under narrowband LED spectra with different peak wavelengths and in the dark. Data are means ± SE (n = 3). R (λpeak= 660 nm), UVA (λpeak= 385 nm), B1 (λpeak= 405 nm), B2 (λpeak= 440 nm), B3 (λpeak= 455 nm), FR (λpeak= 730 nm), D is dark. Within the same species, means bearing the same letter are not significantly different at P ≤ 0.05 according to Duncan’s new multiple range test.
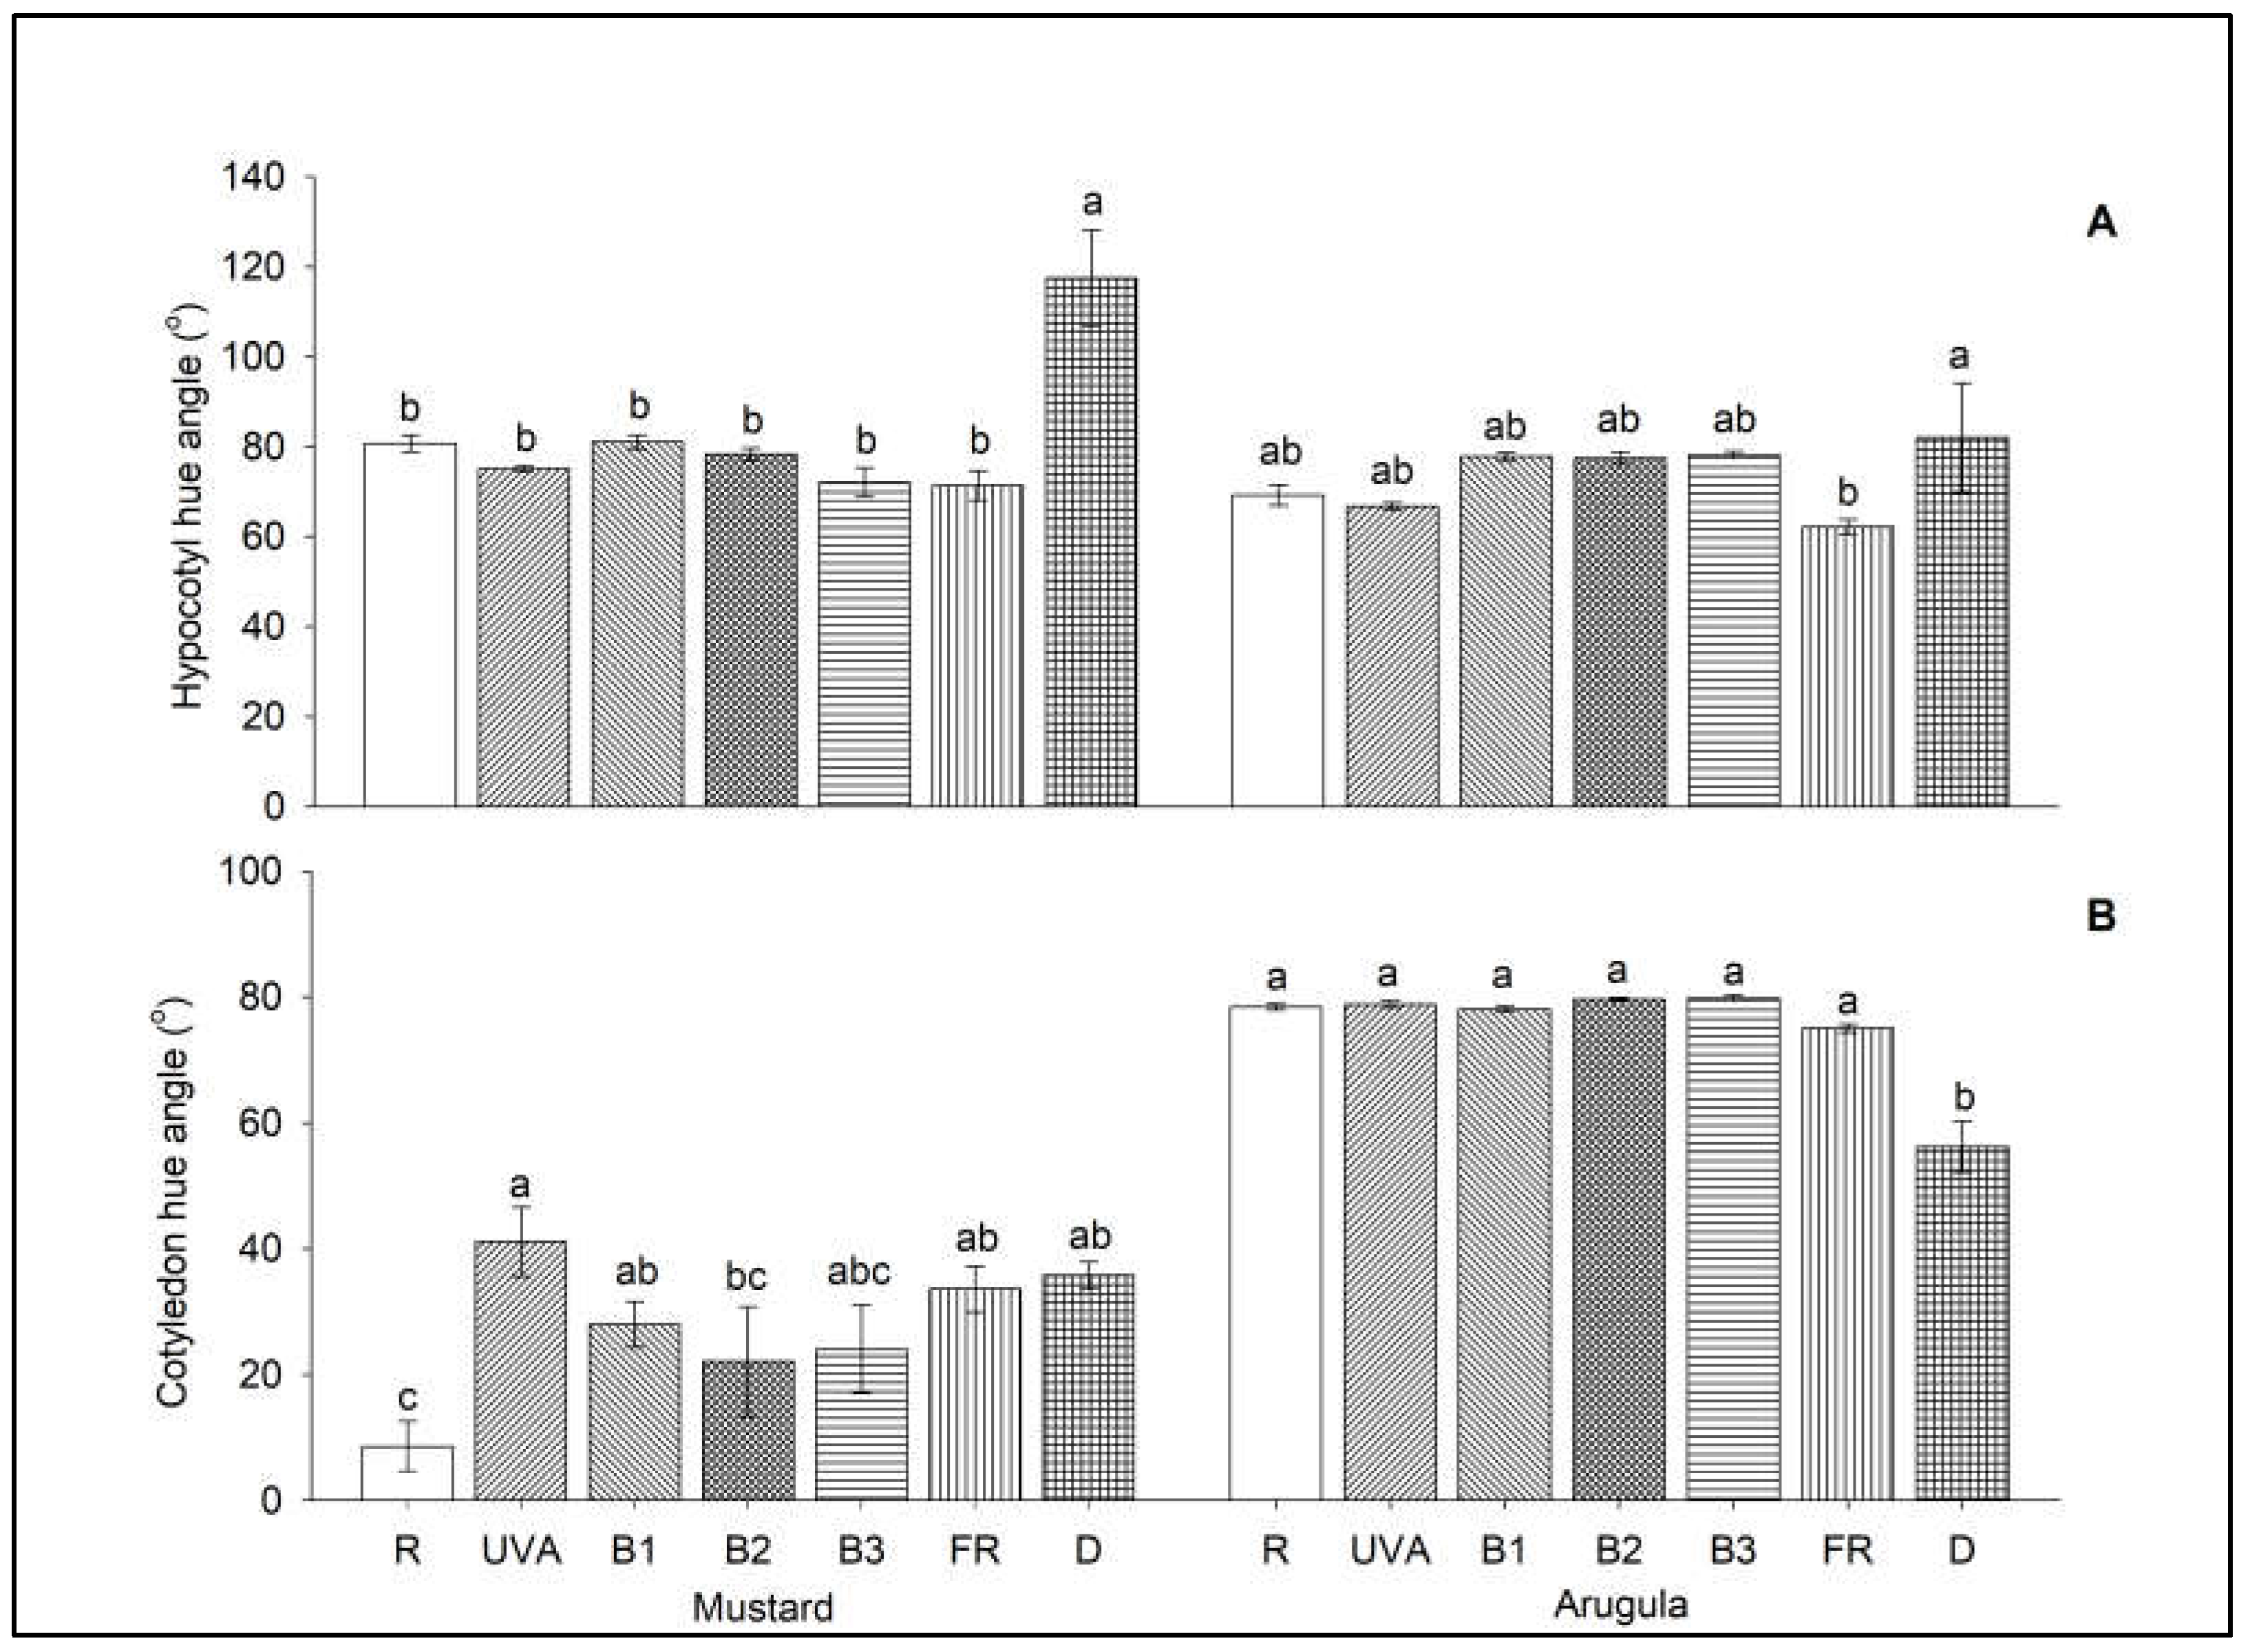

Table 1.
Temperature and relative humidity (mean ± SD) of each treatment plot for each consecutive replication.
Table 1.
Temperature and relative humidity (mean ± SD) of each treatment plot for each consecutive replication.
| Spectrum treatments | Temperature (°C) | Relative Humidity (%) | ||||
|---|---|---|---|---|---|---|
| Rep 1 | Rep 2 | Rep 3 | Rep 1 | Rep 2 | Rep 3 | |
| R | 21.2 ± 0.22 | 21.1 ± 0.19 | 21.0 ± 0.20 | 74.6 ± 0.73 | 73.5 ± 0.73 | 72.9 ± 0.89 |
| UVA | 21.1 ± 0.24 | 21.0 ± 0.25 | 20.4 ± 0.28 | 69.6 ± 0.95 | 70.0 ± 1.02 | 76.0 ± 1.10 |
| B1 | 21.0 ± 0.29 | 21.0 ± 0.20 | 20.7 ± 0.35 | 72.2 ± 1.05 | 72.0 ± 0.69 | 77.5 ± 1.58 |
| B2 | 21.2 ± 0.20 | 21.0 ± 0.23 | 19.8 ± 0.32 | 73.1 ± 0.69 | 71.4 ± 0.92 | 79.1 ± 1.78 |
| B3 | 21.2 ± 0.23 | 20.9 ± 0.33 | 21.0 ± 0.21 | 71.5 ± 0.54 | 75.6 ±1.62 | 71.9 ± 0.96 |
| FR | 21.1 ± 0.29 | 20.9 ± 0.32 | 20.9 ± 0.18 | 70.8 ± 1.28 | 73.5 ± 1.10 | 75.3 ± 0.94 |
| D | 20.3 ± 0.40 | 20.1 ± 0.32 | 20.9 ± 0.21 | 76.3 ± 1.86 | 76.2 ± 1.84 | 71.1 ± 0.97 |
Table 2.
Peak wavelength (λpeak), full width at half maximum (FWHM), photon flux density (PFD), estimated phytochrome photostationary state (PPS), and lighting source for each narrowband LED spectrum treatment.
Table 2.
Peak wavelength (λpeak), full width at half maximum (FWHM), photon flux density (PFD), estimated phytochrome photostationary state (PPS), and lighting source for each narrowband LED spectrum treatment.
| Spectrum treatment | λpeak (nm) |
FWHM (nm) |
PFD (μmol m–2 s–1) |
PPSz | LED lighting source |
|---|---|---|---|---|---|
| UVA | 385 | 11.5 | 52.0 ± 0.4y | 0.77 | Yunustech Inc., Mississauga, Canada |
| B1 | 405 | 13.6 | 49.9 ± 0.1 | 0.58 | RX30, Heliospectra AB, Gothenburg, Sweden |
| B2 | 440 | 14.6 | 50.7 ± 1.0 | 0.49 | LX601C, Heliospectra AB, Gothenburg, Sweden |
| B3 | 455 | 21.2 | 50.0 ± 0.6 | 0.48 | Pro650, LumiGrow, Emeryville, USA |
| R | 660 | 15.6 | 50.0 ± 0.4 | 0.89 | LX601C, Heliospectra AB, Gothenburg, Sweden |
| FR | 730 | 21.9 | 49.5 ± 0.5 | 0.16 | LX601C, Heliospectra AB, Gothenburg, Sweden |
| D | / | / | / | / | / |
zPhytochrome photostationary state estimated following Sager et al. (1988) [3]. yPFD data are means ± SE (n = 3).
Disclaimer/Publisher’s Note: The statements, opinions and data contained in all publications are solely those of the individual author(s) and contributor(s) and not of MDPI and/or the editor(s). MDPI and/or the editor(s) disclaim responsibility for any injury to people or property resulting from any ideas, methods, instructions or products referred to in the content. |
© 2023 by the authors. Licensee MDPI, Basel, Switzerland. This article is an open access article distributed under the terms and conditions of the Creative Commons Attribution (CC BY) license (http://creativecommons.org/licenses/by/4.0/).
Copyright: This open access article is published under a Creative Commons CC BY 4.0 license, which permit the free download, distribution, and reuse, provided that the author and preprint are cited in any reuse.


