
Submitted:
10 May 2023
Posted:
11 May 2023
You are already at the latest version
Abstract
In this study, the Bohler K 190 steel was used. The steel was manufactured by the powder metallurgy (PM) process. The boronizing process was carried out in the range of 1173 to 1323 K, for 1-10 h. The samples were boronized in solid medium, called the Durborid powder mixture. For the microstructural observations, the scanning electron microscopy was utilized for determining the morphology of interfaces and measuring the layers’ thicknesses. The phase composition of boride layers was also determined with X-ray diffraction analysis. To investigate the redistribution of chemical elements redistribution during the boronizing process, the EDS mapping and EDS point analysis were used. The boride layers were constituted by FeB and Fe2B phases except for 1173 K for 1 h. The values of Vickers microhardness of Fe2B, FeB and transition zone were estimated. Finally, to assess the boron activation energies in FeB and Fe2B, the so-called integral method was applied and the results in terms of activation energies were confronted with the literature data.
Keywords:
boronizing
; K190 steel
; microstructure
; properties
; simulation
1. Introduction
The boronizing is a process of thermochemical treatment designed for enhancing the surface features of treated steels. It consists of diffusion the boron atoms via thermal process into the steel surfaces. The typical temperature range of boronizing is 1023 – 1323 K, for 0.5 - 10 h. When applying this process, two iron borides FeB and Fe2B layers can be formed according to the controlling parameters which are the time duration, the treatment temperature and the quantity of boron source in the reactive medium. It is reported that the first iron boride being appeared is the Fe2B phase [1]. It possesses a tetragonal crystal lattice with boron content of 8.83 wt.% B. The typical values of hardness of this phase are around 1600 HV. The thermal expansion coefficient of this phase is 281 × 10-6 K-1. The FeB phase is formed as the second one and contains 16.23 wt.% B. The crystal lattice of this phase is orthorhombic and typical values of hardness are around 2000 HV. The thermal expansion coefficient of FeB phase is 296 × 10-6 K-1. The remarkable properties of boride layers are high surface hardness, resistance against wear, anti-corrosion resistance, low friction coefficient and low fracture toughness.
Boronizing process is usually realized in gaseous [1,2] or liquid medium [3,4], in powder or paste [5,6], in plasmatic medium [7] or using electrolysis [8]. After this process, the boronized material is usually cooled down in the furnace. But the re-austenitization, quenching and tempering of boronized materials can be applied. The purpose of this heat treatment is to achieve the appropriate balance between the toughness and strength [9].
The boronizing in powder mixture is the most used kind of boronizing in practice, because of its simplicity and cost efficiency [10]. However, boronizing in plasma or by electrolysis are less time consuming [11]. In case of carbon steels, the boride layers are formed as per the iron-boron equilibrium diagram [12]. Boride layers are usually biphased and constituted by FeB and Fe2B phases. However, especially in case of carbon steels, boride layers can be monophased too, containing the sole Fe2B phase [11]. The thermal expansion coefficients of these phases are strongly different, which can cause cracks formation at their interfaces. For this reason, the formation of monophased Fe2B layer is preferred in the industry [13]. The formation of Fe2B layer, especially in case of carbon steels, can be achieved by a careful controlling of boronizing parameters, or by applying a diffusion annealing process after boronizing [14]. However, in case of high - alloy steels it is difficult to obtain the Fe2B layer solely. In this case, the thickness of FeB phase can reach 50% of the total layer thickness [15,16]. In case of chromium steels, the chromium borides (CrxBy), may be present in the boride layers as precipitates [17]. The thickness of boride layers is strongly dependent on boronizing parameters. It increases as both the boronizing time and temperature rise. On the other hand, increasing carbon and alloying elements contents limits the growth of boride layers by slowing down the mass flux of active boron. This phenomenon is also caused by the presence of metal borides (i.e. chromium borides) as precipitates that consume a part of active boron during this thermodiffusion process.
For this reason, the morphology of boride layers formed on high – alloy steels is smoother and loses typical saw-tooth morphology at interfaces with the substrate [18,19]. Some alloying elements have stabilizing effect as silicon on ferrite. Therefore, in the case of steels with ferritic microstructure, the presence of silicon can create obstacles for the growth of boride layers, and deviations from the parabolic growth law of boronized layers can be observed [20].
This paper aims to study the surface modifications of high-alloyed Bohler K 190 steel by boronizing. The properties of boronized layers were then investigated by using adequate experimental tools. Particularly, the SEM observations were carried out to examine the type of interface morphology and to measure the layers’ thicknesses. The phase composition of boride layers was done with the help of XRD analyses. The property of surface hardness was examined by using the microhardness Vickers testing. The redistribution of alloying elements between boride layers and substrate was also quantified by EDS mapping and point analysis. Furthermore, the integral diffusion model [21,22,23,24,25] was employed for obtaining the values of boron activation energies in FeB and Fe2B for PM Bohler K190 steel. This part of kinetic study was completed by comparing our values of activation energies with the literature data.
2. Materials and Methods
The used material was Bohler K 190 steel, manufactured by PM process. Chemical composition of the steel was (in wt.%) 2.30 % C; 0.6 % Si; 0.3 % Mn; 12.5 % Cr, 1.1 % Mo; 4.0 % V. The samples were first metallographically prepared, by grinding using SiC sandpapers with a grit 600 and 1200 and polishing by diamond paste with particle size 6, 3 and 1 µm. After preparation, the samples were ultrasonically cleaned and degreased in acetone for 15 minutes. Before boronizing process, the samples were placed into the steel container and covered with Durborid powder mixture (see Figure 2). The container was inserted into an electrical resistance furnace and heated to 1173, 1223, 1248, 1273 or 1323 K, and for 1, 3, 5, 7 or 10 h at each temperature. After the boronizing, the container was removed from the furnace and samples were cooled down to the room temperature. Then the specimens were cross-sectioned and subjected to the standard metallographic preparation line. After the final step of polishing, the samples were etched in Nital etchant (3% solution of HNO3 in ethyl alcohol) for 60 s. The microstructure of boride layers was analysed by a scanning electron microscope (SEM) Jeol JSM-7600F. For analysis, the secondary electrons (SE) detection regime, at an acceleration voltage of 15 kV was used. Thickness of individual and total boride layers was estimated on randomly selected places. For a sufficient reliability of the results, the Kunst and Schaaber method has been used [26]. For quantification of elemental redistribution, the EDS (energy dispersive spectroscopy) was used. The chemical elements mapping and point analysis (with a minimum of 8 measurements in each boride compound) were realized. The XRD analysis of samples was obtained using a Phillips PW 1710 with CoKα1,2 characteristic radiation, filtered by iron. The record of XRD analysis was realized in the 2-theta angle between 10 and 100° with a step of 0.05°. However, the results from each X-ray pattern may represent the phase composition of the material surface and its substrate depending on the penetration depth of X-rays. The diffraction maxima were identified using the HighScore Plus programme. The microhardness of boride layers, diffusion zone and substrate was analyzed using a Hanneman microhardness tester, with a load of 100g (HV0.1) during a loading time of 15. To obtain the relevant information of Vickers microhardness, seven measurements were made in each place.
Figure 1.
Schematization of the container with its components designed for the powder pack boronizing process [7].
Figure 1.
Schematization of the container with its components designed for the powder pack boronizing process [7].
3. Results
3.1. The integral diffusion model
The so-called the integral diffusion model was already applied for some boronized steels [21,22,23,24,25] to simulate the time dependencies of layers ‘thickness of FeB and (FeB+ Fe2B) after assessing the values of boron diffusion coefficients in the FeB and Fe2B phases. The diffusion of boron atoms occurs in the semi-infinite medium within the steel matrix saturated with boron atoms. Figure 2 gives a schematic view of the generated boron concentration profiles across the FeB and Fe2B layers without the occurrence of boride incubation periods.
Figure 2.
Schematization of the boron concentration profiles in case of the bilayer (FeB+ Fe2B).
The equilibrium boron concentrations with upper and lower limits in FeB and Fe2B are represented in the Figure 1 with (=16.40 wt.%B) and (=16.23 wt.%B) for the FeB phase. For the Fe2B phase, the corresponding values are (= 9 wt.%B) and (=8.83 wt.%B) [23,24,25]. The adsorbed amount of boron at the steel surface is designated by the quantity [27]. The variable designates the position of the first (FeB/Fe2B) interface while refers to that of the second (Fe2B/substrate) interface. The solubility limit of boron atoms within the steel matrix is represented by the concentration and equal to 35×10-4 wt.% B [28,29]. Equation (1) represents the change in time of the FeB layer thickness :
Where denotes the kinetic constant at the (FeB/Fe2B) interface and ε a dimensionless parameter related to the boron diffusion coefficient in FeB. Equation (2) gives the time dependence of the entire layer (FeB+ Fe2B):
Where stands for the parabolic growth constant at the (FeB/Fe2B) interface and η is the second dimensionless parameter related to the boron diffusion coefficient in Fe2B. Equation (2) gives the time dependence of the entire layer (FeB+ Fe2B): The assumptions considered while establishing the mathematical foundation of this kinetic approach can be found elsewhere [21,22]. In the integral method, the boron concentration profiles in the FeB and Fe2B layers are expressed by Equations (3) and (4) following the method proposed by Goodman [30]:
The time–dependent parameters , , and must verify the boundary conditions. Therefore, the integral method is based on the numerical solving of the set of differential algebraic equations (DAE) given by Equations (5) to (10).
with , and
By choosing appropriate changes of variables [21,22,34], the DAE system can be turned into a set of non linear equations to find the numerical values of , , and constants, by using the Newton-Raphson method [31], needed for the estimation of boron diffusion coefficients in FeB and Fe2B. Consequently, the values of dimensionless parameters ε and η can be readily found by using Equations (11) and (12):
and
The values of boron diffusion coefficients in FeB and Fe2B are deduced from Equations (13) and (14):
and
3.2. SEM examinations and EDS analysis
The cross-sectional SEM images of differently borided specimens are shown in the Figure 3. It is clearly visible that all boride layers were two-phase, composed of FeB and Fe2B phases. However, in the case of 1173 K for 1 h, the FeB layer does not appear and only Fe2B layer is formed. The interfaces have a high tendency to flatness as observed in borided Royalloy steel [21]. This scenario is ascribed to the effect of alloying elements present in the steel matrix with producing dense and thicker layers at prolonged time duration (10 h).
Figure 4 gives the results of EDS mapping of boronized Bohler K 190 steel. A strong redistribution of alloying elements was noticed during the boronizing process. The chromium is the most redistributed element from the substrate underneath the boride layers, to the transient region, which is accompanied with the formation of additional particles in close-to-boride region. These particles contained the highest content of chromium. Additionally, the silicon is insoluble in the borides, and hinders the diffusion of boron atoms to the substrate. Therefore, Si is being accumulated at the Fe2B/substrate interface and reached a maximum concentration of 5.07 wt.%. This experimental outcome was also obtained in the reference [32] in case of boronized steel having the following chemical composition (in wt. %) 0.1% C, 0.20% Si, 0.85% Mn, 0.20% Cu, 0.040% P, and 0.050% S). In this paper it was reported that silicon was expelled from the surface layer, as a result of borides growth, to nearby the Fe2B/substrate interface forming there the Fe-Si-B compounds (FeSi0.4B0.6 and Fe5SiB2) [32].
To quantify the redistribution of alloying elements during the boronizing process, the EDS point analysis was realized. The results of this analysis are shown in Figure 5. It is noticed that the chromium content in the boride layers is slightly higher, compared to the substrate. This is the proof, that the chromium is displaced from the substrate to the boride layers, by leaving the region near the boride layers. This region is at the same time depleted of it. The Fe2B phase contains a slightly higher chromium content compared to the FeB phase. The reason of this phenomenon is probably the gradual diffusion of chromium from the substrate to the boride layers, or its easier incorporation into the Fe2B phase compared to the FeB phase. The particles formed in the transient region contain in all cases the highest content of chromium, around 20 – 25 wt. %. The highest amount of silicon was found in the transient region underneath the boride layers, Figure 6. The maximum value of silicon content ranged between 3.73 and 5.07 wt.%. The boronizing temperature has only limited effect on the maximum content of silicon within the transition zone. This result is in good agreement with the experimental findings obtained by investigation of boronized Royalloy steel [21].
3.2. XRD Results
To support the results of microscopic examinations of cross-sectional views of boronized Bohler K 190 steel, the experimental characterization by XRD technique is crucial to identify the phases formed at the surface layer. The XRD patterns of boronized samples at the temperatures 1173, 1248 and 1323 K for two times 1 or 10 h are shown in the Figure 7. It is clearly visible that all the boride layers are two-phase, constituted by FeB and Fe2B phases. However, borides of alloying elements were not detected. It is known that in case of high alloy steels the metal borides such as chromium borides can be present in the boride layers. Chromium borides were found, for instance, in the case of AISI 440C steel (2.1 wt.% C; 16.50 wt.% Cr; 0.417 wt.% Mn) [10], boronized in Ekabor II powder mixture. The chromium borides CrB and Cr2B were also found in boride layers on steel with chemical composition: 0.90 wt.% C; 7.80 wt.% Cr and 2.50 wt.% Mo [33] together with molybdenum borides of MoB type. In the reference [14], the CrB phase was identified by XRD analysis in the boride layers for Vanadis 6 steel while employing other processing parameters. However, in case of boronized of Royalloy steel [21], the chromium borides were not detected in the boride layers by XRD analysis. This fact was attributed to the overlapping of diffraction peaks of iron borides and chromium borides CrxBy and their deconvolution is rather difficult. To detect accurately the presence of chromium borides inside the boride layers, the use of transmission electron microscopy is strongly recommended. Therefore, it is necessary to prepare thin foils of boride layers for identifying their nature and chemical composition.
3.3. Microhardness Vickers measurements
The microhardness of boron compounds is very crucial for their wear performance. A success of the thermochemical treatment such as boronizing depends on the degree of hardening attained in the surface layer to generate hard phases by thermodiffusion. Therefore, the establishment of microhardness profiles exhibiting a gradient of this property along the depth is a key factor for determination of efficiency of boronizing process. The Vickers microhardness HV0.1 of boride layers and transient region are shown in Figure 8. The higher microhardness value was recorded for the FeB layer on the outer surface of boronized samples. The values of microhardness for the FeB layer ranged between 1992 and 2245 HV0.1. The microhardness of the Fe2B phase was lower than that of FeB phase and ranged between 1579 and 1743 HV0.1. The Vickers microhardness of transient region was in the range 748 - 1141 HV0.1. Also it is seen that the microhardness depends only slightly on either the temperature of boronizing or its duration, and the magnitudes are very similar to those obtained on Royalloy [21] or Vanadis 6 steels [13].
3.4. Assessment of boron diffusion coefficients in iron borides with the integral method
The determination of boron diffusivity in each iron boride (FeB or Fe2B) is a crucial step allowing for the modelling of boronizing kinetics of Bohler K190 steel for the selected processing parameters. The employed model assumes the diffusion of active boron at atomic level to develop a dual-phase boride layer composed of FeB and Fe2B for which the boron concentrations are kept constant at the two phase interfaces and independent of time duration. Thus, the plots of time dependencies of layers’ thicknesses permit to extract the experimental parabolic constants needed for assessing the boron diffusivities in iron borides. Figure 9 describes the change in time duration of experimental layers’ thicknesses obtained on the Bohler K190 steel. It is obvious from the plotted straight lines of Figure 9 that the generated layers by boronizing obeyed the classic parabolic law, and the process is then controlled by the diffusion of boron atoms at atomic level. İn Table 1 are grouped the experimental values of parabolic growth constants obtained from the slopes of corresponding straight lines in the temperature range 1173-1323 K.
The set of non linear equations stemming from the DAE system was solved numerically via the Newton-Raphson routine [31] to obtain the following values , , and related to the two dimensionless parameters ε and η. Table 2 summarizes the calculation results regarding the values of boron diffusion coefficients in both phases by employing Equations (13) and (14) and also the values of the two dimensionless parameters ε and η. From Table 2, it is seen that these two parameters are not affected by the processing temperature and kept constant within the considered temperature range which demonstrated the parabolic nature of iron boride layers.
The calculated results in terms of boron diffusivities in iron borides displayed in Table 2 were fitted by employing the Arrhenius relations to obtain from the slopes of plotted lines the values of boron activation energies in both phases. The results of this fitting are shown in Equations (15) and (16):
The values of boron activation energies estimated from the present work were compared to other data reported in the literature in case of boronized high alloy steels [21,22,34,35,36,37,38,39,40,41,42,43] as displayed in Table 3. It is obviously noted that the boron activation energies calculated or measured on these various materials are influenced by the key factors which include the following: the difference in chemical composition of substrate, the boriding process used to generate the boride coatings, the processing parameters, the nature of boron source, the calculation method or approach and the nature of chemical reactions controlling the process. The high values of boron activation energies in FeB and Fe2B are attributed to the effect of alloying elements present in the Bohler K190 steel. They are consistent with the literature data in case of pack-boronizing process [21,22,34,39,40,41,42,43]. In fact, the increase of alloying element in the matrix steel tend to hinder the boron diffusion and acting as a diffusion barrier that resulted in a reduction of layers’ thicknesses. For example, Makuch et al. [22] pack-boronized the X165CrV12 with the powder mixture constituted by 50 wt.% B4C, 0.5 wt.% AlF3 and 49.5 wt.% Al2O3 to generate the FeB and Fe2B layers. The estimated boron activation energy in FeB was lower to that of Fe2B phase which contrasts other literature results [21,34,38,42] for which the Fe2B phase was formed before the FeB phase. However, Makuch et al. [22] claimed that FeB phase was formed first via phase transformation, similar to that observed in the gas boriding process [44]. Keddam et al. [35] plasma paste boronized the AISI 440C steel by employing the borax paste as a boron source. From Table 3, the obtained activation energy was the lowest (=134.62 kJmol-1), compared to those found or estimated in case of the powder-pack boriding [21,22,34,39,40,41,42,43]. This situation is certainly ascribed to the activation of different species inside the generated plasma. In another study, Kartal et al. [36] designed a recent cost-efficient method of surface hardening referred to as CRTD-Bor. This process was used to form solely the Fe2B phase by combining the action of CRTD with the phase homogenization (PH) step. The employed electrolyte contained 90 wt. % Na2B4O7 and 10 wt.%Na2CO3. XRD studies indicated the presence of only FeB for processing temperatures of 850, 900 and 950°C during 15 min whereas for higher temperatures (i.e., 1000 and 1050°C) both iron borides co-exist. The boron activation energy was then estimated by using the classical parabolic growth law independently of the phase composition of boronized layers and they found the value of 179 kJ mol-1. This latter value of activation energy is lower to that obtained in case of the pack-boronizing of AISI T1 steel [44] (= 212.76 kJ mol−1) because in the CRTD-Bor, the electrochemical reactions proceed rapidly reducing thereby the activation energy of the system. Campos-Silva et al. [37] designed a new boronizing method referred to as the pulsed-DC powder-pack boriding process (PDCPB). This surface hardening technique is promising because of the shortening of time duration and saving energy. It was applied to the AISI 316L steel substrates to form the bilayer (FeB/Fe2B) under a constant current input of 5 A with the possibility of changing the polarity in the cathodes. Such a process led to the reduction of boron activation energies in FeB and Fe2B compared to the conventional powder methods [21,22,34,39,40,41,42,43].
Campos et al. [38] employed the paste-boronizing treatment to surface harden the AISI M2 steel. The result of such a thermochemical process led to the formation of FeB, Fe2B and diffusion zone in the interval of 1123 to 1273 K. The effect of boron paste thickness on the kinetics was evidenced by varying its value from 3 to 5 mm. An increase of boron paste thickness resulted in the rise of the parabolic growth constants at the three growing phase interfaces. In addition, the bilayer model was suggested to determine the respective boron activation energies in FeB and Fe2B which were 257.5 and 201 kJmol-1. Ramakrishnan et al. [39] pack-boronized the martensitic stainless steel (grade SS410) at temperatures between 900 and 950°C. The change in diameter of cylindrical specimens before and after boronizing was measured in the range of 0.12 to 0.36% resulting in the increase of surface roughness of treated specimens. In addition, the boron activation energy in SS410 steel was calculated with the use of empirical relationship and they obtained a value of 186.49 kJ mol-1. Nait Abdellah et al. [42] used the powder mixture of 90 wt.% B4C and 10 wt%. NaBF4 to produce the bilayer (FeB/Fe2B) on AISI H13 steel in the range 800-1000°C. The mean diffusion coefficient (MDC) method was established to extract the boron activation energies in FeB and Fe2B which are respectively 236.43 and 233.04 kJmol-1. Additionally, the same model was verified empirically for two additional processing parameters (925 °C for 1 and 3 h).
As limiting factors, the present approach did not account for the precipitation of metal borides. Apart from the formation of iron borides as compact layers, a certain content of boron atoms reacts with metal transition to give rise to the metal borides present as precipitates within the boronized layer. This situation leads to slowing down the diffusion rate of boron atoms and thereby diminishing the layers’ thicknesses. The chemical interaction carbon-boron is neglected. In reality, the boron element competes with carbon present in the steel substrate to occupy the majority of octahedral sites in the iron lattice. As a result, the carbon element is chased away from the diffusion front to pass into the diffusion zone [45]. Although these two limitations, the integral method is a key tool used to model the boronizing kinetics of any alloyed steel.
4. Conclusions
The Bohler K190 steel was treated thermochemically employing Durborid powder mixture in the interval of 1173 to 1323 K. The entire boride layer reached a maximum thickness of 113 ± 4.5 µm. The borides/matrix interfaces are relatively flat and smooth, which is typical for high-carbon and high-alloyed steels. The XRD studies corroborated the presence of two iron borides (FeB and Fe2B) for almost all (except at 1173 K for 1 h) processing parameters. The repartition of alloying elements was put into evidence through the EDS mapping. Chromium was found to be more soluble in Fe2B than in FeB. The particles appeared in the transition zone were found to be rich in chromium content of about 20-25 wt. %. Silicon was more accumulated underneath the borides where its maximum content was in the range 3.73-5.07 wt.%. The values of Vickers microhardness of FeB phase were located between 1992 and 2245 HV0.1 while those of Fe2B were in the range 1579-1743 HV0.1. The Vickers microhardness values measured in the transition zone ranged from 748 to 1141 HV0.1. The obtained values of microhardness were only slightly influenced by the processing parameters. Finally, the obtained values of boron activation energies in FeB and Fe2B were respectively 204.54 and 196.67 kJ·mol-1. These two activation energies were obtained from the integral method and deemed to be concordant with the literature results.
References
- Keddam, M.; Kulka, M.; Makuch, N.; Pertek, A.; Maldzinski, L. A kinetic model for estimating the boron activation energies in the FeB and Fe2B layers during the gas-boriding of Armco iron: Effect of boride incubation times. Appl. Surf. Sci. 2014, 298, 155–163. [Google Scholar] [CrossRef]
- Kulka, M.; Makuch, N.; Piasecki, A. Nanomechanical characterization and fracture toughness of FeB and Fe2B iron borides produced by gas boriding of Armco iron. Surf. Coat. Technol. 2017, 325, 515–532. [Google Scholar] [CrossRef]
- Smolnikov, E.A.; Sarmanova, L.M. Study of the possibility of liquid boriding of high-speed steels. Metal Science and Heat Treatment 1982, 24, 785–788. [Google Scholar] [CrossRef]
- Nguyen, L.; Pham, N.A. study of SiC/Borax liquid boride layer on AISI H13 hot work tool steel. International Journal of Applied Engineering & Technology 2021, 23–28. [Google Scholar]
- Léon, R. Mechanical characterization of the AISI 316L alloy exposed to boriding process. Revista DYNA. 2020, 87, 34–41. [Google Scholar] [CrossRef]
- Ipek, M.; Celebi Efe, G.; Ozbek, I.; Zeytin, S.; Bindal, C. Investigation of Boronizing Kinetics of AISI 51100 Steel. J. Mater. Eng. Perform. 2012, 21, 733–738. [Google Scholar] [CrossRef]
- Gunes, I.; Ulker, S.; Taktak, S. Kinetics of plasma paste boronized AISI 8620 steel in borax paste mixtures. Protection of Metals and Physical Chemistry of Surfaces 2013, 49, 567–573. [Google Scholar] [CrossRef]
- Jiang, Y.; Bao, Y.; Wang, M. Kinetic Analysis of Additive on Plasma Electrolytic Boriding. Coatings 2017, 61, 1–9. [Google Scholar] [CrossRef]
- Jain, V.; Sundararajan, G. Influence of the pack thickness of the boronizing mixture on the boriding of steel. Surf. Coat. Technol. 2002, 149, 21–26. [Google Scholar] [CrossRef]
- Kayali, Y.; Gunes, I.; Ulu, S. Diffussion kinetics of borided AISI 52100 and AISI 440C steels. Vacuum 2012, 86, 1428–1434. [Google Scholar] [CrossRef]
- Xie, F.; Cheng, J.; Wang, S. Effects and mechanisms of an alternating current field on pack boriding. Vacuum 2018, 148, 41–47. [Google Scholar] [CrossRef]
- Okamoto, H. B-Fe (boron-iron). Journal of Phase Equilibria and Diffusion 25, 297 – 298, [online]: 2004. [viewed: 2022-11-04]. Available from: https://doi.org/10.1007/s11669-004-0128-3. [CrossRef]
- Keddam, M.; Hudáková, M.; Ptačinová, J.; Moravčík, R.; Gogola, P.; Gabalcová, Z.; Jurči, P. Characterization of boronized layers on Vanadis 6 tool steel. Surface Engineering 2020, 1–10. [Google Scholar]
- Campos-Silva, I.; Flores-Jiménez, M.; Rodríguez-Castro, G.; Hernández-Sánchez, E.; Martínez-Trinindad, J.; Tadeo-Rosas, R. Improved fracture toughness of boride coating developed with a diffusion annealing process. Surface & Coatings Technology 2013, 237, 729–439. [Google Scholar]
- Dybkov, V.I. Boriding of High Chromium Steels. Current Physical Chemistry 2016, 6, 137–144. [Google Scholar] [CrossRef]
- Dybkov, V.I. Basics of Formation of Iron Boride Coatings. Journal of Mineral Metal and Material Engineering. 2016, 2, 30–46. [Google Scholar] [CrossRef]
- Dybkov, V.I.; Lengauer, W.; Barmak, K. Formation of Boride Layers at the Fe–10 %Cr alloy–boron Interface. Journal of Alloys and Compounds. 2005, 398, 113–122. [Google Scholar] [CrossRef]
- Erdogan, M.; Gunes, I. Corrosion behavior and microstructure of borided tool steel. Revista matéria 2013, 20, 1–7. [Google Scholar] [CrossRef]
- Uslu, I.; Omert, H.; Ipek, M.; Celebi, F.G.; Ozdemir, O.; Bindal, C. A Comparison of Borides Formed on AISI 1040 and AISI P20 Steels. Mater. Des. 2007, 28, 1819–1826. [Google Scholar] [CrossRef]
- Zhang, Y.; Zhen, Q.; Lygdenov, B.; Guriev, A.; Shun-Qi, M. Research on the technology of paste boronizing for H13 die steel. Material Science Engineering. 2019, 684, 1–5. [Google Scholar] [CrossRef]
- Orihel, P.; Drienovský, M.; Gabalcová, Z.; Jurči, P.; Keddam, M. Characterization and boron diffusion kinetics on the surface-hardened layers of Royalloy steel. Coatings 2023, 13, 113–129. [Google Scholar] [CrossRef]
- Makuch, N.; Kulka, M.; Keddam, M.; Piasecki, A. Growth kinetics, microstructure evolution and some mechanical properties of boride layers produced on X165CrV12 tool steel. Materials 2023, 16, 1–28. [Google Scholar] [CrossRef] [PubMed]
- Keddam, M.; Topuz, P.; Aydin, O. Simulation of boronizing kinetics of AISI 316 steel with the integral diffusion model. Materials Testing. 2021, 63, 906–912. [Google Scholar] [CrossRef]
- Zouzou, C.; Keddam, M. Boriding kinetics of FeB and Fe2B layers on AISI M2 steel by the integral diffusion model. Annales de Chimie-Sciences des Matériaux 2019, 43, 159–164. [Google Scholar] [CrossRef]
- Keddam, M.; Kulka, M. Simulation of the growth kinetics of FeB and Fe2B layers on AISI D2 steel by the integral method. Phys. Met. Metallogr. 2018, 119, 842–851. [Google Scholar] [CrossRef]
- Kunst, H.; Schaaber, O. Beobachtungen beim Oberflaechenborieren von Stahl. HTM Haerterei Tech. Mitt. 1967. [Google Scholar]
- Yu, L.G.; Chen, X.J.; Khor, A.K.; Sundararajan, G. FeB/Fe2B phase transformation during SPS pack-boriding: Boride layer growth kinetics. Acta Mater. 2005, 53, 2361–2368. [Google Scholar] [CrossRef]
- Okamoto, H. B-Fe (boron-iron). J Phs Eqil and Diff. 2004, 25, 297–298. [Google Scholar] [CrossRef]
- Nait Abdellah, Z.; Cherougne, R.; Keddam, M.; Bouarour, B.; Haddour, L.; Elias, A. The Phase Stability in the Fe-B Binary System: Comparison between the Interstitial and Substitutional Models. Defect and Diffusion Forum. 2012, 322, 1–9. [Google Scholar] [CrossRef]
- Goodman, T.R. Application of Integral Methods to Transient Nonlinear Heat Transfer. Adv. Heat Transfer 1964, 1, 51–122. [Google Scholar]
- Press, W.H.; Flannery, B.P.; Teukolsky, S.A. Numerical Recipes in Pascal: The Art of Scientific Computing. 1989. 1989. [Google Scholar]
- Ortiz-Domínguez, M. Modeling of the Growth Kinetics of Boride Layers in Powder-Pack Borided ASTM A36 Steel Based. Advances in Materials Science and Engineering 2019, 1–12. [Google Scholar] [CrossRef]
- Ortiz-Domínguez, M.; Elias–Espinosa, M.; Keddam, M.; Gómez–Vargas, A.; Lewis, R.; Vera–Cardénas, E. Growth kinetics and mechanical properties of Fe2B layers formed on AISI D2 steel. Indian Journal of Engineering & Materials Science 2015, 22, 231–243. [Google Scholar]
- Keddam, M.; Jurči, P. Simulating the Growth of Dual-Phase Boride Layer on AISI M2 Steel by Two Kinetic Approaches. Coatings. 2021, 11, 433. [Google Scholar] [CrossRef]
- Keddam, M.; Chegroune, R.; Kulka, M.; Taktak, S. Characterization and Diffusion Kinetics of the Plasma Paste Borided AISI 440C Steel. Transactions of the Indian Institute of Metals 2017, 70, 1377–1385. [Google Scholar] [CrossRef]
- Kartal Sireli, G.; Yuce, H.; Arslan, M. Improving the Surface Performance of Discarded AISI T1 Steel by Cathodic Reduction and Thermal Diffusion-Based Boriding. Journal of Materials Engineering and Performance 2023. [Google Scholar] [CrossRef]
- Campos-Silva, I.; Hernández-Ramirez, E.J.; Contreras-Hernández, A.; Rosales-Lopez, J.L.; Valdez-Zayas, E.; Mejía-Caballero, I.; Martínez-Trinidad, J. Pulsed-DC powder-pack boriding: Growth kinetics of boride layers on an AISI 316 L stainless steel and Inconel 718 superalloy. Surface and Coatings Technology 2021, 421. [Google Scholar] [CrossRef]
- Campos, I.; Ramírez, G.; Figueroa, U.; Martínez, J.; Morales, O. Evaluation of boron mobility on the phases FeB, Fe2B and diffusion zone in AISI 1045 and M2 steels. Applied Surface Science 2007, 253, 3469–3475. [Google Scholar] [CrossRef]
- Ramakrishnan, H.; Balasundaram, R.; Lenin, K.; Dhanapal, C.; Saravanan, S. Experimental investigation of borided kinetics on martensitic stainless steel. Materials Today: Proceedings 2022, 68, 1508–1514. [Google Scholar] [CrossRef]
- Ortiz-Domínguez, M.; Keddam, M.; Elias-Espinosa, M.; Damián-Mejía, O.; Flores-Rentería, M.A.; Arenas-Flores, A.; Hernández-Ávila, J. Investigation of boriding kinetics of AISI D2 steel. Surface Engineering 2014, 30, 490–497. [Google Scholar] [CrossRef]
- Topuz, P.; Çicek, O. Kinetic investigation of AISI 304 stainless steel boronized in indirect heated fluidized bed furnace. J. Min. Metall. 2016, 52, 63–68. [Google Scholar] [CrossRef]
- Nait Abdellah, Z.; Boumaali, B.; Keddam, M. Experimental evaluation and modelling the boronizing kinetics of AISI H13 hot work tool steel. Materials Testing 2021, 63, 1136–1141. [Google Scholar] [CrossRef]
- Kayali, Y.; Talas, Ş.; Yalcin, M.C. Diffusion Kinetics of Boronized ASP®2012 Tool Steel Produced by Powder Metallurgy. Protection of Metals and Physical Chemistry of Surfaces 2022, 58, 1036–1043. [Google Scholar] [CrossRef]
- Ortiz-Domínguez, M.; Keddam, M.; Elias-Espinosa, M.; Ramírez-Cardona, R.; Arenas-Flores, A.; Zuno-Silva, J.; Cervantes-Sodi, F.; Cardoso-Legorreta, E. Characterization and boriding kinetics of AISI T1 steel. Metallurgical Research and Technology 2019, 116. [Google Scholar] [CrossRef]
- Campos-Silva, I.; Ortiz-Domínguez, M.; Tapia-Quintero, C. Kinetics and Boron Diffusion in the FeB/Fe2B Layers Formed at the Surface of Borided High-Alloy Steel. J. of Materi Eng and Perform. 2012, 21, 1714–1723. [Google Scholar] [CrossRef]
Figure 3.
Cross sectional SEM images of samples boronized at different processing conditions: (a) 1173 K for 1 h, (b) 1173 K for 10 h, (c) 1248 K for 1 h, (d) 1248 K for 10 h, (e) 1323 K for 1 h and (f) 1323 K for 10 h.
Figure 3.
Cross sectional SEM images of samples boronized at different processing conditions: (a) 1173 K for 1 h, (b) 1173 K for 10 h, (c) 1248 K for 1 h, (d) 1248 K for 10 h, (e) 1323 K for 1 h and (f) 1323 K for 10 h.
Figure 4.
Cross-sectional view of boronized sample at 1223 K for 10 h along with the EDS mapping of Fe, Cr, V, Mn and Si elements.
Figure 4.
Cross-sectional view of boronized sample at 1223 K for 10 h along with the EDS mapping of Fe, Cr, V, Mn and Si elements.
Figure 5.
Chromium contents in FeB, Fe2B and in particles underneath the boride layers.
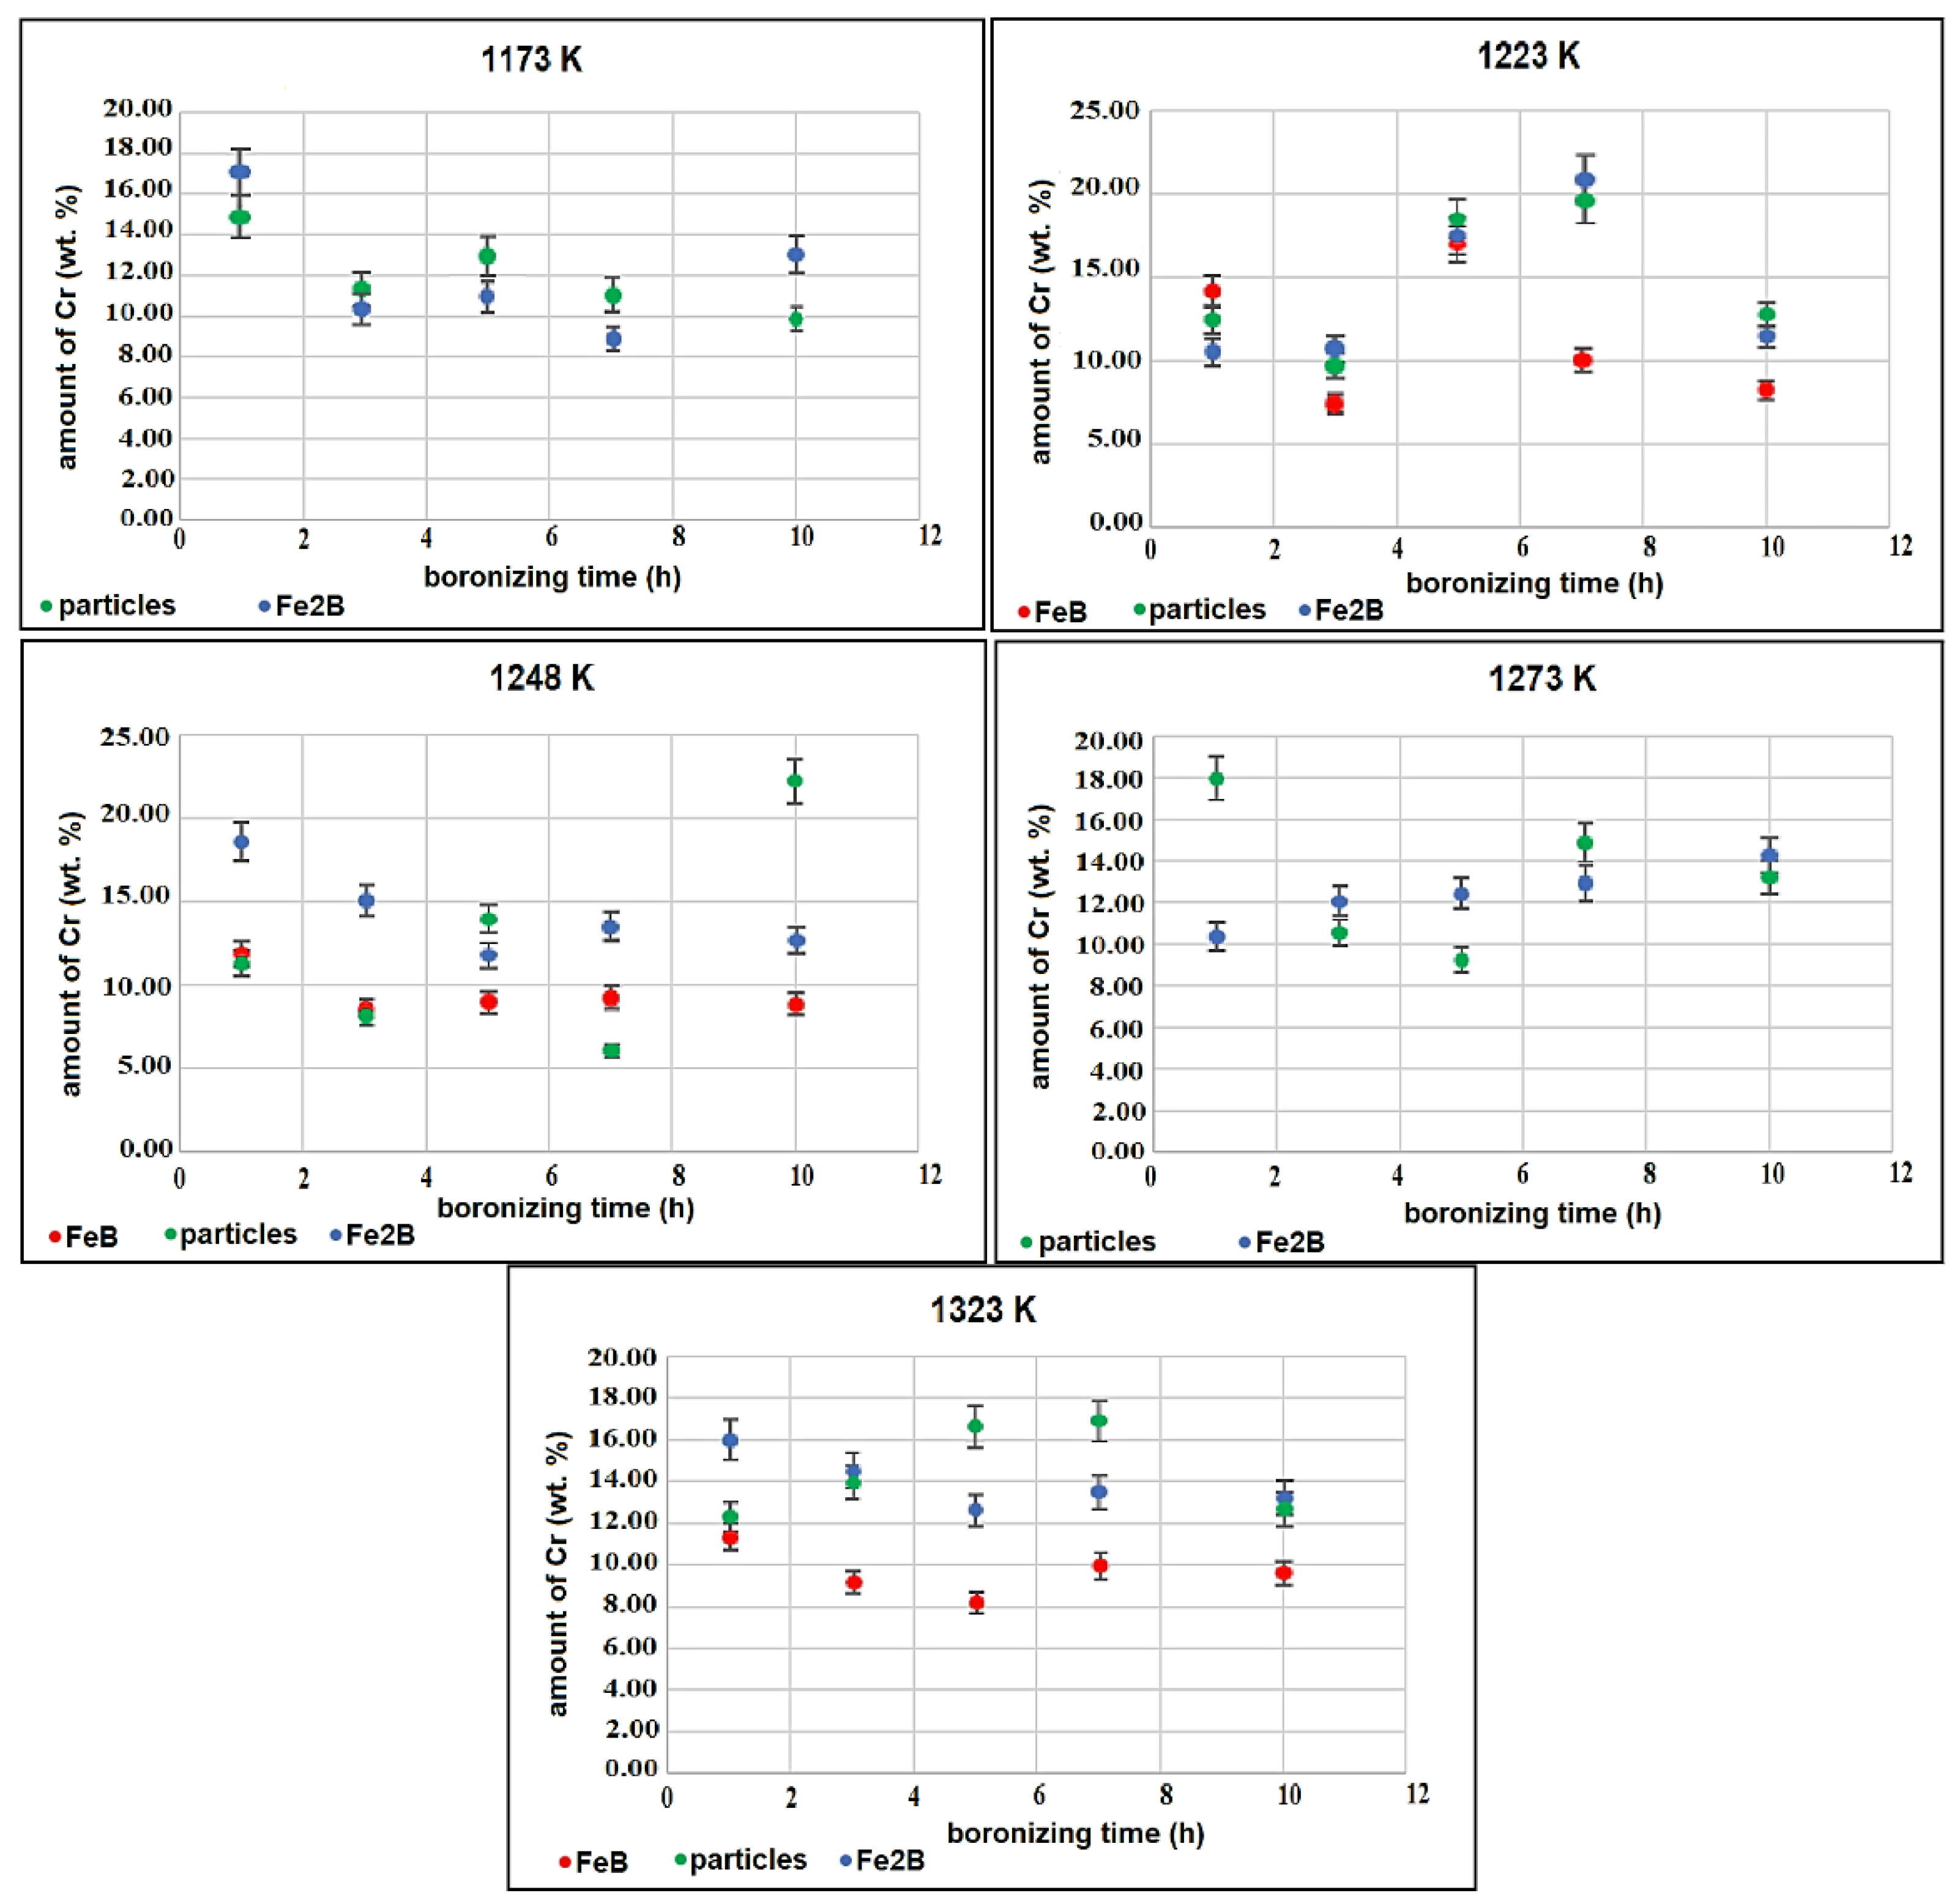
Figure 6.
Maximum of silicon content in transient region underneath the boride layers.
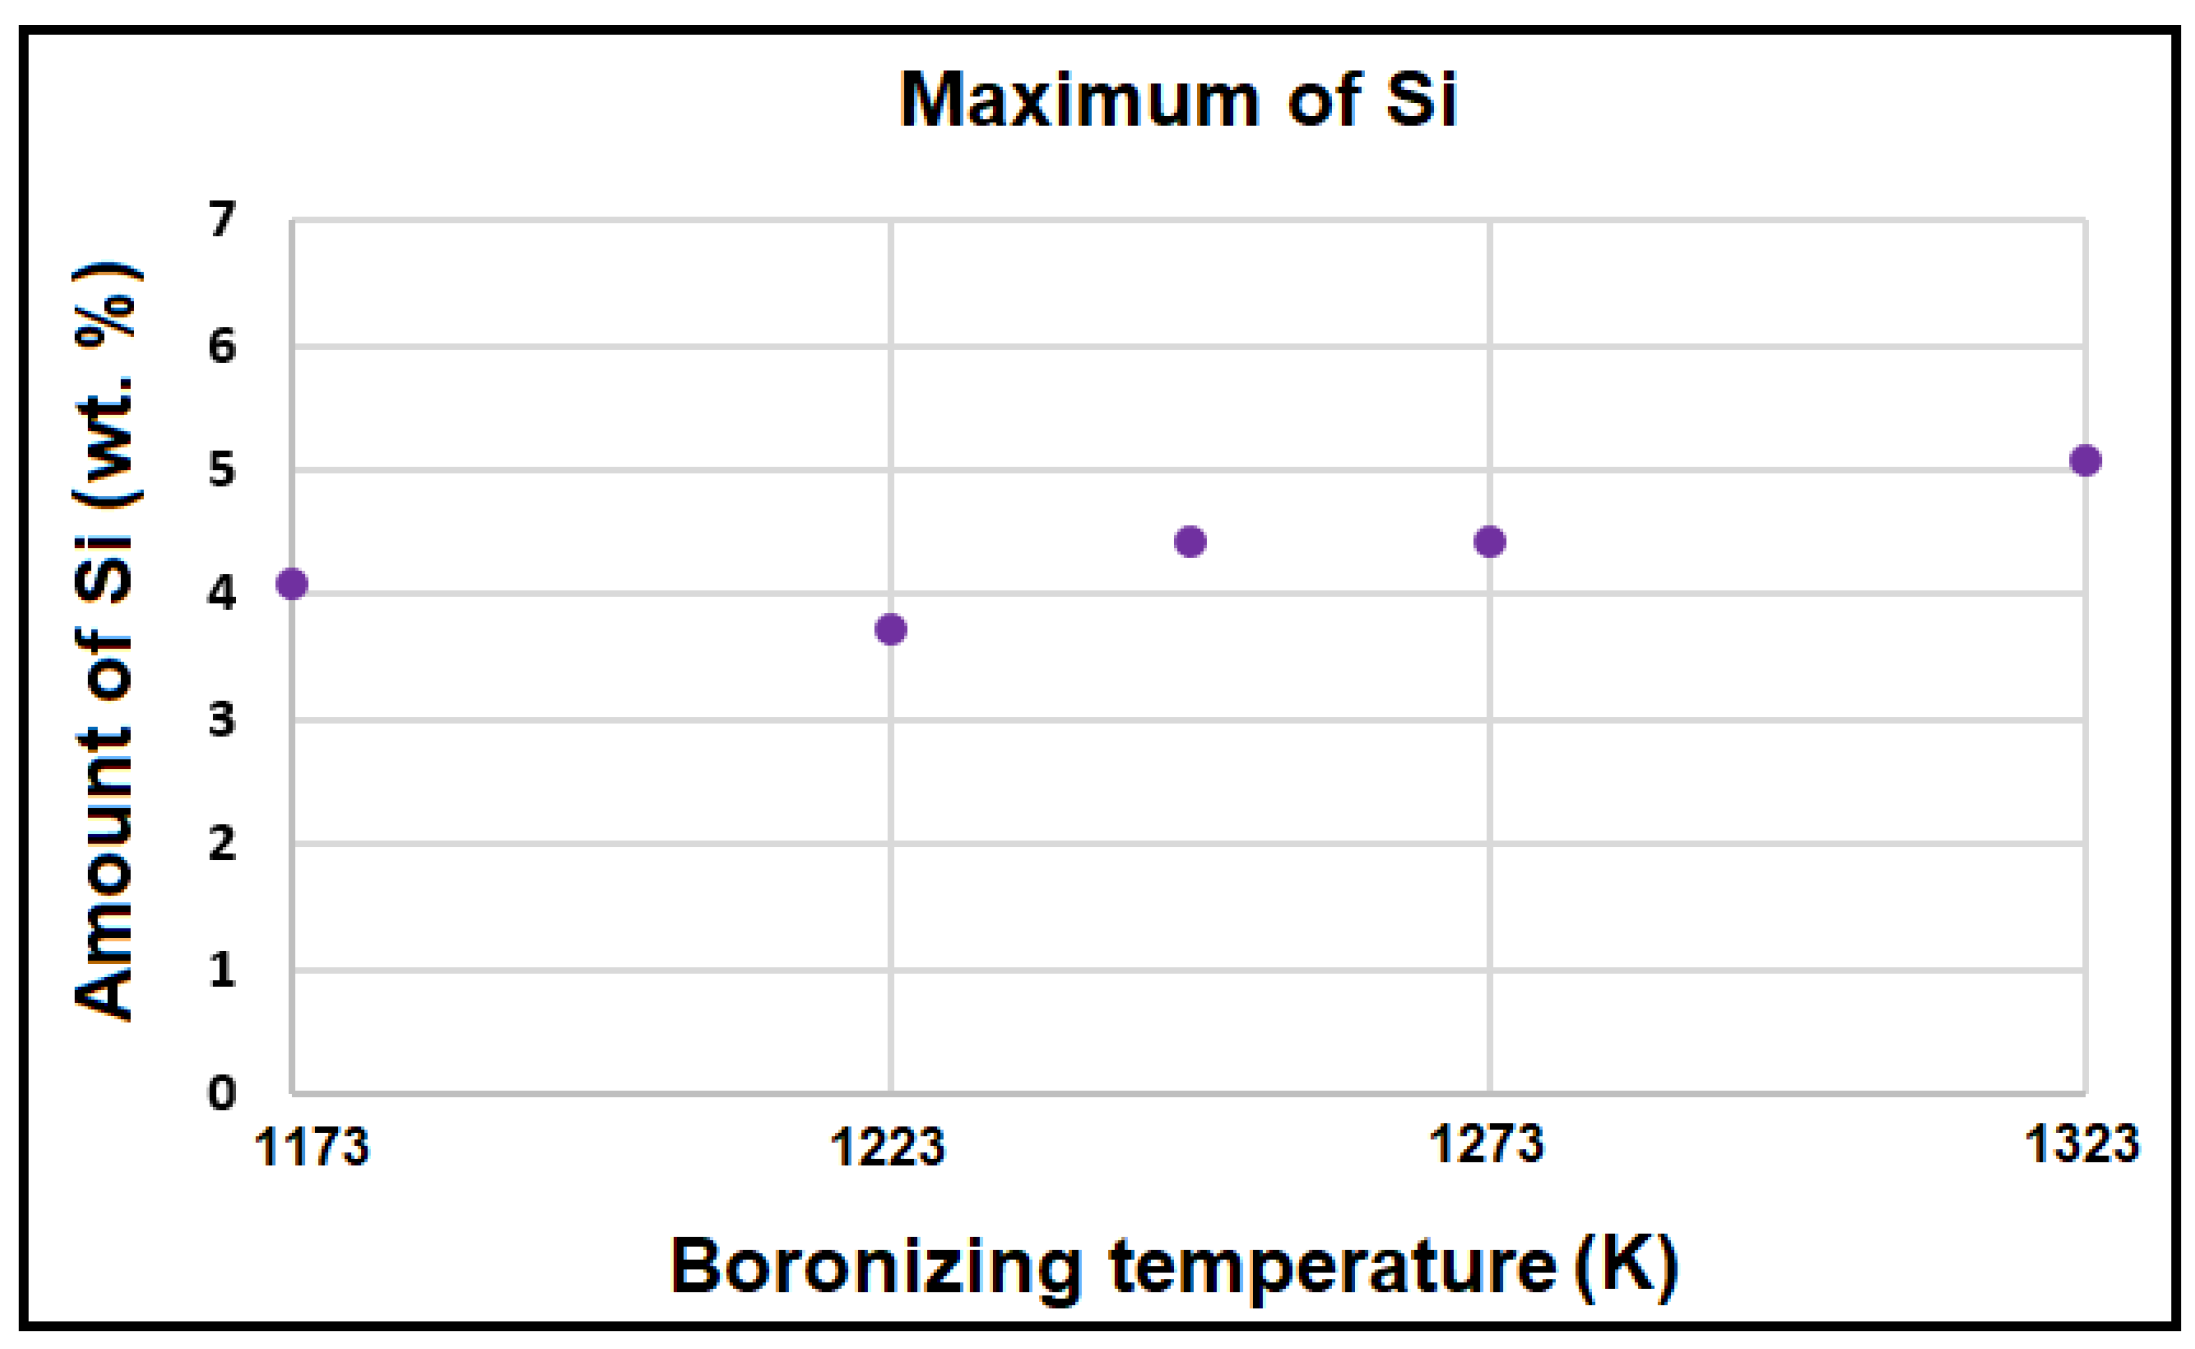
Figure 7.
X-ray diffraction patterns of boride layers on Bohler K 190 steel.
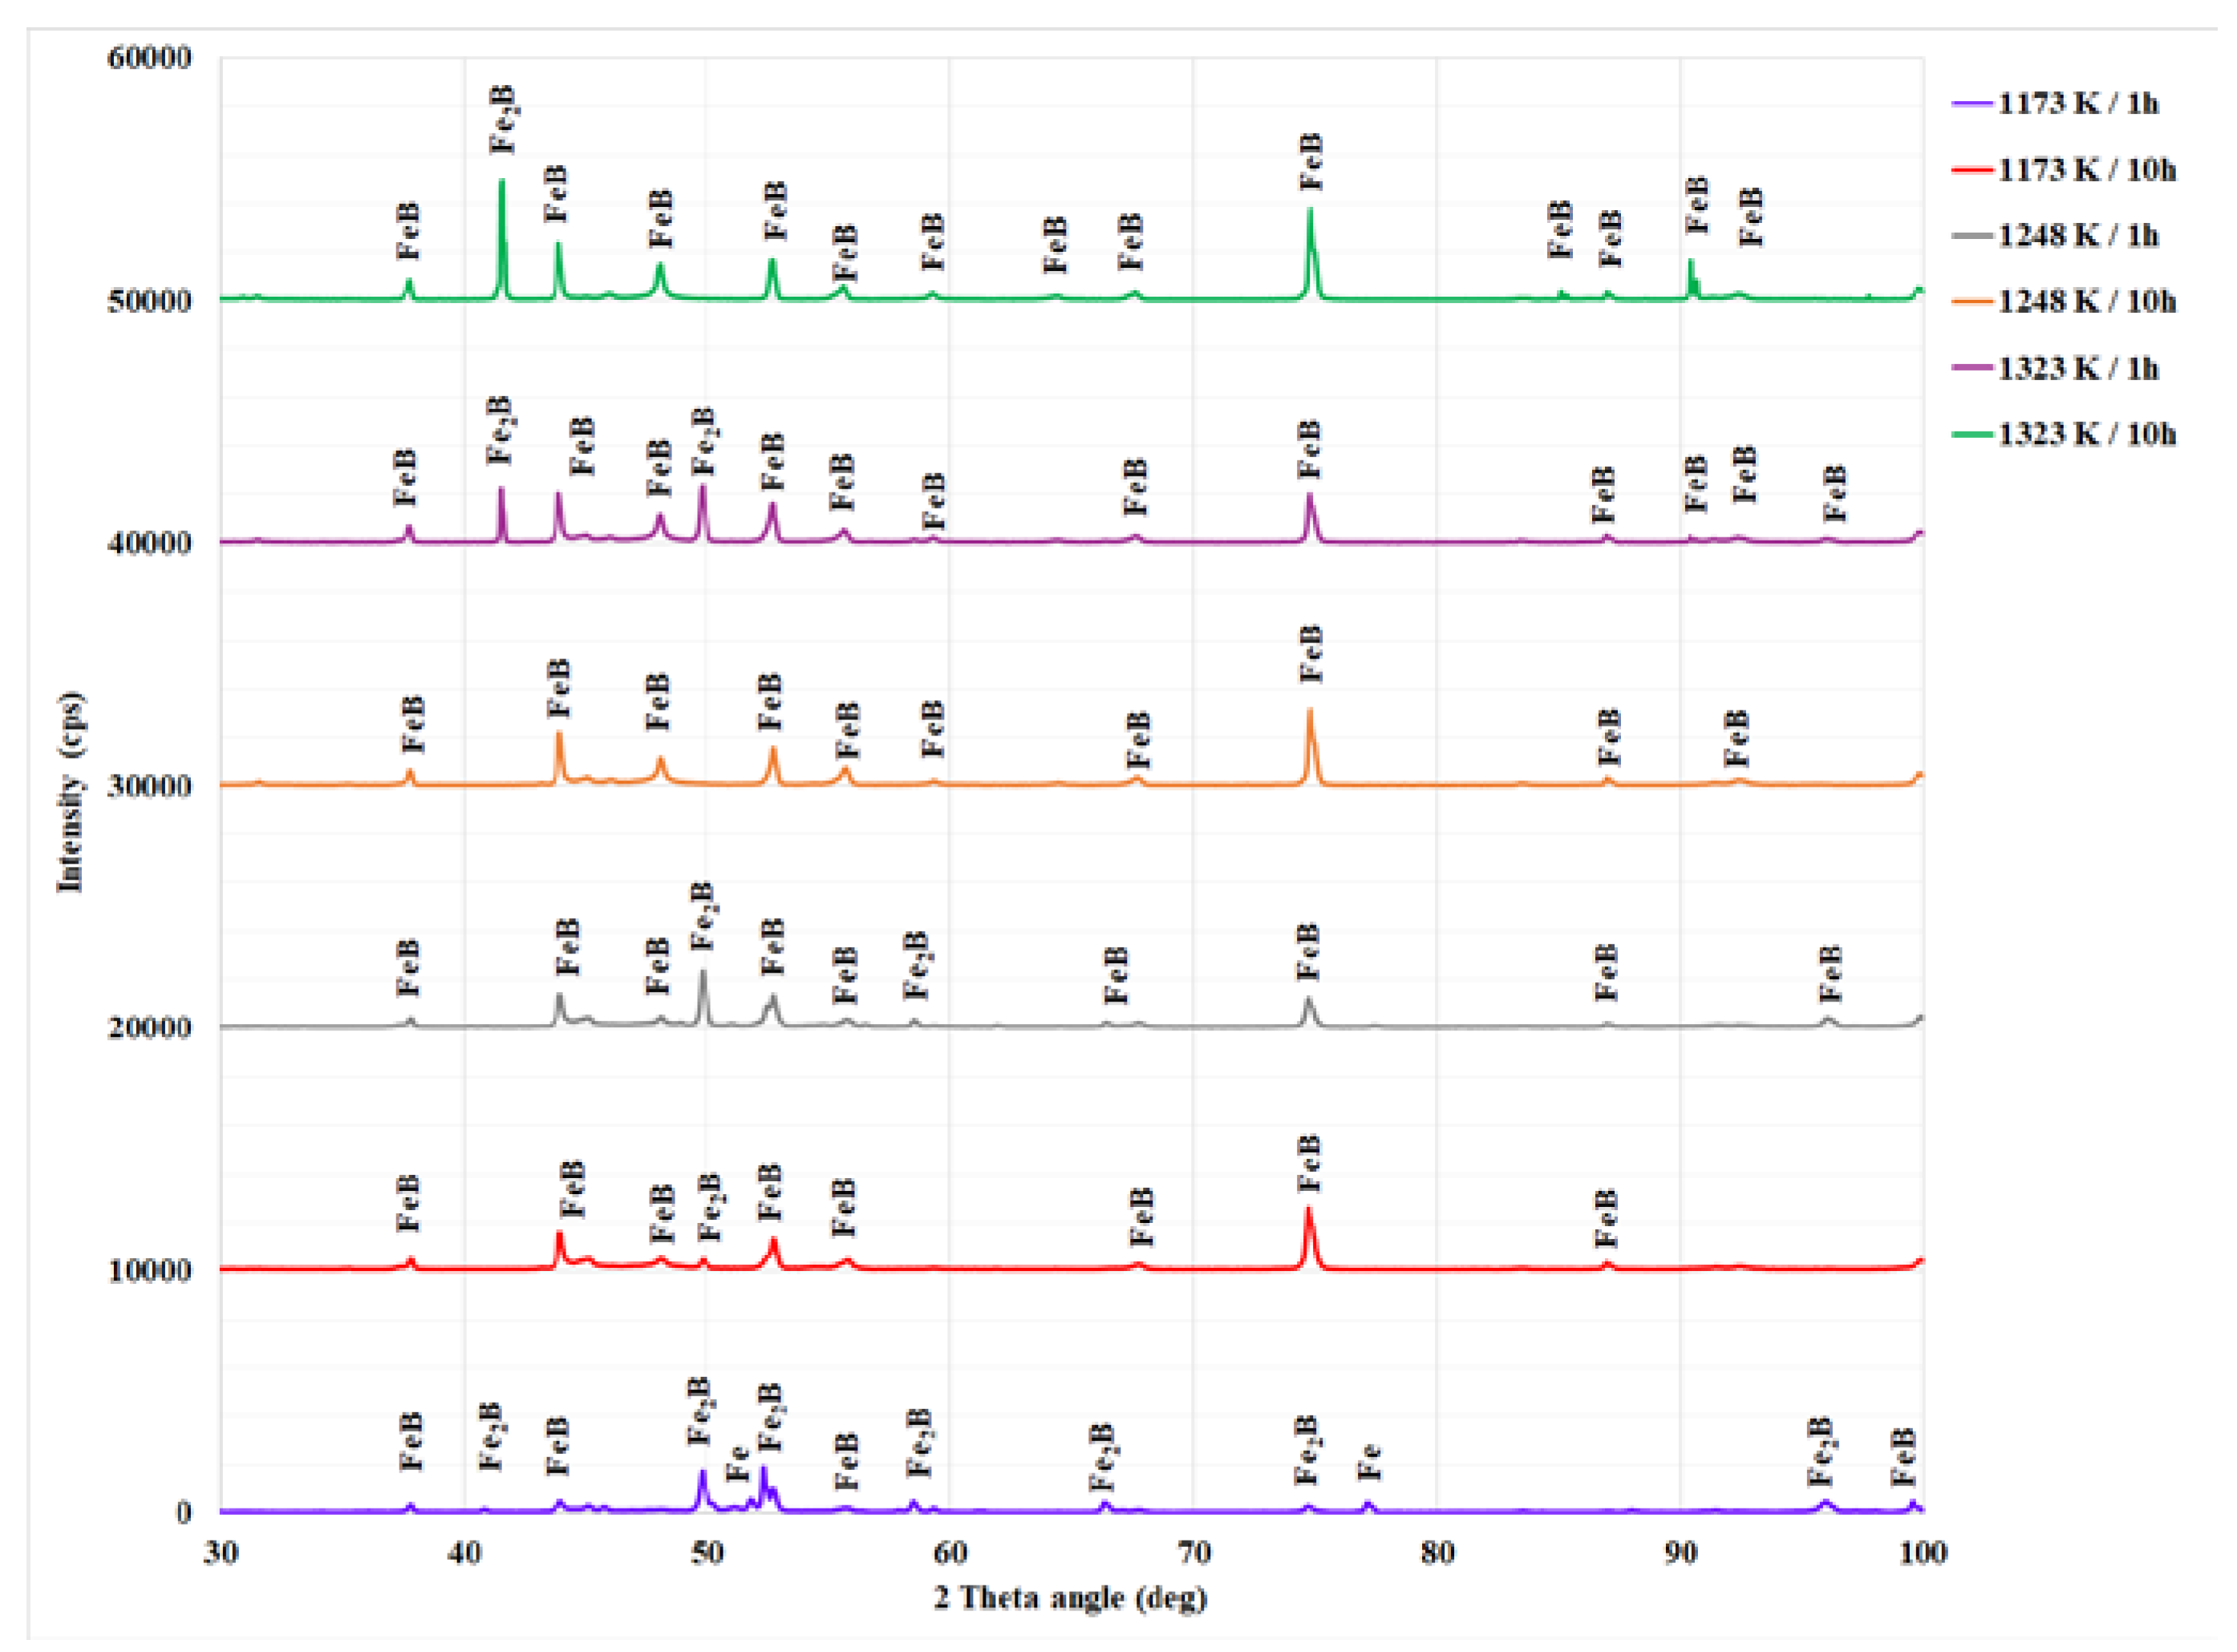
Figure 8.
Measured values of Vickers microhardness in the three locations (FeB, Fe2B.and diffusion zone) on the cross-sections of boronized layers for different conditions.
Figure 8.
Measured values of Vickers microhardness in the three locations (FeB, Fe2B.and diffusion zone) on the cross-sections of boronized layers for different conditions.
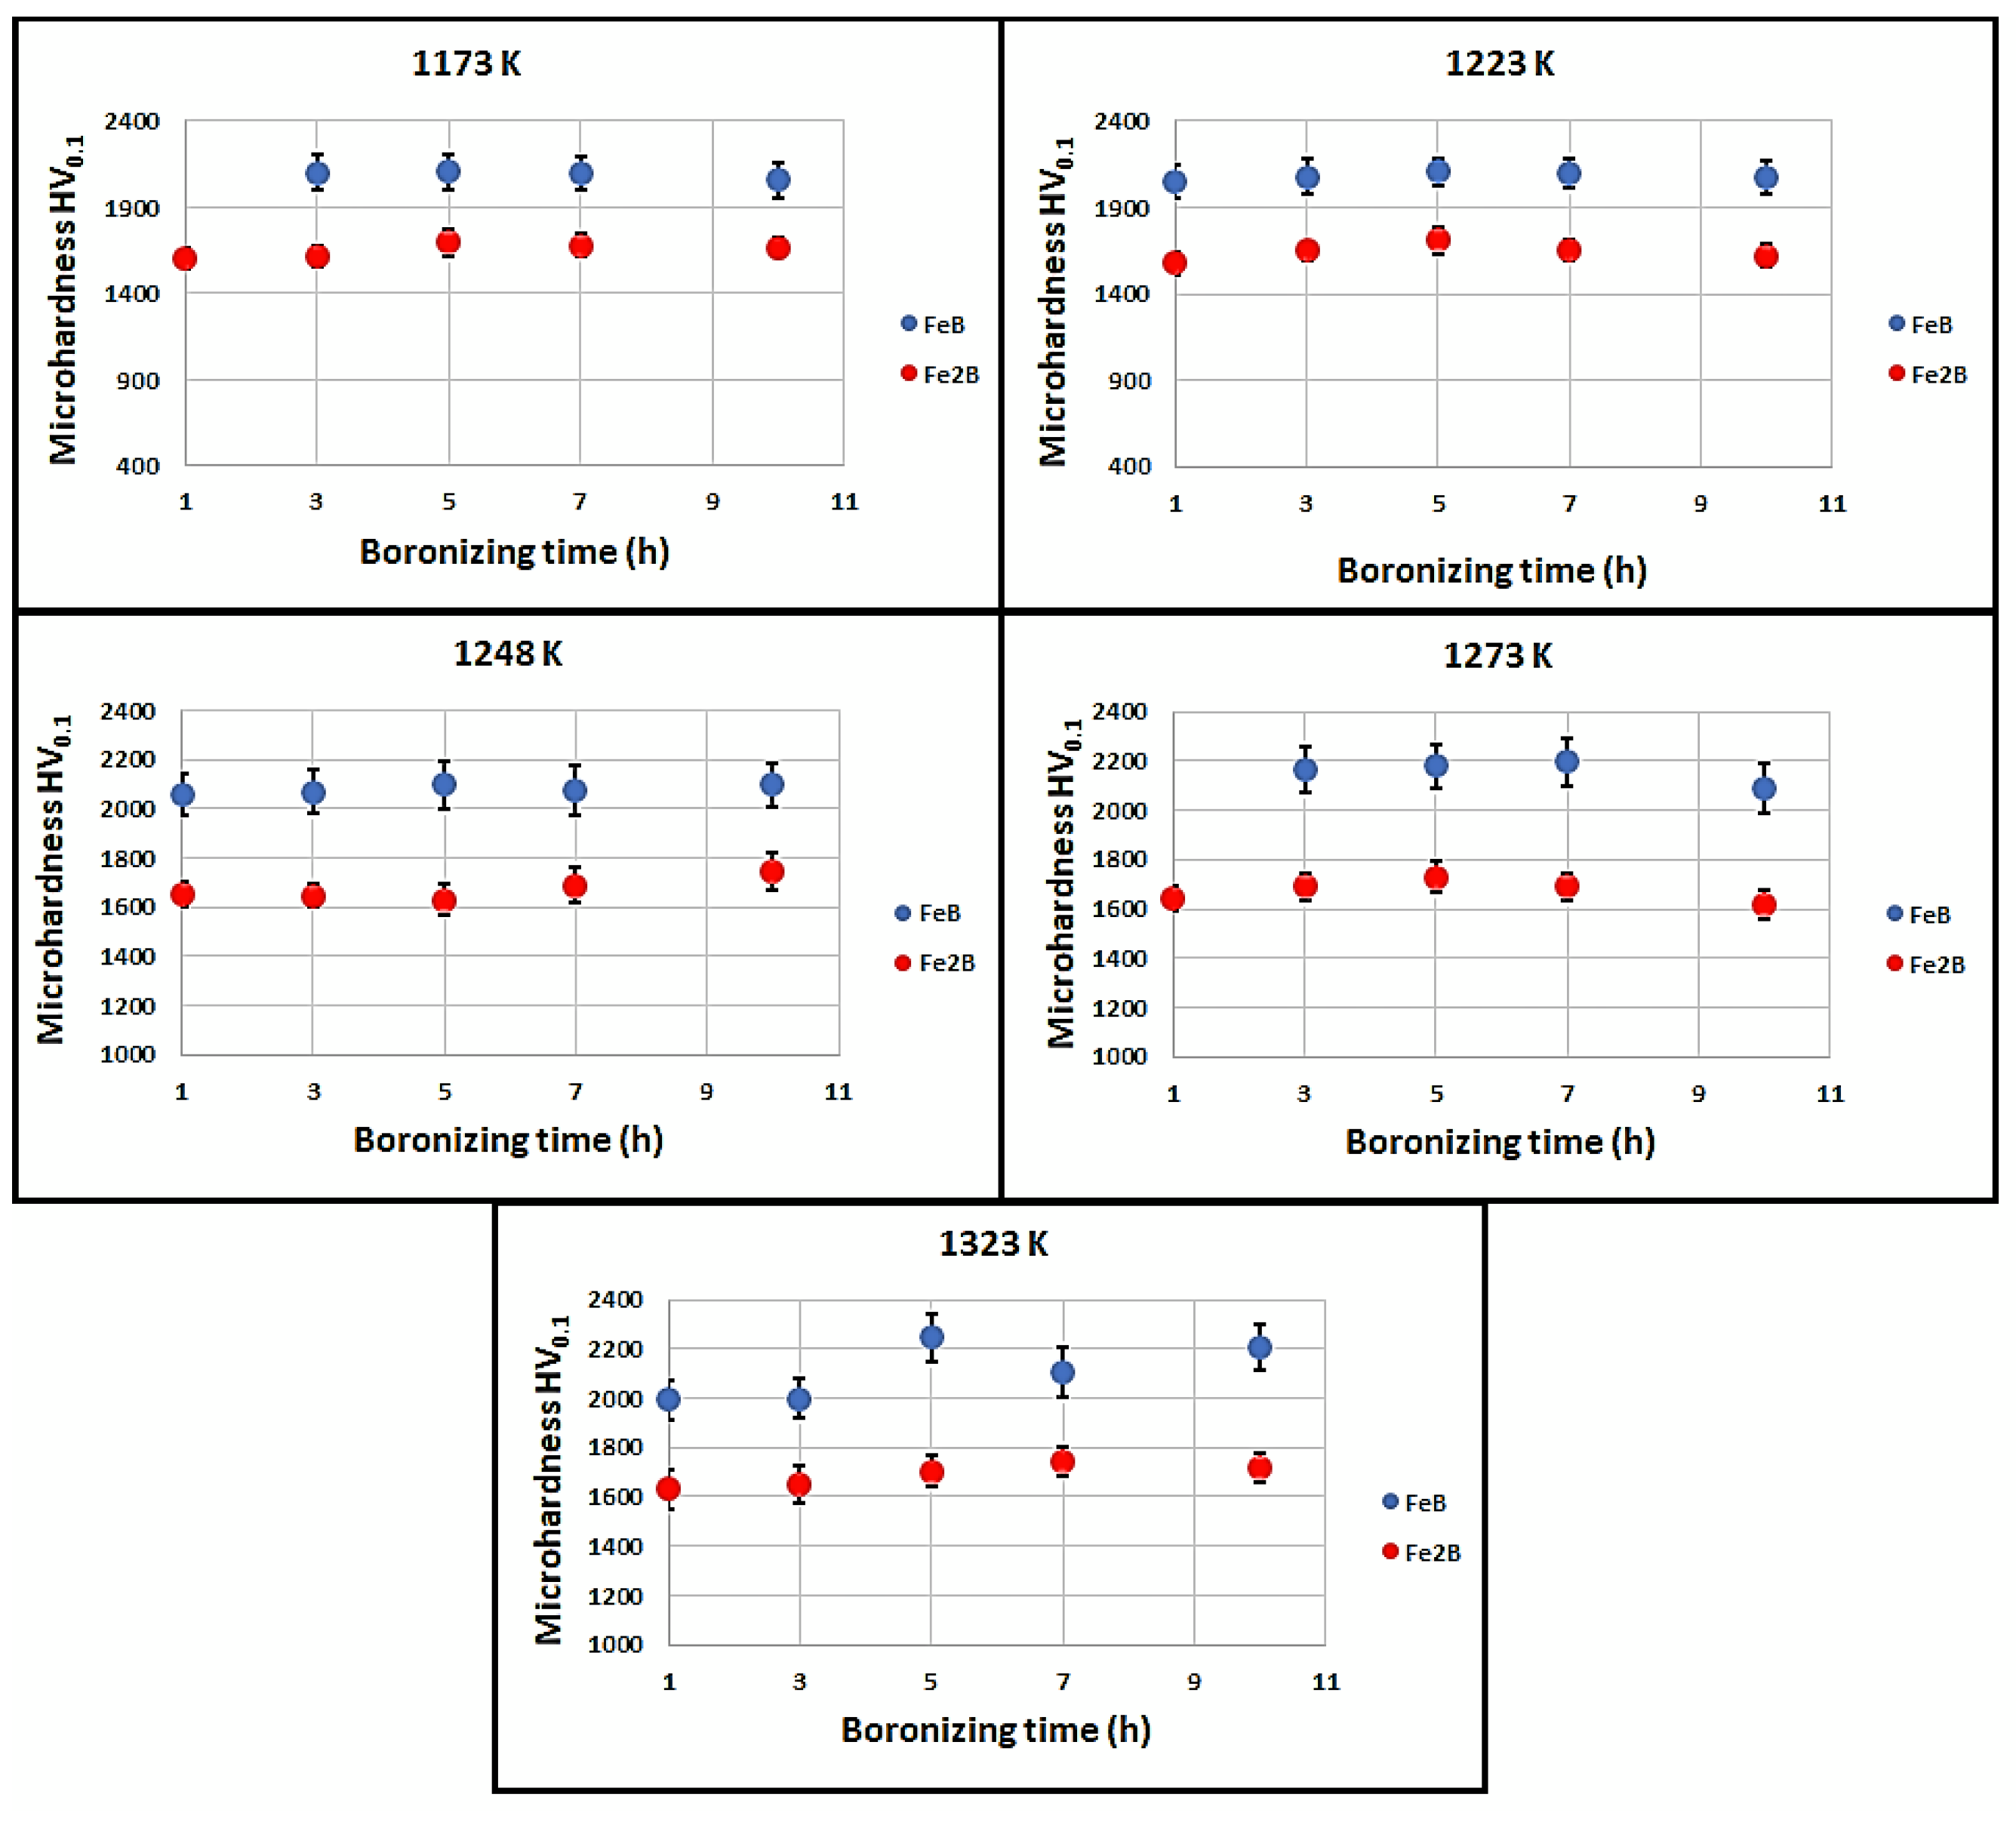
Figure 9.
Time dependencies of layers’thicknesses: (a) the FeB layer, (b) the bilayer (FeB+ Fe2B).
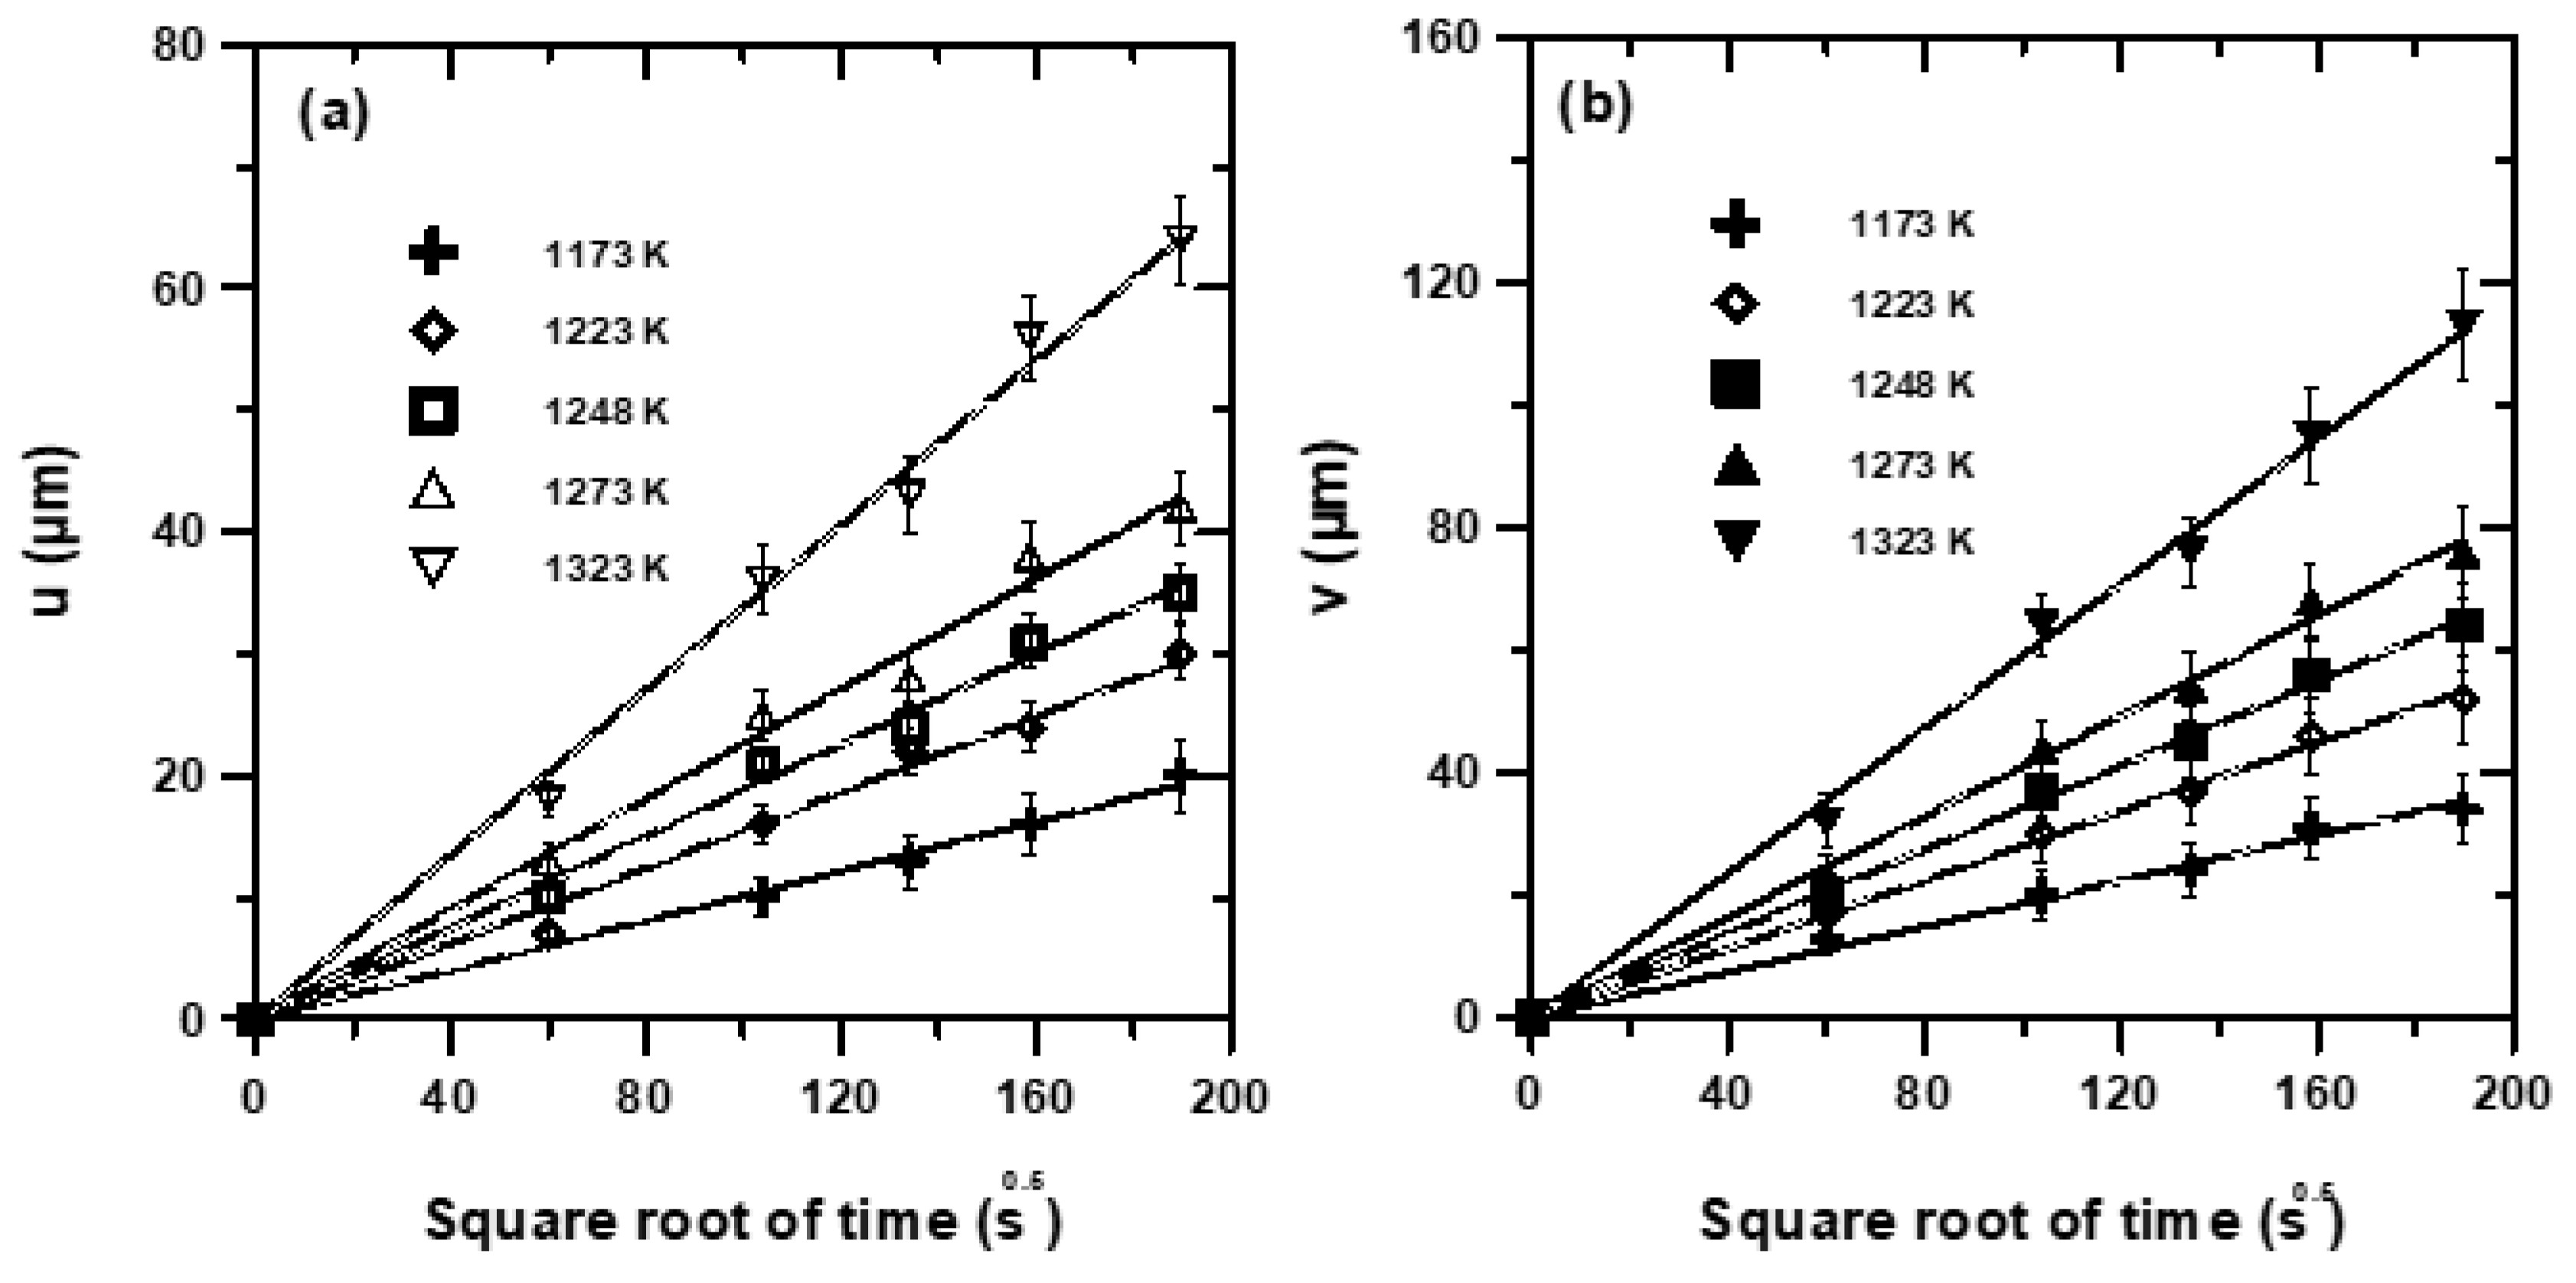

Table 1.
Experimental kinetics constants determined at the phase interfaces in the interval of 1173 to 1323 K.
Table 1.
Experimental kinetics constants determined at the phase interfaces in the interval of 1173 to 1323 K.
|
(µm s-0.5) at the first phase interface |
(µm s-0.5) at the second phase interface |
|
|---|---|---|
| 1173 | 0.1013 | 0.1864 |
| 1223 | 0.1559 | 0.2806 |
| 1248 | 0.1876 | 0.3431 |
| 1273 | 0.2258 | 0.4103 |
| 1323 | 0.3378 | 0.5906 |
Table 2.
Calculated boron diffusion coefficients in iron borides using the integral diffusion model.
Table 2.
Calculated boron diffusion coefficients in iron borides using the integral diffusion model.
| T (K) |
(×10-12 m2 s -1) Equation (13) |
(×10- 12 m2 s -1) Equation (14) |
parameter | parameter |
|---|---|---|---|---|
| 1173 | 0.50 | 0.32 | 0.0712 | 0.1628 |
| 1223 | 1.18 | 0.73 | 0.0716 | 0.1643 |
| 1248 | 1.73 | 1.10 | 0.0713 | 0.1632 |
| 1273 | 2.49 | 1.57 | 0.0714 | 0.1636 |
| 1323 | 5.48 | 3.14 | 0.0721 | 0.1666 |
Table 3.
Comparison of the estimated boron activation energies with those from the literature for borided high alloy steels.
Table 3.
Comparison of the estimated boron activation energies with those from the literature for borided high alloy steels.
| Steel | Boriding process | Operating parameters | Phases present | Activation energy (kJ mol-1) |
Calculation Method |
Refs. |
|---|---|---|---|---|---|---|
| AISI 440 C | PPB | 700-800°C For 3-7 h |
FeB,Fe2B,CrB, Cr2B |
134.62 | Parabolic growth law | [35] |
| AISI TI | CRTD-Bor | 850-1050°C For 0.25-1 h |
FeB and/or Fe2B | 179.05 | Parabolic growth law | [36] |
| AISI 316 L | PDCPB | 850-950°C For 0.5-2 h |
FeB,Fe2B,CrB, Cr2B |
162.7 ±7 (FeB) 171 ±5 (Fe2B) |
Bilayer model | [37] |
| AISI M2 | Paste | 950-1000°C for 2 and 6 h |
FeB,Fe2B | 257.5(FeB) 201 (Fe2B) |
Bilayer model | [38] |
| SS410 | Powder | 850-1000°C for 2-8 h |
No reported | 186.49 | Parabolic growth law | [39] |
| AISI D2 | Powder | 850-1000°C for 2-8 h |
Fe2B | 201.5 | Monolayer model | [40] |
| AISI 304 | Powder | 850-1050°C for 1-4 h |
FeB, Fe2B, Ni2B, Cr2Ni3B6 | 244 | Parabolic law | [41] |
| AISI H13 | Powder | 800-1000°C For 2-6 h |
FeB,Fe2B,CrB, Cr2B | 236.43(FeB) 233.04(Fe2B) |
MDC method | [42] |
| ASP®2012 | Powder | 850-950°C for 2-6 h |
FeB, Fe2B, CrB, Mo2B and W2B | 314.716 | Parabolic growth law | [43] |
| Royalloy | Powder | 900-1050°C for 1-10 h |
FeB, Fe2B | 242.79 (FeB) 223.0 (Fe2B) |
Integral method | [21] |
| X165CrV12 | Powder | 850-950°C for 3-9 h |
FeB,Fe2B,CrB, | 173.73 (FeB) 193.47 (Fe2B) |
Integral method | [22] |
| AISI M2 | Powder | 850-950°C for 2-6 h and 10 h |
FeB,Fe2B,CrB, Cr2B, B4V3 | 206.41 (FeB) 216.18 (Fe2B) |
Integral method | [34] |
| AISI M2 | Powder | 850-950°C for 2-6 h and 10 h |
FeB,Fe2B,CrB, Cr2B, B4V3 | 226.02 (FeB) 209.04 (Fe2B) |
Dybkov model | [34] |
| Bohler K190 | Powder | 900-1050°C for 1-10 h |
FeB,Fe2B | 204.54 (FeB) 196.67 (Fe2B) |
Integral method | This study |
Disclaimer/Publisher’s Note: The statements, opinions and data contained in all publications are solely those of the individual author(s) and contributor(s) and not of MDPI and/or the editor(s). MDPI and/or the editor(s) disclaim responsibility for any injury to people or property resulting from any ideas, methods, instructions or products referred to in the content. |
© 2023 by the authors. Licensee MDPI, Basel, Switzerland. This article is an open access article distributed under the terms and conditions of the Creative Commons Attribution (CC BY) license (http://creativecommons.org/licenses/by/4.0/).
Copyright: This open access article is published under a Creative Commons CC BY 4.0 license, which permit the free download, distribution, and reuse, provided that the author and preprint are cited in any reuse.


