

Submitted:
09 May 2023
Posted:
10 May 2023
You are already at the latest version
Abstract
This study aims to focus on using the Volterra series and machine learning for forecasting random and chaotic wind speed regimes, since the calm weather is mostly noticed at the local site, making the dataset selection difficult. A novel method is proposed to predict Volterra kernels up to the third order, using a forward-back propagation neural network with 12-month measurements at Fujairah site (UAE). Both daily and monthly wind speed data sets are investigated for forecasting. The three dominant hourly and daily kernels are extracted for each day and each month. Predicted future Volterra kernels are estimated from past values using both statistical analysis and individual neuro networks for each of the Volterra kernel coefficients. Due to the random nature of wind speed at the local site, a two-layer with 4 neurons per layer neuro network is used to locate the most variable and intense speed during 8-hours in the day. Forecasted wind speed is determined with errors arising from different sources such as the utilization of only 3rd-order Volterra kernels and the difficulty of machine training of the employed shallow network. Nevertheless, this work depicts a useful algorithm to forecast chaotic and random wind speed regimes. Computational time is a trade of the complexity of Volterra mathematical analysis.
Keywords:
error estimation
; Korhonen network
; machine learning
; extraction algorithm
; Volterra kernels
; wind speed prediction
1. Introduction
Wind energy is one of the main sources of the recent increase of renewable energy systems worldwide. Its potential output depends greatly on wind characteristics such as speed, which requires accurate forecasting to manage and control grid networks and standalone electrical power operation [1]. Wind speed prediction is normally analyzed by physical models or statistical models. Physics-dependent models are based on metrological physical laws, such as wind speed and direction [2], whereas statistical analysis relies on data algorithms such as moving average, autoregressive, machine learning, support vector machine [3,4], and hybrid methods combining different machine learning algorithms [4,5]. Statistical modeling is useful for short-time forecasting which ranges from hours to even seconds, whereas physics-driven models are more suitable for long-time prediction of wind speed.
The chaotic and random nature of wind speed is one of the shortcomings effects of wind forecasting due to the indeterminate nature of the wind speed. This problem is exploited even more with a low-scale wind speed regime. Prediction using the nonlinear learning ensemble method [5] is attempted to investigate deep learning time series, whereas a frequency domain analysis based on frequency decomposition [6] is conducted. Recently, a probabilistic wind speed prediction model was attempted using real-time decomposition [3]. However, dealing with chaotic and random forecasting [7] requires other approaches, such as fractal analysis [8,9], which calculates the persistence of past features of monotonous nature. It has been introduced to characterize and quantify the complexity of geometries with a fractal factor ranging from 1 to 2. Another approach is wavelet transformation analysis which converts a series of data from the time domain to several frequency filtrations. Earlier, the largest Lyapunov exponent method [10] was used for continuous and discrete nonlinear systems to measure variations in the Lyapunov exponent trajectories. A similar method in this context is the Kolmogorov entropy method [11].
The chaotic and random characteristics of wind speed can better be described using the Volterra series due to the nonlinearities relating to inputs and outputs. The calculation of Volterra series and kernels suffers from poor accuracy and large complexity, hence conventional and time-delay series neural networks [12,13,14] are used both in time and frequency domains to overcome this shortcoming, by truncating and recurrent estimation approaches [15,16]. Yet, the selection of NN layers, activation functions, and input and hidden layers nodes, impose difficulties for the optimal analysis of estimating the Volterra kernels, which describe the input-output of the nonlinear system. With a smaller number of neurons, lower accuracy is achieved, whereas, with a larger neuron number, overfitting occurs. In the case of a time-delay artificial neural network (TDANN), the length of the memory affects accuracy too, because with shallow memory length, the lower correlation between neurons has resulted, and with deep memory length, overfitting is obtained [17]. Wavelet decomposition was used to analyze and predict wind speed of chaotic nature [18]. The work of [19] is used to simplify NN training by truncating the Volterra kernels. Normally, up to the first third-order time-domain kernels are needed for reasonable accuracy, but the tradeoff is the size of the input range of values.
In this work, a novel method is proposed and implemented to forecast random, chaotic wind speed using different hourly and daily data sets, for training ANN to evaluate the first third-order Volterra kernels over a period of several months. The adoption of data sets depends on the randomness and variability of the measured data. Then, the behavior of the kernels is predicted by finding their trend values from their previous evaluations. Due to the complexities of estimating many kernels, only the first-order and second-order kernel coefficients are calculated. Hence, with two layers, a 4-input neutron, and 4-hidden neutrons, the network is implemented. The method has been compared with two other methods of evaluating the forecasts [20] using the same data sets.
2. Methodology
2.1. Wind Speed Dataset
Wind speed has been measured over a period of 12 months by a logger located 10 m above ground at Fujairah site in the UAE, with site data as shown in Table 1. The dataset is logged as one-minute average values. The wind regime is normally chaotic and random with large indeterminate periods. Figure 1 depicts the nature of the wind regime at the site [21]. It can be deduced that wind speed is generally calm with the maximum values scarcely reaching 10 mph. This can further impose difficulties in predicting future wind speeds. Selections that make a careful selection of the dataset are crucial to eliminating random errors.
The characteristics of Fujairah site is listed in Table 1. The wind regime at site is largely random in nature with large variations from season to season. It must be mentioned here that during the 2020-2021 measurements, the wind speed was mainly calm with an average speed of 5 mph. The logger setup is basic, which is meant for academic research purposes. The metrological data including wind speed, are recorded in two ways, wirelessly and wired to a LabVIEW© programmed platform.
Due to the nature of large wind randomness, it is important to select periods of random wind speed persistence. Consequently, it is intended to use the dataset for both hourly and daily prediction with different selections, for short-time and long-time forecasting cases. For the hourly forecasting, only 100 appropriate days are selected for the analysis of this study due to being exposed to noticeable seasonal variations. The exposed days are divided equally into ten periods of 10 days each. The wind speed is selected 4 times a day, covering an average of 6 hours each in which normal potential variations can exist, making it suitable for the goal of this study. For the daily forecasting, wind regime exploitation of the entire 12 months period is used with daily average values for each month.
Another difficulty of accurate forecasting is the size and amount of calculating each Volterra kernel for the selected period. For instance, an N perception neuron network requires calculations for up to the m-order kernels, and for each period that is considered for this study. The prediction of these kernels requires neural networks for each kernel to be determined. In this work, 2-layers NN with only 4 neutrons is chosen, which makes network training inaccurate and difficult.
2.2. NN Model
It is known that dynamic neural networks, which may have topologies of recurrent and time-delayed patterns, can identify, and solve nonlinear dynamic systems. In the first stage of the analysis, a conventional artificial neuro network (ANN) is implemented for the extractions of the Volterra kernels, with one hidden layer to accommodate a smaller number of Volterra kernels. The inputs are the time-delayed data measured with an M-depth of history according to the dataset selected and explained in the previous section. The number of neurons used in the input layer constitutes the memory depth of the data used. It’s also appropriate to use an equal number of neurons in the hidden layer as well for the convenience of Volterra kernel calculations. A general M-memory depth CNN is depicted in Figure 2, with p neurons in the hidden layer, and one neuron output. In this study, only 4 specific periods of interest are chosen as inputs that reflect the persistence of the wind speed randomness, incorporated with 4 neurons in a single hidden layer.
The next stage of analysis is to estimate the evolution of the Volterra kernels throughout the different selected periods of the dataset. This has been attempted using either statistical analysis or machine learning. In the latter, a similar topographic pattern of Korhonen’s self-organizing feature map (SOFM) network is proposed for the 4 × 4 and 1 × 4 neurons.
The Volterra kernels are functions of layer-to-layer weights and neuron biases [17]. Hence, it’s needed first to train the neural network with the datasets explained above to evaluate all weights and biases. Then Volterra kernels up to the third order are calculated for each period studied. Afterward, the evolution of the main Volterra kernels values is predicted and used to forecast future wind speeds.
2.3. Procedural Algorithm
Figure 3 depicts the procedural algorithm adopted in this study, which relies on the Volterra kernel evolution from one period to the next. In each period, up to the third-order kernels are evaluated using static artificial neural networks with time-delayed wind speeds that have been recorded in the datasets. In the process of the kernel evaluation, the weight coefficients of the input-hidden layer, optimal weights of the output layer, as well as biases of both the hidden layer and output layer, are extracted from the trained networks. Then, the mathematical Volterra analysis is applied according to the formulation displayed in the next section.
2.4. Volterra Kernel Extraction
With Volterra modeling, a single output is determined from a series of inputs using mathematical formulation without necessarily the need of knowing the real structure of the nonlinear system, i.e.,
That’s, given a set of m-memorized inputs the output can be evaluated in discrete form as follows,
This can be simplified using Volterra kernels as,
where , is the p-order Volterra kernels which constitutes weighting coefficients on past values of m-memorized inputs. In this context, only kernels of p value up to 2 are determined. The first up to the second-order kernels are defined as
In this work, the Volterra kernels are first evaluated using the weight coefficients of the implemented neural network from (4, 5, 6) for the period in concern, hence the forecasted wind speed is evaluated from (3). It’s accepted to truncate these kernels up to the 3-rd order, to reduce computational efforts of this work without raising extra errors.
2.5. Kernels Estimation
2.5.1. Prediction methods
Predicted Volterra kernels are estimated using previous kernels extractions in the last 10 months period. In this work, only a single value of h0, a vector of 4 values for h1, and a two-dimensional area of 4 × 4 values of h2 are used for their prediction using statistical analysis as well as machine learning.
2.5.2. ML
Once Volterra kernels are extracted from previous periods, different sizes of neural networks are further used to predict evaluated values of the h0, h1 and h2 kernels for future estimation. Figure 4, Figure 5 and Figure 6 display the neuro networks which are implemented to extract h0, {1 × 4} h1 and {4 × 4} h2 respectively.
It is noted that Korhonen neural network is important for the evaluation of the zero and first order Volterra kernels. Due to large computations, the Korhonen neural arrangement has not been applied for evaluating the second order kernels. This truncation of Volterra kernels can cause enormous errors whereas the use of smaller number of neurons per NN-layer will reduce the accuracy of this analysis.
3.1. Volterra Kernels Evaluation
3.1.1. Long-term Prediction
Table 2 lists the zero- and first-order evaluated kernels in the 12 months period. The forecasting of wind speed is performed based on only these two kernels as an accepted approximation to reduce exhausted computations, but this would impose further errors on the proposed forecast.
It is deduced from above table that based on previous months’ data, the forecasted wind speed can be expressed truncated as shown in (3) to be , where S1, S2, S3 are the measured wind speed on 3 previous days. It is intended here to check the amount of daily wind speed randomness, which is expected to be large, and consequently the estimation is based merely on statistical analysis.
3.1.2. Short-term Prediction
As a first attempt, a period span of 100 days is considered for the short-term kernels prediction, The dataset is divided into two periods of 50-day each to monitor the variety and extend of speed randomness. Four selected daily measurements which reflect potential wind speed randomness, are chosen in the analysis. The resultant zero- and first-order Volterra kernels are:
Using only these values of kernel coefficients, Figure 7 shows both the measured and forecasted wind speed for the 100-day period, divided into two 50-day periods,
The proposed algorithm of extracting the kernels and estimating their evaluated values, has been applied on this period. In Table 3 the two-order Volterra kernels are listed for 10 consequence periods of 10 days each, based on the occurrence of potential persistence of wind speed randomness. The Volterra kernels up to the second-order coefficients are calculated for specific hours of the days, normally during 1 AM-8 AM, in each day of logged data. These specific hours constitute the largely persistence of wind speed randomness. Other time occurrences can also be considered.
hence, the forecasted wind speed is determined by,
when neural networks are implemented, and as,
when statistical analysis is applied, where S1, S2, S3, S4 are the measured wind speed on 4 previous days.
3.2. Wind Speed Forecasting
Wind speed forecasting is performed in two different phases in the first, wind speed is calculated with the extracted Volterra kernels up to the third order and compared with the measured values. Figure 8 displays the two patterns of measured and calculated wind speed for each of the 10 periods of 10 days each. It can be noticed that although the two concurrent patterns are similar, the errors are enormous. This is due to three main reasons:
- The overall analysis is based on the evaluation of up to the third order Volterra kernels.
- Only 2-layers neural networks of 4 neutrons per layer are incorporated which implies that machine training was not perfect.
- The forecasted wind speed in each period has been compared with the measured one in a handicapped manner since evaluated Volterra kernels are for the entire period, but not for each day as has been performed.
- The historical depth of memory recurrence of selected inputs was limited to 4 only. The reason for this is to compensate for the large number of needed computations.
3.3. Method Validation
The selection of proper dataset is crucial for validating the proposed algorithm in this study. It was intended to compare measured wind speed with the forecasted value based on statistical trends. It was unable to validate the implemented method, since there were large discrepancies between the measured and forecasted values, as depicted in Table 4. For the first dataset, Volterra kernels were calculated in a 12-month period, and the resultant is extracted from the evolution of previous 12 months. Three main readings per day of the 12th month, which reflect potential variations in wind speed, were used in this analysis.
In Table 5, the dataset period of 100 days divided into 10 groups, that reflects major variation in the wind speed is selected, in which 4 major readings per day are used for evaluating the resultant Volterra kernels. With this arrangement, a better estimation of the wind speed forecast is obtained. Two ways of forecasting the wind speed are applied, one from statistical trends, and the other from machine learning, in which a neural network is used for each kernel coefficient. In this context, only zero-order and first-order kernels of 4 coefficients are considered.
4. Conclusions
A novel method is used to evaluate the Volterra coefficients up to the third-order kernels, for forecasting wind speeds of chaotic nature with variable and inconsistent randomness. The Volterra kernels are extracted for a sequence of periods to estimate predicted evolution and hence forecasted wind speed. Computational efforts are traded for the complexity of Volterra mathematical analysis. Errors arise due to the following:
- The overall analysis is based on the evaluation of up to the third order Volterra kernels.
- Only 2-layers neural networks of 4 neutrons per layer are incorporated which implies that machine training was not perfect.
- The forecasted wind speed in each period has been compared with the measured one in a handicapped manner since evaluated Volterra kernels are for the entire period, but not for each day as has been performed.
- The historical depth of memory recurrence of selected inputs was limited to 4 only. The reason for this is to compensate for the large number of needed computations.
Nevertheless, as the aim of this work is to address forecasting nonlinearities with Volterra kernels, this is an incentive attempt for other collaborators to opt for more accurate results, by eliminating the above-mentioned errors.
Acknowledgments
This is to thank Eng. Momen Odeh (m.odeh@ustf.ac.ae) for setting up the logger and LabVIEW programming. I would also like to thank Geith Majid (U1910988@live.warwick.ac.uk) for text proofing.
References
- Drisya, G.; Asokan, K.; Kumar, K.S. Diverse dynamical characteristics across the frequency spectrum of wind speed fluctuations. Renew. Energy 2018, 119, 540–550. [Google Scholar]
- Ouyang, T.; Cha, X.; Qin, L. Medium-or long-term wind power prediction with combined models of meteorological multivariable. Power Syst. Technol. 2016, 40, 847–852. [Google Scholar]
- Sun, H.; Qiu, C.; Lu, L.; Gao, X.; Chen, J.; Yang, H. Wind turbine power modeling and optimization using artificial neural network with wind field experimental data. Appl. Energy 2020, 280, 115880. [Google Scholar] [CrossRef]
- Yan, C.; Pan, Y.; Archer, C.L. A general method to estimate wind farm power using artificial neural networks. Wind Energy 2019, 22, 1421–1432. [Google Scholar] [CrossRef]
- Zhang, W.Y.; Qu, Z.X.; Zhang, K.Q.; Mao, W.Q.; Ma, Y.N.; Fan, X. A combined model based on CEEMDAN and modified flower pollination algorithm for wind speed forecasting. Energy Convers. Manag. 2017, 136, 439–451. [Google Scholar] [CrossRef]
- Song, J.J.; Wang, J.Z.; Lu, H.Y. A novel combined model based on advanced optimization algorithm for short-term wind speed forecasting. Appl. Energy 2018, 215, 643–658. [Google Scholar] [CrossRef]
- Jiang, Y.; Huang, G.; Yang, Q.; Yan, Z.; Zhang, C. A novel probabilistic wind speed prediction approach using real time refined variational model decomposition and conditional kernel density estimation. Energy Convers. Manag. 2019, 185, 758–773. [Google Scholar] [CrossRef]
- Chen, J.; Zeng, G.-Q.; Zhou, W.; Du, W.; Lu, K.-D. Wind speed forecasting using nonlinear-learning ensemble of deep learning time series prediction and extremal optimization. Energy Convers. Manag. 2018, 165, 681–695. [Google Scholar] [CrossRef]
- Tutueva, A.V.; Karimov, T.I. Detection of Hidden Oscillations in system without equilibrium. Int. J. Bifurc. Chaos 2021, 31, 20150043. [Google Scholar] [CrossRef]
- Harrouni, S. Long term persistence in daily wind speed series using fractal dimension. Int. J. Multiphys 2016, 7, 87–94. [Google Scholar] [CrossRef]
- An, X.; Jiang, D.; Liu, C.; Zhao, M. Wind farm power prediction based on wavelet decomposition and chaotic time series. Expert Syst. Appl. 2011, 38, 11280–1128. [Google Scholar] [CrossRef]
- Kantz, H.; Schreiber, T. Nonlinear Time Series Analysis; Cambridge University Press: Cambridge, UK, 2004; Volume 7. [Google Scholar]
- Grassberger, P. Estimation of the Kolmogorov entropy from a chaotic signal. Phys. Rev. A 1983, 28, 2591–2593. [Google Scholar] [CrossRef]
- Wray, J.; and Green, G.G.R. . Calculation of the Volterra kernels of non-linear dynamic systems using an artificial neural network. Biological Cybernetics 1994, 71, 187–195. [Google Scholar] [CrossRef]
- Stegmayer, G.; Pirola, M.; Orengo, G.; and Chiotti, O. Towards a Volterra series representation from a Neural Network model. WSEAS Transactions on Systems 2004, 3, 432–437. [Google Scholar]
- Zhang, B.; and Billings, S.A. Volterra series truncation and kernel estimation of nonlinear systems in the frequency domain. Mechanical Systems and Signal Processing 2017, 84, 39–57. [Google Scholar] [CrossRef]
- Zhong, K.; Chen, L. An Intelligent calculation method of Volterra time-domain kernel based on time-delay artificial neural network. Hindawi, Mathematical Problems in Engineering 2020, 2020, 8546963. [Google Scholar] [CrossRef]
- Lin, L.; Xia, D.; Dai, L.; Zheng, Q.; and Qin, Z. Chaotic analysis and prediction of wind speed based on wavelet decomposition. Processes 2021, 9, 1793. [Google Scholar] [CrossRef]
- Giannini, F; et.al. Neural networks and Volterra series for time-domain power amplifier behavioral models. Inter Science, Wiley Periodicals, Inc., www.interscience.wiley.com, 2007.
- Abdul Majid, A. Accurate and efficient forecasted wind energy using selected temporal metrological variables and wind direction. Energy Conversion and Management 2022, 16, 100286. [Google Scholar] [CrossRef]
- Abdul Majid, A. Forecasting Monthly Wind Energy Using an Alternative Machine Training Method with Curve Fitting and Temporal Error Extraction Algorithm. Energies. [CrossRef]
Figure 1.
Wind speed histogram and cumulative histogram. Most of the variations occur in 1–5 mph range [21].
Figure 1.
Wind speed histogram and cumulative histogram. Most of the variations occur in 1–5 mph range [21].
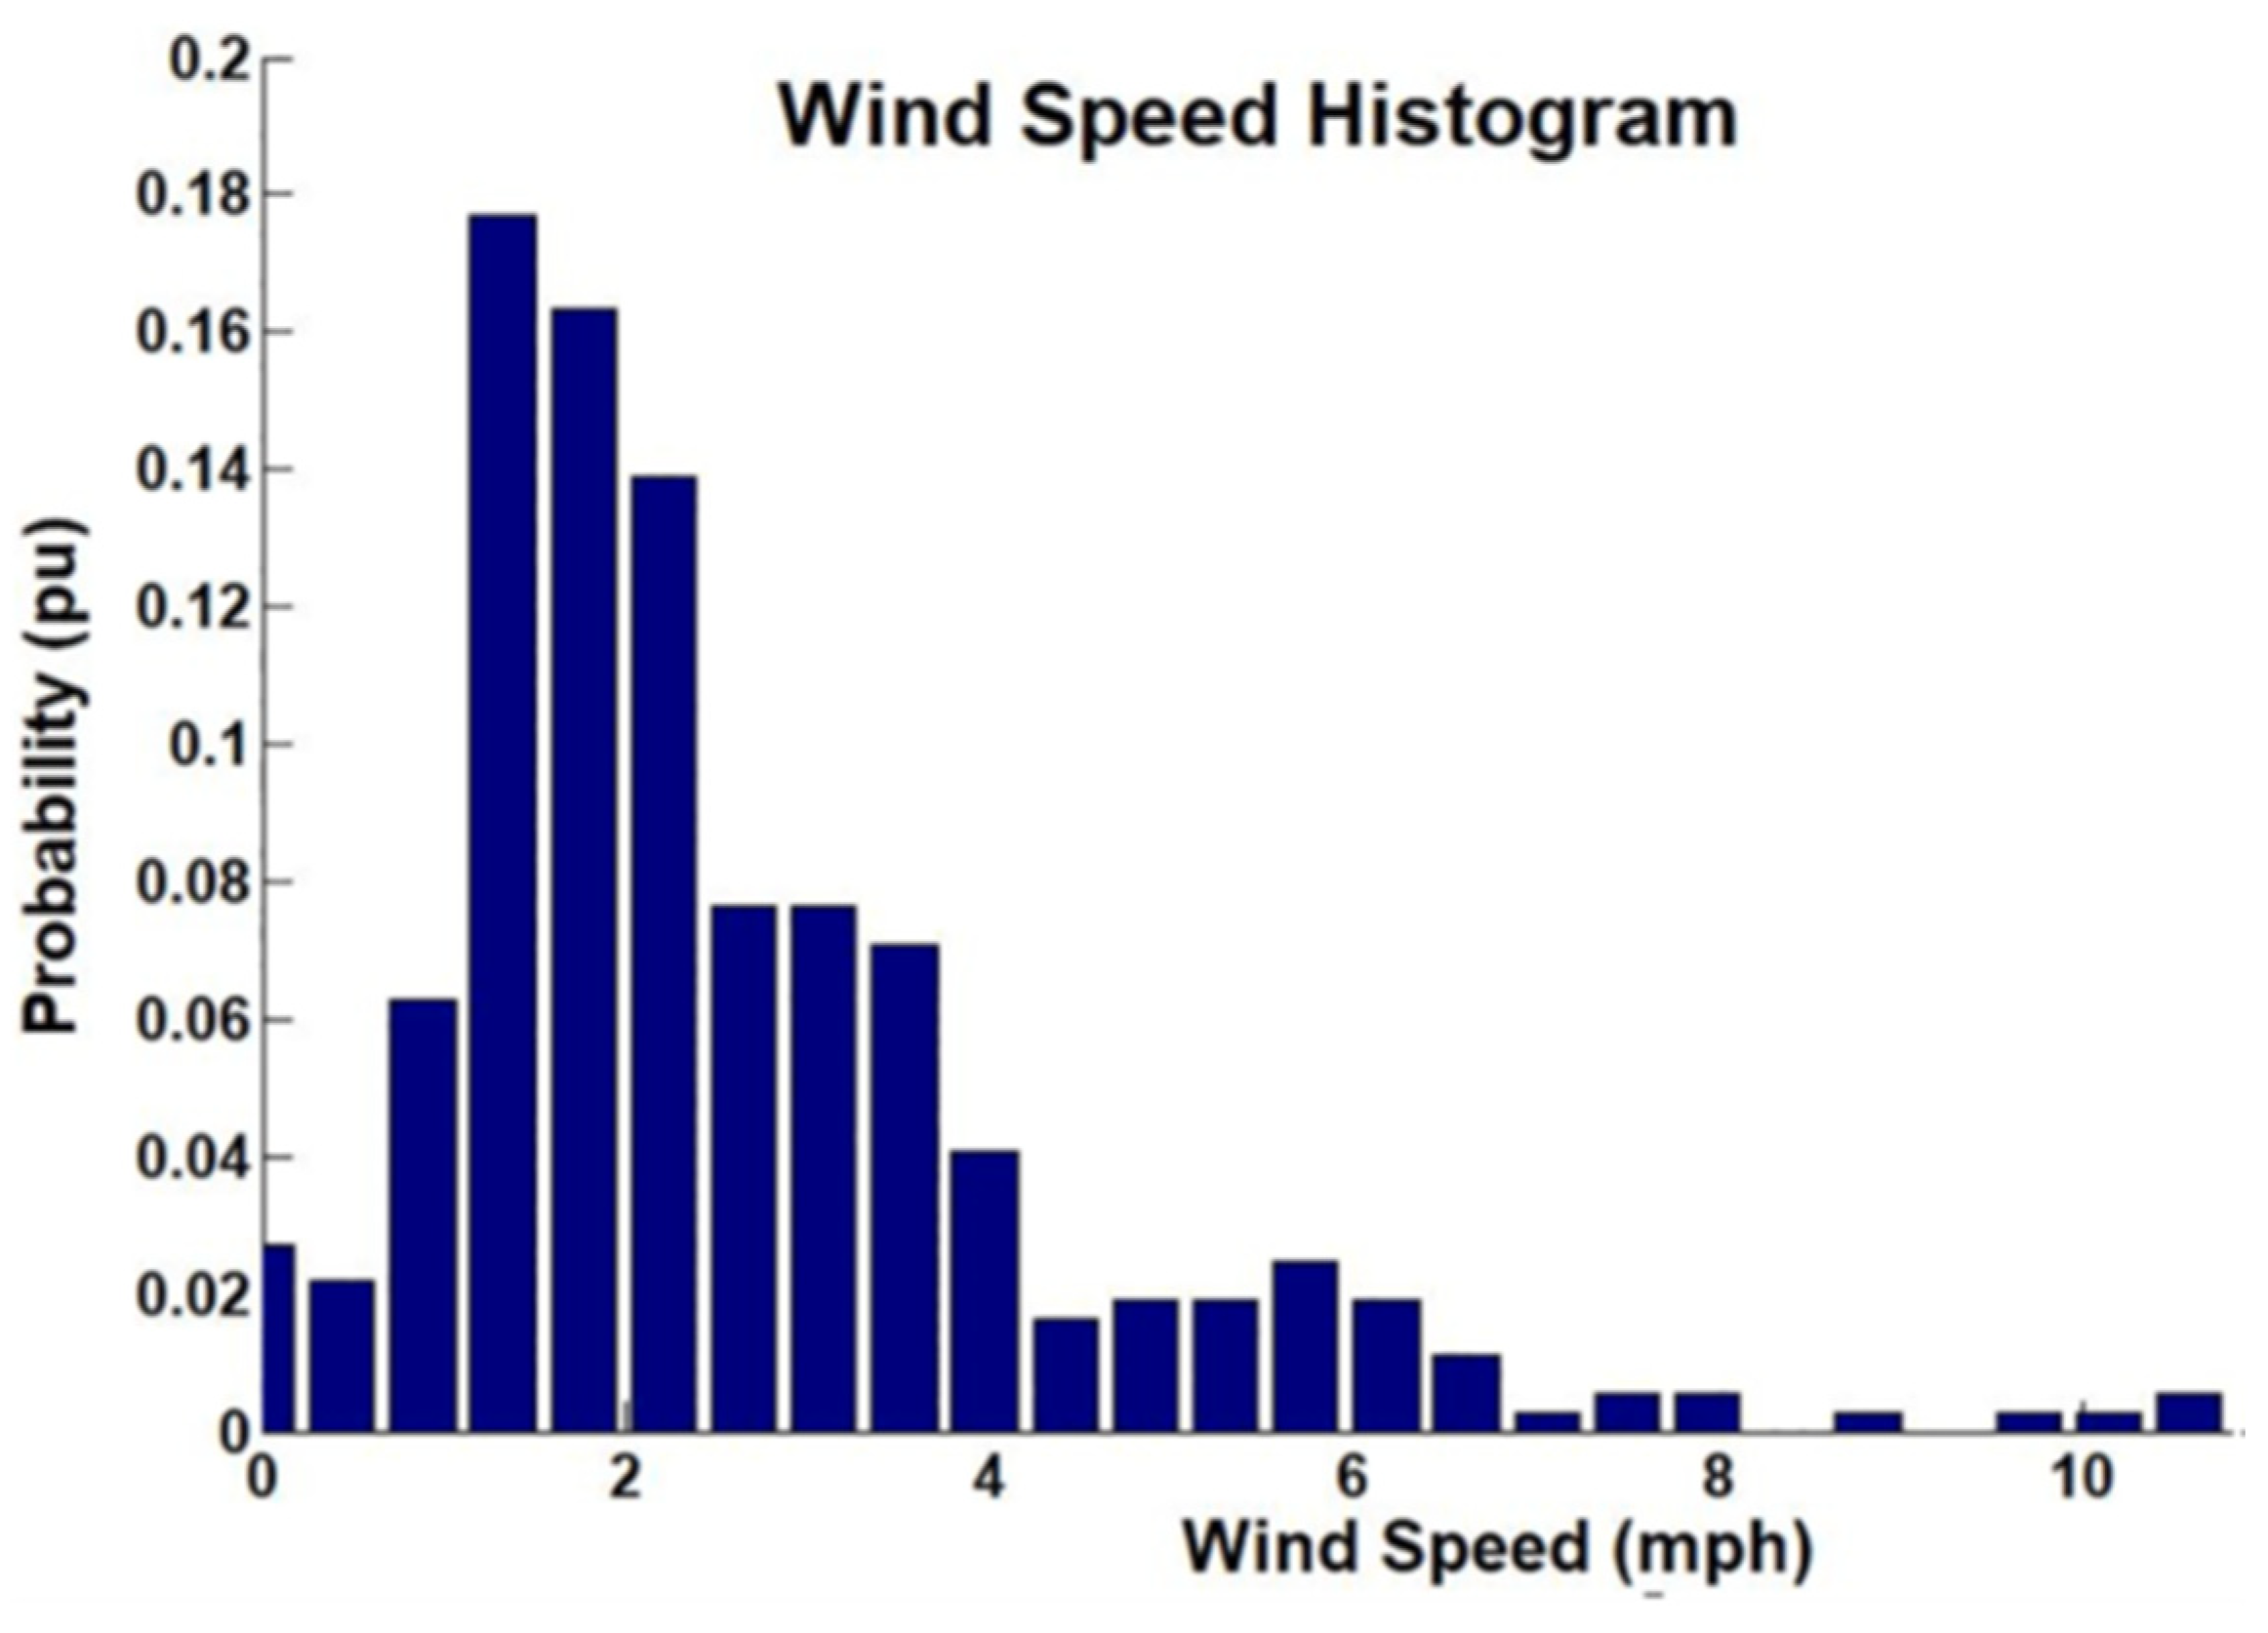
Figure 2.
Neuro network model with M-depth of memory.
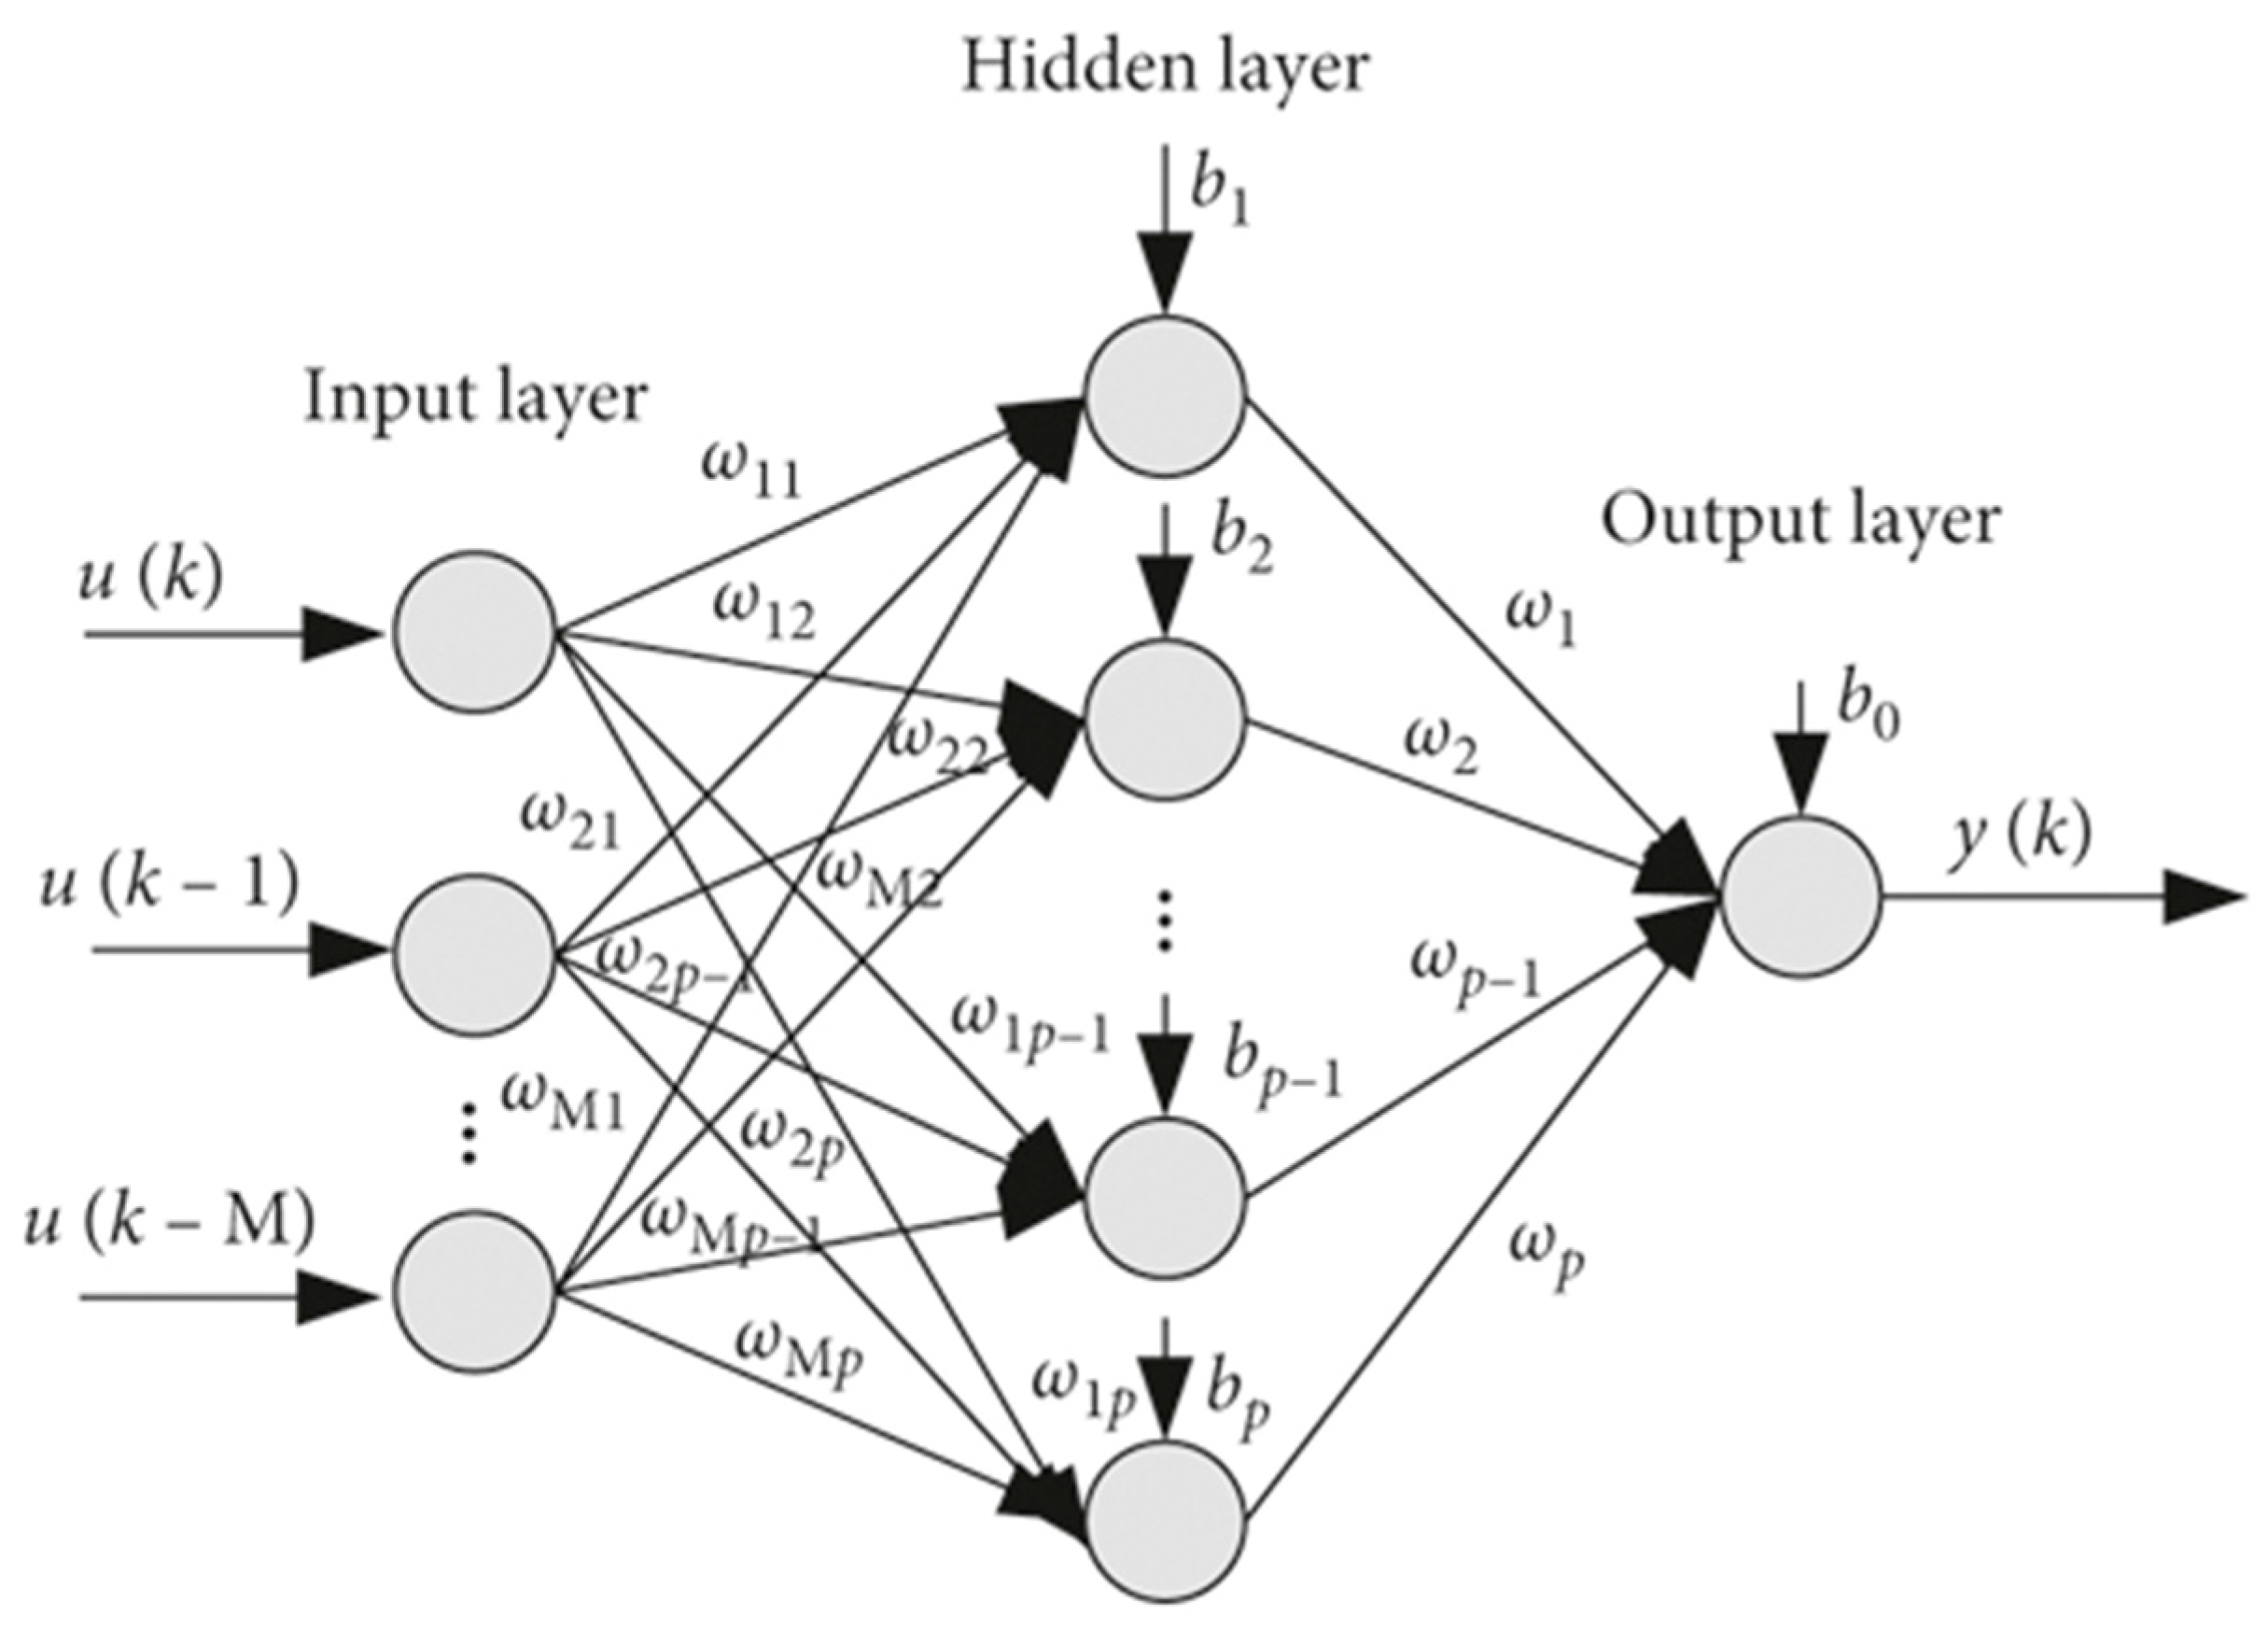
Figure 3.
Algorithm procedures of the implemented model.
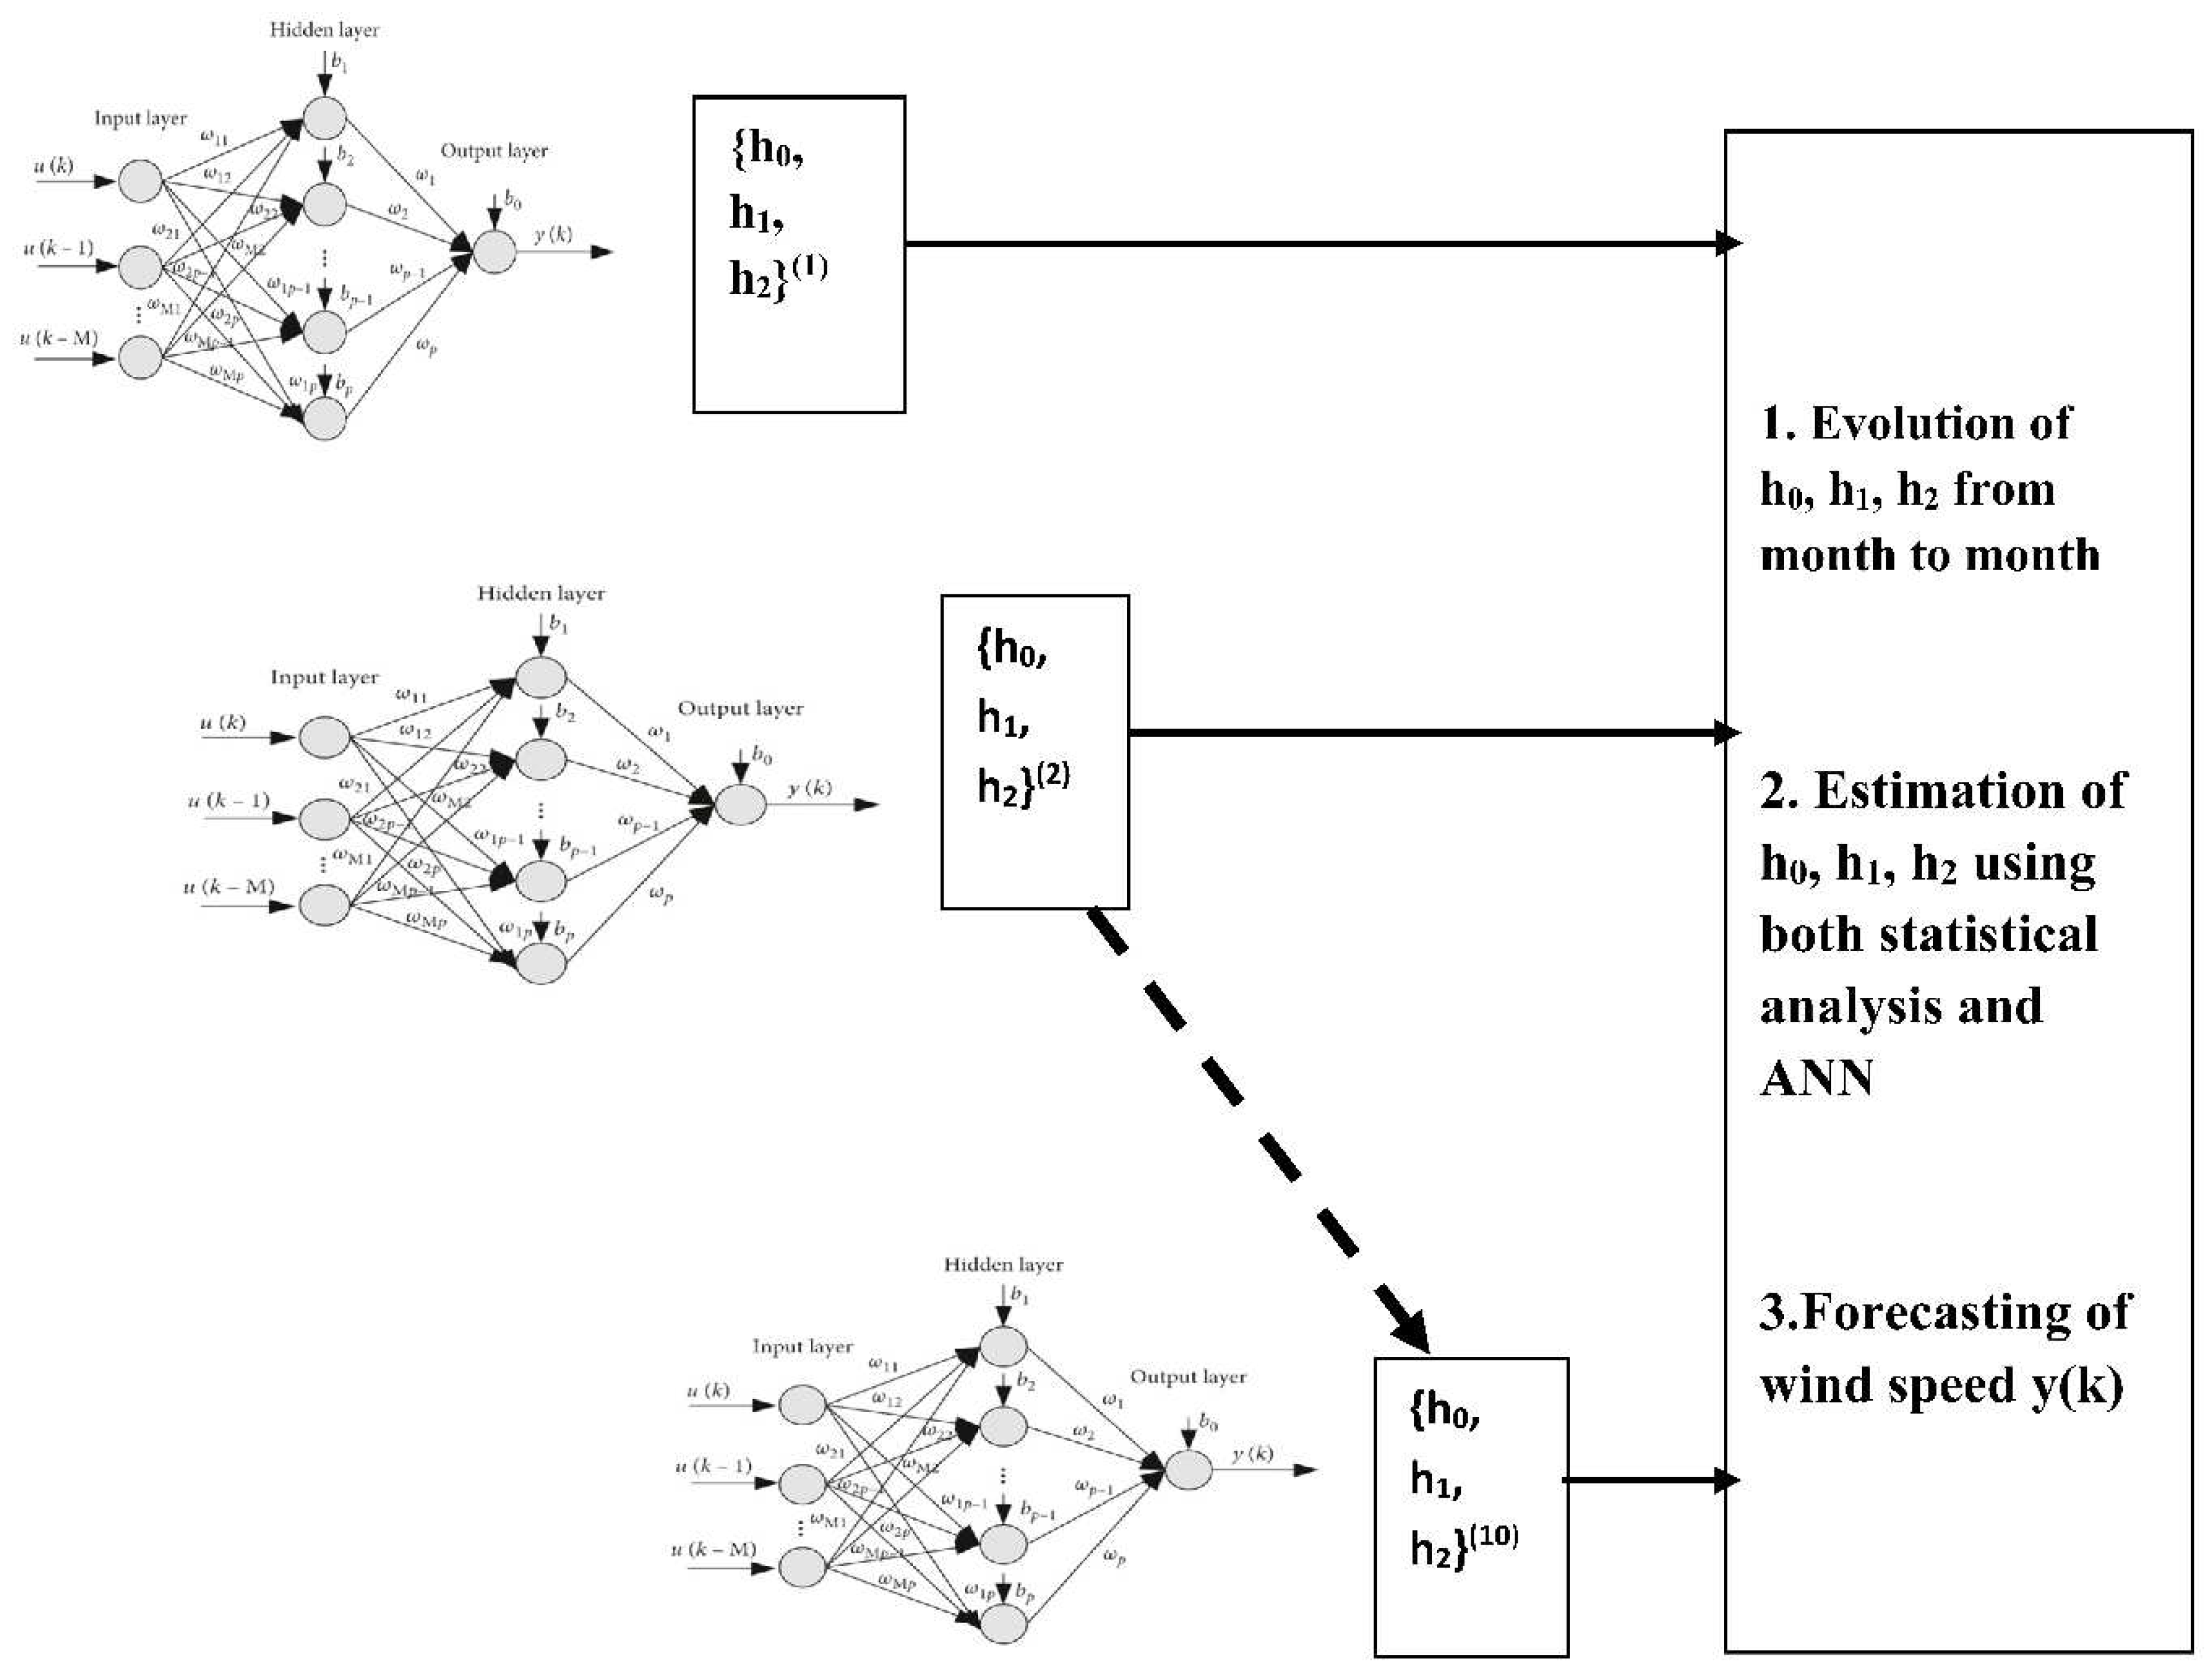
Figure 4.
NN for the evaluation of h0.
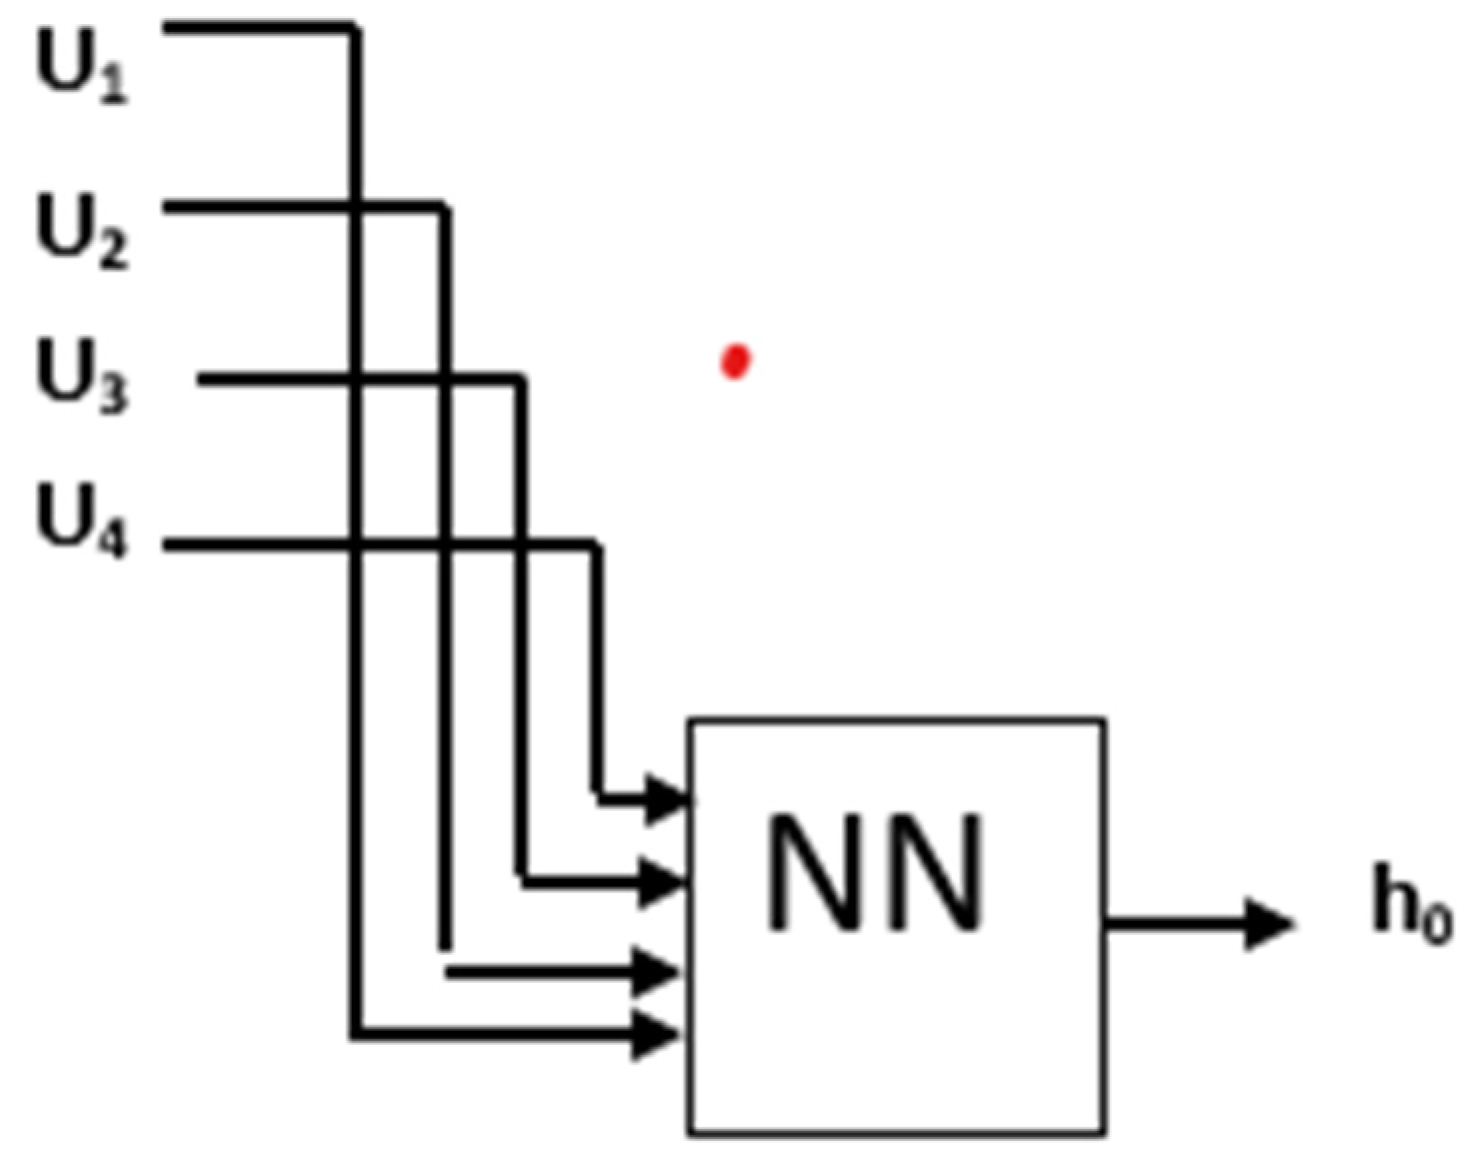
Figure 5.
NN for the evaluation of h1 {1,2,3,4} coefficients.
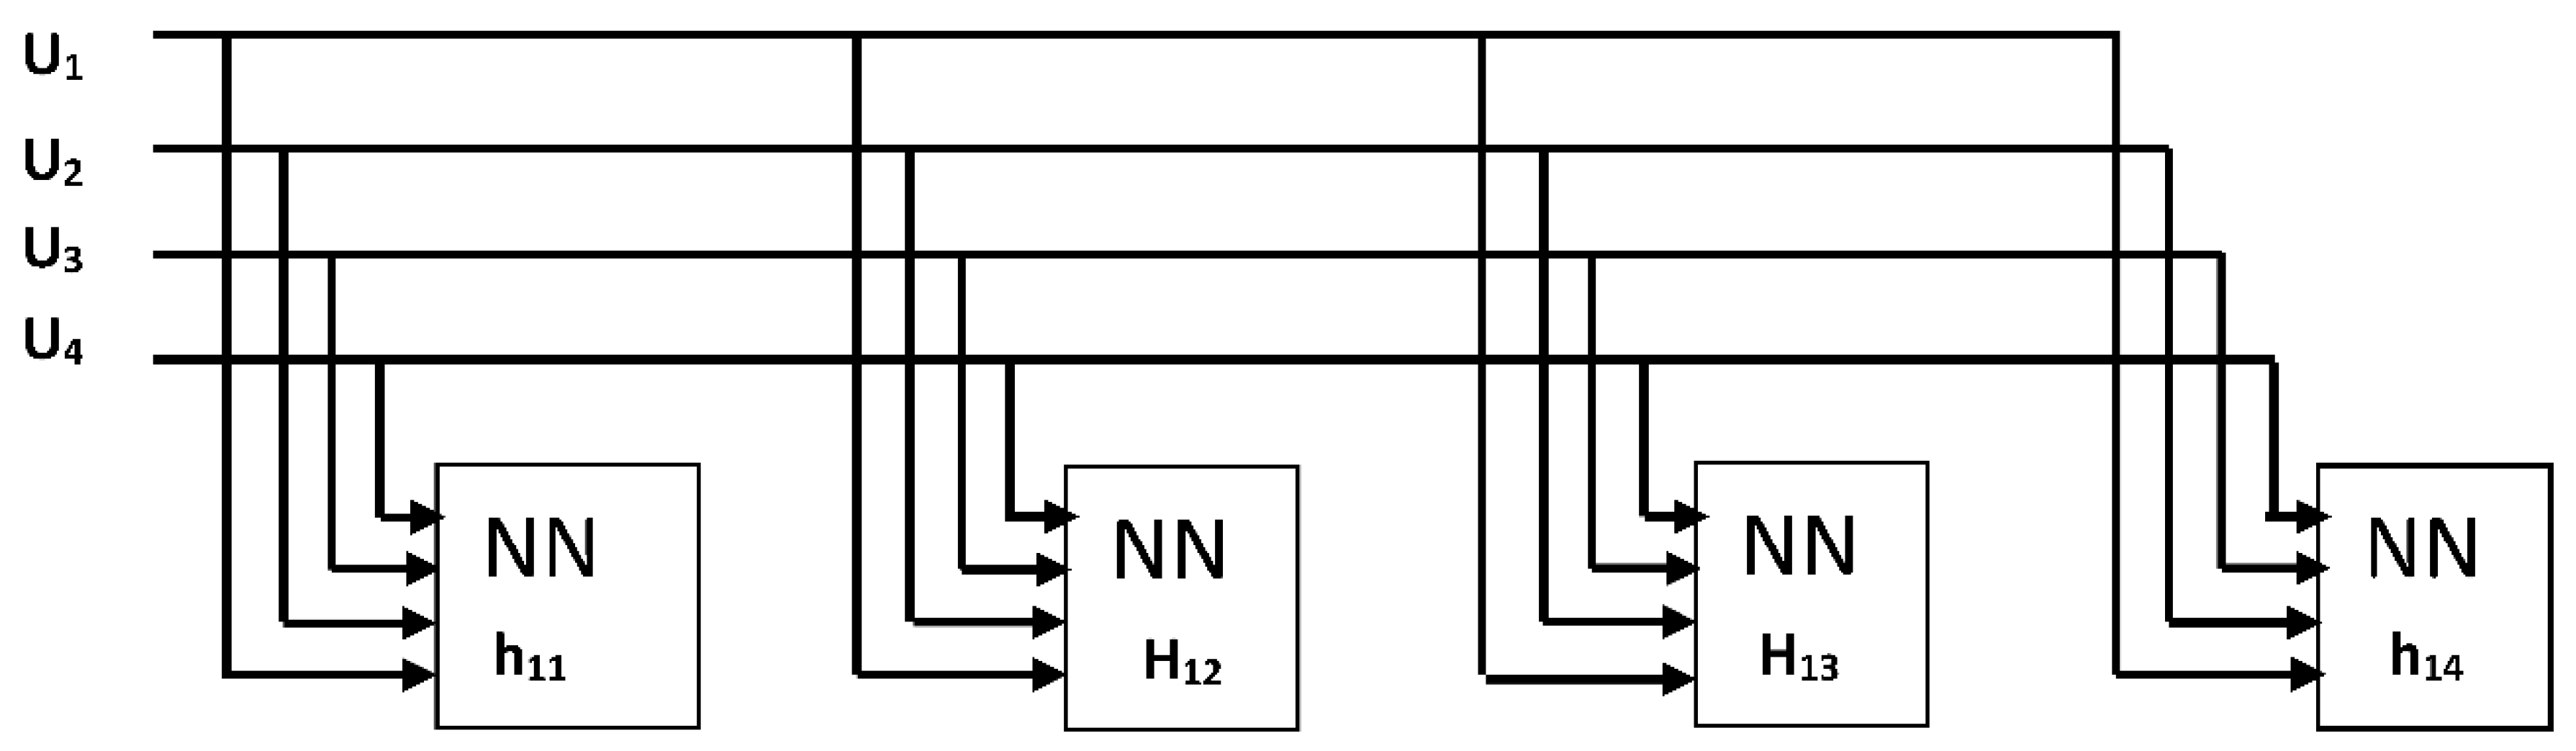
Figure 6.
NN for the evaluation of {4 × 4} coefficients of h2.
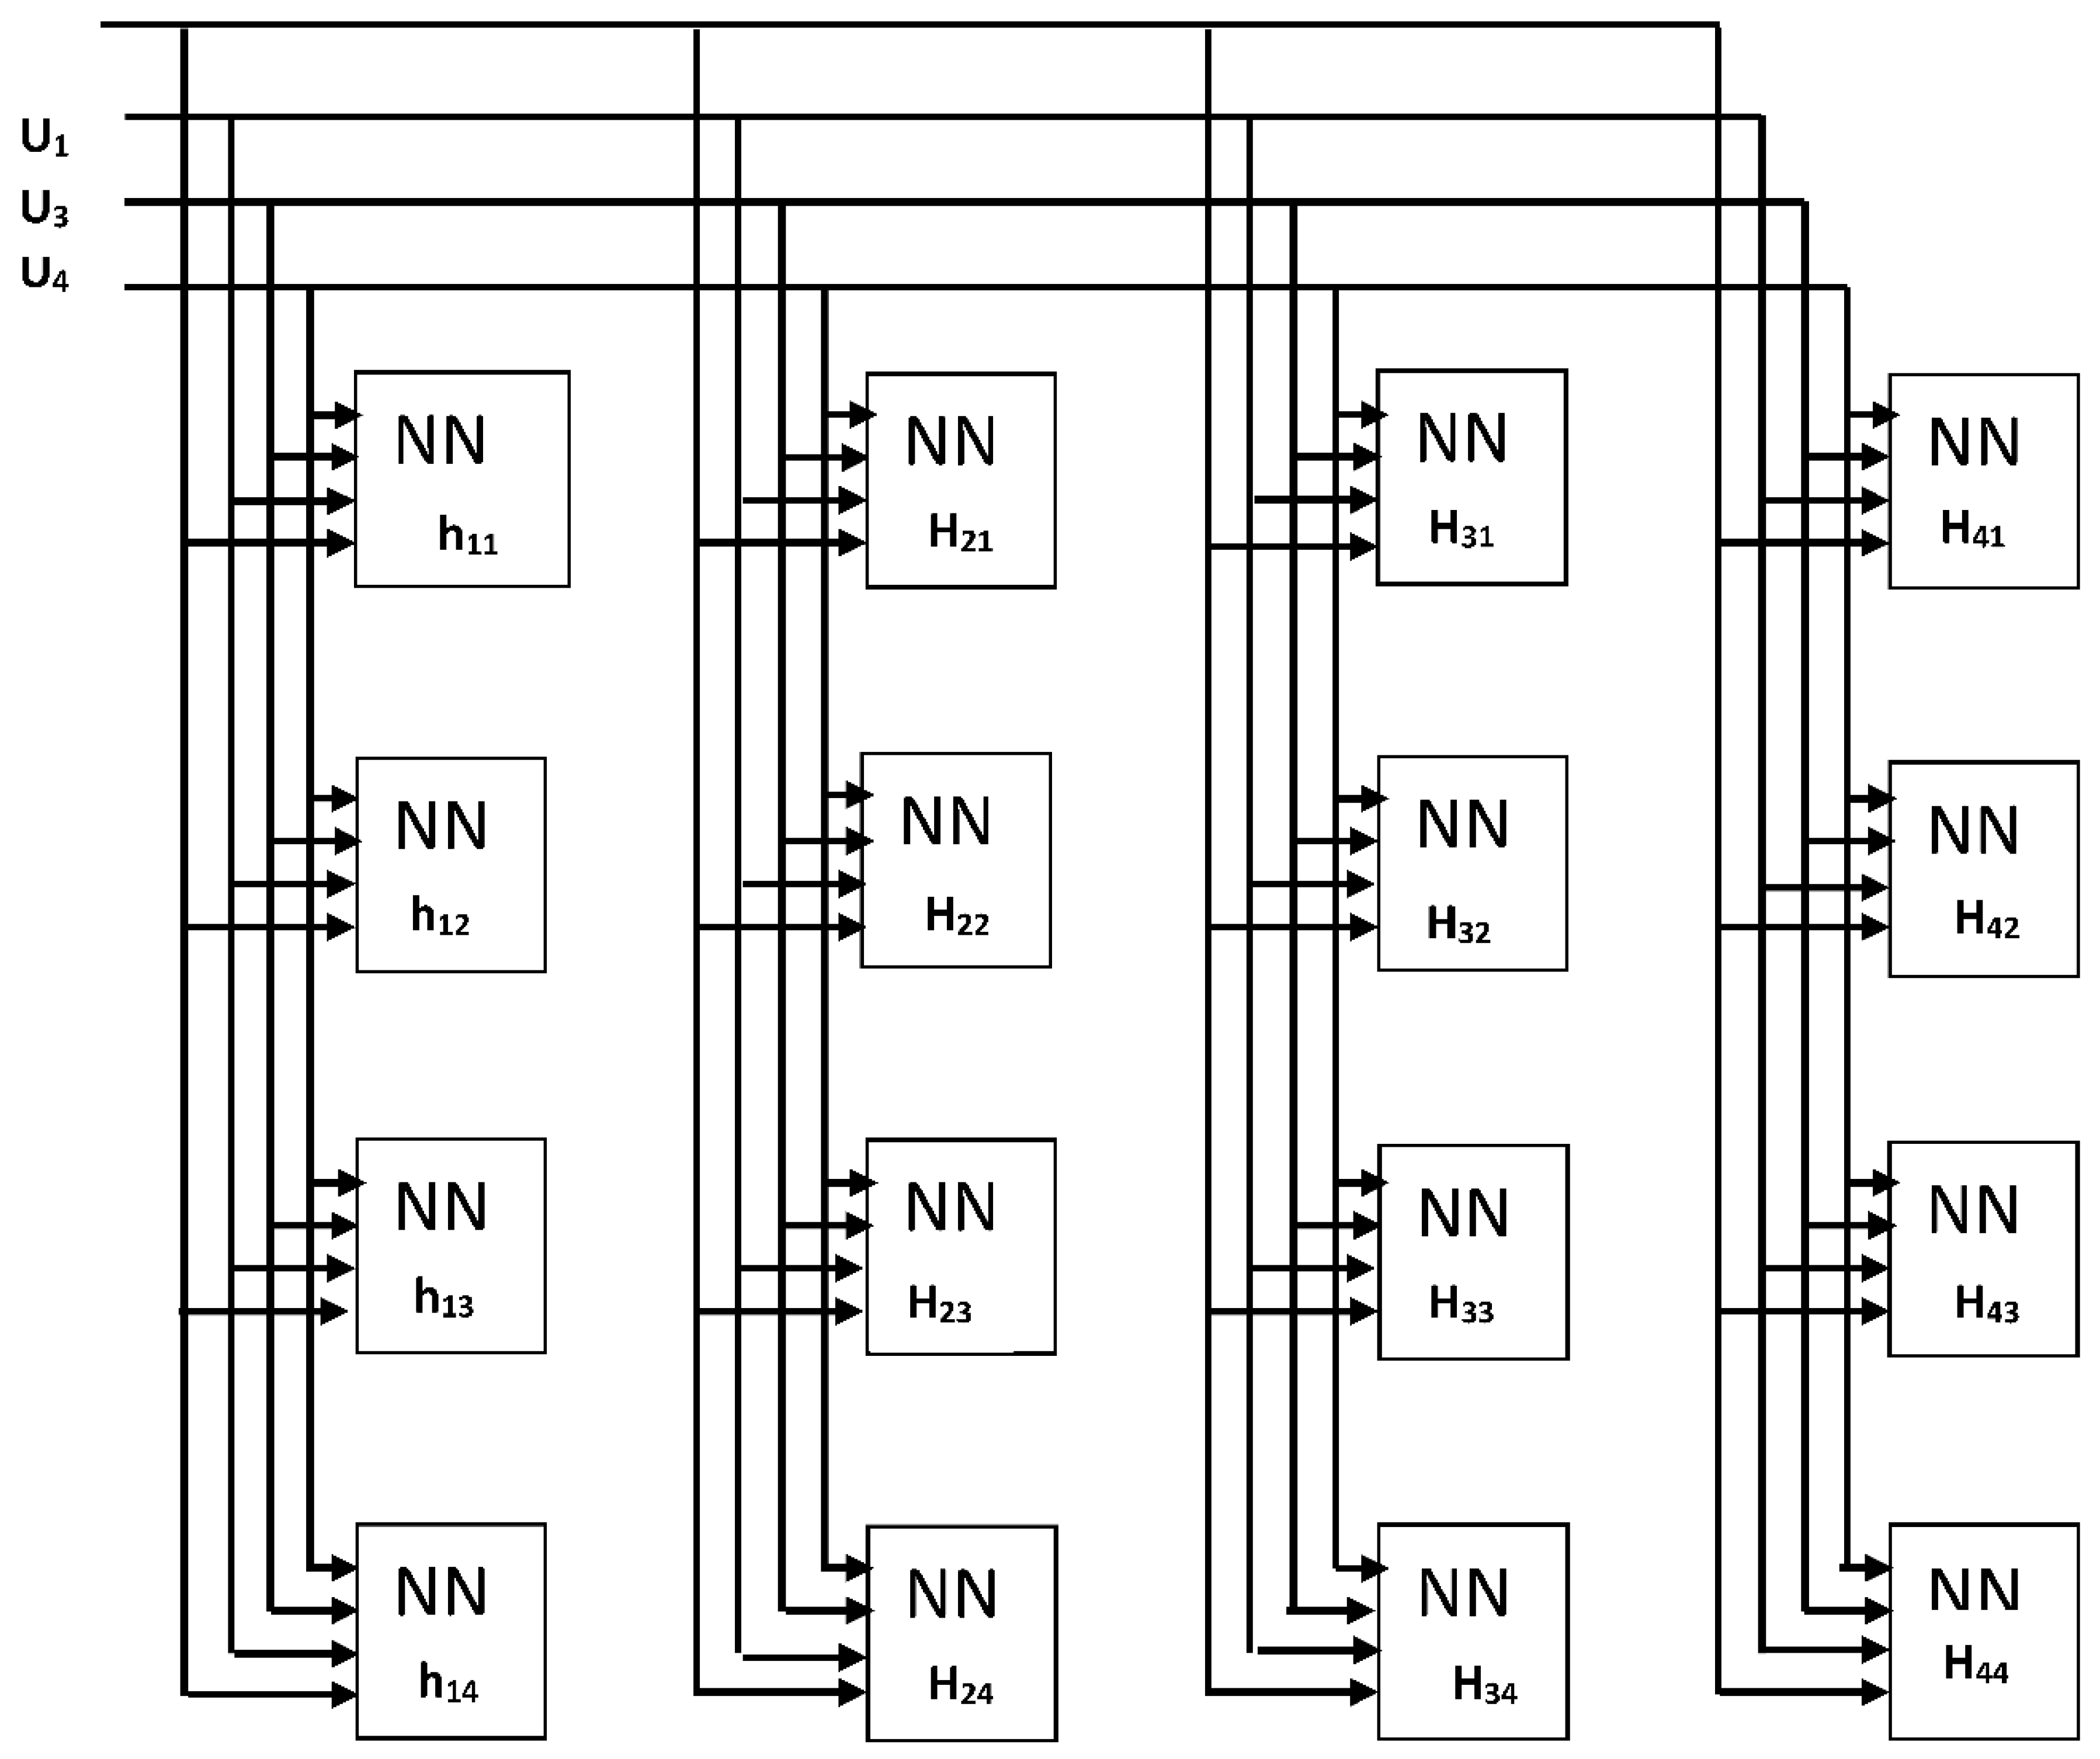
Figure 7.
Measured and forecasted wind speed during 100-day period.
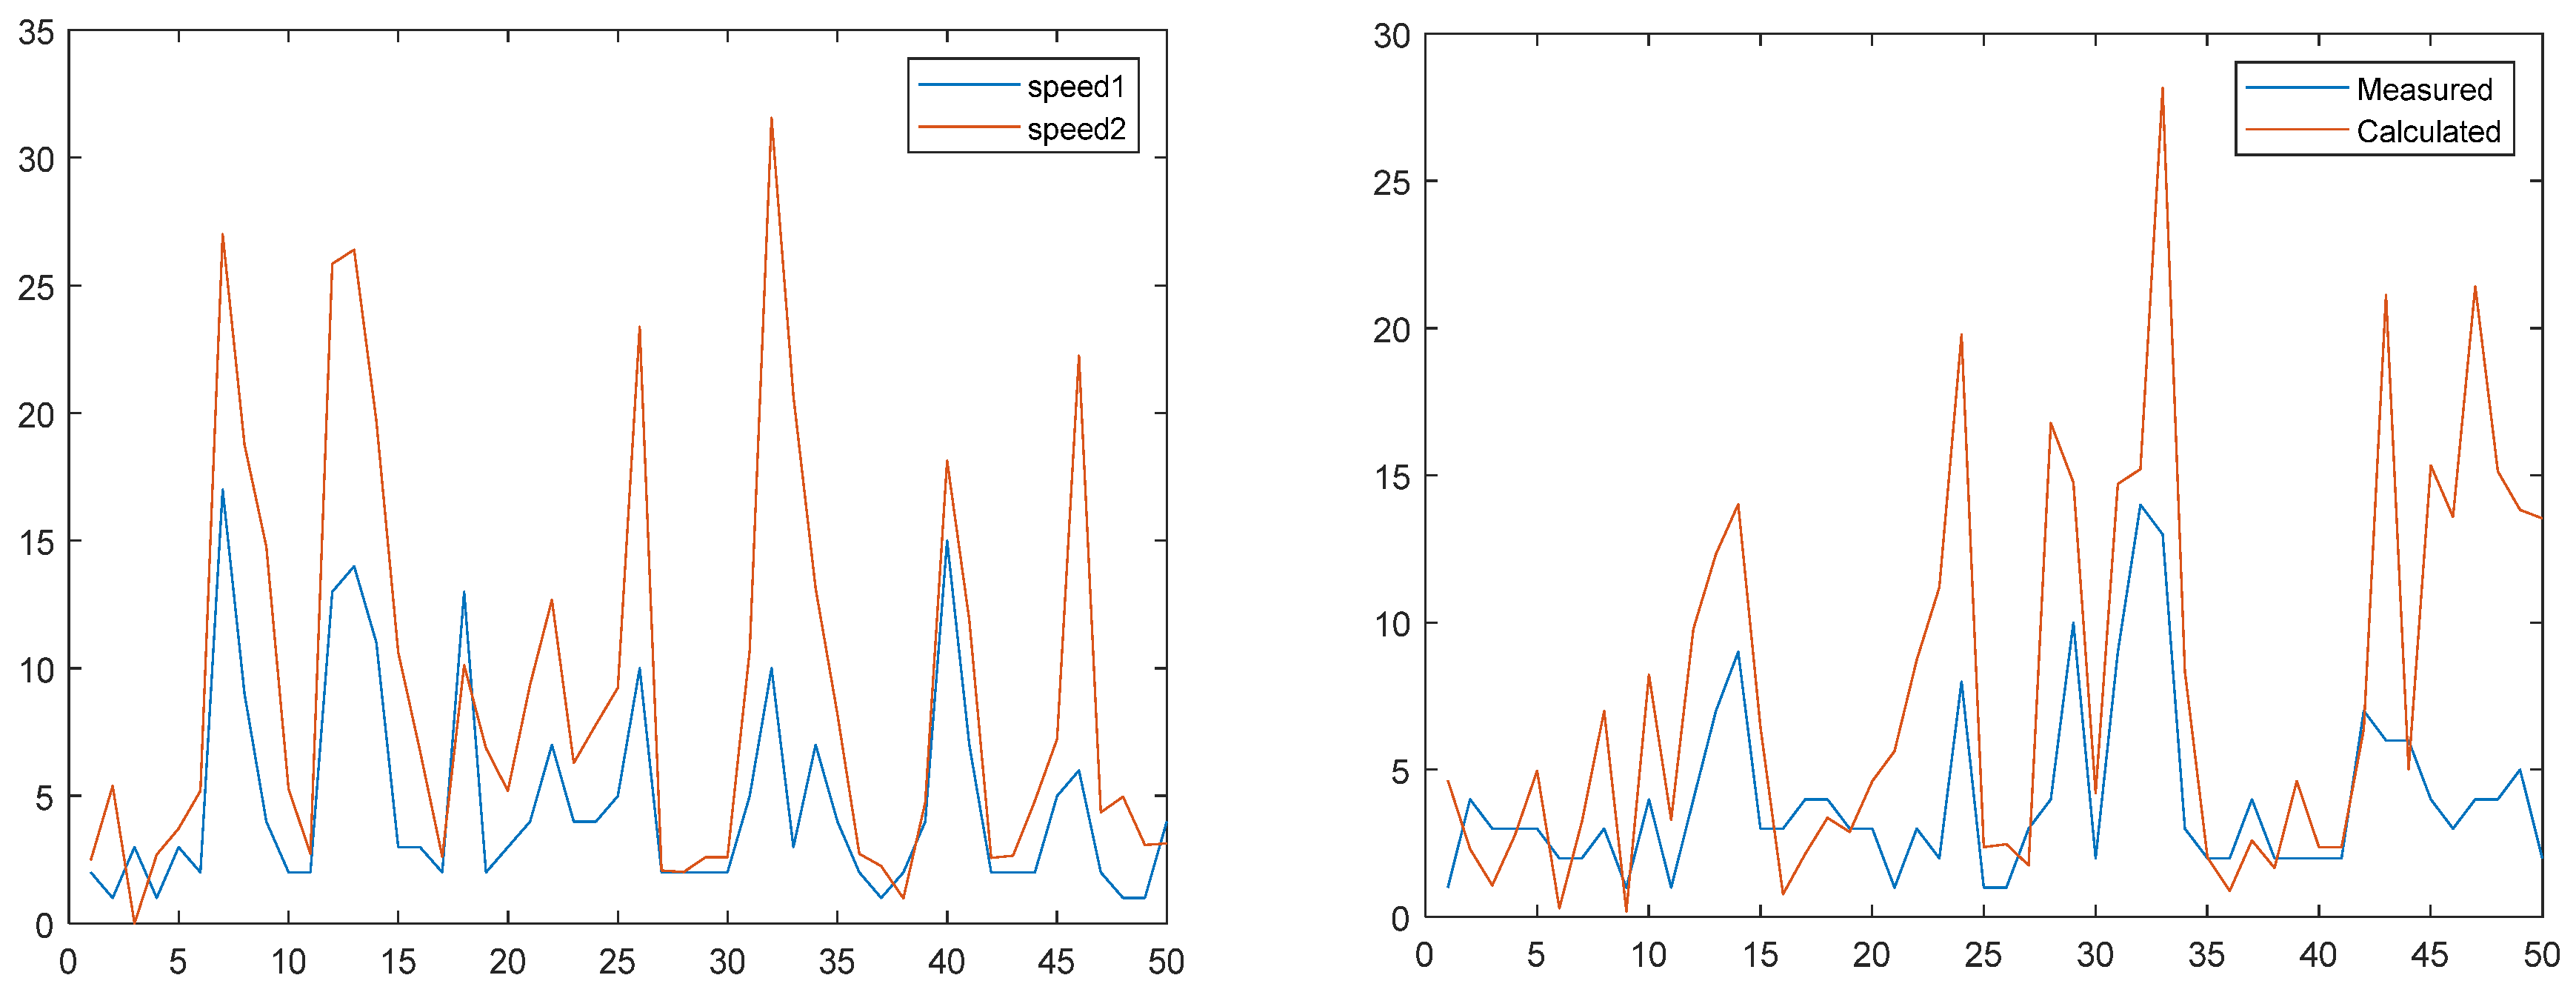
Figure 8.
Patterns of measured and calculated wind speeds for 10 periods.
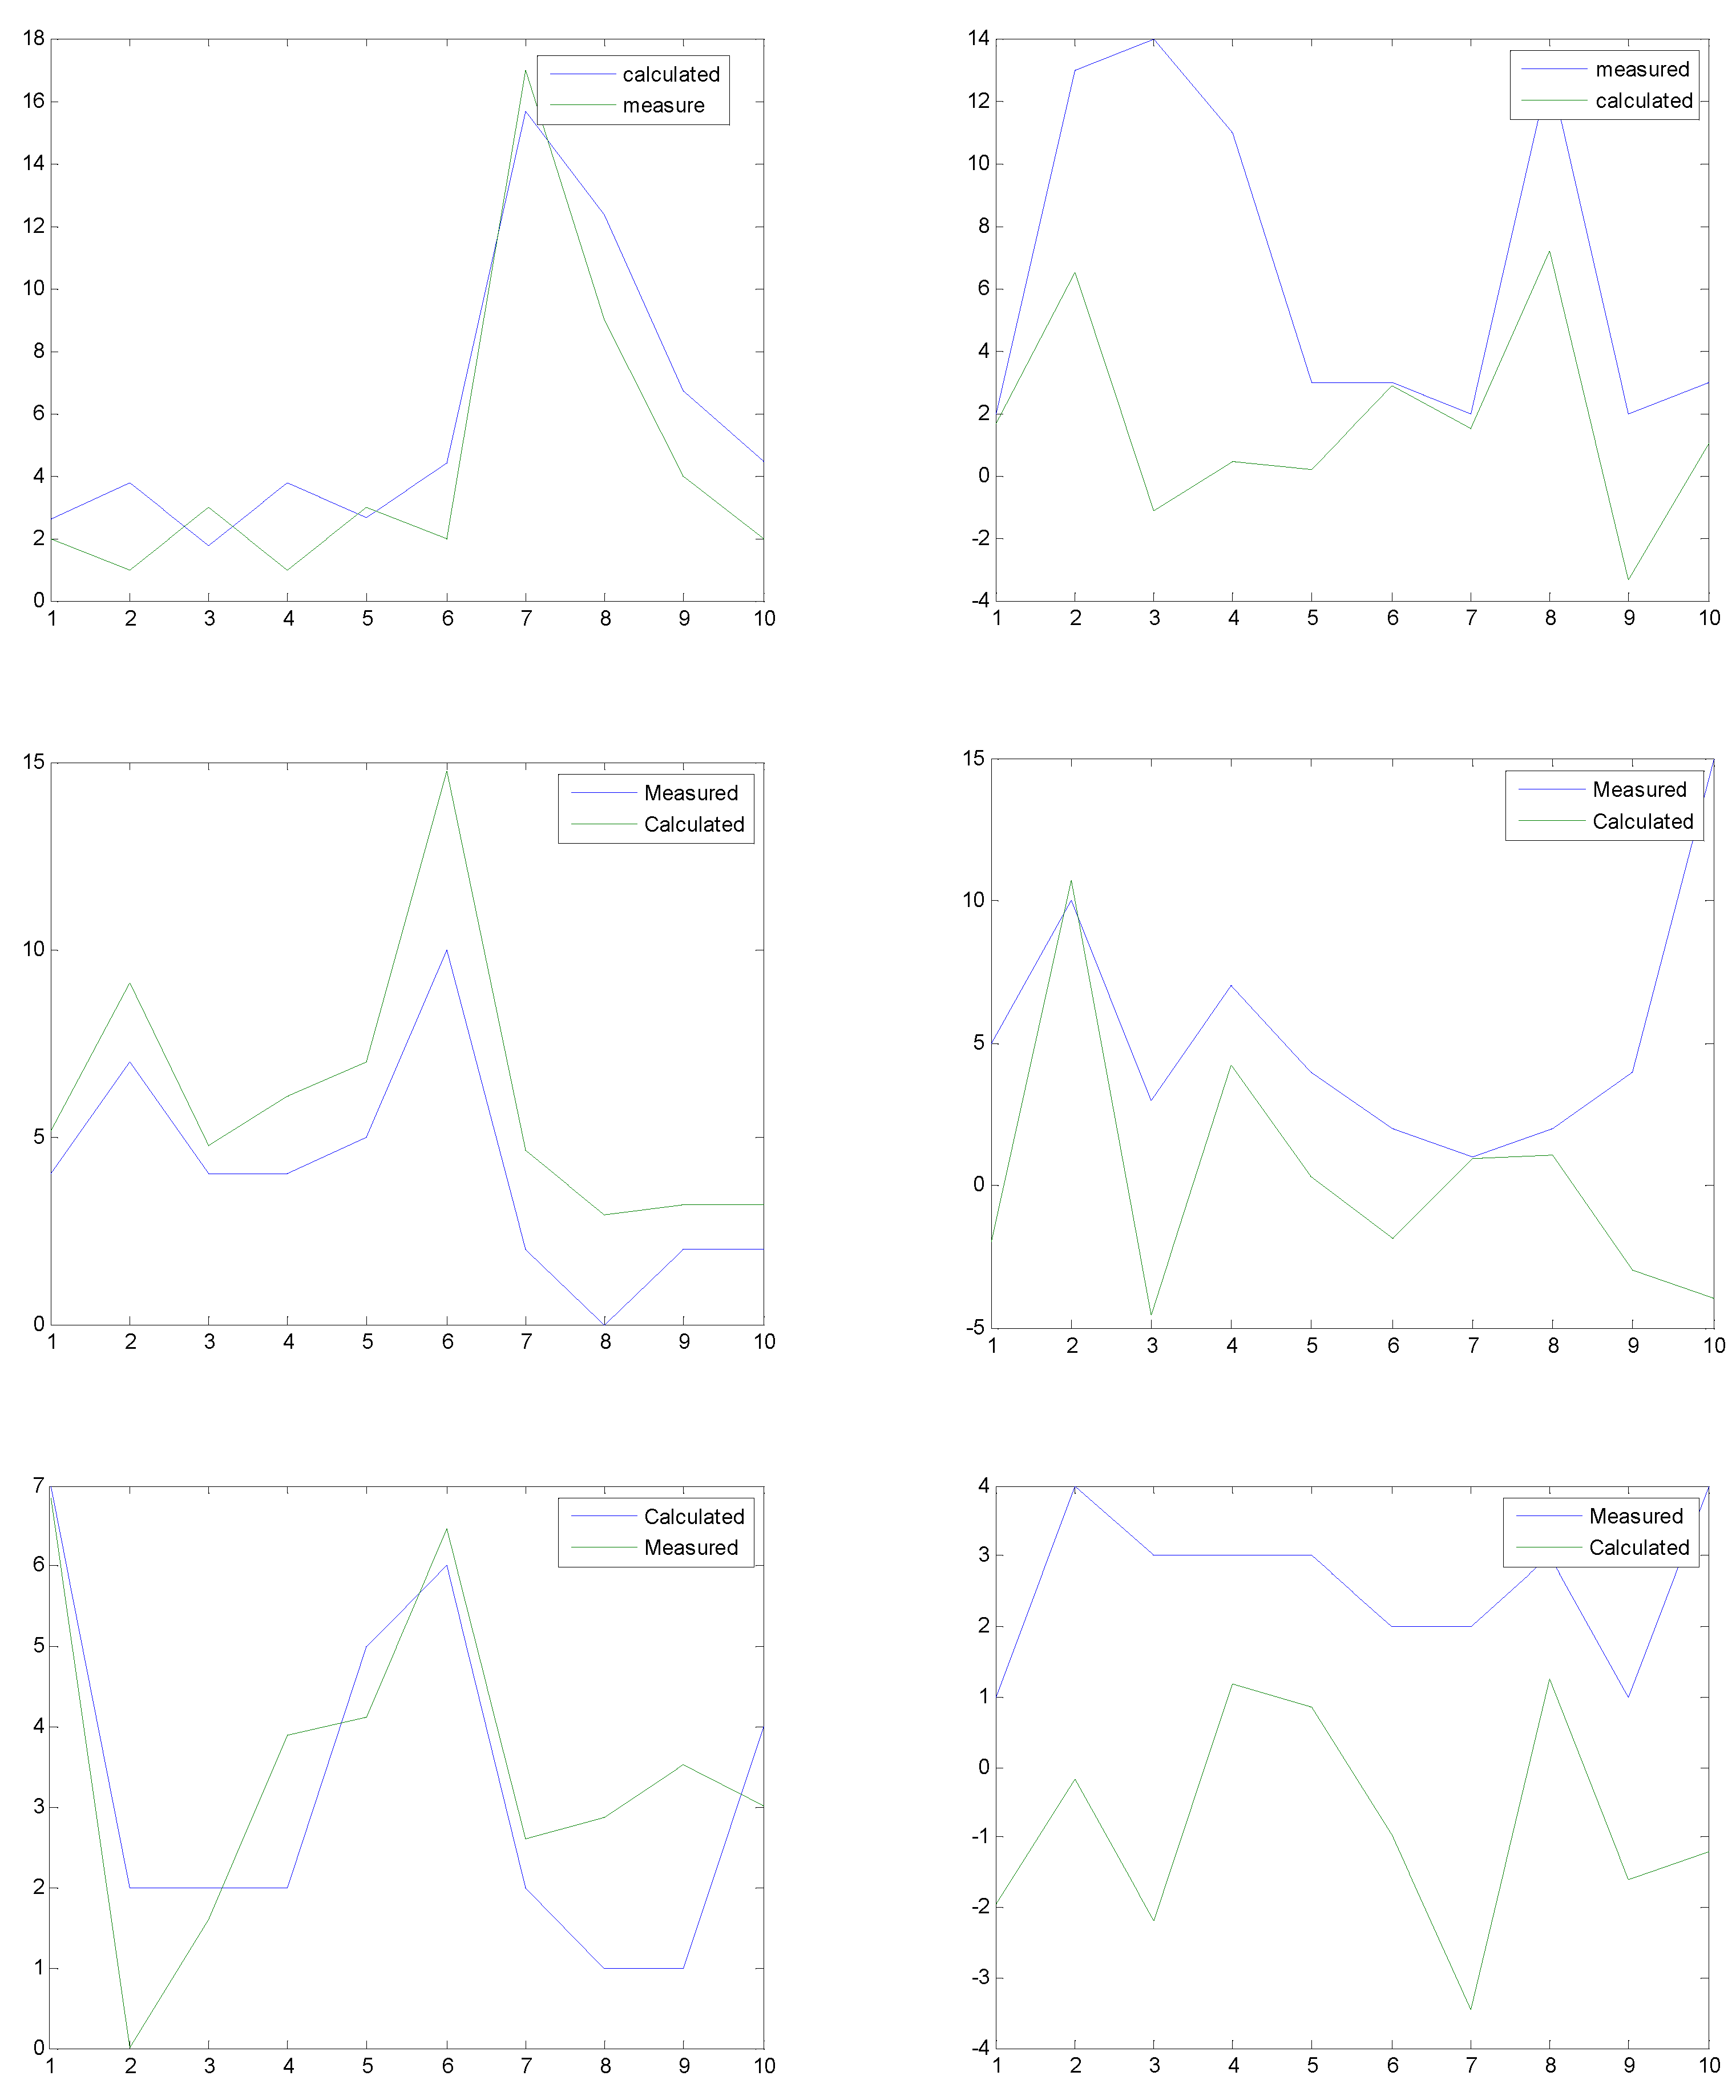
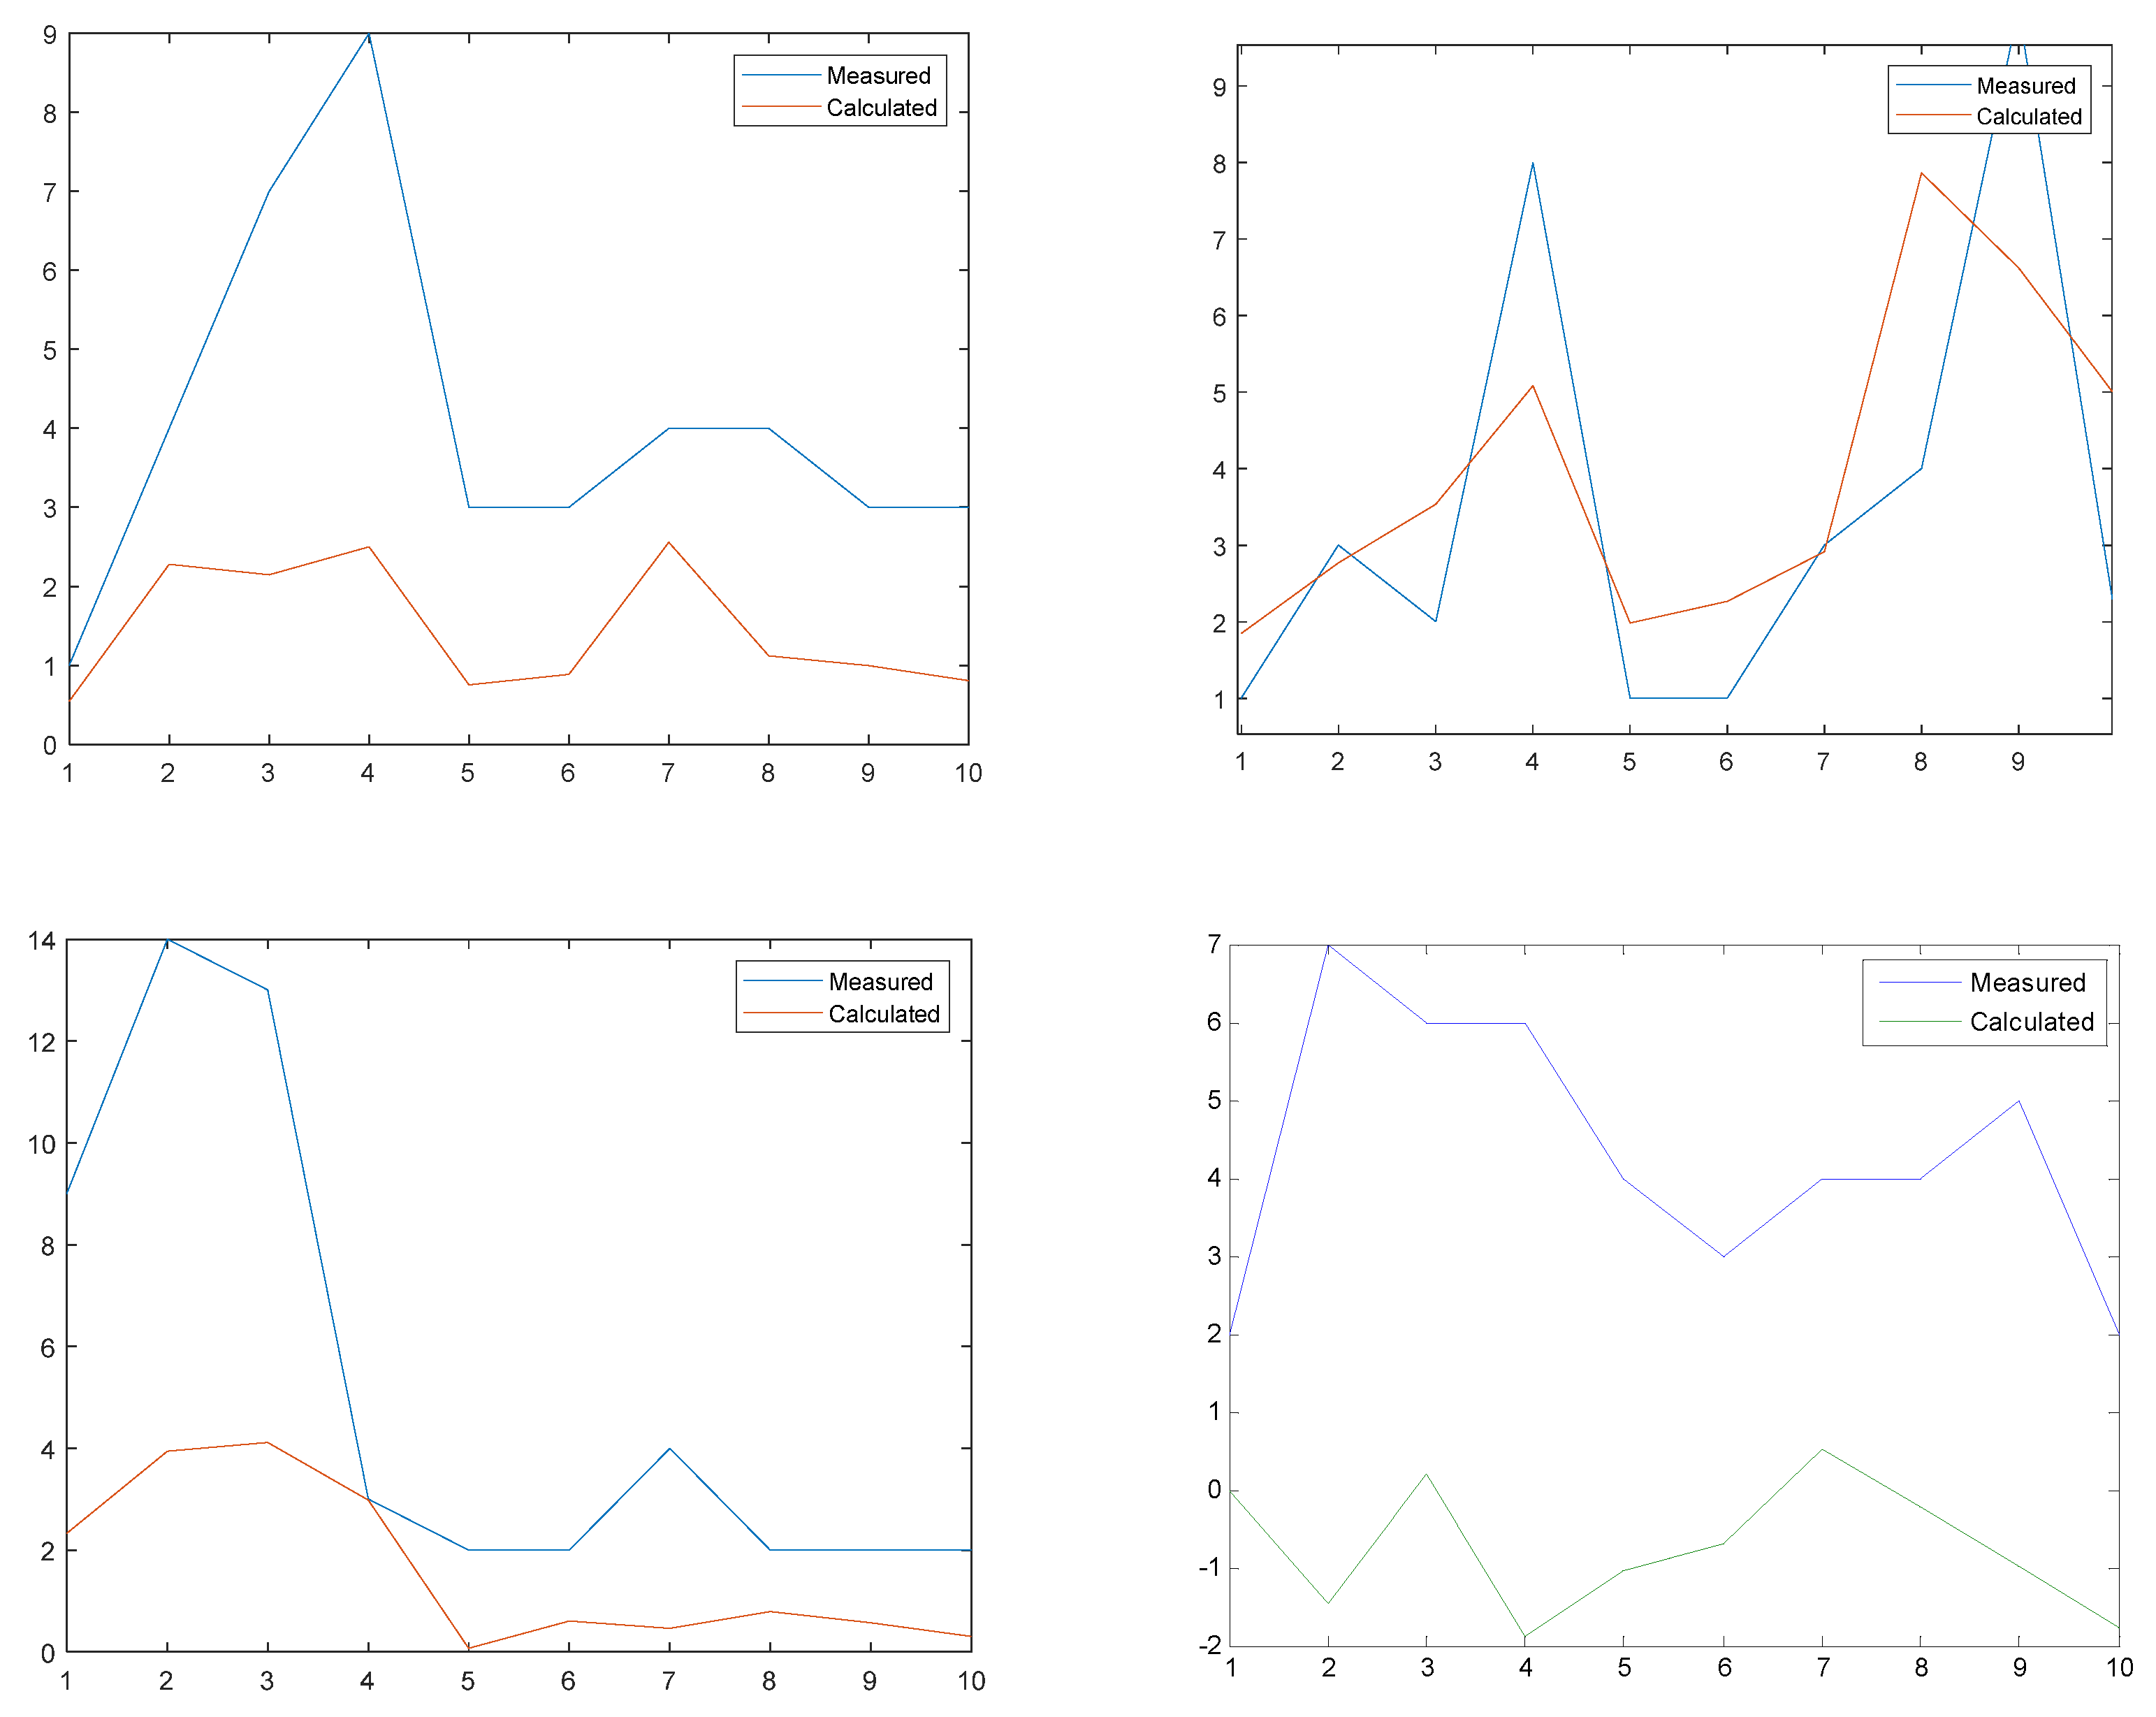

Table 1.
Physical parameters of Fujairah site [20].
Table 1.
Physical parameters of Fujairah site [20].
| Parameter | Value |
|---|---|
| Latitude (deg N) | 25007′ N |
| Longitude | 56018′ E |
| Mean wind speed at 10 m | 4.072664 mph |
| Mean wind direction | 182.46510 |
| Average temperature | 28 °C |
| Mean pressure | 900–1100 m bar |
| Relative humidity | 50–100% |
| Air density | 1.188 kg/m3 |
| Terrain | flat land |
| Obstacles | Hills |
| Surface roughness class | 0.5 Sa |
Note: The site is surrounded by low–high hills that might impose wind speed obstructions and restrictions. The wind regime is generally calm at site, with occasional abrupt and chaotic increases in wind speed due to seasonal temperature changes.
Table 2.
depicts these values for long-term daily forecasting.
| h0 | h1 [1] | h1 [2] | h1 [3] | |
|---|---|---|---|---|
| Month 1 | 1.0655 | 0.7209 | -0.7852 | 3.5145 |
| Month 2 | -0.6084 | 1.3254 | -1.082 | 0.9684 |
| Month 3 | 8.5884 | 0.2627 | -0.6431 | 0.3529 |
| Month 4 | 3.959 | -0.3831 | 0.9421 | -1.0135 |
| Month 5 | -0.9335 | -0.7779 | -1.4873 | -1.1422 |
| Month 6 | -4.1281 | 0.0515 | -1.7653 | -0.3483 |
| Month 7 | 4.2697 | 0.5041 | -0.265 | -0.5244 |
| Month 8 | 2.6796 | -9.0945 | -16.7354 | 6.7691 |
| Month 9 | -1.0694 | -4.2658 | -5.5122 | -0.3046 |
| Month 10 | -7.8111 | 5.0786 | -3.3169 | -0.8385 |
| Month 11 | 7.8389 | 7.1803 | 2.681 | -0.6133 |
| Month 12 | -0.2562 | -0.069 | -0.0257 | 0.0059 |
| Forecasted month | 2.271605 | -0.60568 | -1.31348 | 1.223976 |
Table 3.
Extracted Volterra kernels in 100 days.
| h0 | h1[1] | h1[2] | h1[3] | h1[4] | |
|---|---|---|---|---|---|
| Day1-Day10 | 0.4572 | 1.0097 | 0.4292 | 1.1897 | -0.0469 |
| Day11-Day20 | 1.1548 | -0.2147 | -0.1143 | -0.6630 | -0.4621 |
| Day21-Day30 | 0.288 | 0.8719 | 0.3434 | 3.6623 | -3.0886 |
| Day31-Day40 | 0.1391 | 1.6331 | -0.5056 | -2.8615 | 2.5864 |
| Day41-Day50 | 0.5602 | 0.0933 | 1.2503 | -0.1631 | -0.6328 |
| Day51-Day60 | -0.7095 | -0.1883 | -0.3355 | -0.6535 | 1.5966 |
| Day61-Day70 | -0.4693 | 0.0579 | 0.0906 | 0.0674 | -0.0007 |
| Day71-Day80 | 0.2426 | -0.2129 | -0.6904 | 0.0800 | -0.1705 |
| Day81-Day90 | 4.3374 | 5.1684 | -2.0509 | 2.5870 | 4.8567 |
| Day91-Day100 | 0.9676 | 0.5311 | 0.5597 | 0.6154 | 0.1890 |
| Forecasted Day (statistics) | 0.1352 | -0.0932 | -0.0166 | -0.3929 | 0.4800 |
| Forecasted Day (NN) | 3.4194 | 4.5363 | -0.48691 | -2.9585 | 1.3046 |
Table 4.
Daily wind speed forecasting.
| Month: Day | Forecasted wind speed (trended) | Average measured wind speed |
|---|---|---|
| 12:01 | 1.27 | 1.825579 |
| 12:02 | 1.75 | 1.576968 |
| 12:03 | -0.26 | 2.59120 |
| 12:04 | 1.05 | 2.209375 |
| 12:05 | -2.5 | 4.078935 |
| 12:06 | -2.4 | 2.343981 |
| 12:07 | -2.3 | 2.666667 |
Table 5.
Hourly (average) wind speed forecasting.
| Forecasted Day | Trended (statistics) wind speed mph | NN forecasted wind speed mph | Average forecasted wind speed mph | Average measured wind speed mph |
|---|---|---|---|---|
| Day 101 | 0.5 | 8.01 | 4.25 | 3.77708 |
| Day 102 | 0.5 | 8.01 | 4.25 | 4.07974 |
| Day 103 | 0.28 | 19.4 | 9.8 | 4.78622 |
| Day 104 | 0.25 | 17.2 | 8.7 | 4.51921 |
| Day 105 | 0.25 | 17.2 | 8.7 | 8.05856 |
| Day 106 | 0.21 | 12.6 | 6.4 | 5.11458 |
| Day 107 | 0.19 | 10.3 | 5.25 | 3.80370 |
| Day 108 | 0.21 | 12.6 | 6.4 | 2.80706 |
| Day 109 | 0.21 | 12.6 | 6.4 | 4.04444 |
| Day 110 | 0.09 | 14.8 | 7.4 | 3.31793 |
Disclaimer/Publisher’s Note: The statements, opinions and data contained in all publications are solely those of the individual author(s) and contributor(s) and not of MDPI and/or the editor(s). MDPI and/or the editor(s) disclaim responsibility for any injury to people or property resulting from any ideas, methods, instructions or products referred to in the content. |
© 2023 by the authors. Licensee MDPI, Basel, Switzerland. This article is an open access article distributed under the terms and conditions of the Creative Commons Attribution (CC BY) license (http://creativecommons.org/licenses/by/4.0/).
Copyright: This open access article is published under a Creative Commons CC BY 4.0 license, which permit the free download, distribution, and reuse, provided that the author and preprint are cited in any reuse.


