

Submitted:
07 April 2024
Posted:
08 April 2024
You are already at the latest version
Abstract
The main source of electricity worldwide stems from fossil fuels, contributing to air pollution, global warming, and associated adverse effects. This study explores wind energy as a potential alternative. Nevertheless, the variable nature of wind introduces uncertainty in its reliability. Thus, it is necessary to identify an appropriate machine learning model capable of reliably forecasting wind speed under various environmental conditions. This research compares the effectiveness of artificial neural networks (ANN) and convolutional neural networks (CNN) in predicting wind speed across three locations in South Africa, characterised by different weather patterns. Empirical results show that CNN outperforms ANN in accurately forecasting wind speed under different weather conditions. This superiority is likely due to the inherent architectural attributes of CNNs, including feature extraction capabilities, spatial hierarchy learning, and resilience to spatial variability. These results could be useful to decision-makers in the energy sector.
Keywords:
Air pollution
; Global warming
; Fossil fuels
; Renewable energy
; Carbon emissions
; volatility
; Reliability
; Machine learning
; ANN
; CNN
1. Introduction
1.1. Overview
Wind energy utilisation as a sustainable energy alternative has become increasingly favoured due to its environmental friendliness and accessibility (Wiser et al. [1]). One of the advantages of wind energy is that it is accessible all day, making it preferable to solar energy. The use of wind as the primary energy source would reduce global warming and the carbon footprint, which is critical because many countries are rushing to implement measures to reduce carbon emissions due to the increases in the emissions reported over the last decade. However, the use of wind energy has its challenges as it is highly volatile, which would cause power spikes in the power grid. This, therefore, calls for accurate predictions of wind speed, which is known to be the main driver of wind power. Failure to predict the wind speed accurately can disrupt the power supply (Klein and Celik [2]).
1.2. Literature Review
Much research has been done in modelling and forecasting wind power generation. Li and Shi [3] compared different Artificial Neural Network (ANN) models to find one with the highest predictive power. Three ANN models were considered: ADALINE, feed-forward back-propagation (BP), and RBF. The wind information utilised consists of the average wind velocity per hour gathered at two monitoring locations in North Dakota: Hanna-ford and Kulm.
In the study, both wind speeds are measured 10 meters above the ground, as suggested by WMO [4]. The authors used MAE, RMSE, and MAPE to assess the models’ performance. Observing whether different metrics would produce similar rankings for model performance would be intriguing. As part of pre-processing, the authors divided the data into parts, which are training, evaluation, and testing. For the testing dataset, they separated the last five days of the year and randomly selected 5000 inputs for the training set, and the remainder were used for the validation dataset. Based on the evaluation metrics, the authors established that the BP and RBF outperformed the ADALINE model. This would be the case for any dataset as the ADALINE is just a single perceptron, and that the selection of the best performance of the ANN models would depend on the type of dataset one has because the accuracy of the forecast is affected by various factors, including distinct inputs and learning rates, in addition, the structure of the model.
Antor and Wollega [5], in their study, determined the most accurate machine learning algorithm amongst ridge regression, polynomial regression, and ANN for predicting wind speed. Wind speed is known to be one of the most unpredictable renewable energy sources. The study was conducted in the USA, and the data used was from 2017 to 2019, which was collected by the Dark Sky website. The authors’ justification for choosing these three models is that they are sustainable when dealing with the underlying problem, which the regression model represents. After analysing the test data with R-square and RMSE metrics, it was discovered that the polynomial model had the highest R-square value of around 60%. On the other hand, the ANN model had the lowest R-square value. Additionally, the polynomial model had the lowest RMSE value of about 3.07, while the ANN model had the highest RMSE value above 3.5.
Shen et al. [6] conducted a study to predict wind speed for an unmanned sailboat. An unmanned sailboat uses wind to power its sails and moves through the water. The boat’s navigation system uses wind direction and speed information to adjust its course and optimise speed. Accurate wind speed prediction is essential for an unmanned sailboat as this improves safety and performance. To achieve multi-step wind prediction, the authors suggested a new hybrid model for neural networks that combines CNN and LSTM. The study involved analysing the data and improving the grid search method. The appropriate hyperparameters for the learning rates and input length were determined during this process. The information analysed in this research was chosen from the National Climate Database of New Zealand. The time interval between observations is only ten minutes. The specific stations chosen are Baring Head, Lake Karapiro Cws, and Gore Ews. Upon analysing the data, it was discovered that the Gore Ews station recorded 39,575 instances, with the highest wind speed reaching 15.2 metres per second and an average wind speed of 3.4 metres per second. The Lake Karapiro Cws station had 26,135 instances, with the highest wind speed of 13.7 metres per second and an average of 1.7 metres per second. Baring Head had 39,916 instances, with the highest wind speed of 30.3 metres per second and an average of 9.4 meters per second. The dataset comprises several attributes, including humidity and pressure, among others. The training set and test set were created from the data. Specifically, 80% of the original data points were allocated for training purposes, while the remaining 20% was set aside for testing. As part of the data pre-processing, it was important to handle missing values to avoid any errors that may occur. To address this, the authors took one of two approaches: either deleting the record with a missing value or interpolating the missing value with a new one. The accuracy of the CNN-LSTM model was evaluated using MAE, R-Square, RMSE, and correlation coefficients (CC) metrics after using the multi-grid search method and training the models. The CNN-LSTM model performed better than the benchmark models, with lower errors and better CC values. On Gore Ews station, the MAE and MSE are 0.478 and 0.648, respectively, which is best compared to all the other models. CC and R-squared metrics of CNN-LSTM are 0.9528 and 0.9070, again the best among other models; on Lake Karapiro Cws station, CNN-LSTM MAE and MSE are lower than the other two stations. However, the CNN-LSTM still performed better than all other benchmark models. This leads to the conclusion that CNN-LSTM shows better accuracy and stability.
Chen and Folly [7] conducted a study comparing three wind speed prediction models: the autoregressive moving average (ARMA), ANN and ANFIS. The ANFIS is a hybrid model. . I The research employed information from the Wind Atlas of South Africa, obtained specifically from the Vredendal station. The data encompassed wind speed measurements at different heights, temperature readings, and atmospheric pressure data, all recorded at ten-minute intervals during the study period from December 2010 to January 2017.
The MAPE and RMSE metrics evaluated how well these models performed. The MAPE, RMSE, NMAE, and other metrics were examined for efficacy by Milligan et al. [8]. When feeding the data in ANN, the authors implemented pre-data processing, like removing outliers and ensuring no missing values, because ANN is very sensitive to insufficient data. The dataset was split into three segments, with 70% designated for training, 15% for validating, and 15% for testing. The findings demonstrate that all models perform similarly for extremely short-term predictions; however, the ARMA model was superior for shorter time frames. However, as the prediction period lengthened, its performance decreased more rapidly than that of ANN and ANFIS.
1.3. Research Highlights and Contributions
The research highlights of this study are:
- Comparison of wind speed prediction using ANN and CNN models across Napier, Noupoort, and Upington stations.
- Identification of non-stationarity in wind speed at Napier and Noupoort stations, contrasting with stationary behaviour at Upington.
- Utilisation of hyperparameter tuning via gradient ascent to optimise model performance.
- Consistent superiority of the CNN model over ANN in predicting wind speeds across diverse weather conditions, with CNN’s Mean Absolute Scaled Error (MASE) consistently below 1, indicating superior performance to the baseline model.
A discussion of the modelling framework is given in Section 2. Empirical results are presented in Section 5 while Section 10 presents a discussion of the performance of the models. Section 11 concludes.
2. Methods
2.1. Study Area
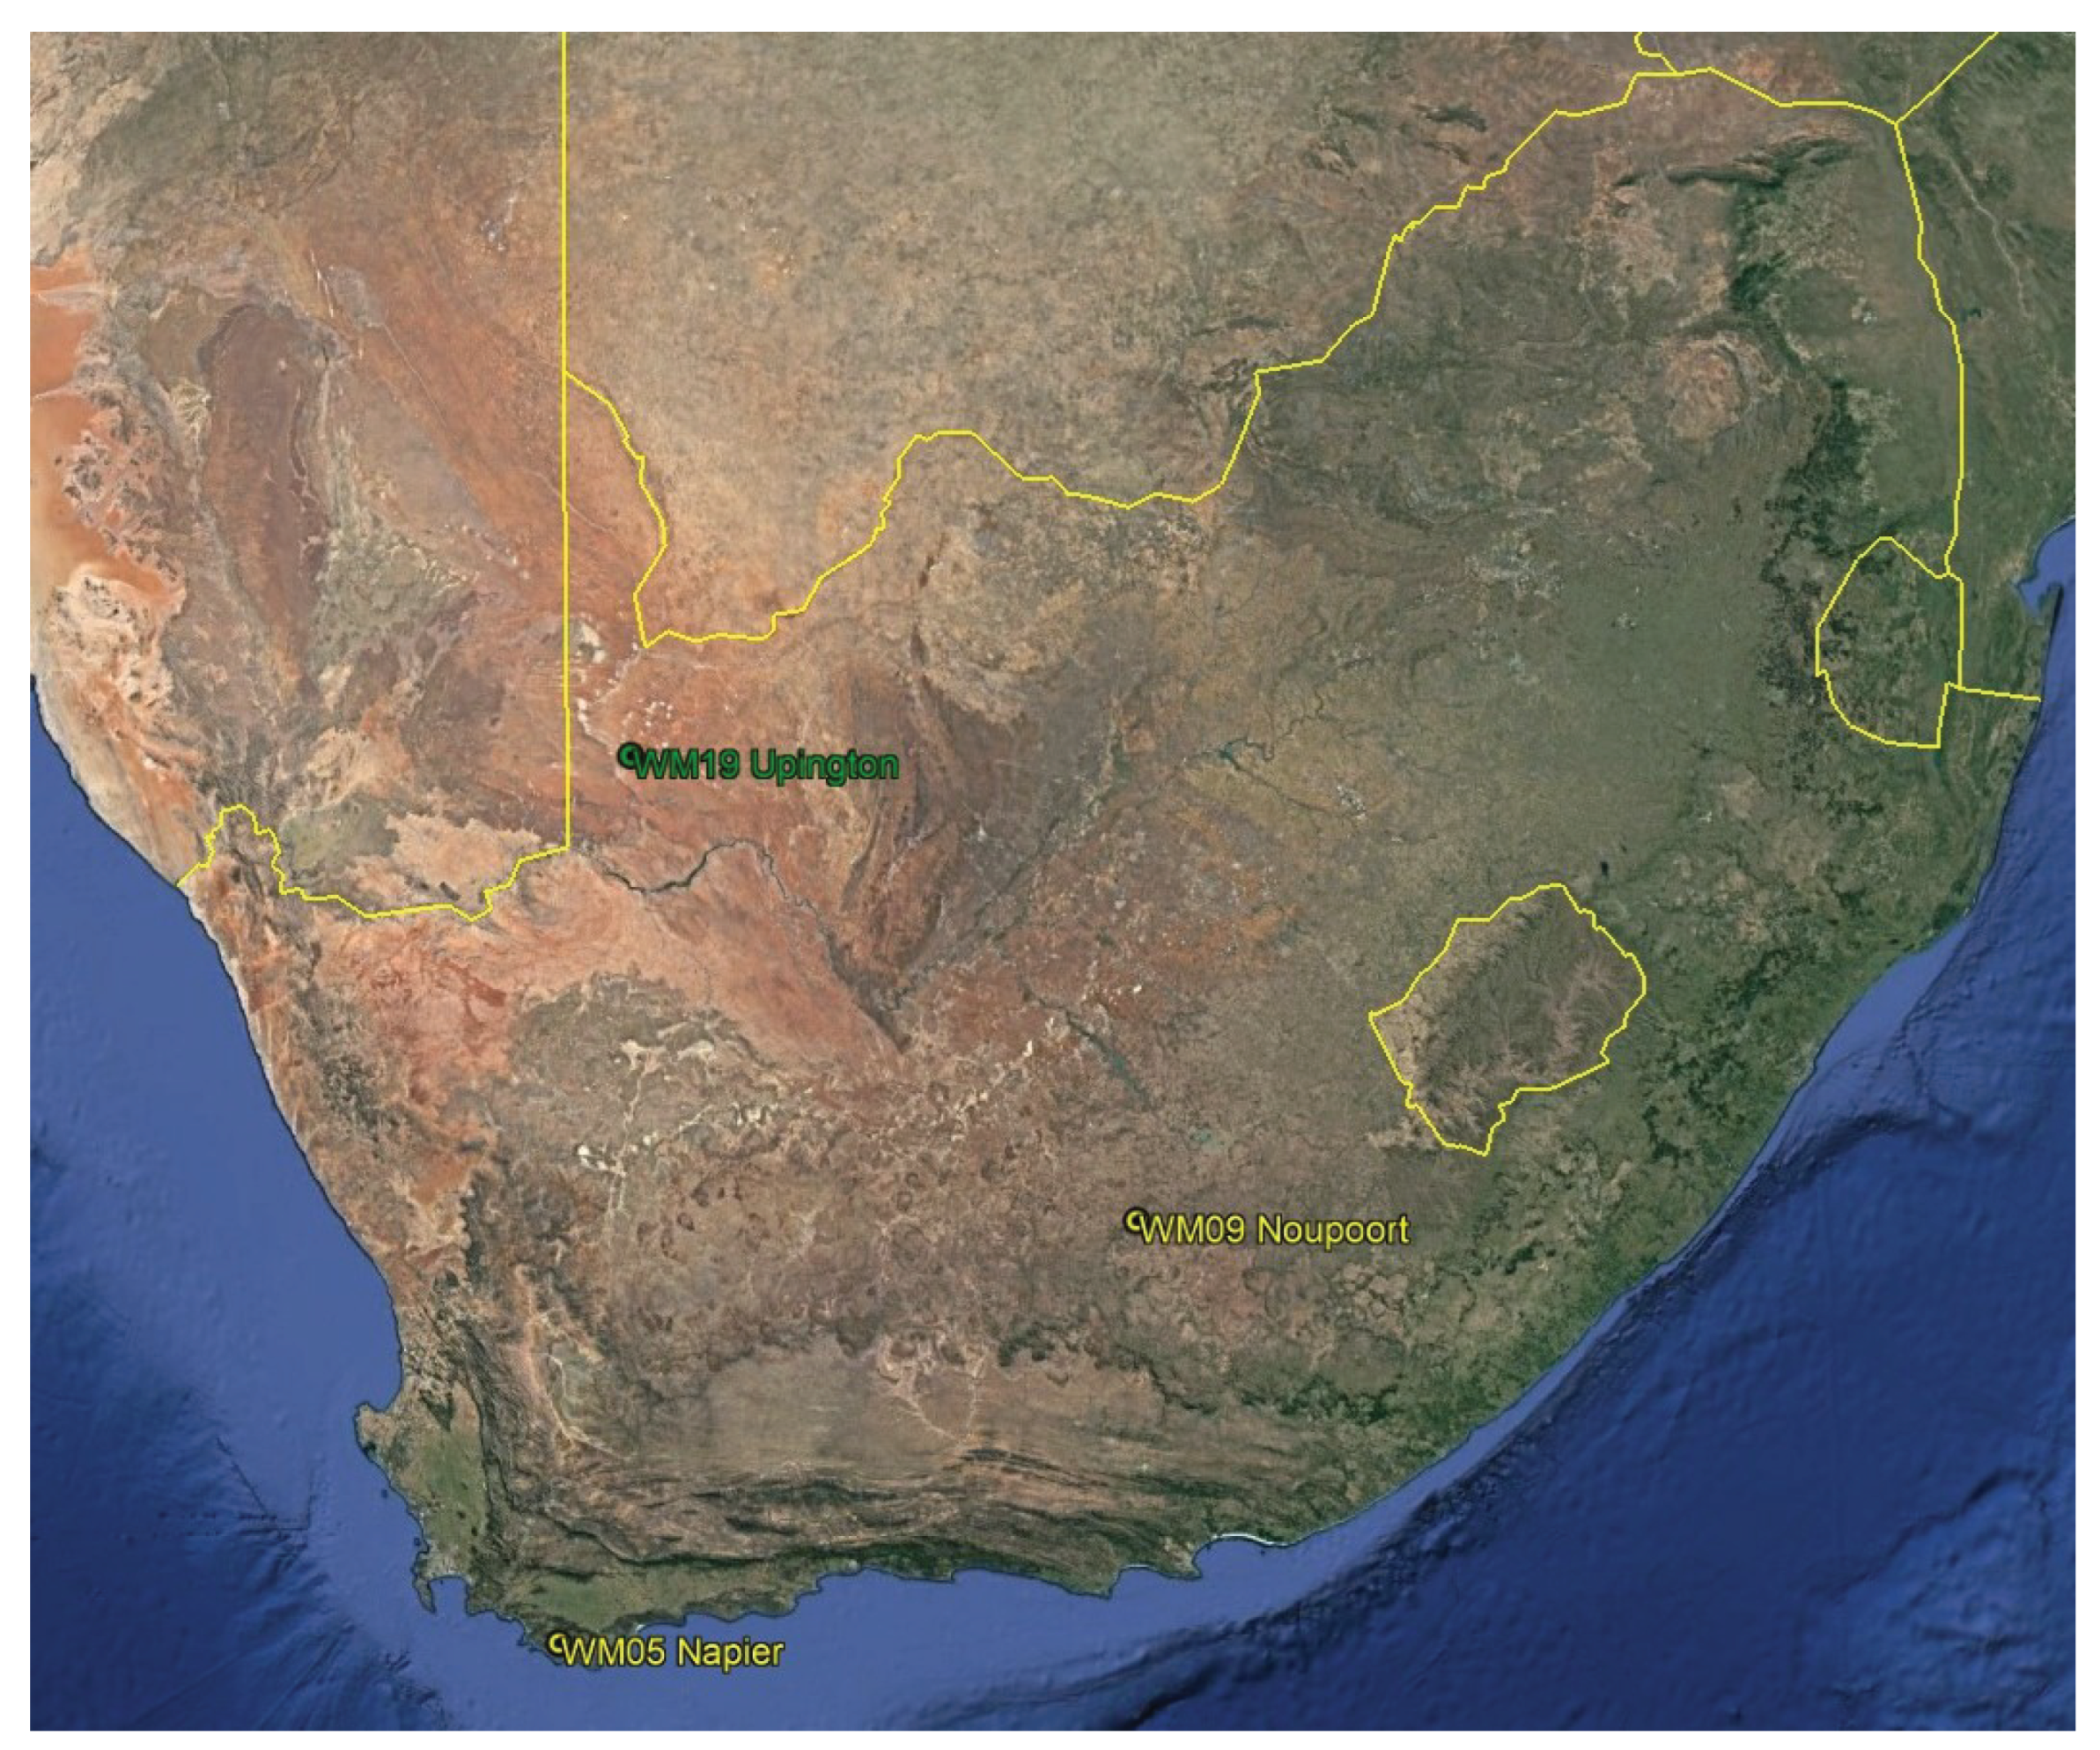
The research study will investigate three unique locations, each with distinct characteristics. The first location to be examined is Napier station, which can be found in the Western Cape. Its precise coordinates are longitude 19.692446, latitude 34.611915, and an elevation of 288m. The second location, Noupoort, is in the Northern Cape and has coordinates of longitude 25.028380, latitude 31.252540, and an altitude of 1806m. Lastly, Upington is also located in the Northern Cape, with its coordinates being longitude 20.568330, latitude 27.726700, and altitude of 848m. These locations have varying weather conditions; Napier is in a coastal area, Noupoort is inland, and Upington is in a dry region. The information for these three places is sourced from the WASA database, accessible at http://wasadata.csir.co.za/wasa/WASAData
Figure 1.
Location map. Source: The map was made with the Google Earth app, and data from the Wasa website was used, which is accessible at http://wasadata.csir.co.za/wasa/WASAData
Figure 1.
Location map. Source: The map was made with the Google Earth app, and data from the Wasa website was used, which is accessible at http://wasadata.csir.co.za/wasa/WASAData
2.2. Models
To predict wind speed, we will utilise the following machine learning models.
2.2.1. Artificial Neural Networks
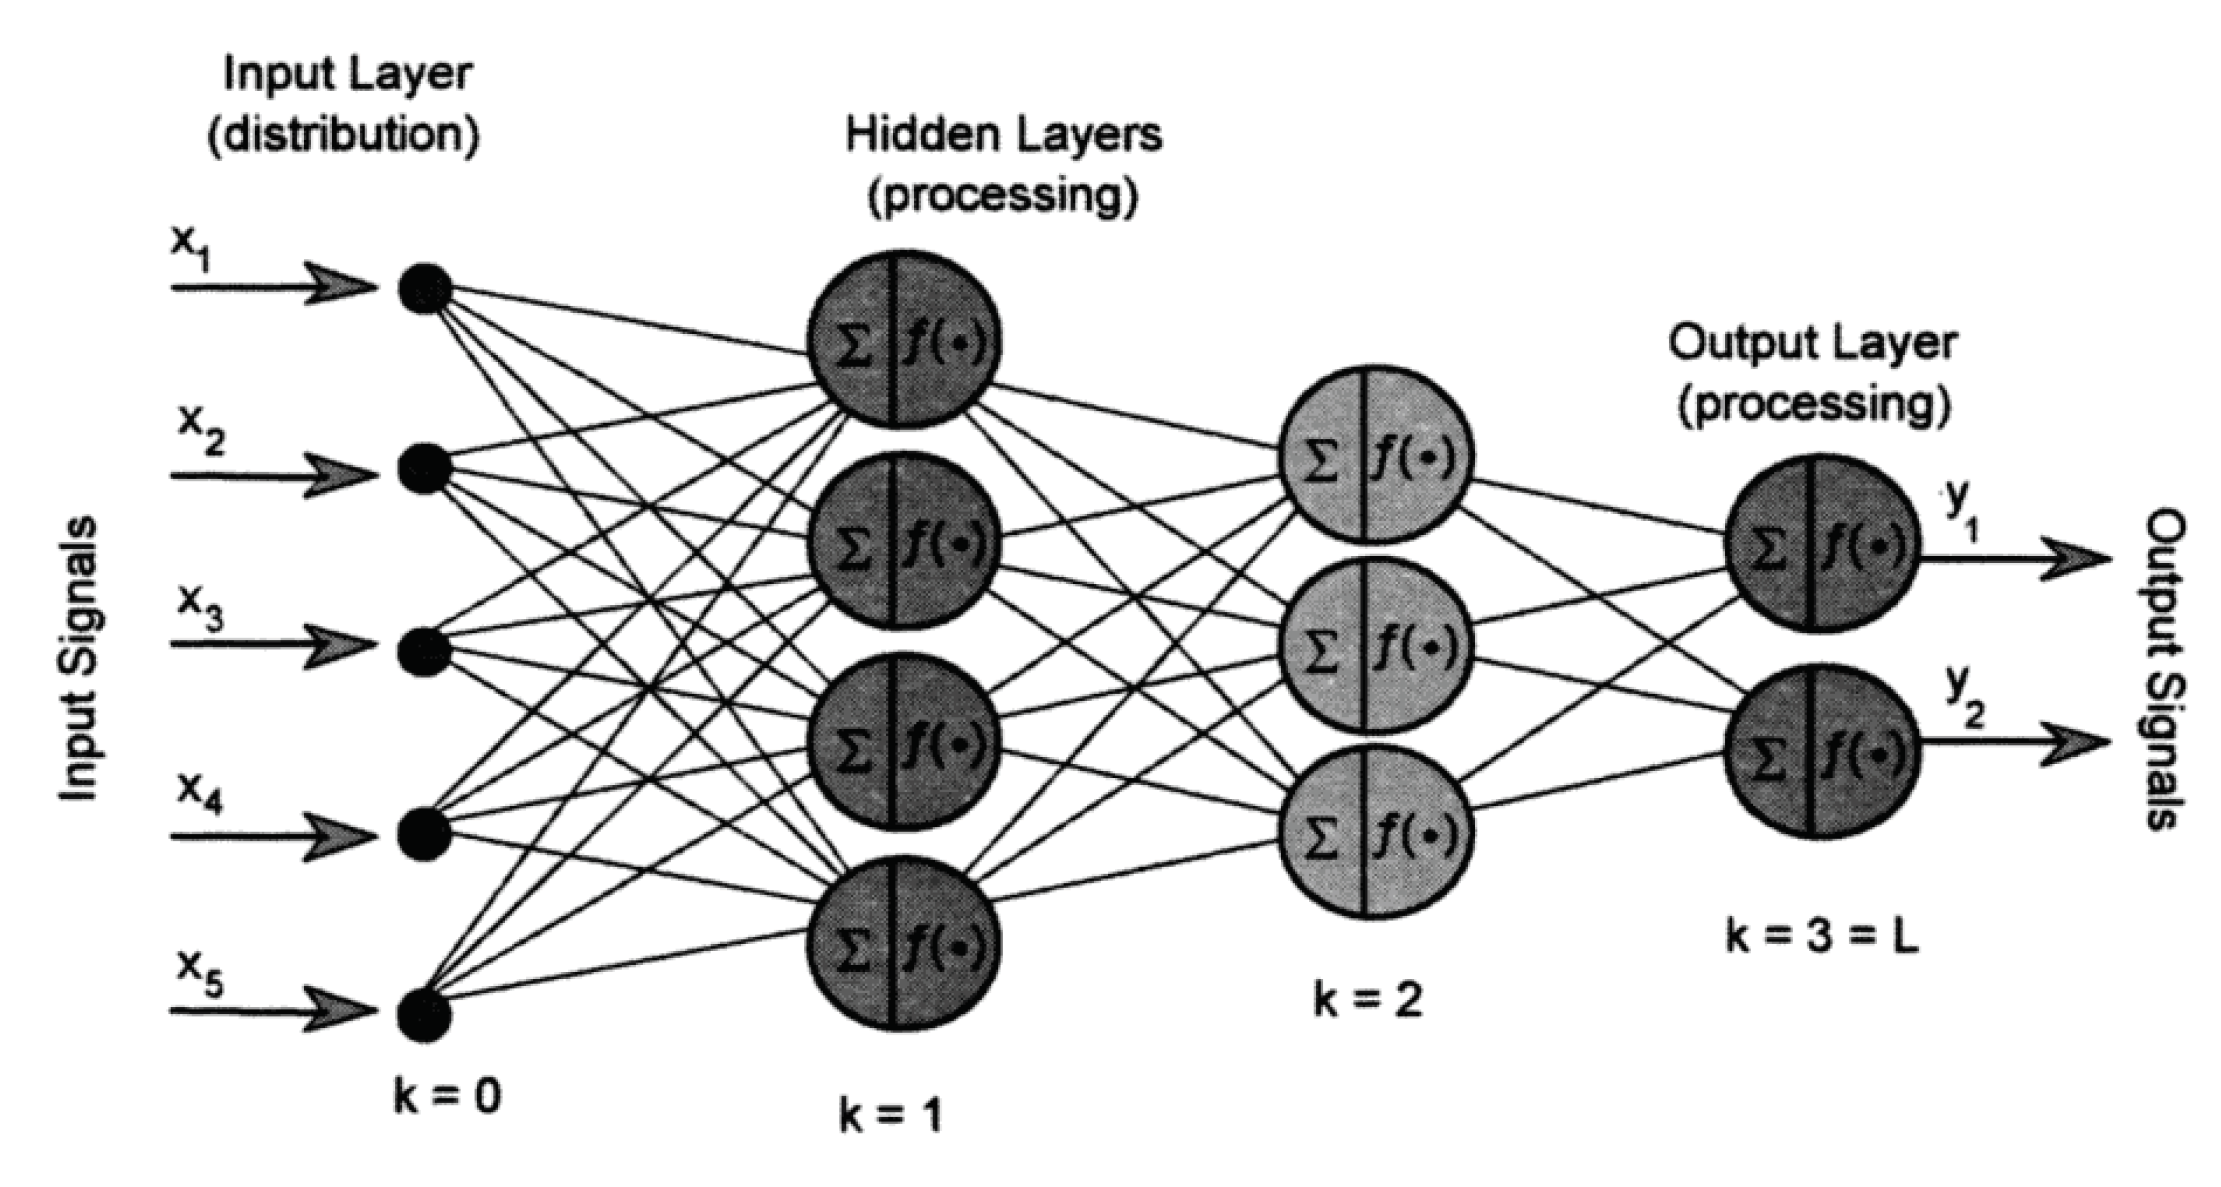
For several decades now, researchers have been focusing on artificial neural networks. The origin of this idea can be traced back to the early 1940s when [9] introduced a mathematical model of the brain capable of performing logical operations on neuron behaviour. This concept became the basis for artificial neural networks, and subsequent researchers have developed more advanced algorithms, including the perceptron algorithm created by [10]. Now, we can properly define the ANN. ANNs are sophisticated computer systems that replicate the functionality of biological neural networks. ANN has demonstrated remarkable versatility and efficiency and has been used to solve many world problems, such as image recognition. An illustration of a multilayer feed-forward artificial neural network can be observed in Figure 2. This network’s structure comprises three layers: the input, hidden, and output. A simple neural network can be defined as follows:
Equation 1 includes the activation function , which can be selected from various options such as sigmoid, relu, and others. The inputs or data points are denoted by , the bias is represented by , and the weights are shown as . In equation 3, the weighted sum is indicated by . Additionally, in equation 4, the threshold is represented by .
The utilisation of a multilayer feed-forward network is crucial for achieving precise predictions. This also helps prevent network loops [11]. ANN relies on a learning process that involves adjusting parameters like weights and thresholds to predict an output. Schmidhuber [12] categorised the learning process into two types: supervised, where the model is fed a target output, and unsupervised, where the model self-organises without any input target data. In order to train the network, we will utilise Forward Propagation and Backward Propagation, whose mathematical expressions are as follows:
Forward Propagation
where is the weighted sum and is the activation value for the neuron, which is computed by passing the weighted sum through a non-linear activation function. The activation function can be a sigmoid, ReLU, or tanh.
Backward Propagation
Here, we explain the mathematical process of back-propagation, which uses the gradient descent method to train the edge weights and biases in a neural network. If m and n are nodes anywhere in the network such that m is connected to n, so that is the variable for the weight of the connecting edge, we first compute , which is the error at an output node n.
Then we compute , the error at a hidden node m.
The subsequent rules are utilised to adjust the weights and biases of the network at any point during the training process.
To update the weight and biases at the input layer, we use the following update rules
Traning ANNs using Backward Propagation algorithm:
The backward propagation algorithm for training the ANNs is given as follows:
- We first configured our neural network’s weights and biases.
- Next, we calculate the loss by calculating the difference between the expected and actual output.
- Next, we traverse back through the network to compute the gradients of the loss concerning the weights and biases of each layer.
- Gradients are utilised to update the weights and biases in a manner that reduces the loss through an optimisation algorithm like stochastic gradient descent.
- We perform this procedure for several epochs until our network reaches a satisfactory solution.
Figure 2 shows the structure of multilayer feed-forward ANN.
Figure 2.
Structure of multilayer feed-forward ANN. (Source: [13])
Figure 2.
Structure of multilayer feed-forward ANN. (Source: [13])
2.2.2. Convolutional neural network
The other model we will consider is CNN. CNN is a neural network used in deep learning created in the 1990s. [14] introduced its basic architecture in their paper titled “Gradient-Based Learning Applied to Document Recognition.” This paper presented a more effective way of recognising handwritten digits using a convolutional neural network, which surpassed traditional machine learning methods. CNN effectively reduces network parameters and overfitting risks by processing input data through local connection and parameter sharing. Compared to traditional neural networks, convolutional neural networks have several advantages, including quick training speed, fault tolerance, and parallelism. A typical CNN structure comprises an input layer, a convolutional layer, a pooling layer, and a fully connected layer, as demonstrated in Figure 3 [15].
3. Variable Selection
Over-fitting can be a problem that is best avoided using a proper variable selection method. This paper will consider a Lasso (least absolute shrinkage and selection operator), which Tibshirani introduced [16]. Utilising the Lasso technique can significantly enhance training speed. Its ability to select variables and implement regularisation by reducing specific regression coefficients to zero makes it an efficient approach. Suppose we have a regression model with a response variable Y and predictors . The Lasso formulation is given as:
In the Lasso regression formula, Y represents the target vector, the input matrix will be denoted by X, is the vector of estimated coefficients, variable i represents the number of observations, m is the number of predictors, and is the regularisation parameter that determines the strength of the penalty on the coefficients’ absolute values. The goal of Lasso regression is to minimise the sum of squared errors between the predicted and true values by finding the optimal values of while ensuring that the absolute value of the sum of coefficients is less than or equal to a specific threshold determined by .
4. Metrics for Evaluating Forecasts
We will assess the effectiveness of our models and choose the most precise one by using the following metrics: MAE, RMAE, RMSE, RRMSE, and MASE. We will choose the model with the lowest values for these metrics. In the following section, we will provide the formulas for calculating these metrics:
In equations 6, 7, 8, and 9, the following variables are used: n denotes the count of observations, the value refers to the factual value of the observation, while refers to the projected value for the observation. In equation 10, n is the length of the time series, is the forecast error at time t, and is the actual value at time t (for ).
5. Empirical Results and Discussion
6. Exploratory Data Analysis
6.1. Data source
The research study will investigate three unique locations, each with distinct characteristics. The first location to be examined is Napier station, which can be found in the Western Cape. The second location, Noupoort, is in the Northern Cape; lastly, Upington is in the Northern Cape. These locations have varying weather conditions; Napier is in a coastal area, Noupoort is inland, and Upington is in a dry region. The information for these three places is sourced from the Wasa database, which is accessible at http://wasadata.csir.co.za/wasa/WASAData.
6.2. Locations
6.3. Data Characteristics
Based on our earlier discussions, we will be using 70% of the data for training, and the remaining 30% will be split equally between validation and testing. This means that the data for training will cover the period from October 1 2022, at 00:10 to October 22 2022, at 16:50, while the data for validation and testing will span from October 22 2022, at 17:00 to November 1 2022, at 00:00. Furthermore, the whole dataset has no missing values. Using this approach, we can ensure that our models are accurately trained and validated with the available data, ultimately leading to better insights and predictions. The wind speed is the response variable in this dataset, while the list of covariates is given in Appendix A.1.
6.4. Summary Statistics
All three datasets have 4464 observations and 23 columns. The tables labelled as 1, 3, and 4 provide a summary of statistics for the response variable and explanatory variables. These tables display the minimum value (Min), first quantile (Q1), median, mean, third quantile (Q3), maximum value (Max), skewness, and kurtosis. The wind speed on the Napier station ranged from a minimum of 0.2075 to a maximum of 18.1209, with an average of 8.1546, throughout the entire 31 days. The wind speed is positively skewed, with a skewness value of 0.0120. The kurtosis value is 2.2579, indicating a smaller peak than the normal distribution or a platykurtic curve. Explanatory variables on the Napier station such as Tair mean, Tair Max, Tair stdv, Tgrad mean, Tgrad min, Tgrad max, Tgrad max, Tgrad stdv, Pbaro stdv, RH mean, RH min, RH max, and RH stdv have a kurtosis of more than 3, indicating they follow a leptokurtic distribution.
Table 3 summarises the Noupoort station, which had a wind speed minimum of 0.7426 and a maximum of 17.3895, with a mean of 7.6568 throughout the period. Wind speed is positively skewed with a skewness value of 0.343, and the kurtosis value is 2.808, indicating a smaller peak than the normal distribution or a platykurtic curve. Explanatory variables on the Noupoort station, such as WS 62 stdv, Tair stdv, Tgrad mean, Tgrad min, Tgrad max, Tgrad max, Tgrad stdv, Pbaro max, Pbaro stdv, and RH stdv have a kurtosis of more than 3, indicating they follow a leptokurtic distribution.
Finally, Table 4 the Upington station had a wind speed minimum of 0.3693 and a maximum of 16.8912, with a mean of 5.7308 throughout the period, which shows the lowest numbers recorded compared to the other two stations. Wind speed is positively skewed with a skewness value of 0.0393 and a kurtosis value of 3.002, indicating a leptokurtic curve, which differs from the other two stations. Explanatory variables on the Upington station, such as WS 62 min, Tair mean, Tair min, and Tair max, have a kurtosis of less than 3, indicating they follow a platykurtic distribution.

Table 2.
Summary of statistics Napier station.
| Variables | Min | Q1 | Median | Mean | Q3 | Max | Kurtosis | Skewness |
|---|---|---|---|---|---|---|---|---|
| WS 62 mean | 0.2075 | 5.3707 | 8.0980 | 8.1546 | 10.7587 | 18.1209 | 2.2579 | 0.120 |
| lag1 | -3,672 | -0.3843 | -0,006 | 0.0013 | 10.3471 | 4.5360 | 3,2753 | 0.4164 |
| lag2 | -5.9052 | -0.5083 | -0.0124 | 0.0024 | 0.5018 | 5.080 | 0.3050 | 2.8335 |
| noltrend | 0.4194 | 5.4067 | 8.1558 | 8.0186 | 10.6570 | 15.6493 | -0.8405 | 0.1334 |
| WS 62 min | 0.2075 | 3.9265 | 5.9410 | 6.0726 | 8.2654 | 13.8439 | 2.2359 | 0.1209 |
| WS 62 max | 0.2075 | 6.7158 | 9.8150 | 9.9529 | 12.6043 | 21.2820 | 2.3448 | 0.1505 |
| WS 62 stdv | 0.0000 | 0.4208 | 0.7302 | 0.7565 | 1.0407 | 2.1862 | 2.4622 | 0.396 |
| Tair mean | 0.05 | 12.67 | 14.14 | 14.29 | 15.66 | 27.54 | 6.5815 | -0.250 |
| Tair min | -0.96 | 12.55 | 14.00 | 14.12 | 15.44 | 26.32 | 6.8373 | -0.364 |
| Tair max | 0.33 | 12.80 | 14.35 | 14.49 | 15.84 | 28.52 | 6.4376 | -0.156 |
| Tair stdv | 0.0080 | 0.0352 | 0.0544 | 0.0859 | 0.1056 | 6.2100 | 1070.9 | 25.404 |
| Tgrad mean | -1.7170 | -0.9450 | -0.3370 | -0.3394 | 0.0822 | 5.3090 | 8.0381 | 1.464 |
| Tgrad min | -2.3590 | -1.1870 | -0.4390 | -0.5158 | -0.0100 | 4.5340 | 5.2743 | 0.747 |
| Tgrad max | -1.4360 | -0.7240 | -0.2960 | -0.1777 | 0.2050 | 6.3590 | 11.9340 | 2.209 |
| Tgrad stdv | 0 | 0.0310 | 0.0680 | 0.0869 | 0.1230 | 1.6610 | 40.6393 | 3.292 |
| Pbaro mean | 975.5 | 981.9 | 984.3 | 984.3 | 986.8 | 992.5 | 2.5188 | -0.1719 |
| Pbaro min | 975.4 | 981.7 | 984.0 | 984.1 | 986.6 | 992.3 | 2.5067 | -0.160 |
| Pbaro max | 975.6 | 982.1 | 984.5 | 984.4 | 987.0 | 994.1 | 2.5307 | -0.175 |
| Pbaro stdv | 0.0345 | 0.0517 | 0.0615 | 0.0688 | 0.0768 | 0.4847 | 40.7974 | 4.465 |
| RH mean | 0.3731 | 67.1750 | 80.00 | 76.0780 | 90.600 | 100.0 | 6.5481 | -1.697 |
| RH min | 0 | 64.34 | 78.03 | 72.65 | 89.70 | 100.00 | 5.2239 | -1.568 |
| RH max | 0.4761 | 69.7800 | 82.6000 | 78.9211 | 92.8000 | 100.00 | 7.8746 | -1.934 |
| RH stdv | 0.0073 | 0.1532 | 0.4781 | 2.0726 | 0.9190 | 49.8000 | 29.5516 | 5.234 |
Table 3.
Summary of statistics Noupoort station.
| Variables | Min | Q1 | Median | Mean | Q3 | Max | Kurtosis | Skewness |
|---|---|---|---|---|---|---|---|---|
| WS 62 mean | 0.7426 | 5.4502 | 7.5723 | 7.6568 | 9.5766 | 17.3895 | 2.8084 | 0.343 |
| lag1 | -6,7801 | -0,4461 | -0.0210 | 0.0007 | 0.4089 | 8.8909 | 8.3133 | 0.6035 |
| lag2 | -6.7107 | -0.6059 | -0.0434 | 0.0012 | 0.5449 | 10.2386 | 6.2678 | 0.5044 |
| noltrend | 2.3325 | 5.5389 | 7.5344 | 7.6575 | 9.4338 | 15.3806 | -0.2665 | 0.3920 |
| WS 62 min | 0.2148 | 3.9322 | 5.4812 | 5.6039 | 7.0301 | 14.1553 | 2.9473 | 0.129 |
| WS 62 max | 1.454 | 6.720 | 9.199 | 9.672 | 11.987 | 23.139 | 2.9325 | 0.521 |
| WS 62 stdv | 0.1252 | 0.4461 | 0.7215 | 0.8142 | 1.0776 | 4.1196 | 4.9796 | 1.140 |
| Tair mean | 4.46 | :13.25 | 16.36 | 16.42 | 19.91 | 27.44 | 2.5718 | -0.221 |
| Tair min | 4.37 | 13.00 | 16.14 | 16.21 | 19.66 | 27.27 | 2.5529 | -0.207 |
| Tair max | 4.57 | 13.53 | 16.61 | 16.67 | 20.12 | 27.74 | 2.5877 | -0.231 |
| Tair stdv | 0.01190 | 0.0526 | 0.0859 | 0.1169 | 0.1384 | 2.7570 | 107.6253 | 7.994 |
| Tgrad mean | -1.5090 | -0.8410 | -0.3015 | -0.0134 | 0.5712 | 8.6500 | 10.5456 | 2.000 |
| Tgrad min | -2.0680 | -1.0760 | -0.4370 | -0.2633 | 0.3460 | 7.5830 | 8.5134 | 1.535 |
| Tgrad max | -1.2180 | -0.6500 | -0.1530 | 0.2275 | 0.8460 | 9.2700 | 12.3579 | 2.321 |
| Tgrad stdv | 0.0000 | 0.0690 | :0.1130 | 0.1334 | 0.1650 | 2.4420 | 99.0035 | 7.333 |
| Pbaro mean | 815.8 | 821.4 | 822.9 | 822.8 | 824.6 | 828.2 | 2.8536 | -0.400 |
| Pbaro min | 815.3 | 821.2 | 822.7 | 822.7 | 824.4 | 828.1 | 2.8750 | -0.401 |
| Pbaro max | 816.1 | 821.6 | 823.1 | 823.1 | 824.9 | 834.6 | 3.0576 | -0.334 |
| Pbaro stdv | 0.0386 | 0.0572 | 0.0660 | 0.0748 | 0.0819 | 0.7640 | 113.7876 | 8.054 |
| RH mean | 4.63 | 26.11 | 48.02 | 50.97 | 73.38 | 100.00 | 1.8856 | 0.210 |
| RH min | 4.337 | 24.625 | 45.320 | 49.124 | 70.748 | 100.00 | 1.9561 | 0.286 |
| RH max | 4.88 | 27.92 | 50.30 | 52.73 | 75.86 | 100.00 | 1.8278 | 0.144 |
| RH stdv | 0.0137 | 0.2652 | 0.5501 | 0.8811 | 1.0413 | 18.6200 | 49.4307 | 5.359 |
Table 4.
Summary of statistics Upington station.
| Variables | Min | Q1 | Median | Mean | Q3 | Max | Kurtosis | Skewness |
|---|---|---|---|---|---|---|---|---|
| WS 62 mean | 0.3693 | 3.9306 | 5.6373 | 5.7308 | 7.3684 | 16.8912 | 3.002 | 0.393 |
| lag1 | -4.1385 | -0.4724 | -0.0062 | -0.0000 | 0.4537 | 7.7245 | 4.3099 | 0.2771 |
| lag2 mean | -6.8561 | -0.6306 | 0 | 0.0000 | 0.6216 | 10.2096 | 5.1082 | 0.2813 |
| noltrend | 1.2370 | 4.2517 | 5.6724 | 5.7299 | 7.1200 | 12.2634 | -0.2640 | 0.2997 |
| WS 62 min | 0.1891 | 2.0538 | 3.9186 | 3.9350 | 5.4726 | 11.9993 | 2.411 | 0.252 |
| WS 62 max | 0.8106 | 5.4726 | 7.3373 | 7.5899 | 9.2021 | 24.1203 | 4.428 | 0.796 |
| WS 62 stdv | 0.1193 | 0.3996 | 0.6645 | 0.7589 | 1.0276 | 4.7676 | 6.229 | 1.264 |
| Tair mean | 11.20 | 22.72 | 26.93 | 26.55 | 30.72 | 37.29 | 2.475 | -0.289 |
| Tair min | 11.01 | 22.36 | 26.59 | 26.24 | 30.39 | 36.98 | 2.455 | -0.271 |
| Tair max | 11.55 | 23.33 | 27.56 | 27.16 | 31.36 | 38.05 | 2.491 | -0.299 |
| Tair stdv | 0.0731 | 0.1069 | 0.1373 | 0.1704 | 0.1939 | 2.117 | 40.824 | 4.423 |
| Tgrad mean | -1.5270 | -0.8290 | 0.0760 | 0.8828 | 2.0688 | 11.2300 | 4.317 | 1.313 |
| Tgrad min | -2.375 | -1.107 | -0.066 | 0.576 | 1.712 | 10.960 | 4.241 | 1.249 |
| Tgrad max | -1.183 | -0.571 | 0.236 | 1.169 | 2.391 | 11.440 | 4.321 | 1.333 |
| Tgrad stdv | 0.0090 | 0.0750 | 0.1280 | 0.1588 | 0.1930 | 1.9500 | 21.063 | 3.091 |
| Pbaro mean | 907.8 | 913.8 | 915.2 | 915.2 | 916.9 | 921.4 | 3.035 | -0.243 |
| Pbaro min | 907.8 | 913.5 | 915.1 | 915.0 | 916.6 | 921.2 | 3.041 | -0.239 |
| Pbaro max | 908.2 | 914.0 | 915.4 | 915.4 | 917.1 | 921.7 | 3.063 | -0.233 |
| Pbaro stdv | 0.0559 | 0.0818 | 0.0895 | 0.0932 | 0.0991 | 0.3305 | 20.372 | 2.981 |
| RH mean | 3.85 | 9.94 | 17.18 | 22.40 | 31.01 | 93.00 | 4.696 | 1.342 |
| RH min | 3.599 | 9.527 | 16.510 | 21.691 | 30.225 | 92.300 | 4.745 | 1.352 |
| RH max | 4.019 | 10.370 | 17.740 | 23.130 | 32.072 | 93.300 | 4.667 | 1.340 |
| RH stdv | 0.0314 | 0.1117 | 0.2061 | 0.3546 | 0.3995 | 7.0850 | 43.169 | 5.119 |
7. Data Visualisation
Figure 4 displays time series plots of the mean wind speed at Napier, Noupoort, and Upington stations. It is evident from these plots that each station has its unique pattern, but they all exhibit a repeating pattern over time. This pattern indicates that the data may contain seasonality and stationarity in all stations. We conducted a KPSS test at the Napier, Noupoort, and Upington stations to confirm stationality . The test statistics for Napier and Noupoort are 1.0191 and 1.0761, respectively, greater than the critical value of 0.463 at a 5% significance level. Therefore, we reject the null hypothesis and conclude that wind speed is not stationary at Napier and Noupoort stations. The test statistic for Upington is 0.2858, less than 0.463 at a 5% significance level. Therefore, we fail to reject the null hypothesis and conclude that wind speed at this station is stationary.
It is necessary to make the data from Napier and Noupoort stations stationary. Stationary time series data provides stability in statistical properties and simplifies the detection of patterns and relationships, leading to more reliable results. The data from the stations was differentiated once, and after the KPSS test was carried out again, the test statistics for Napier and Noupoort were 0.0098 and 0.0043, respectively. Both are less than the critical value of 0.463 at the 5% significance level. Thus, we fail to reject the null hypothesis and conclude that the wind speed for both stations is stationary. The differenced data will be utilised for model training and testing.
8. Variable Selection
Tables 5(a), 5(b), and 5(c) give a summary of the coefficients of the variables which were selected by the Lasso regression method for each station. These coefficients indicate the estimated effect of each selected variable on the predicted wind speed. Variables with non-zero coefficients are considered significant and influential in predicting wind speed, while variables with zero coefficients are considered less significant and are not included in the model.

8.1. Training Loss for ANN Model for All Stations
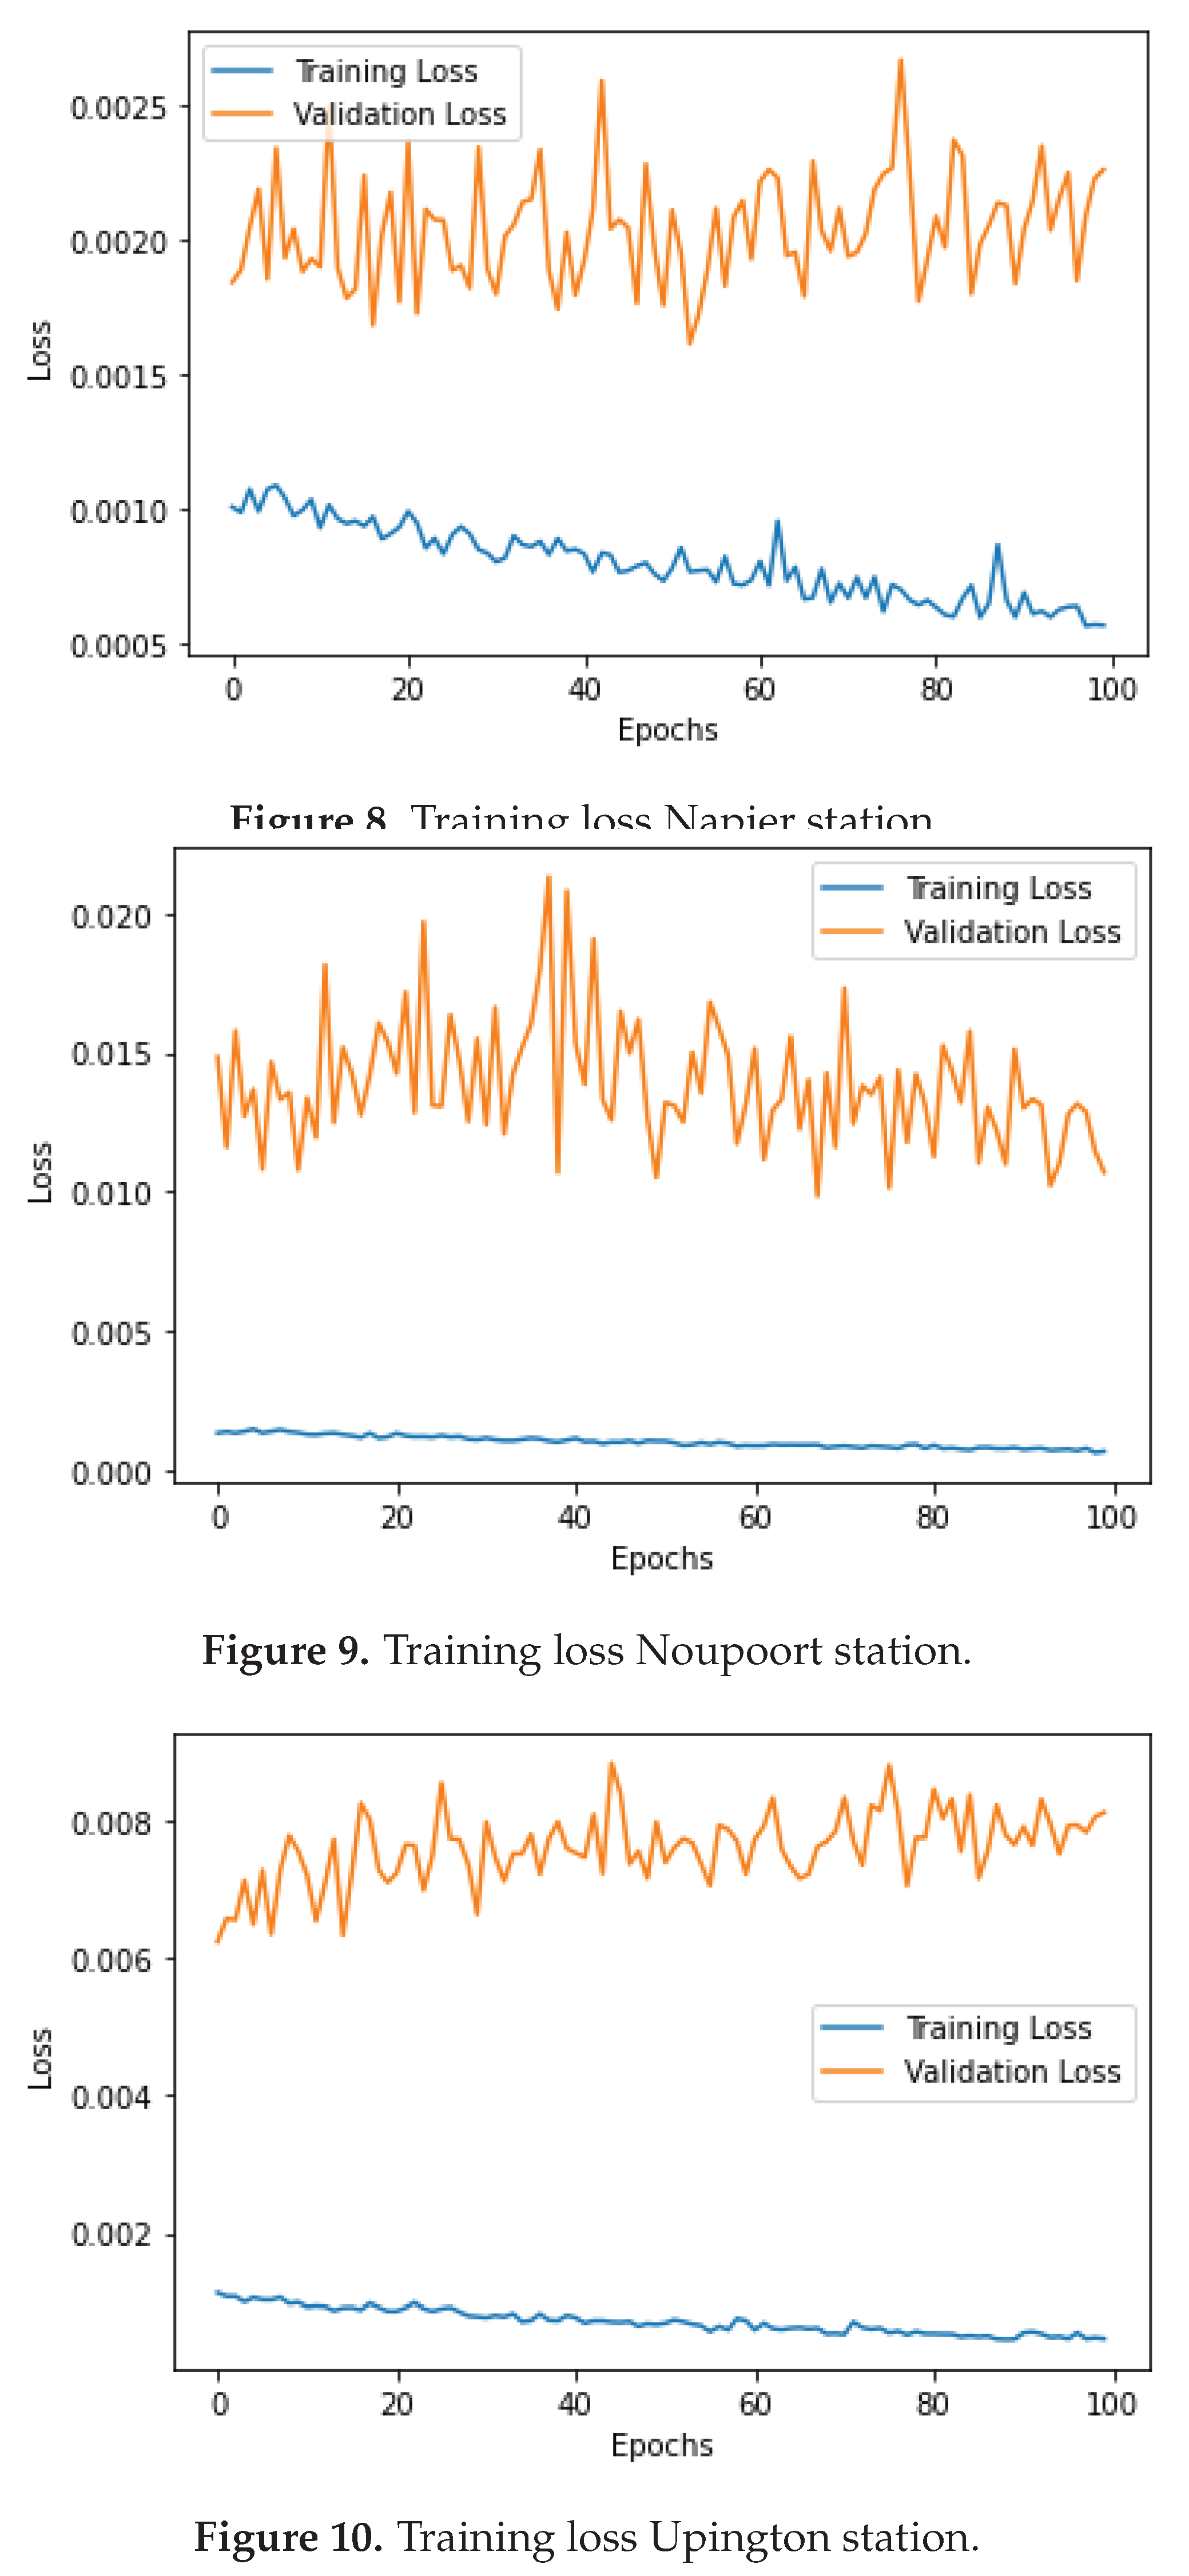
Figure 11 show all three stations’ training and validation loss plots. Training and validation loss plots provide insights into a model’s performance during training. Decreasing training loss indicates improved fit to training data, but increasing validation loss suggests over-fitting, where the model struggles to generalise. Figure 8 shows the loss during training at Napier station. The training loss is decreasing, and the validation loss is steady, suggesting no overfitting. The same can be said for the Noupoort and Upington shown in Figure 9 and Figure 10, respectively.
Figure 11.
Training and validation loss for three stations.
8.2. Forecast Accuracy for ANN Model
The performance of an ANN model across three different locations was evaluated using error metrics, as shown in Table 6. Each station’s test set was used to calculate these metrics, which provide insight into the model’s performance. Notably, all stations’ MASE values indicate that the ANN model performs similarly to a naive model, with each MASE value being exactly 1. This suggests that the model is less accurate than the simple baseline model. Regarding other error metrics, there are differences in performance across the stations. The Upington station has the lowest MAE and RMAE values, with scores of 5.851 and 2.411, respectively, demonstrating better performance when compared to the other two stations. On the other hand, the Noupoort station has the highest MAE and RMAE values, with scores of 8.8844 and 2.980, respectively. Regarding RMSE, the Upington station again showcases better performance, achieving the lowest RMSE of 6.142 but recording the highest RRMSE with a value of 11.096. Meanwhile, the Noupoort station has the lowest RRMSE among the three stations, with a value of 9,928, and Napier station displays the highest RMSE value of 9.343.
In conclusion, although the MASE values show similarities in performance between the ANN models and a naive model, a closer analysis of the error metrics reveals variations in performance among the stations. The Upington outperform Napier and Noupoort; the Upington station consistently demonstrates superior performance with lower MAE, RMAE, and RMSE values.
9. CNN Model Training and Results
After using the Lasso method to select variables, a CNN model was trained on the normalised dataset. The same min-max normalisation method was used, and the data split was done in the same way as in ANN. However, another step was taken to fit the data into the CNN model. This involved segmenting the time series into fixed-length windows using a sliding window approach to capture sequential patterns. Each window was considered a separate channel, similar to the multi-channel structure of an image. The data within each window was organised into rows and columns, effectively converting the temporal progression into spatial dimensions. These windows were consolidated into a three-dimensional matrix, where each instance corresponded to a window, and the dimensions defined the rows, columns, and channels. Ultimately, this reshaped matrix served as the input to the CNN, allowing the network to decipher spatio-temporal relationships within the time series data.
Napier Station
Figure 12 shows the final plot of the CNN model’s predictions on the test dataset. The model’s predictive capabilities have been validated as it successfully anticipates the data. Additionally, the plot extends into the future, displaying predictions for the next 60 minutes. This forward projection indicates that the model has the potential to forecast future values with reasonable accuracy.
Figure 13, Figure 14 show the Noupoort and Upington CNN model on the test set. These two plots confirm the observations that were made at Napier station. The CNN model accurately predicts data spikes, setting it apart from the ANN model. Additionally, the CNN model’s proficiency in forecasting unseen data, including periods of volatility, is highlighted by predictions on the test set.
Upington Station
Noupoort Station
9.1. Training Loss for CNN Model for All Stations
Figure 18 shows all three stations’ training and validation loss. Looking at Napier station Figure 15, the training loss and validation are steady with few spikes around the tenth and Twentieth epoch. This again is observed at the remaining stations, Noupoort station and Upington station, shown in Figure 16 and Figure 17, respectively.
9.2. Forecast Accuracy for CNN Model
Table 7 presents the results of assessing the accuracy of the CNN model using the same metrics as the ANN model. The MASE values indicate that the CNN model performs better than the naive model, with all values below 1. This means the CNN model’s predictions are more accurate than the baseline model. Napier performed the best among the stations, with a low MAE of 0.635 and a remarkably low RMAE of 0.079. On the other hand, Noupoort had the highest MAE and RMAE, with values of 2.564 and 0.333, respectively. Looking at RMSE and RRMSE, the Napier station performed the best, with the lowest values of 0.805 and 0.100, respectively. In contrast, Noupoort station had the highest RMSE value of 2.727 and an elevated RRMSE value of 0.354.
The CNN model has shown better accuracy than the naive model. This is reflected in the MASE values that remain consistently below 1. Out of all the stations evaluated, the Napier station has consistently demonstrated superior performance across all metrics. This indicates that the Napier station is the best-performing station for the CNN model.
10. Discussion
Wind speed is predicted using two machine learning models in this study. The models used are ANN and CNN. These models were compared to how they performed in three different locations. The dataset was from WASA and covered the period from October 1, 2022, to November 1, 2022.
With the help of descriptive statistics and formal tests, it was discovered that wind speed is not stationary at two locations, Napier and Noupoort stations, and the last station was stationary, which is Upington. Again, with the help of further testing, it was discovered that wind speed is normally distributed in all three locations. Furthermore, it is shown that wind speed in all three stations is strongly positively correlated with wind speed minimum and wind speed maximum.
Two machine learning models were used across three weather stations to assess their effectiveness in predicting wind speeds under varying weather conditions. The training began with the designated datasets, and hyperparameter tuning was conducted using gradient ascent to identify the optimal hyperparameters. The results indicate that the Convolutional Neural Network (CNN) consistently outperforms the other model at all stations. This superiority is primarily attributed to the Mean Absolute Scaled Error (MASE) consistently registering values below 1, signifying that it performs better than the baseline model. In contrast, the Artificial Neural Network (ANN) model performs similarly to the baseline model. Notably, it faces challenges predicting wind speeds in coastal and inland areas, such as Napier and Noupoort stations.
11. Conclusion
As the world struggles with the urgent need to move away from fossil fuels towards renewable energy sources, such as wind and others, researching and improving the reliability and accuracy of these alternatives becomes important. This study highlights the significance of using advanced machine learning models, specifically comparing Artificial neural networks (ANN) and Convolutional neural networks (CNN), in predicting wind speed accurately across different geographical locations and weather patterns. Even though both the CNN and ANN models exhibited exceptional accuracy in predicting wind speed at Napier Station and Upington Station, the findings still strongly suggest that the CNN model may be a more reliable model for wind speed prediction across different weather conditions.
Author Contributions
“Conceptualization, VRR. and CS.; methodology, VRR and CS; software, VRR; validation, VRR, CS and TR; formal analysis, VRR; investigation, VRR; data curation, VRR; writing—original draft preparation, VRR; writing—review and editing, VRR, CS and TR; visualization, VRR; supervision, CS and TR; project administration, CS and TR; funding acquisition, VRR. All authors have read and agreed to the published version of the manuscript.
Funding
This research was funded by the DST-CSIR National e-Science Postgraduate Teaching and Training Platform (NEPTTP) http://www.escience.ac.za/.
Institutional Review Board Statement
Not applicable.
Informed Consent Statement
Not applicable.
Data Availability Statement
The data were obtained from the Wind Atlas South Africa website http://wasadata.csir.co.za/wasa1/WASAData.
Acknowledgments
The support of the DST-CSIR National e-Science Postgraduate Teaching and Training Platform (NEPTTP) towards this research is hereby acknowledged. Opinions expressed and conclusions arrived at are those of the authors and are not necessarily to be attributed to the NEPTTP. In addition, the authors thank the anonymous reviewers for their helpful comments on this paper.
Conflicts of Interest
The authors declare no conflict of interest. The funders had no role in the study’s design, in the collection, analyses, or interpretation of data, in the writing of the manuscript, or in the decision to publish the results.
Abbreviations
The following abbreviations are used in this manuscript:
| ANN | Artificial Neural Network |
| CNN | Convolutional neural network |
| WASA | Wind atlas for South Africa |
| WWEA | World Wind Energy Association |
| ANFIS | Adaptive Neuro-Fuzzy Inference |
| ARMA | Autoregressive–moving-average |
| BP | Backpropagation |
| RBF | Radial Basis Function |
| WMO | World Meteorological Organization |
| KPSS | Kwiatkowski-Phillips-Schmidt-Shin |
| Lasso | Least Absolute Shrinkage and Selection Operator |
| LSTM | long short-term memory networks |
| MAE | Mean Absolute Error |
| RMAE | Relative Absolute Percentage Error |
| RMSE | Root Mean Squared Error |
| RRMSE | Relative Root Mean Square Error |
| MASE | Mean Absolute Scaled Error |
Appendix A
Appendix A.1. List of covariates used in the study
- lag1 - This variable represents the first lag of the wind speed, which is derived from historical wind speed data. It serves as one of the predictors or explanatory variables in the analysis, potentially indicating the effect of past wind speed on the current wind speed.
- lag2 - Similar to lag1, this variable represents the second lag of the wind speed, derived from historical data. It’s another predictor variable used to examine the influence of wind speed in the previous time period on the current wind speed.
- noltrend - The noltrend variable is derived from a cubic regression spline model. In this context, it likely captures the trend component of the data after removing any non-linear patterns through regression splines.
- WS_62_min - represents the minimum wind speed recorded at the stations. Wind speed measures how fast the air is moving at a particular location. In this case, it specifically refers to the wind speed measured at a height of 62 meters above the ground.
- WS_62_max -represents the maximum wind speed recorded at the stations.
- WS_62_stdv - refers to the standard deviation of wind speeds measured 62 meters above the ground at the stations.
- Tair_mean represents the stations’ mean (average) air temperature. Air temperature refers to the measure of the warmth or coldness of the air in a particular location
- Tair_min - represents the minimum air temperature at the stations.
- Tair_max - represents the highest air temperature ever recorded at the stations.
- Tair_stdv - represents the standard deviation of air temperature at the stations. The standard deviation is a statistical measure that quantifies the amount of variability or dispersion in a set of values
- Tgrad_mean -this represents the average temperature gradient at the stations. Temperature gradient reflects the speed of temperature alteration about distance or height.
- Tgrad_min - represents the minimum temperature gradient at the stations.
- Tgrad_max -represents the highest temperature gradient recorded at the stations.
- Tgrad_stdv - represents the standard deviation of the temperature gradient at the stations. The variable helps to understand how much the temperature gradients vary from the average value.
- Pbaro_mean - represents the average barometric pressure at the Napier station. Barometric pressure, also called atmospheric pressure, is the force exerted by the weight of the air above a specific area.
- Pbaro_min - represents the lowest barometric pressure recorded at the stations during the day.
- Pbaro_max - represents the highest barometric pressure recorded at the station during the day.
- Pbaro_stdv - represents the variation or dispersion in the barometric pressure values at the station.
- RH_mean represents the stations’ mean (average) relative humidity. Relative humidity measures the amount of moisture in the air relative to the maximum amount of moisture the air can hold at a given temperature.
- RH_min - represents the minimum relative humidity at the stations. Relative humidity is typically expressed as a percentage (%), with 100% indicating that the air is saturated with moisture and lower percentages indicating drier air
- RH_max - represents the highest relative humidity recorded at the stations during the day.
- RH_stdv - represents the variation or dispersion in the relative humidity values at the stations.
References
- Wiser, R.; Lantz, E; Mai, T.; Zayas, J.; DeMeo, E.; Eugeni, E.; Lin-Powers, J.; Tusing, R. Wind vision: A new era for wind power in the united states. The Electricity Journal 2015, 28(9), 120–132. [CrossRef]
- Klein, R.; Celik, T. The Wits Intelligent Teaching System: Detecting student engagement during lectures using Convolutional Neural Networks. In 2017 IEEE International Conference on Image Processing (ICIP) 2017, 2856–2860. [CrossRef]
- Li, G.; Shi, J. On comparing three artificial neural networks for wind speed forecasting. Applied Energy 2010, 87(7), 2313–2320. [CrossRef]
- Mathew, S. Wind energy: Fundamentals, resource analysis and economics 2006, volume 1, Springer Berlin, Heidelberg. [CrossRef]
- Antor, A.F.; Wollega, E.D. Comparison of machine learning algorithms for wind speed prediction. In Proceedings of the International Conference on Industrial Engineering and Operations Management 2020, 857–866. https://dx.doi.org/10.1088/1742-6596/1618/6/062060.
- Shen, Z.; Fan, X.; Zhang, L.; Yu, H. Wind speed prediction of unmanned sailboat based on CNN and LSTM hybrid neural network. Ocean Engineering 2022, 254, 111352. [CrossRef]
- Chen, Q.; Folly, K.A. Comparison of three methods for short-term wind power forecasting. In 2018 International Joint Conference on Neural Networks, IEEE 2018, 1–8. [CrossRef]
- Milligan, M.; Schwartz, M.; Wan, Y.-h. Statistical wind power forecasting models: Results for us wind farms. Technical report, National Renewable Energy Laboratory 2003. 1–11. https://www.nrel.gov/docs/fy04osti/35087.pdf.
- McCulloch, W.S., Pitts, W. A logical calculus of the ideas immanent in nervous activity. Bulletin of Mathematical Biophysics 1943, 5, 115–133. [CrossRef]
- Rosenblatt, F. (1958). The perceptron: A probabilistic model for information storage and organization in the brain. Psychological Review 1958, 65(6), 386–408. [CrossRef]
- Daniel, L.O.; Sigauke, C.; Chibaya, C.; Mbuvha, R. Short-term wind speed forecasting using statistical and machine learning methods. Algorithms 2020, 13(6), 132. [CrossRef]
- Schmidhuber, J. Deep learning in neural networks: An overview. Neural networks 2015, 61, 85–117. [CrossRef]
- Priddy, K.L.; Keller, P.E. Artificial neural networks: an introduction 2005, volume 68, SPIE press. [CrossRef]
- LeCun, Y.; Bottou, L.; Bengio, Y.; Haffner, P. Gradient-based learning applied to document recognition. Proceedings of the IEEE 1998, 86(11) 2278–2324. [CrossRef]
- Wang, Z.; Zhang, J.; Zhang, Y.; Huang, C.; Wang, L. Short-term wind speed forecasting based on information of neighboring wind farms. IEEE Access 2020, 8, 16760–16770. [CrossRef]
- Tibshirani, R. Regression shrinkage and selection via the lasso. Journal of the Royal Statistical Society: Series B (Methodological) 1996, 58(1), 267–288. https://www.jstor.org/stable/2346178.
Figure 3.
Structure of CNN. (Source: [15])
Figure 3.
Structure of CNN. (Source: [15])
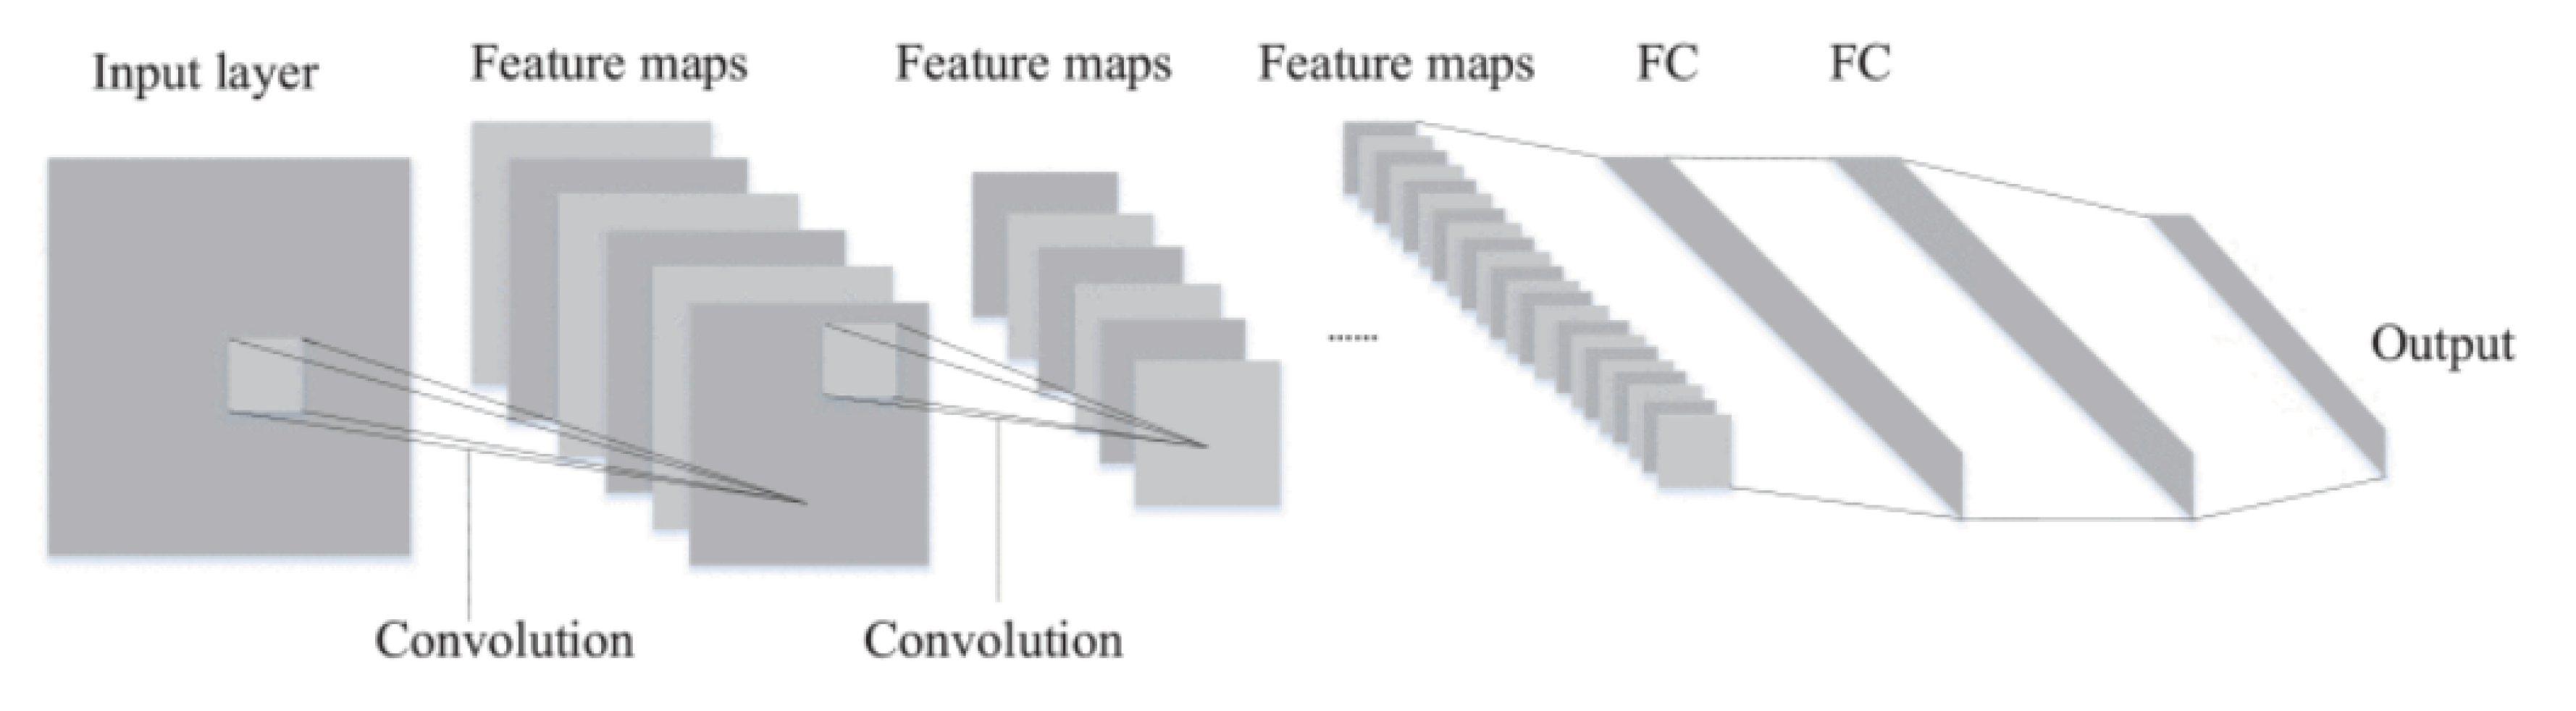
Figure 4.
Top panel:Time series plot of wind speed mean on Napier station. Middle panel: Time series plot of wind speed mean on Noupoort station. Bottom panel: Time series plot of wind speed mean on Upington station.
Figure 4.
Top panel:Time series plot of wind speed mean on Napier station. Middle panel: Time series plot of wind speed mean on Noupoort station. Bottom panel: Time series plot of wind speed mean on Upington station.
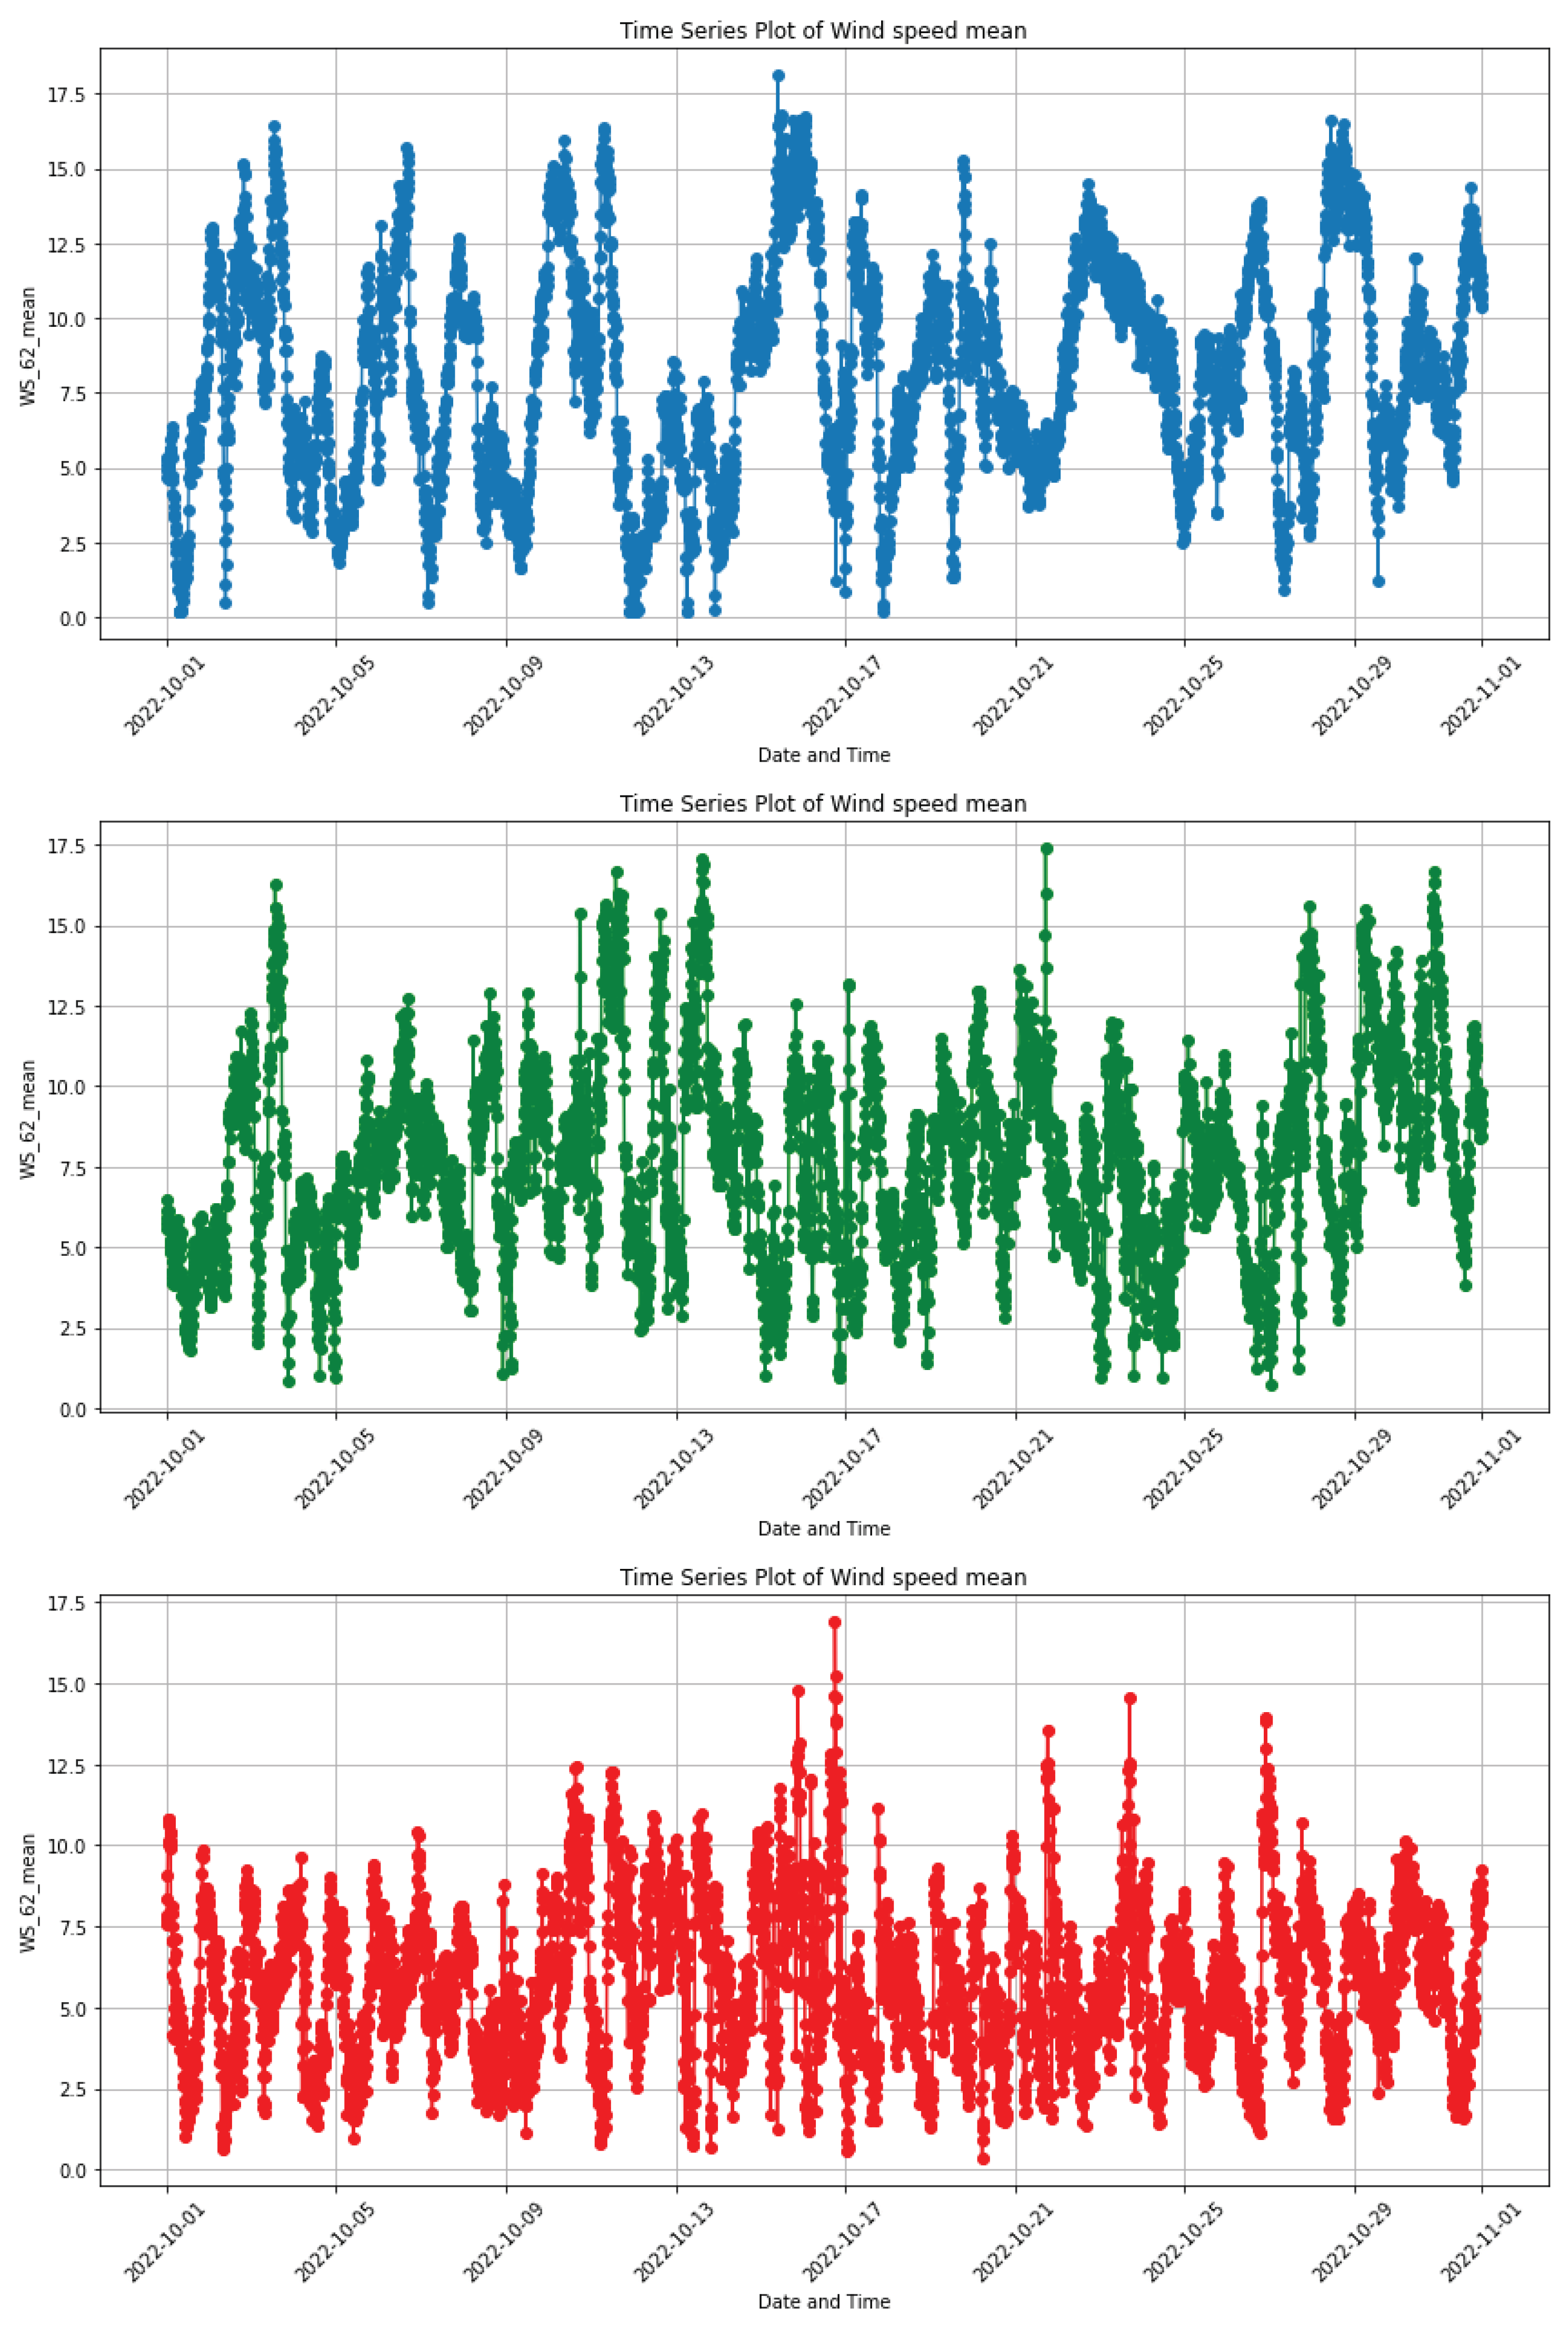
Figure 5.
Distribution of daily average wind speed at 62 metres at Napier station.
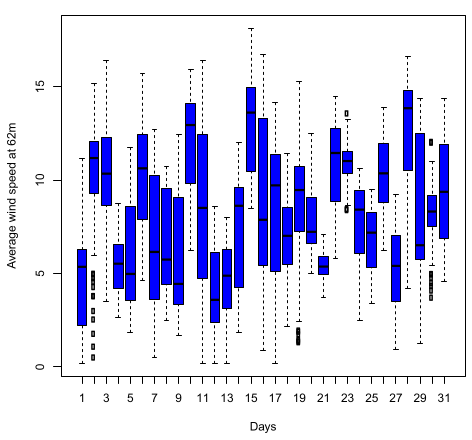
Figure 6.
Distribution of daily average wind speed at 62 metres at Noupoort station.
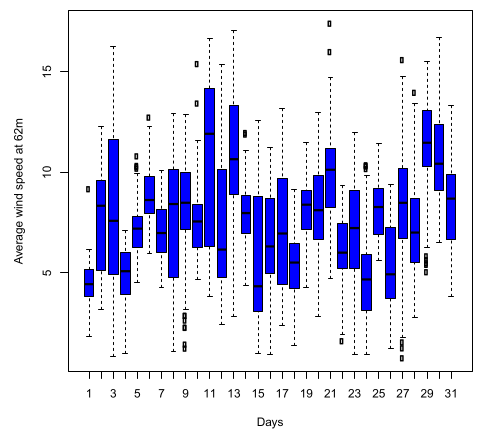
Figure 7.
Distribution of daily average wind speed at 62 metres at Upington station.
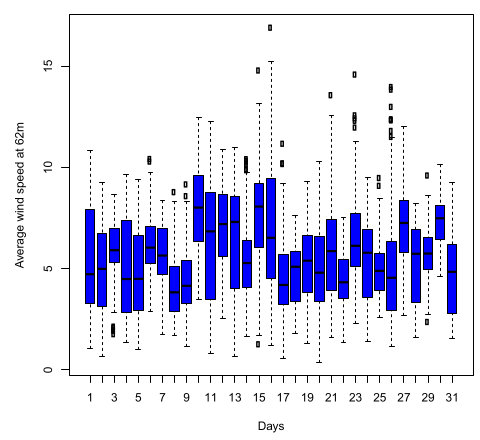
Figure 12.
Test set and future prediction Napier station.
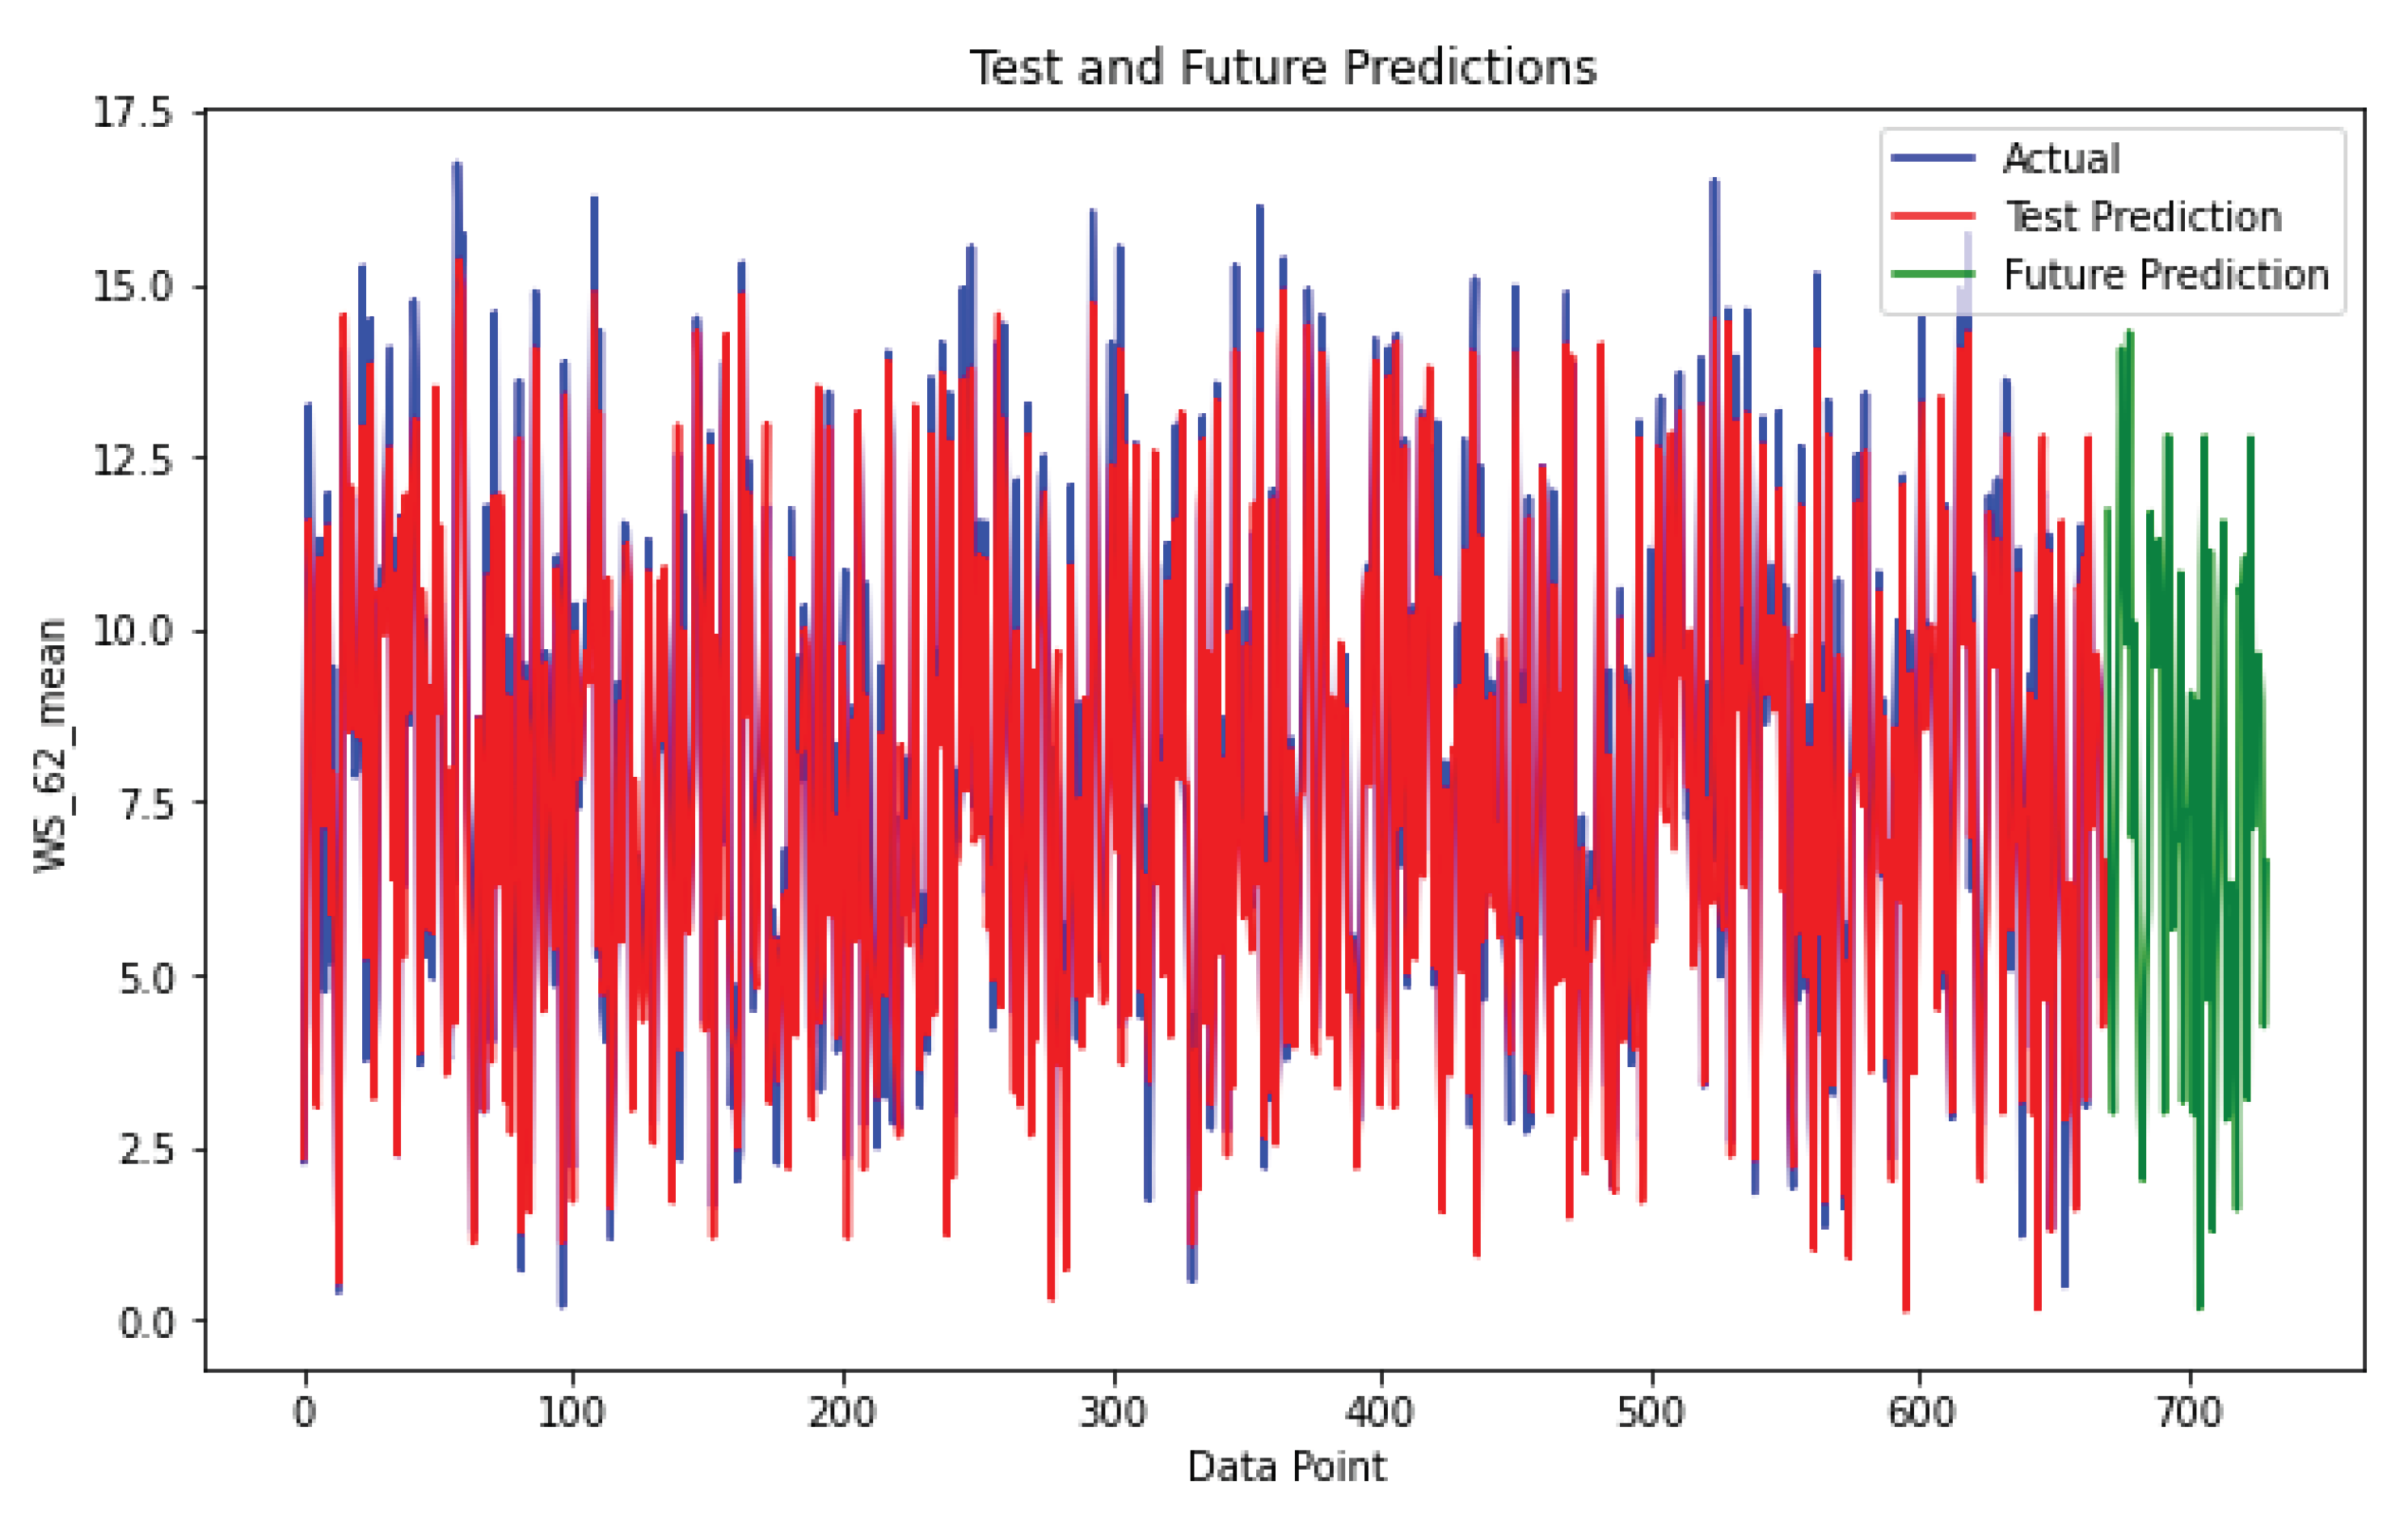
Figure 13.
Test set and future prediction Noupoort station.
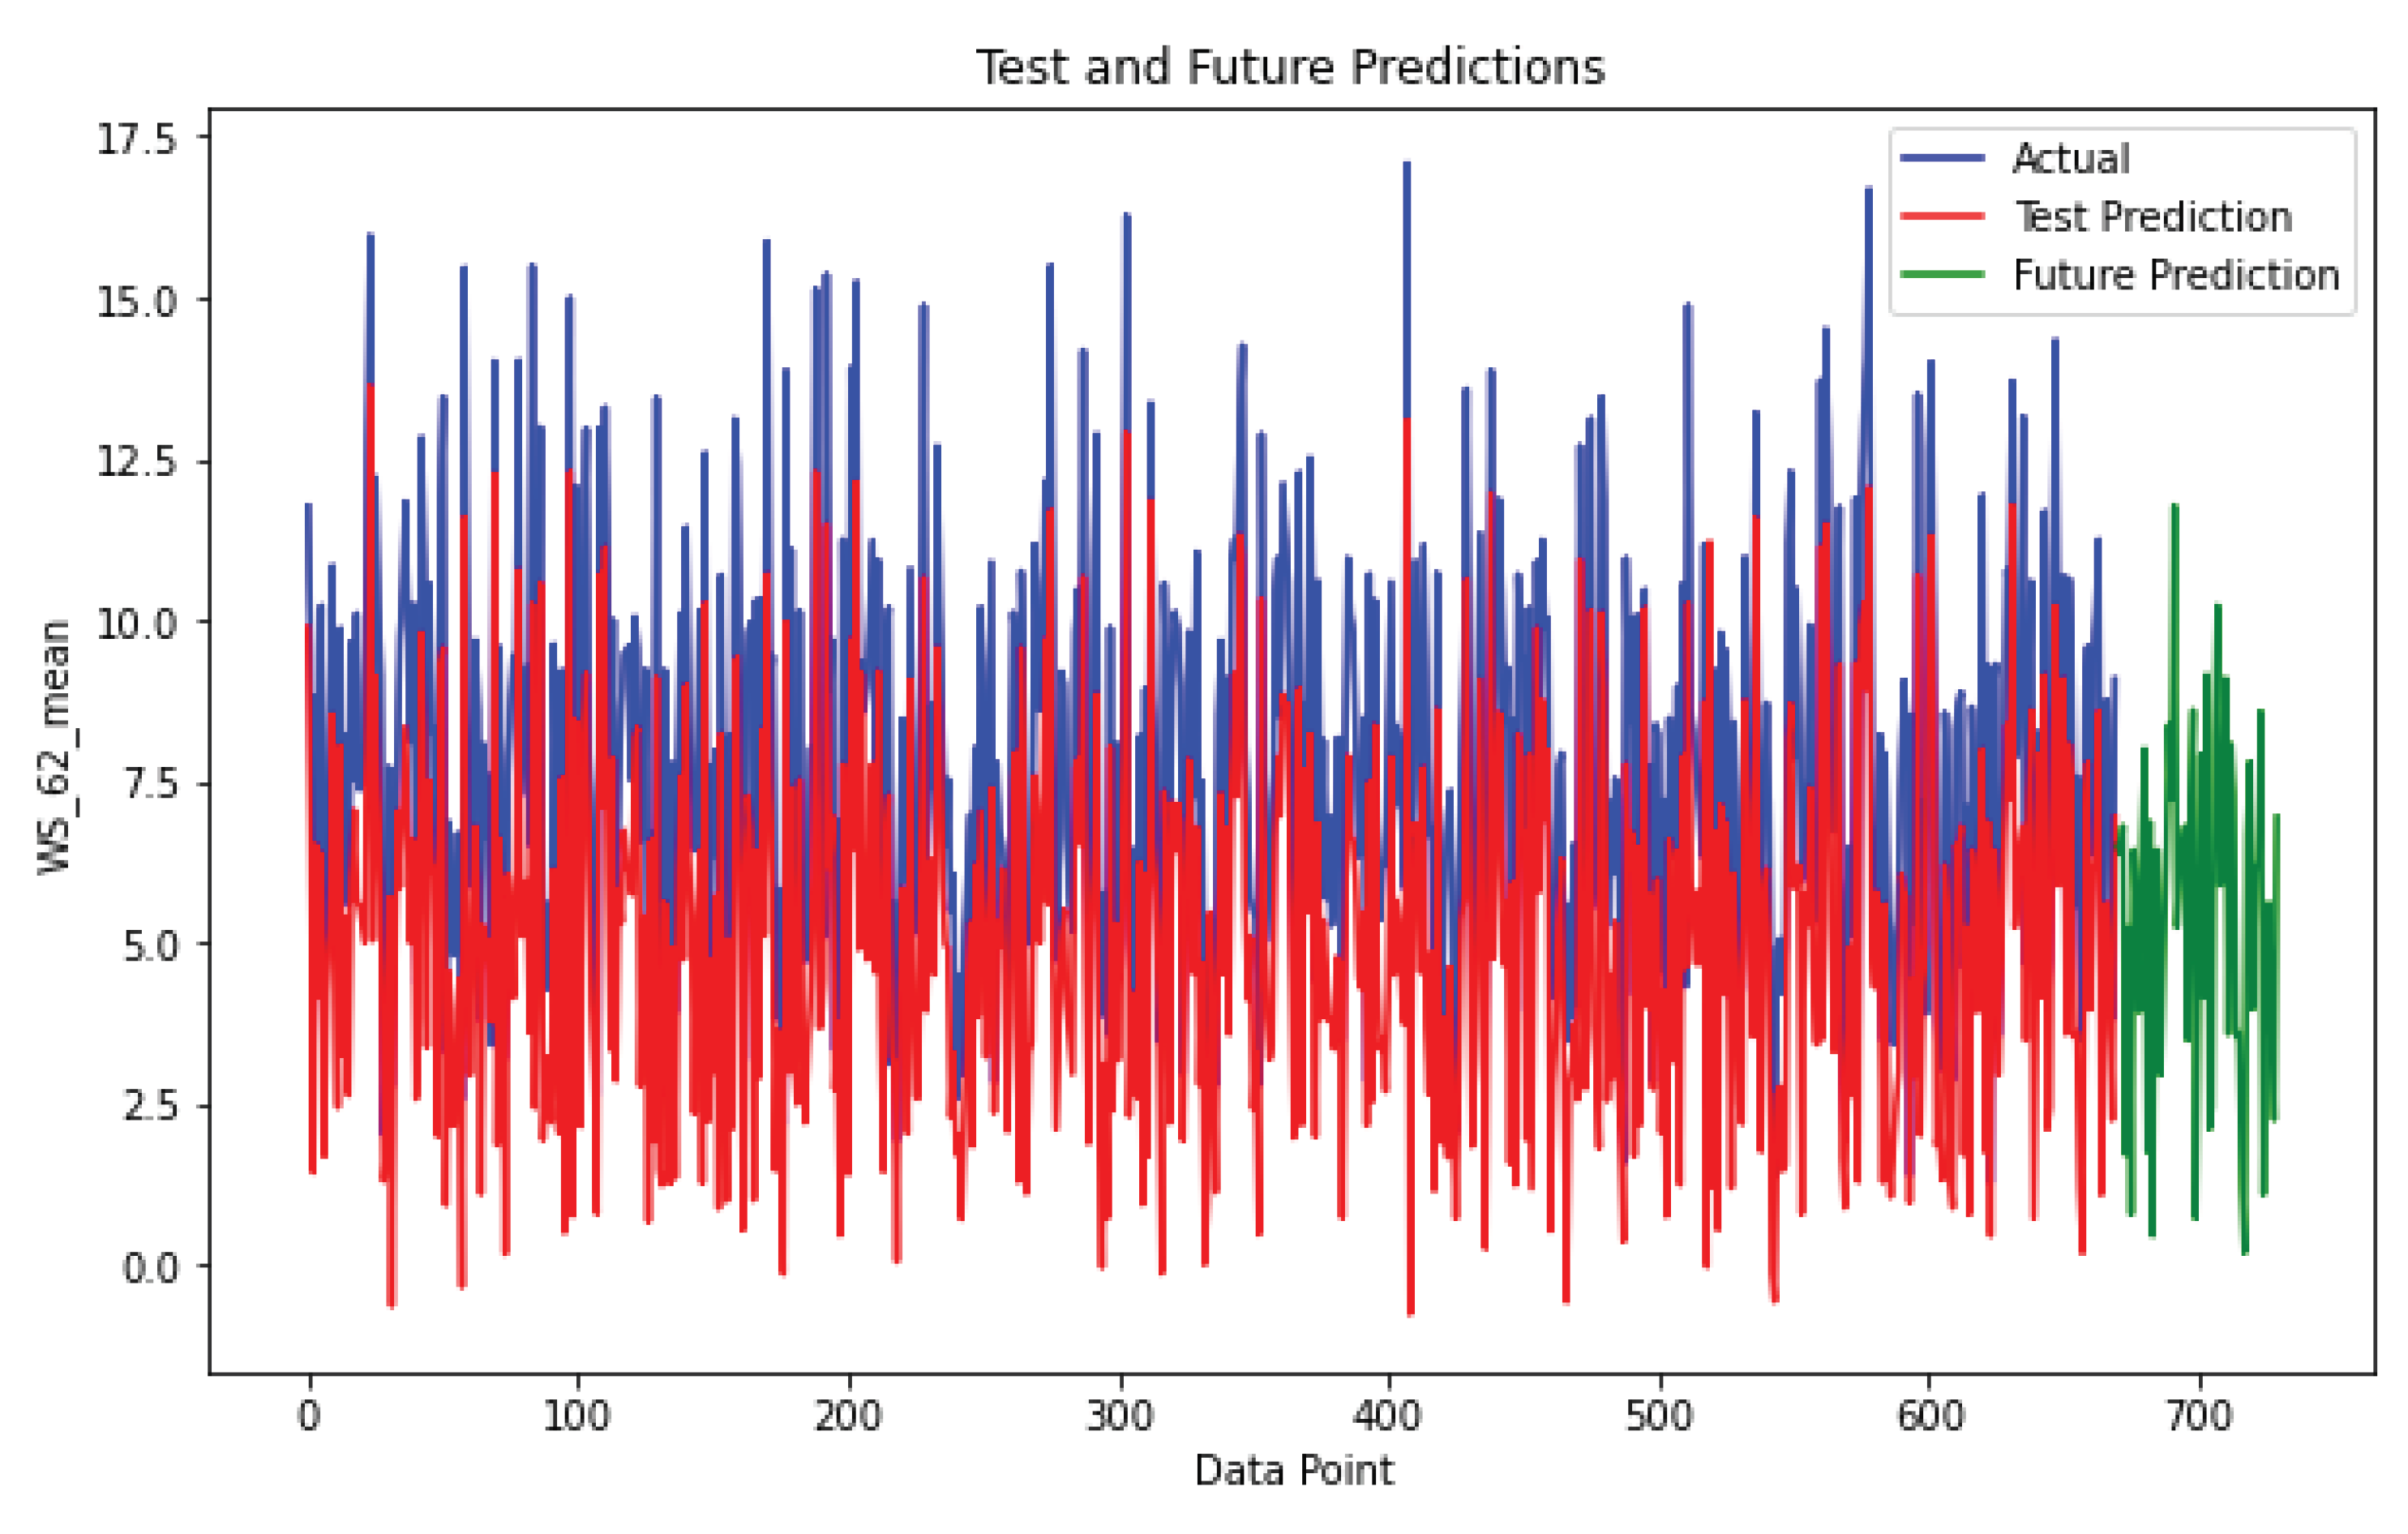
Figure 14.
Test set prediction Upington station.
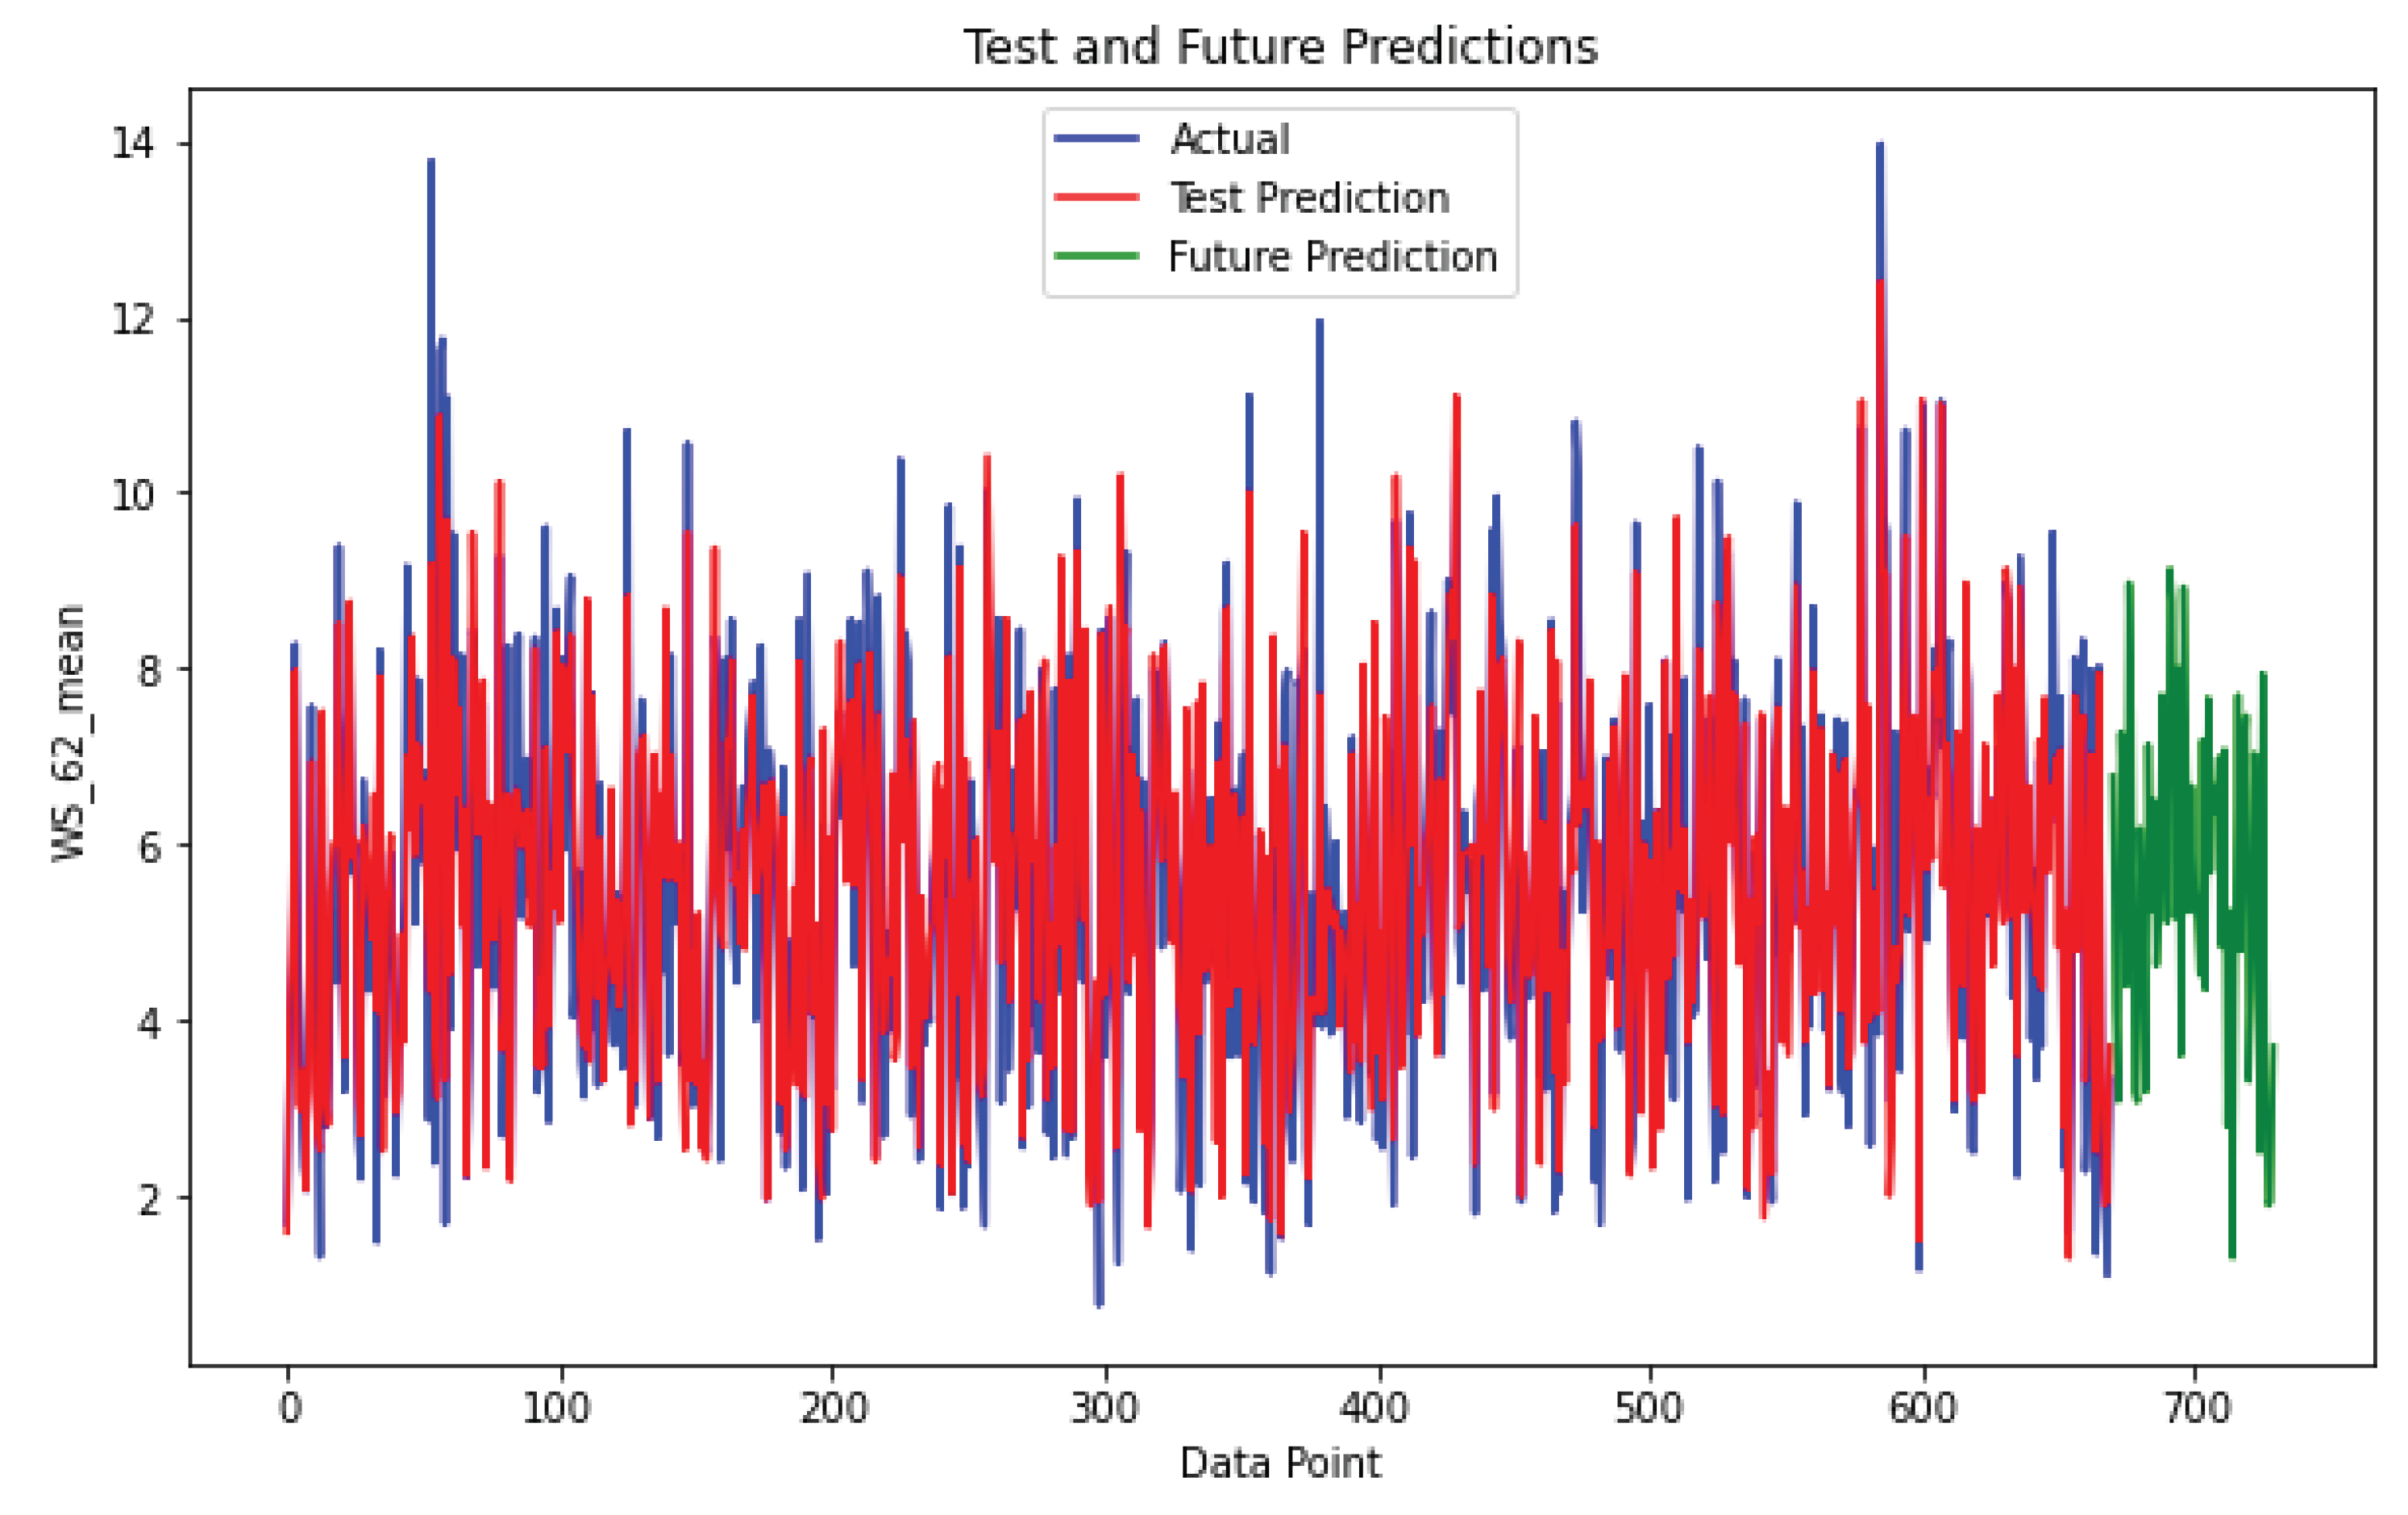
Figure 18.
Training and validation loss for three stations.
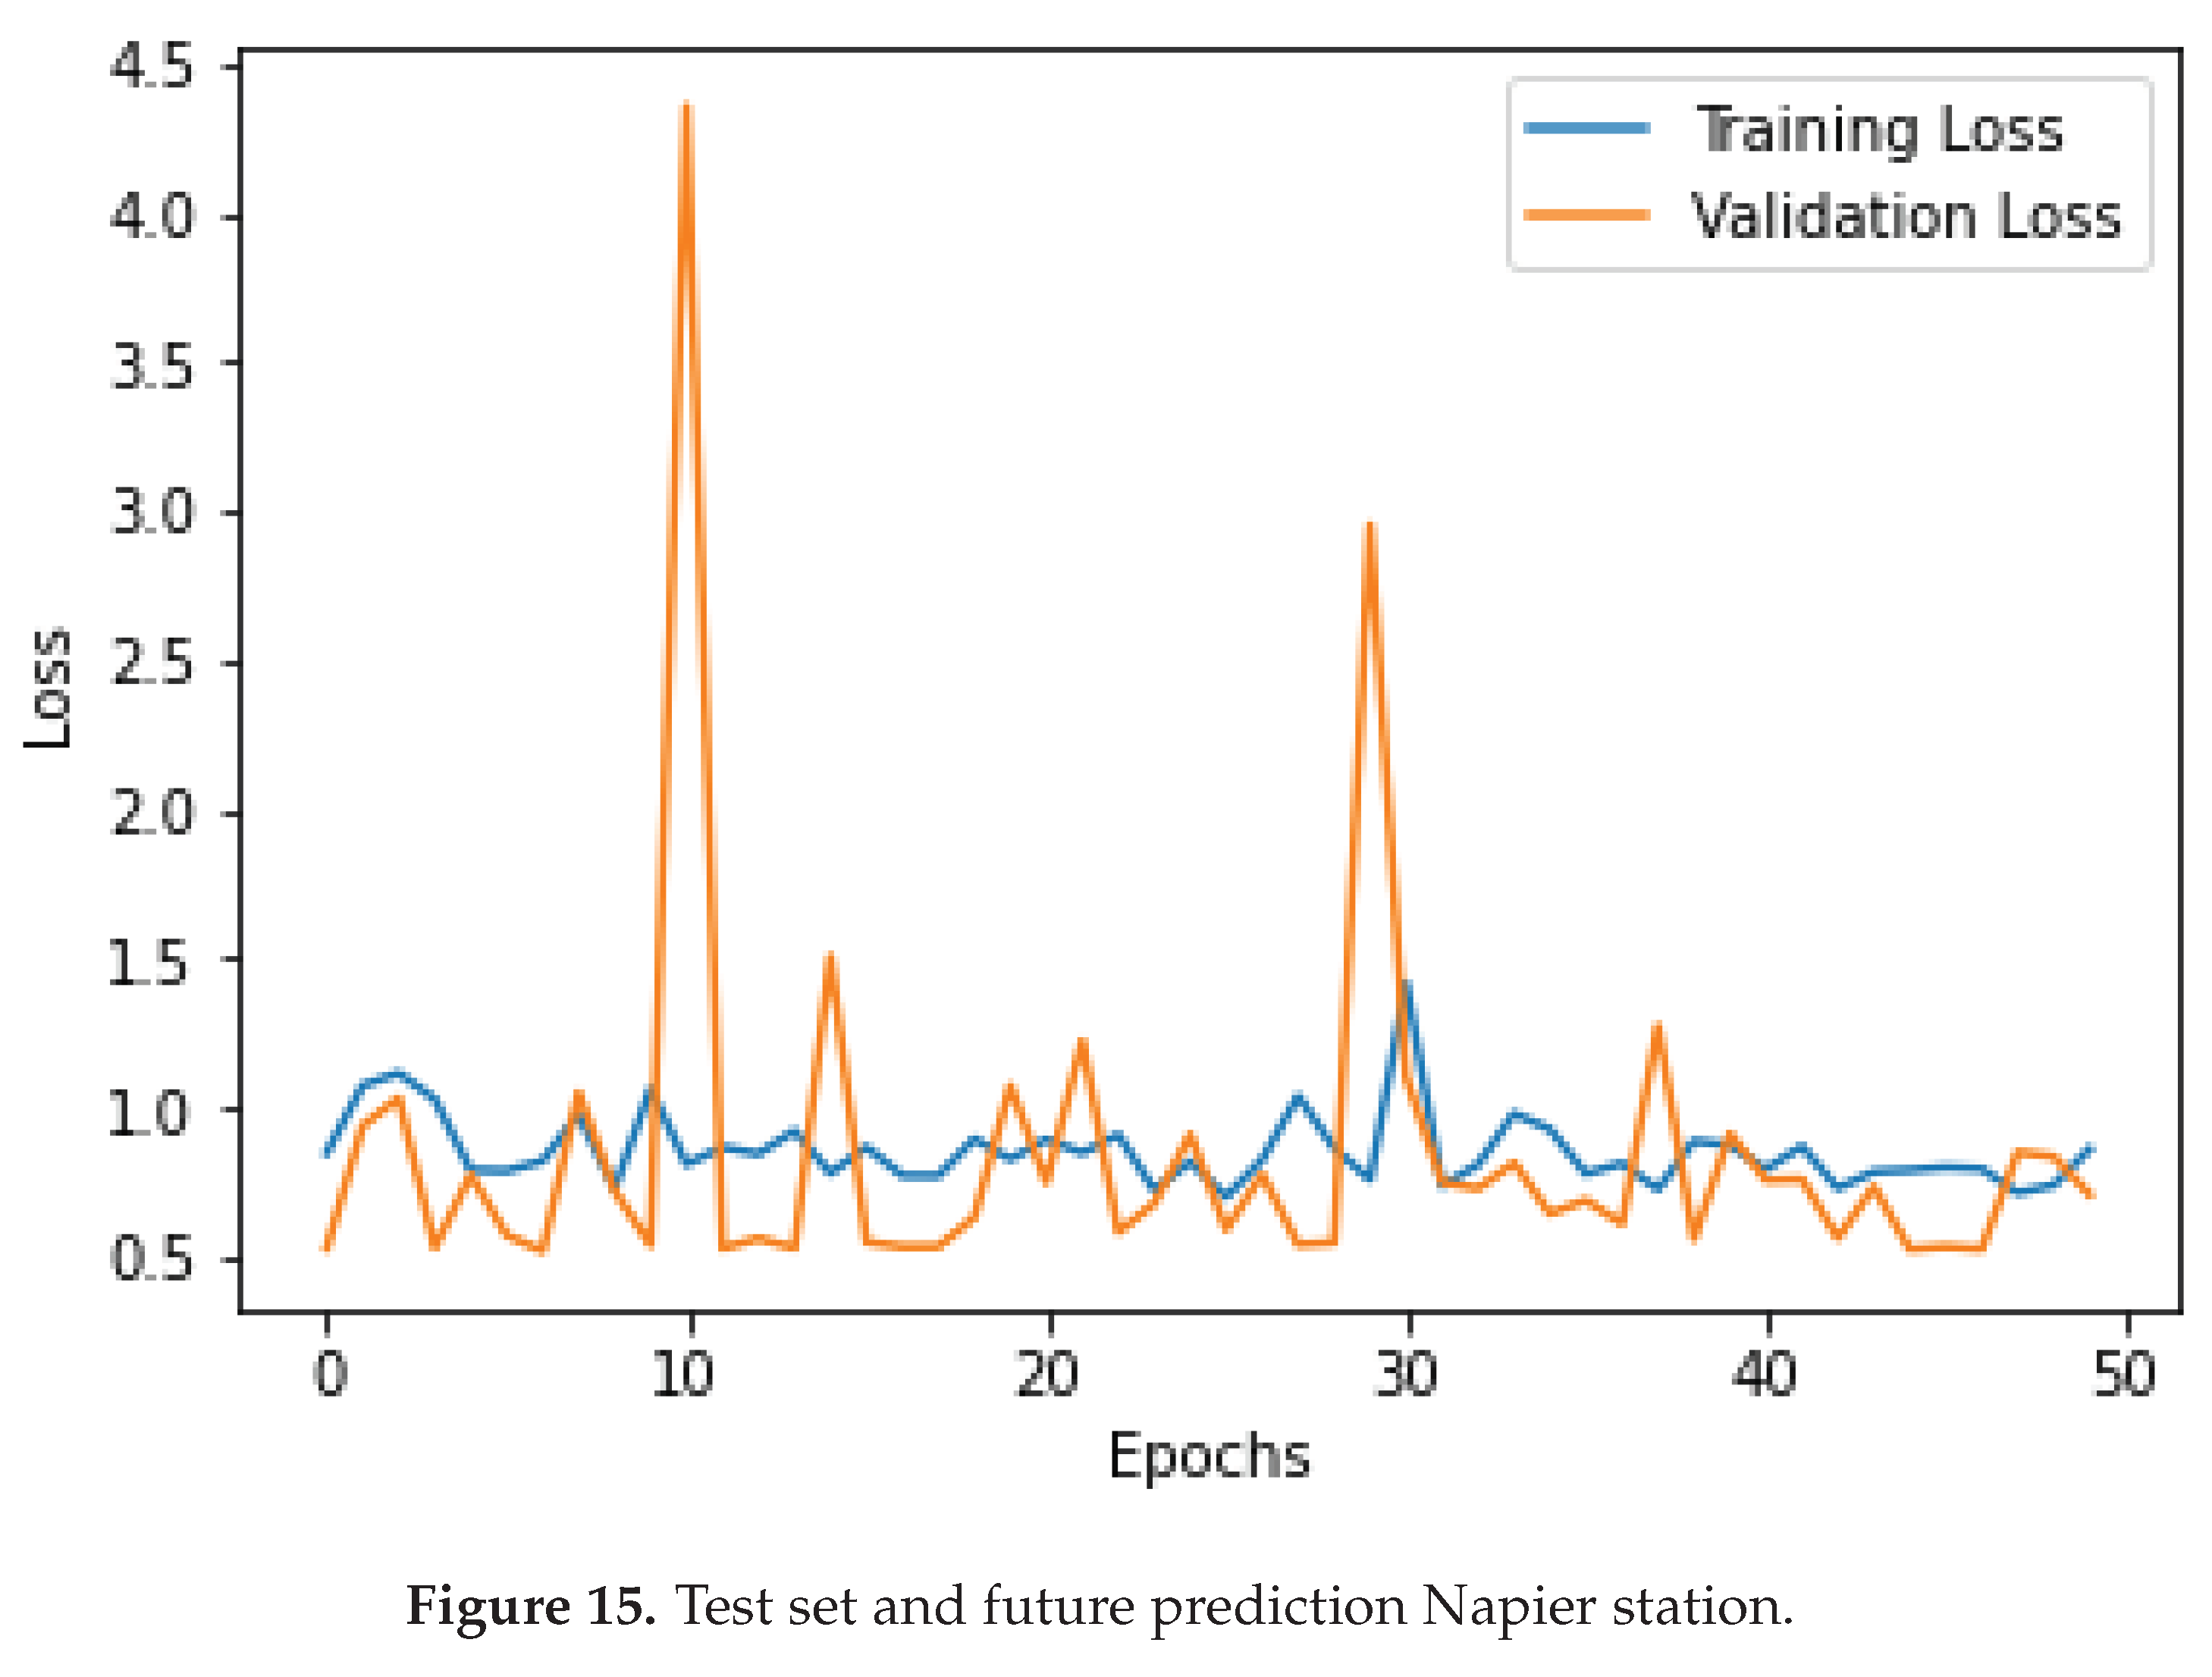
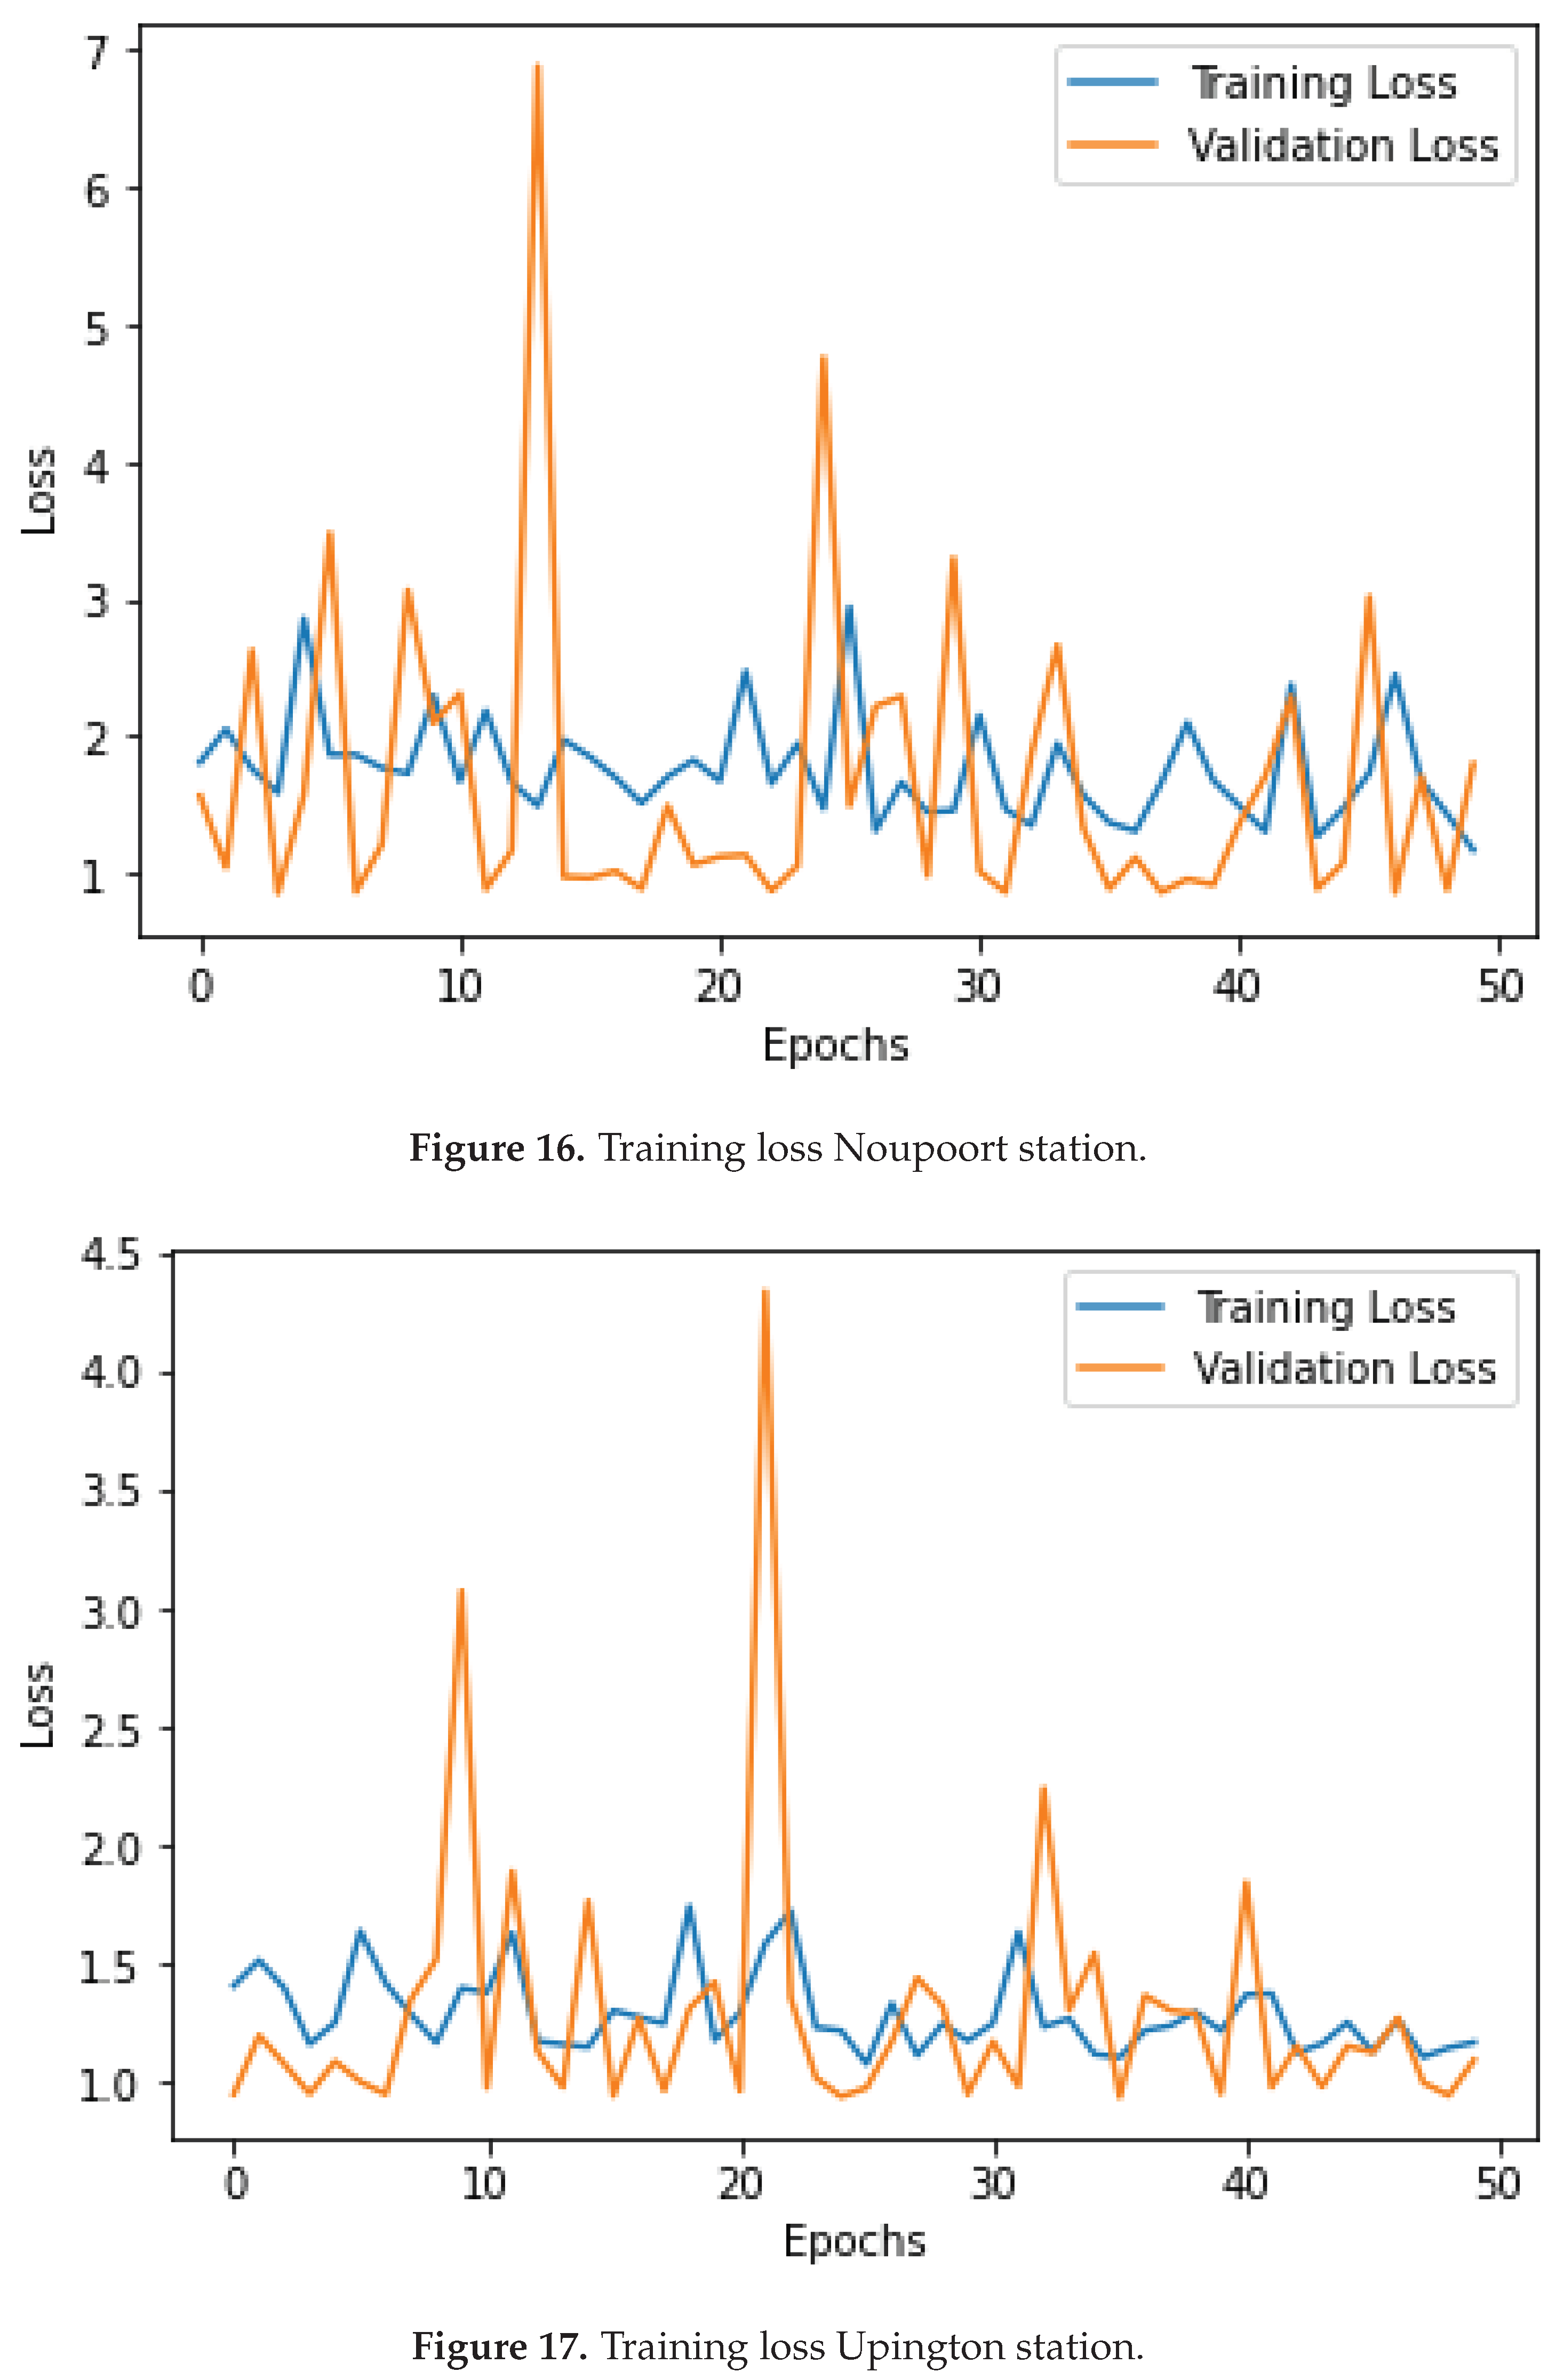
Table 1.
(a) Stations Information.
| Station | Longitude | Latitude | Elevation |
|---|---|---|---|
| Napier | 19.7 | -34.617 3 | 288m |
| Noupoort | 25.033 | -31.25 | 1806m |
| Upington | 20.567 | -27.733 | 848m |
| (b) Distance matrix. | |||
| Napier | Noupoort | Upington | |
| Napier | 0 | 832 | 1041 |
| Noupoort | 832 | 0 | 866 |
| Upington | 1041 | 866 | 0 |
Table 6.
Forecast evaluation.
| Locations | MAE | RMAE | RMSE | RRMSE | MASE |
| Napier station | 8,7974 | 2.966 | 9.343 | 10.889 | 1.0 |
| Noupoort station | 8.8844 | 2.980 | 9.21 | 9.928 | 1.0 |
| Upington station | 5.851 | 2.411 | 6.142 | 11.096 | 1.0 |
Table 7.
Forecast evaluation metrics (CNN model).
| Locations | MAE | RMAE | RMSE | RRMSE | MASE |
| Napier station | 0.635 | 0.079 | 0.805 | 0.100 | 0.150 |
| Noupoort station | 2.564 | 0.333 | 2.727 | 0.354 | 0.747 |
| Upington station | 0.7414 | 0.134 | 0.9810 | 0.1781 | 0.284 |
Disclaimer/Publisher’s Note: The statements, opinions and data contained in all publications are solely those of the individual author(s) and contributor(s) and not of MDPI and/or the editor(s). MDPI and/or the editor(s) disclaim responsibility for any injury to people or property resulting from any ideas, methods, instructions or products referred to in the content. |
© 2024 by the authors. Licensee MDPI, Basel, Switzerland. This article is an open access article distributed under the terms and conditions of the Creative Commons Attribution (CC BY) license (http://creativecommons.org/licenses/by/4.0/).
Copyright: This open access article is published under a Creative Commons CC BY 4.0 license, which permit the free download, distribution, and reuse, provided that the author and preprint are cited in any reuse.


