
Submitted:
05 May 2023
Posted:
06 May 2023
You are already at the latest version
Abstract
Estimation of the potential consequences from events occurring downstream of a dam are part of the risk assessment needed during the installation phase of a new dam. In case of specific Natural or Man Made ongoing or prospected events, it may be also important to carry out fast computations that can provide information on the areas at risk either because the original design analyses are not available or because the parameters needed are different. This study is aimed to develop a procedure that strongly facilitates the preparation of the input deck and the derivation of the output quantities to allow a fast analysis of a dam break event using a shallow water model, NAMI DANCE, as the analysis tool.
Keywords:
Dam
; Dam Break
; Flooding
; Modelling
; Early Warning Systems
1. Introduction
Estimation of the potential consequences from events occurring downstream of a dam are part of the risk assessment needed during the installation phase of a new dam. In case of specific Natural or Man Made ongoing or prospected events, it may be also important to carry out fast computations that can provide information on the areas at risk either because the original design analyses are not available or because the parameters needed are different.
Examples of those needs can be recalled as an ongoing Tropical Cyclone, with the large amount of rainfall that can quickly increase the level of the lake upstream the dam and cause sudden overspilling from the dam with the potential flooding of the areas downstream or, in the worst case, the complete failure of the dam if of the earth filled type. An example of such a failure is the Laos dam break in 2018. An extensive flood occurred on 23 July 2018, downstream one of the dams of the Xe-Pian Xe-Namnoy Power Project, in southern Lao People’s Democratic; the flood was due to the partial failure of the dam (Annunziato et al. 2018). The Mosul dam instead, was analyzed because of the risk of intentional bombing and destruction of the dam (Annunziato et al. 2016); In this case, the failure, luckily, did not happen but a great concern was expressed by the United Nations (https://news.un.org/en/tags/mosul-dam) and therefore dedicated quick analyses were necessary. Many other examples can be reported where a dam break analysis was necessarily performed under strict timeline conditions.
The typical analysis of a dam break by numerical modeling requires a number of input data and output quantities which are explained in detail in the following sections. This study is aimed to develop a procedure that strongly facilitates the preparation of the input deck and the derivation of the output quantities to allow a fast analysis of a dam break event using a shallow water model, NAMI DANCE, as the analysis tool.
In case of the numerical analysis of a dam break, the necessary components to be defined to perform the computations can be listed as:
- Topography of the area
- the lake upstream the dam under question
- the bathymetry of the lake
- the topography of the area that can be flooded when the dam break occurs
- The characteristics of the timing and length of the break of the dam (i.e., if the break is sudden or if it takes some time to pen and the width of the opening)
The quantities to be computed (main outputs) are generally the following:
- the flooding extent (Distribution of maximum flow depth along the flow path)
- the timing of the flooding (wave travel time)
- the time histories of water elevations at relevant observation points (numerical gauges)
- the population to be affected in the impacted area
- the building area to be affected by the flood
2. Details of Numerical Model NAMI DANCE
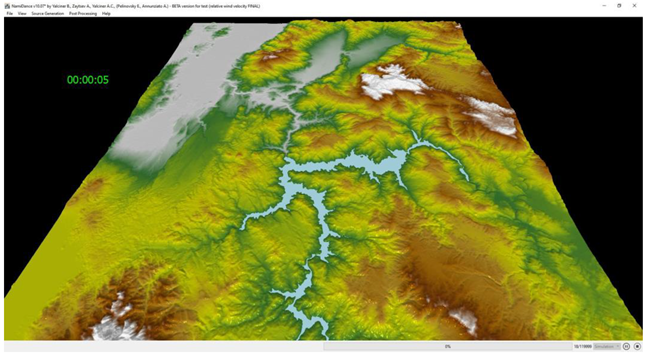
The numerical model, NAMI DANCE, was originally developed for solving tsunamis based on shallow water theory. The code solves the nonlinear shallow water equations covering the surface and bottom stresses, Coriolis force and uses the water surface disturbances as the inputs simulating propagation and coastal amplification of long waves. The governing equations of NAMI DANCE (continuity and momentum equations) are given in Equations 1-3. The equations are solved using a staggering leapfrog scheme numerical solution procedure in single or nested domains with rectangular structured mesh.
is the water surface elevation; represents the seawater density; is gravitational acceleration; is time; and are the horizontal coordinates in zonal and meridional directions; is the total water depth; is the undisturbed basin depth; is the Coriolis parameter with where ω is the angular velocity of the Earth, and ∅ is the y-coordinate in degree. and , the discharge fluxes in the horizontal plane along and coordinates, are calculated from
and are the bottom shear stresses in the horizontal plane along and directions, where the Manning law is used for the bottom friction with coefficient , also given in the following.
The Manning’s coefficient is calculated by
where fb denotes the bottom friction.
NAMI DANCE has been validated by several benchmark problems and applied to many tsunami events and modeling studies (Dogan et al. 2023; IAEA-TECDOC 2022; Dogan et al. 2021a; Velioglu Sogut and Yalciner 2019; Lynett et al. 2017) Currently, the model is upgraded to use Graphical Processor Unit (GPU) for high-speed processing capability (Yalciner and Zaytsev 2017) and can also solve long waves due to atmospheric pressure and wind disturbances in the latest version, NAMI DANCE SUITE (Dogan et al. 2021b). NAMI DANCE uses the bathymetry and topography data in raster formant and the initial water surface displacement, and fluxes if needed as the standard inputs and additionally, the spatial and temporal distributions of atmospheric pressure and wind for solving long waves due to atmospheric disturbances.
3. Methodology
The first action for the numerical analysis of dam break events is the approximate identification of the potentially affected area and the time expected for the calculation (a few hours or several days). The definition of the area is not precise at the beginning for a new problem; in particular for dams created for irrigation where an output river is not present. However, looking at the topography of the valley downstream the dam it is normally possible to have an idea of what could be the overall extent of the calculation. A preliminary bounding box can therefore be established for an initial low-resolution calculation to be conducted for an expected initial duration of the analysis time. The idea is to check if the flow reaches or not the whole extent of the study domain in the expected duration. In case the inundation does not reach the whole extent, it is possible to reduce the domain bounding box and thus reduce the computational effort or, if the water reaches the borders of the bounding box before the end of the expected duration of the calculation, the bounding box could be expanded.
About the determination of the analysis time, in general, it is important to verify if large cities are present downstream and a requirement is to identify the timing when the flow reaches those cities. Again, a preliminary calculation with a low-resolution nodalization can clarify this aspect too.
The extent of the calculation, the resolution and the analysis time define the amount of CPU time needed to perform the calculation. Therefore, in order to contain the CPU time within a reasonable range (i.e., 8-12 h), it is necessary to minimize the bounding box and the analysis time and maximize the resolution.
A topography and bathymetry database defining the topography of the area and the bathymetry of the lake is needed to perform the calculations. If no specific and detailed data is available for the case, the publicly available SRTM 30 m resolution data represent today the best option (Tufekci-Enginar et al. 2022). The data can be easily downloaded for a selected area from various sources such as https://dwtkns.com/srtm30m/, Figure 1. For the case in question, it could be necessary to download several sections and merge them into a single gridded raster dataset.
The raster file representing the topography will be our main datum to start the following manipulation.
3.1. Input Quantities
The first activity is the identification of the extent of the lake upstream the dam. This is generally done by following the perimeter of the lake at a specific elevation representing the surface of the lake. Technically speaking this can be done by identifying a lake point close to the dam, estimating its elevation and then selecting all the adjacent points at that same elevation (Figure 2).
The lake bathymetry is generally unknown. It is very rare that dam lakes are examined after construction to obtain the current depth in the lake. In some rare cases, the topography of the valley before the construction of the dam is available and that can represent good information. In the majority of cases, the depth is unknown and some possible hypotheses can be implemented: constant lake depth, linear decrease depth, and reconstruction of the depth from the form of the surrounding valleys (Figure 3).
- The constant lake depth is the simpler one. The assumed depth is the difference between the lake elevation provided by SRTM and the elevation of the earth downstream the dam (down dam elevation). This depth is preserved for the whole surface of the lake. It is clear that this is an overestimation of the lake volume because far from the dam the depth will be certainly smaller. This procedure can be the best option in case of emergency calculations.
- The linear decrease depth from the beginning of the lake to the dam is probably closer to the real lake volume but in some cases, it could be an underestimation of the volume.
- The reconstruction of the possible bathymetry considering the slopes of the surrounding areas is a rather long and expensive procedure and requires manual intervention. In case there is no time limitation, this is probably the best solution.
3.2. Specific Needs for NAMI DANCE
The NAMIDANCE code foresees:
- the definition of a bathymetry raster file, where the depth is positive below the water surface
- A deformation file that represents the height of initial water disturbance that is then moved to have the water propagation
- The bathymetry and deformation files must have the same extent and number of cells (rows and columns)
Since the NAMI DANCE code was developed for tsunami propagation but not for dam break calculations, we need to find a way to initialize the system so that the code could perform the calculation of the propagation. To do that we have determined the following procedure:
-
The bathymetry is the topography multiplied by -1 and with a constant value removed so that the surface of the lake is set equal to the constant depth
- ○
- Suppose that the elevation of the lake is 290 m and the constant depth of the lake is 15 m:
- ■
- [bathymetry]=290.0-[topography (SRTM)]
- ■
- [bathymetry] over the lake is set to 15 m
-
The deformation file is assumed the opposite of the bathymetry a part on the lake that is left at zero level:
- ○
- In the same example above:
- ■
- [deformation]=[topography (SRTM)]-290.0
In order to verify if the manipulations have been done correctly, the bathymetry on the lake area will be 15 m and the deformation will be 0. In any other point lower than the lake elevation, the bathymetry will have a positive value and the deformation will have the same value negative. At any point at an elevation higher than the lake, the bathymetry will be negative (as if it is on land in a tsunami computation) and the deformation will be positive with the same absolute value.
The other needed modification is the opening of the broken section of the dam in the bathymetry file. The opening will be a number of pixels that represent the opening, which is set at an elevation corresponding to the height of the opening. For example, if the opening is 130 m, this will be represented with 4 pixels (SRTM is 30 m, so the total will be a bit smaller, 120 m) with a value of the maximum water depth (15 m in the previous case), or smaller if you want to represent a partial break. In the positioning of the broken pixel, it is necessary to take into account that, in order to have water flow it is always necessary to have ‘at least’ one pixel in common between the rows otherwise water will not flow in (Figure 4).
In case the break is smaller than 1 pixel (i.e., 20 m or less), it is necessary to reduce the grid size, i.e., resample the SRTM to 15 m or less, before performing the calculations to satisfy this requirement.
3.3. Python Script to Facilitate the Input Files Preparation
In order to facilitate the preparation of the input files according to the procedure explained above, a Python script has been created, present in Appendix A, which allows generating the required files, ready for the use with NAMI DANCE code.
Once the script is installed as explained in the GitHub, it is possible to provide the following command:
creaFiles.py [-d basedir] [-s srtm.tif] -w 0.3 -lp 36.32 36.19 -dp 36.12 37.42 [-od outDem.grd] [-ol outLake.grd ] [-bbox xmin ymin xmax ymax] [-res NewCellSize]
where:
- -d
- is the base directory. If is not specified the current directory is used. The output will be located in that directory
- -s
- is the SRTM file that is used [default: srtm.tif]. You can specify more files included in double apices and separated by a + sign (example: -s “file1.tif+file2.tif”). In that case, the script will merge the files before cropping to the desired extent specified by the bbox parameter
- -w
- This is the dam break width in km
- -lp
- This is the lake point and is a couple of numbers [longitude, latitude] representing one point on the lake very close to the dam. Do not be too close to the dam but remain 2 or 3 pixels (ab 100 m) from the beginning of the dam
- -dp
- This is a downstream point of the dam and represents the first point after the dam, along the flow path downstream. Also in this case do not choose a point too far from the dam and not inside the area of the dam
- -od (optional)
- This is the output file name for the bathymetry. By default is outDem.grd
- -ol (optional)
- This is the output file name for the deformation file. By default is outLake.grd
- -bbox
- This is the bounding box of the calculation “lonmin latmin lonmax latmax”, in double apices, with the values representing the boundary of the computation
- -res (optional)
- This is the required resolution in degrees. If not specified the SRTM30 original value is assumed
An example of this call is the following:
time python creaFiles.py -d El_Cajun -s "/data/N14W088.hgt+/data/N15W088.hgt" -w 0.06 -lp -87.744886 15.02809 -dp -87.745366 15.030250 -bbox "-88. 14.800 -87.400 15.400"
The output of this call is the creation of two grid files, “outDem.grd” and “outLake.grd”, in the format Surfer6, required by NAMI DANCE, that can be included as input files in the NAMI DANCE code user interface (outDem.grd as bathymetry and outLake.grd as deformation file) or used to create an input deck to launch a NAMI DANCE calculation with a script.
3.4. Output Quantities
The duration of a NAMI DANCE simulation depends on the domain extent, running time and the desired resolution and can take quite a long time in case of either large extent and long time or fine resolution. NETCDF format is one of the output format options of NAMI DANCE calculations and if the NETCDF format is selected for the output, two important files are generated:
- -
- The file namely “OUT-T-ETA.nc”, that contains the timeline of the water surface elevation at each cell point over time.
- -
- The file namely “OUT-EXTREMUM.nc”, that contains the spatial distributions of the computed maxima and minima of the selected tsunami parameters through the calculation. The quantity which is most useful for this type of analysis is “FD_MAX” representing the maximum flow depth.
The quantities to be analysed are generally the following:
-
the flooding extent (distribution of maximum flow depth along the flow path)
- ○
- This is obtained by extracting the FDMAX from the OUT-EXTREMUM.nc file
-
The timing of the flooding (wave travel time)
- ○
- In order to obtain this quantity, a programme, called “Arrival_time.py” has been developed that allows indicating for each cell the hour at which the wave arrives (the arrival time is considered when a definable threshold is surpassed by the flow depth)
-
The time histories of water elevations at relevant observation points
- ○
- If these points are known before doing the calculations, their locations can be included in the file gauges.dat and specified before launching the calculations. If other points are required not known in advance, they can be extracted using the script extract.py that analyses the OUT-T-ETA.nc and perform the required estimation
-
The population to be affected along the flow path
- ○
- This can be obtained using the script classify.py which allows to compute the population in each cell using the maximum flow depth and perform the analysis of the population distribution per class of heights. For the population file it is possible to use files such as LandScan (https://www.eastview.com/resources/e-collections/landscan/) or GHSL from the JRC (https://ghsl.jrc.ec.europa.eu/) or any other with proper resolution and reading mode changes.
-
The building area to be affected by the flood
- ○
- Similarly to the population affected, using the built-up area information and the maximum flow depth, it is possible to estimate the built-up area subject to each height class. Builtup dataset is offered for example by JRC (https://ghsl.jrc.ec.europa.eu/)
An analysis of a dam break should produce all the output above. A number of scripts have been developed that allow to facilitate obtaining the quantities. Using those scripts, it could be possible in the future to automatically perform the risk assessment for all the dams subject to a strong Tropical Cyclone and include them in the algorithms present in the Global Disasters Alerts and Coordination System (GDACS, https://www.gdacs.org), for example. However, at the moment, at least the identification of the lake point and down dam point, should be done manually to avoid wrong results but it is not excluded that clever methods could be used to automatize also this last step.
4. Case Study
Figure 5.
Side opening of the earth dam in Puerto Rico after the passage of Hurricane MARIA, figure from https://floodobservatory.colorado.edu/Events/2017USA4523/PuertoRicoDam.v2.1.pdf.
Figure 5.
Side opening of the earth dam in Puerto Rico after the passage of Hurricane MARIA, figure from https://floodobservatory.colorado.edu/Events/2017USA4523/PuertoRicoDam.v2.1.pdf.
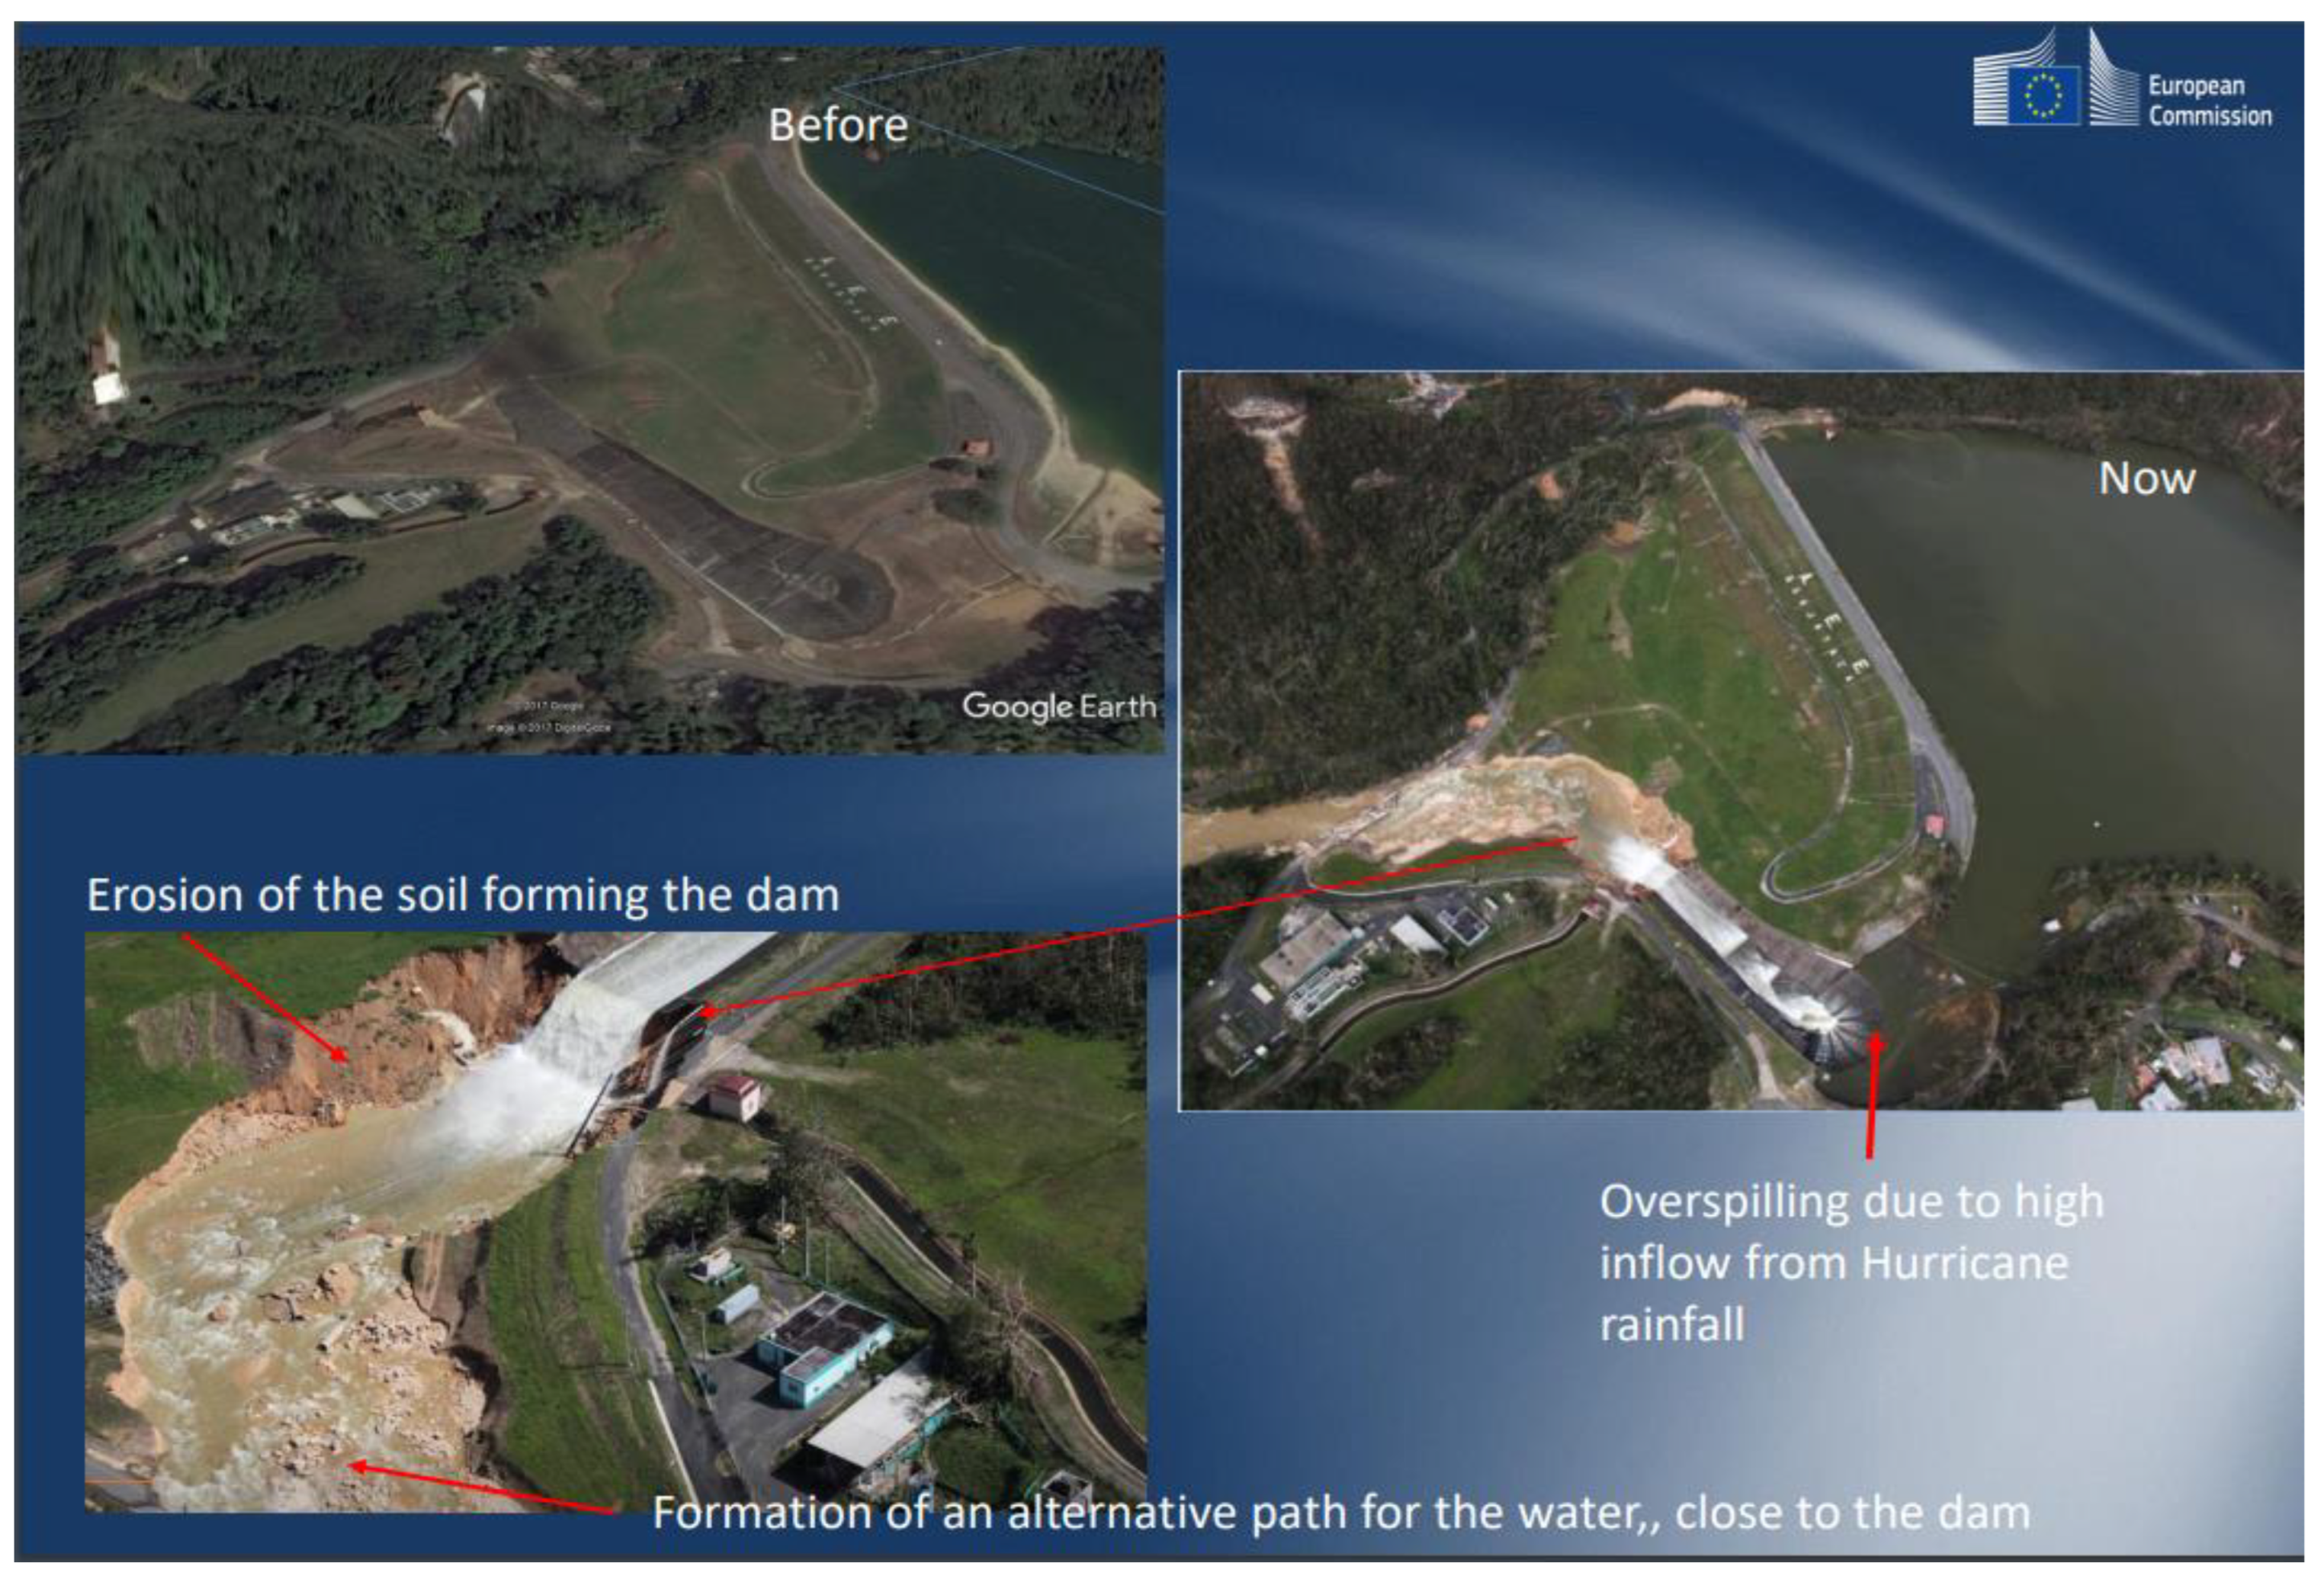
As a case study, we selected an important event that occurred in 2017 due to the passage of Hurricane MARIA, where the Guajataca Dam in Puerto Rico was partly broken, causing important flash floods downstream and causing the evacuation of more than 70 thousand people. The European Commission Joint Research Center (EC JRC) analysed the event and produced a number of reports on the event, identifying the major consequences in terms of timeline and population affected. A summary of the findings can be found in the following document.
Looking at the location of the Guajataca Dam in Puerto Rico, it is possible to identify the two relevant observation points for our procedure (Figure 6), lake point and down dam point as
Lake Point (lon/lat): -66.922825° / 18.396176°
Down dam point (lon/lat): -66.925838° / 18.397463°
From the SRTM30 repository, we can download the file N18W067 that contains the data of the whole flow path of this case. Given the location of the lake and the expected flow plain, we can identify the following bounding box for the domain of the analysis, marked in red in Figure 7.
[Lonmin, Latmin, Lonmax, Latmax]=
[-67° 18.358° -66.88° 18.50°]
The study domain is about 12 km by 16 km, a relatively small area. In many other cases the bounding box can be much larger and can require much more computational effort.
4.1. Preparation of the Files and NAMI DANCE Run
We can therefore launch the following script with the parameters that are explained in Section 2.3:
time python creaFiles.py -d Puerto_Rico -s ‘SRTM/N18W067.hgt’ -w 0.075 -lp -66.922825 18.396176 -dp -66.925838 18.397463 -bbox “-67 18.358 -66.88 18.50”
Which means that the represented size is 75 m (0.075 km).
The response is the following:
*************************************************
* Preparation of file for NAMIDANCE DB calc
*************************************************
srtm file = Puerto_Rico/SRTM/N18W067.hgt
Lake Point = [-66.922825, 18.396176]
Down dam Point= [-66.925838, 18.397463]
output DEM = Puerto_Rico/outDem.grd
output Lake = Puerto_Rico/outLake.grd
resizing dem Puerto_Rico/SRTM/N18W067.hgt to = new file=Puerto_Rico/srtmNew.tif to: -67 18.358 -66.88 18.50
gdalwarp -r bilinear -te -67 18.358 -66.88 18.50 Puerto_Rico/SRTM/N18W067.hgt Puerto_Rico/srtmNew.tif
Creating output file that is 432P x 511L.
Processing Puerto_Rico/SRTM/N18W067.hgt [1/1] : 0Using internal nodata values (e.g. -32768) for image Puerto_Rico/SRTM/N18W067.hgt.
Copying nodata values from source Puerto_Rico/SRTM/N18W067.hgt to destination Puerto_Rico/srtmNew.tif.
...10...20...30...40...50...60...70...80...90...100 - done.
Opening dem: Puerto_Rico/srtmNew.tif
data type: Int16
0 363 -32768.0 0.0002777777777777883 432 511
reshaping file as 432 511
row col of lake 374 277
Lake dem= 198 Downdam dem= 187 Jump= 11
2 True False
delta, dmax= 100 374
delta, dmax= 200 374
delta, dmax= 300 374
vv# 371 373
real 0m0.998s
user 0m0.643s
sys 0m0.097s
The resulting files, “outDem.grd” and “outLake.grd” are the ones that can be immediately used with NAMIDANCE as the bathymetry and initial water surface elevation (forcing) and have the characteristic to have respectively 0 m in the “outLake.grd” file over the lake and 11 m (the hydraulic jump) in the “outDem.grd” file.
These files are relatively small (432 x 511 pixels) and therefore it could be a good idea to use a resampled version of them by adding the parameter -res 0.000069444445 (¼ of the original SRTM cell size, so the case would be 1728x2044 and resolution 7.5 m instead of 30 m. This can allow to analyse smaller break sizes in finer resolution.
4.2. Calculation of Arrival Time
At the end of the calculation of NAMI DANCE it is possible to extract the necessary output parameters, which are
- Arrival time
- Extract the water height timeline for specific points
- Population affected
The arrival time is calculated using the calcArrivalTime.py script that establishes for each point the moment when the water level is larger than a threshold that can be varied.The parameters to call the script are:
- -d
- is the base directory. If is not specified the current directory is used. The output will be located in that directory
- -s
- is the step between each point. It is used for very large computations, to reduce the time
- -h
- is the threshold water elevation (m) above which the wave is considered as it arrived at that location
The following example is valid for this command:
time python calcArrivalTime.py -d Puerto_Rico -h 0.2 -s 1
The result of running “calcArrivalTime.py” is shown graphically in Figure 10.
4.3. Extraction of Wave Parameters at Specific Points
NAMI DANCE code has the capability to provide the text format output which includes the time histories of defined wave parameters at selected numerical gauge (observation) points. However, it is also sometimes necessary to obtain the parameters at other points rather than the initially selected ones and it takes several hours or days to re-compute.
Therefore, the script named “extract.py” reads the output of NAMI DANCE and extracts the timeline from a list of specified points with their coordinates organized in the same way.
So, for this particular case, the file contained the following lines:
* LAT LON DESC
18.396176 -66.922825 Lake_Point
18.39764 -66.925700 Down_point
18.401518 -66.947281 P1
18.474119 -66.959620 P2
18.486906 -66.957526 P3
And the output for the 5 points indicated is shown in the plot below, using the following command:
python extract.py -d Puerto_Rico -g gauges.dat
4.4. Extraction of Population Involved
One of the most important quantities to produce from the dam break analysis is the inundation extent and the involved population. The inundation extent is a standard quantity contained in the file OUT-EXTREMUM.nc of NAMI DANCE and represents the distribution of maximum flow depth reached over the course of the simulation.
Using this quantity, it is important to identify how much population is involved. To do this, another script has been developed, named “classifyPopulation.py” that allows extracting the population based on a predefined class of water elevations.
The script includes the following parameters:
- -d
- is the base directory. If it is not specified the current directory is used. The output will be located in that directory
- -desc
- is the description that will be included in the output file
- -fm
- is the file containing the maximum flow depth. If not specified, it will use by default FD_MAX.tif
- -nc
- True or False: if True the system will look into the directory and search for OUT-EXTREMUM.nc and from here it will extract the layer FD_MAX and will write as FD_MAX in the base directory, is the base directory. If is not specified the current directory is used. The output will be located in that directory.
- -p
- LS or GHSL to specify LandScan or Global Human Settlement Layer population density files. Please note that you need to have those files present in the system
For the example shown, the command is
python ./SCRIPTS/classifyPopulation.py -d Puerto_Rico -desc 'Puerto Rico Dam Break' -nc True -p LS
This will produce the following putput in xml format:
<?xml version="1.0" encoding="UTF-8"?>
<popvalues MaxValueWind="6.438943208894819" unit="m/s" >
<!-- Puerto Rico Dam Break -->
<!-- /mnt/DISKD/DAM_BREAK/DATA/lspop20141.tif -->
<!-- LANDSCAN 2014 -->
<class>
<value><![CDATA[wind>0 and <=0.05]]></value>
<ListCountries>Puerto Rico</ListCountries>
<category>0-0.05</category>
<popValue>4709</popValue>
<countriesPop>
<country name="Puerto Rico" iso3="PRI">4709</country>
</countriesPop>
</class>
<class>
<value><![CDATA[wind>0.05 and <=1]]></value>
<ListCountries>Puerto Rico</ListCountries>
<category>0.05-1</category>
<popValue>37344</popValue>
<countriesPop>
<country name="Puerto Rico" iso3="PRI">37344</country>
</countriesPop>
</class>
<class>
<value><![CDATA[wind>1 and <=3.0]]></value>
<ListCountries>Puerto Rico</ListCountries>
<category>1-3</category>
<popValue>680</popValue>
<countriesPop>
<country name="Puerto Rico" iso3="PRI">680</country>
</countriesPop>
</class>
<class>
<value><![CDATA[wind>3.0 and <=10.0]]></value>
<ListCountries>Puerto Rico</ListCountries>
<category>3-10.</category>
<popValue>55</popValue>
<countriesPop>
<country name="Puerto Rico" iso3="PRI">55</country>
</countriesPop>
</class>
<class>
<value><![CDATA[wind>10.0 and <=20.0]]></value>
<ListCountries></ListCountries>
<category>10.-20.</category>
<popValue>0</popValue>
<countriesPop/>
</class>
<class>
<value><![CDATA[wind>20.0 and <=1000]]></value>
<ListCountries></ListCountries>
<category>>20.</category>
<popValue>0</popValue>
<countriesPop/>
</class>
</popvalues>
Similar values can be obtained by specifying -p GHSL to use GHSL population density file. Please note that in gitHub we included only the GHSL file that is freely distributable from JRC.
The file above can be represented in Table 1:
For the calculation of the population affected due to the selected case study here, the Landscan 2014 population density file has been used. Other types of datasets can also be used. If more than one country was involved, the system would have split among the various countries the number of people.
It is relevant to note that both Landscan2014 and GHSL2015 have a rather coarse resolution, 1 km. To have a more precise estimation of the population it would be important to use higher resolution files such as GHSL 100 m or, in Europe, even GHSL 10 m. In such cases, the computational time increases considerably. Those rather coarse resolution files can be used for a coarse estimation of the involved population.
5. Conclusions
The execution of dam break calculations involves the preparation of input decks needed to be used in a computer code solving the water propagation, a shallow water model in this case. NAMI DANCE is a good option for such cases as it has a Graphical User Interface and hence is easy to use, it is valid and verified providing reliable results in a short time with the high resolution, benefiting from Graphical Processing Unit (GPUs) cards. Nevertheless, in case of emergency situations, the bottleneck has always been the time needed for the collection and the adaptation of the input decks that required few days.
A novel method has been developed that uses a python script to facilitate the creation of the files required by NAMI DANCE model and following additional scripts that help in the determination of the output quantities, needed to perform a complete analysis of a dam break event.
The quality of the computed calculations has been verified by code-to-code comparison but till now not with an extensive analysis of real cases for which some of the needed comparison quantities are available. This may be the subject of a future study.
A number of scripts have been developed to facilitate input preparation and output analysis.
The proposed methodology can help in the future to automatize the analysis of those events in the case of relevant natural disasters, such as a Tropical Cyclone, that can put in danger the population downstream of big dams; this is particularly true for earth-filled dams that can suffer relevant damage in case of overfilling due to extensive raining in the area. In those cases, automatic systems like the Global Disasters Alerts and Coordination System (GDACS) could provide immediately (or in relatively short time) an output of the expected consequences from a disaster cause by the dam rupture and therefore inform the population downstream of the potential consequences.
Acknowledgments
The authors acknowledge Dr. Andrey Zaytsev for his efforts in establishing NAMI DANCE numerical structure and PhD candidate Bora Yalciner, for his outstanding success to develop GPU version of NAMI DANCE. It shoud be noted here that most of the ideas in this rpaper were developed during Alesaandro Annunziato’s tenure at the European Commission Joint Research Center (EC JRC) Ispra. All the scripts for the automatic computations were developed or updated after his retirement. Acknowledgements are extended to JRC for the working environment that allowed the development and application of the procedures. A great acknowledgement also to Ocal Necmioglu, from Joint Research Centre of the European Commission, who kindly accepted to review the paper.
Appendix A
Appendix A.1. El Cajun (Honduras) Dam Break
This appendix provides some further details on the procedures to follow to obtain the input data of the calculations and their output quantities.
All the scripts are contained in the following gitHub site:
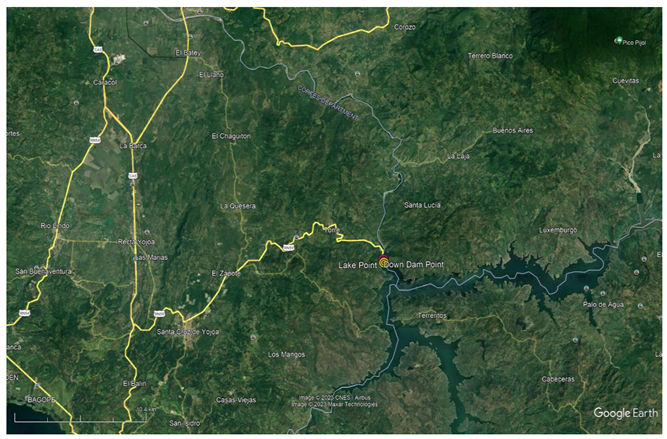
Identify the dedicated SRTM files that compose the DEM. In case you need more SRTM sections, download them and combine them into one single srtm.tif file. To download you can use: https://dwtkns.com/srtm30m/ For this case the specific piece to download is N15E88 and N14E88.
Then you have to identify the lake point and the down dam point. The lake point is a point very close to the dam and where the level is constant in the SRTM file representing the surface of the upstream lake.
The down Dam point is a point downstream the dam. The difference in height of these two points represent the dam water jump.
time python creaFiles.py -d El_Cajun -s "/data/N14W088.hgt+/data/N15W088.hgt" -w 0.06 -lp -87.744886 15.02809 -dp -87.745366 15.030250 -bbox "-88. 14.800 -87.400 15.400"
The result is the following:
*************************************************
* Preparation of file for NAMIDANCE DB calc
*************************************************
srtm file = /data/N14W088.hgt+/data/N15W088.hgt
Lake Point = [-87.744886, 15.02809]
Down dam Point= [-87.745366, 15.03025]
output DEM = El_Cajun/outDem.grd
output Lake = El_Cajun/outLake.grd
gdal_merge.py -o El_Cajun/srtmMerge.tif El_Cajun/data/N14W088.hgt El_Cajun/data/N15W088.hgt
0...10...20...30...40...50...60...70...80...90...100 - done.
resizing dem El_Cajun/srtmMerge.tif to = new file=El_Cajun/srtmNew.tif to: -88. 14.800 -87.400 15.400
gdalwarp -r near -te -88. 14.800 -87.400 15.400 El_Cajun/srtmMerge.tif El_Cajun/srtmNew.tif
Creating output file that is 2160P x 2160L.
Processing El_Cajun/srtmMerge.tif [1/1] : 0...10...20...30...40...50...60...70...80...90...100 - done.
Opening dem: El_Cajun/srtmNew.tif
data type: Int16
17 2312 None 0.0002777777777777751 2160 2160
reshaping file as 2160 2160
row col of lake 1339 918
Lake dem= 285 Downdam dem= 266 Jump= 19
2 True False
delta, dmax= 100 1339
delta, dmax= 200 1339
delta, dmax= 300 1339
delta, dmax= 400 1339
delta, dmax= 500 1339
delta, dmax= 600 1339
delta, dmax= 700 1339
delta, dmax= 800 1339
delta, dmax= 900 1339
delta, dmax= 1000 1339
delta, dmax= 1100 1339
delta, dmax= 1200 1339
delta, dmax= 1300 1339
vv# 1334 1336
real 0m16.363s
user 0m7.101s
sys 0m2.013s
Now you can setup the NAMI DANCE calculation by specifying “outDem.grd” as bathymetry and “outLake.grd” as deformation file. Then the NAMI DANCE computation can start
References
- Annunziato, P. Probst, T. Petroliagkis - Lao Lao People’s Democratic Republic Flash Flood due to Dam Collapsing People’s Democratic Republic Flash Flood due to Dam Collapsing – JRC Emergency Report, Activation #14, 25 July 2018.
- Annunziato, I. Andredakis, P. Probst; Impact of flood by a possible failure of the Mosul dam; EUR 27923 EN; 2016. [CrossRef]
- Khazaei, Bahram; Read, Laura K; Casali, Matthew; Sampson, Kevin M; Yates, David N (2022): GLOBathy Bathymetry Rasters. figshare. Dataset. [CrossRef]
- José Ráurium Bacalhau, Alfredo Ribeiro Neto, Jean-François Crétaux, Muriel Bergé-Nguyen, Daniel Medeiros Moreira, - ‘Bathymetry of reservoirs using altimetric data associated to optical images,’ - Advances in Space Research, Volume 69, Issue 11, 2022, Pages 4098-4110, ISSN 0273-1177. https://www.sciencedirect.com/science/article/abs/pii/S0273117722001971.
- SRTM topography database is from NASA: https://www2.jpl.nasa.gov/srtm/, We propose the method by D. Watkins to download: https://dwtkns.com/srtm30m/.
- Tufekci-Enginar, D., Dogan, G.G., Suzen, M.L. et al. Performance analysis of open-source DEMs in tsunami inundation modelling. Earth Sci Inform 15, 2447–2466 (2022). [CrossRef]
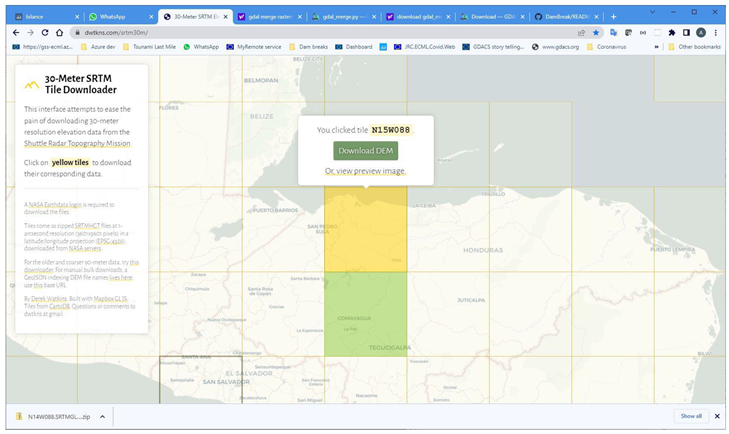
Figure 1.
Picture showing the general procedure to select and download a topography section of interest from the https://dwtkns.com/srtm30m/ website.
Figure 1.
Picture showing the general procedure to select and download a topography section of interest from the https://dwtkns.com/srtm30m/ website.
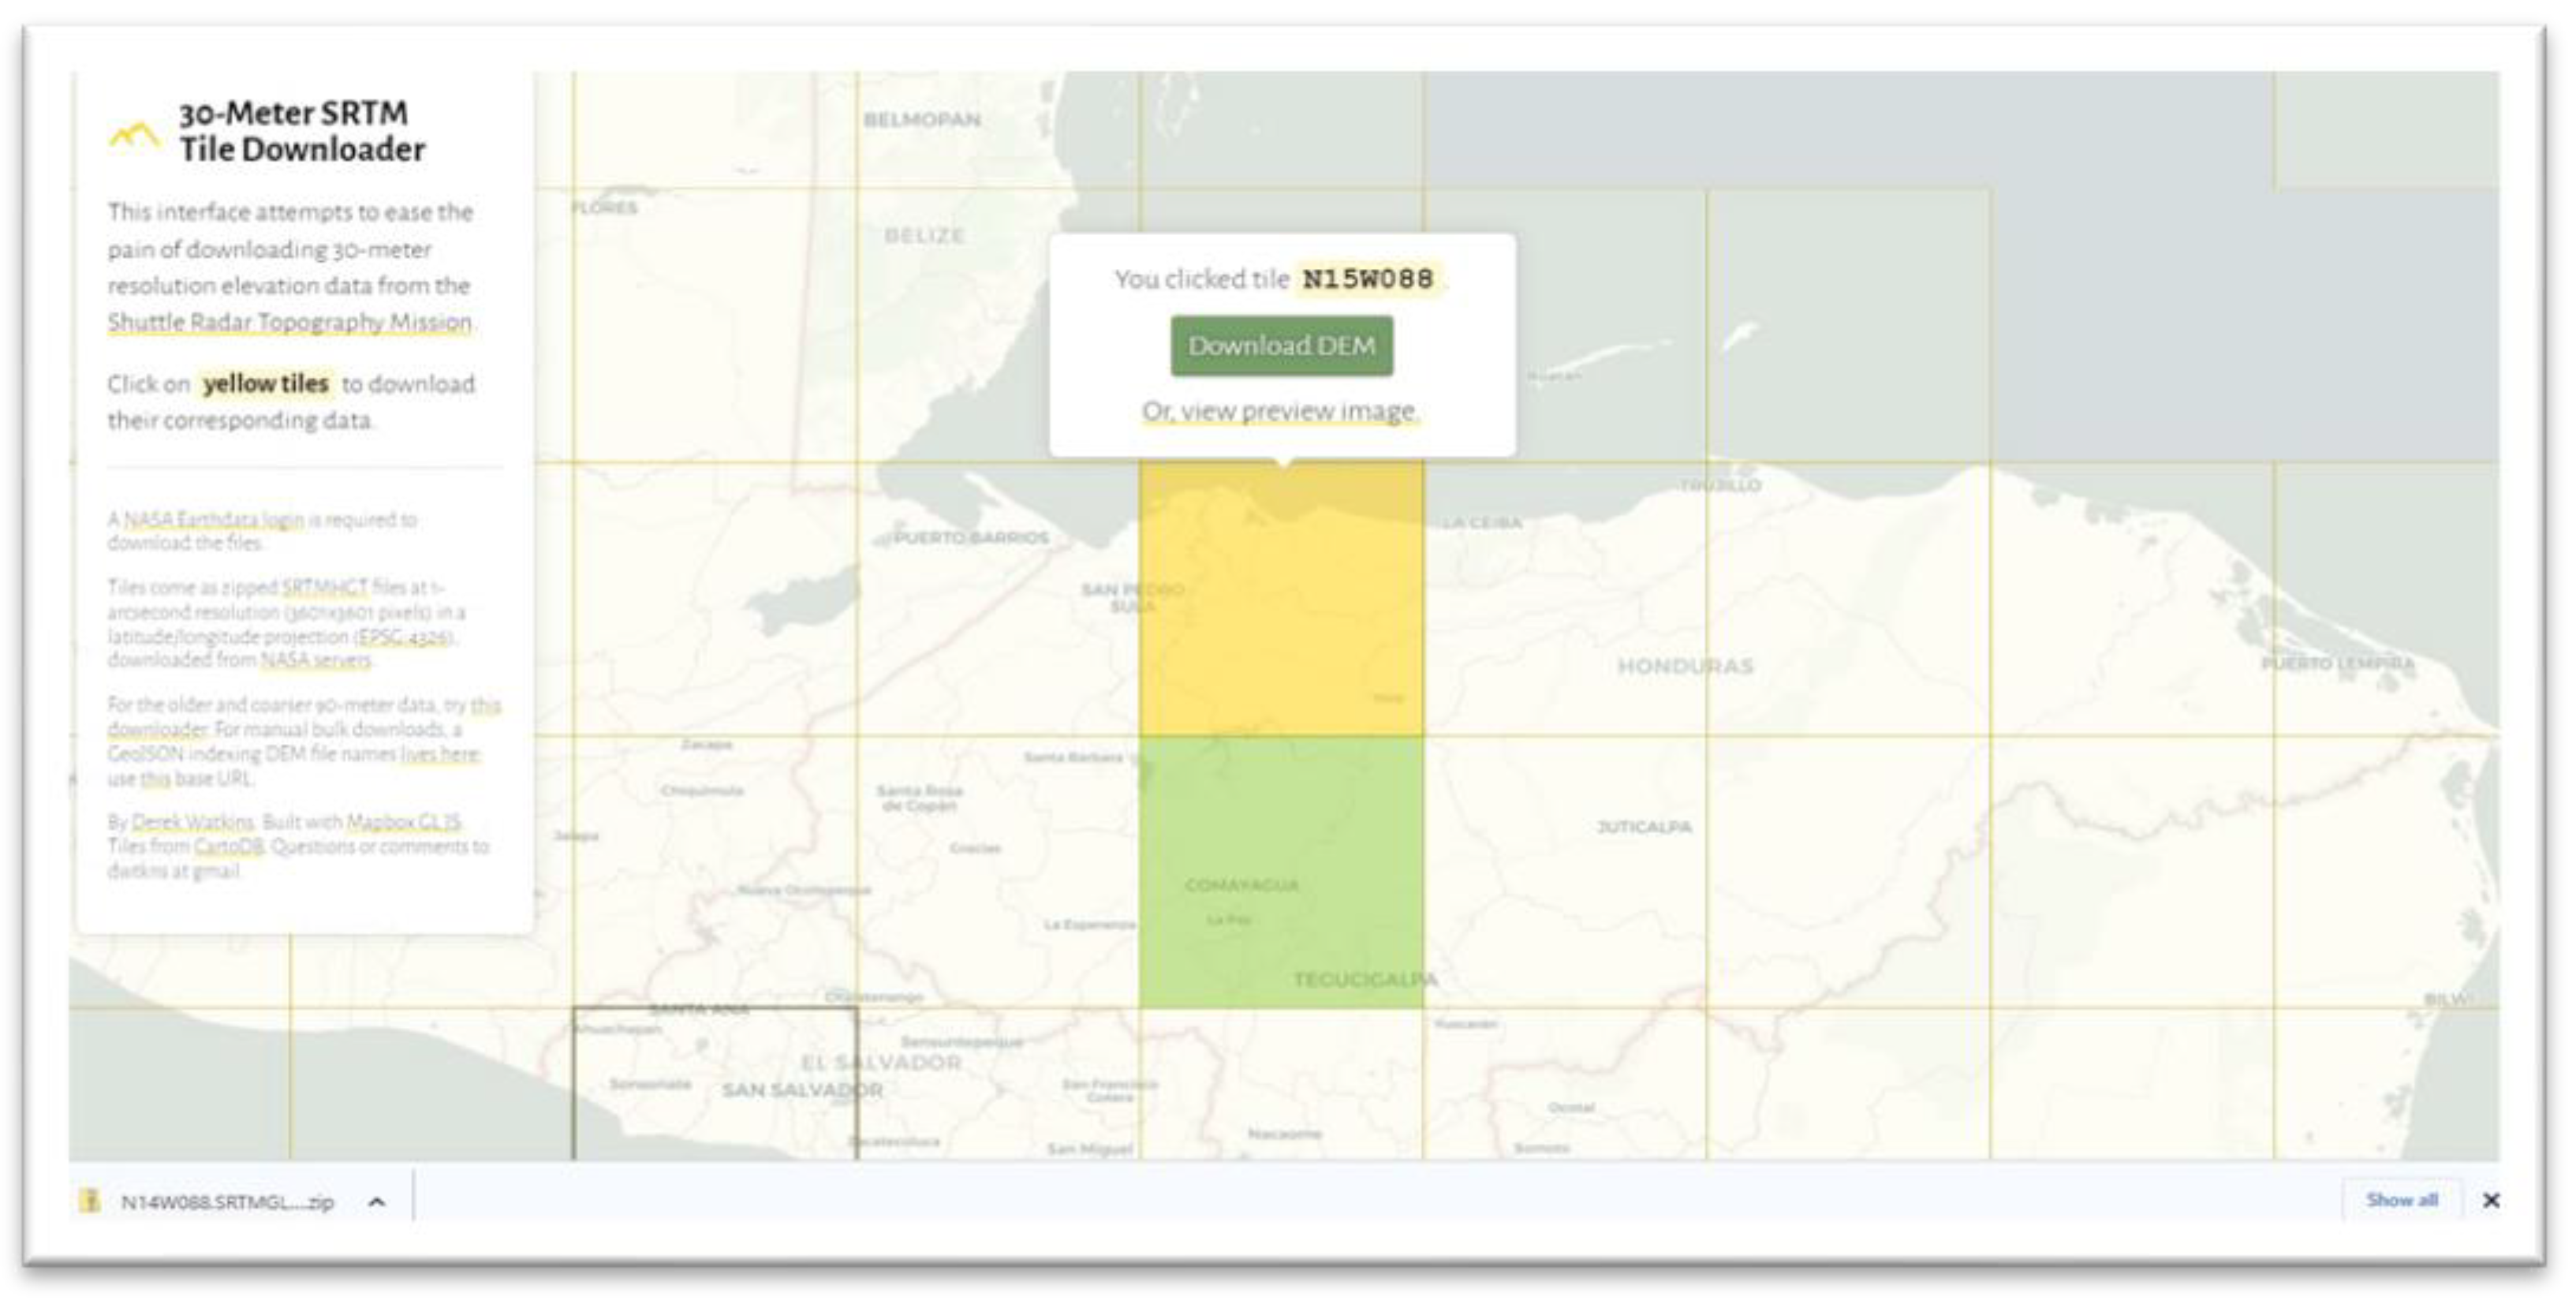
Figure 2.
Approximated extent of the lake obtained by identifying the points at the same elevation of the lake upstream the dam.
Figure 2.
Approximated extent of the lake obtained by identifying the points at the same elevation of the lake upstream the dam.
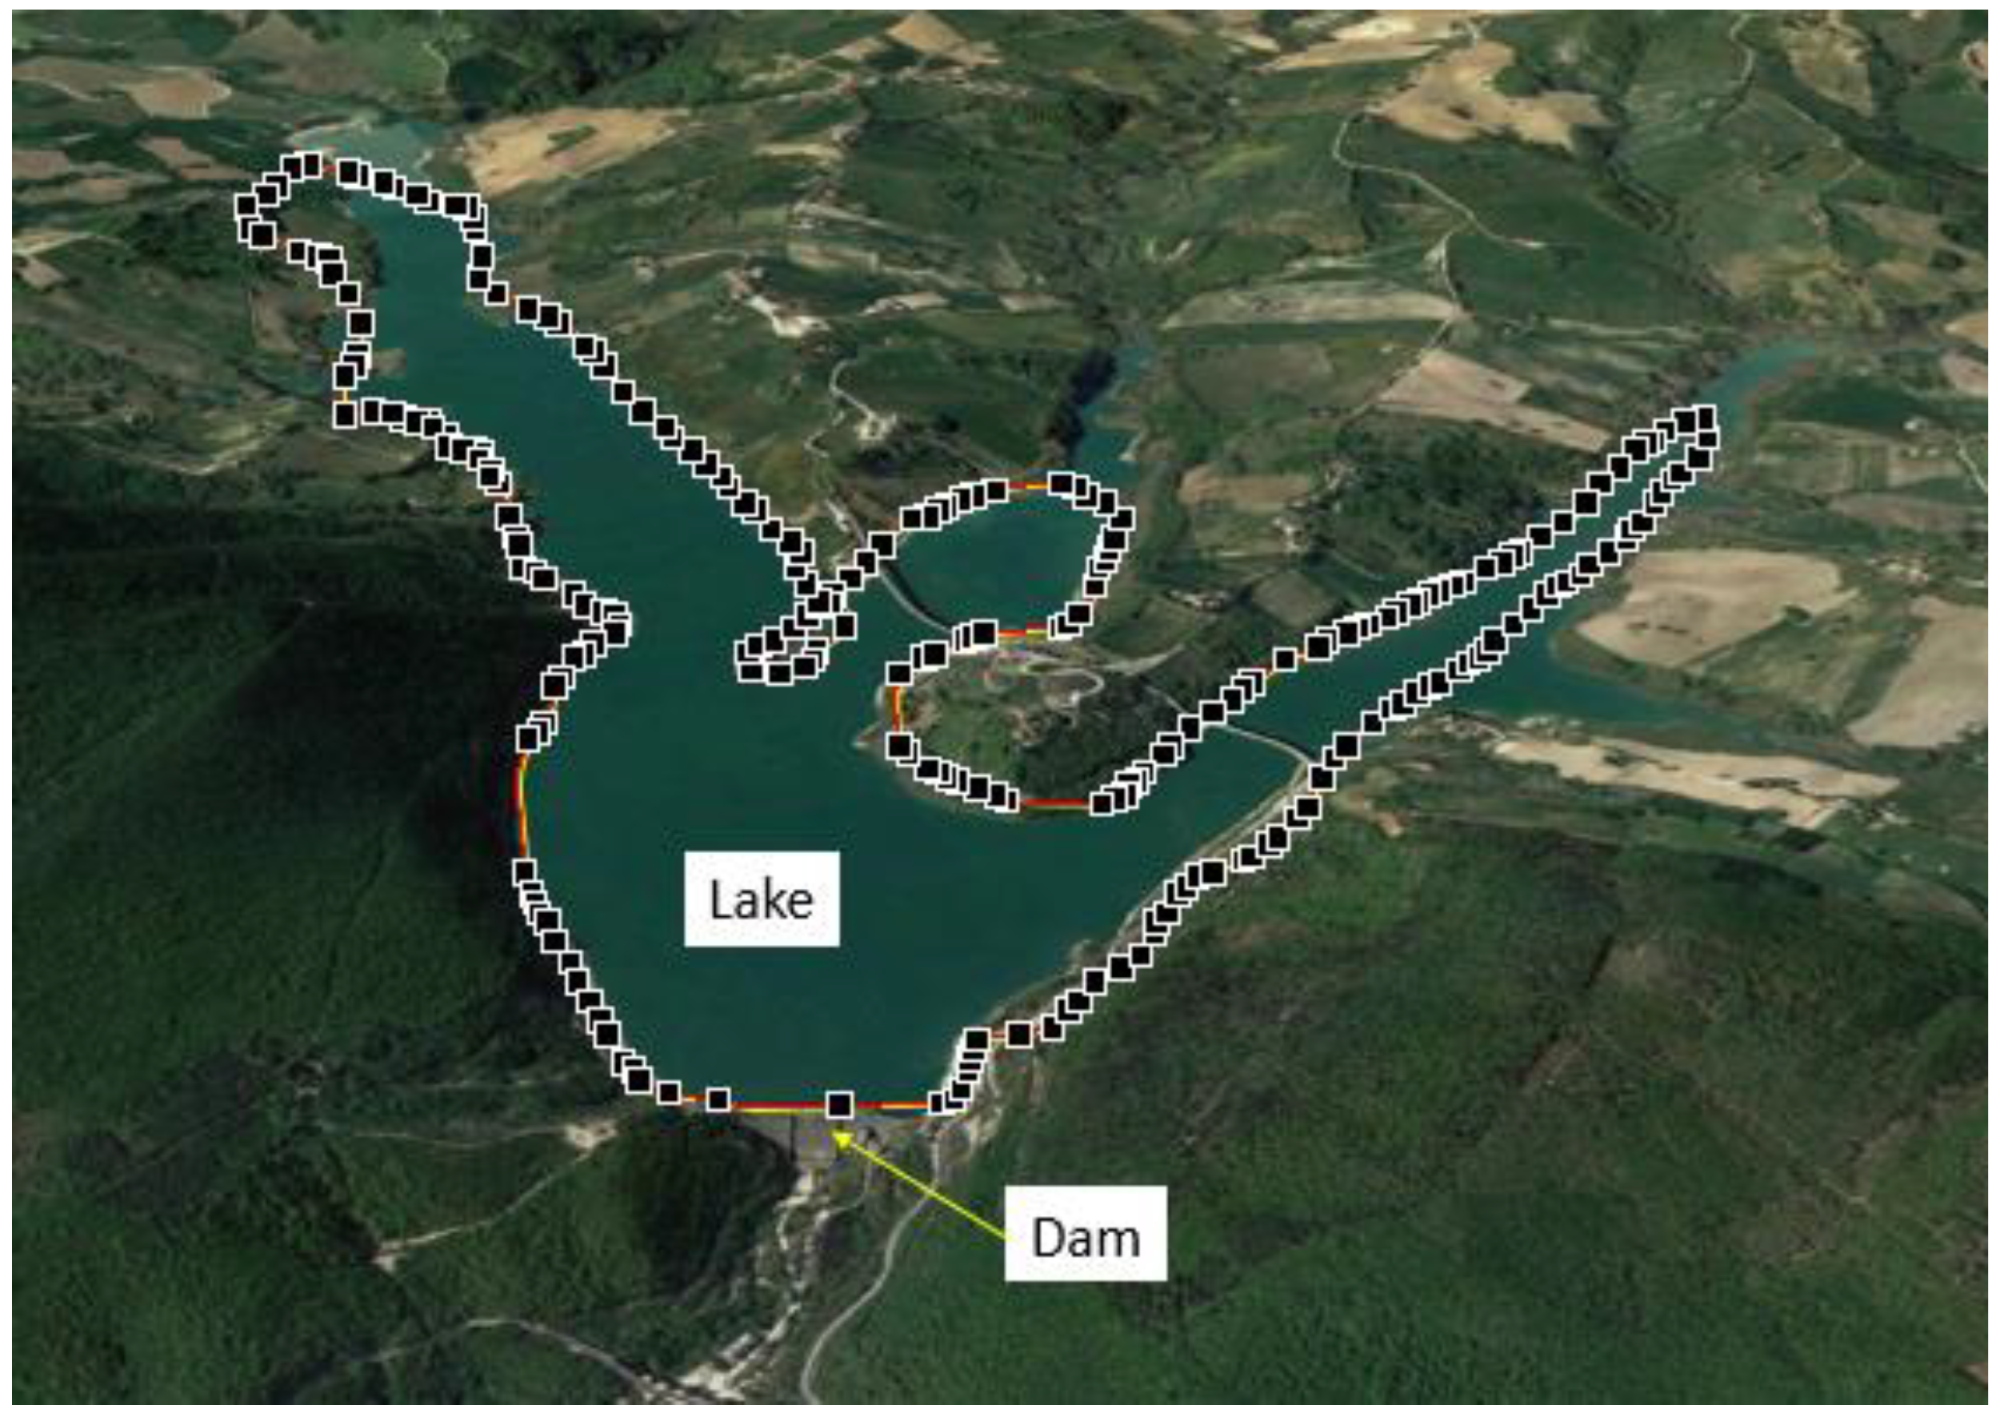
Figure 3.
Depth profiles of the dam lake.
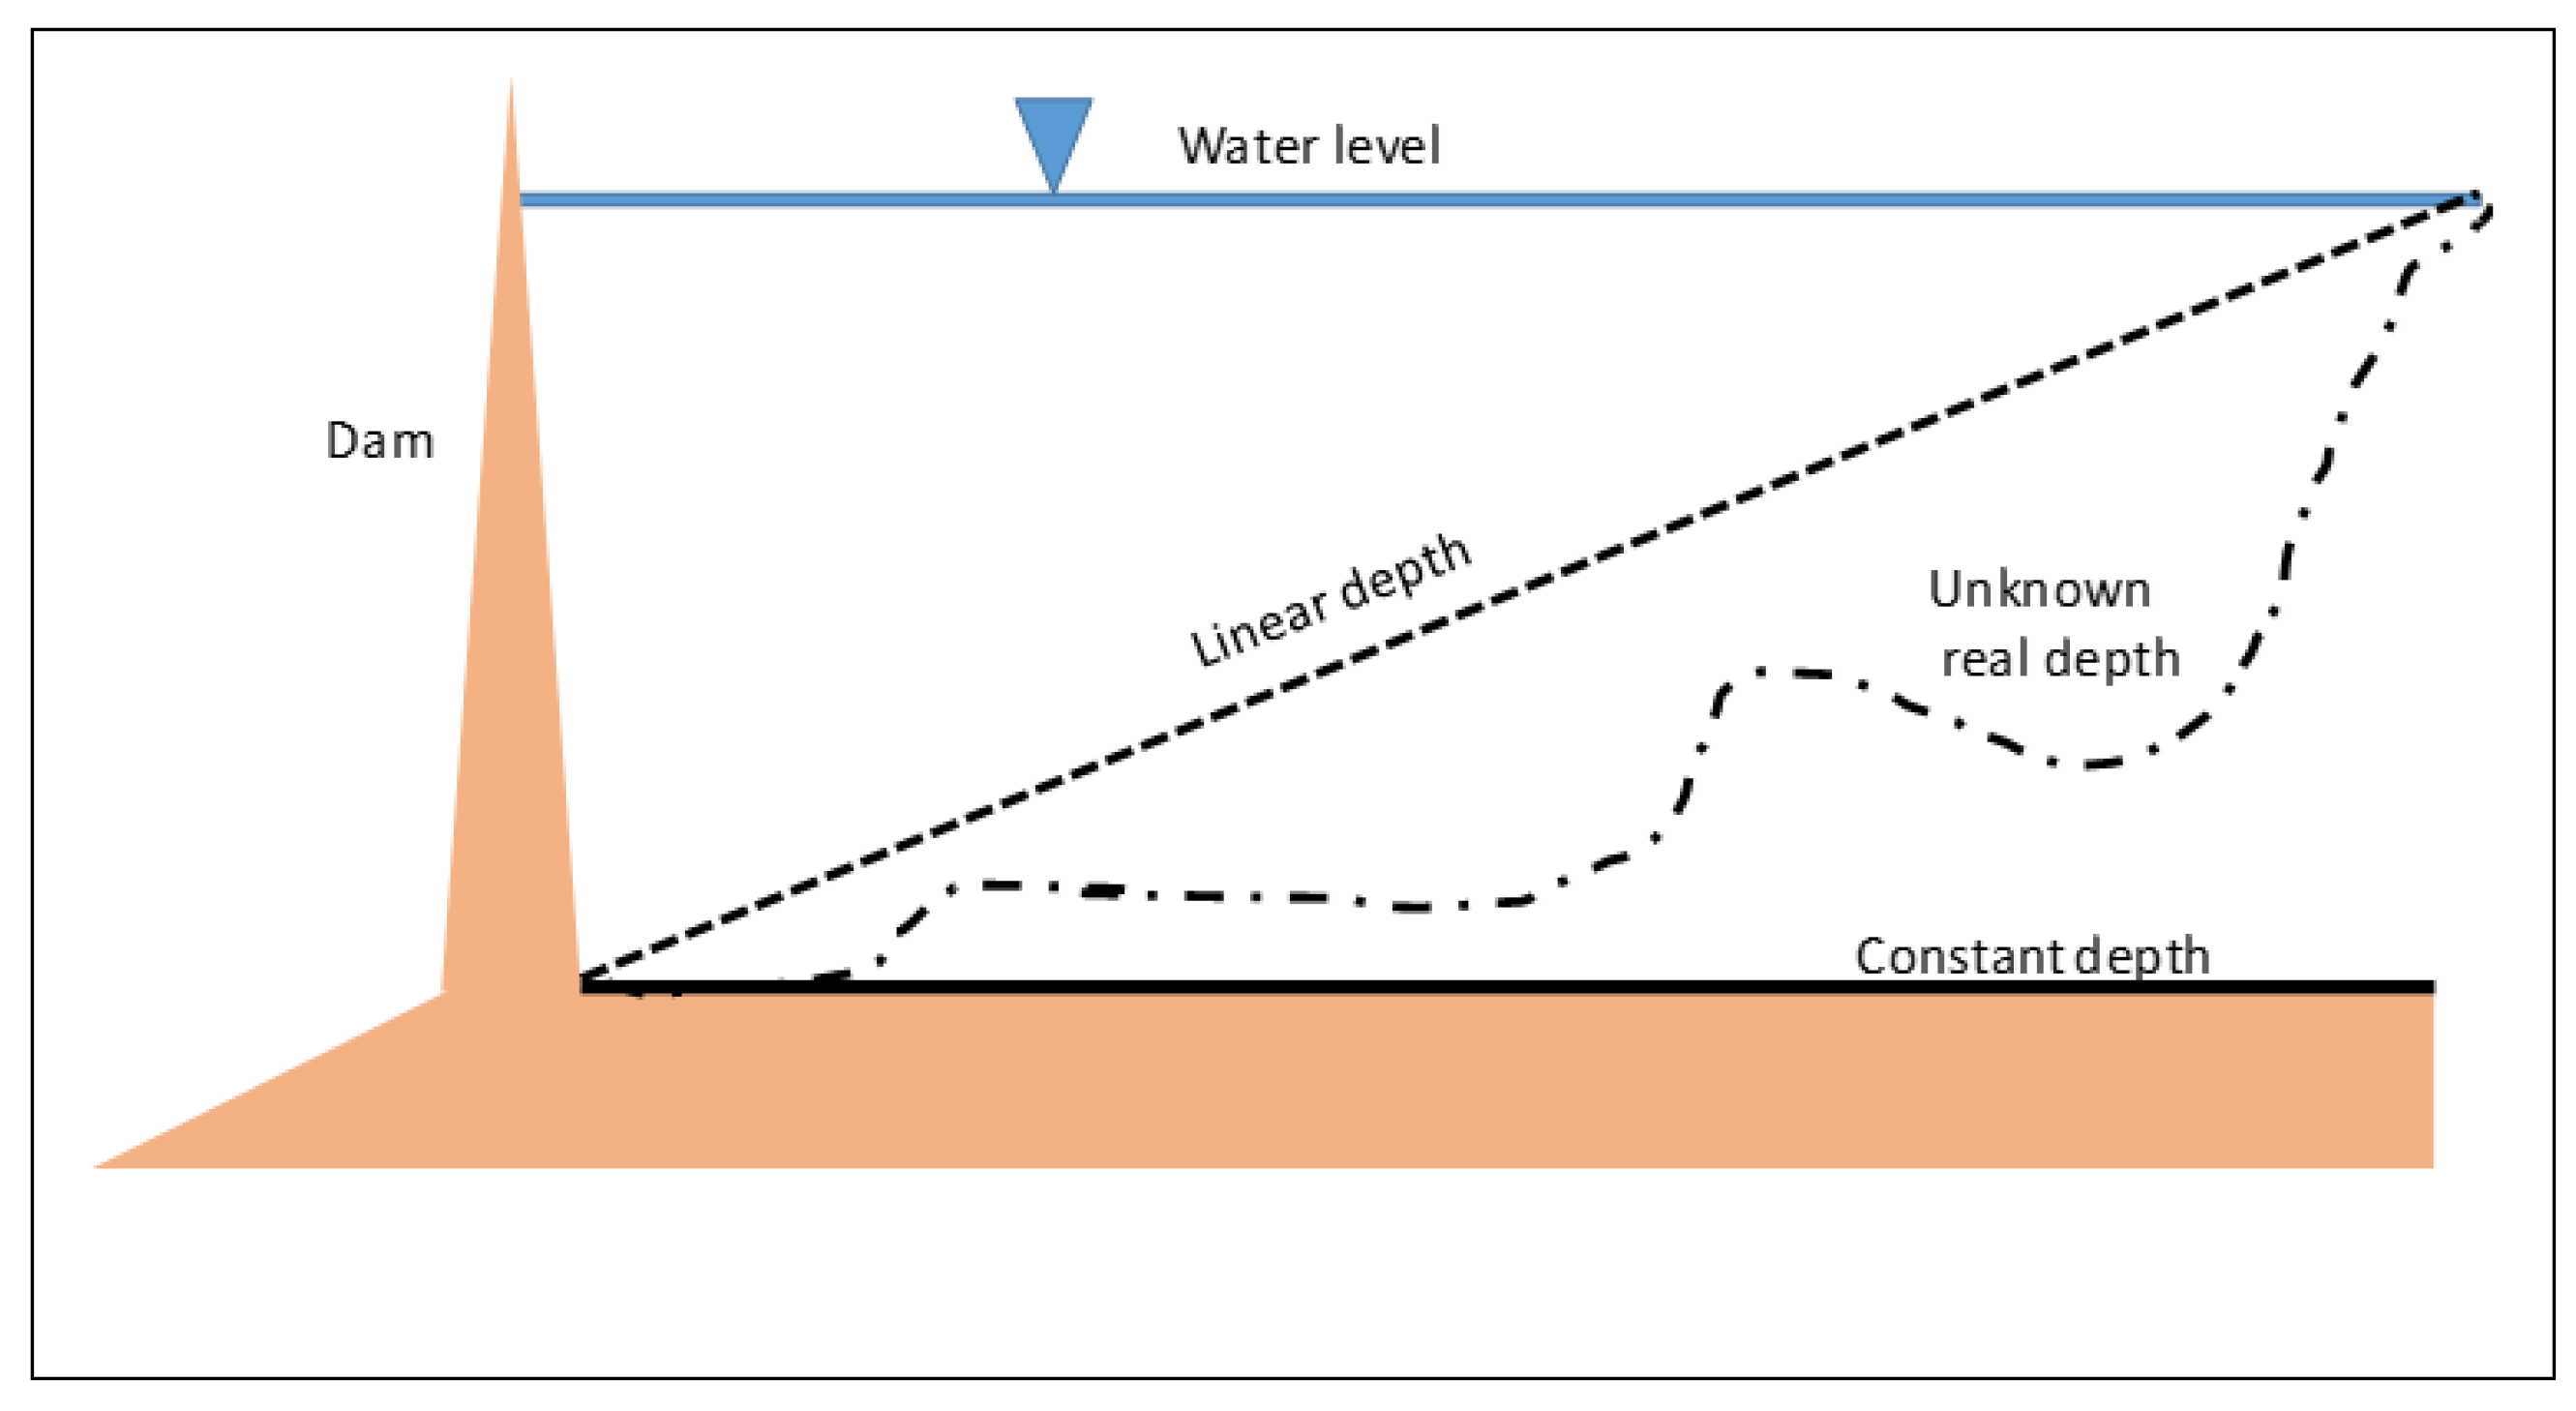
Figure 4.
Explanation of the water flow needs.
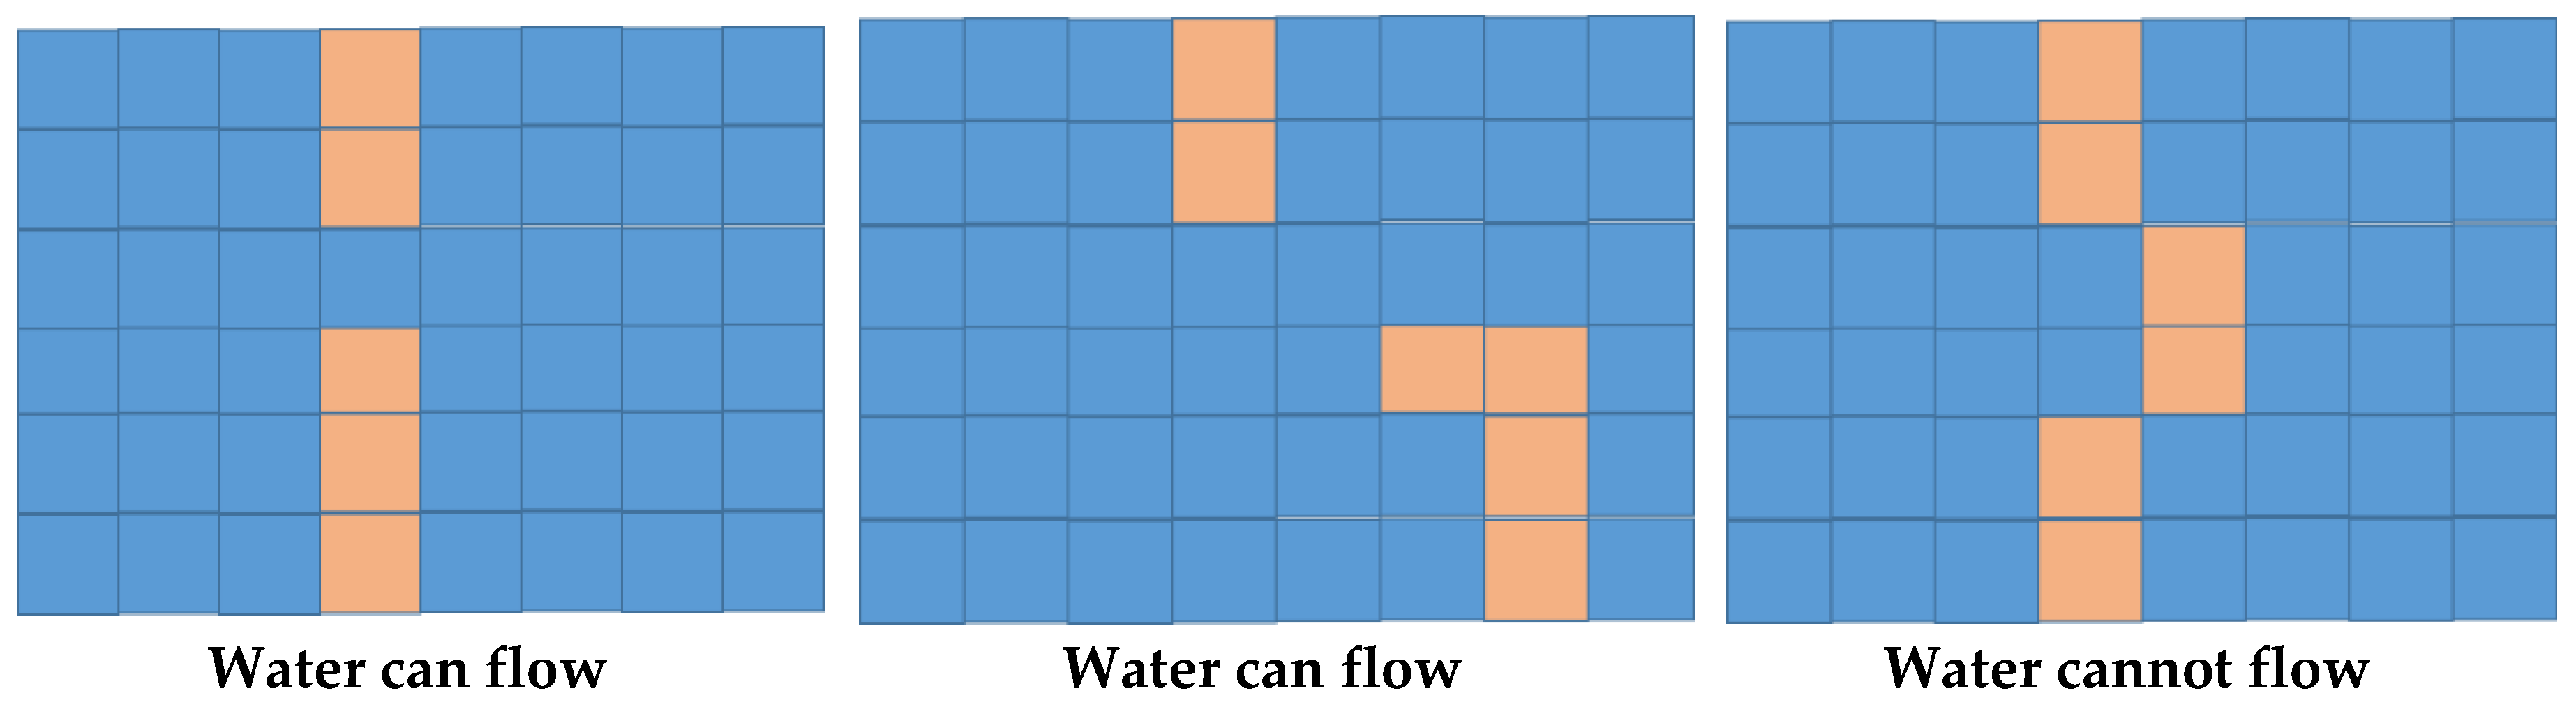
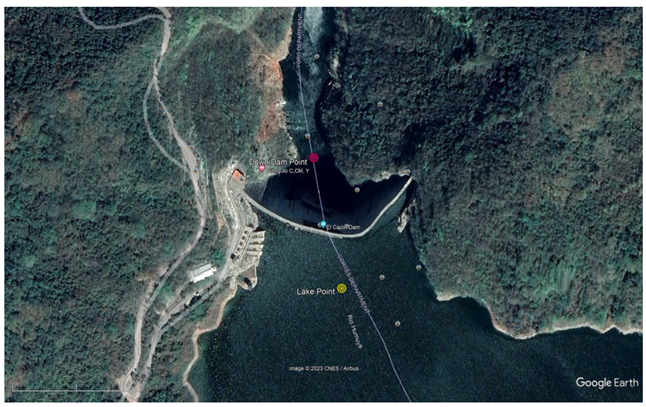
Figure 6.
Location of the observation points: lake and down dam points.
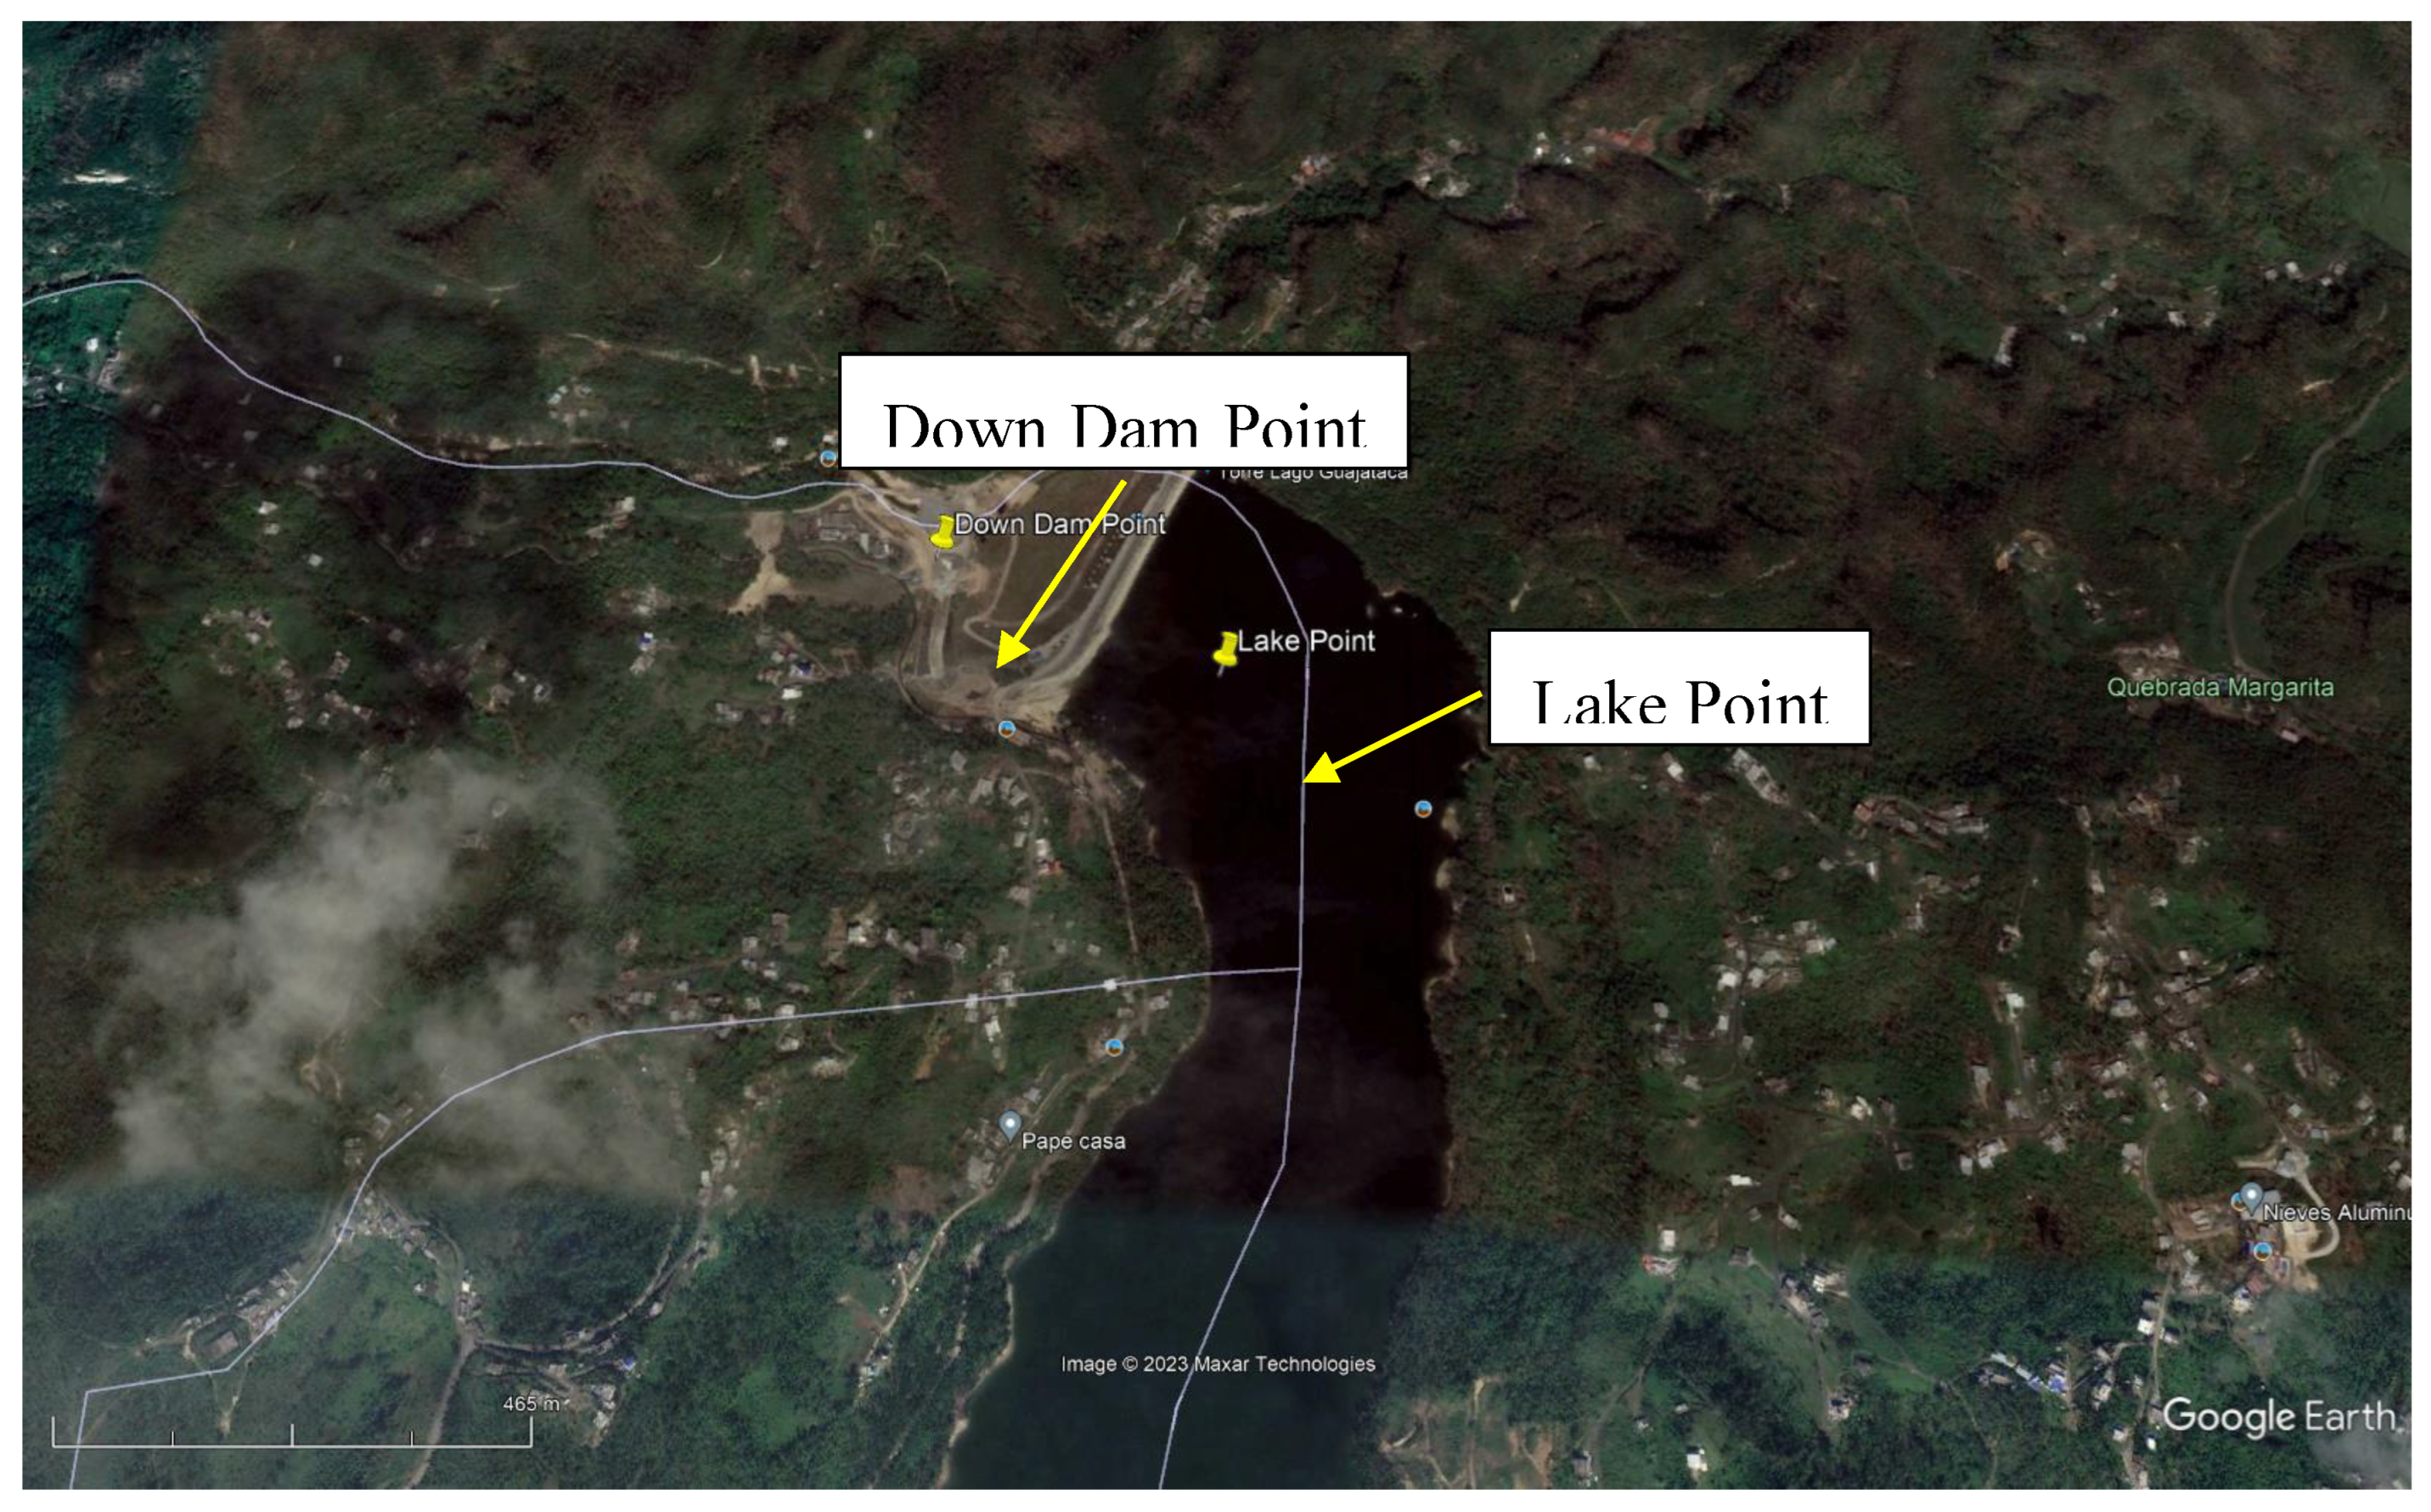
Figure 7.
Identification of calculation extent.
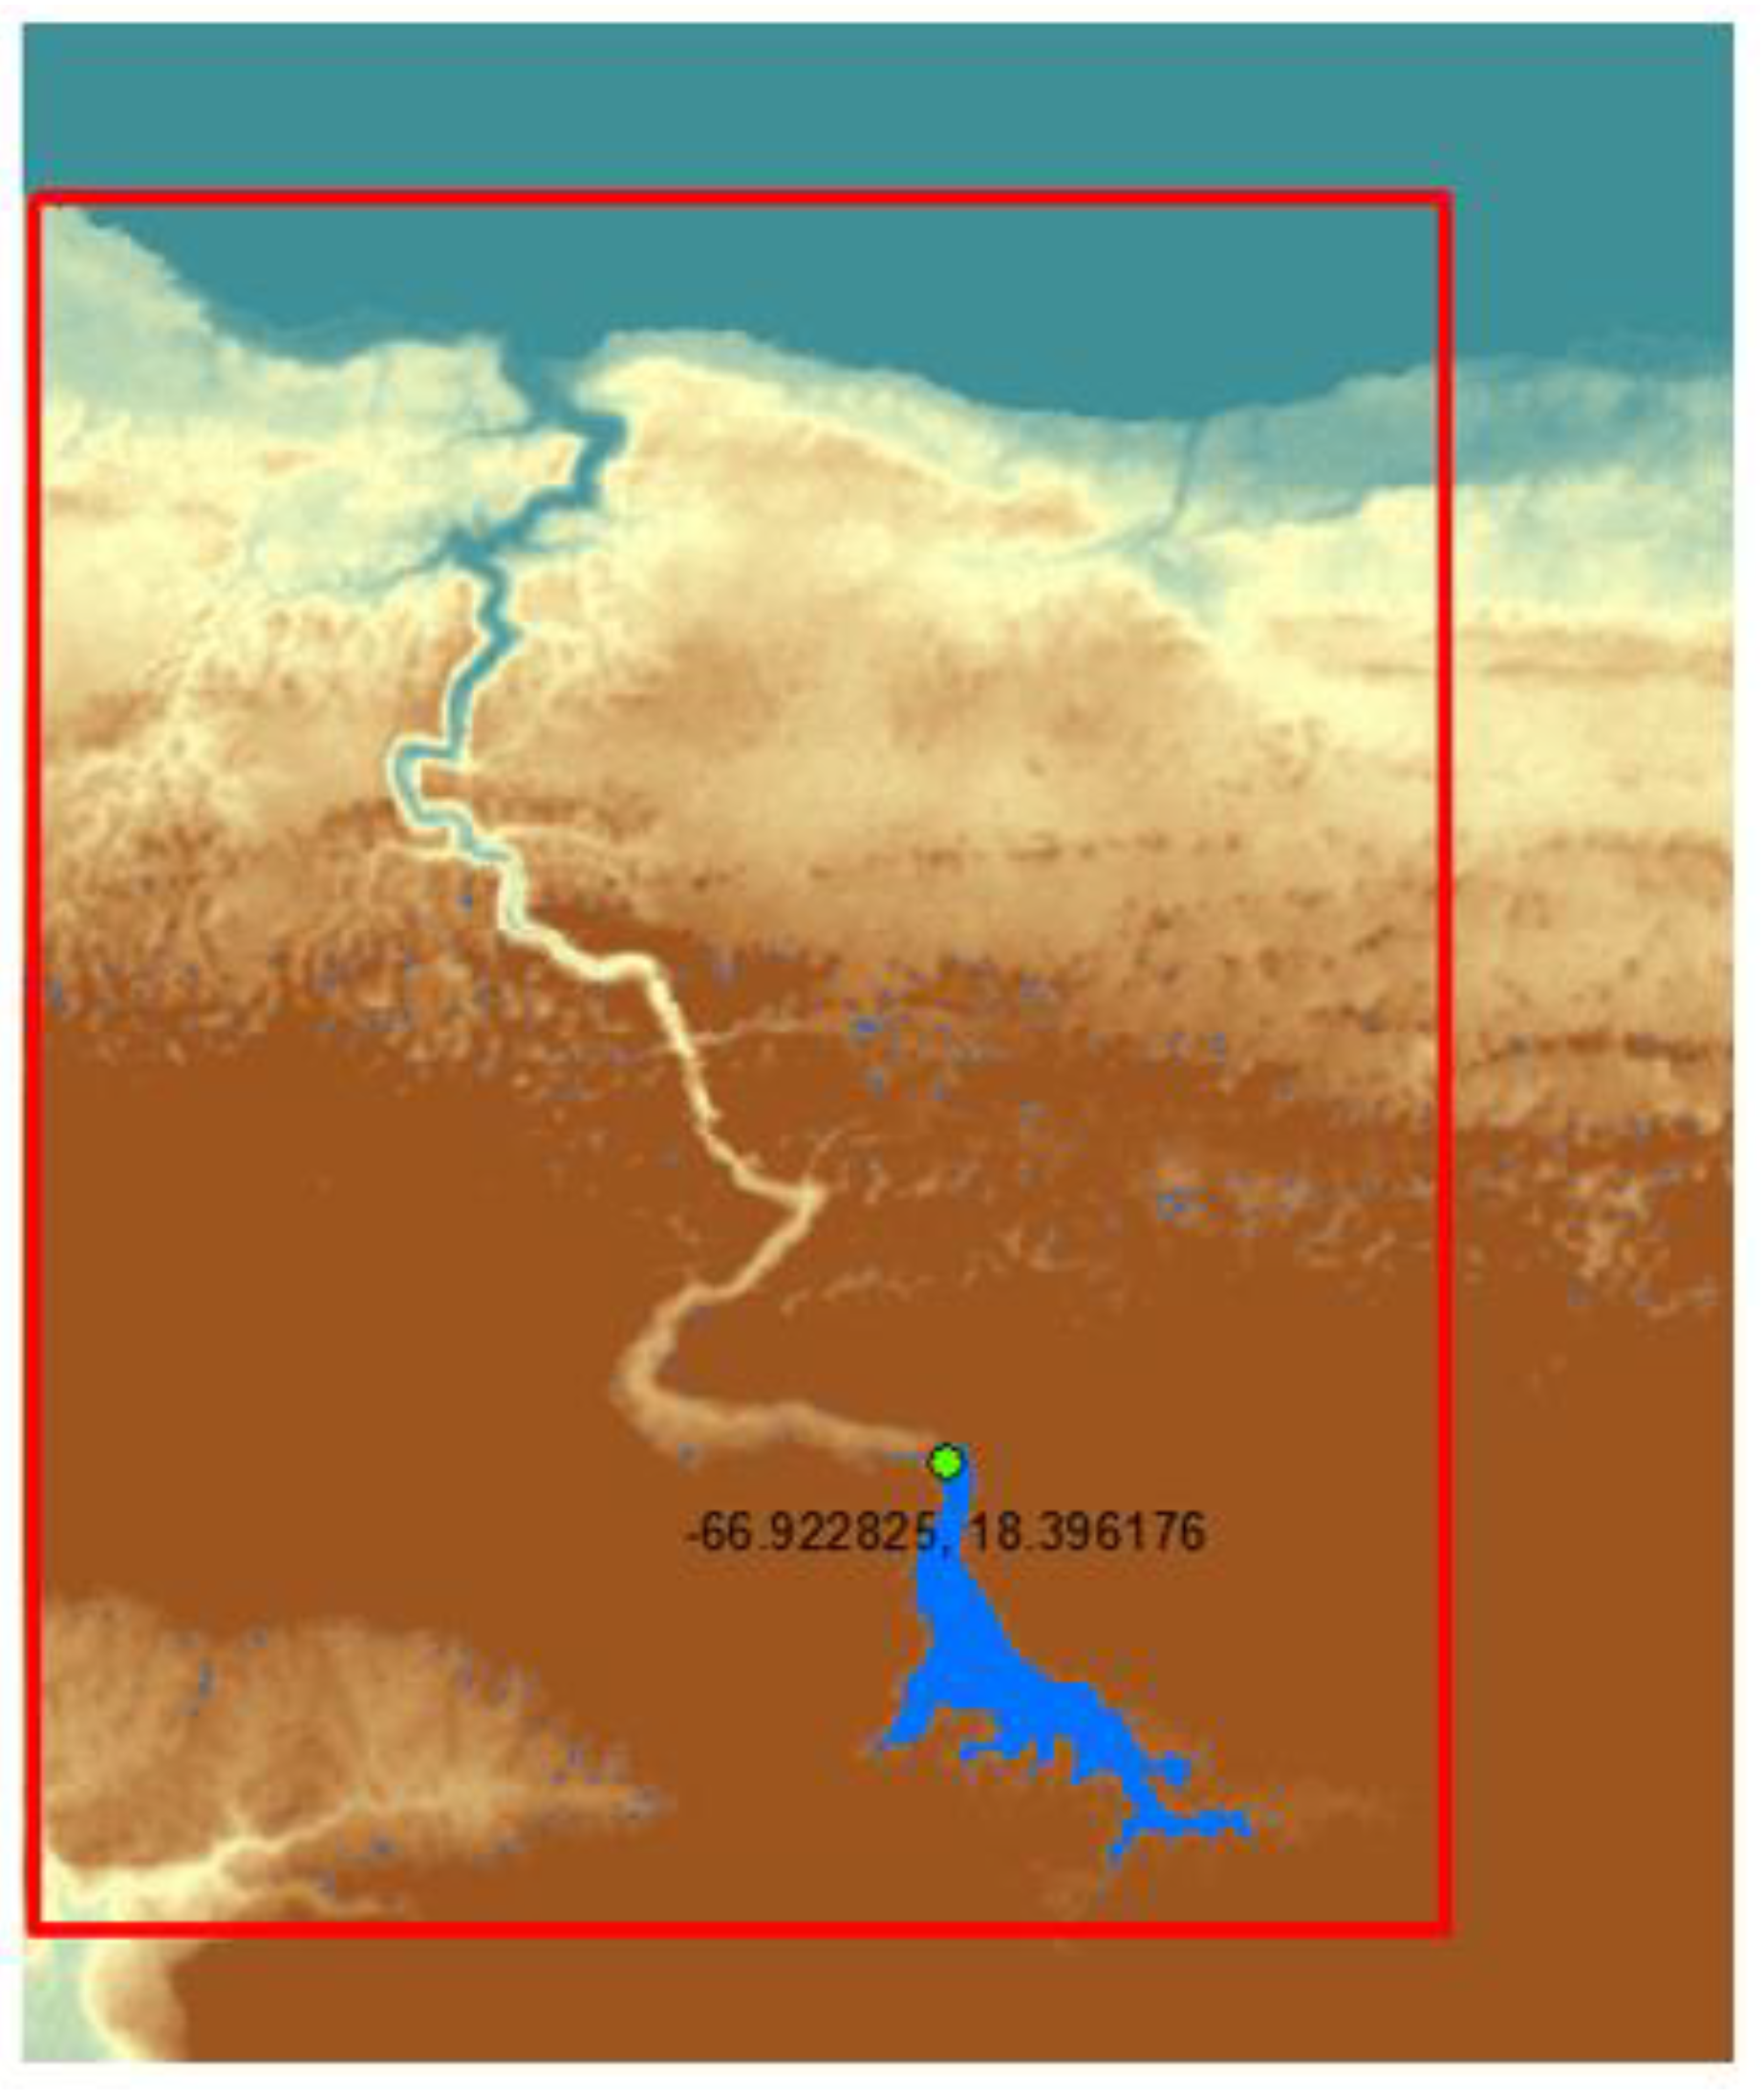
Figure 8.
Maximum Water height in the whole calculation extent (left) and in one specific location where a city is located.
Figure 8.
Maximum Water height in the whole calculation extent (left) and in one specific location where a city is located.

Figure 9.
Water propagation after the dam break event.
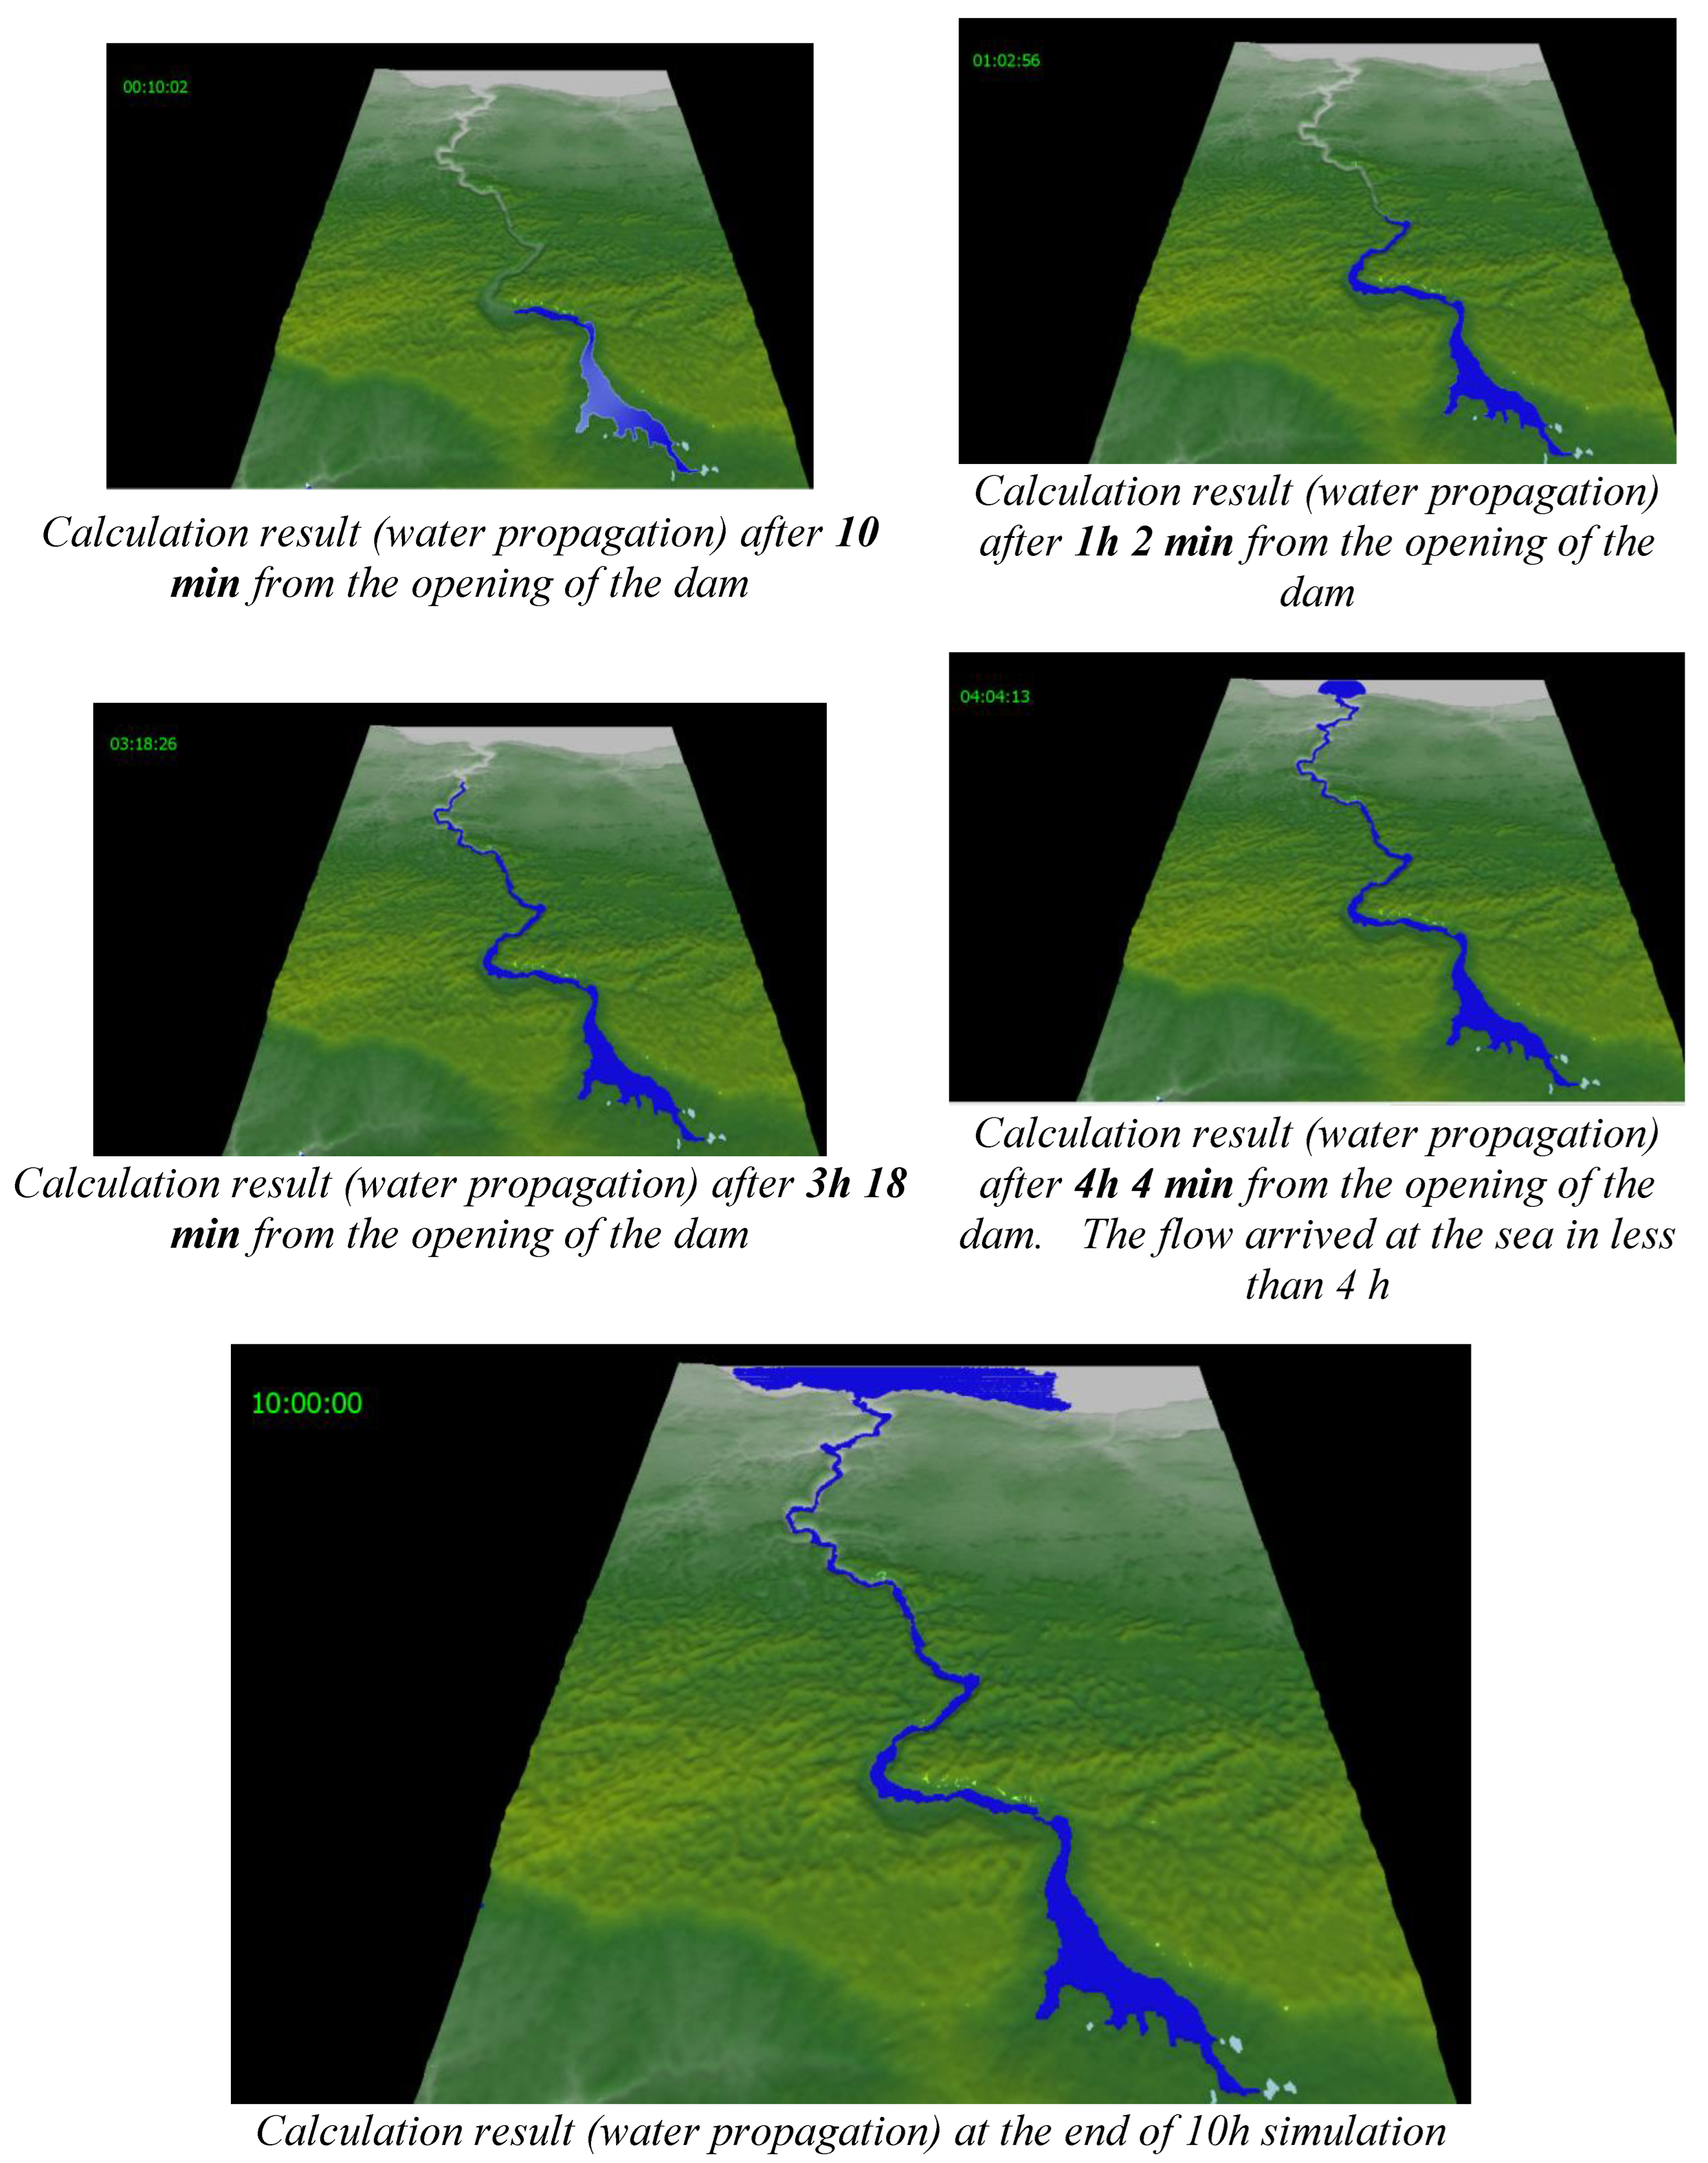
Figure 10.
Arrival time estimated for the case.
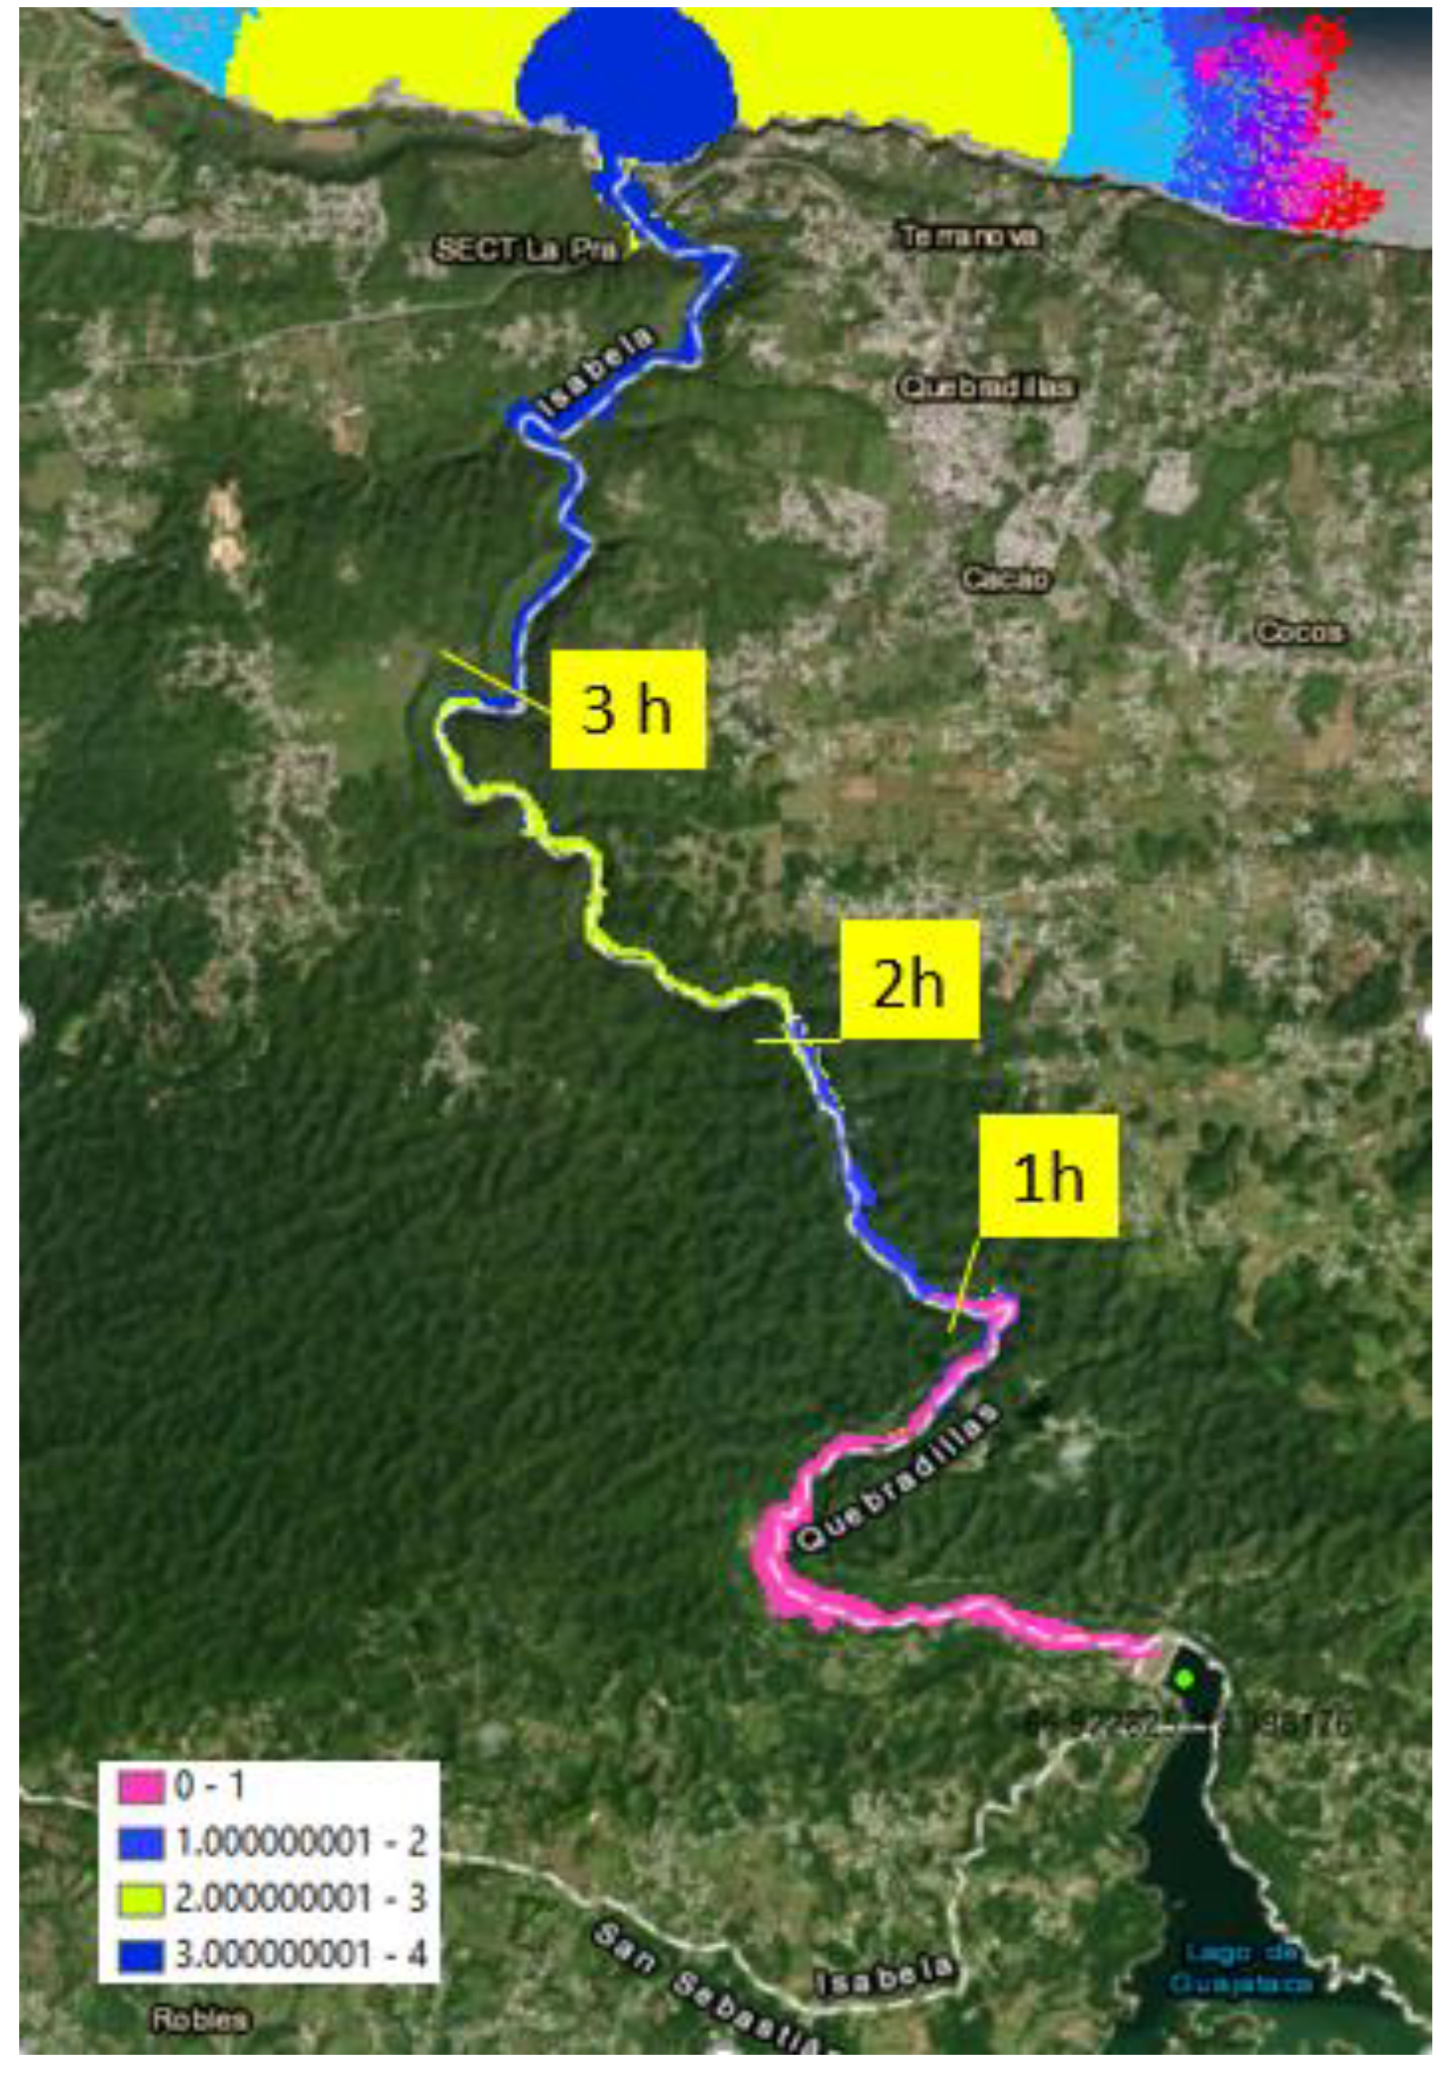
Figure 12.
Timeline of relevant points.
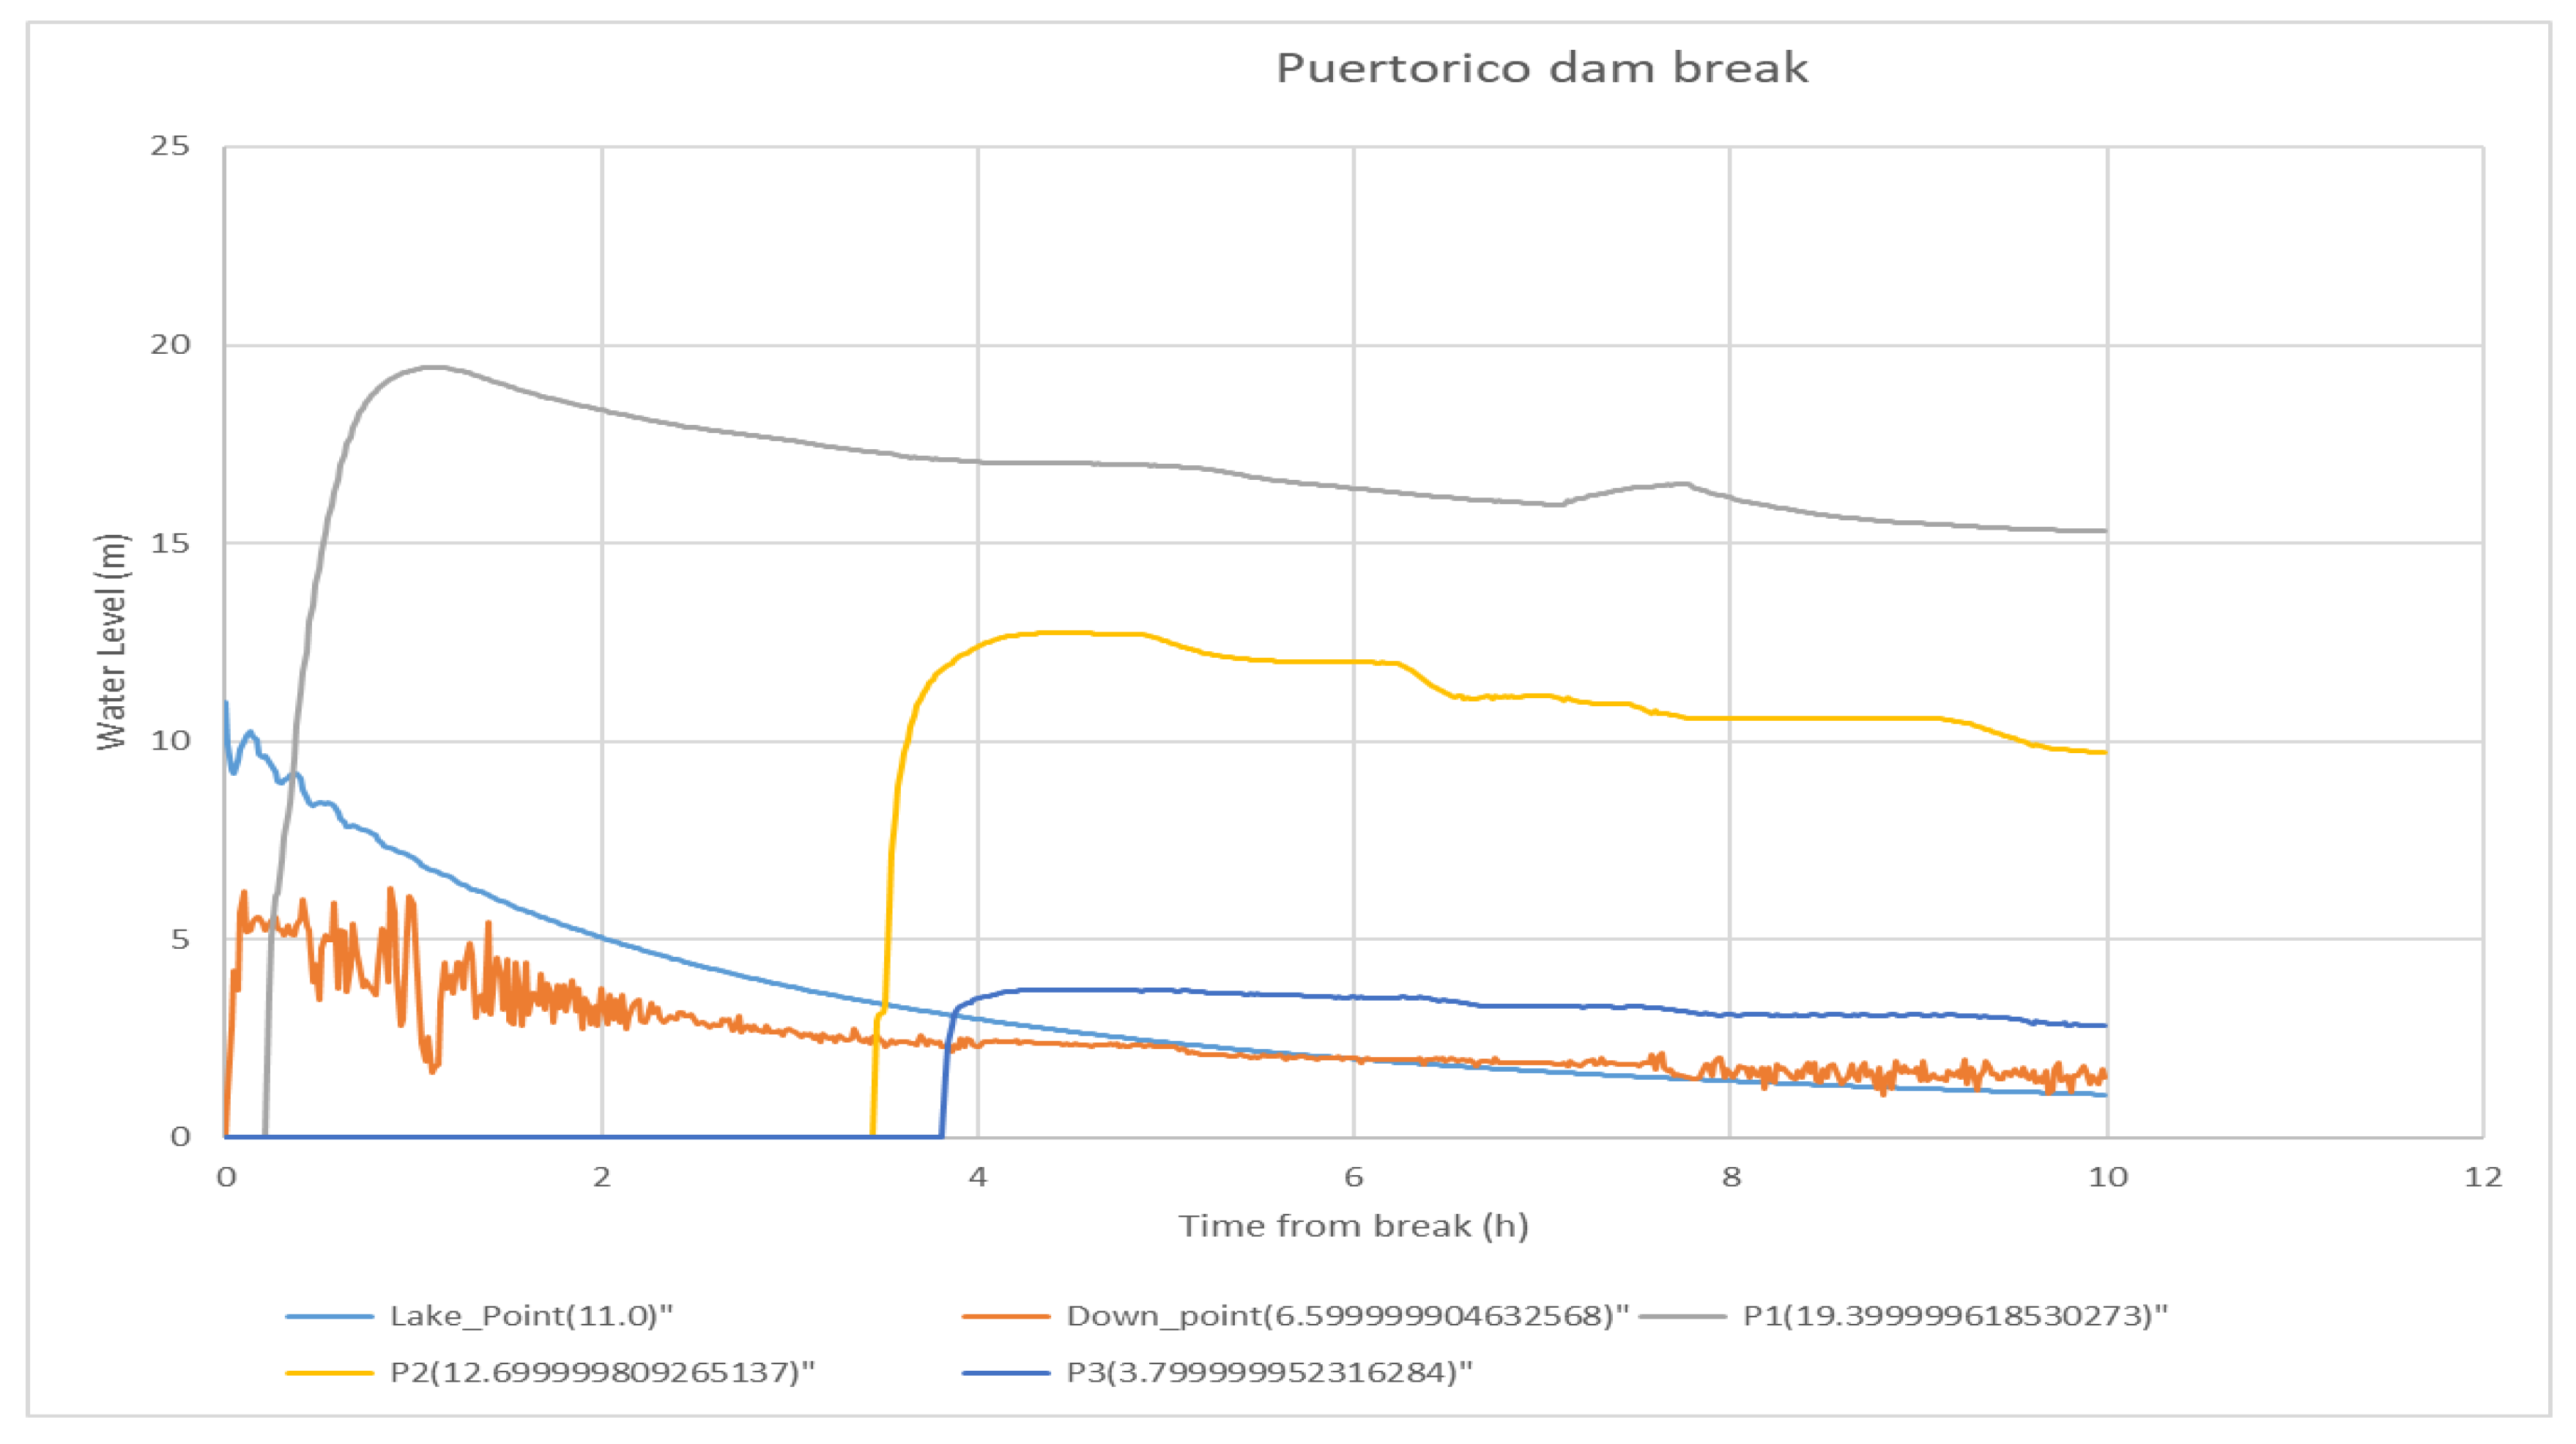

Table 1.
Estimated Population involved.
| Height | Number of People LANDSCAN 2014 |
Number of People GHSL 2015 |
|---|---|---|
| 0-0.05 m | 4709 | 5062 |
| 0.05-1 m | 37344 | 37872 |
| 1-3 m | 680 | 819 |
| 3-10, | 55 | 129 |
| 19-20 m | 0 | 0 |
| >20m | 0 | 0 |
| TOTAL | 38079 | 43882 |
Disclaimer/Publisher’s Note: The statements, opinions and data contained in all publications are solely those of the individual author(s) and contributor(s) and not of MDPI and/or the editor(s). MDPI and/or the editor(s) disclaim responsibility for any injury to people or property resulting from any ideas, methods, instructions or products referred to in the content. |
© 2023 by the authors. Licensee MDPI, Basel, Switzerland. This article is an open access article distributed under the terms and conditions of the Creative Commons Attribution (CC BY) license (http://creativecommons.org/licenses/by/4.0/).
Copyright: This open access article is published under a Creative Commons CC BY 4.0 license, which permit the free download, distribution, and reuse, provided that the author and preprint are cited in any reuse.


