Submitted:
13 October 2025
Posted:
14 October 2025
You are already at the latest version
Abstract
The present study examines the mechanisms of overtopping failure and the evolution laws of homogeneous earth embankments during the flood season. To this end, the Changkai embankment in Fuzhou City, Jiangxi Province, was selected as a case study, with seven groups of indoor model tests conducted to consider the effects of different embankment top widths, embankment heights, river water depths, and river flow rates. The test results are as follows: Overtopping failure of earth embankments can be categorised into three distinct stages. The breach formation process can be categorised into three stages: vertical erosion (stage I), breach expansion (stage II) and breach stabilisation (stage III). River water levels and inflow rates were identified as pivotal factors influencing the final morphology of the breach and the flow velocity within it. Conversely, the height of the dike was found to have little influence on the shape of the breach and the flow velocity. The breach width ranges from 6 cm to 12 cm. An increase in water depth, corresponding to a greater difference in water levels on both sides of the river, has been observed to result in a deeper breach and faster widening rate. Elevated water levels have been shown to increase the potential energy of the water, which is subsequently converted into greater kinetic energy during breach formation. This, in turn, increases the flow velocity at the breach. However, a negative correlation has been observed between inflow velocity and flow at the breach. This paper combines the material properties of the embankment to discuss the overtopping failure mechanism and the breach evolution law of homogeneous earth embankments. This provides a basis for preventing and controlling embankment failure disasters.
Keywords:
homogeneous earth embankment
; overtopping failure
; failure evolution
; model test
; disaster mechanism
1. Introduction
The embankment is the last line of defence against flooding and is a key part of China’s flood control infrastructure. According to statistical data, by the end of 2022, a total of 330,600 kilometres of grade 5 embankments and above had been constructed across the country, protecting 682 million people and 629 million mu of cultivated land. However, the majority of embankment projects were constructed in the early years of the People’s Republic of China. The limitations imposed by the prevailing level of construction technology, in addition to more than half a century passing, have resulted in embankment projects experiencing a succession of potential hazards[1,2]. Given that the country has experienced some of the world’s most severe flooding, it is crucial to understand the mechanisms and progression of dike breaches. This knowledge is essential for effectively implementing dike engineering measures to mitigate the impact of such disasters[3,4].
Researchers at home and abroad have conducted systematic research into the mechanisms of embankment bursts and disaster prevention and control, achieving significant theoretical and technical progress[5]. In the context of engineering practice and physical problem analysis, integrating numerical calculations with visual representations has been shown to be a highly effective approach[6]. In numerical simulation, Wang et al. utilised a two-digit model to study the evolution process of a dam-break flood in a specific area[7]. The inundation data acquired during the progression of the dam-break flood were analyzed. Salamtalab et al. proposed a numerical model based on the shallow water equations[8]. A two-dimensional finite element framework was used to solve the problem, and an enhanced approximate HLLC Riemann solver was implemented to accurately treat the discontinuity in the water flow during the dam-break process. Qiu et al. constructed a coupling model of fluid dynamics and the discrete element method to accurately simulate the coupled motion characteristics of fluid and particle phases in a dam-break flood[9]. A variety of typical flood evolution modes were observed as a result. Akgun et al. utilised Flow 3D Hydro software to conduct 2D and 3D simulations of dam breakage[10]. They then made a systematic comparison between the two models in terms of their differences and the applicability of each model in simulating the evolution of dam break flow. Aiming et al. used the Volume of Fluid (VOF) method to carry out a three-dimensional numerical simulation of a dam break[11]. This provided support for the quantitative analysis, prevention, and control of dam break disasters. With the rapid development of artificial intelligence, researchers have also developed a series of numerical models to study dam-break flow in more depth[12]. Seyedashraf et al. employed machine learning techniques to model and analyze the hydrodynamic behavior of dam-break flows, including variations in water level and shock wave propagation[13,14]. Additionally, Vosoughi et al. and Nguyen et al. employed neural network learning to predict the water level in dam-break flows and gain insight into their characteristics[15,16].
Despite considerable progress in recent years in the numerical simulation of dike bursts, such methods rely on specific theoretical frameworks, such as shallow water equations and continuum mechanics theory, or simplified assumptions, such as ignoring microscopic particle migration and the effects of unsaturated seepage on the dam[17,18]. The reliability of the results must be verified by physical tests, which cannot replace the fundamental role of physical testing in revealing the burst mechanism in depth. Due to the scarcity and sparseness of field data on historical events, and the high level of uncertainty associated with it, laboratory testing of dam-break flow is widely considered a valuable benchmark for verifying numerical models[19]. In the field of physical experimentation, Ma et al.[20]investigated the distribution of the flow velocity field and the outflow characteristics of the overflow dam of a tailings dam. They proposed a calculation model for the flow velocity field under different flow conditions and constructed a flow estimation method based on the flow velocity equation. Using a flume test device, Niu et al.[21]conducted a series of model tests under varying inflow rates, subdividing the river blockage–dam break coupling process into four distinct evolutionary stages. This study yielded novel concepts for the subsequent design of similar tests and provided valuable experimental references for preventing and controlling dam break disasters. Wang et al.[22] deduced an approximate analytical solution by considering the friction effect of levee break flow in a horizontal triangular channel through indoor physical experiments. This revealed how river channel morphology regulates the motion characteristics of the break front. Xu et al.[23] conducted a systematic analysis of the landslide dam failure mechanism. This was achieved by carrying out multiple sets of laboratory tests, which made it possible to quantify the strength of the various influencing factors.
However, existing physical experimentation has predominantly focused on macroscopic characteristics such as flow velocity and discharge, and has not yet penetrated the mesostructure level of the dam body [24,25]. This makes it difficult to fully reveal the intrinsic nature of the failure mechanism. In light of the above research deficiencies, this paper adopts physical model testing as its core methodological approach. Data is collected using high-precision test instruments, including a pore water pressure gauge and an earth pressure sensor. Comparative analyses are conducted on the vertical expansion rate of the breach, velocity distribution in the breach section, dynamic changes in the earth pressure of the dam body, and the response law of pore water pressure under different embankment heights, initial water levels, and inflow conditions. Furthermore, the dynamic response mechanism of each control factor throughout the levee breach initiation, development and stability process is systematically explored. Combining the test results with the internal mechanism of a dike breach provides a comprehensive understanding of the underlying processes. This serves as the theoretical basis for the design of pre-disaster prevention and control measures in dike projects. Additionally, it provides technical support for formulating emergency response plans in the event of a breach disaster.
2. Test Model and Methodology
2.1. Prototype Background
The experiment uses the Changkai Embankment in Fuzhou City, Jiangxi Province, as its prototype. The 82-kilometre-long embankment is located on the right bank of the Fuhe River and is characterised as a closed embankment with the following key parameters: an average height of 5.5 metres, an average elevation of 38.54 metres and a crest width of 10 metres. It covers a total area of approximately 100 square kilometres, protects 140,000 mu of farmland and has a resident population of around 145,000 within its protected scope. On 21 June 2010, the embankment section between Pile Nos. 32+923 and 33+270 suffered a breach triggered by 50-year-return-period rainfall. The evolution and closure process of the breach were as follows: Initially, on 21 June, the breach was 60 m wide. By 22 June, it had expanded to 348 m, and the breach was successfully closed at 18:00 on 27 June. The breach had severe consequences: the affected area was 85.5 km2, the maximum submerged depth was 34.54 m, and the total water storage volume in the flooded area was 296 million cubic metres. Nearly 100,000 people were forced to evacuate their homes, resulting in significant economic losses and wide-reaching social impacts.
The analysis posits that three principal factors have been instrumental in causing the breach to occur. Firstly, the flood is no longer a matter of historical significance. Subsequent to the main flood season, there has been a continuous historical rare heavy rainfall in the city, resulting in a rapid rise in the water level of the Fuhe River. The high precipitation levels and the consequent saturation of the soil in the early stage are indicative of the substantial water content of the soil. In the subsequent stage, the precipitation primarily results in runoff. The occurrence of heavy rainfall resulted in a flood of unprecedented magnitude in the Fuhe River Basin, with the flood frequency attaining a 50-year milestone. However, the current flood control standard of the Changkai embankment is less than once in 20 years, and it is difficult to resist the super-standard flood. Secondly, the soil quality of the embankment foundation is poor. The embankment body at the breach of the dam is composed of fine sand, while the embankment foundation consists of a sand and gravel layer. The structure is characterised by a single, highly permeable component. Due to the early commencement of the flood season, the water level has been consistently high, resulting in the long-term immersion of the embankment, thereby causing its softening. Thirdly, the location of the dam breach corresponds to the point of head-on impact. The breach embankment section is located on the concave bank of the confluence of the dry port and the main stream of the Fuhe River. Following the confluence, the mainstream of the Fuhe River directly impacts the embankment toe, thereby causing the underwater bank toe to be emptied and steepened. The slope of the embankment toe is characterised by softness and saturation, and the shear strength is found to be low. It is evident that structures may be susceptible to collapse when subjected to the forces of elutriation resulting from elevated water levels and wind waves.
2.2. Test Equipment and Materials
The experiment was conducted within the glass tank of the Water Conservancy Experimental Center of Nanchang University. The glass tank utilised in the experiment had dimensions of 3 m in length, 0.5 m in width, and 0.5 m in height. The component parts of the system under consideration are as follows: firstly, a water storage tank; secondly, a river channel section; thirdly, a breach; fourthly, a water outlet section; and fifthly, a baffle. The river section measures approximately 0.5 meters in length, with its width varying according to different test conditions. As shown in Figure 1, the experimental glass sink is presented.
The primary function of this test is to simulate the process of embankment failure. In order to ensure that the internal friction coefficient of the sediment particles utilised in the test is comparable to that of the prototype particles, the test soil materials are configured in accordance with the particle gradation of the soil samples obtained from the Changkai embankment. The soil material with a maximum particle size of 20 mm and a median particle size of d50 = 0.75 mm is selected for the construction of the main particles of the test embankment. As shown in Figure 2, the gradation curve is analogous to the soil composition observed at the Changkai embankment site.
2.3. Test Scheme and Similarity Design
In this experiment, one side of the transparent glass trough is employed as the river channel, and the water level is elevated by the baffle. The location and size of the embankment are arranged under different test conditions, and the DV camera, positioned parallel to the glass trough, is set up for video recording for subsequent conclusion analysis. Following the conclusion of the arrangement process, the test is initiated. The water level on one side of the river channel is elevated by the baffle, and the water level is measured using the transparent measurement sticker. At the designated water level for each operational condition, the inflow is gradually introduced, and the velocity data at the breach is measured using a velocity meter that has been installed in advance. Subsequent to the test, a video recording is utilised for comprehensive analysis.
The model and the prototype demonstrate geometric and gravitational similarity. In accordance with the prevailing parameters of this experiment, the horizontal geometric scale has been designated as 1:100. As the embankment height is employed as a variable, there are divergent scales, as shown in Table 1:
The reliability of the conclusion of this test is confirmed by the actual measurement and analysis of the data. The parameters that were measured during the course of this experiment included the shape of the breach, the flow velocity, and the water level. The following instruments are utilised: The LGY-III multifunctional intelligent flow meter and DV camera.
In this experiment, the influence of dam elevation, river water level and inflow rate on levee breach is analysed under the condition of the same top width. This analysis is based on data regarding breach shape, water level and flow rate. The results of this analysis will deepen our understanding of the mechanism of levee breach, and facilitate the prevention of such breaches, thus avoiding loss of human and financial resources. The exploration of the mechanism of the breach is also beneficial in terms of the subsequent rescue operation, with the aim of minimising any loss. The experiment comprises a treatment group and six additional groups, thus yielding a total of seven distinct test conditions. The soil samples utilised in the test were obtained from the soil of a nearby embankment site. The specific test conditions are delineated in Table 2.
3. Test Results and Analysis
3.1. Evolution of Breach Phenomena
In this experiment, conditions 1, 2 and 3 constitute the water level treatment group, conditions 4 and 5 constitute the embankment height treatment group, and conditions 6 and 7 constitute the inflow treatment group. The analysis of the data from each treatment group has enabled the identification of a discrepancy between the breach process and the breach evolution. As shown in Figure 3, the failure of each group occurred at different times.
As demonstrated in Figure 3, at the commencement of the test, the water level did not attain the height of the embankment, and the embankment itself remained stable. The seven test conditions of the test undergo three stages to complete the breach. The phenomenon under investigation can be summarised as follows: approximately 90 seconds after the commencement of the test, the water level is observed to be level with the embankment, and the overtopping is imminent at this time; at approximately 120 seconds after the commencement of the test, the embankment gradually fails due to overtopping. At this time, a minor breach of the embankment was observed, and a narrow erosion trough gradually formed at the summit of the embankment. The flow velocity increased in comparison with the overtopping. The collapse of the soil on both sides of the embankment was due to the effect of water flow. At this time, the breach mainly developed in a downward direction, and the overall vertical erosion phenomenon was presented. At approximately 270 seconds, the vertical erosion of 90 seconds leads to a deeper and narrower breach shape. At this time, due to the erosion of the water flow, it can be observed that the soil on both sides of the breach begins to collapse downward. At this juncture, the flow rate reaches its maximum stage within the test. In light of the escalating phenomenon of water erosion, the morphology of the breach undergoes rapid and unpredictable changes. The breach as a whole demonstrates a rapid expansion phenomenon; however, when the test reaches 300 seconds, the breach gradually ceases to change. At this juncture, the breach has reached its culmination, and the final breach shape is now discernible. The flow velocity and the breach flow undergo a gradual decrease to zero, and the breach tends to be stable as a whole. It is evident from the experimental data that the test groups 2 and 3 demonstrate a higher velocity of response to elevated water levels in comparison to the treatment group 1. The occurrence of overtopping failure is observed to precede the initiation of the test by 120 seconds, and the rate of breach widening is also enhanced. In the treatment group 4 and 5, it was observed that differing embankment heights did not have a significant effect on the breach, and there was no significant change in the experimental phenomenon when compared with the treatment group 1. The phenomenon of 6 and 7 in the experimental group was similar to that in the treatment group 1, but the break widening was increased, and the widening time was also increased.
During the course of the experiment, the infringement of the seven groups of test conditions is exhibited in three stages. Initially, the infringement is minor, and the flow velocity and water depth undergo negligible changes. At this time, the phenomenon is characterised by vertical erosion and an inclination to spread horizontally. In the second stage of the collapse, the soil layer began to lose stability due to an increase in depth. The collapse mouth underwent a gradual expansion to both sides, and the slope surface away from the river channel exhibited a significantly faster rate of erosion than the river side, due to the action of the water flow. The flow rate and flow rate of the collapse mouth increased and reached maximum values, and the river water level decreased significantly. In the third stage, the discharge of a substantial volume of water into the submerged area results in a decline in the flow and velocity of the breach. This leads to a gradual cessation of breach widening and erosion, thereby stabilising the breach’s shape.
3.2. Influence of Key Factors on Breach Characteristics
3.2.1. Breach Morphology
The shape of the breach is described through the projection of images during, after and at the end of the test. The discrepancy analysis demonstrates the impact of varying operational conditions on the configuration of the breach.
The shape of the breach in the water depth treatment group is shown in Figure 4.
As demonstrated in Figure 4, the water depth is identified as the primary variable, with the final depth of the breach from large to small being the secondary variable. The tertiary variable is the third condition, the secondary condition, and the primary condition. It has been observed that the rate of development of the breach is increasing gradually. The third test condition is the most rapidly expanding, followed by the second, and the first is the slowest.
As demonstrated in Figure 5, there is a lack of statistical significance between the three test conditions of the first, fourth and fifth variables of the test conditions, as well as the height of the embankment and the final depth of the breach. Furthermore, it was observed that the development speed of the breach was essentially unchanging. However, due to the occurrence of force majeure, even if the depth and width remain essentially unchanged, the final breach shape will vary considerably.
As shown in Figure 6, the variables of test conditions one, six and seven correspond to the inflow, and the final depth of the breach is represented by c, b and a, from large to small. The development speed of the breach is increasing step by step; the width of the breach gradually increases from a, b, c, and develops violently from 2-4 minutes to form the final breach shape.
The projection of images during, after and at the conclusion of the test facilitates the depiction of the shape of the breach and the subsequent difference analysis. The influence of differing test conditions on the geometry of the breach is well documented. The test is recorded by the inflow, and the breach phenomenon commences gradually as the water flows over the dam. A comparison of the widening of the breach in the test group of Figure 4 reveals that as the water depth in the river increases, that is, as the water level difference across the river is amplified, the breach becomes deeper and wider at a faster rate. This finding suggests that the water level difference is a primary factor influencing the breach’s width. In circumstances where the water level difference between the two sides of the embankment is substantial, the potential energy generated by the water level is increased. In the event of a breach, the potential energy is converted into kinetic energy, resulting in the rapid development of breach widening. In circumstances where the water level is elevated, the seepage pressure exerted by the embankment soil is substantial. This has a detrimental effect on the stability and compactness of the embankment. Following the occurrence of a breach, the phenomenon of seepage deformation is exacerbated. As demonstrated in Figure 5, the relationship between breach widening and embankment height appears to be inconsequential. There is no significant difference in breach shape and breach widening rate observed in this group of experiments, and the experimental phenomenon is basically consistent with the three stages of breach. The analysis of the breach process and morphology of the three groups of test conditions depicted in Figure 6 reveals that as the inflow rate increases, the breach width also increases. It has been demonstrated that an increase in inflow results in an increase in breach duration and scouring time on both sides of the embankment.
3.2.2. Breach Flow Velocity
Once the test is complete, the flow rate for each test condition is extracted and processed by computer to eliminate invalid data. A comparison of the flow rate under various test conditions is then made, as shown in Figure 7.
As shown in Figure 7, the flow velocity reached its maximum approximately two minutes after the break was initiated, under the first, second and third test conditions. Thereafter, the flow velocity gradually declined alongside a reduction in the breach’s flow rate. The maximum flow velocities recorded for the three test conditions were 83.15 cm/s, 89.15 cm/s and 92.20 cm/s, respectively. There is a clear upward trend.
As shown in Figure 8, the variable under consideration is the embankment height in three test conditions (test conditions 1, 4 and 5). The flow rate gradually decreases in proportion to the breach flow rate, ultimately reaching zero. The maximum flow rates observed for the three distinct test conditions are 83.15 cm/s, 83.20 cm/s and 80.85 cm/s respectively. A thorough examination of the data reveals no substantial increase or decrease, and no discernible trend is apparent across the three datasets.
As shown in Figure 9, the variable under consideration is the flow in three test conditions (test conditions 1, 6 and 7). The inflow rate decreases from 83.15 cm/s to 72.95 cm/s.
The analysis indicates that the velocity of the breach is influenced by three factors: the water level, the height of the embankment and the inflow. As Figure 7 shows, there is a direct correlation between the breach’s flow velocity and the water level. An increase in the water level has been shown to be accompanied by an increase in flow velocity. The elevated water level during the breach increases the difference in water level across the embankment, thereby increasing the potential energy of the water flow. In the event of a breach, more kinetic energy is converted from potential energy, and the flow velocity at the breach increases. As shown in Figure 8, embankment height has little effect on flow velocity at the breach. As shown in Figure 5, there is no discernible difference in the morphology of the breach, and a substantial decline in flow velocity occurs during its formation. Consequently, the flow velocity remains unaltered. As shown in Figure 9, there is a negative correlation between the inflow rate and the flow velocity at the breach. An increase in the inflow rate has been shown to result in an increase in the erosion time of the breach. Consequently, the embankment is unable to resist erosion from the water flow, resulting in rapid widening of the breach. This, in turn, widens the shape of the breach and gradually decreases the force of the water flow. Concurrently, a decline in flow velocity has been observed. It can therefore be concluded that the water level and inflow rate are significant factors in controlling the breach’s flow rate.
4. Discussion
The breach process mechanism is explored through the analysis of multiple breach test sets, with particular reference to breach morphology characteristics and flow velocity data. The seven groups of test conditions have been categorised into three distinct stages: vertical erosion (stage I), breach expansion (stage II) and breach stability (stage III). Stage II is the primary stage of breach development and sees significant changes in velocity and widening velocity. As shown in Figure 10.
4.1. Vertical Erosion Stage (Stage Ⅰ)
This stage commences at the start of the test. Inflow to the reservoir causes the water level to rise to the same level as the river, resulting in overflow at the top of the embankment. If the inflow increases sustainably, the water will overflow onto the rear of the embankment, causing a breach in the weakest part of the structure. This is because the sediment is damaged by the flow of water, creating a crack. As the inflow to the river increases further, the resulting water flow erodes the rear surface of the embankment, forming a narrow scour ditch. At this stage, the flow velocity is slow and insufficient to cause significant erosion or the rapid expansion of the breach. As the water content of the sediment increases, the friction between the particles rises, facilitating the movement of water away and establishing a prerequisite for stage II. At this stage, the flow velocity and sediment friction mutually restrict each other. Concurrently, the friction of the particles is reduced, the inflow rate increases continuously and the flow velocity gradually increases, thereby enhancing the traction effect on the sediment of the contact surface. Consequently, the breach propagates in a downward direction. During this gradual development, the sediment is pulled by the water flow to form a fan-shaped accumulation on the rear surface. This is primarily characterised by vertical erosion.
4.2. Breach Expansion Stage (Stage Ⅱ)
The breach expansion stage is the second phase of dike breaching, during which the breach develops rapidly. As the breach widens, the flow rate and velocity increase, leading to an acceleration in the scouring rate and an increase in the depth of the scour ditch. At this point, the breach transitions from vertical to lateral erosion.
The initial stage (Stage I) is characterised by soil erosion on both sides of the breach and water infiltration. As the depth increases and the influence of soil gravity becomes more dominant, the soil on both sides collapses, resulting in a rapid increase in breach width. As the breach continues to expand, a substantial volume of river water enters it, further widening and deepening the breach and accelerating the breaching process.
In the case of substantial discharge, the breach is fully penetrated, the river water level experiences a sharp decline, and the discharge exceeds the inflow. At this juncture, the flow rate peaks, and the rear of the embankment is subjected to continuous impact. In the final stage, the process of sedimentation behind the embankment and soil beneath the collapsed area is subject to a process of erosion, leading to a gradual decline in flow rate and a slowdown in breach development. Consequently, a wide and deep breach morphology is formed.
4.3. Breach Stabilization Stage (Stage III)
The third stage of breaching is the stabilisation stage. At this point, the morphology of the breach becomes stable, with vertical and lateral growth stopping. This results in the formation of the final shape of the breach.
As the river water level declines at this juncture, the differential in water levels across the embankment diminishes concomitantly. The hydrodynamic forces are no longer sufficient to drive continued water flow and the available energy is insufficient to widen the breach further.
As the flow rate decreases below the critical initiation velocity of the embankment test material, significant sediment deposition occurs in the area behind the embankment. This process stabilises the structure, ensuring its integrity and stability.
As the breaching process comes to an end, the flow rate at the breach approaches the inflow rate. At this stage, the flow rate at the breach gradually decreases to zero. The embankment then reaches a state of dynamic equilibrium and the breaching process is fully concluded. The breach morphology is also completely stable at this point.
5. Conclusions
This study is based on the Changkai embankment prototype. The aim is to record and analyse the morphology of overtopping breaches, as well as the evolution of water levels and velocities at the breach, under different test conditions, using indoor model tests. Furthermore, the study elucidates the impact of fluctuating water levels, dike heights and inflows on the occurrence of dike breaching. The following conclusions are derived from the research:
(1) The process of dike breaching can be categorised into three distinct stages. Firstly, there is the vertical erosion stage (Stage I, 90–120 s), followed by the breach expansion stage (Stage II, 120–270 s). The third and final stage is the breach stabilisation stage (Stage III, 270–300 s). The initial phase of breaching, Stage I, is characterised by gradual vertical erosion. Stage II is characterised by accelerated expansion of the breach and the attainment of peak flow rate. The breaching process culminates in Stage III. At this point, the flow rate has decreased and the breach morphology has stabilised, concluding the breaching process.
(2) It is evident that the river water level and inflow are pivotal factors in determining the final morphology of the levee breach and the velocity at the breach. However, the height of the levee has been shown to have no significant influence on the morphology or velocity of the breach.
(3) The results indicate that the width of the breach ranges from 6 cm to 12 cm. Specifically, the greater the water depth (i.e. the greater the difference in water level across the river), the deeper and wider the breach becomes and the faster it widens. In cases of large inflow, the breach is wider. Greater inflow results in a longer breach duration, extended scouring on both sides of the embankment and a larger breach cross-section. In summary, the water level difference and inflow are key factors influencing the breach width.
(4) In sub-aquatic conditions, the maximum flow velocities observed in the control group were 83.15 cm/s, 89.15 cm/s and 92.20 cm/s respectively. This suggests a direct correlation between water level and flow velocity: an increase in water level is associated with a corresponding increase in flow velocity. It has been demonstrated that an increase in water level results in a corresponding rise in the potential energy of the water flow. During breaching, a greater proportion of this potential energy is converted into kinetic energy, which increases the flow velocity at the breach. The inflow rate is found to be inversely proportional to the flow velocity at the breach. As the inflow rate increases, the breach widens and the force of the water flow gradually diminishes, resulting in a decrease in flow velocity.
Author Contributions
Conceptualization, P.Y. and F.X.; methodology, P.Y. and X.Y.; software, P.Y. and X.X.; validation, F.L.; formal analysis, P.Y. and F.X.; investigation, Y.W. and L.O.; data curation, L.O.; writing—original draft, P.Y. and F.X.; funding acquisition, P.Y. and F.X.; All authors have read and agreed to the published version of the manuscript.
Funding
This research was funded by the National Natural Science Foundation of China (52269027), by the Jiangxi Provincial technology innovation guidance program(20223AEI91008, 20243BBH81006), by the Natural Science Foundation of Jiangxi Province (20242BAB23046), by the Natural Science Foundation of Chongqing City (CSTB2024NSCQ-MSX0802) and by the Jiangxi Provincial Department of water resources Foundation (202426ZDKT31).
Institutional Review Board Statement
Institutional review board approval. Studies not involving humans or animals.
Informed Consent Statement
Informed consent was obtained from all subjects involved in the study.
Data Availability Statement
The data presented in this study are available on request from the corresponding author. The data are not publicly available due to privacy restrictions.
Acknowledgments
The authors wish to express their thanks to all supporters.
Conflicts of Interest
The authors declare no conflict of interest.
References
- Xiang, Y., Sheng, J., Wang, L., et al. Research progresses on equipment technologies used in safety inspection, repair, and reinforcement for deepwater dams. Science China Technological Sciences, 2022, 65, 1059–1071. [CrossRef]
- astro-Orgaz O , Hager W H .Unsteady Boussinesq-type flow equations for gradually-eroded beds: application to dike breaches[J].Journal of Hydraulic Research, 2013, 51(2):203-208.
- uang, D., Yu, Z., Li, Y., et al. Calculation method and application of loss of life caused by dam break in China. Natural Hazards, 2017, 85, 39–57. [CrossRef]
- omers A .Predicting Outflow Hydrographs of Potential Dike Breaches in a Bifurcating River System Using NARX Neural Networks[J].Hydrology, 2021, 8.
- ou, L., Li, C., Min, X., et al. Review of dam-break research of earth-rock dam combining with dam safety management. Procedia Engineering, 2012, 28, 382–388. [CrossRef]
- engyun Y .Fault tree analysis on casualty accidents caused by dike breaches[J].Advances in ence & Technology of Water Resources, 2013.
- ang, W., Chen, W., Huang, G. Research on flood propagation for different dam failure modes: A case study in Shenzhen, China. Frontiers in Earth Science, 2020, 8, 527363.
- alamttalab, M., Parmas, B., Mustafa Alee, H., et al. A finite volume method for a 2D dam-break simulation on a wet bed using a modified HLLC scheme. Water, 2023, 15(21), 3841. [CrossRef]
- iu, W., Li, Y., Zhang, Y., et al. Numerical investigation on the evolution process of cascade dam-break flood in the downstream earth-rock dam reservoir area based on coupled CFD-DEM. Journal of Hydrology, 2024, 635, 131162.
- kgun, C., Nas, S., Uslu, A. 2D and 3D numerical simulation of dam-break flooding: A case study of the Tuzluca Dam, Turkey. Water, 2023, 15(20), 3622. [CrossRef]
- i, A., Xu, A., Li, X. Numerical simulations of dam break flow on complicated terrain using VOF method. In Proceedings of the 2013 International Conference on Mechanical and Automation Engineering, IEEE. 2013, 229–232.
- eng, Y., Zhang, D., Cao, Z., et al. Spatio-temporal water height prediction for dam break flows using deep learning. Ocean Engineering, 2024, 302, 117567.
- eyedashraf, O., Rezaei, A., Akhtari, A. Dam break flow solution using artificial neural network. Ocean Engineering, 2017, 142, 125–132. [CrossRef]
- eyedashraf, O., Akhtari, A. Two-dimensional numerical modeling of dam-break flow using a new TVD finite-element scheme. Journal of the Brazilian Society of Mechanical Sciences and Engineering, 2017, 39(11), 4393–4401.
- osoughi, F., Nikoo, M., Rakhshandehroo, G., et al. The application of Bayesian model averaging based on artificial intelligent models in estimating multiphase shock flood waves. Neural Computing & Applications, 2022, 34(22), 20411–20429. [CrossRef]
- guyen, X. Combining statistical machine learning models with ARIMA for water level forecasting: The case of the Red river. Advances in Water Resources, 2020, 142, 103656.
- ai Q , Zhou W , He R ,et al.A Data Assimilation Methodology to Analyze the Unsaturated Seepage of an Earth–Rockfill Dam Using Physics-Informed Neural Networks Based on Hybrid Constraints[J].Water, 2024, 16(7):1041.
- i J , Chen C , Wu Z ,et al.Multi-source data-driven unsaturated seepage parameter inversion: Application to a high core rockfill dam[J].Journal of Hydrology, 2023.
- ureli, F., Maranzoni, A., Petaccia, G., et al. Review of experimental investigations of dam-break flows over fixed bottom. Water, 2023, 15(6), 1229. [CrossRef]
- a, C., Guo, X., Yang, C., et al. Velocity field and outflow discharge behavior in overtopping dam-break of an iron mine tailings dam: A model test. Bulletin of Engineering Geology and the Environment, 2024, 83(6), 232.
- iu, Z., Meng, C., Xu, W., et al. Experimental study on whole process of river blockage and dam break under different hydrodynamic conditions. Frontiers in Earth Science, 2023, 10, 977246.
- ang, B., Zhang, F., Liu, X., et al. Approximate analytical solution and laboratory experiments for dam-break wave tip region in triangular channels. Journal of Hydraulic Engineering, 2021, 147(10), 06021015.
- u, F., Yang, X., Zhou, J., et al. Experimental research on the dam-break mechanisms of the Jiadanwan landslide dam triggered by the Wenchuan earthquake in China. The Scientific World Journal, 2013, 272363. [CrossRef]
- Wang G , Zhao B , Zhao K ,et al.Piping-Seepage Mechanism of Tailings with Different Fine Particle Contents[J].International Journal of Geomechanics, 2023, 23(11):13.
- Long D , Li C , Wang Y ,et al.X-Ray CT Investigation on Fractal Characteristics of Fine-Grained Tailing Sand in Fujian’s Makeng: Insight into the Mesoscopic Seepage Failure[J].Geofluids, 2021, 2021.
Figure 1.
Schematic diagram of experimental water tank.
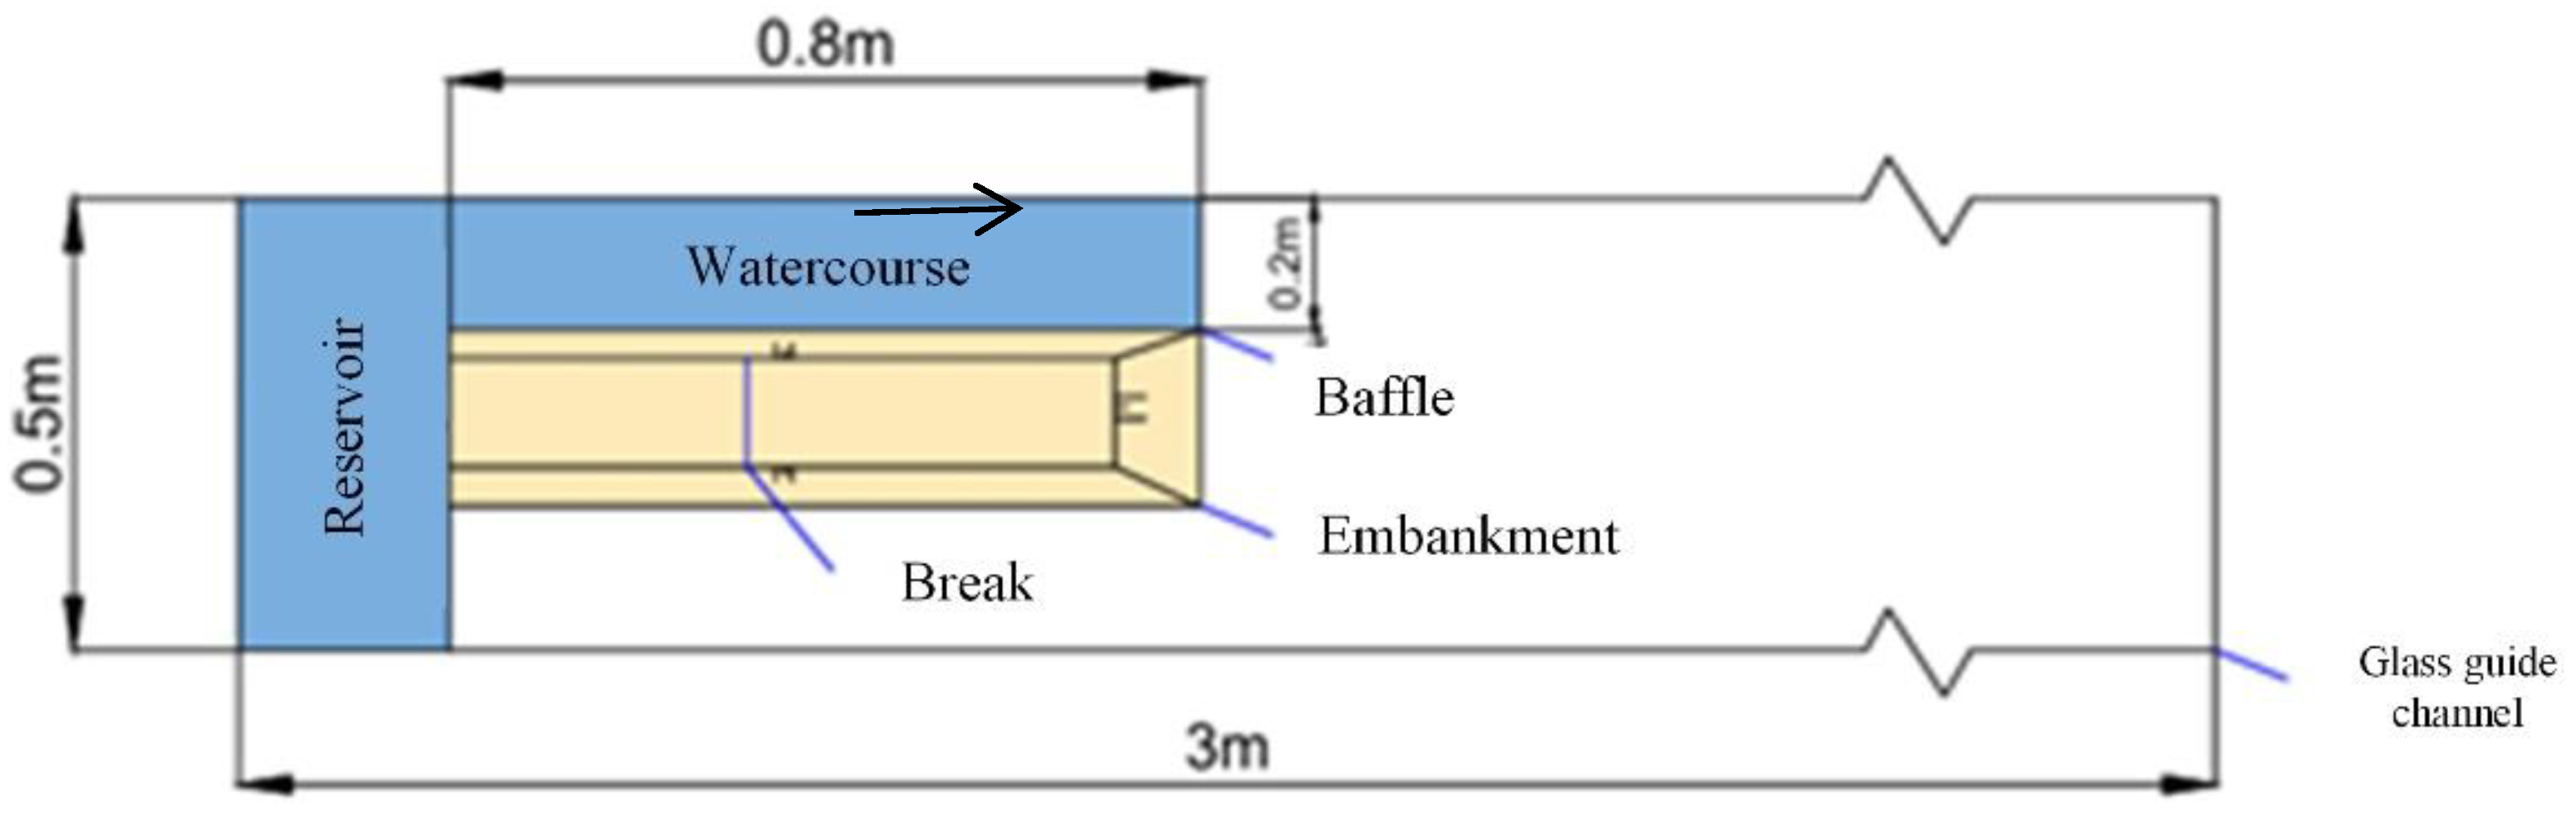
Figure 2.
Experimental and prototype material particle size distribution.
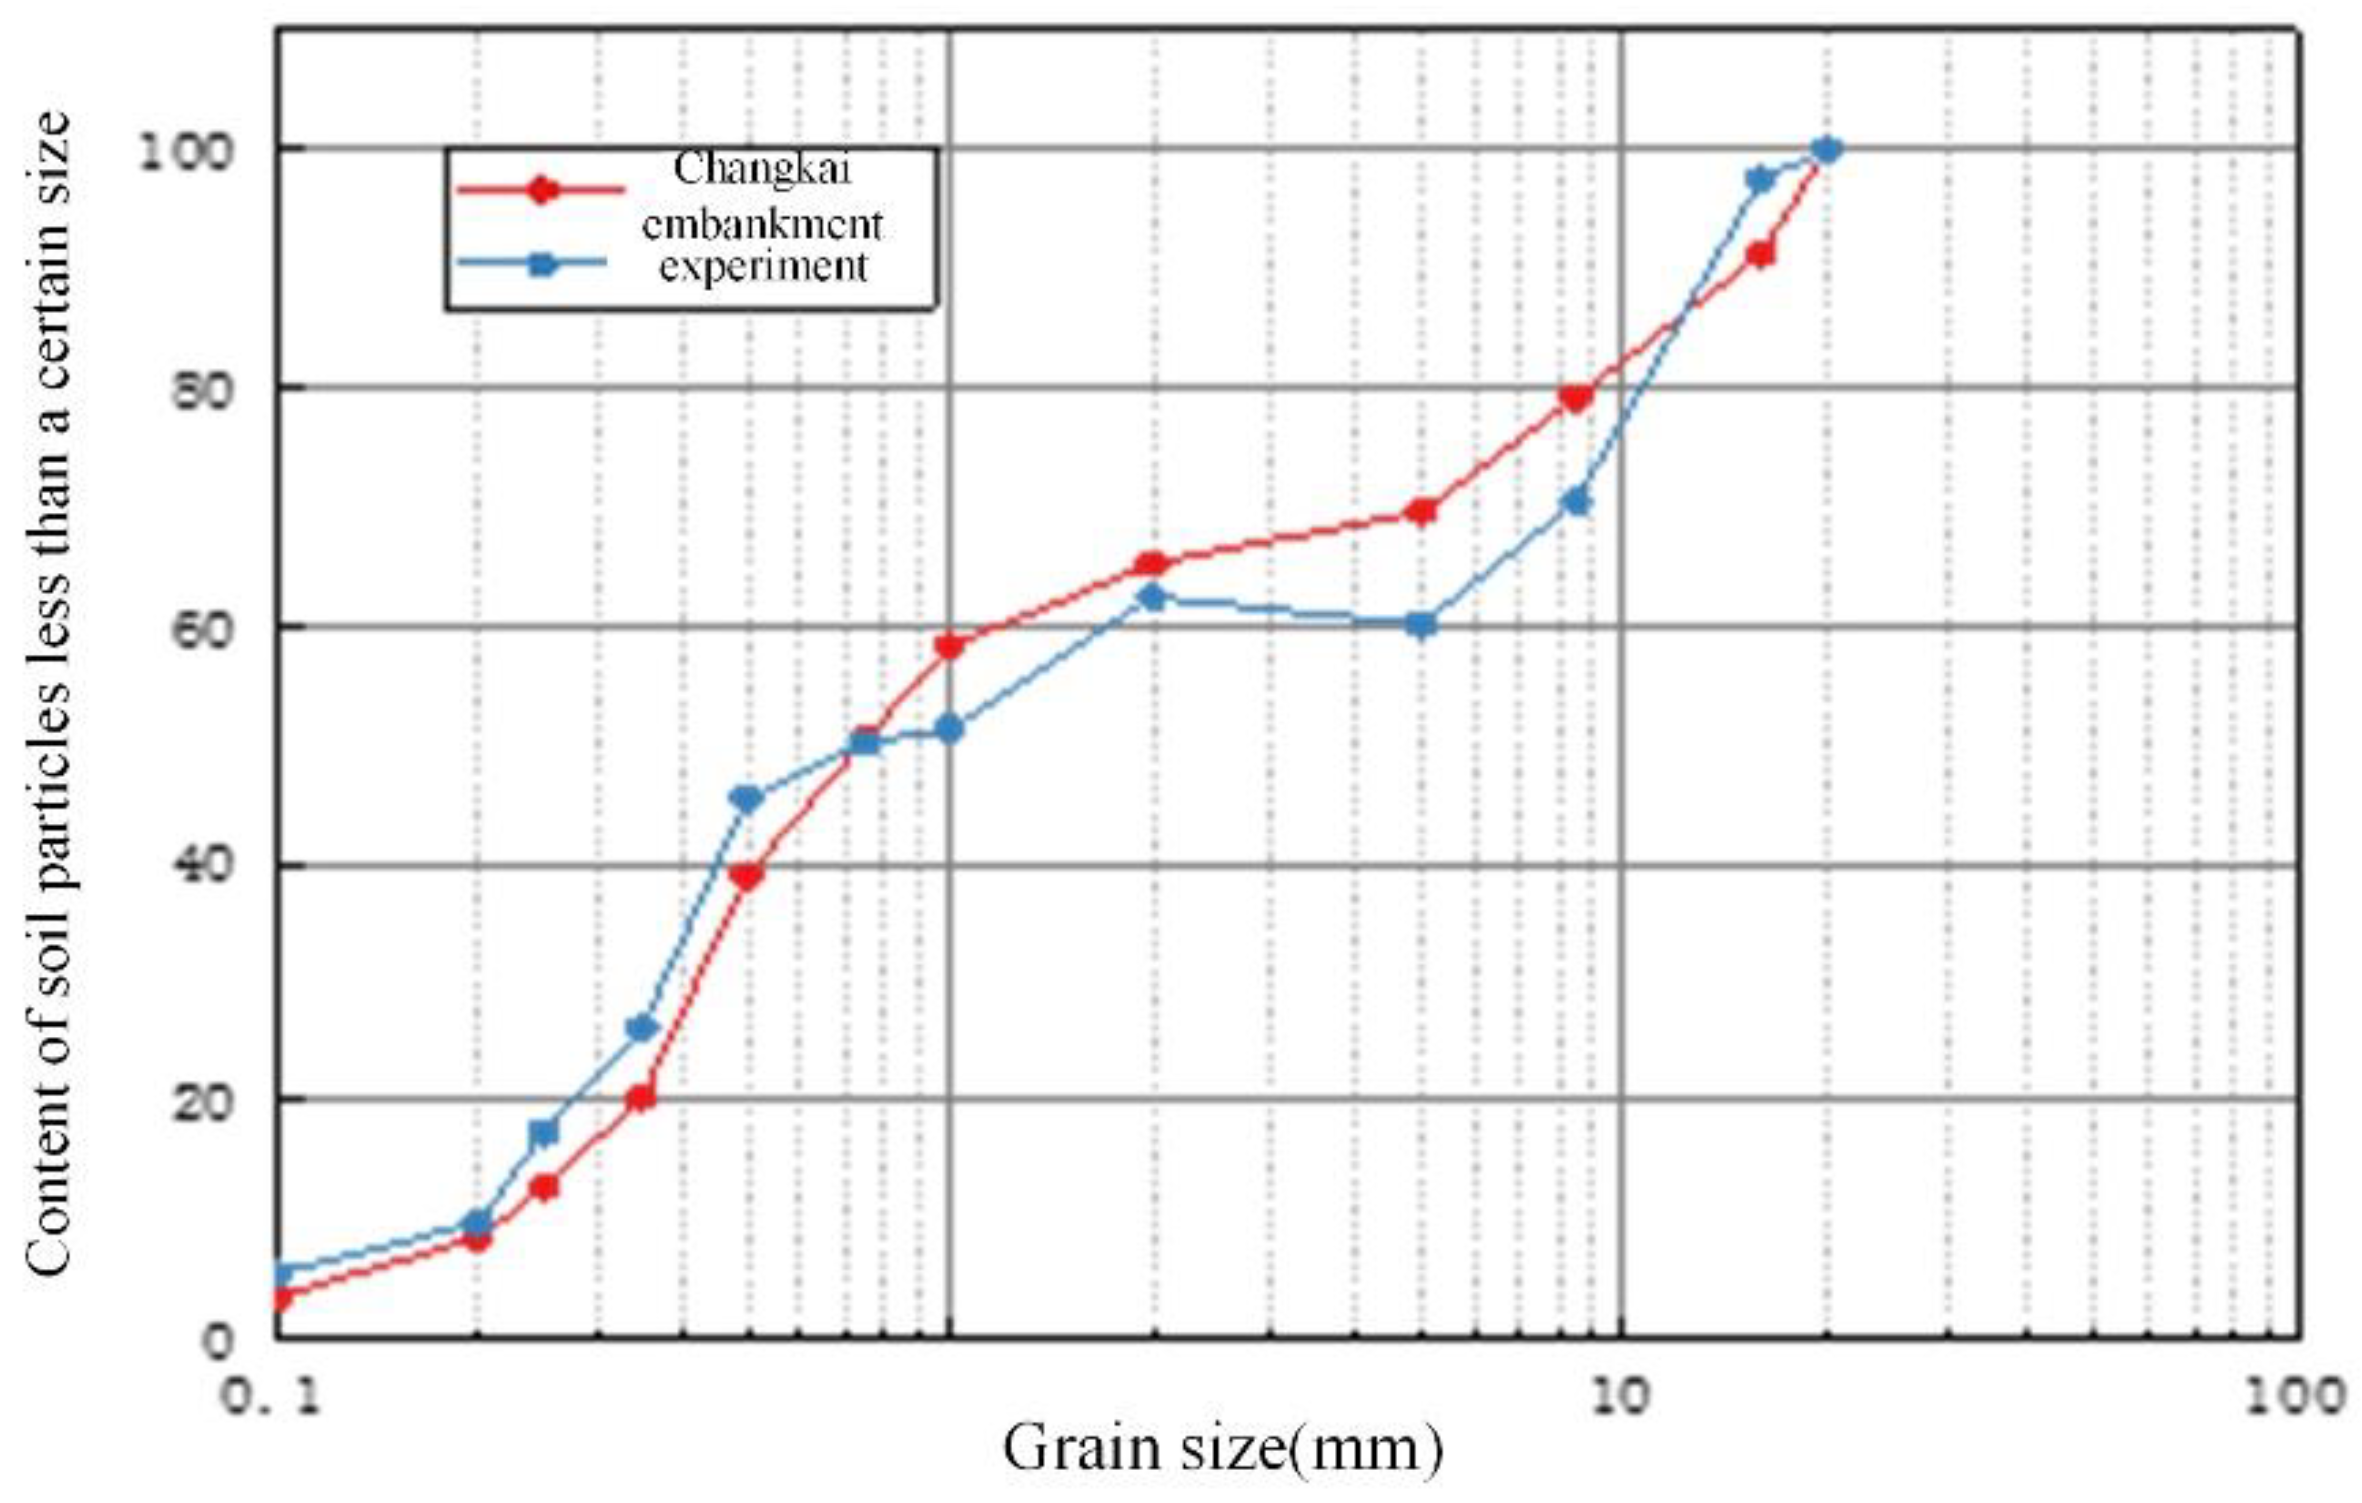
Figure 3.
Stage diagram of collapse morphology.
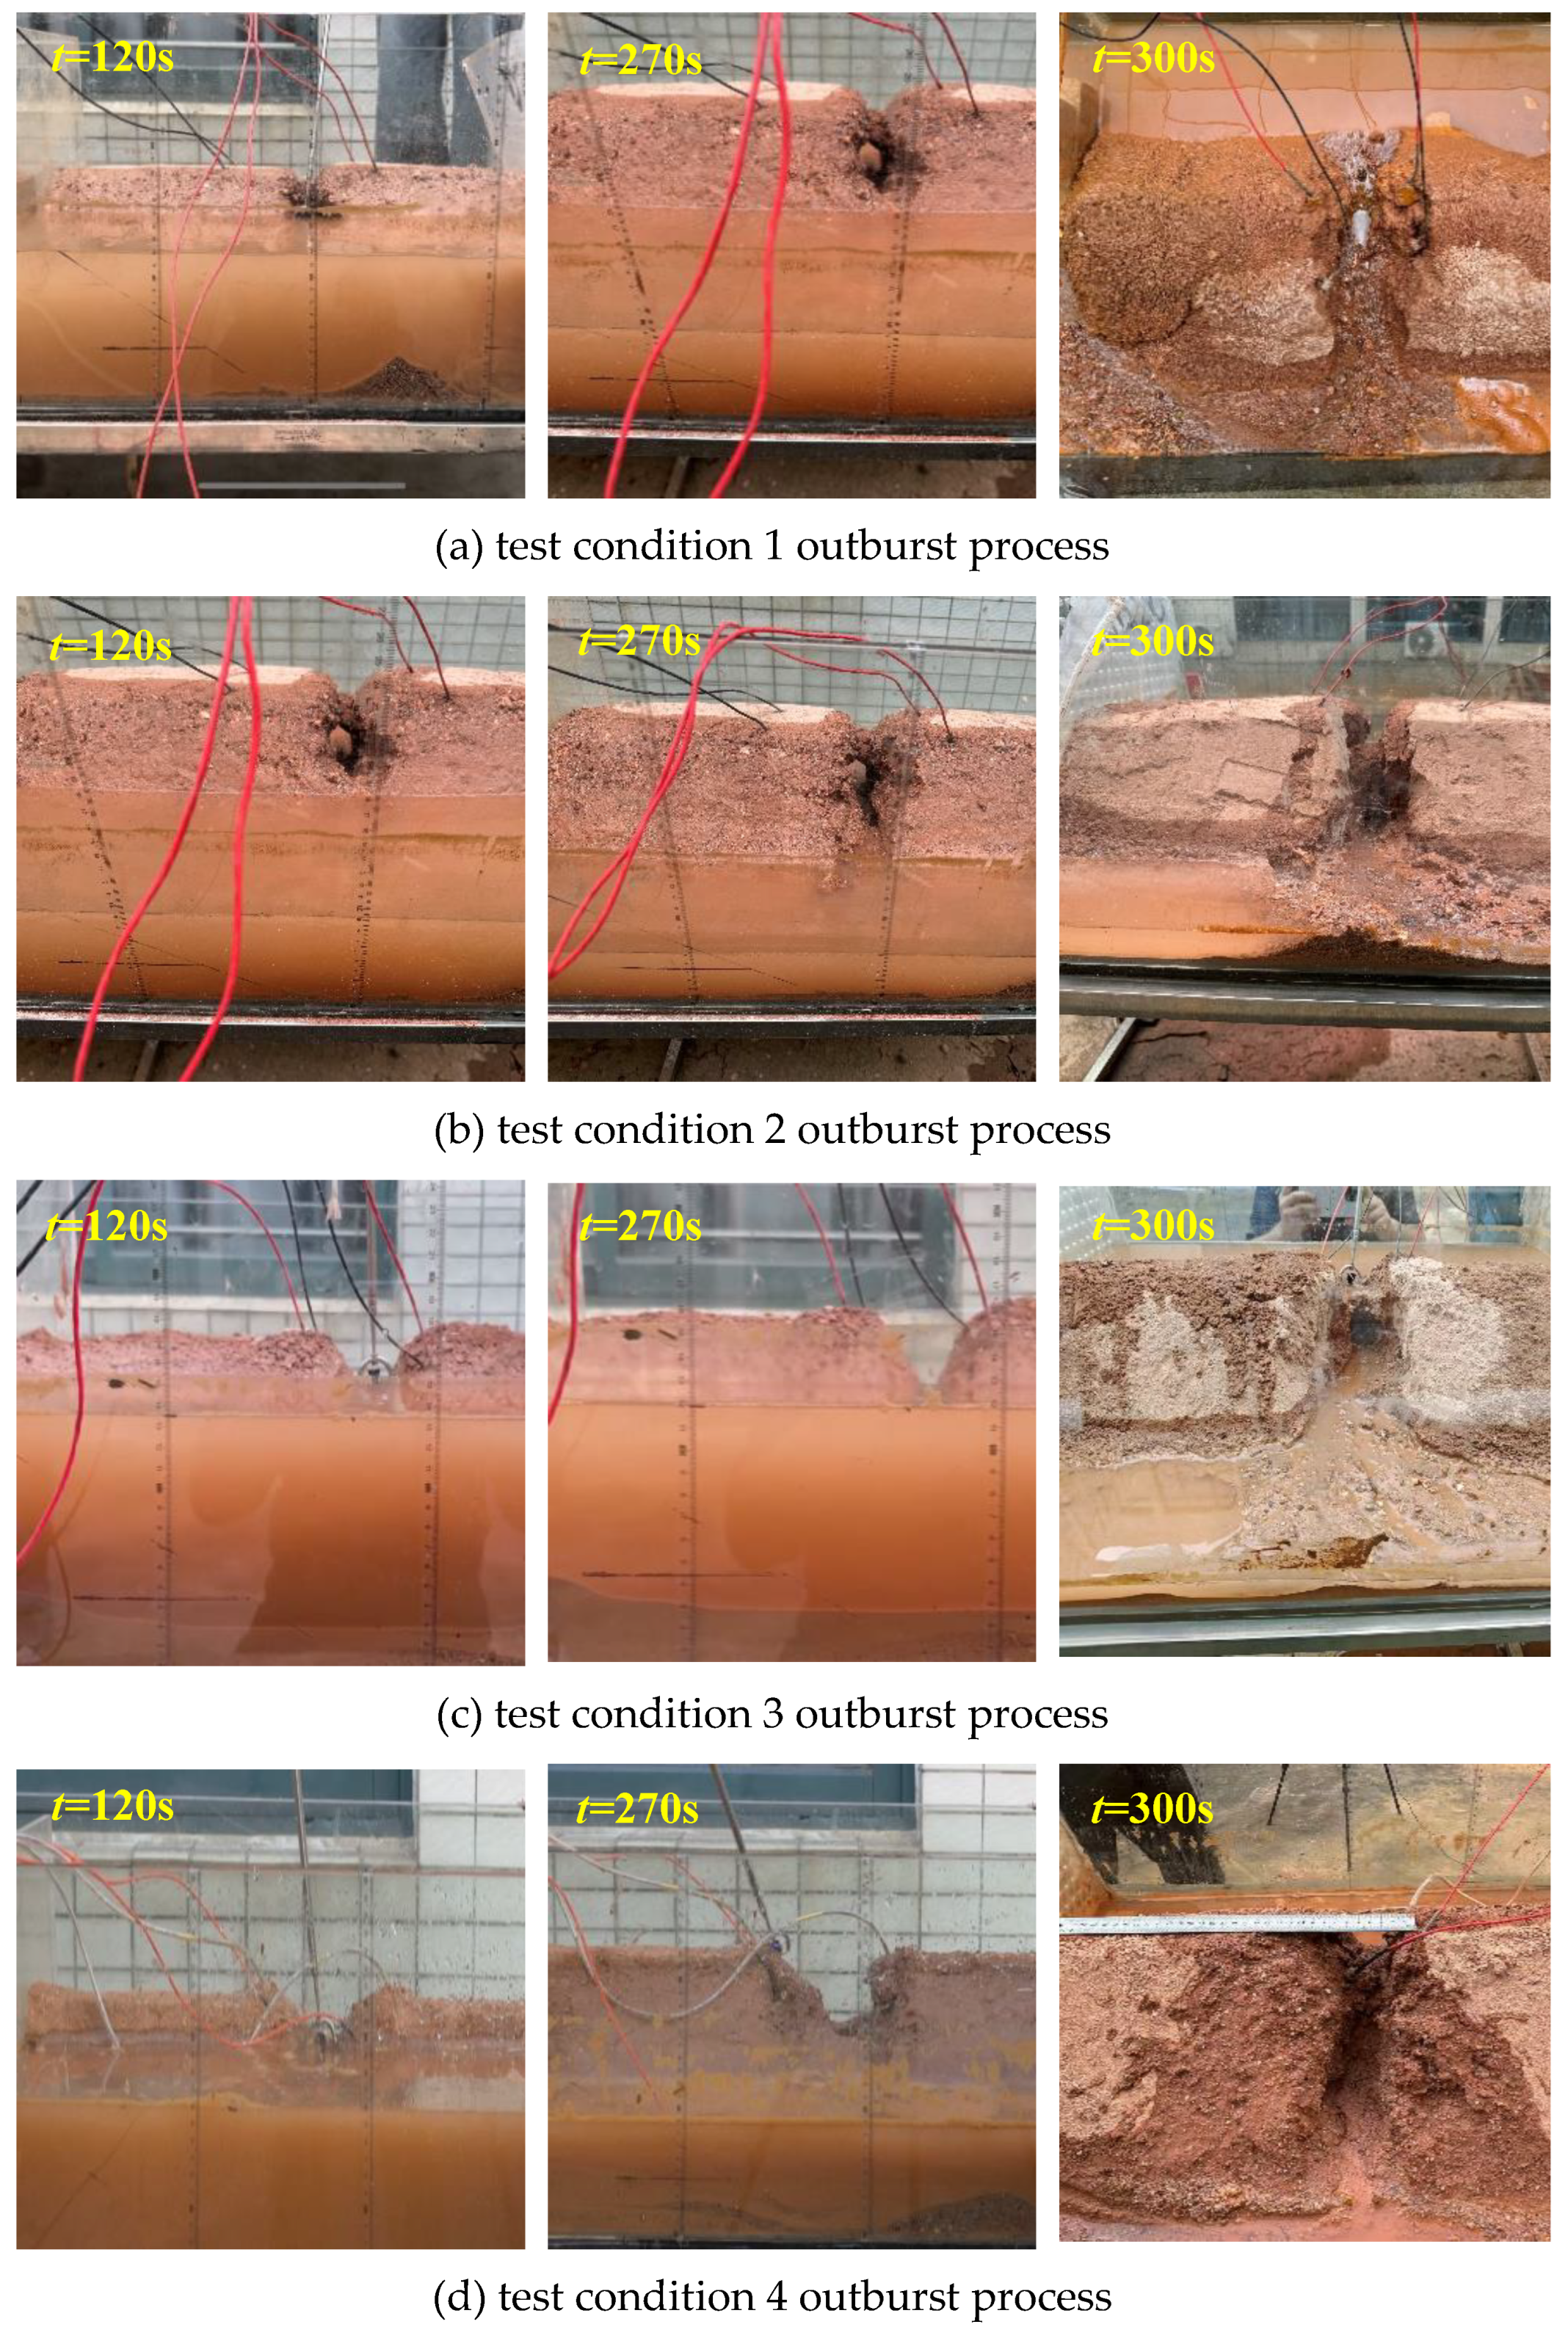
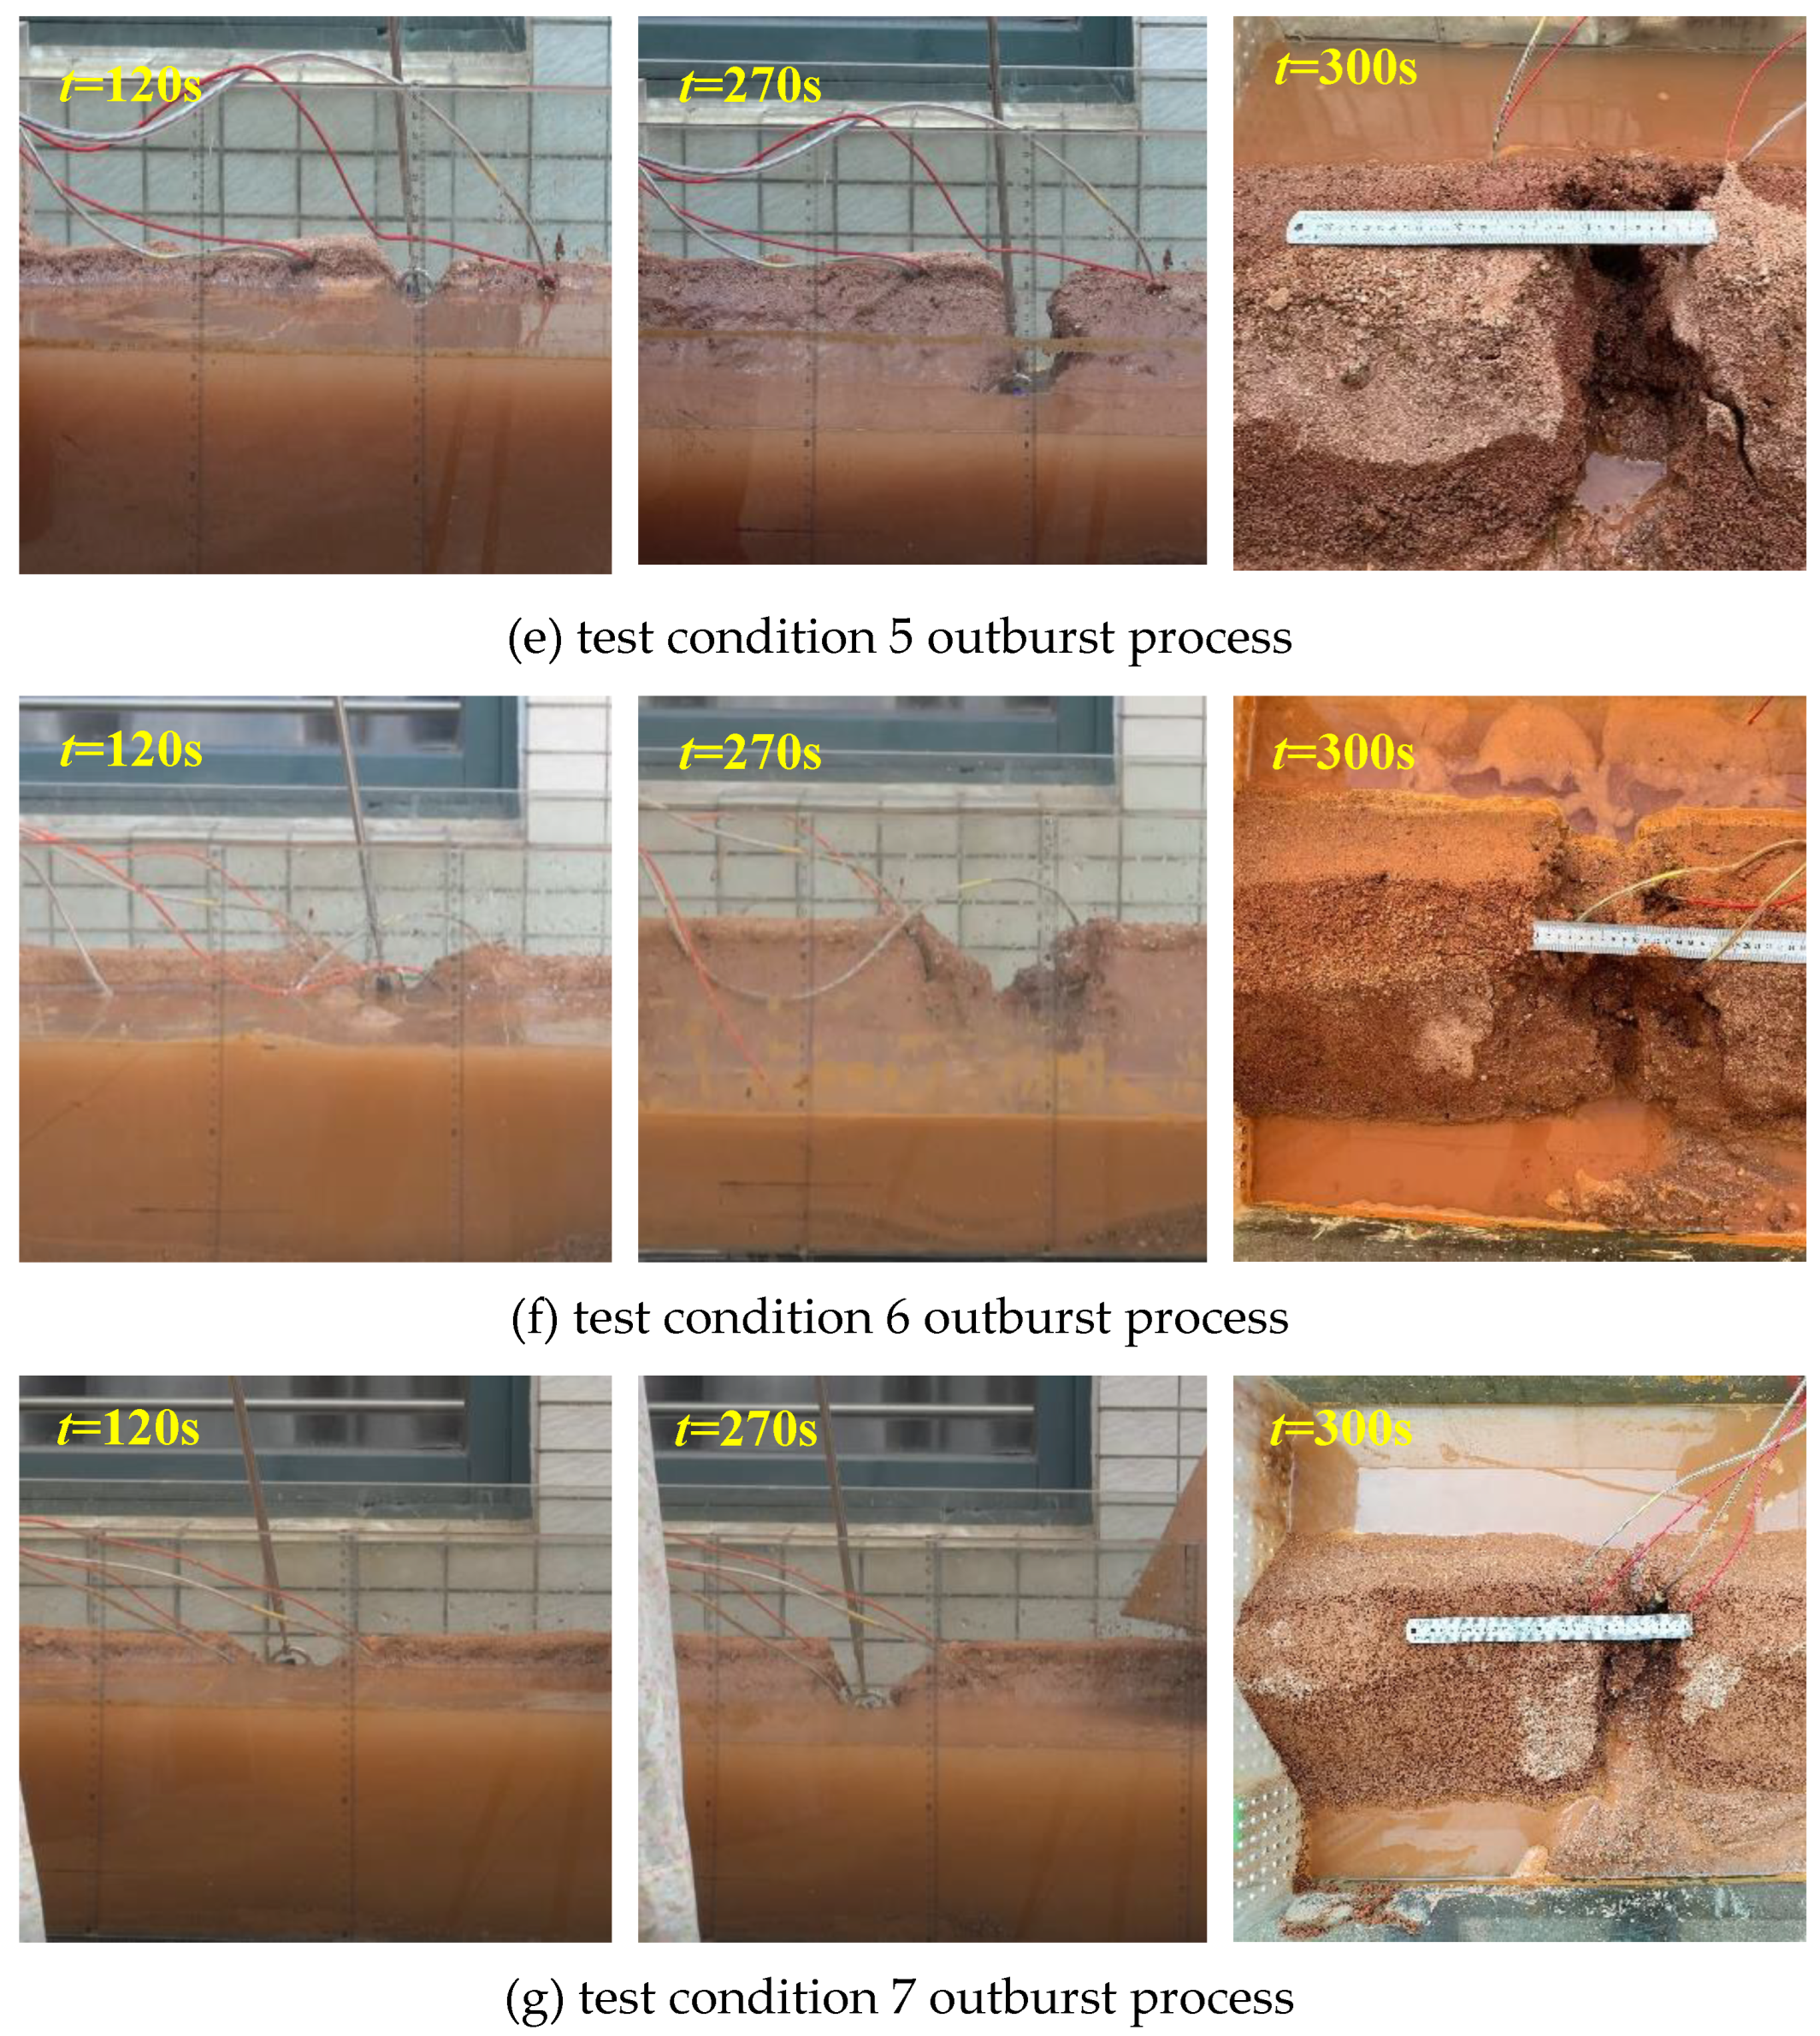
Figure 4.
Breach morphology in different water depths.
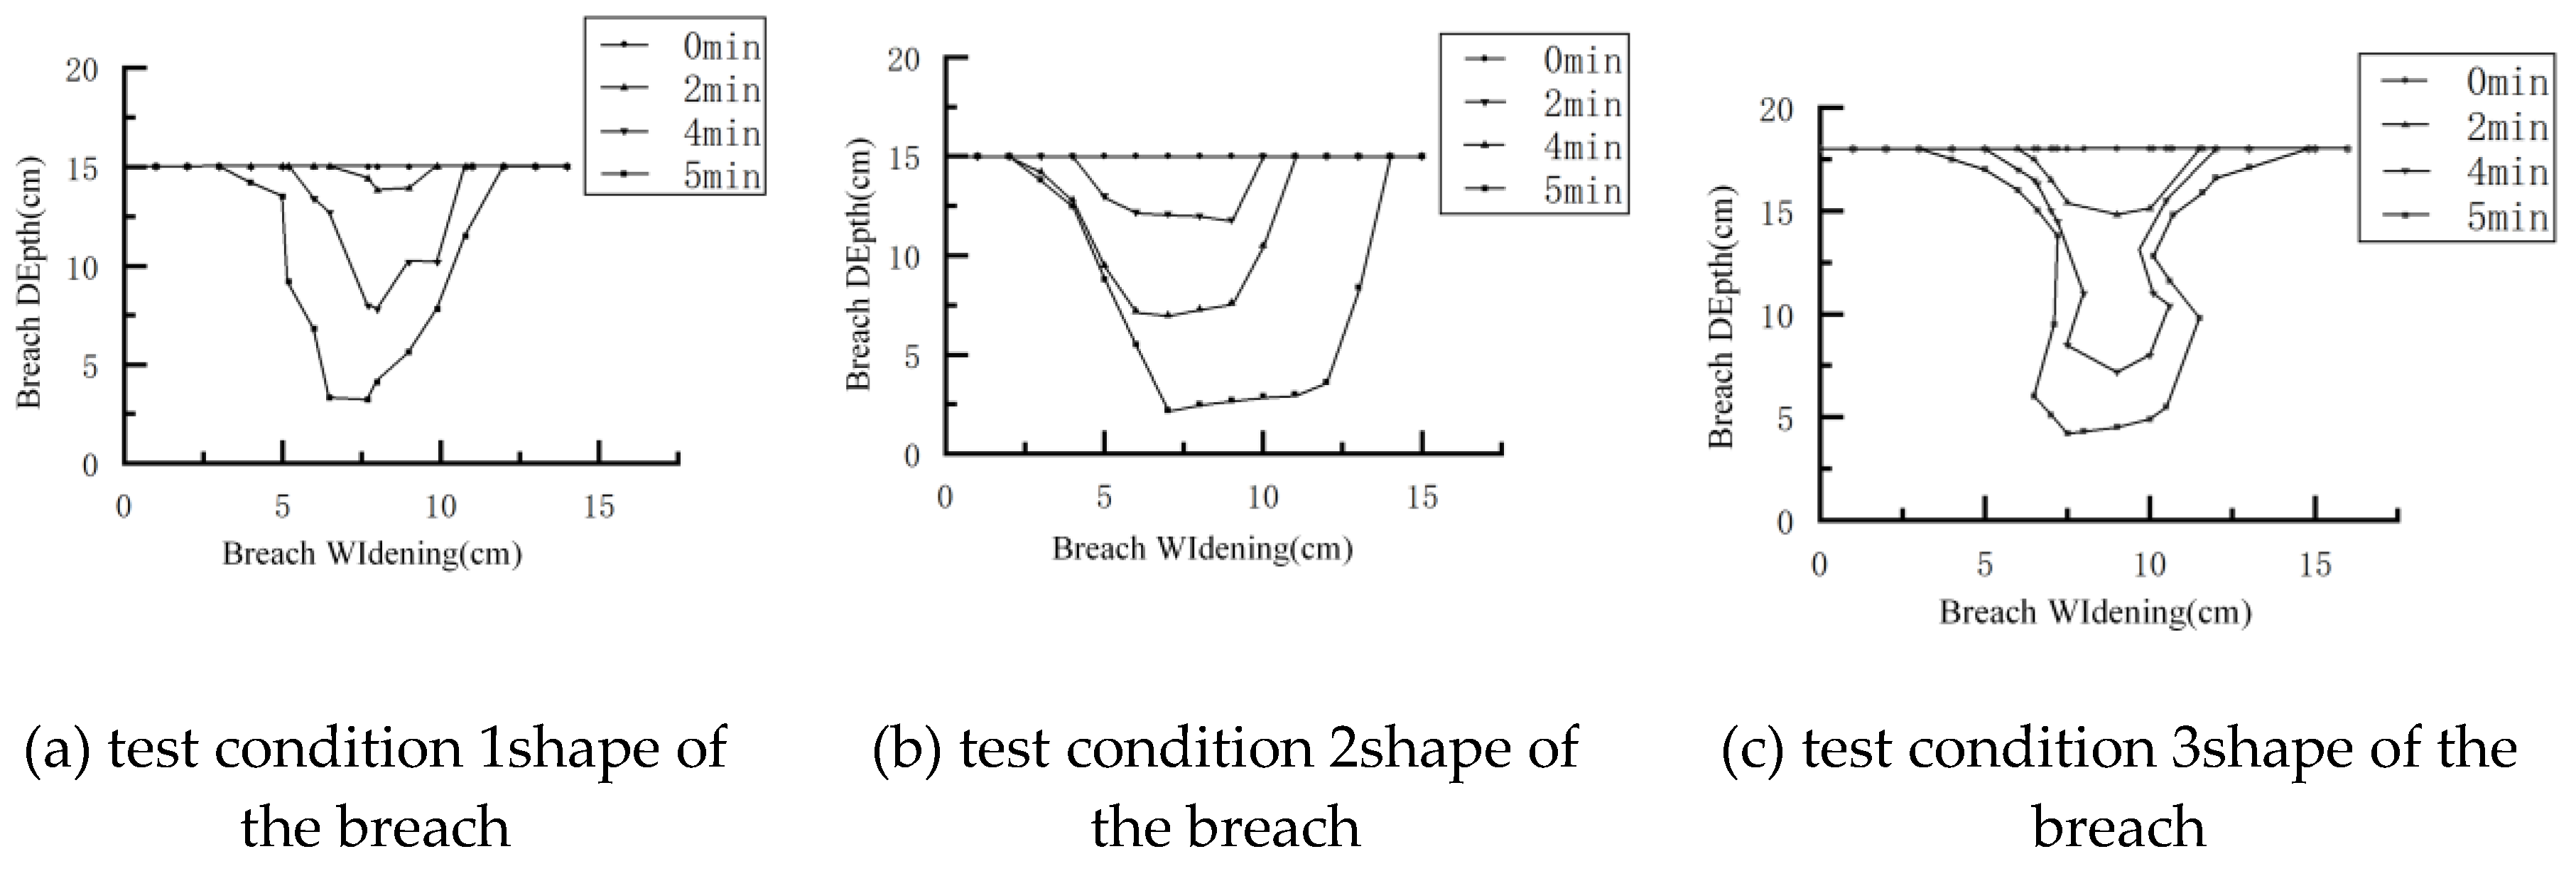
Figure 5.
Breach shape at different levee heights.
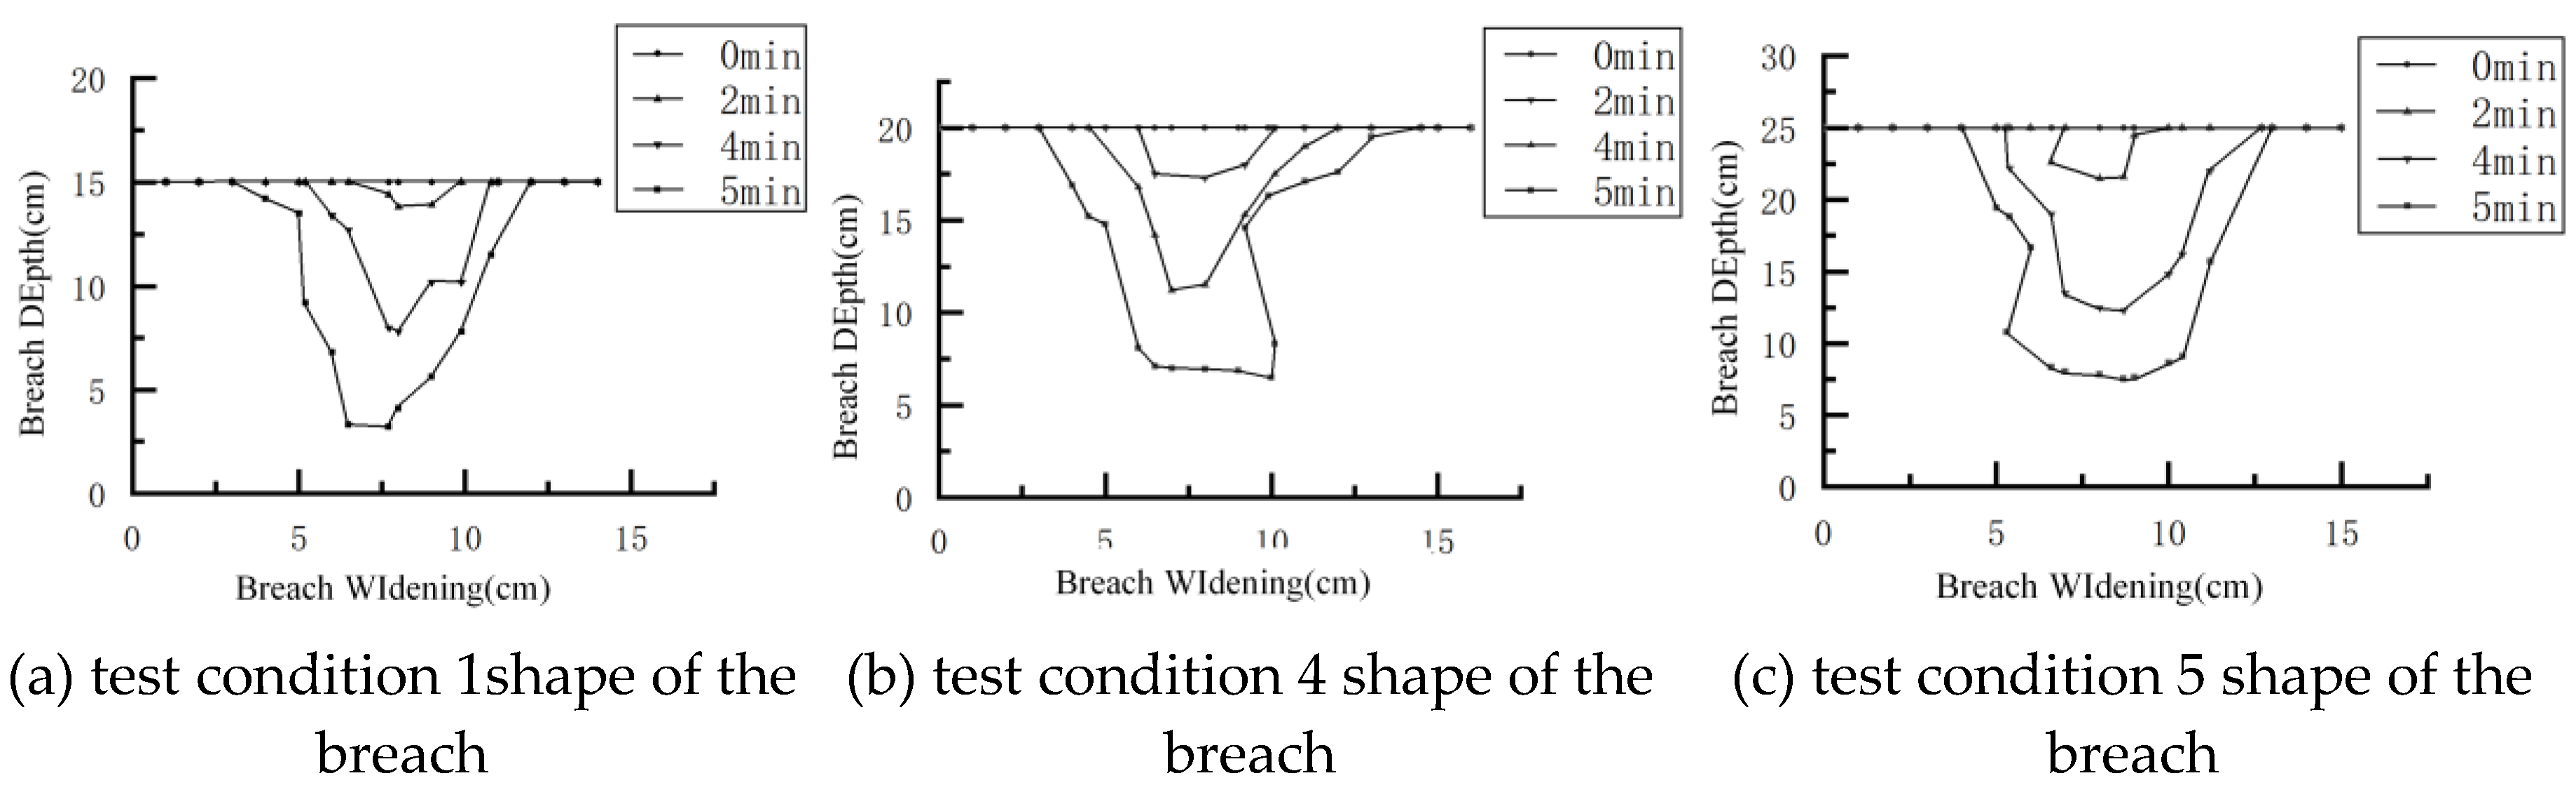
Figure 6.
Breach morphology with different inflow.
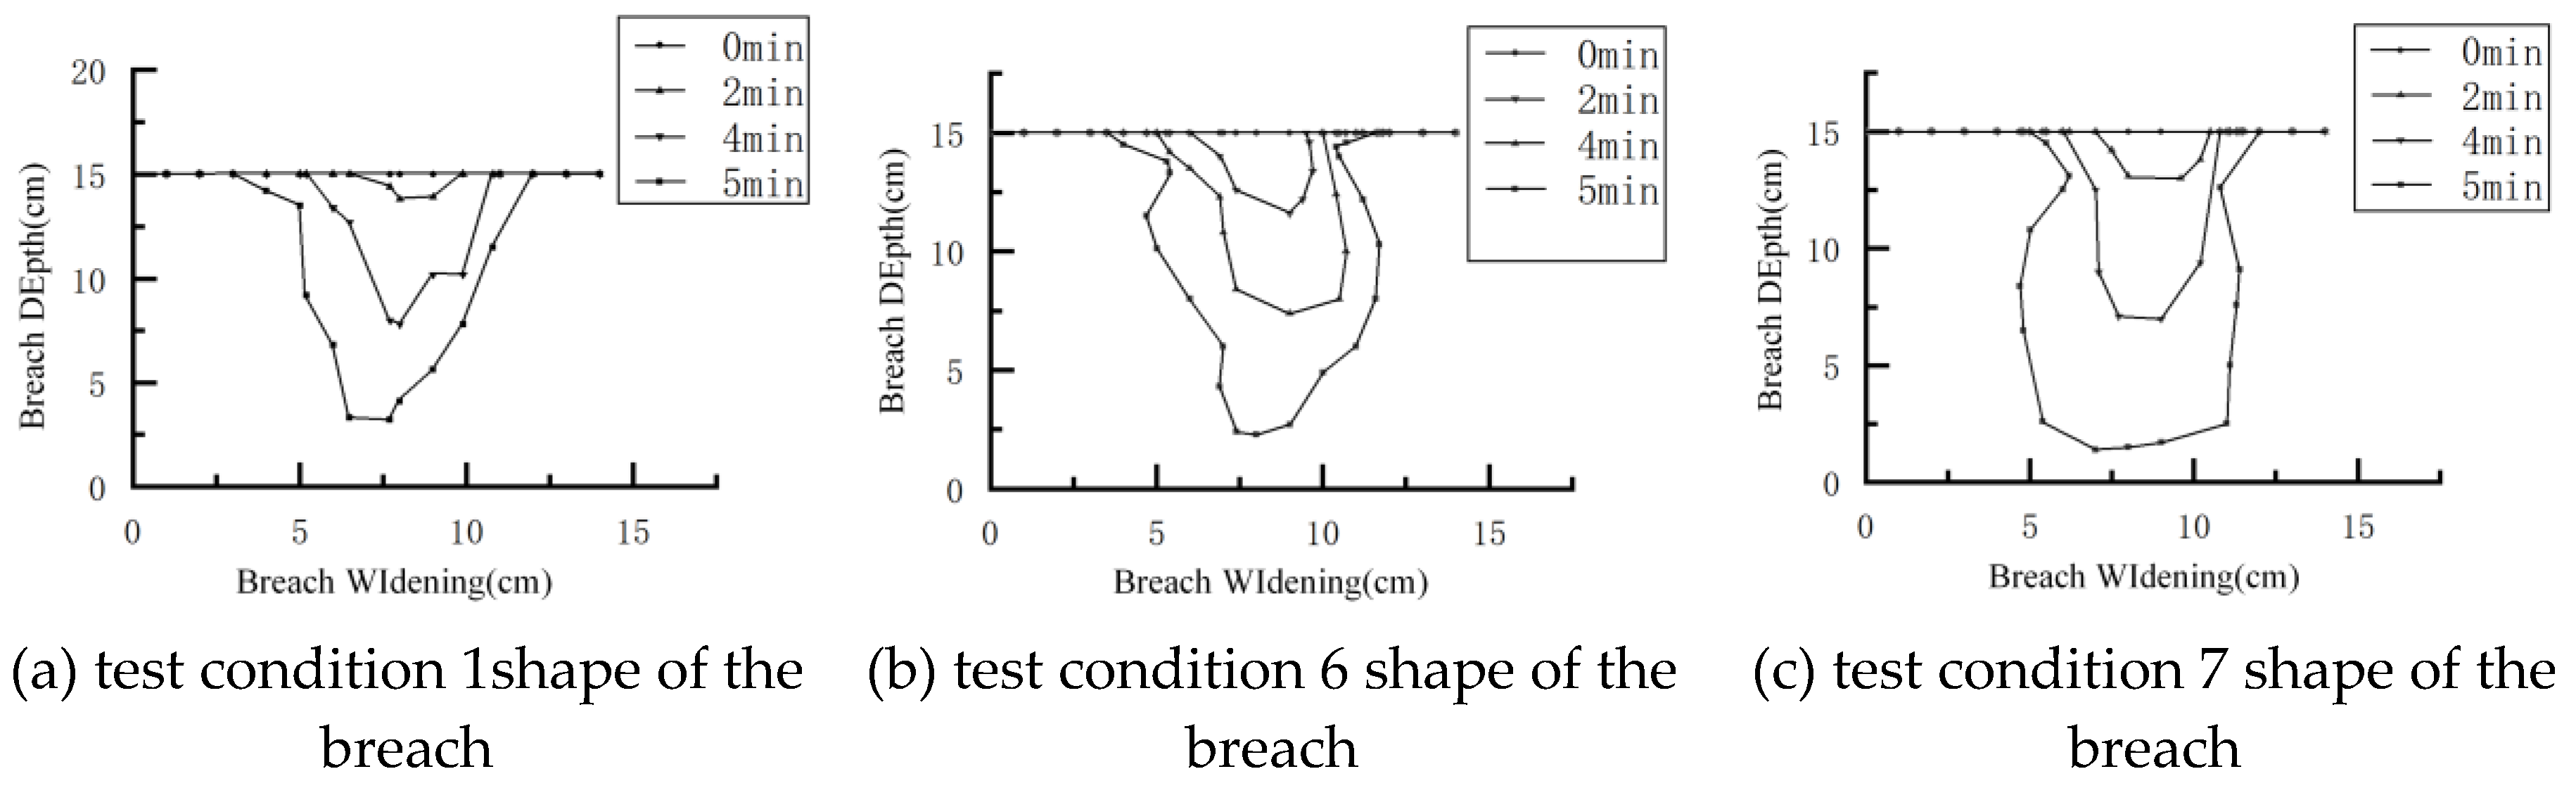
Figure 7.
Velocity at the breach of different water depths.

Figure 8.
Velocity at breach with different levee heights.
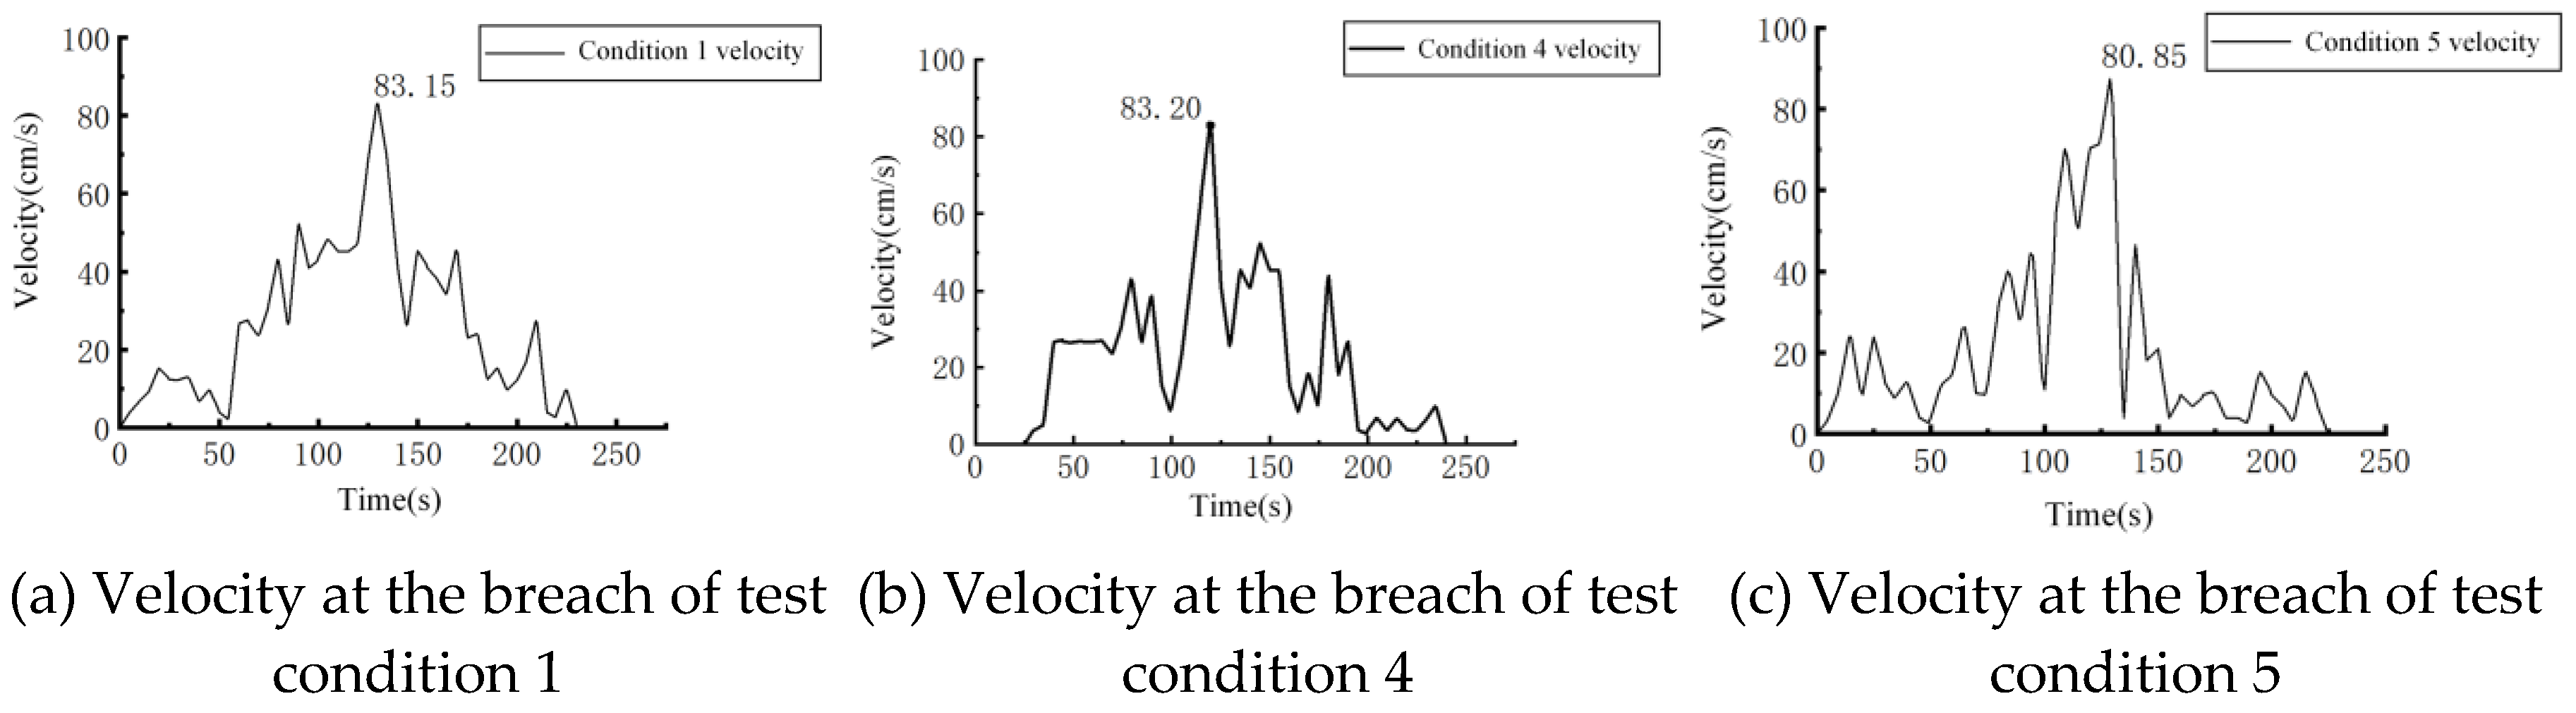
Figure 9.
Velocity at breach with different inflow.
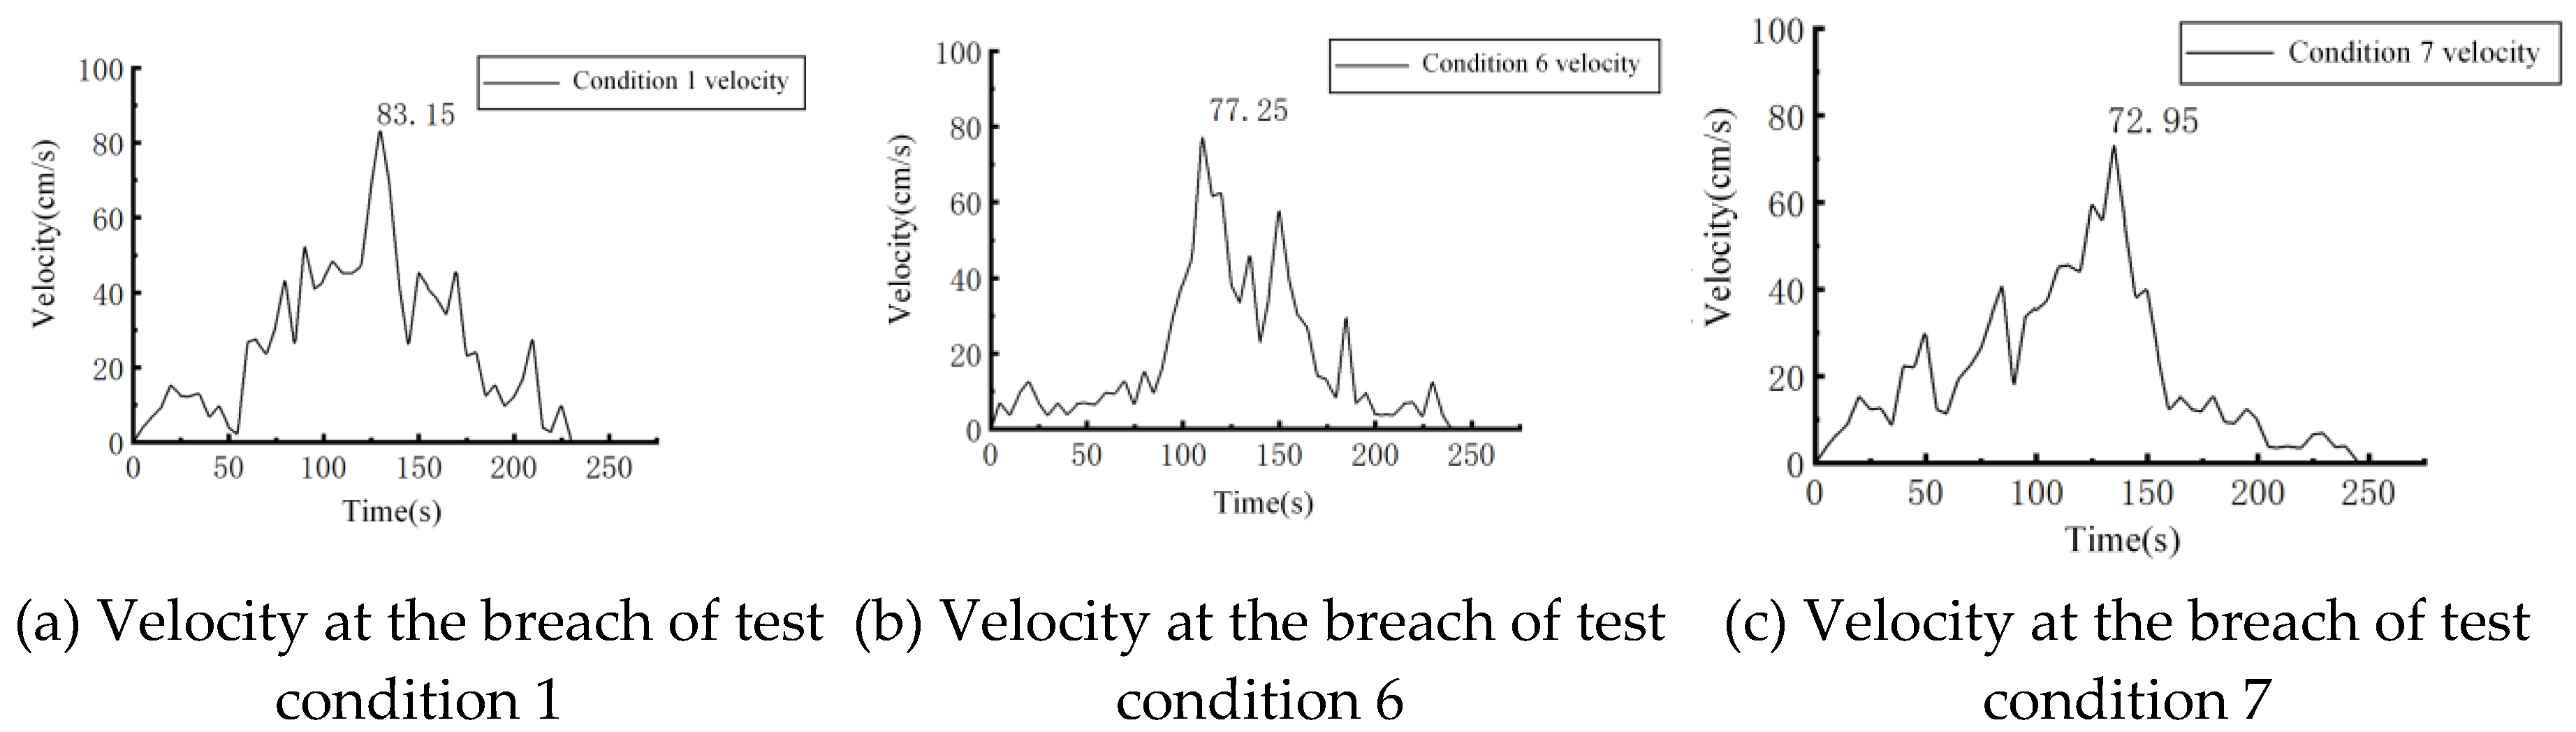
Figure 10.
Dike break mechanism diagram.
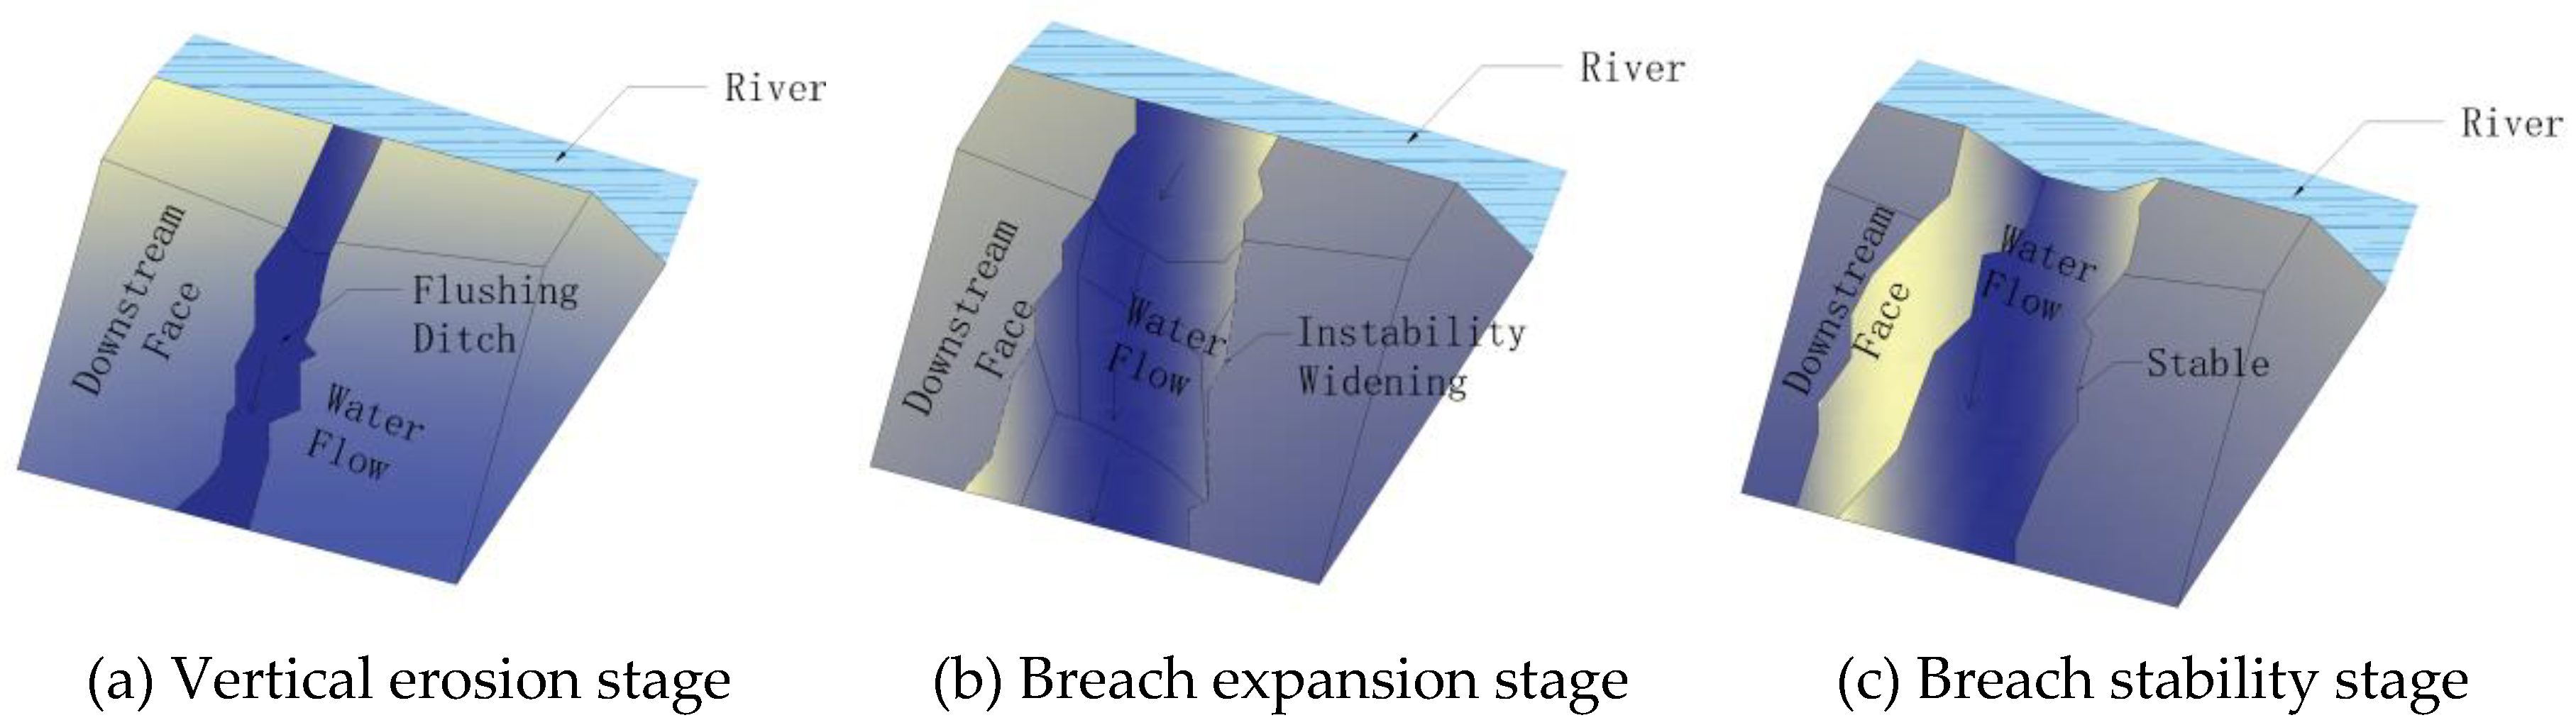

Table 1.
Geometric dimensions of the prototype and test embankment.
| Parameter | Changkai embankment | Test Embankment 1 | Test Embankment 2 | Test Embankment 3 | Hrizontal Sale |
|---|---|---|---|---|---|
| top width(cm) | 1000 | 10 | 10 | 10 | 1:100 |
| Height(cm) | 550 | 15 | 20 | 25 | / |
| Vertical Scale | / | 1;36 | 1:28 | 1:22 | / |
Table 2.
Test conditions of embankment breach.
| Test Condition | Top width(cm) | Height(cm) | Water level(cm) | Inflow rate(cm3/s) |
|---|---|---|---|---|
| 1 | 10 | 15 | 8 | 60 |
| 2 | 10 | 15 | 10 | 60 |
| 3 | 10 | 15 | 12 | 60 |
| 4 | 10 | 20 | 8 | 60 |
| 5 | 10 | 25 | 8 | 60 |
| 6 | 10 | 15 | 8 | 80 |
| 7 | 10 | 15 | 8 | 100 |
Disclaimer/Publisher’s Note: The statements, opinions and data contained in all publications are solely those of the individual author(s) and contributor(s) and not of MDPI and/or the editor(s). MDPI and/or the editor(s) disclaim responsibility for any injury to people or property resulting from any ideas, methods, instructions or products referred to in the content. |
© 2025 by the authors. Licensee MDPI, Basel, Switzerland. This article is an open access article distributed under the terms and conditions of the Creative Commons Attribution (CC BY) license (http://creativecommons.org/licenses/by/4.0/).
Copyright: This open access article is published under a Creative Commons CC BY 4.0 license, which permit the free download, distribution, and reuse, provided that the author and preprint are cited in any reuse.


