

Submitted:
03 May 2023
Posted:
04 May 2023
You are already at the latest version
Abstract
The local reactive power control in distribution grids with a high penetration of distributed energy resources (DERs) is essential in future power system operation. Appropriate control characteristic curves for DERs support stable and efficient distribution grid operation. However, the current practice is to configure local controllers collectively with constant characteristic curves that may not be efficient for volatile grid conditions or the desired targets of grid operators. To address this issue, this paper proposes a time series optimization-based method to calculate control parameters, which enables each DER to be independently controlled by an exclusive characteristic curve for optimizing its reactive power provision. To realize time series optimizations, the open-source tools pandapower and PowerModels are interconnected functionally. Based on the optimization results, Q(V)- and Q(P)-characteristic curves can be individually calculated using the linear decision tree regression to support voltage stability and provide reactive power flexibility and potentially reduce grid losses and component loadings. In this paper, the newly calculated characteristic curves are applied in two representative case studies, and the results demonstrate that the proposed method outperforms the reference ones suggested by grid codes.
Keywords:
characteristic curve
; optimal power flow
; distribution grids
; voltage stability
; reactive power flexibility
1. Introduction
1.1. Motivation
Power systems worldwide are increasing in complexity due to the increasing penetration of distributed energy resources (DERs). In Germany, the existing and to-be-implemented DER are, with the majority of 97%, installed at the distribution and sub-transmission levels [1] that can be controlled, monitored, or analyzed by the power system operators [2]. The rapid increase in DERs can cause power system instabilities[3], such as system inertia reduction [4], transmission congestion [5], overloading, and voltage problems [6] in distribution grids. In particular, (static) voltage stability is one of the main concerns of the system operators [7]. This is currently largely implemented via grid reinforcement and, operationally, via intentional stepping of transformers, voltage controller (e.g., voltage-related redispatch), and the provision of reactive power [8]. In the past, reactive power has been supplied primarily by conventional power plants and reactive power compensators [8]. However, the rapid development of power electronic technologies has made it possible to utilize DER to provide reactive power. As the increasing transport distance and the decreasing of conventional power plants in transmission grids, the available potential of the reactive power from DERs in the high voltage (HV) grid could also be used to provide flexibility to the superordinate grid levels [9], in addition to its common usages, e.g., for local voltage stability.
The efficiency of reactive power provision from DERs is determined by the applied control strategies. In general, the reactive power provision can be controlled centrally and locally. Central control strategies depend on the communication infrastructure for collecting real-time grid information, processing them, and controlling the DERs [10]. In the past few years, technological advancements and the growth of intelligent grid management and monitoring systems have facilitated the communication capabilities of some high and medium voltage (MV) levels [11,12]. With central control, e.g., centralized reactive power optimization, the optimal reactive power setpoints for each DER can be calculated in real-time to achieve objectives such as supporting the reactive power balancing at the distribution to transmission interface or maintaining the voltages of certain buses. Unlike central strategies, local control strategies avoid the need for a communication channel and therefore are very commonly used at medium and low voltage levels due to simplicity, high computation efficiency, and strong reliability, which is suitable for an almost real-time response to grid condition changes. Local controls are often realized as fast feedback control systems based on autonomous control characteristic curves, e.g., Q(V)- (VAr-Voltage-) droop curves or Q(P)- (VAr-Watt) characteristic curves. They can serve as a backup for failures in central control or as a bridging solution for grid operators without modern grid monitoring systems.
As can be seen, the applied characteristic curves determine the efficiency of the local reactive power provision from the DER. However, in almost all the German distribution grids, the characteristic curves for DERs are configured collectively with ordinarily constant parameters suggested by grid codes, such as VDE-AR-N 4110 [13]. The effectiveness and the benefit of the characteristic curves are limited since, most of the time, the resulting reactive power provision does not match optimal the condition of the distribution grid. For this reason, the development of a method to calculate an optimal characteristic curve for each DER is well worth studying.
1.2. Literature Review
In Q(P)-control mode, the proportionality factor between the target reactive power and the installed active power is changed with increasing active power injection. As Figure 1 (a) demonstrates, during a low injection of active power, a small amount of reactive power is provided, and with a higher injection of active power, a larger percentage of inductive reactive power should be provided by the DER. According to the grid code VDE-AR-N 4110 [13], the Q(P)-characteristic curve is defined by a maximum of ten break points. Grid operators specify the breakpoints to achieve objectives while meeting the technical requirements, e.g., all the points must be located within the Q(P) operational area defined by the grid code, see Figure 1 (c). In this paper, the generation-based signing system is used, i.e., positive reactive power provision means that the DER is over-excited and provides capacitive reactive power (or supplies reactive power to the grid). Table 1 lists the configurable parameters for Q(P)-characteristic curves.
The Q(V)-control uses the local voltage information, which depends on power production and consumption in the neighborhood, and the grid impedance at the network connection point. The corresponding reactive power provision aims to support voltage stability, i.e., keeping voltage within a specific bandwidth. Figure 1 (b) shows a generic characteristic curve for the Q(V)-control, where and are the limits of the reactive power provision defined by grid codes. The reference voltage denotes the voltage setpoint. At this voltage, reactive power is neither injected (over-excited) into the power grid nor absorbed (under-excited) by the DER. The voltage and indicate the voltage range. Reactive control is not executed in the voltage deviation within the dead band for efficient operation of DERs, sparing the reactive power provision. The slope presents the droop of the characteristic curve. Table 2 lists the configurable parameters for Q(V)-characteristic curves.
To find the best configuration setting for the characteristic curves, research has been done to modify the controllable parameter to improve the grid stability. Table 3 shows the research carried out in recent years. The parametrization for the Q(V)- and Q(P)-characteristic curves were modified for voltage stability (VS) and power loss minimization (PLM). However, these methods have the following constraints:
- Evolutionary algorithms and iterative simulations were often used to obtain the proper parameters. A generalized approach using classical optimal power flow was missing, which is more familiar to power system engineers.
- In these studies, the control parameters were not discussed systemically. Only one or a limited number of parameters were considered. The others used standard settings.
- The design of the Q(P)-characteristic curve was mentioned relatively rarely. This may make a significant contribution to objectives with suitable configuration.
- As mentioned in section 1.1, in addition to supporting VS and PLM, reactive power provision from DER in distribution grids can be also used to support the reactive power balancing (provide reactive power flexibilities) at the distribution-to-transmission interface and to enable the desired ancillary services at the up-streamed transmission level. The corresponding characteristic curves are hence worth studying. However, this has not been considered.
1.3. Contribution and Organization
In our previous work [26], a method based on time series optimization was proposed. The method utilized an artificial neural network- (ANN-) based optimization proposed by [27] to estimate reactive power setpoints of DERs for maintaining the predefined voltage value. According to the distribution of ANN-estimated QP-operating points for a specific period, individual Q(P)-characteristic curves for each DER can be fitted by the polynomial regression and modified as characteristic curves for local reactive power provision. However, the previous method has some limitations:
- The ANN-based time series optimization (or estimation) needs low computational resources. Its drawbacks are obvious, i.e., it is highly subjective-dependent, and a lot of time needs to be devoted to pre-training and parametrization. It is inefficient for short-term time series optimization.
- Using polynomial regression to determine the characteristic curve (a continuous piecewise line: multiple segments connected by breakpoints) is not an efficient method. Firstly, we need to carefully select the polynomial degree based on the data. Secondly, the result is typically a single curve. This can make it challenging to identify the breakpoints necessary for the characteristic curve.
- Only the Q(P)-characteristic curve for voltage stability was considered.
- Lack of automatization and generalization.
This method is further developed by implementing the following improvements and extensions:
- An implemented open-source tool is applied and further developed, enabling the users to create custom mathematical optimization models for time series optimization in power systems. For this paper, additional models for reactive power optimization are implemented, applied, and released in github.
- The previous method is extended to Q(V)-characteristic curve calculations, considering dead band settings.
- The decision tree method is used for linear regression, with which a continuous piecewise line can be efficiently calculated as a characteristic curve.
- Q(P)- and Q(V)-characteristic curves for the observed grids can be individually calculated, supporting maintaining voltage stability, reactive power flexibility provision, loss minimization, and loading reduction.
These developments are implemented as a module with automated parametrization, calculation, simulation, and evaluation. For this paper, comprehensive simulations are carried out, considering voltage stability and transmission to distribution cooperation. To validate the advantages of the optimized characteristic curves, their performance is compared to the reference ones suggested by grid codes.
The structure of this paper is organized as follows: In Section 2, the features and functionality of the proposed method for an individual characteristic curve calculation are described. Subsequently, the developed tool for power system optimization is introduced in Section 3. Section 4 performs two case studies to evaluate the proposed method. Finally, in Section 5, conclusions are drawn.
2. Characteristic Curve Calculation for Local Reactive Power Control
2.1. Method Overview
Figure 2 shows an overview of the method. In the following, the inputs, outputs, and three calculation processes are shortly outlined.
Input Data: The grid data and modeling are performed in the pandapower [28] format. The aim of the calculated characteristic is to address the time-varying grid condition, which is featured by the corresponding time series. Thus, time series data for loads and generations for an interesting time window is indispensable. Users can calculate different characteristic curves for various targets by defining the curve type (Q(P) or Q(V)) and the objective, such as maintaining voltage-setpoints and maintaining reactive power-balancing. In addition, optional parameters such as “dead band” and “setpoints” can be configured.
Time Series Optimization: Based on the given input data, an optimal power flow problem with reactive power-setpoints of DER as variables is solved for each time step. For this, pandapower with PowerModels [29] provides a convenient solution. As optimization results, optimized reactive power-setpoints of DER are calculated for each time step and form the optimized operating points.
Linear Regression: With these optimized operating points, a scatter diagram can be created individually for each DER. The optimal Q(P) or Q(V) relationship for each DER is then approximated using the linear decision tree regression. It is used in expectance of a better performance compared to the conventional Q(P)- or Q(V)-characteristic curve regarding a predefined objective.
Verification and Modification: The optimized Q(P)-or Q(V)-relationships for each DER have to pass the acceptance tests to meet the technical requirements of the grid codes; otherwise, the coordinates (position) of some breakpoints can be modified, for avoiding steep slopes. In this case, the regressed characteristic curve might no longer fit the operating point distribution completely and therefore might no longer be optimal in the sense of an optimization. The final Q(P)- or Q(V)-characteristic curve is then determined.
Output Data: A list of optimized (Q(P) or Q(V)) coordinates for DER are exported as the output data and can be directly applied for further simulation and analysis.
In the following sections, some of the assumptions, features, and functionalities of the proposed method are introduced in detail.
2.2. Continuous Piecewise Linear Fitting
The characteristic curve is a continuous piecewise line with breakpoints representing the termination points of line segments. This section describes the fitting of continuous piecewise linear functions from the optimized operating points.
For curve fitting, linear regression is usually the first algorithm that comes to mind. It is a linear model and works effectively when the data has a linear shape. However, if the data has an aperiodic non-linear shape and the dataset is limited, linear regression cannot capture the non-linear features. Polynomial regression is one of the most popular choices for approximate non-linear features. To accurately fit the data points with a polynomial curve, careful design is required, i.e., this involves the user having a solid understanding of the data, enabling them to make informed decisions when selecting the most appropriate exponents. The fitting curve is prone to overfitting if exponents are poorly selected [30]. To find the best continuous piecewise line from the optimized operating points, the difficulty is finding the best location of the breakpoints. Neither linear regression nor polynomial regression can solve this problem. In this context, a machine learning algorithm “decision tree” is used in this paper.
Decision trees are a non-parametric supervised learning method used for classification and regression [31]. They capture the nonlinearity in the data by splitting them into smaller segments in a way such that the sum of squared residuals is minimized. Each segment corresponds to a decision or a leaf of the tree. One of the variants of the decision tree is called the linear tree. This implies having linear models in the segments instead of a simple constant approximation. As a result, the linear tree model makes the final fitting curve piecewise, continuous, locally linear, and globally non-linear, which fits the conditions for a characteristic curve.
Based on the python package linear-tree [32], a fitting function for the proposed method was developed in this paper. Figure 3 shows an example of finding the optimized Q(V)-characteristic curve. A linear tree model is trained by the given data (blue points in Figure 3). The red piecewise line presents the fitting characteristic, whose breakpoints (x-locations: and ) correspond to the conditions in the tree model (right). and can be a user- defined period, e.g., [0.9, 1.0]. The optimized y-coordinates are determined by calling the trained tree model for the inputs (, , , ). The losses in the plot on the right express the residuals between the operating points and the regressed segments (red lines).
In general, the Q(V)-characteristic curve tends to divide the distribution of the voltage into two parts, centered on . The part greater than is called the over-voltage part ([, 1.1]), and the part below 𝑉ref refers to the under-voltage part ([0.9, ]). The curves in these two parts are normally symmetrical according to , cf. Figure 1. However, during the operation of real distribution systems, the span of the bus voltage distribution for a time window is often small, i.e., most of the bus voltages can be located only in the over-voltage part or in the under-voltage part, e.g., the bus voltages in Figure 3 are all located within the under-voltage part ([0.9, ]). In this case, the proposed model estimates the other part of the Q(V)-characteristic curve using the principle of symmetry. Figure 4 shows the estimation for the calculated Q(V)-characteristic curve in Figure 3. The fitting curves for both parts are symmetric around the -axis. Considering the grid code limits (e.g., −0.328 p.u. < Q < 0.328 p.u.), they are further modified, and the final Q(V)-characteristic curve (solid red line) is unsymmetric. It is noting that this DER provides also a small amount of inductive reactive power () when the voltage is lower than . It is caused by the objective function and optimization settings and is explained in the following sections.
If there are enough points in both over-voltage and under-voltage parts, the characteristic curve is still calculated based on the distribution of points, and it can be asymmetrical.
Figure 5 suggests the suitable range for choosing the reference value for each voltage level without voltage controllers. For a generator-dominated grid, a reference value below 1.0 p.u. probably would be more appropriate. In contrast, for a load-dominated grid, a reference value above 1.0 p.u. (e.g. 1.03 p.u.) might be favorable. For this paper, is used in case studies.
2.3. Objective Functions
As mentioned in section 1, DERs can provide reactive power for objectives like supporting voltage stability or reactive power balancing at the grid interface. Correspondingly, the optimization models - maintaining voltage-setpoints and maintaining reactive power-setpints – are formulated.
Maintaining Voltage-Setpoints: Grid operators want to preserve a consistent voltage profile across all/part of the buses in the power system. The applied optimization, in this case, should help both of them to identify the preferable set of actions and to achieve the desired profile. The objective is to minimize the deviation of the voltage magnitude at the DER bus from a setpoint. The resulting reactive powers enable the setup of Q-related characteristics to guarantee the resilience of local voltage. The general formulation of the objective function and the numerical and technical constraints are represented as follows:
| sets: | |||
|
Buses generators (or DER) Loads branches |
|||
| variables: | |||
|
voltage magnitude voltage angle reactive power of DER |
|||
| (1) | |||
| subject to: | |||
| ac power flow | (2) | ||
| branch current | (3) | ||
| voltage magnitude | (4) | ||
| voltage angle | (5) | ||
| gen. reactive power | (6) | ||
| gen. active power | (7) | ||
| load apparent power | (8) | ||
where is the vector of complex voltages, is the complex bus admittance matrix, is the vector of complex power fed in by the generators (DER), and is the vector of complex loads. The active power of the DERs and the loads are constant, and they are formulated as equality constraints. is the local bus voltage magnitude at the generator bus. The quadratic objective function, in this case, helps minimize both the positive and the negative deviations of the voltage from the desired setpoint. Since all DERs are taken into account collectively during the optimization process, the optimized reactive power provision of DER contributes not only to its local voltage but to the voltages of all considered DERs. Thus, the subsequently calculated characteristic curve can be regarded as “decentralized” or “distributed” control to some extent [34].
Considering the dead band setting, in this paper, the objective function and constraints are modified. The predefined dead band can divide the voltage distribution into two areas, i.e., inside the dead band and outside the dead band. DERs whose voltage is inside the dead band zone will not provide reactive power (see step 1 in Figure 6). On the contrary, the reactive power of DERs whose voltage is outside the dead band zone will be considered as optimization variables. For the corresponding buses, the setpoints are set to (e.g., 1.03) and (e.g., 0.97) (see step 2 in Figure 6). Compared to 1.0 p.u., (e.g., 1.03) is more approachable, and the required reactive power is, thus, less. These modifications in steps 1 and 2 achieve a dead band setting and save the reactive power provisions, but they also limit the optimal solution to a certain extent, i.e., the voltage will be regulated in a limited way.
To further save the reactive power provision, in step 3, the objective function is extended by adding the minimization of reactive power provisions. Two sub-objectives in step 3 are connected through coefficient and , with . An analysis of different coefficient combinations is presented in the following case studies, e.g., Figure 13.
Maintaining reactive power-setpoints: The motivation for this objective is the provision of reactive power flexibility from the distribution system to the transmission system. The deviations of reactive power injection at the interface from a target value are minimized. It is formulated by equation (9) (The sets, variables, and operating constraints refer to the mathematical formulation for the objective of maintaining voltage setpoints):
Except for maintaining voltage-setpoints and reactive power-flexibility, optimization models for power loss minimization and branch loading reduction are implemented and can be used for the proposed method. Nevertheless, this paper only focuses on the application of the introduced objectives.
2.5. Update Frequency
Due to the time-varying power system, it is supposed that the reactive power dispatch or the update of the characteristic curve calculation is periodically scheduled. As the overview describes, the optimized characteristic curve is calculated based on the given time series. If short-term time series are used, e.g., using daily time series (day-ahead forecasting), frequent updates of control settings are possible. However, it would be time-consuming for the grid and DER operators (in some distribution grids, DER is still configured manually). Additionally, a short-term time series means that only a few optimized operating points are available for characteristic curve fitting and therefore it is susceptible to extreme values. Hence, it can be assumed that an update within these short periods is not advisable.
Also, medium- and long-term updates according to monthly or annual time series (e.g., the historical data of last year) are considerable. In this case, time series deviations[1], e.g., forecasting errors or uncertainties, directly influence the distribution of optimized reactive power-setpoints for each DER. The finally calculated characteristic curves are, anyway, approximated piecewise linear fitting curves, and the forecast errors can be assumed to be of the order of the approximation error or even lower and, hence, have fewer negative effects. This has been validated in [6]. With medium- and long-term timer series, grid operators don’t have to update the characteristic curve parameter frequently. In this paper, calculations and simulations are performed within a time window of three months.
3. Optimization Tool: Interface between pandapower and PowerModels
To execute a time series optimization, a convenient optimization tool is required. In the past, a variety of tools for power system analysis and optimization were published and made available, in particular within the Open-Source community. The advantage of Open-Source software is that it allows unlimited sharing of developments and unlimited verification of models.
pandapower and PowerModels
Pandapower [28] is a program designed to automate analysis and optimization in power systems, utilizing a combination of the data analysis library pandas [35] and the power flow solver PYPOWER [36]. The pandapower library validated equivalent circuit models for lines, transformers, DER, generators, switches, etc., and provides the most commonly used static network analysis functions, including power flow calculation, times-series simulation, short-circuit analysis, state estimation, grid equivalent, etc. To solve the classic AC and DC optimal power flow challenges in power systems, pandapower has integrated its element-based data structure with the power flow optimization environment PYPOWER, dealing with cost-related optimization problems such as dispatch optimization and load shedding. Until April 2023, there have been over 350,000 downloads of pandapower. It has been used for various projects and investigations by grid operators and research institutes worldwide.
PowerModels [29] is a Julia/JuMP [37,38] package for steady-state power system optimization. It enables computational evaluation of power system models with a focus on decoupling problem terms from the different formulations. Core problem specifications in PowerModels are power flow, optimal power flow, optimal transmission switching, and transmission network expansion planning. Users interested in alternative objectives, such as the reactive power optimizations discussed in this paper, can utilize PowerModels to build customized problem specifications.
3.3. PandaModels
As mentioned above, pandapower is becoming more and more popular for power system analysis, but it can only deal with cost-related optimization issues. PowerModels is especially strong in solving different power-flow formulations but doesn’t provide many pre-implemented models for custom objectives. It can serve as the basis for further development. In this context, we have developed an interface called PandaModels (combining pandapower and PowerModels) as described in [39]. However, it has not yet been applied in published case studies. This interface enables a stable and functional connection between pandapower and PowerModels, and also extends the available models for reactive power optimization. As Figure 7 shows, a conversion from the pandapower format to the PowerModels format is enabled by the pandapower-PowerModesl (PP-PM) converter. After the optimization in PowerModels, the PP-PM converter transforms the optimization results back to the original pandapower grid model, which can be used for further analysis.
The most important feature of PandaModels is that it extends the optimization models. Except for the existing PowerModels-models, the optimization model to support voltage stability, such as equations (1)-(8), has been implemented [39]. For this paper, the optimization model for multi-objectives as shown in Figure 6 is implemented. In addition to this, optimization models with objectives including provision of reactive power flexibility (as described in equation (9)), power loss reduction (as described in equation (10)), and loading reduction (as described in equation (11)) are implemented. In (10), the total losses along a branch - are equal to the apparent power leaving bus minus the apparent power arriving bus . Equation (11) shows the objective function for branch loading reduction, which minimizes the deviation of the current of target branches (lines or transformers) from zero. The variables and operating constraints refer to the mathematical formulation in section 2.3.
All of the implemented optimization models can be accessed through their corresponding functions in pandapower. The released tutorials[2] demonstrate how users can use these models to solve optimization problems in power systems. Based on this knowledge, users can define custom objectives by adding models in the model bank.
One of the advantageous features of PowerModels is its ability to solve multi-grid optimization problems. This paper uses this capability to address time-series optimization for a specific grid model by substituting the “multi-grid” component with a “multi-time step of one grid” approach, as depicted in Figure 8. The time series configuration is compatible with the time series controller in pandapower. Alternatively, a more direct way is that users can perform time series optimizations iteratively through a loop.
4. Case Studies
Based on the power system analysis tool pandapower with the parallel high-performance computing solver [40], this section applies and tests the developed method with different grids and scenarios for various objectives. In the first case study, Q(P)- and Q(V)-characteristic curves (without dead band) are calculated for voltage stability. Subsequently, regarding the saving of unnecessary reactive power provision, the dead band for Q(V)-characteristic curve is considered, and its effect is analyzed. In the second case study, the proposed method is applied to support the Q-balancing or -flexibility at the TSO-DSO interface.
As discussed before, a three-month time series for loads and DERs are used for the time series optimization and the simulative grid operation, see Figure 9. According to [41,42], a quarter ahead forecasting errors are considered in the optimization phase, see Table 4, where is the actual active power injection (DERs) or consumption (loads). The performance of the newly calculated characteristic curves is compared to the reference ones based on time series simulations without forecasting errors.
4.1. Characteristic Curve Calculations for Voltage Stability
In the first case study, the proposed method is applied for voltage stability by maintaining the voltage setpoints. A real German 20 kV distribution grid – 475 buses, 112 loads (total load of 12.19 MW), and 126 DERs (total nominal injection 22.61 MW, 50 DERs are controllable) – of the grid operator LEW Verteilnetz GmbH is used as the test grid, see Figure 10 (a). The time series profiles are generated according to the local weather data from [43] in 15-min resolution over one year. To display the advantages of individually calculated characteristic curves, conventional fixed - (fixed Q(P)), Q(P)- and Q(V)-characteristics, as shown in Figure 10 (b) are considered as references.
4.1.1. Characteristic Curve Calculation and Simulations
The optimization model in section 2.3 with objective function is used to minimize the deviation of DER bus voltages from 1.0 p.u. Q(V)-characteristics curves are calculated without dead band settings. Figure 11 (a) shows the calculated Q(P)-characteristic curves for two exemplary DERs. All optimized operating points are located within the operational area defined by the grid code German VDE-AR-N 4110 [13]. DER A presents essentially inductive features while the operation of DER B changes from under-excited to over-excited with increasing active power feed-in. This significant difference is caused by the local conditions and the objective function settings. According to the objective function , all DERs contribute together (with under-excited Q or over-excited Q) to maintain all the DER bus voltages at 1.0 p.u.
Figure 11 (b) displays the Q(V)-characteristic curves for DER A and B after modifying the curve type. In comparison to the Q(P)-characteristic curves on the left, the x-coordinates (voltage) cover only a portion of the entire [0.9, 1.1] range. As a result, the two Q(V)-characteristic curves appear relatively similar. It is worth noting that the slopes for Q(V)-characteristic curve must be restricted to 16.5 and may not accurately reflect the distribution well, as seen in A-QV.
The individually calculated (or optimized) characteristic curves are assigned to all 50 controllable DERs, while the reference characteristic curves are configured collectively. Based on time series simulation, the results are evaluated in Figure 12. Table 5 defines the simulations with different characteristic curves.
Figure 12 (a) compares the bus voltage magnitude distribution caused by different control modes in violin plots. All bus voltages are located within 90% to 110% of the rated terminal voltage. The results directly obtained from time series optimization (pink) are the best, i.e., the voltage distribution is closer to the exemplarily defined setpoint 1.0 p.u. The second-best scenario is caused by the optimized Q(P)-characteristic curves (green). Correspondingly, more reactive power is provided, see Figure 12 (b). Compared to the scenario with ID QV, the voltage distribution caused by the calculated Q(V)-characteristic curves (ID: QVopt, brown) extends downward to 1.0 p.u. with increased reactive power provision from DERs.
To calculate more proper Q(V)-characteristic curves (maintaining voltage stability with saving reactive power provision), in the next section, the dead band is considered, and the optimization process with multi-objective function is applied according to Figure 6, introduced in section 2.3.
4.1.2. Calculation Considering Dead Band Setting
According to Figure 12 (a), the considered bus voltages without reactive power provision (ID: Q0) were distributed from 0.99 p.u. and 1.075 p.u. Since they are all within the boundaries [0.9, 1.1], from the point of view of reactive power saving, reactive power doesn’t have to be provided. This paper does not focus on optimizing the dead band setting but on the characteristic curve calculation outside the defined dead band. Thus, the dead band of [0.97, 1.03] suggested by the grid code and [44] is used, cf. Figure 10 (b).
As introduced in section 2.3, only DERs with voltages outside the dead band are taken into account in the objective function. The setpoints for these buses are set to the upper limit (1.03 p.u.) or the lower limit (0.97 p.u.), see equations (12) and (13). Furthermore, an additional objective for reactive power saving is added. Its effect can be visualized by running with different coefficient combinations ( and ).
Figure 13 displays the optimization results with the objective functions (12) and (13) for one exemplary time step with different coefficient combinations. For this time step, only 24 of 50 DERs have voltages outside the dead band. It is obvious that with and (leftmost), both capacitive (over-excited) and inductive (under-excited) reactive power are provided from the 24 DERs, and the resulting voltage is the lowest (it is equal to the defined setpoint ). With larger the provided reactive power decreases (especially from to ), and the resulting voltage is close to the value without optimizations.
Figure 13.
Optimization results with different coefficient settings for an exemplary time step.
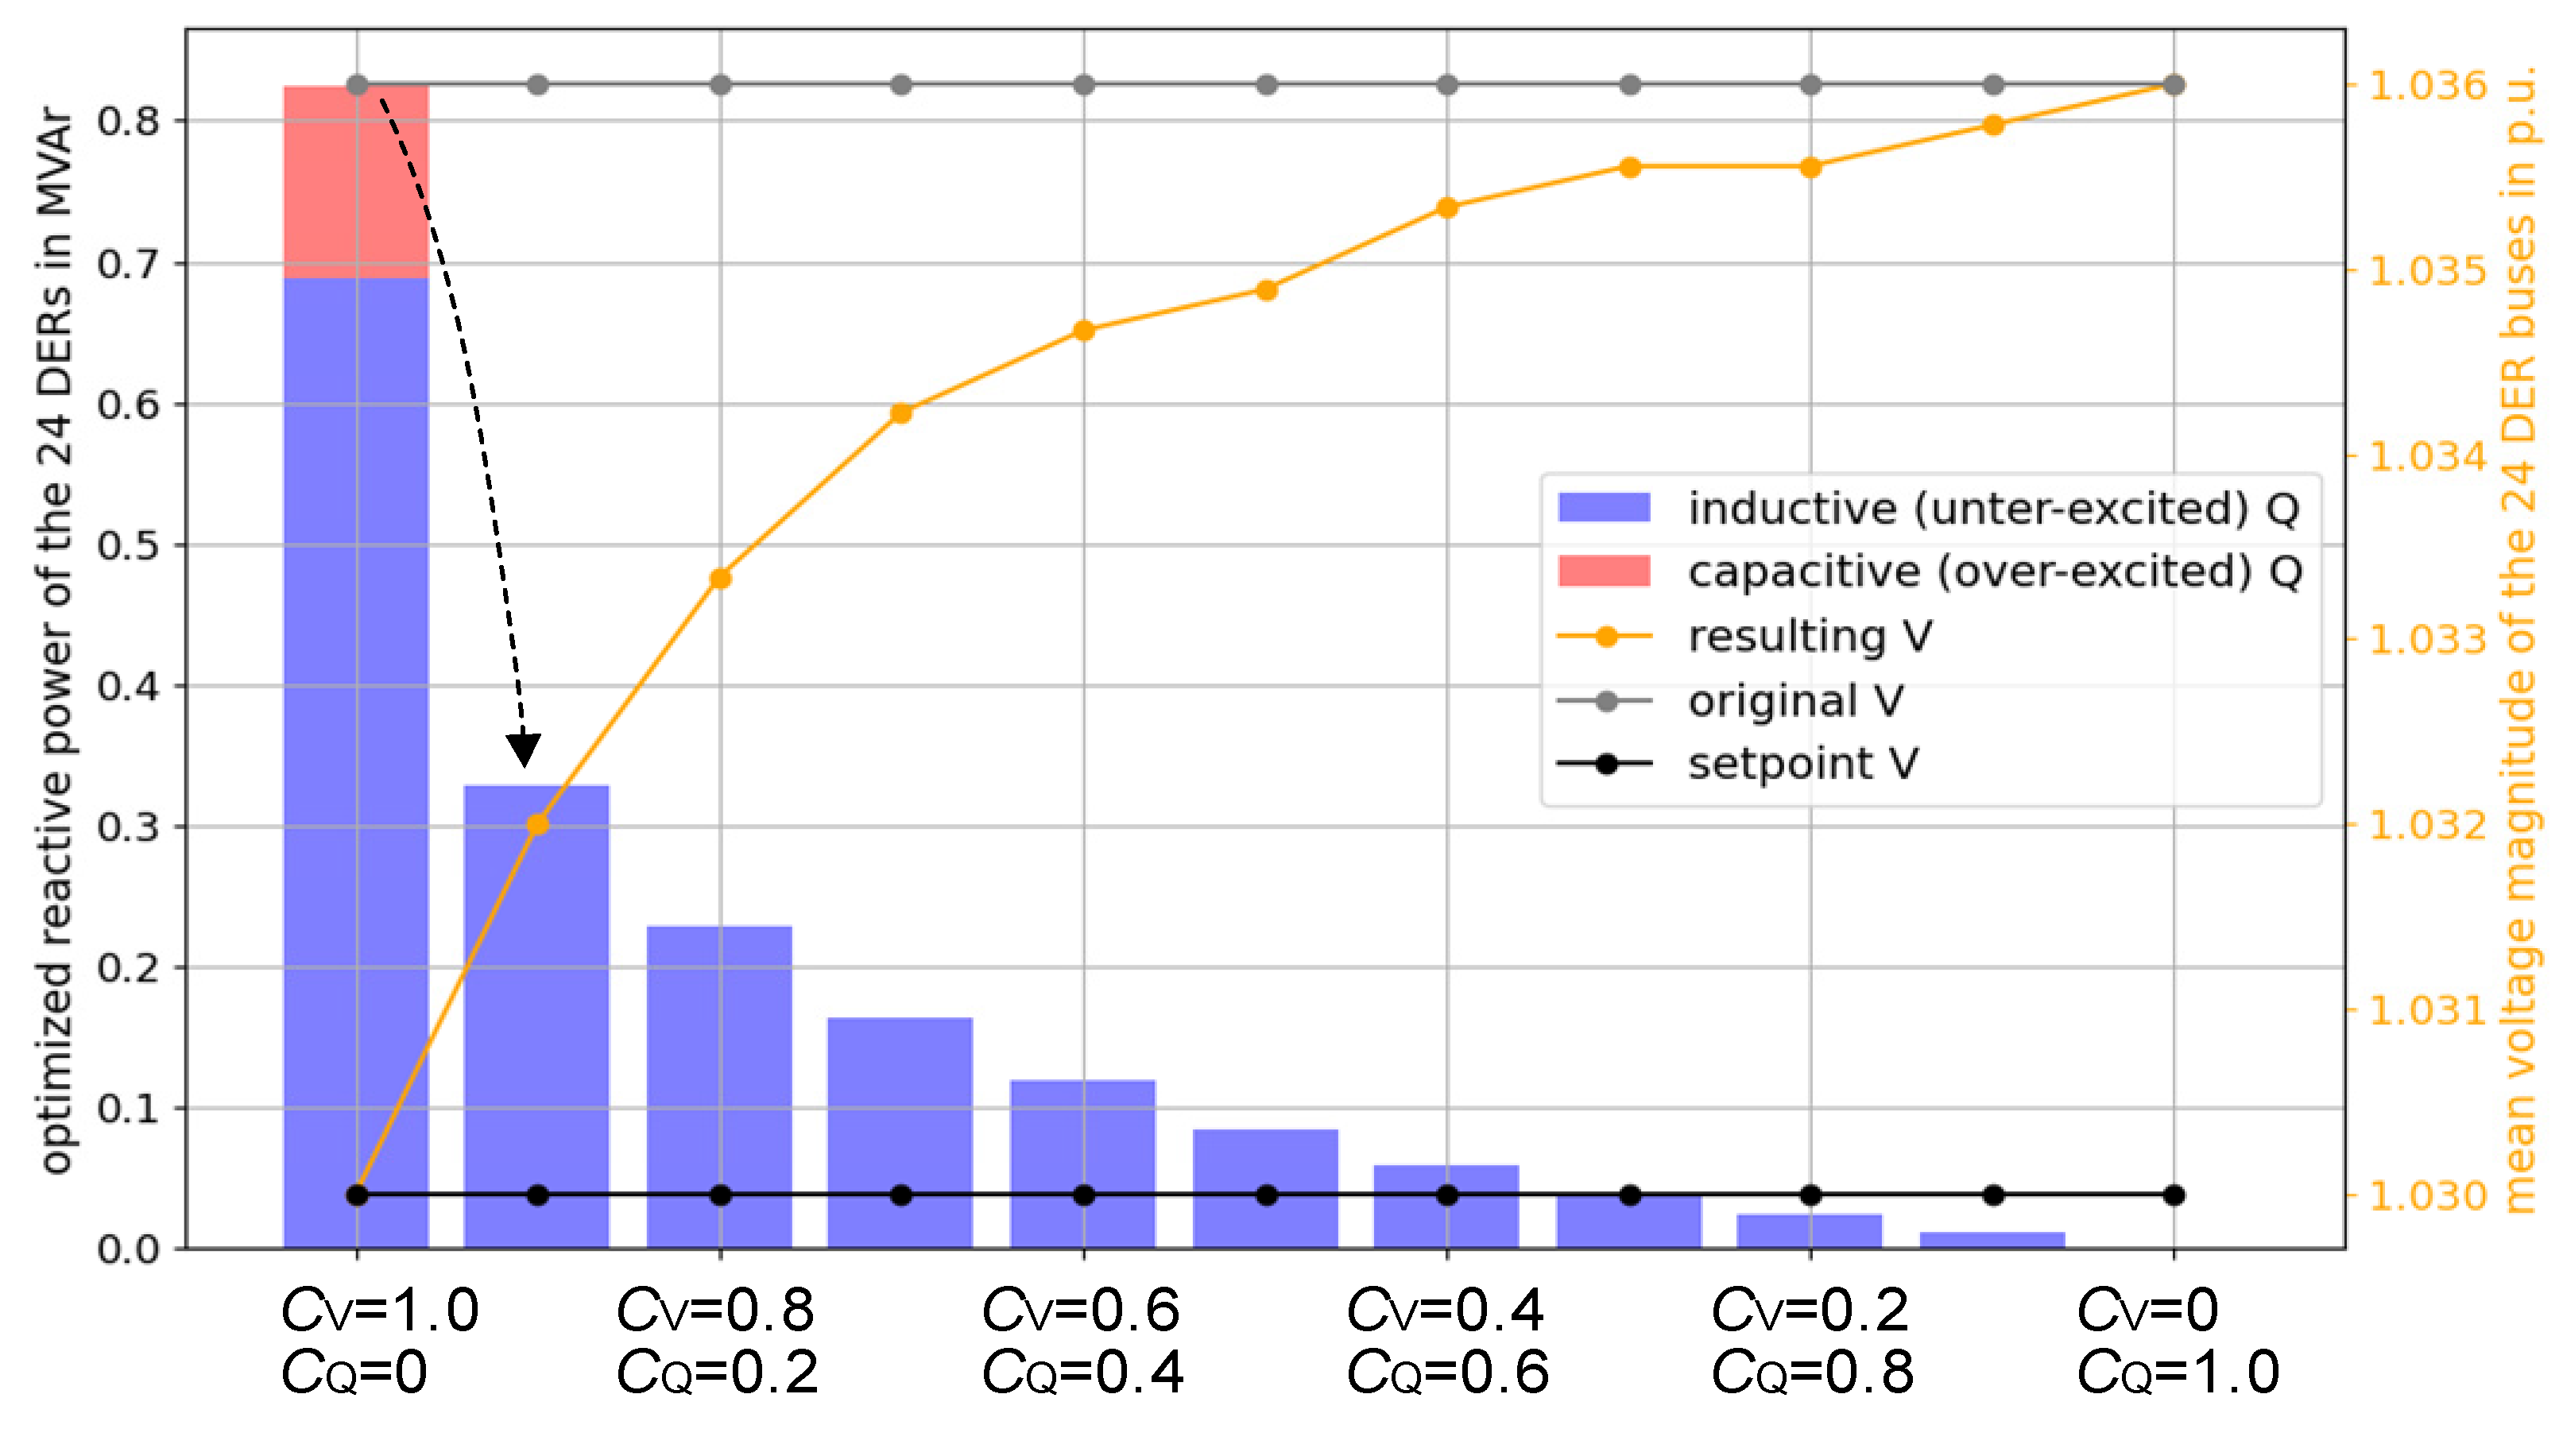
Using and as an example, Q(V)-characteristic curves considering dead band and reactive power saving are calculated individually for the 24 DERs. Figure 14 illustrates the resulting characteristic curves for some of the DERs, while also comparing them to the previous results for DER A and B. It is evident that considering the dead band (A-DBD and B-DBD), the DERs can provide reactive power starting from 1.03 p.u. Moreover, A-DBD and B-DBD exhibit far fewer time steps with reactive power provision compared to the case without considering the dead band (A and B). In addition, the trend of the distribution of the operating points in A-DBD and B-DBD is more prominent, facilitating the identification of the characteristic curves.
Regarding other exemplary DERs (C, D, E, F), the main difference between the newly calculated (cyan) and the reference (purple) Q(V)-characteristic curves is the slope. In most cases, the newly calculated characteristic curves have a relatively flat slope compared to the purple dashed line, suggesting that they allow for lower reactive power provision.
In the simulation phase, the calculated and the reference characteristic curves are assigned to DERs for three-month time series simulations. It can be seen in Figure 15 (b), as expected, that the individually calculated slopes allow a slight reduction of reactive energy by comparing QVdbdopt and QVdbd. Compared to the result for QVopt calculated in section 4.1.1, the Q reduction caused by QVdbdopt is very considerable, and the resulting voltage distribution is shifted to 1.03 p.u. (the probability density distributed close to 1.03 p.u. is more extensive), see Figure 15 (a).
In general, Q(V)-characteristic curves considering dead band and Q saving are individually calculated for DERs, and the effect of maintaining voltage stability with limited reactive power provision is achieved. However, it is difficult to compare the results from section 4.1.1 since the optimization conditions are different. A parameter setting that differs from this can lead to different characteristic curves and hence different results. An appropriate (or optimal) parameterization for the optimization model will vary depending on the grid states and the user’s goals.
4.2. Characteristic curve calculations for Q-flexibility provision
As mentioned in section 1, a controlled reactive power exchange at the grid interface between two voltage levels (especially between the distribution and transmission level) is considered nowadays as an essential ancillary service, which can be provided by the distribution system operator (DSO) to the transmission system operator (TSO) using existing Q provision capabilities from DERs in distribution systems. In this case study, central and local provisions of reactive powers from DERs for maintaining the Q flexibility at the TSO-DSO interface are investigated using a generated SimBench [45] grid, see Figure 16. The observed grid consists of an extra-high-voltage (EHV) grid and an HV grid out of the SimBench dataset [45]. TSO and DSO are connected via three EHV/HV transformers. The attached time series are used for calculations and simulations. It is assumed that DSO offers TSO reactive power flexibility by optimizing the reactive power provision of the involved 7 DERs (Wind or PV-Farms with a total installed power of 79 MW), keeping the Q-exchange at three interfaces, see Table 6.
4.2.1. Central Optimization
For finding the optimized reactive power provision of DERs, central optimization can be realized using the developed PandaModels. Based on the SimBench time series in 15-minute resolution, the optimization with reactive power of DERs as optimization variables for each time step is solved for the objective:
Figure 17 shows central optimization results for an exemplary day (timestep from 96 to 192). It is evident that, during the simulative day, all Q-exchanges (green: normal values, orange: optimized values) at the three interfaces are located within the theoretical Q-range (the grey area), based on the Q provision capability from DERs, according to the resprectivegrid codes. With central optimizations, the target providing Q-setpoint at the interface is primarily achieved, e.g., from timestep 92 to 150, with sufficient available capacities, the optimized values follow the targets, and the corresponding deviation (see plot on the bottom) is almost zero. Due to limited Q provision capabilities from DERs, from the time step 150, the expected setpoints are not met, but the optimized values are still better than that with normal power flow.
When using centralized optimization, communication failures and optimization failures are inevitable. In such scenarios, it is recommended that the DERs switch back to characteristic-curve-based local control mode, which should align with the grid condition and the objective. In addition to serving as a backup for failures in central optimization, local control can also function as a bridging solution for DSOs lacking modern grid monitoring systems to provide TSOs with ancillary services. In the following section, we will explore the Q-flexibility supported by the characteristic curves.
4.2.2. Characteristic Curves Calculation and Simulations
As DERs in this case study provide reactive power to meet the reactive power balancing at the TSO-DSO interface as much as possible, the dead band setting is not considered during the characteristic curve calculations. With maintaining reactive power-setpoints as the objective function, the proposed method is performed based on a three-month time series optimization considering forecasting uncertainties to calculate proper characteristic curves. Figure 18 shows the calculated characteristic curves for two exemplary DERs, where the Q(V)-characteristic curve only shows the part from 1.0 p.u. to 1.1 p.u. It can be observed that the distribution of QV-coordinates is relatively more concentrated and has a more pronounced trend (e.g., A-QV in Figure 18). However, due to the slope’s limitation on grid codes, the calculated Q(V)-characteristic curve (cyan line) can only cover a part of the distribution of points. By comparison, the Q(P)-characteristic curve follows the corresponding fitting curve (orange) well, although the QP distribution is relatively scattered. These calculated characteristic curves are configured for DERs in a three-month time series simulation.
To assess the impact of different characteristic curves on Q-exchanges at TSO-DSO interfaces, the mean errors from the setpoints in Table 6 and the mean total reactive power provisions for each type of characteristic curve are displayed in Figure 19. As a reference, the characteristic curves with ID QPf, QP, and QV, which have the same parameters as in the last case studies, are applied. The results directly from the centralized optimization (ID: OPT) yield the smallest deviation to the objective values, 5 MVAr in total for each 15min; see Figure 19 (a) bottom. The second best is the simulation with optimized Q(P)-characteristic curves (ID: QPopt; purple: mean total error of 6.35 MVAr), which is better than the reference scenario (ID: QP; green). Compared to OPT, the error is reduced by about 40% (). Similarly, the optimized Q(V)-characteristic curve (ID: QVopt; brown) supports more effectively than the reference one (ID: QV, red). The results for QVopt can be better if there was a more relaxed condition on the slope, such as allowing a larger slope.
Figure 19 (b) shows the mean reactive power provision for each 15min. The most obvious feature is that with optimization (OPT, QPopt, and QVopt), more capacitive reactive power is provided. Depending on the local condition and the distance from the interfaces, inductive or capacitive reactive feed-ins are needed, e.g., the DER A and the DER B in Figure 18 show different properties.
By modifying the objective function or creating proper combinations of objectives, different characteristics can be calculated for different purposes in terms of grid operation. For example, the objective function in this study can be extended to consider voltage support, see (15). For this, it is necessary for the users to find the most suitable combination of and by means for several simulations.
As previously mentioned, PandaModels includes optimization models for loss and loading reduction, allowing for the calculation of the corresponding characteristic curves. The related case studies and simulations are not given in this paper.
5. Conclusions
In this paper, an innovative method to design suitable characteristic curves of DERs for local reactive power control was introduced, implemented, and validated by different case studies. The Q control characteristic curves in this paper were calculated based on results from time series optimizations. To do this, the tool PandaModels was applied and further developed, with which optimization problems – maintaining voltage setpoints and maintaining reactive power setpoints – can be solved with Q-setpoints of DER as optimization variables. As a result, characteristic curves for the DERs were calculated individually using linear decision tree regression, considering the grid code limits (e.g., slope and breakpoints). The simulation results clearly demonstrate that the proposed method in this paper outperforms the reference characteristics in terms of voltage stability and provision of Q-flexibility at TSO-DSO interfaces (e.g., after calculation, the mean error from the central optimization was reduced by about 40%.).
The proposed approach is expected to be both simple and efficient in practical implementation. There are no additional requirements for hardware. Since the length of the applied time series and the corresponding forecasting errors have a relatively small impact on the results, it is recommended to choose a longer period, such as six months or one year, for offline calculations based on the objective and forecasting for the next period. The resulting characteristic curves can then be manually or remotely set for each DER. In cases where DERs are remotely controllable, a shorter period with a higher update frequency can be chosen to adjust the objective function in response to changing demands or recalculate the characteristic curves for significant changes in the grid topology.
Meanwhile, further research is still needed:
- The application of the proposed method for different power system devices and types of control curves, e.g., the I(V)-characteristic curve calculation for static var compensators and the P(V)-characteristic curve calculation for electric vehicle charging control. Correspondingly, more optimization models in PandaModels are expected to be further implemented, providing more different ancillary services.
- In this paper, Q(P)- and Q(V)-characteristic curves are observed separately. It may be worthwhile to investigate calculating different curve types based on their location in the grid.
- After the linear decision tree regression, any segment with an excessive slope is corrected to meet the grid code requirements. This corrected segment can be further optimized or appropriately shifted to better represent the distribution of optimized operating points. Additionally, considering Q(V)-characteristic curves with dead band, the dead band width and position can also be optimized and integrated with the proposed method.
Author Contributions
Conceptualization, Zheng Liu; methodology, Zheng Liu; software, Zheng Liu, Maryam Majidi; validation, Zheng Liu; formal analysis, Zheng Liu; investigation, Zheng Liu; resources, Zheng Liu; data curation, Zheng Liu; writing—original draft preparation, Zheng Liu; writing—review and editing, Maryam Majidi, Haonan Wang, Denis Mende, Martin Braun.; visualization, Zheng Liu; All authors have read and agreed to the published version of the manuscript.
Funding
This work was supported in part by the project RPC2 (grant number 035003A) and the project Ladeinfrastruktur 2.0 (grant number 0350048D) funded by the Federal Ministry of Economics and Climate Action according to a decision of the German Federal Parliament.
Data Availability Statement
The data presented in the paper are available on request from the corresponding author. Some of the data are not publicly available due to confidential agreements with the industrial partner in this project.
Acknowledgments
This work was supported by the project RPC2 (grant number: 0350003C), the project Ladeinfrastruktur 2.0 (grant number: 0350048D), and the project SPANNeND (grant number: 5563719) funded by the Federal Ministry of Economics and Energy according to a decision of the German Federal Parliament. The used realistic German grid model was provided by LEW Verteilnetz GmbH. The authors are solely responsible for the content of this publication.
Conflicts of Interest
The authors declare no conflict of interest. The funders had no role in the design of the study; in the collection, analyses, or interpretation of data; in the writing of the manuscript, or in the decision to publish the results.
References
- Federal Ministry for Economic Affairs and Energy, Figures, data und information concerning EEG. [Online]. Available online: https://www.bundesnetzagentur.de/EN/Areas/Energy/Companies/RenewableEnergy/FactsFiguresEEG/start.html (accessed on 29 November 2022).
- Deutsche Energie-Agentur GmbH, “Beobachtbarkeit und Steuerbarkeit im Energiesystem: Handlungsbedarfsanalyse der dena-Plattform Systemdienstleistungen,”. Available online: https://www.dena.de/fileadmin/dena/Dokumente/Pdf/9184_Beobachtbarkeit_und_Steuerbarkeit_.pdf (accessed on 15 March 2023).
- Boyle, G. Renewable electricity and the grid: The challenge of variability; Earthscan: London, UK, 2009. [Google Scholar]
- Du, P.; Matevosyan, J. Forecast System Inertia Condition and Its Impact to Integrate More Renewables. IEEE Trans. Smart Grid 2017, 9, 1531–1533. [Google Scholar] [CrossRef]
- Li, H.; Li, Y.; Li, Z. A Multiperiod Energy Acquisition Model for a Distribution Company With Distributed Generation and Interruptible Load. IEEE Trans. Power Syst. 2007, 22, 588–596. [Google Scholar] [CrossRef]
- Mao, M.; Jin, P.; Hatziargyriou, N.D.; Chang, L. Multiagent-Based Hybrid Energy Management System for Microgrids. IEEE Trans. Sustain. Energy 2014, 5, 1. [Google Scholar] [CrossRef]
- Lee, T.-L.; Hu, S.-H.; Chan, Y.-H. D-STATCOM With Positive-Sequence Admittance and Negative-Sequence Conductance to Mitigate Voltage Fluctuations in High-Level Penetration of Distributed-Generation Systems. IEEE Trans. Ind. Electron. 2011, 60, 1417–1428. [Google Scholar] [CrossRef]
- German Energy Agency, “dena Ancillary Service Study 2030: security and reliability of a power supply with a high percentage of renewable energy,” [Online]. Available online: https://www.dena.de/fileadmin/dena/Dokumente/Themen_und_Projekte/Energiesysteme/dena-Studie_Systemdienstleistungen_2030/dena_Ancillary_Services_Study_2030.pdf (accessed on 29 November 2022).
- CEDEC. ; EDSO; entsoe; eurelectric powering people; GEODE, “TSO-DSO Report: An integrated approach to active system management; Available online: https://www.edsoforsmartgrids.eu/wp-content/uploads/2019/04/TSO-DSO_ASM_2019_190304.pdf (accessed on 29 November 2022).
- Olivier, F.; Aristidou, P.; Ernst, D.; Van Cutsem, T. Active Management of Low-Voltage Networks for Mitigating Overvoltages Due to Photovoltaic Units. IEEE Trans. Smart Grid 2015, 7, 926–936. [Google Scholar] [CrossRef]
- Berizzi, A.; et al. Architecture and functionalities of a smart Distribution Management System. in 16th International Conference on Harmonics and Quality of Power (ICHQP), pp. 439–443.
- Song, I.-K.; Yun, S.-Y.; Kwon, S.-C.; Kwak, N.-H. Design of Smart Distribution Management System for Obtaining Real-Time Security Analysis and Predictive Operation in Korea. IEEE Trans. Smart Grid 2012, 4, 375–382. [Google Scholar] [CrossRef]
- VDE-AR-N 4110 - Technische Regeln für den Anschluss von Kundenanlagen an das Mittelspannungsnetz und deren Betrieb, Verband der Elektrotechnik, Elektronik und Informationstechnik.
- Meyer, M.; Cramer, M.; Goergens, P.; Schnettler, A. Optimal use of decentralized methods for volt/var control in distribution networks. in 2017 IEEE Manchester PowerTech, pp. 1–6.
- Rylander, M.; et al. Methods to determine recommended feeder-wide advanced inverter settings for improving distribution system performance. in 2016 IEEE 43rd Photovoltaic Specialists Conference (PVSC), pp. 1393–1398.
- Takasawa, Y.; Akagi, S.; Yoshizawa, S.; Ishii, H.; Hayashi, Y. Evaluation of Voltage Regulation Functions of Smart Inverters Based on Penetration Level and Curtailment in Photovoltaic Systems,” in 2018 IEEE PES Innovative Smart Grid Technologies Conference Europe (ISGT-Europe), pp. 1–6.
- Dao, V.T.; Ishii, H.; Hayashi, Y. Optimal parameters of volt-var functions for photovoltaic smart inverters in distribution networks. IEEJ Trans. Electr. Electron. Eng. 2018, 14, 75–84. [Google Scholar] [CrossRef]
- Takasawa, Y.; Akagi, S.; Yoshizawa, S.; Ishii, H.; Hayashi, Y. Effectiveness of updating the parameters of the Volt-VAR control depending on the PV penetration rate and weather conditions,” in 2017 IEEE Innovative Smart Grid Technologies - Asia (ISGT-Asia), pp. 1–5.
- Lee, H.-J.; Yoon, K.-H.; Shin, J.-W.; Kim, J.-C.; Cho, S.-M. Optimal Parameters of Volt–Var Function in Smart Inverters for Improving System Performance. Energies 2020, 13, 2294. [Google Scholar] [CrossRef]
- D. Montenegro and M. Bello, “Coordinating Control Devices and Smart Inverter Functionalities in the Presence of Variable Weather Conditions,” in 2018 IEEE/PES Transmission and Distribution Conference and Exposition (T&D), pp. 1–9.
- Jafari, M.; Olowu, T.O.; Sarwat, A.I. Optimal Smart Inverters Volt-VAR Curve Selection with a Multi-Objective Volt-VAR Optimization using Evolutionary Algorithm Approach. in 2018 North American Power Symposium (NAPS), pp. 1–6.
- Friederike Thomas, Sebastian Krahmer, and Peter Schegner, Robust and Optimized Voltage Droop Control considering the Voltage Error. [Online]. Available: https://www.researchgate.net/publication/334491719_Ro-bust_and_Optimized_Voltage_Droop_Control_con-sidering_the_Voltage_Error.
- Kim, W.; Song, S.; Jang, G. Droop Control Strategy of Utility-Scale Photovoltaic Systems Using Adaptive Dead Band. Appl. Sci. 2020, 10, 8032. [Google Scholar] [CrossRef]
- Ampofo, D.O.; Abdelsamad, A.S.; Myrzik, J.M.; Asmah, M.W. Adaptive Q(U) Control using combined Genetic Algorithm and Artificial Neural Network. in 2020 IEEE Electric Power and Energy Conference (EPEC), pp. 1–6.
- Lee, D.; Han, C.; Jang, G. Stochastic Analysis-Based Volt–Var Curve of Smart Inverters for Combined Voltage Regulation in Distribution Networks. Energies 2021, 14, 2785. [Google Scholar] [CrossRef]
- Z. Liu et al., “Optimized Characteristic-Curve-Based Local Reactive Power Control in Distribution Grids with Distributed Generators,” in ETG Congress 2021, pp. 1–6. [Online]. Available: https://ieeexplore.ieee.org/document/9469673.
- Wang, Z.; Menke, J.-H.; Schäfer, F.; Braun, M.; Scheidler, A. Approximating multi-purpose AC Optimal Power Flow with reinforcement trained Artificial Neural Network. Energy AI 2021, 7, 100133. [Google Scholar] [CrossRef]
- Thurner, L.; et al. Pandapower—An Open-Source Python Tool for Convenient Modeling, Analysis, and Optimization of Electric Power Systems. IEEE Trans. Power Syst. 2018, 33, 6510–6521. [Google Scholar] [CrossRef]
- Fobes, D.M.; Claeys, S.; Geth, F.; Coffrin, C. PowerModelsDistribution.jl: An open-source framework for exploring distribution power flow formulations. Electr. Power Syst. Res. 2020, 189, 106664. [Google Scholar] [CrossRef]
- Chen, B. A Practical Introduction to 9 Regression Algorithms. [Online]. Available: A Practical Introduction to 9 Regression Algorithms. https://towardsdatascience.com/a-practical-introduction-to-9-regression-algorithms-389057f86eb9 (accessed on 30 November 2022).
- Cerliani, M. Linear Tree: the perfect mix of Linear Model and Decision Tree. [Online]. Available: https://towardsdatascience.com/linear-tree-the-perfect-mix-of-linear-model-and-decision-tree-2eaed21936b7 (accessed on 30 November 2020).
- Python package Linear-tree. [Online]. Available: https://github.com/cerlymarco/linear-tree (accessed on 30 November 2022). (accessed on 30 November 2022).
- Sojer, M. Voltage Regulating Distribution Transformers as new Grid Asset. Procedia Eng. 2017, 202, 109–120. [Google Scholar] [CrossRef]
- Wenderoth, F.; Drayer, E.; Schmoll, R.; Niedermeier, M.; Braun, M. Architectural and functional classification of smart grid solutions. Energy Informatics 2019, 2, 1–13. [Google Scholar] [CrossRef]
- McKinney, W. Data structures for statistical computing in python. In Proceedings of the 9th Python in Science Conference, Austin, TX, USA, 28 June–3 July 2010; Volume 445, pp. 51–56. [Google Scholar]
- PyPower. [Online]. Available online: https://pypi.python.org/pypi/PYPOWER (accessed on 30 November 2022).
- Bezanson, J.; Edelman, A.; Karpinski, S.; Shah, V.B. Julia: A Fresh Approach to Numerical Computing. SIAM Rev. 2017, 59, 65–98. [Google Scholar] [CrossRef]
- Dunning, I.; Huchette, J.; Lubin, M.; Tong, S.; Subramanyam, A.; Rao, V.; Wang, J.; Magron, V.; Mixon, D.G.; Parshall, H.; et al. JuMP: A Modeling Language for Mathematical Optimization. SIAM Rev. 2017, 59, 295–320. [Google Scholar] [CrossRef]
- Bolgaryn, R.; et al. Recent Developments in Open Source Simulation Software pandapower and pandapipes. in 2022 Open Source Modelling and Simulation of Energy Systems, pp. 1–7.
- Wang, Z.; Liu, Z.; Kraiczy, M.; Bornhorst, N.; Berg, S.W.-V.; Braun, M. Fast parallel quasi-static time series simulator for active distribution grid operation with pandapower. in CIRED 2021 - The 26th International Conference and Exhibition on Electricity Distribution, pp. 1602–1606.
- Han, S.; Qiao, Y.-H.; Yan, J.; Liu, Y.-Q.; Li, L.; Wang, Z. Mid-to-long term wind and photovoltaic power generation prediction based on copula function and long short term memory network. Appl. Energy 2019, 239, 181–191. [Google Scholar] [CrossRef]
- Shohan, M.J.A.; Faruque, M.O.; Foo, S.Y. Forecasting of Electric Load Using a Hybrid LSTM-Neural Prophet Model. Energies 2022, 15, 2158. [Google Scholar] [CrossRef]
- Renewables.ninja. [Online]. Available online: https://www.renewables.ninja/ (accessed on 30 November 2022).
- e. a. Marggraf, “U-Control - Analysis of Distributed and Automated Voltage Control in current and future Distribution Grids,” in ETG-Fb. 155: International ETG Congress 2017: Die Energiewende - Blueprints for the new energy age Proceedings - 29, 2017, World Conference Center, Bonn, 2017. 28 November.
- Meinecke, S.; et al. SimBench—A Benchmark Dataset of Electric Power Systems to Compare Innovative Solutions Based on Power Flow Analysis. Energies 2020, 13, 3290. [Google Scholar] [CrossRef]
Figure 1.
Exemplary characteristic curves for DER providing reactive power (a, b) and Q(P) operational area according to VDE-AR-N 4110 (c).
Figure 1.
Exemplary characteristic curves for DER providing reactive power (a, b) and Q(P) operational area according to VDE-AR-N 4110 (c).
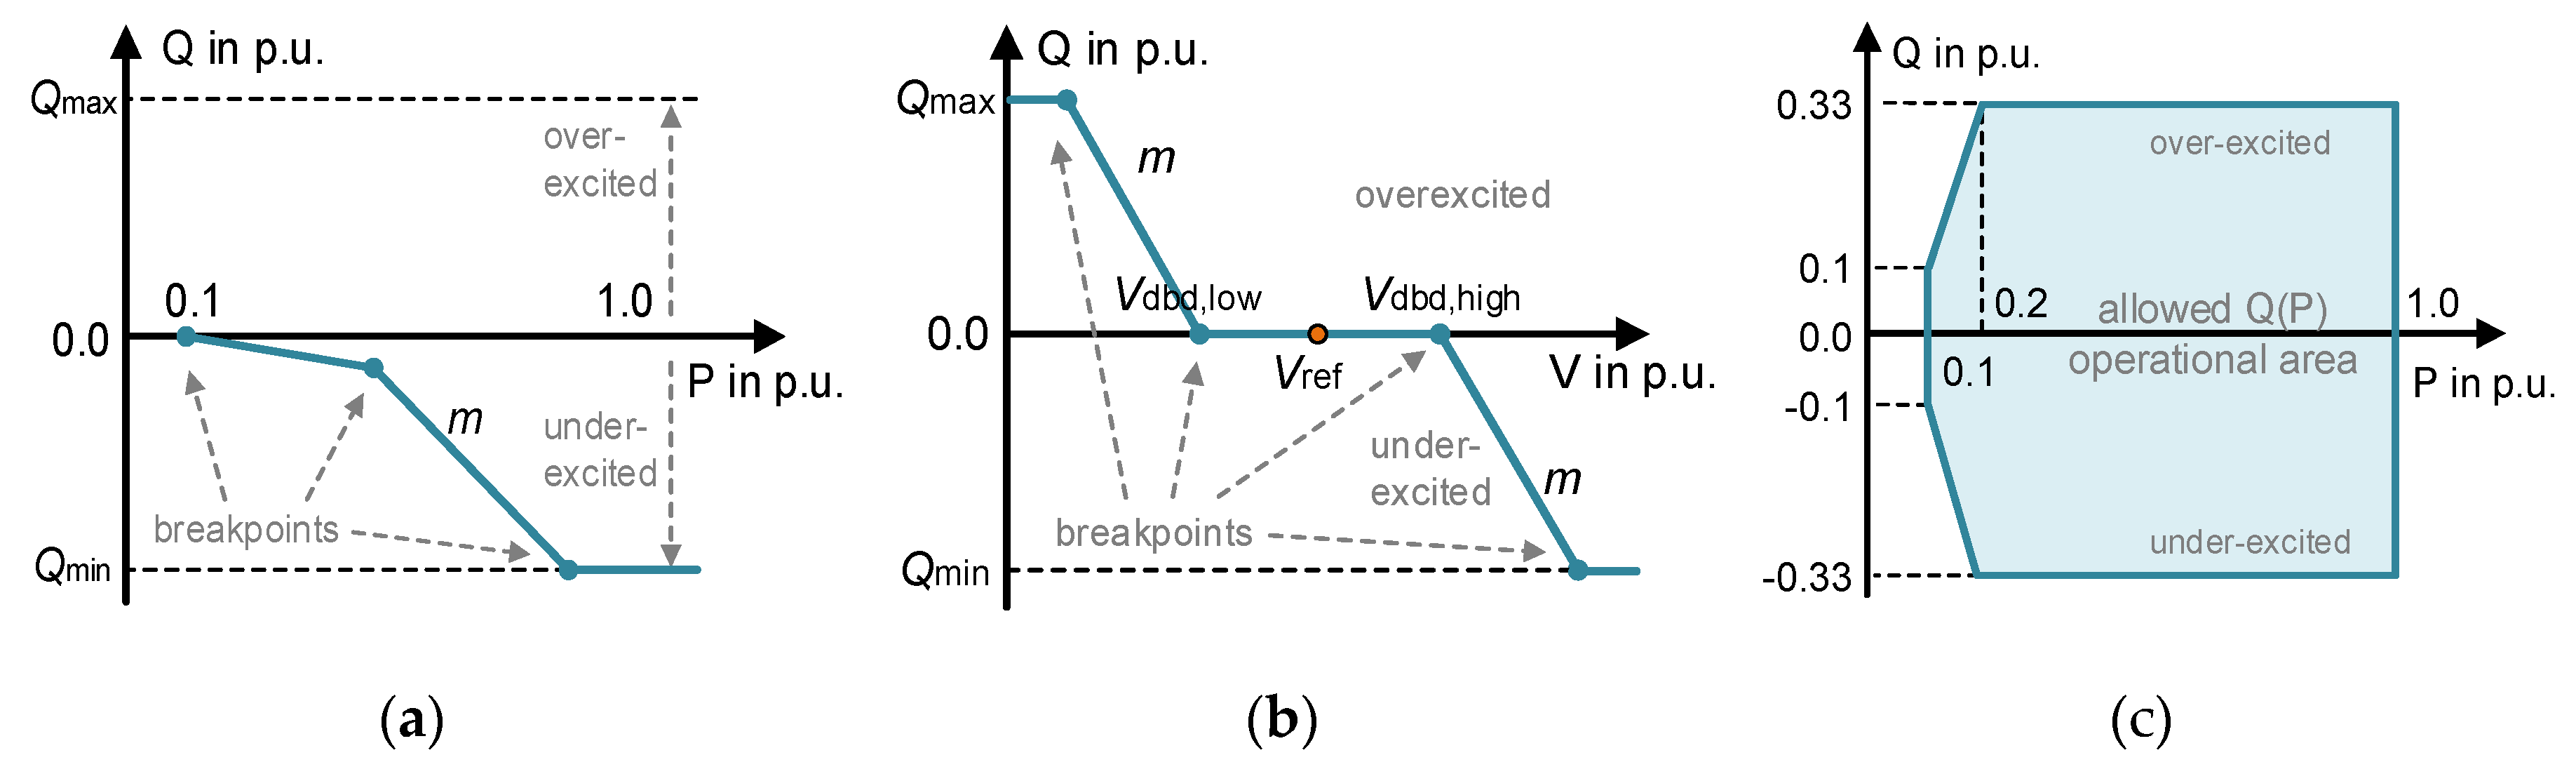
Figure 2.
Overview of the proposed method for characteristic curve calculation for local reactive power control.
Figure 2.
Overview of the proposed method for characteristic curve calculation for local reactive power control.
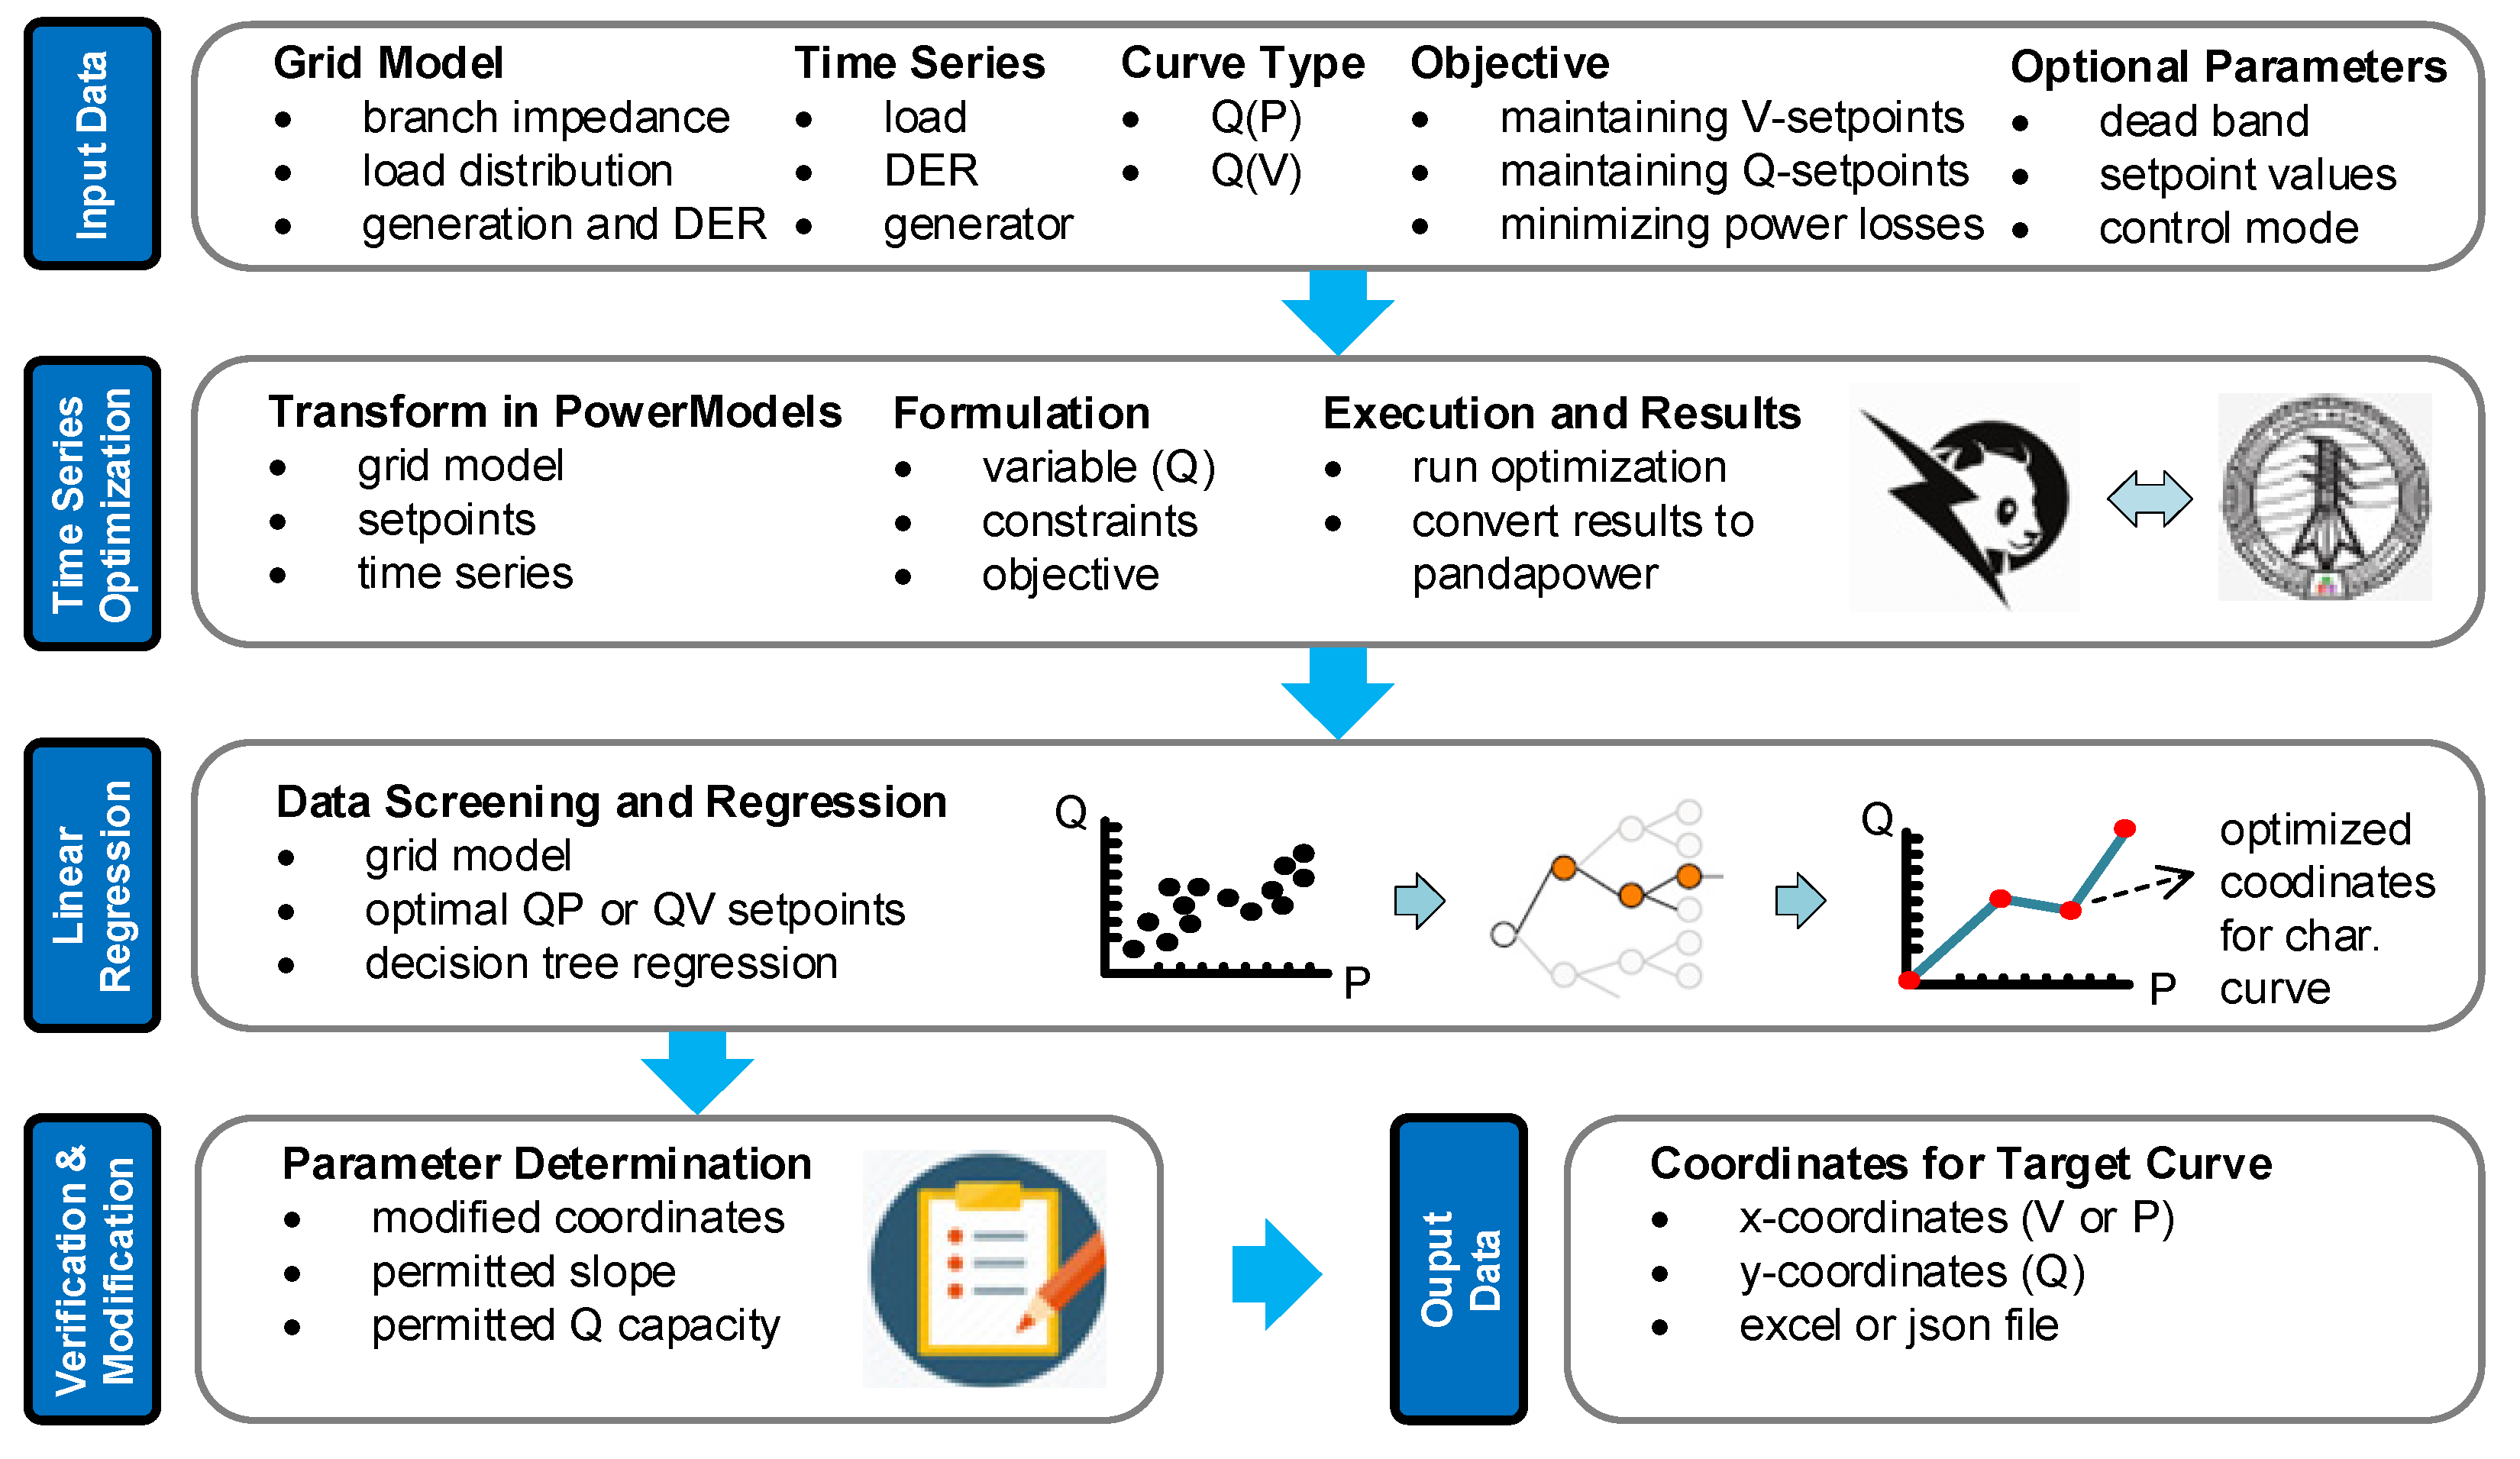
Figure 3.
Example for finding optimized Q(V)-relationship with linear tree model. Left: optimized Q(V)-relationship based on resulting operating points; Right: architecture of the trained linear tree model.
Figure 3.
Example for finding optimized Q(V)-relationship with linear tree model. Left: optimized Q(V)-relationship based on resulting operating points; Right: architecture of the trained linear tree model.
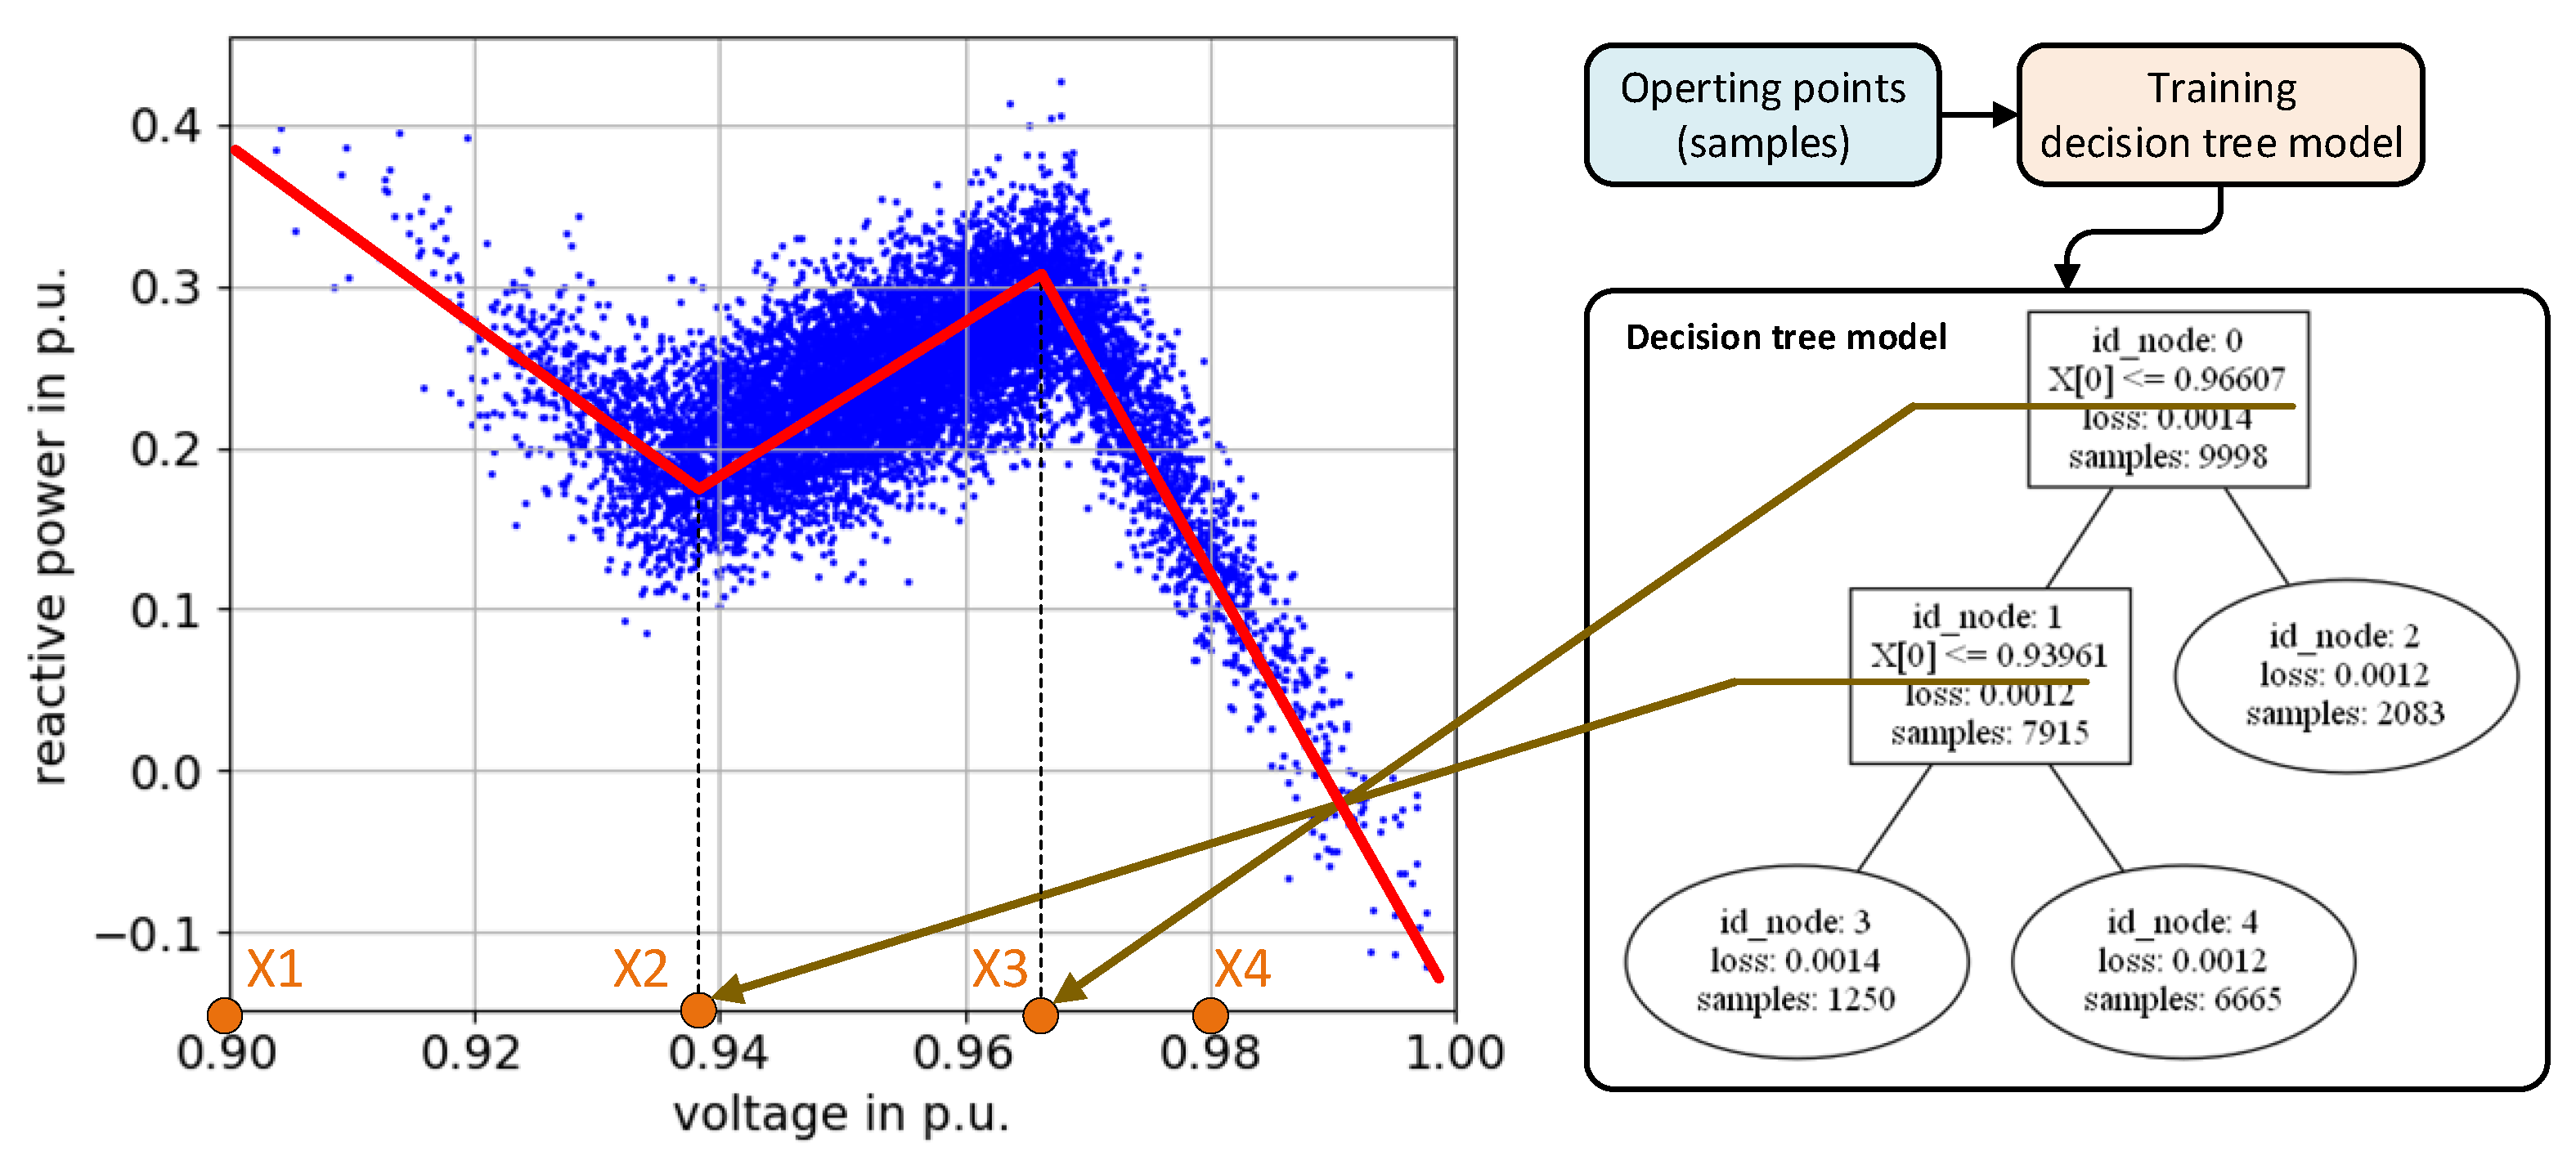
Figure 4.
Schema for symmetric estimation of Q(V)-characteristic curve.
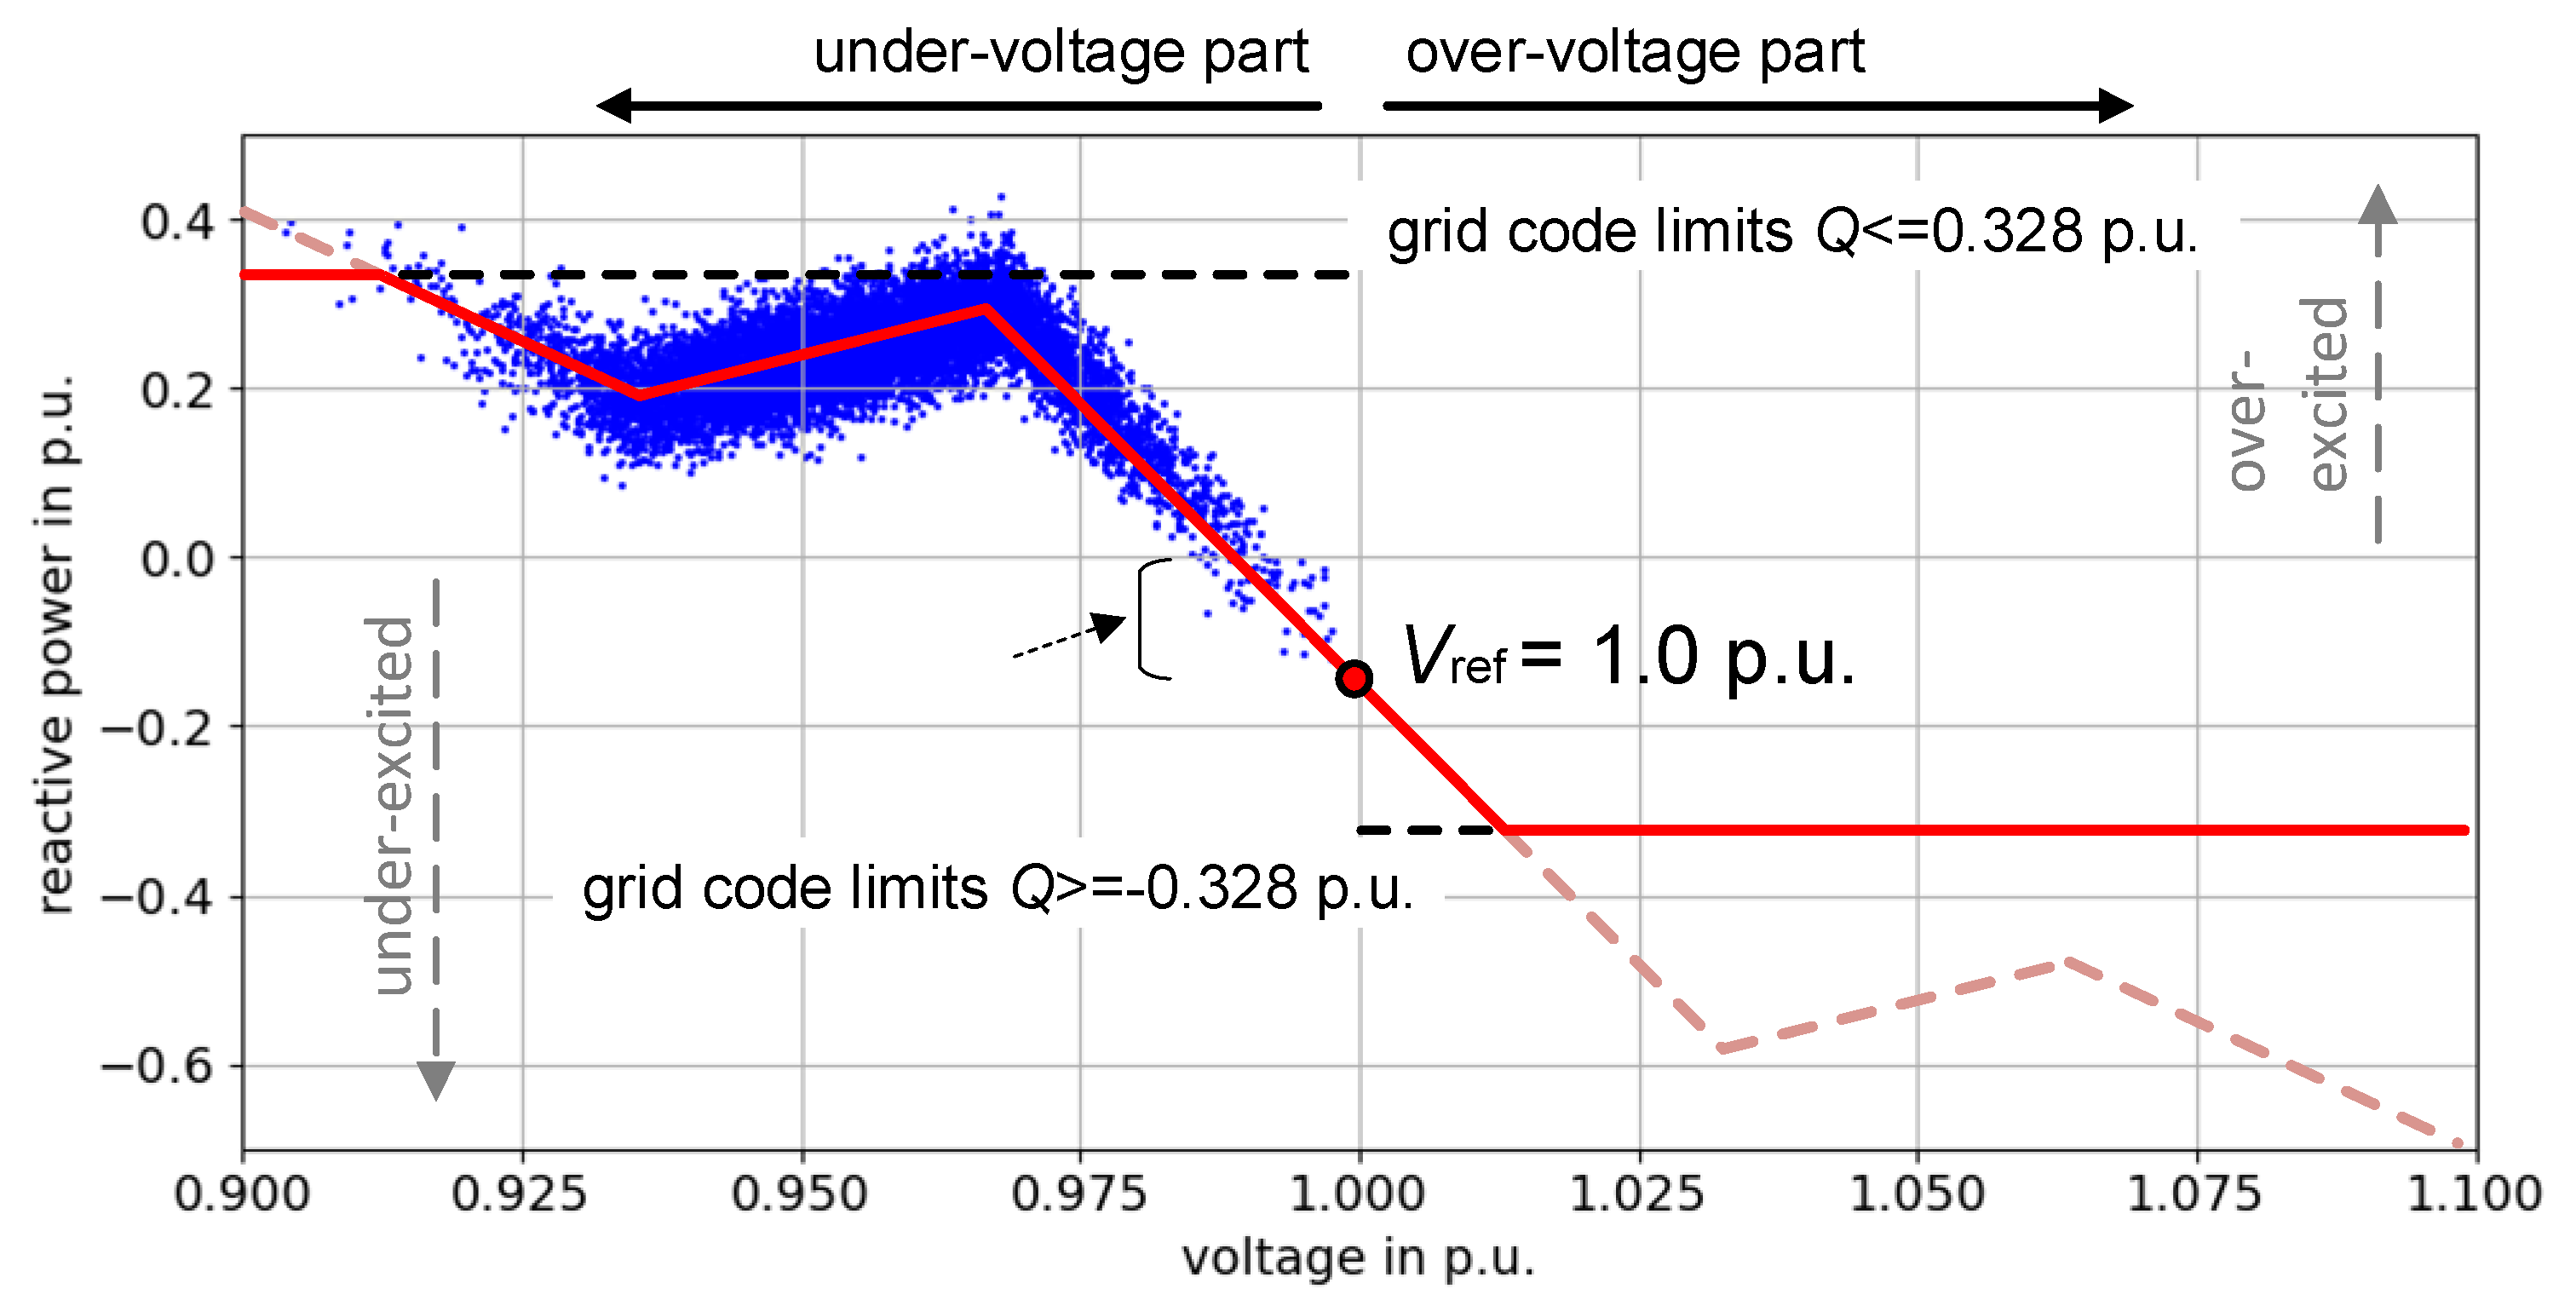
Figure 5.
Voltage band in accordance with EN 50160 without controllable transformers, adapted from [33].
Figure 5.
Voltage band in accordance with EN 50160 without controllable transformers, adapted from [33].

Figure 6.
Modifications considering dead band setting and saving reactive power provision.
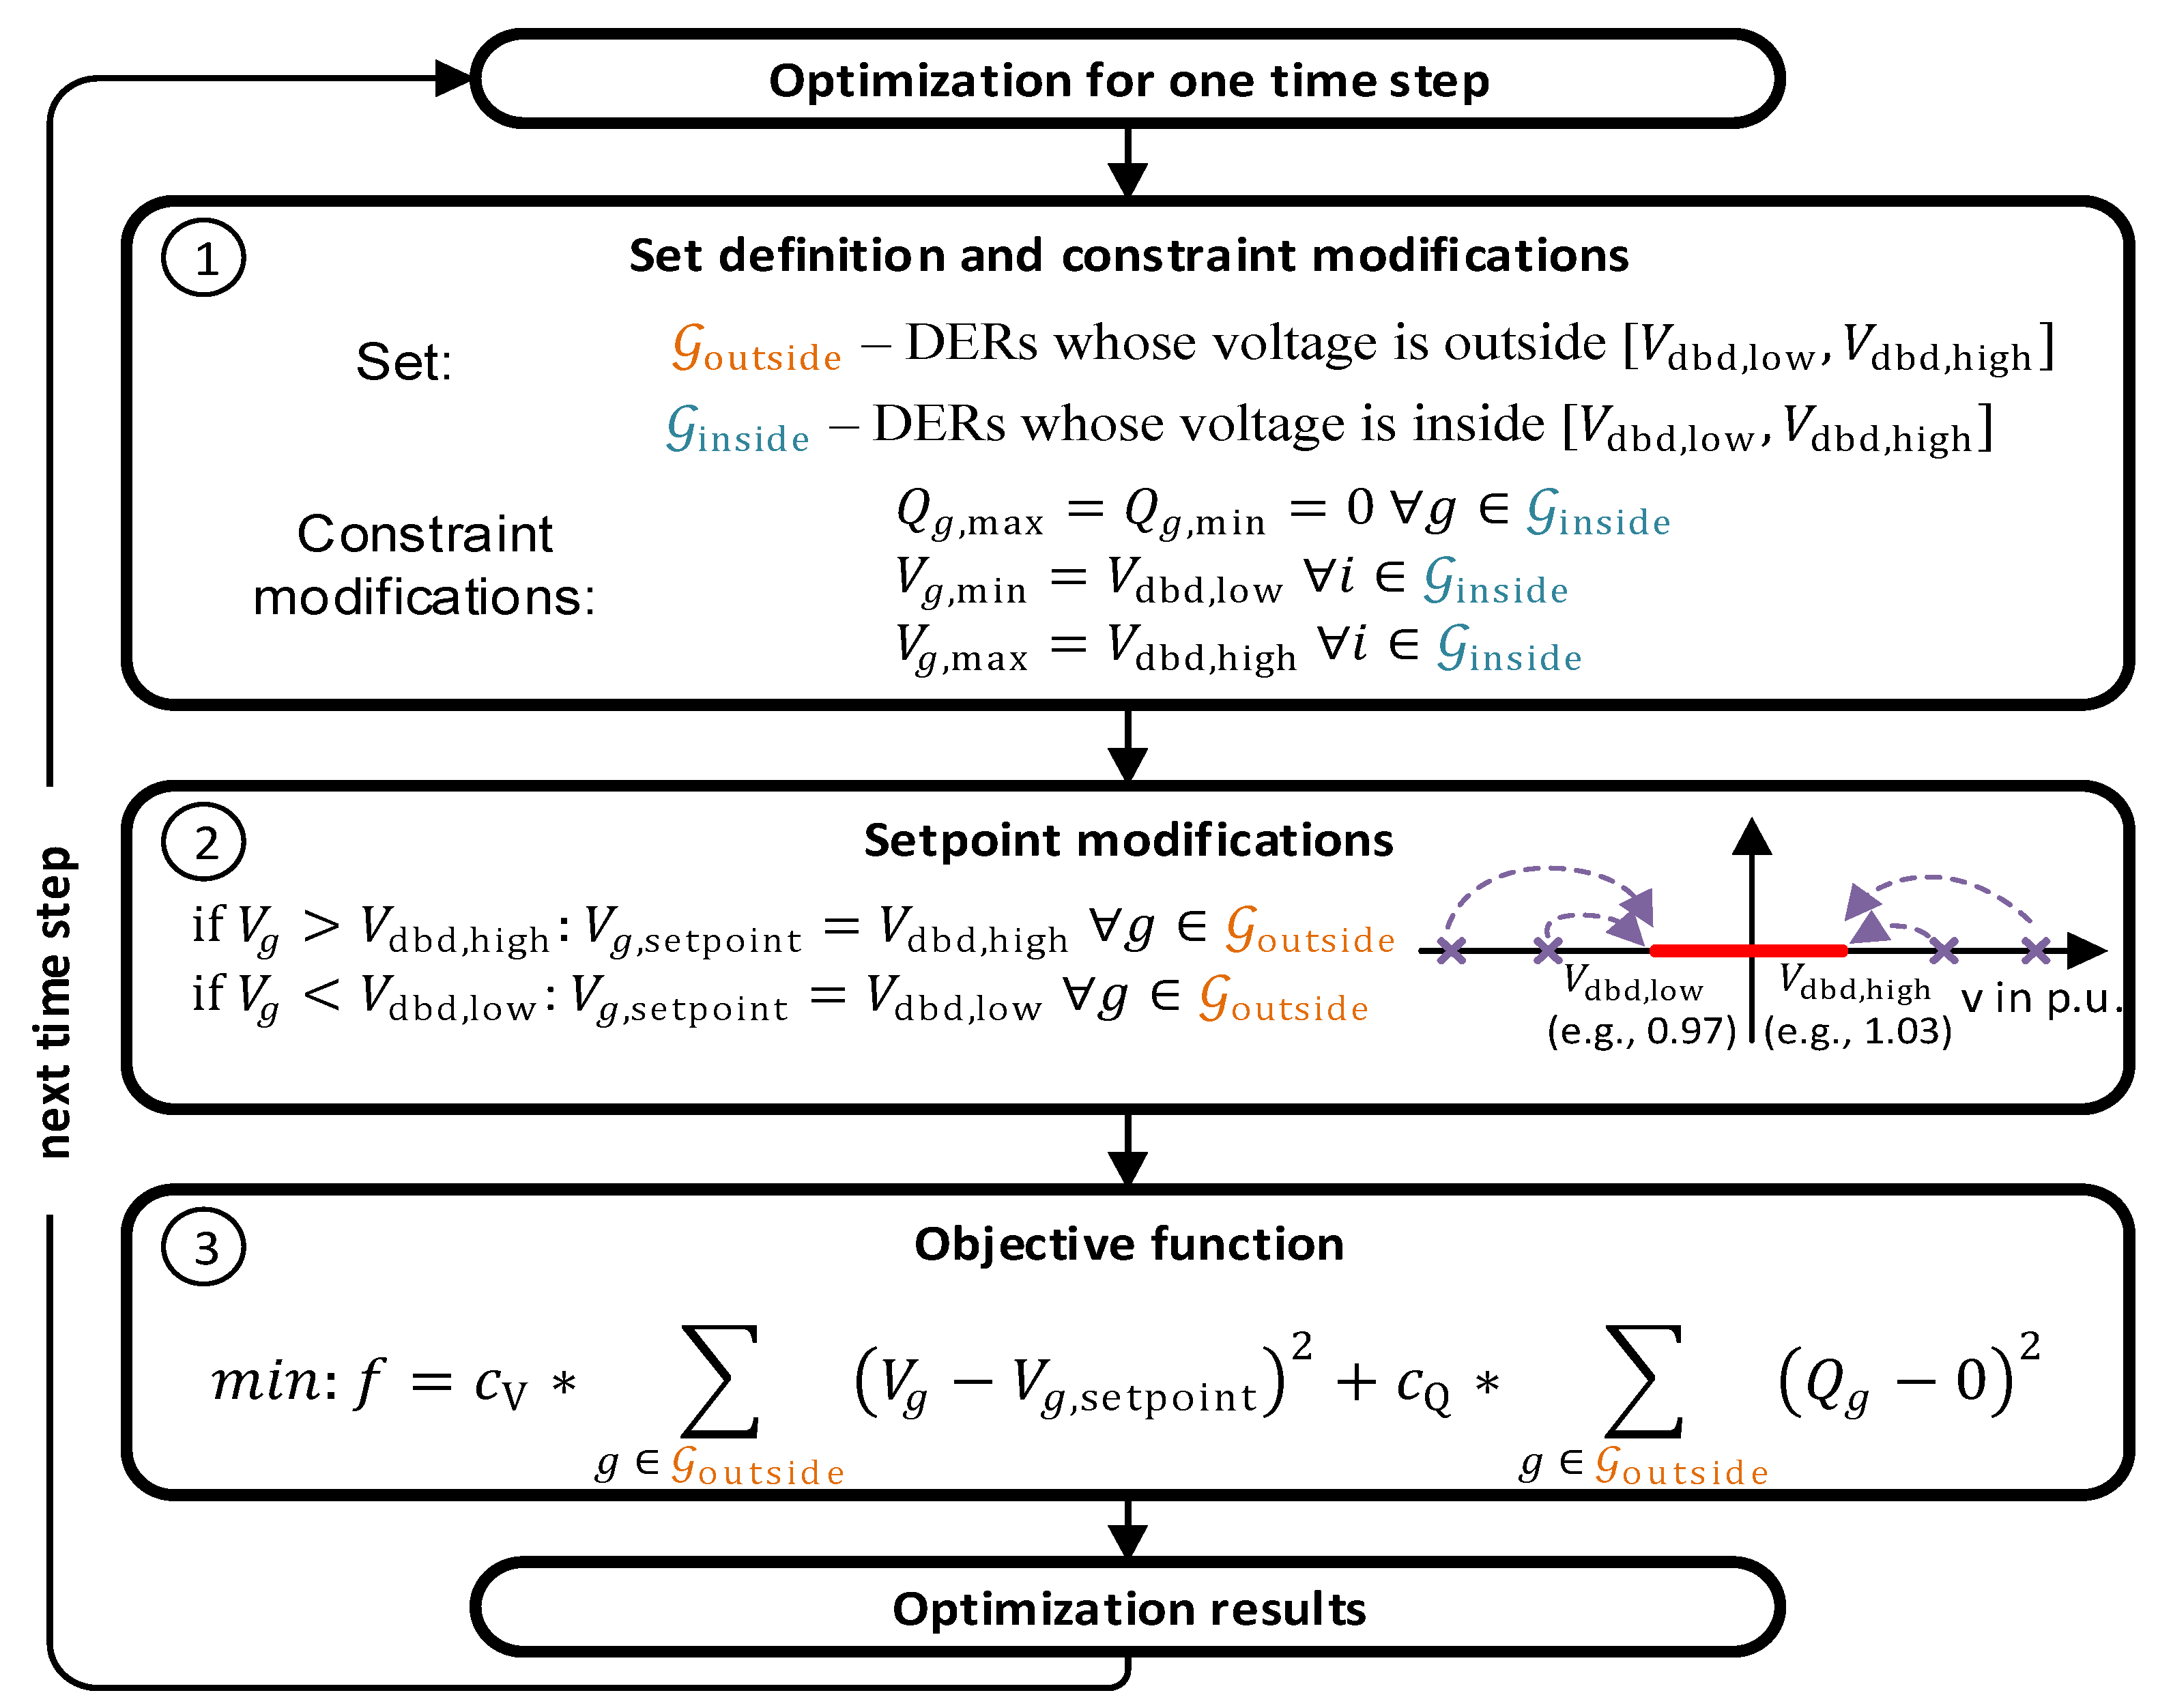
Figure 7.
General schema of PandaModels.
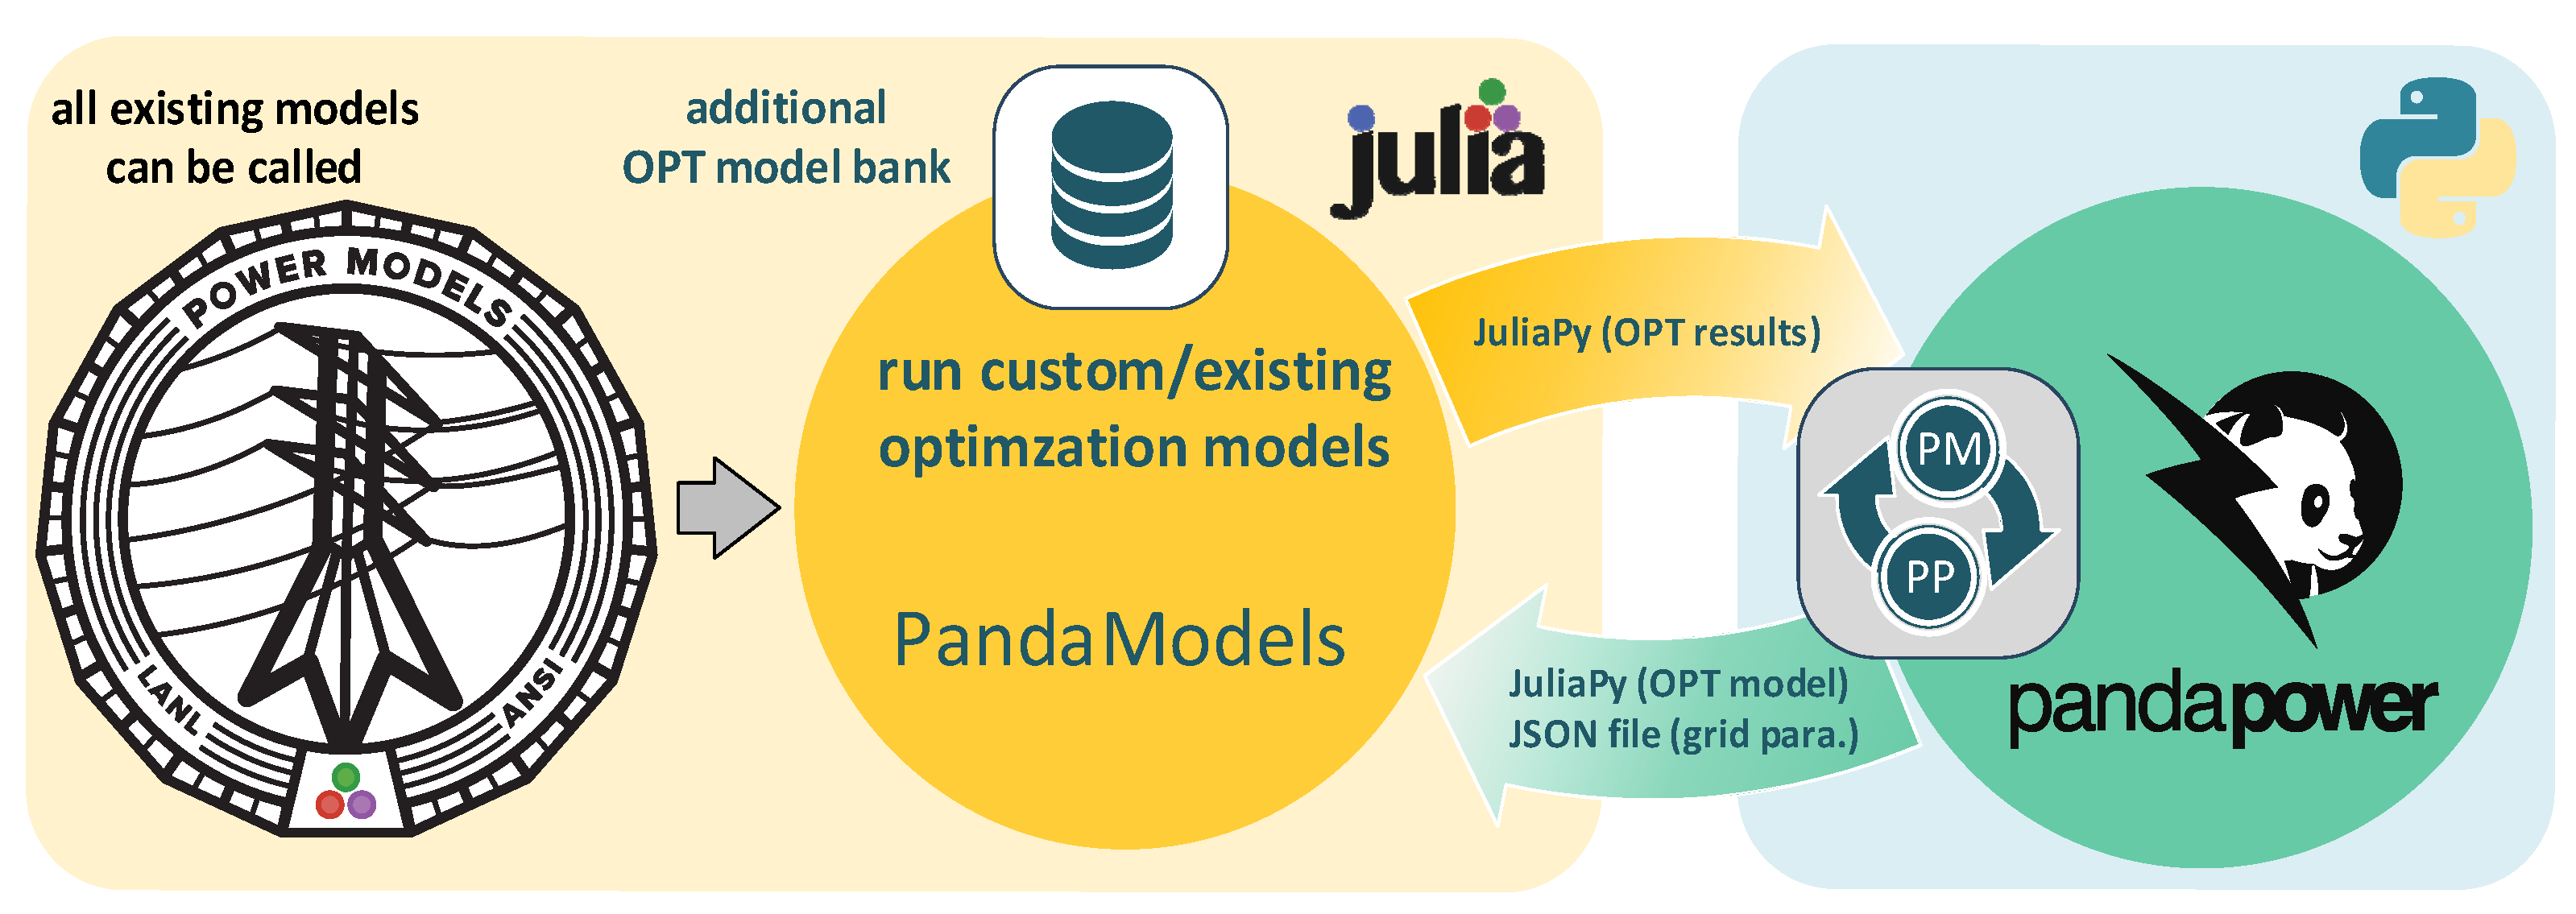
Figure 8.
Modification of multi-grid optimization in a time-sequential manner for time-series optimization.
Figure 8.
Modification of multi-grid optimization in a time-sequential manner for time-series optimization.
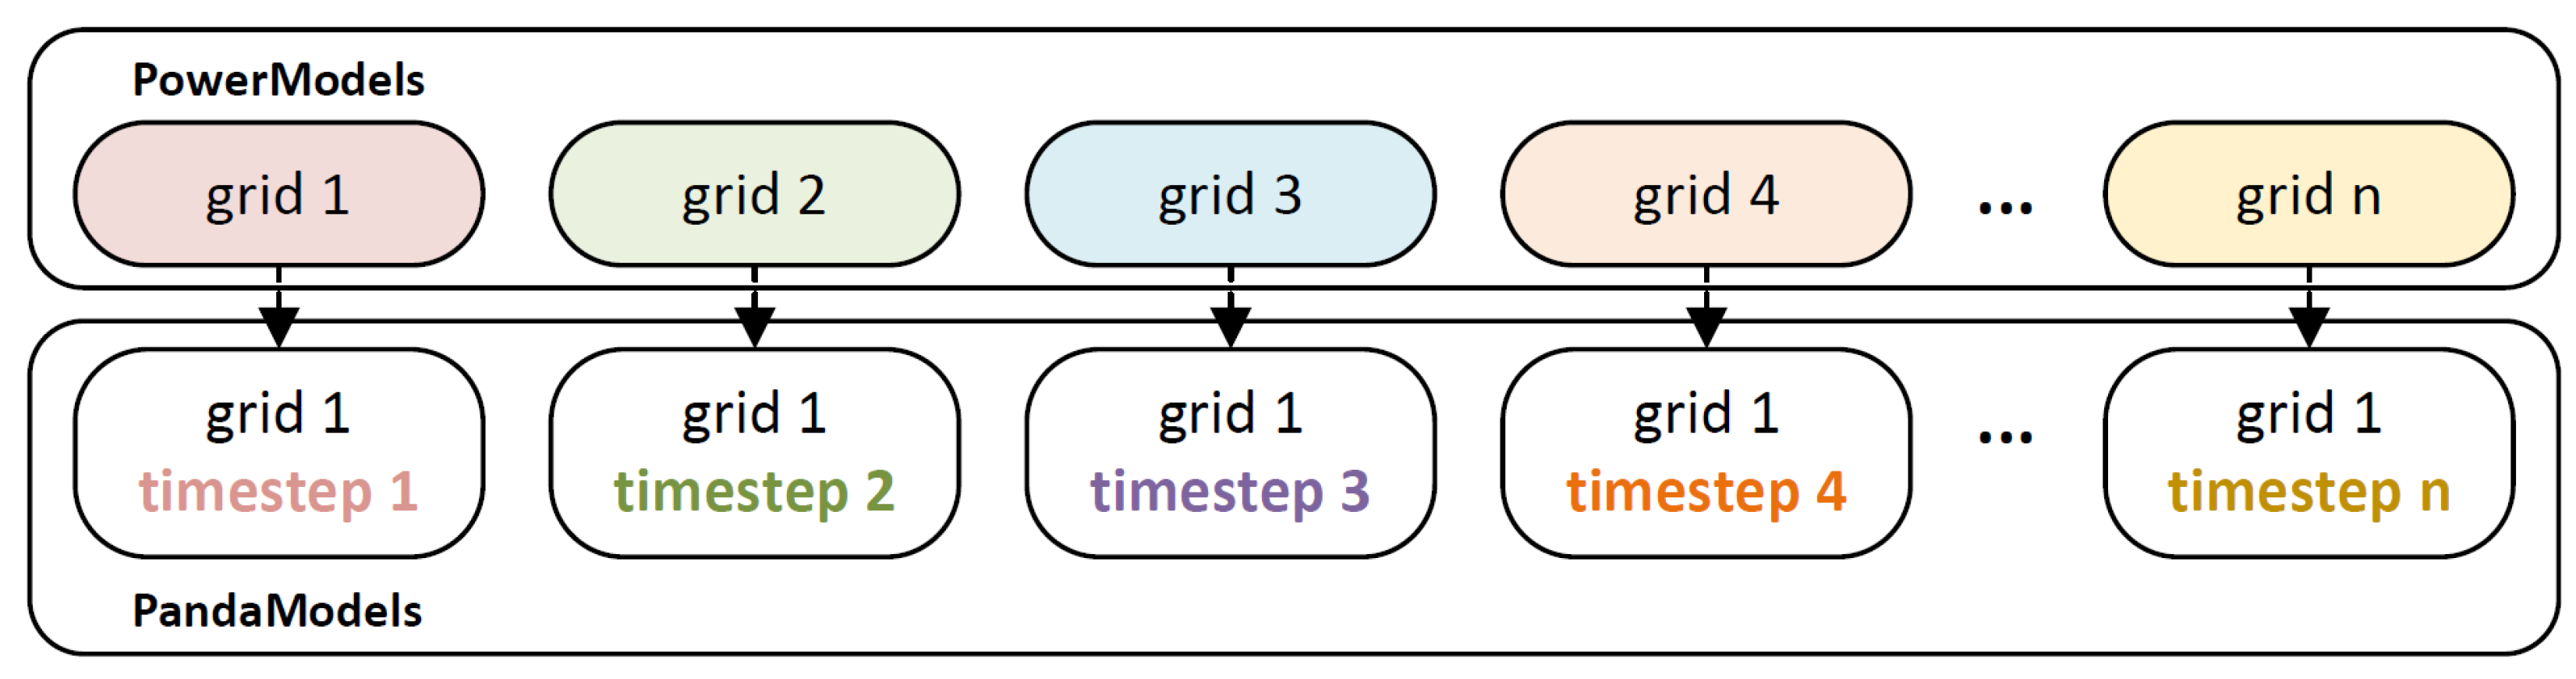
Figure 9.
Flowchart for case studies.
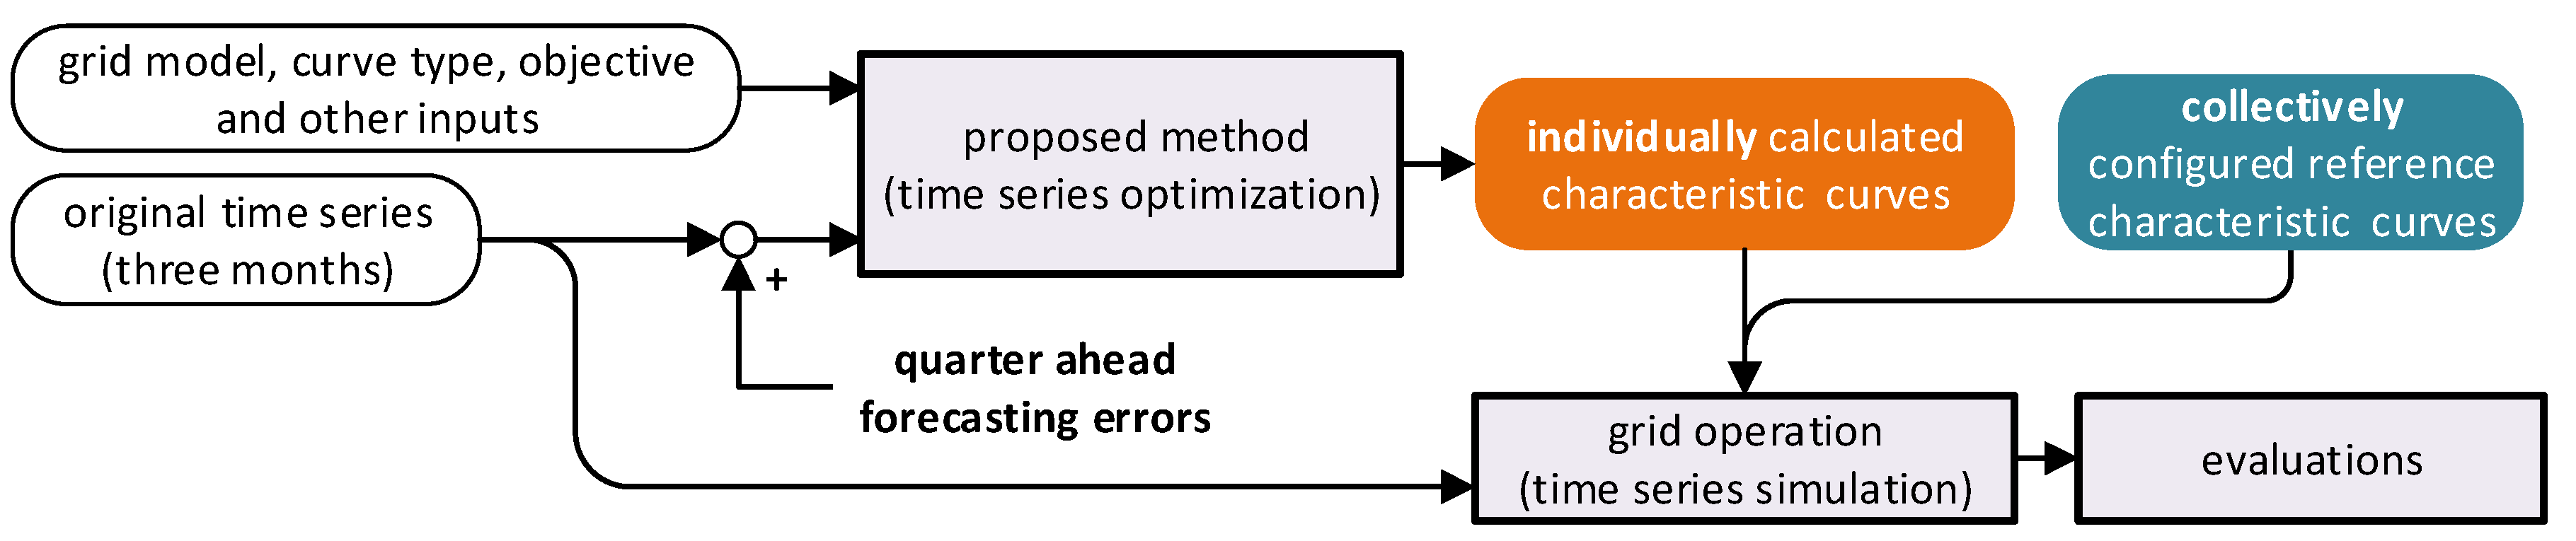
Figure 10.
a) Schematic geographic visualization of the test grid; (b) reference characteristic curves used for evaluation.
Figure 10.
a) Schematic geographic visualization of the test grid; (b) reference characteristic curves used for evaluation.
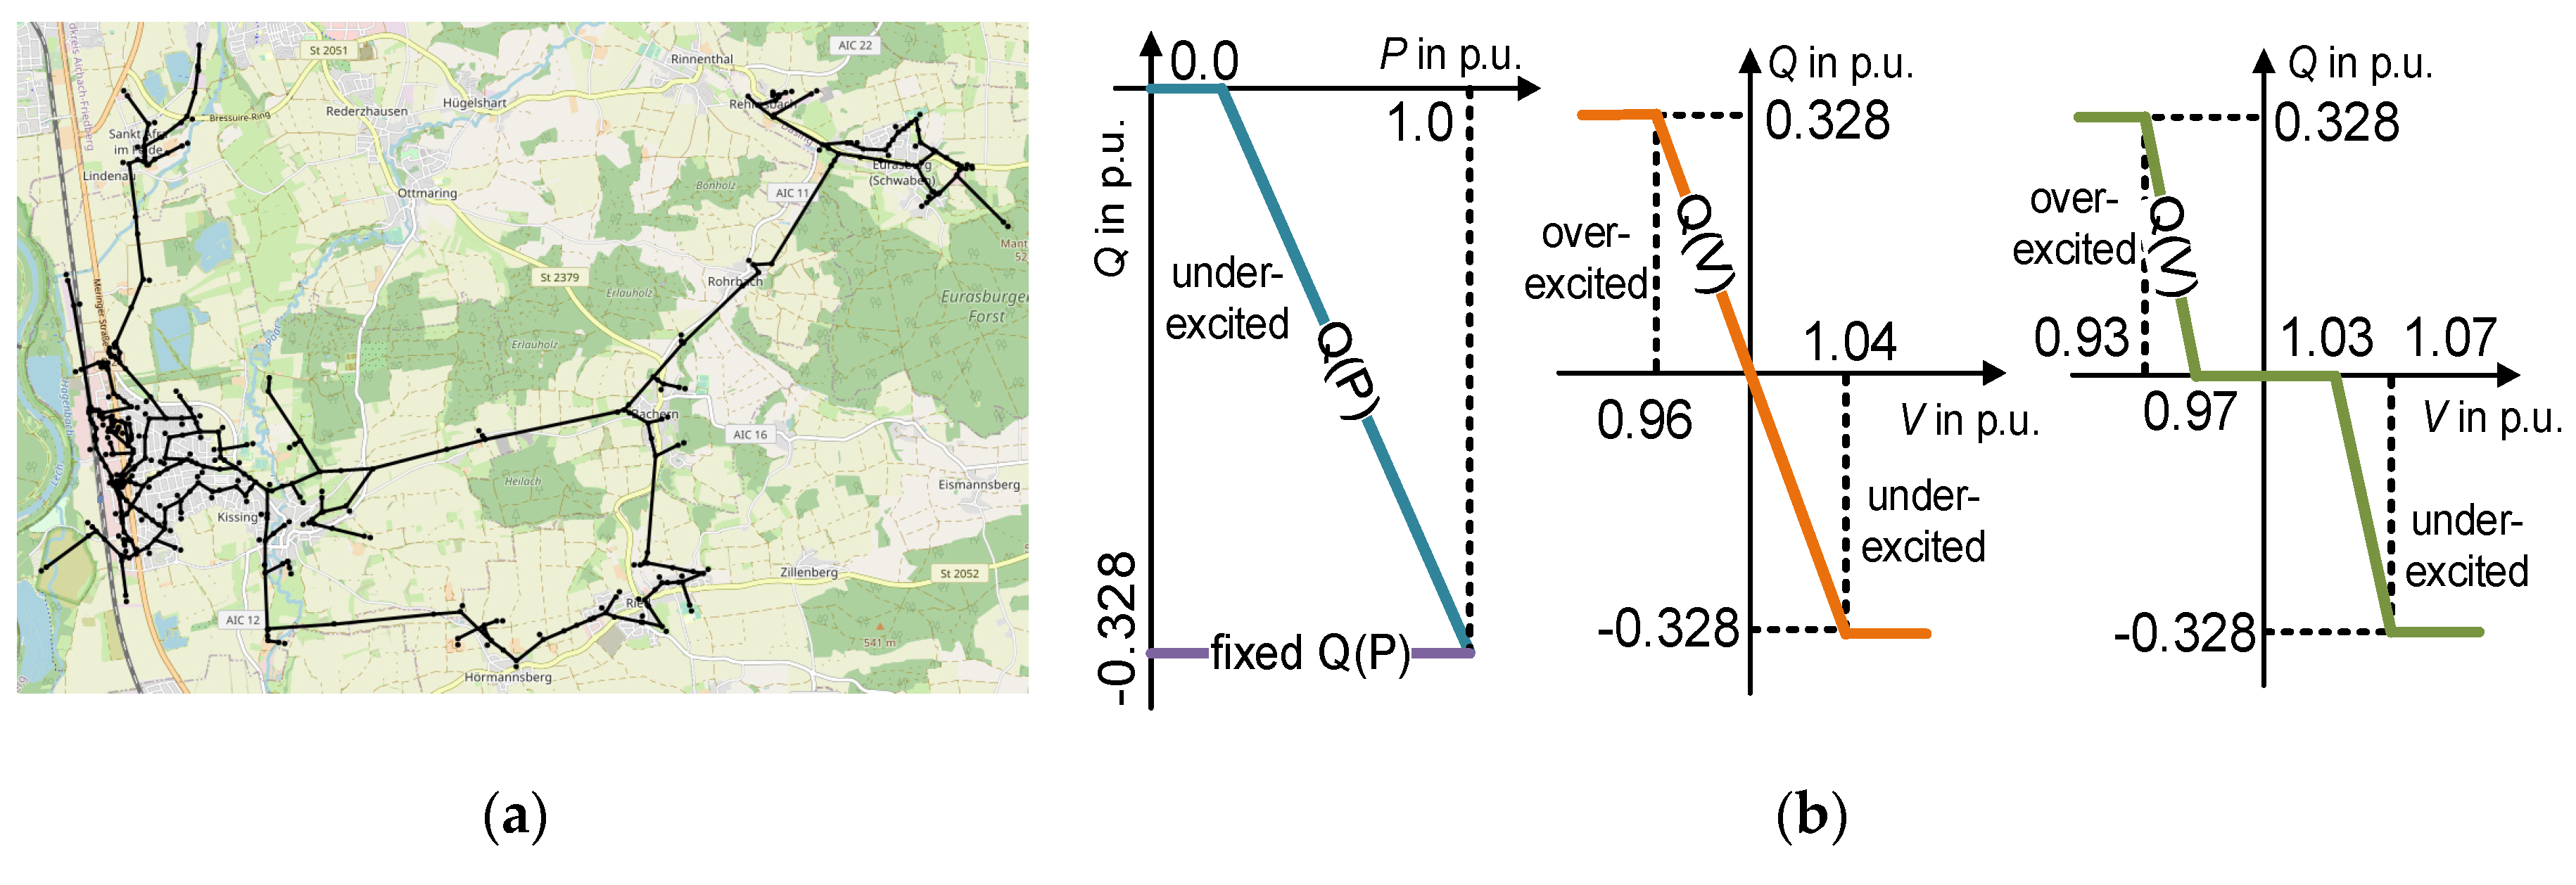
Figure 11.
Calculated Q(P)-characteristic (left) and Q(V)-characteristic (right) curves of two exemplary DERs for supporting voltage stability.
Figure 11.
Calculated Q(P)-characteristic (left) and Q(V)-characteristic (right) curves of two exemplary DERs for supporting voltage stability.
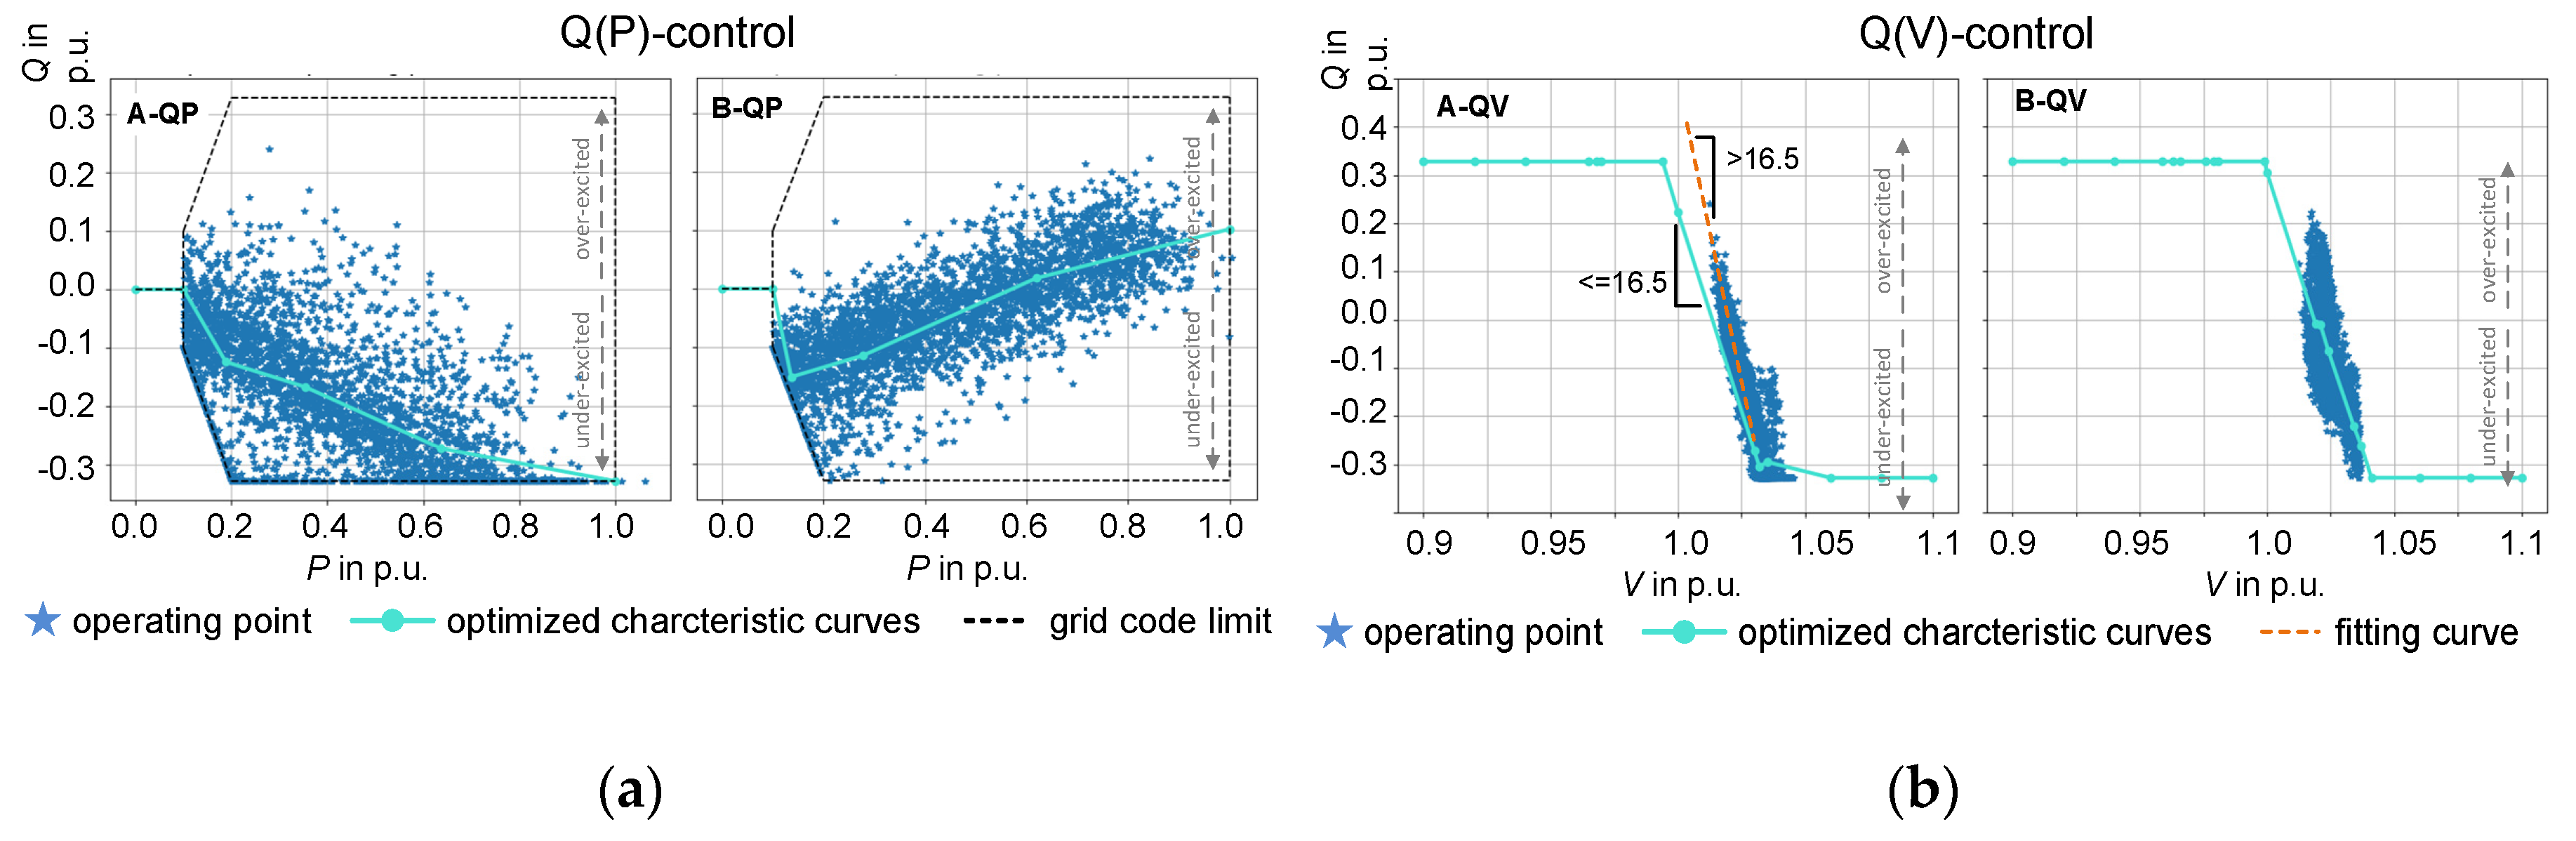
Figure 12.
Comparison of bus voltages (left) and reactive power provision (right) for the simulative quarter with different characteristic curves.
Figure 12.
Comparison of bus voltages (left) and reactive power provision (right) for the simulative quarter with different characteristic curves.
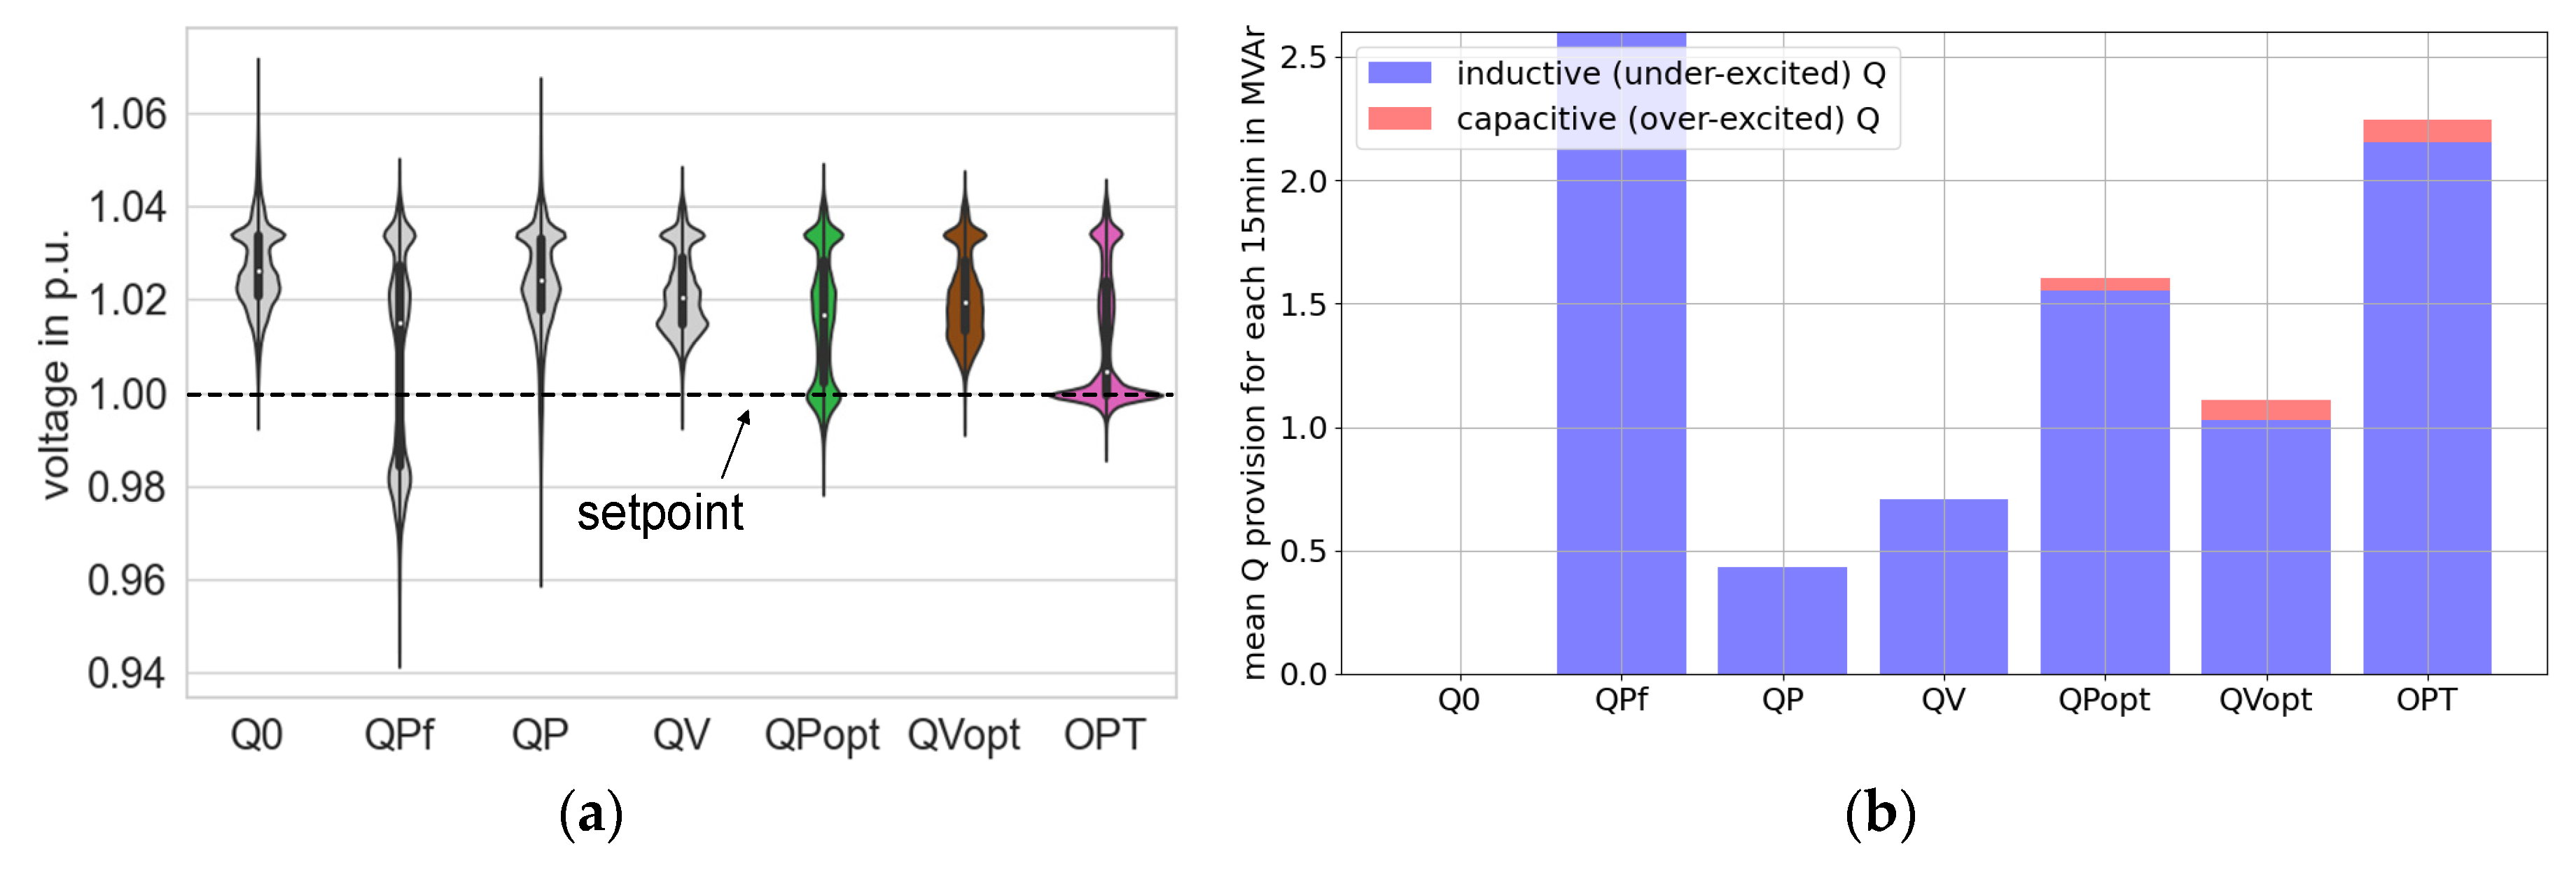
Figure 14.
Calculated Q(V)-characteristic curves with and the dead band for exemplary DERs.
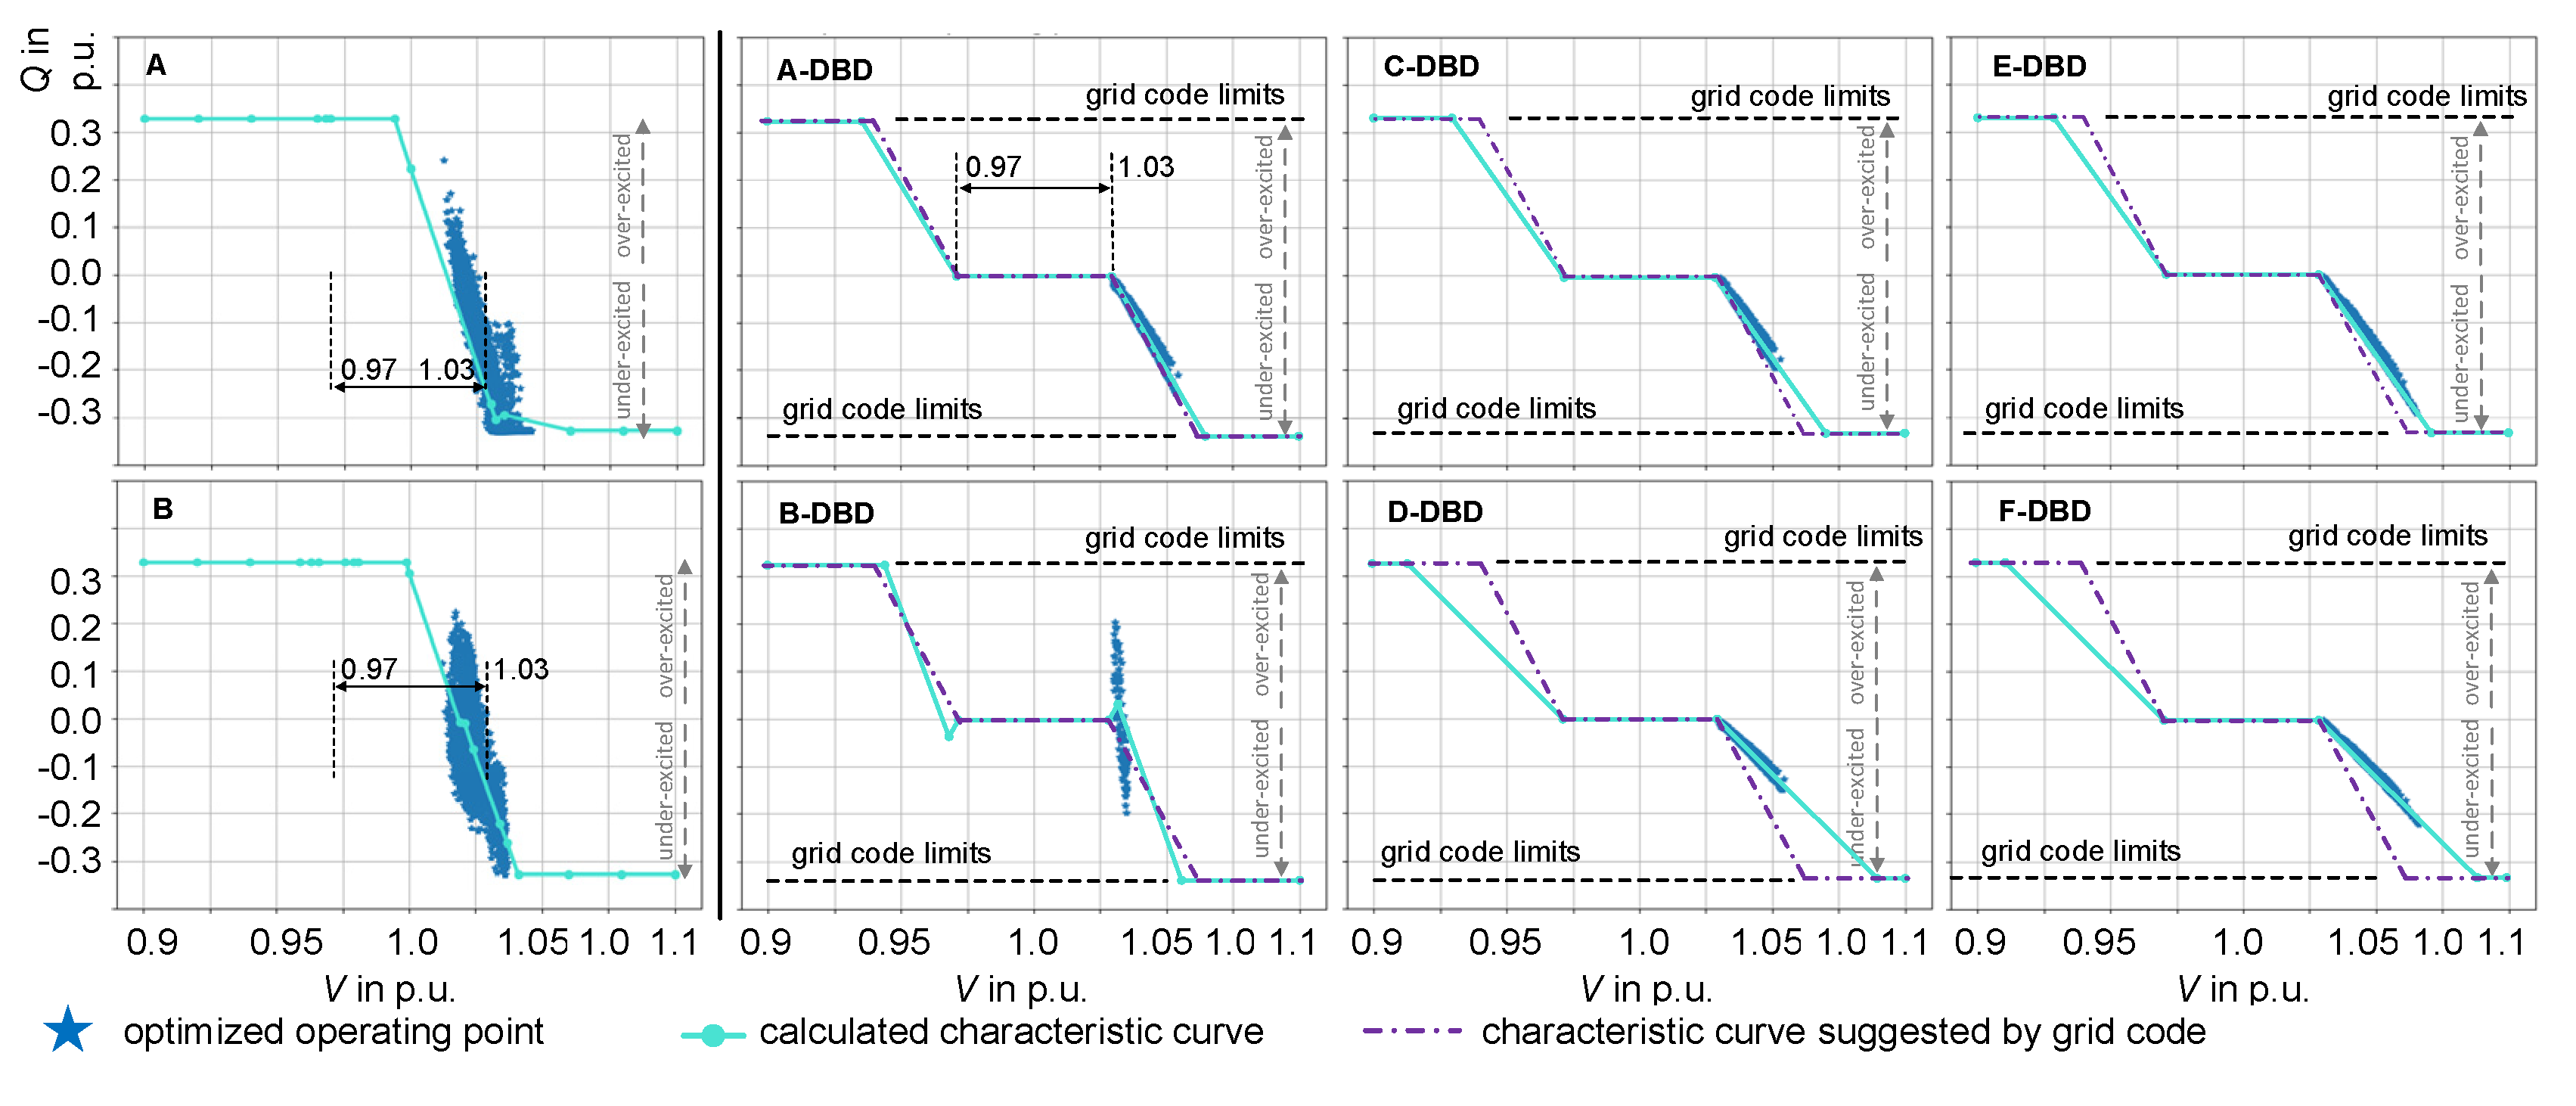
Figure 15.
Simulation result comparison for characteristic curve with and without dead band: (a) Bus voltage distribution; (b) Mean reactive power provision.
Figure 15.
Simulation result comparison for characteristic curve with and without dead band: (a) Bus voltage distribution; (b) Mean reactive power provision.
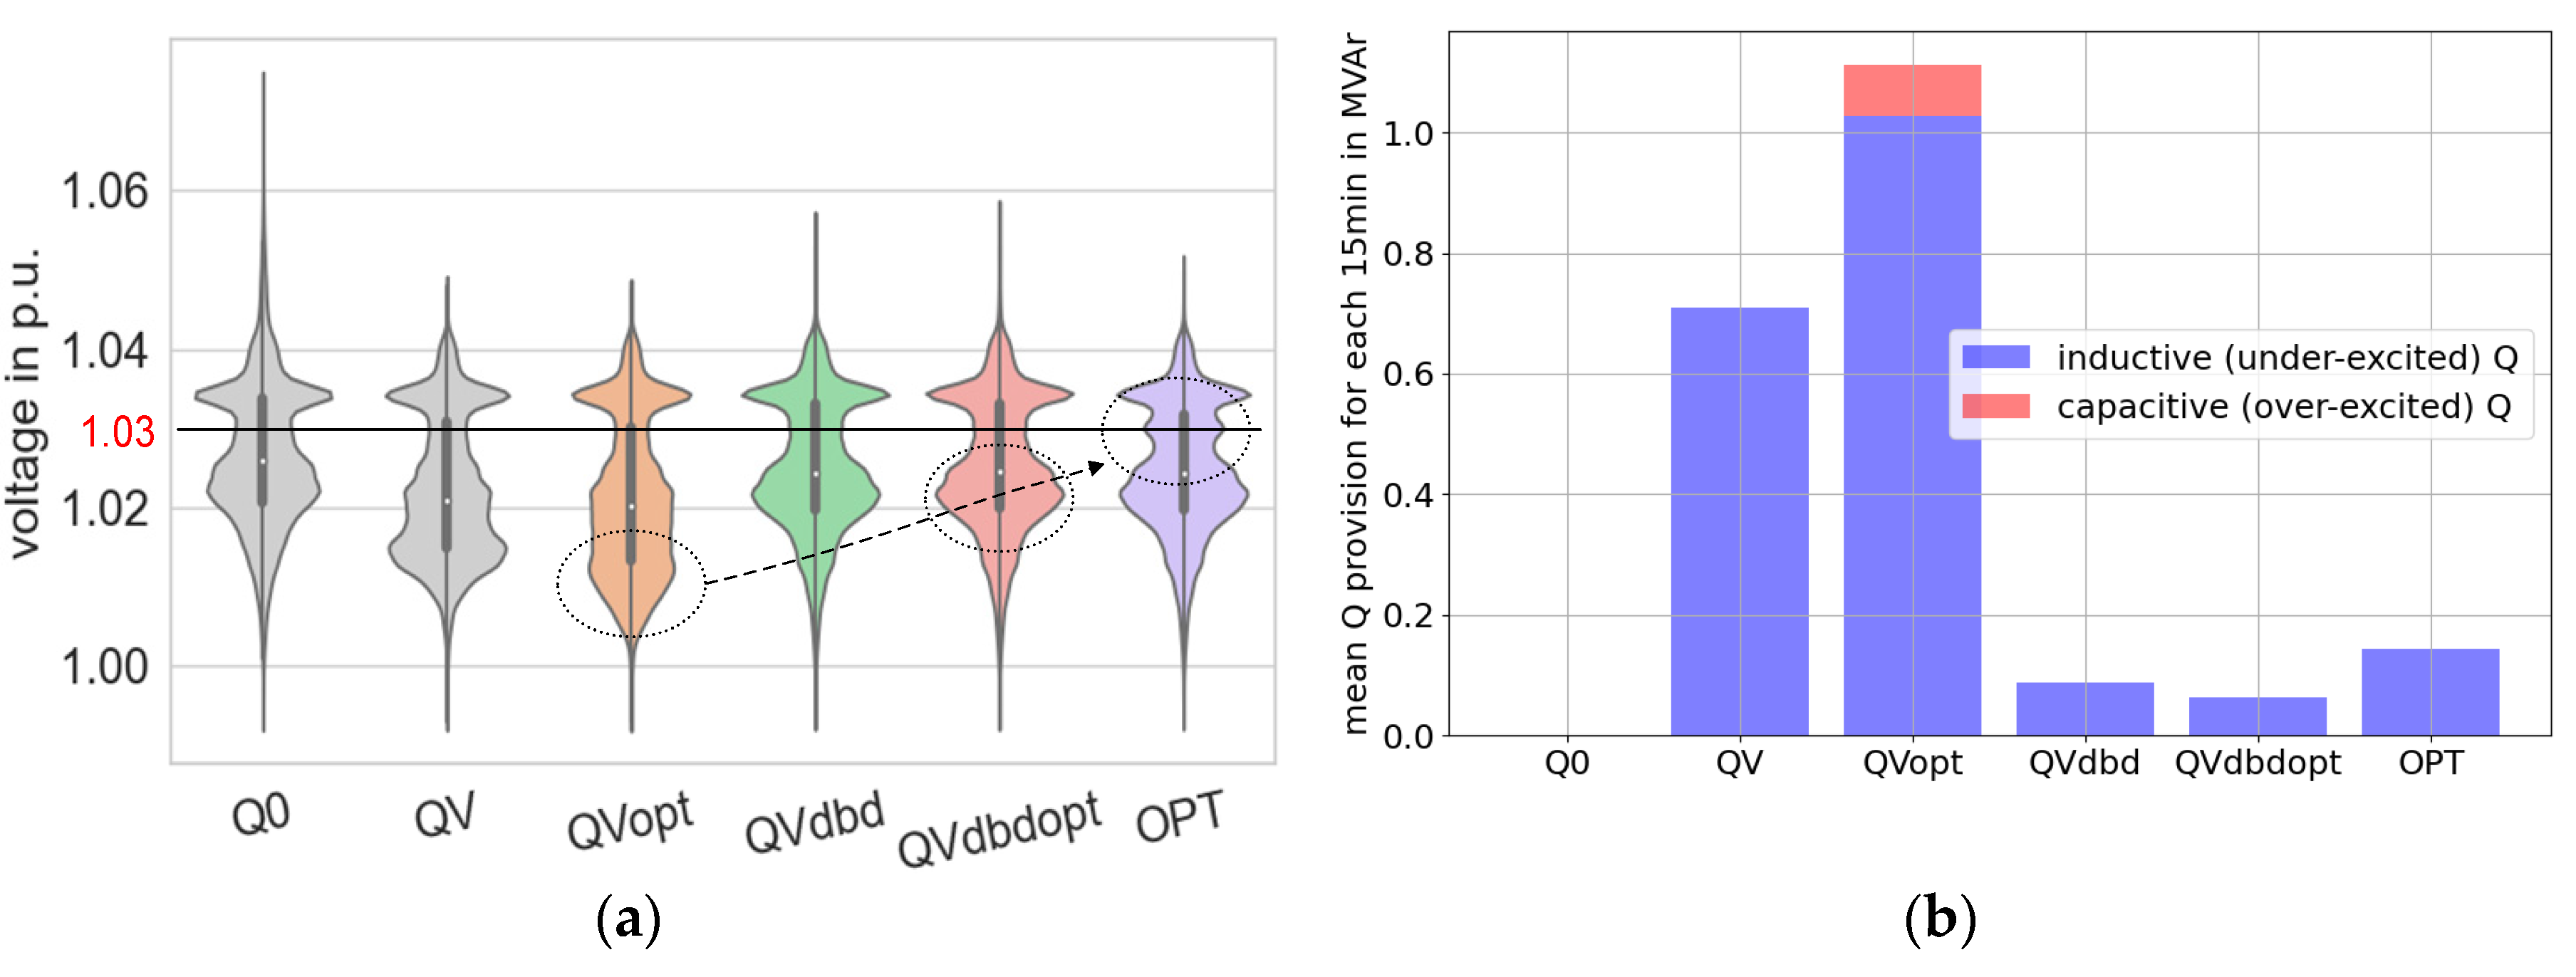
Figure 16.
Schematic geographic visualization of a cross-voltage level test grid.
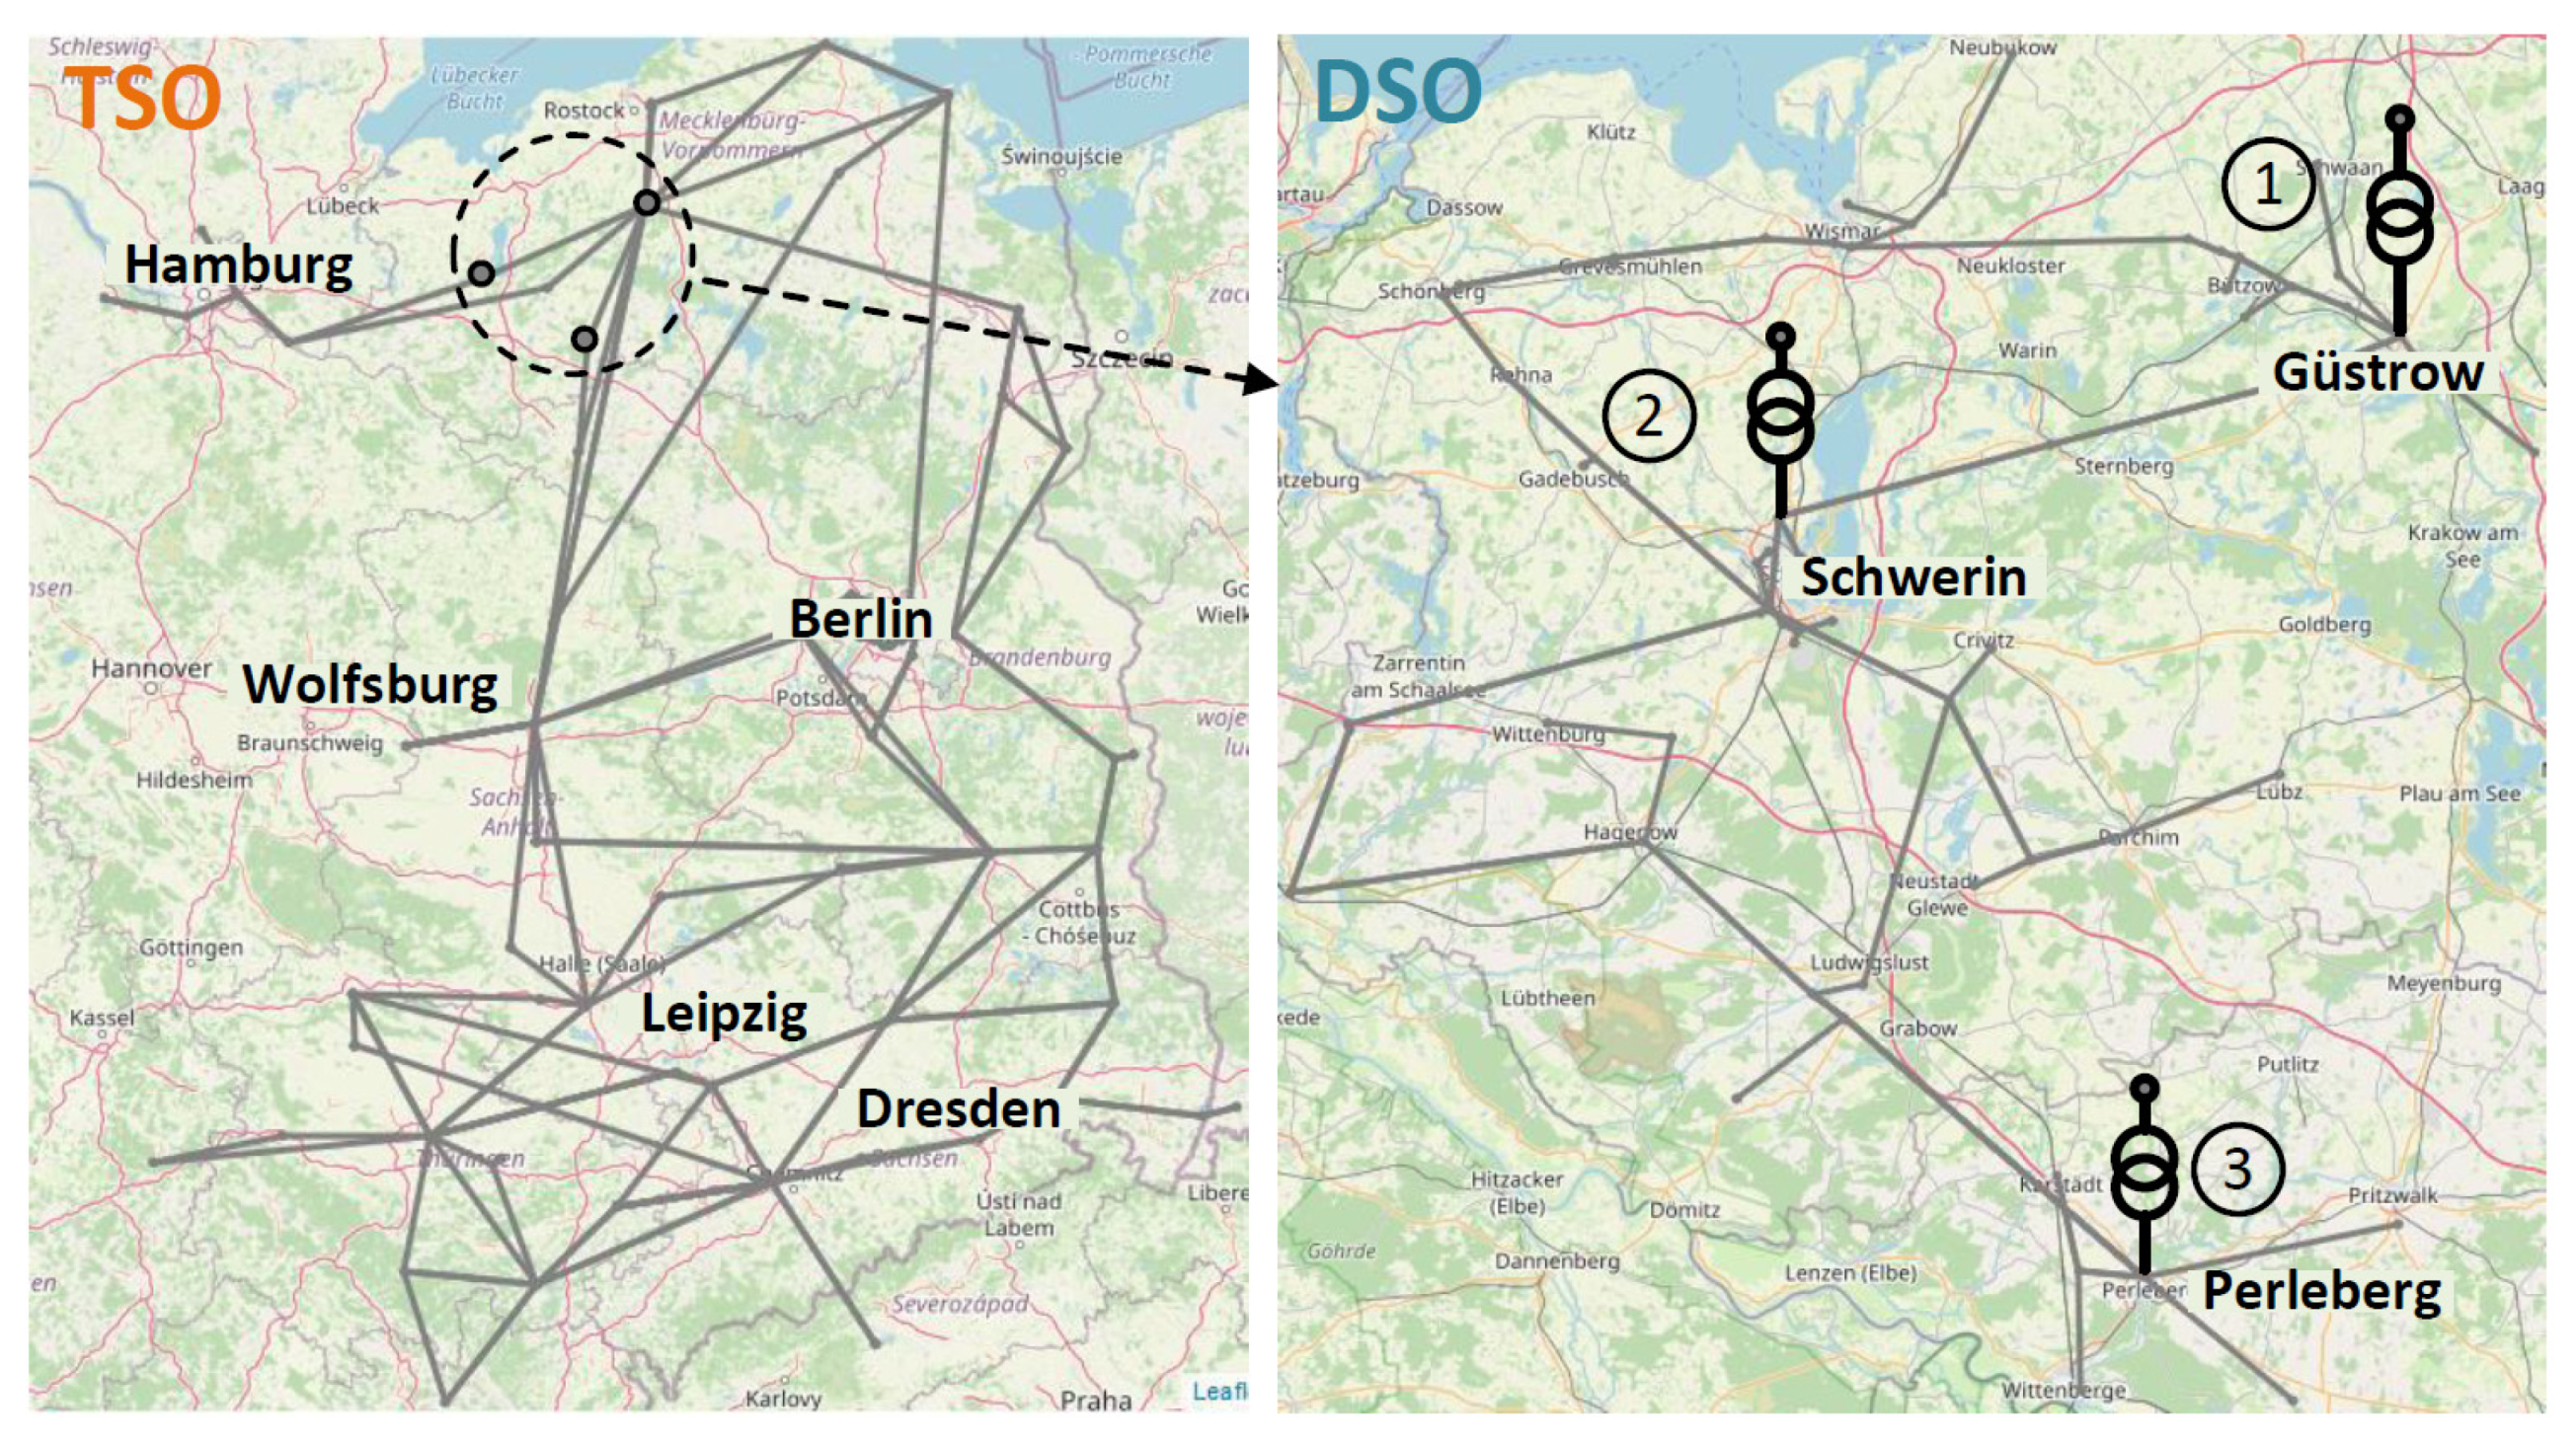
Figure 17.
Q-exchange at the interface with central reactive optimization for an exemplary day.
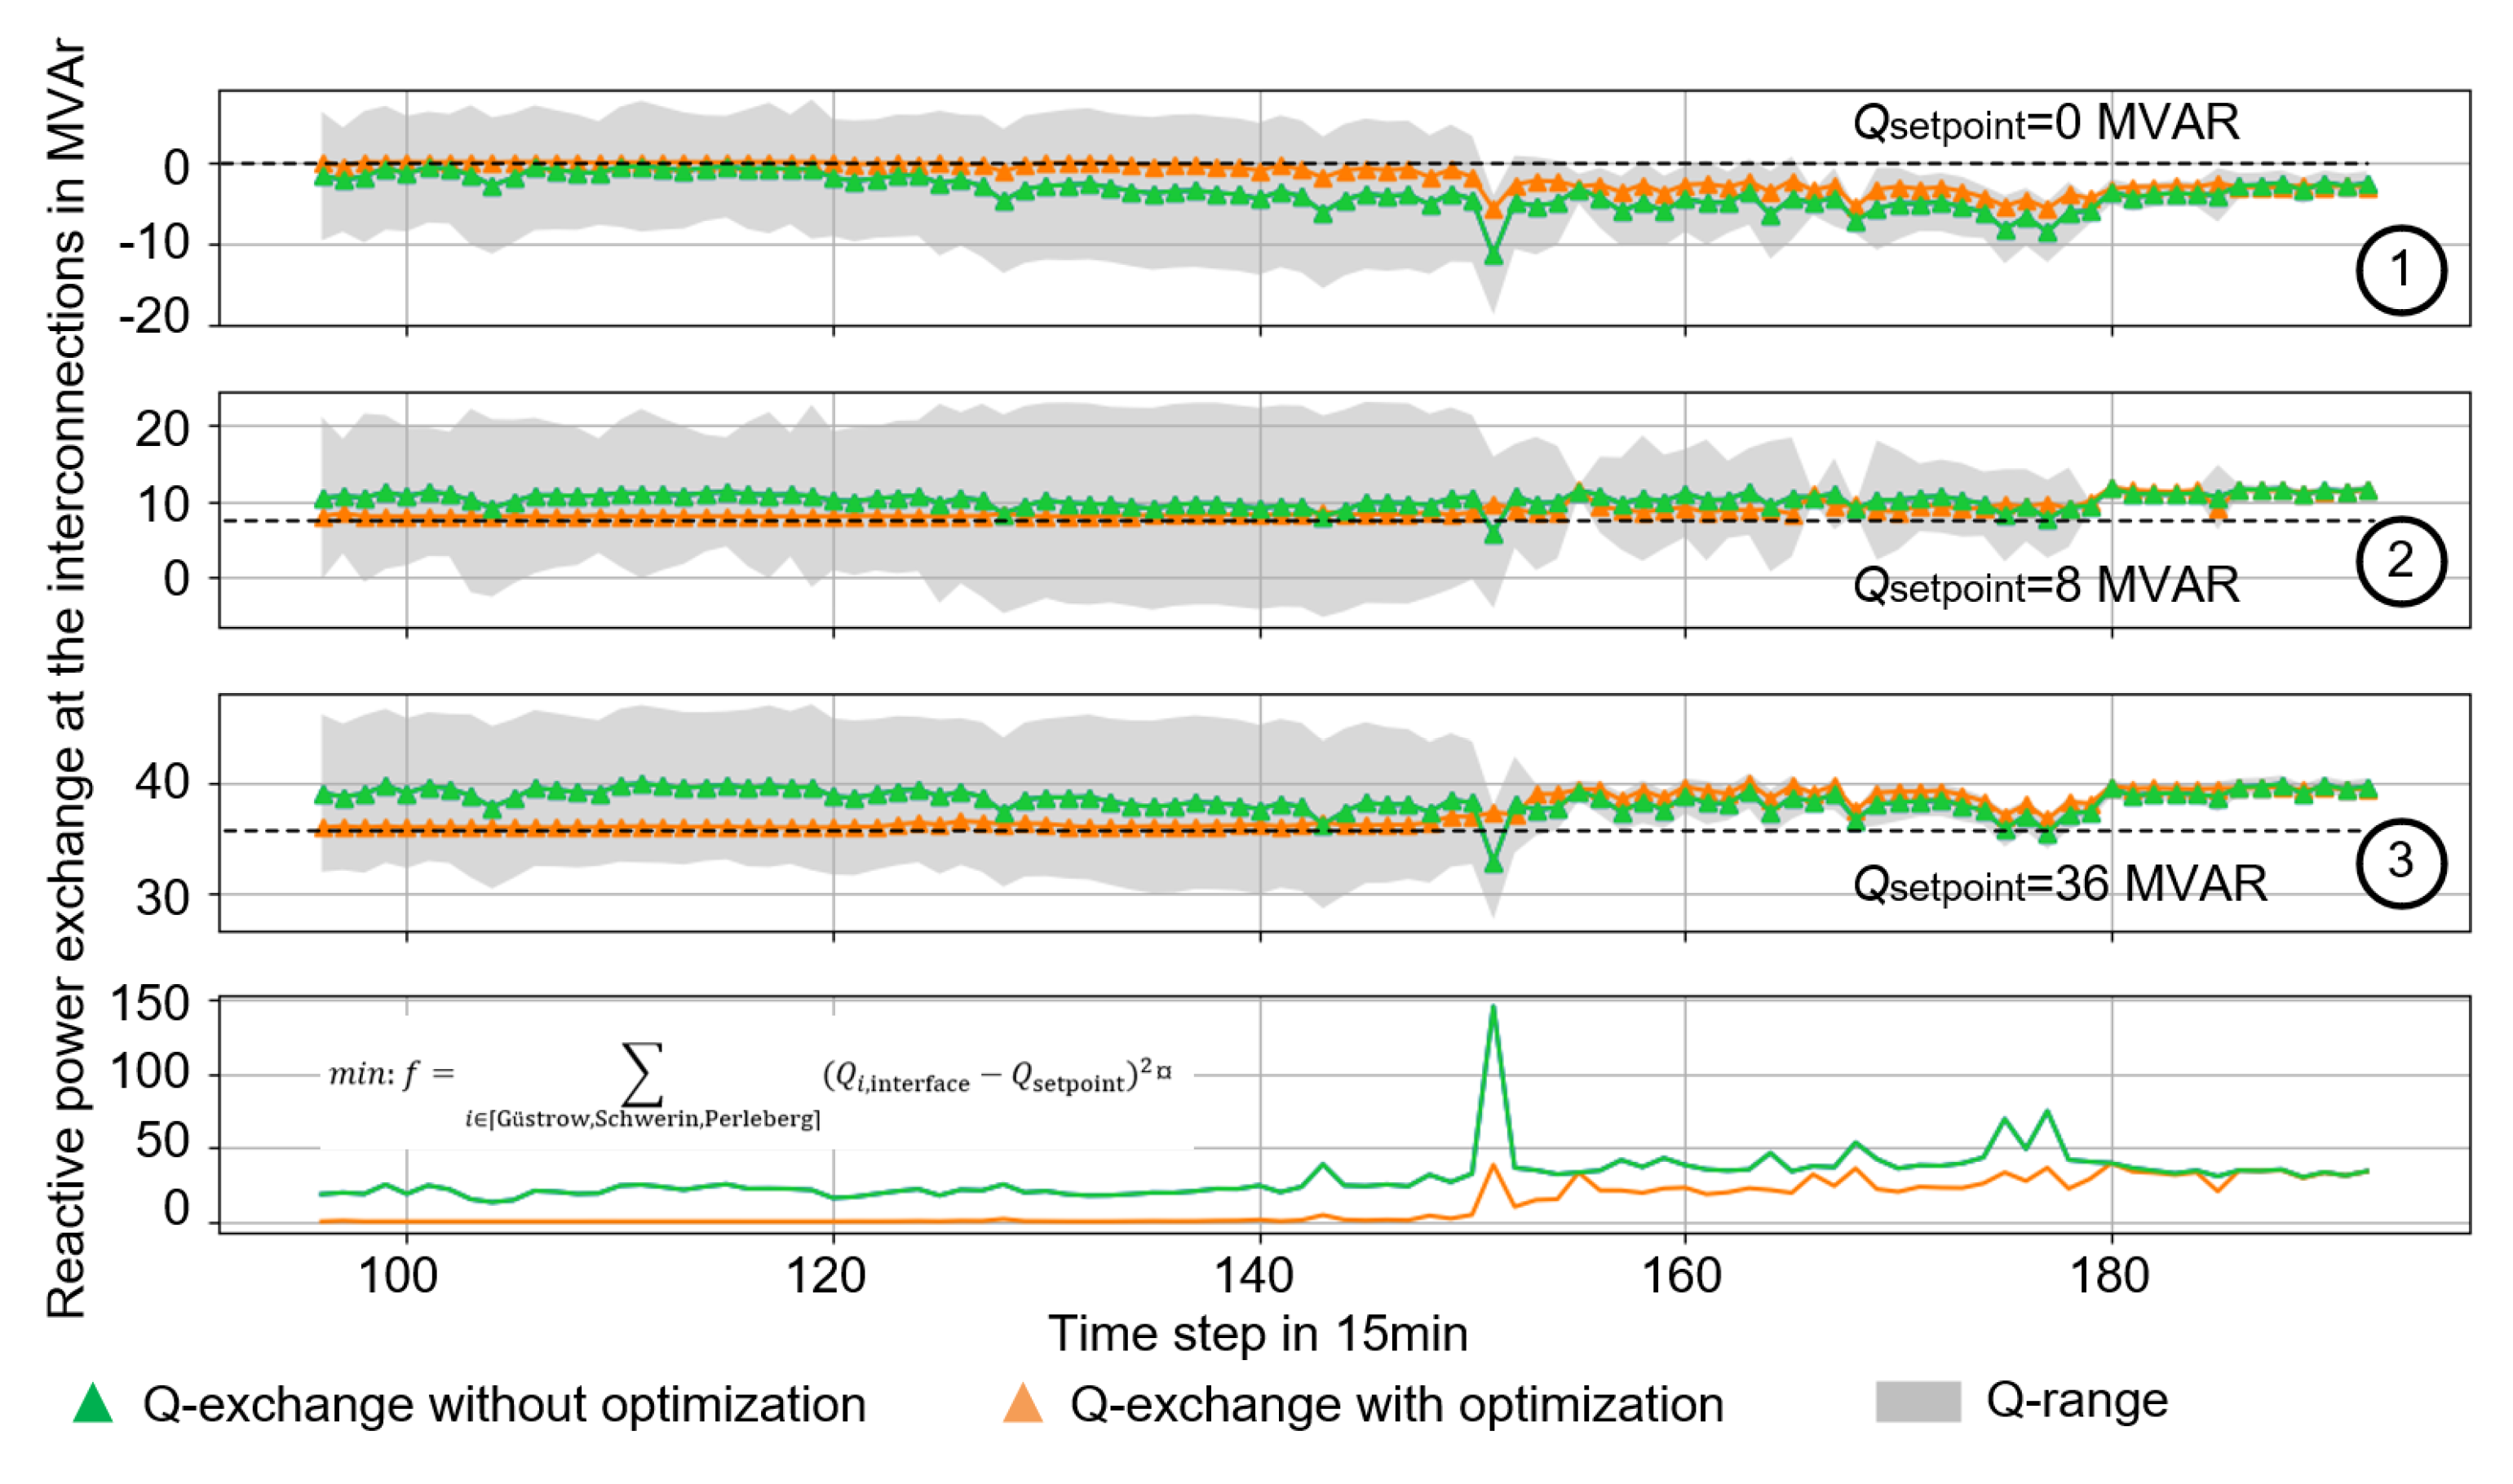
Figure 18.
Calculated Q(P)- and Q(V)-characteristics of exemplary DERs for maintaining the reactive power setpoints based on a three-month time series optimization.
Figure 18.
Calculated Q(P)- and Q(V)-characteristics of exemplary DERs for maintaining the reactive power setpoints based on a three-month time series optimization.
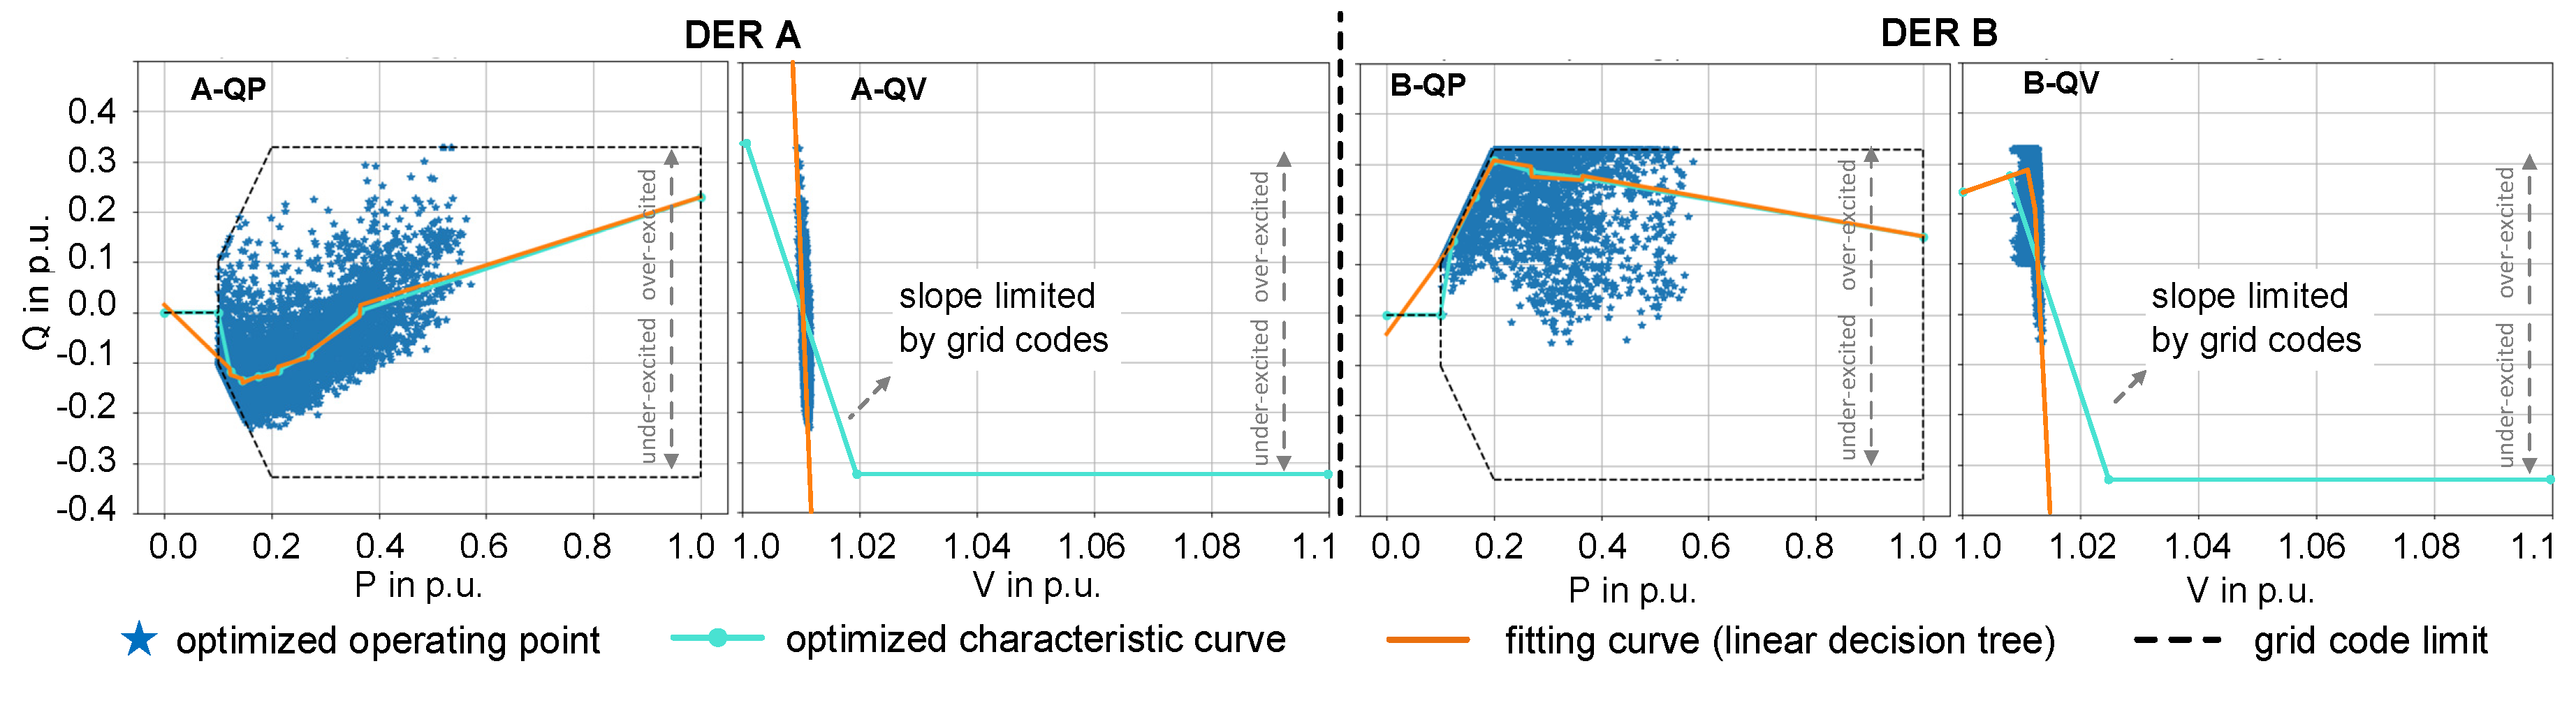
Figure 19.
Simulation results with different local controllers: (a) mean errors from the targets at the three interfaces; (b) mean total reactive power provision for each 15min.
Figure 19.
Simulation results with different local controllers: (a) mean errors from the targets at the three interfaces; (b) mean total reactive power provision for each 15min.
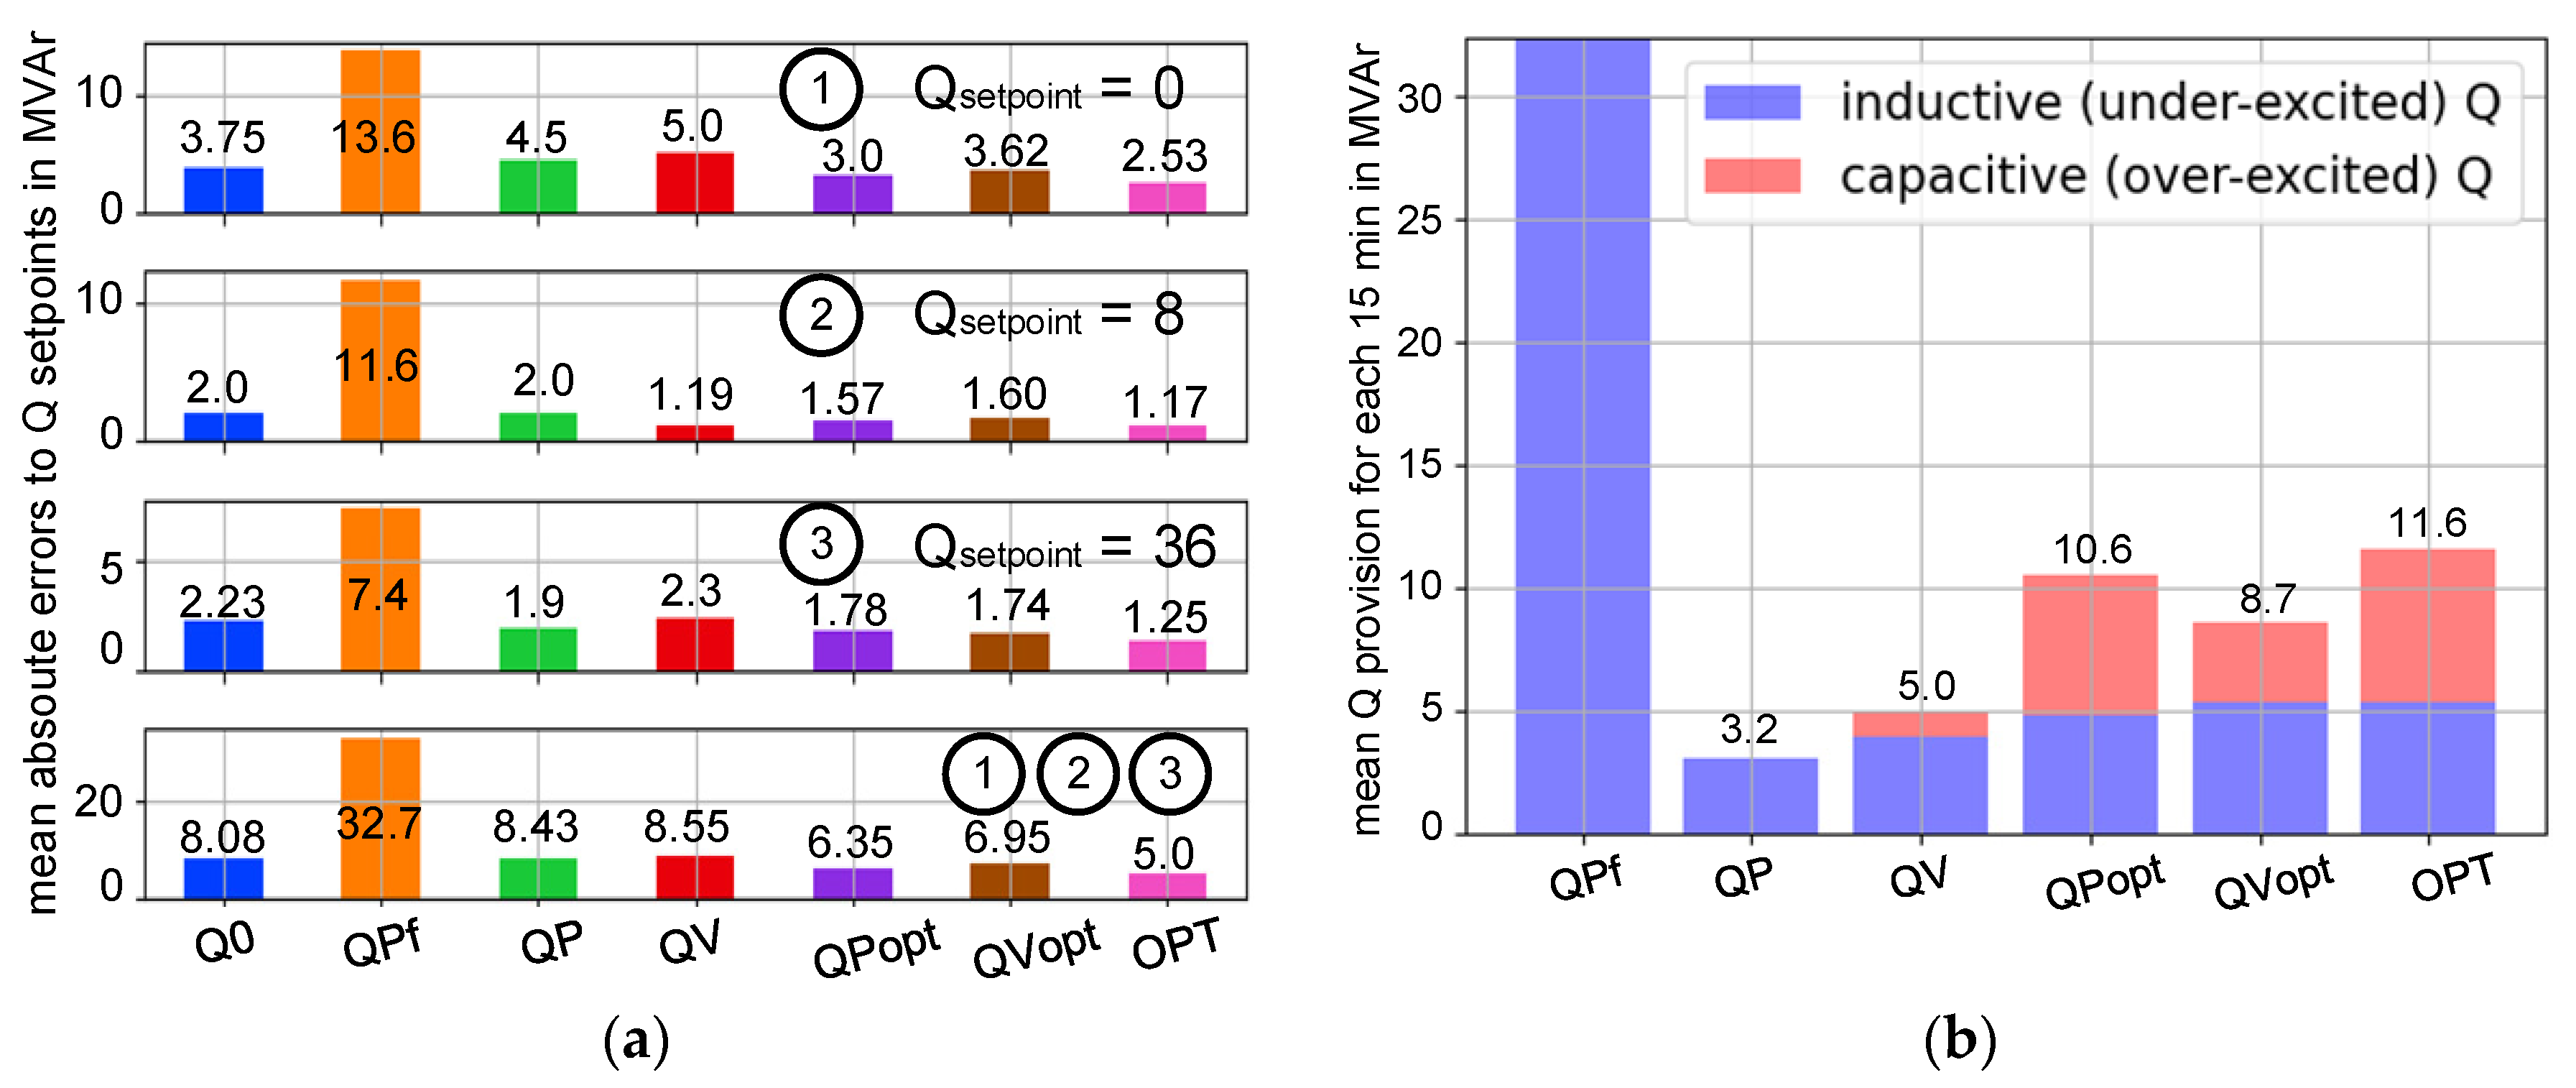

Table 1.
Configurable parameters and their limitations for Q(P)-characteristic curve according to VDE-AR-N 4110 [13].
Table 1.
Configurable parameters and their limitations for Q(P)-characteristic curve according to VDE-AR-N 4110 [13].
| Parameter | Determination/Limitation |
|---|---|
| Limits of reactive power provision: | Determined by grid code: [, ] |
| Limits of active power: | Determined by grid code: |
| Number of breakpoints: |
Table 2.
Configurable parameters and their limitations for Q(V)-characteristic curve according to VDE-AR-N 4110 [13].
Table 2.
Configurable parameters and their limitations for Q(V)-characteristic curve according to VDE-AR-N 4110 [13].
| Parameter | Determination/Limitation |
|---|---|
| Limits of reactive power provision: | Determined by grid code: [, ] |
| Reference voltage value: | Determined by grid operators: e.g., 1.01 p.u. |
| Dead band: | within bounds [] |
| Slope: | |
| Number of breakpoints: |
Table 3.
Modification of control parameters for local reactive power control.
| article | type | objective | dead band | slope | breakpoint | power factor | description/comments | |
|---|---|---|---|---|---|---|---|---|
| [14] | Q(P) Q(V) |
VS | --- | --- | --- | This method is used to optimize the control parameters for different grid areas separately with heuristic approaches (Genetic algorithm (GA), Downhill-Simplex/Nelder mead, Golden Section Search). | ||
| [15] | VS | --- | --- | --- | --- | An analysis method is proposed to improve the PV hosting capacity by the modification of the power factor (𝑄min, 𝑄max). | ||
| [16] | PLM | --- | --- | --- | --- | To reduce the power loss, the reference setpoint location is analyzed, considering the PV penetration rate and the weather conditions. | ||
| [17] | VS | --- | --- | --- | --- | The P(V)-control and the Q(V)-control are combined, considering active power curtailment. | ||
| [18] | Q(V) | PLM | --- | --- | --- | According to the daily clearness index and the daily variability index, the grid condition (with high PV penetration) is classified into five types. For each grid condition type, the best dead band and slope in terms of power loss are determined by varying over ranges. | ||
| [19] | PLM | --- | --- | --- | Particle Swarm Optimization is used to optimize the control parameter. The grid states, e.g., power loss, are represented by revenues and measurements from DSO and customers. | |||
| [20] | Q(V) | VS | --- | --- | --- | --- | Using a three-phase optimal power flow, the voltage reference point of the Q(V)-curve is optimized. | |
| [21] | Q(V) | VS | --- | --- | --- | --- | The use of GA is proposed to optimize the slope of the Q(V)-curve for grids with high penetration of PV. | |
| [22] | Q(V) | VS | --- | --- | --- | --- | --- | The steady-state voltage error is considered |
| [23] | Q(V) | VS | --- | --- | --- | --- | Using sensitivity analysis, the setting of the dead band that satisfies the voltage maintenance standard for two special disturbances in transmission systems is addressed. | |
| [24] | Q(V) | VS | --- | --- | --- | The paper proposes a two stages method based on GA and ANN to adapt the control parameters of Q(V)-curve. The ANN aims to develop a fitting function correlating the Thevenin impedance at the PCC and optimal control parameters obtained from the GA optimization. | ||
| [25] | Q(V) | VS | --- | --- | --- | The conventional Q(V)-curve is divided into multi sections to compensate for reactive power, minimizing the power loss actively. The sections are determined by GA. |
Table 4.
Parameter for the quarter ahead forecasting error generations, according to [41, 42].
| DER type | Normal distribution parameters: mean; standard deviation |
|---|---|
| PV | |
| Wind | |
| Load |
Table 5.
Description of time series simulation and applied characteristics.
| Simulation ID | Applied characteristic curves |
|---|---|
| Q0 (reference) | No controller |
| QPf (reference) | Fixed Q(P) (cf. Figure 10) |
| QP (reference) | Q(P) (cf. Figure 10) |
| QV (reference) | Q(V) (cf. Figure 10) |
| QPopt | Individually calculated Q(P) |
| QVopt | Individually calculated Q(V) |
| OPT | Results directly from time series optimization |
| QVdbd (reference) | Q(V) with the dead band (cf. Figure 10) |
| OVdbdopt | Individually calculated Q(V) considering the dead band |
Table 6.
Defined Q-flexibility for different interfaces.
| Interface | Q flexibility at the Interface |
|---|---|
| Güstrow | 0 MVAr |
| Schwerin | 8 MVAr |
| Perleberg | 36 MVAr |
Disclaimer/Publisher’s Note: The statements, opinions and data contained in all publications are solely those of the individual author(s) and contributor(s) and not of MDPI and/or the editor(s). MDPI and/or the editor(s) disclaim responsibility for any injury to people or property resulting from any ideas, methods, instructions or products referred to in the content. |
© 2023 by the authors. Licensee MDPI, Basel, Switzerland. This article is an open access article distributed under the terms and conditions of the Creative Commons Attribution (CC BY) license (http://creativecommons.org/licenses/by/4.0/).
Copyright: This open access article is published under a Creative Commons CC BY 4.0 license, which permit the free download, distribution, and reuse, provided that the author and preprint are cited in any reuse.


