
Submitted:
03 May 2023
Posted:
04 May 2023
You are already at the latest version
Abstract
Omega-3 fatty acids (ω-3 FAs) are important fatty acids having the beneficial roles in human health including reducing blood pressure, lowering the risk of cardiovascular disease and exerting anti-inflammation activities. Omega-3 FAs were mainly found in fish oils, therefore, determination of these FAs is very important. This study highlighted the employment of FTIR spectroscopy combined with multivariate data analysis for determination of ω-3 FAs in fish oils. Fish oils were obtained from the extraction of corresponding fishes and subjected to purification. The oils were further subjected to FTIR spectroscopic measurement at mid infrared region (4000-450 cm-1). Fatty acid compositions of ω-3 FAs namely eicosapentaenoic acid (EPA) and docosahexaenoic acid (DHA) were determined using gas chromatography with flame ionization (GC-FID), and the results from GC-FID were used as actual values. Two multivariate regressions along with wavenumbers regions or their combinations were optimized and compared to provide the best condition for prediction of EPA and DHA in fish oils. The results showed that partial least square regression (PLSR) was suitable for prediction of DHA applying the variable of absorbance values of the second derivative spectra, with the values of coefficient of determination (R2) of 0.9916 and 0.9316 in calibration and validation models, respectively. The values of root mean square error of calibration (RMSEC) and root mean square error of prediction (RMSEP) obtained were 0.789 and 2.53. While, prediction of EPA was performed using principal component regression with R2 value of > 0.72 and low values of RMSEC and RMSEC. It can be concluded that the combination of FTIR spectra and multivariate regression provides the effective tools and alternative GC-FID method for the prediction of EPA and DHA in fish oils.
Keywords:
EPA-DHA
; marine oils
; FTIR spectra
; chemometrics
; partial least square
1. Introduction
Omega-3 fatty acids (ω-3 FAs) are important fatty acids having the beneficial roles in human health. Among ω-3 FAs, eicosapentaenoic acid or EPA (C20:5, ω-3), and docosahexaenoic acid or DHA (C22:6, ω-3) are reported to be found, especially in marine sources such as fish, microalgae and krill [1]. Some beneficial effects of ω-3 FAs on human health have been reported. There is a positive relationship between the reduced risk of cardiovascular diseases (CVD) with the high intake of ω-3 FAs of EPA and DHA because of the capability of these ω-3 FAs to modulate some risk factors associated to CVD including platelet aggregation, blood lipids, blood pressure, and inflammation [2]. In addition, a negative correlation was observed for the association of ω-3 FAs and the risks of ulcerative colitis and Crohn’s disease [3]. The intake of ω-3 FAs could reduce some depression symptoms and exhibit anti-inflammatory effects through the formation of active metabolites capable of promoting the tailored therapy in psychiatric and neurological conditions, and involve the brain development in patients with Alzheimer’s disease [4]. These FAs are also reported to have anti-cancer activity in vitro through inducing the apoptotic in cancer cells and immunostimulants [1].
Because of the positive effects of ω-3 FAs to the human health, some International Organizations including Food and Agriculture Organization (FAO) and World Health Organization (WHO) have recommended an intake of ω-3 FAs (EPA + DHA) of 0.25–2 g per day. In addition, for reducing the risk of heart disease and lowering blood pressure, the European Food Safety Authority (EFSA) has set a daily intake of long-chain ω-3 FAs 250 mg in adults [1]. Therefore, the quality controls of ω-3 FAs by determining the components of ω-3 FAs using some analytical methods is very urgent. Chromatographic-based methods including gas chromatography using flame ionization detector [5], mass spectrometer detector [6], HPLC with UV detection liquid [7] and chromatography/tandem mass spectrometry (LC–MS/MS) [8]. However, these methods involved sophisticated instruments and need skilful analyst, therefore, more user-friendly methods are need to be developed mainly based on spectroscopic methods including FTIR spectroscopy.
FTIR spectroscopy is one of the popular spectroscopic methods applied to quality controls of several commodities including food and pharmaceutical products. This is not surprising since FTIR spectroscopy is fingerprint analytical methods which offer rapid and reliable methods for analysis of any compounds including ω-3 FAs with infrared active property [9]. FTIR spectra contain large number information could be extracted, thus this technique involves big data. A specialized statistics tools called with chemometrics provides the complement technique for treating big data coming from FTIR spectroscopic measurements [10]. The combination of FTIR spectroscopy and chemometrics have been applied methods for determination of fatty acids, as an alternative for gas chromatographic methods [11]. The levels of fatty caids in vegetable oils [12] and marine oils [13] have been successfully determined using FTIR spectroscopy in conjunction with multivariate regressions such as partial least square and principle component regressions. However, the development and validation of FTIR spectra and multivariate calibrations for analysis of ω-3 FAs in fish oils are very limited. Therefore, in this study, FTIR spectroscopy combined with multivariate data analysis has been developed and applied for the prediction of ω-3 FAs levels in fish oils. This method could be an alternative for GC methods which require long time analysis.
2. Results and Discussion
This study was initiated by collecting twenty species marine fishes from different location around Southeast Sulawesi coast, Indonesia. The fish samples were extracted to obtain twenty fish oils with different properties. These oils were purified using bentonite, centrifuged, filtered and stored at dark bottle to maintain their stability profiles before performing the analysis. Quantitative analysis using gas chromatography with flame ionization detector was carried out for determine the content of ω-3 in fish oils. Table 1 compiled the levels of EPA and DHA as determined by gas chromatography with flame ionization detector, and these levels are used as actual values during the quantitative modeling of EPA and DHA using FTIR spectroscopy and multivariate regressions.
FTIR spectra is considered as molecular spectra since the functional groups in the molecular state interact with electromagnetic radiation in mid infrared regions to provide the fundamental vibrations, as represented by peaks and shoulders in FTIR spectra [14]. Figure 1 exhibited FTIR spectra of fish oils extracted from 20 different fishes, scanned using attenuated total reflectance mode at mid infrared region (4000-450 cm-1). Each peak and shoulders represented the functional groups which absorb IR radiation and exhibited typical absorption peaks of fish oils mainly composed from triacylglycerols (TAGs) or triglycerides (TGs). TAG is glycerol esterified with three fatty acids and represented by some functional groups such as methyl (-CH3) which can be confirmed by peaks at 2963 cm-1 (due to asymmetric stretching vibration) and at 1317 cm-1 (due to bending vibrations). TAG is also composed from CH2- (methylene) which can be identified by peaks at 2922 cm-1 (asymmetric stretching vibration), 2853 cm-1 (symmetric stretching vibration) and 1459 cm-1 (bending vibration), C=O (at 1744 cm-1 due to stretching vibration of ester and at 1710 cm-1 due to vibration of acids). The identification of other functional groups in TAG of fish oils can be found elsewhere [9,15,16]. The peaks of FTIR spectra are fingerprint profiles of objects therefore FTIR spectra are effective tools for differentiation and identification of fish oils. In addition, the intensity of peaks could be correlated with levels or concentrations of samples, therefore, peaks could also be used for quantitative analysis, according to Lambert-Beer law [17]. FTIR spectroscopy is widely used for quantitative analysis of certain components in fish oils including fatty acids and for determination of parameters which are related to quality controls of fish oils such as oxidation levels, saponification value, iodine value, etc.
The obtained FTIR spectra were used further to build multivariate calibration models. In this study, two multivariate calibration regressions namely PLSR and Principal Component Regression (PCR) were developed and compared during the optimization studies intended to the quantitative analysis or prediction of ω-3 FAs (EPA and DHA). Both PLSR and PCR are inverse calibration in which the concentrations of EPA and DHA in y-axis were modeled using variable of absorbance values (x-axis) [18]. The statistical performances obtained by the combination of FTIR spectroscopy-multivariate regressions were evaluated during the correlation modeling between actual and predicted values of EPA by selecting the highest values of R2 and lowest values of errors in calibration (RMSEC) and prediction (RMSEP).
The wavenumbers regions were optimized since some regions were directly correlated with the concentrations of analytes (EPA-DHA) according to Lambert-Beer law [19], therefore the selection of correct infrared regions is very crucial for getting the appropriate modeling. According to the FTIR spectral evaluation, it was found that wavenumber regions of 4000-600 cm-1, 1800-600 cm-1, 1800-900 cm-1, and combination region of 2997-2806 and 1800-900 cm-1 can be processed for multivariate calibration modeling. In this study, we stated four FTIR wavenumber regions with three spectral types of normal spectra, first derivatives, and second derivatives. In addition, the derivatization of FTIR spectra may assist the resolving of overlapping peaks which contribute to better modeling [20].
Table 2 provides the statistical performance of FTIR spectroscopy combined with PLSR and PCR for the correlation modeling between actual values of DHA and FTIR predicted values. Based on the highest R2 values and lowest RMSEC and RMSEP values, FTIR spectra using absorbance values of second derivative spectra at wavenumbers region of 4000-600 cm-1 was selected for quantitative analysis of DHA. Using this condition, the R2 values obtained were 0.9916 (in calibration) and 0.9316 (in prediction) indicating that the accuracy of PLSR using this condition is 99.16% and 93.16%, respectively. Meanwhile, the RMSEC and RMSEP values were of 0.789 and 2.53, respectively. The high R2 values indicated that the developed model is accurate meaning that there is a close relationship between actual values of DHA and predicted values of DHA. In addition, the low RMSEC and RMSEP values indicate good precision model [21].
In order to obtain the multivariate calibration regression model for EPA, the similar chemometrics techniques along with similar wavenumber regions were also generated. Both PLSR and PCR models were evaluated and compared. It was found that the performance of PCR model of second derivative spectra at 6000-400 cm-1 was selected as the best multivariate calibration model Table 3. This condition provides the analytical advantages since EPA and DHA could be determined simultaneously.
Figure 2 exhibited the correlation lines representing the relationship between actual values of DHA (A) and EPA (B) in x-axis and FTIR predicted values along with their statistical parameters generated using selected models. To evaluate the errors occurring during the development of calibration models whether random or systematic errors, a residual analysis which as a difference between predicted values and actual values was presented (Figure 2C). There is no systematic errors observed during the modeling since the points representing the residual results fall in above and below zero (0) values randomly. If the systematic errors existed, the points fall in above or in below zero (0) points systematically [22]. Based on this results, the developed models employing FTIR spectroscopy at certain wavenumbers and PLSR could be used for the prediction of EPA and DHA in the unknown samples. Table 4 gives the comparison between the previous methods used for the analysis and quantification of EPA and DHA and the advantages of the current study using FTIR spectroscopy and chemometrics.
In this study, an alternative analytical method for analyzing ω-3 fatty acid in Indonesia fish oils using infrared spectroscopy and multivariate data analysis were successfully developed. We realize that that previous studies were also developed analytical methods to evaluate fatty acid in different condition and/or matrix. The combination of infrared spectroscopy and chemometrics enabled the analytical methods with minimum sample preparation steps, faster, low cost, and efficient compared to the previous studies. However, generating the multivariate calibration remained a crucial challenge since the actual values should be obtained from the empirical study using established analytical techniques. An integrated analytical technique by combining empirical results from validated analytical method and chemometrics modeling can be employed to overcome several problems and challenges related to modern analysis.
3. Materials and Methods
3.1. Materials
Twenty species marine fishes were collected from different location around Southeast Sulawesi coast, Indonesia. The fish samples were eviscerated, filleted, and placed in cooling box, to be sent to the Laboratory of Pharmaceutical Chemistry, Halu Oleo University. The filleted fish samples were dried at temperature of 70-80oC (for 2 x 24 hours) using oven (Stuart Scientific), powdered (Philips blender), and then stored at 4oC for future analysis. All solvents and reagents used for analysis were of analytical grade and were supplied by E. Merck Darmstadt, Germany.
3.2. Fish Oils Extraction
Marine fish oils were extracted using Soxhlet methods according to the methods described by Rincón-Cervera [30] with slight modification. The Powdered fish (50 g) were placed in a Soxhlet apparatus and extracted with 750 mL n-hexane for 2 h at temperature of 80oC. After extraction was complete, n-hexane was evaporated at 50oC using a rotary evaporator (Stuart). The oils were collected, weighed, and stored at 4oC.
3.3. Oils Purification
Crude fish oils were purified using bentonite at a ratio 1 % (w/w) of oils weight, centrifuged (Boeco Germany) for 5 min, filtered and stored at dark bottle in a freezer for subsequent analysis [31].
3.4. Fatty Acids Analysis
The fatty acids analysis of marine fish oils was carried out according to Irnawati et al. [33]. Fatty acids were derived to fatty acids methyl esters (FAMEs). FAMEs of MFO (0.4 g) were prepared using an alkali catalyzed (1.5 ml of methanolic potassium hydroxide) and in crew-capped glass test tube. The mixtures were heated at 60oC for 10 min, cooled at room temperature and then added 2 ml of boron trifluoride-methanol. The sample mixtures were heated again under the same conditions, when cooled, 1 mL heptane was added with 1 mL of sodium chloride, shacked. Finally, the upper Heptane layer was collected for Fatty acid analysis using an Agilent gas chromatography (7890B) equipped flame ionization detector and a HP-88 capillary column (100 m x 0.3 mm x 0.2 μm). The temperature program was 5 min at 100oC, heating until 240oC at rate of 4oC/min, hold time at 15 min. The temperature of injector was 260oC with a split ratio of 10:1, injection volume was 1 μL. Detector temperature was 260oC. Helium was used as carrier gas (40 ml/min). Peaks identification was carried out by comparing the retention time from CRM47885 FAME Mix standards (Supelco).
3.5. FTIR Spectra Measurement
The measurement of all marine fish oil samples was performed according the condition as described by Irnawati et al. [32] with slight modification. The measurement of FTIR spectra of all samples were scanned using FTIR spectrophotometer (Spectrum TwoTM PerkinElmer, USA) controlled with Spectrum TouchTM software. The measurements were done in the middle infrared region of 4000-450 cm-1 with scanning number of 4 and a resolution of 8 cm-1.
3.6. Chemometrics Analysis
Chemometrics technique including partial least square and principal component regression (multivariate calibrations) was performed using TQ Analyst software included in FTIR spectrophotometer used during this study.
4. Conclusions
The combination of FTIR spectroscopy and multivariate regression using absorbance values at the wavenumbers region of 4000-600 cm-1 offered rapid and reliable tools for determination of EPA and DHA with accurate and precise results. The developed method can be an alternative of reference method of gas chromatography for analysis of EPA and DHA. In the future, this method should be standardized among the competent laboratories through the proficiency testing.
Author Contributions
Conceptualization, A.R. and N.A.F.; methodology, I.; software, A.R.; validation, A.W., and F.D.O.R.; formal analysis, I.; investigation, A.W.; resources, I. and A.R; data curation, I.; writing—original draft preparation, A.R. I; writing—review and editing, A.W. and F.D.O.R; visualization, I.; supervision, A.R.; project administration, I.; funding acquisition, A.R. All authors have read and agreed to the published version of the manuscript.
Funding
This research was funded by Directorate of Research Universitas Gadjah Mada through PROGRAM POST-DOCTORAL 2022, grant number 5836/UN1/DITLIT/Dit-Lit/PT.01.05/2022.
Institutional Review Board Statement
Not applicable.
Informed Consent Statement
Not applicable.
Acknowledgments
The authors thank to Laboratorium Penelitian dan Pengujian Terpadu Universitas Gadjah Mada for the instrumental support during this study.
Conflicts of Interest
The authors declare no conflict of interest.
References
- Pasini, F.; Gómez-Caravaca, A.M.; Blasco, T.; Cvejić, J.; Caboni, M.F.; Verardo, V. Assessment of Lipid Quality in Commercial Omega-3 Supplements Sold in the French Market. Biomolecules 2022; 12, 1361. [CrossRef]
- Innes, J.K.; Calder, P.C. Marine omega-3 (N-3) fatty acids for cardiovascular health: An update for 2020. Int. J. Mol. Sci. 2020, 21, 1–21. [CrossRef]
- Mozaffari, H.; Daneshzad, E.; Larijani, B.; Bellissimo, N.; Azadbakht, L. Dietary intake of fish, n-3 polyunsaturated fatty acids, and risk of inflammatory bowel disease: a systematic review and meta-analysis of observational studies. Eur. J. Nutr. 2020, 59, 1-17. [CrossRef]
- Giacobbe, J.; Benoiton, B.; Zunszain, P.; Pariante, C.M.; Borsini, A. The Anti-Inflammatory Role of Omega-3 Polyunsaturated Fatty Acids Metabolites in Pre-Clinical Models of Psychiatric, Neurodegenerative, and Neurological Disorders. Front Psychiatry 2020, 11, 1-13. [CrossRef]
- Alinafiah, S.M.; Azlan, A.; Ismail, A.; Rashid, N.K.M.A. Method development and validation for omega-3 fatty acids (DHA and EPA) in fish using gas chromatography with flame ionization detection (GC-FID). Molecules 2021, 26, 6592. [CrossRef]
- Yi, T.; Li, S.M.; Fan, J.Y.; Fan, L.L.; Zhang, Z.F.; Luo, P.; Zhang, X.J.; Wang, J.G.; Zhu, L.; Zhao, Z.Z. Chen HB. Comparative analysis of EPA and DHA in fish oil nutritional capsules by GC-MS. Lipids Health Dis. 2014, 13, 1–6. [CrossRef]
- Kiełbasa, A.; Buszewski, B.; Gadzała-Kopciuch, R. A novel non-derivatization HPLC/UV method for the determination of some n-3 free fatty acids in breast milk matrix. Microchem. 2022, 181, 107789. [CrossRef]
- Viswanathan, S.; Verma, P.R.P.; Ganesan, M.; Manivannan, J. A novel liquid chromatography/tandem mass spectrometry (LC–MS/MS) based bioanalytical method for quantification of ethyl esters of Eicosapentaenoic acid (EPA) and Docosahexaenoic acid (DHA) and its application in pharmacokinetic study. J. Pharm. Biomed. Anal. 2017, 141, 250–261. [CrossRef]
- Rohman, A.; Putri, A.R.; Irnawati; Windarsih, A.; Nisa, K.; Lestari, L.A. The employment of analytical techniques and chemometrics for authentication of fish oils: A review. Food Control 2021, 124, 107864. [CrossRef]
- Singh, I.; Juneja, P.; Kaur, B.; Kumar, P. Pharmaceutical Applications of Chemometric Techniques. ISRN Anal. Chem. 2013, 2013, 1–13. [CrossRef]
- Yu, X.; Du, S.; van de Voort, F.R.; Yue, T.; Li, Z. Automated and simultaneous determination of free fatty acids and peroxide values in edible oils by FTIR spectroscopy using spectral reconstitution. Anal. Sci. 2009, 25, 627–632. [CrossRef]
- Tarhan, İ.; Ismail, A.A.; Kara, H. Quantitative determination of free fatty acids in extra virgin olive oils by multivariate methods and Fourier transform infrared spectroscopy considering different absorption modes. Int. J. Food Prop. 2017, 20, S790–S797. [CrossRef]
- Aryee, A.N.A.; van de Voort, F.R.; Simpson, B.K. FTIR determination of free fatty acids in fish oils intended for biodiesel production. Process Biochem. 2009, 44, 401–405. [CrossRef]
- Rohman, A.; Man, Y.B.C. Application of Fourier Transform Infrared Spectroscopy for Authentication of Functional Food Oils. Appl. Spectroscy Rev. 2012, 47, 1–13. [CrossRef]
- Putri, A.R.; Rohman, A.; Riyanto, S. Authentication of patin (Pangasius micronemus) fish oil adulterated with palm oil using ftir spectroscopy combined with chemometrics. Int. J. Appl. Pharm. 2019, 11, 195–199. [CrossRef]
- Rohman, A.; Che Man, Y.B. Analysis of cod-liver oil adulteration using fourier transform infrared (FTIR) spectroscopy. J. Am. Oil Chem. Soc. 2009, 86. [CrossRef]
- Kaya-Celiker, H.; Mallikarjunan, P.K.; Kaaya, A. Mid-infrared spectroscopy for discrimination and classification of Aspergillus spp. contamination in peanuts. Food Control 2015, 52, 103–111. [CrossRef]
- Albayrak, M.; Demirkaya-Miloglu, F.; Senol, O.; Polatdemir, E. Design, optimization, and validation of chemometrics-assisted spectrophotometric methods for simultaneous determination of etodolac and thiocolchicoside in pharmaceuticals. J. Anal. Sci. Technol. 2019, 10, 2-8. [CrossRef]
- Eticha, T.; Kahsay, G.; Asefa, F.; Hailu, T.; Gebretsadik, H.; Gebretsadikan, T.; Thangabalan, B. Chemometric-Assisted Spectrophotometric Method for the Simultaneous Determination of Ciprofloxacin and Doxycycline Hyclate in Pharmaceutical Formulations. J. Anal. Methods Chem. 2018, 9538435. [CrossRef]
- Rohman, A.; Riyanto, S.; Sasi, A.M.; Yusof, F.M. The use of FTIR spectroscopy in combination with chemometrics for the authentication of red fruit (Pandanus conoideus Lam) oil from sunflower and palm oils. Food Bioscience 2014, 7, 64–70. [CrossRef]
- Mirghani, M.E.S.; Che Man, Y.B.; Jinap, S.; Baharin, B.S.; Bakar, J. Rapid method for determining malondialdehyde as secondary oxidation product in palm olein system by Fourier transform infrared spectroscopy. Phytochem. Anal. 2002, 13, 195–201. [CrossRef]
- Hermanto, S.; Sumarlin, L.O.; Fatimah, W. Differentiation of Bovine and Porcine Gelatin Based on Spectroscopic and Electrophoretic Analysis. J. Food Pharm. Sci. 2013, 1, 68-73. [CrossRef]
- Lorensia, A.; Budiono, R.; Suryadinata, R.V.; Tiarasari, N. Quantitative determination of EPA and DHA in fish oil capsules for cardiovascular disease therapy in Indonesia by GC-MS. J. Public health Res. 2021; 10. [CrossRef]
- Brotas, M.S.C.; Carvalho, G.A.; Pereira, P.A.P. Determination, through derivatization and GC-MS analysis, of omega-3 and omega-6 fatty acids in fish oil capsules sold in Salvador, Bahia. J. Braz. Chem. Soc. 2020, 31, 447–455. [CrossRef]
- Lv, J.; Wang, C.; Zhang, X.; Lv, Z.; Yu, M. 1H NMR Quantification of DHA and EPA in Fish Oil. J. Ocean Univ. China 2020, 19, 1193–1197. [CrossRef]
- Dais, P.; Misiak, M.; Hatzakis, E. Analysis of marine dietary supplements using NMR spectroscopy. Anal. Methods 2015, 7, 5226–5238. [CrossRef]
- Williamson, K.; Hatzakis, E. NMR Spectroscopy as a Robust Tool for the Rapid Evaluation of the Lipid Profile of Fish Oil Supplements. J. Vis. Exp. 2017, 2017, 55547. [CrossRef]
- Serafim, V.; Tiugan, D.A.; Andreescu, N.; Mihailescu, A.; Paul, C.; Velea, I.; Puiu, M.; Niculescu, M.D. Development and Validation of a LC–MS/MS-Based Assay for Quantification of Free and Total Omega 3 and 6 Fatty Acids from Human Plasma. Molecules 2019, 24. [CrossRef]
- Kotani, A.; Watanabe, M.; Yamamoto, K.; Kusu, F.; Hakamata, H. Determination of eicosapentaenoic, docosahexaenoic, and arachidonic acids in human plasma by high-performance liquid chromatography with electrochemical detection. Anal. Sci. 2016, 32, 1011–1014. [CrossRef]
- Rincón-Cervera, M.Á.; Villarreal-Rubio, M.B.; Valenzuela, R.; Valenzuela, A. Comparison of fatty acid profiles of dried and raw by-products from cultured and wild fishes. Eur. J. Lipid Sci. Technol. 2017, 119, 1600516. [CrossRef]
- Quero-Jiménez, P.C.; Felipe, L.A.A.; Prieto García, J.O.; Rodríguez, M.E.J.; De La Torre, L.J.B.; Montenegro, O.N.; Molina, R.R. Local Cuban bentonite clay as potential low-cost adsorbent for shark liver oil pool purification. J. Pharm. Pharmacogn. Res. 2021, 9, 525–536. [CrossRef]
- Irnawati, I.; Riyanto, S.; Martono, S.; Rohman, A. The employment of FTIR spectroscopy and chemometrics for the classification and prediction of antioxidant activities of pumpkin seed oils from different origins. J. Appl. Pharm. Sci. 2021, 11, 100–107. [CrossRef]
- Irnawati, I.; Riyanto, S.; Martono, S.; Windarsih, A.; Rohman, A. Physicochemical properties and antioxidant activities of pumpkin seed oil as affected by different origins and extraction methods. J. Appl. Pharm. Sci. 2022, 12, 115–122. [CrossRef]
Figure 1.
FTIR spectra of twenty fish oils obtained from Sulawesi regions, Indonesia scanned using attenuated total reflectance (ATR) at mid infrared region (4000-450 cm-1).
Figure 1.
FTIR spectra of twenty fish oils obtained from Sulawesi regions, Indonesia scanned using attenuated total reflectance (ATR) at mid infrared region (4000-450 cm-1).
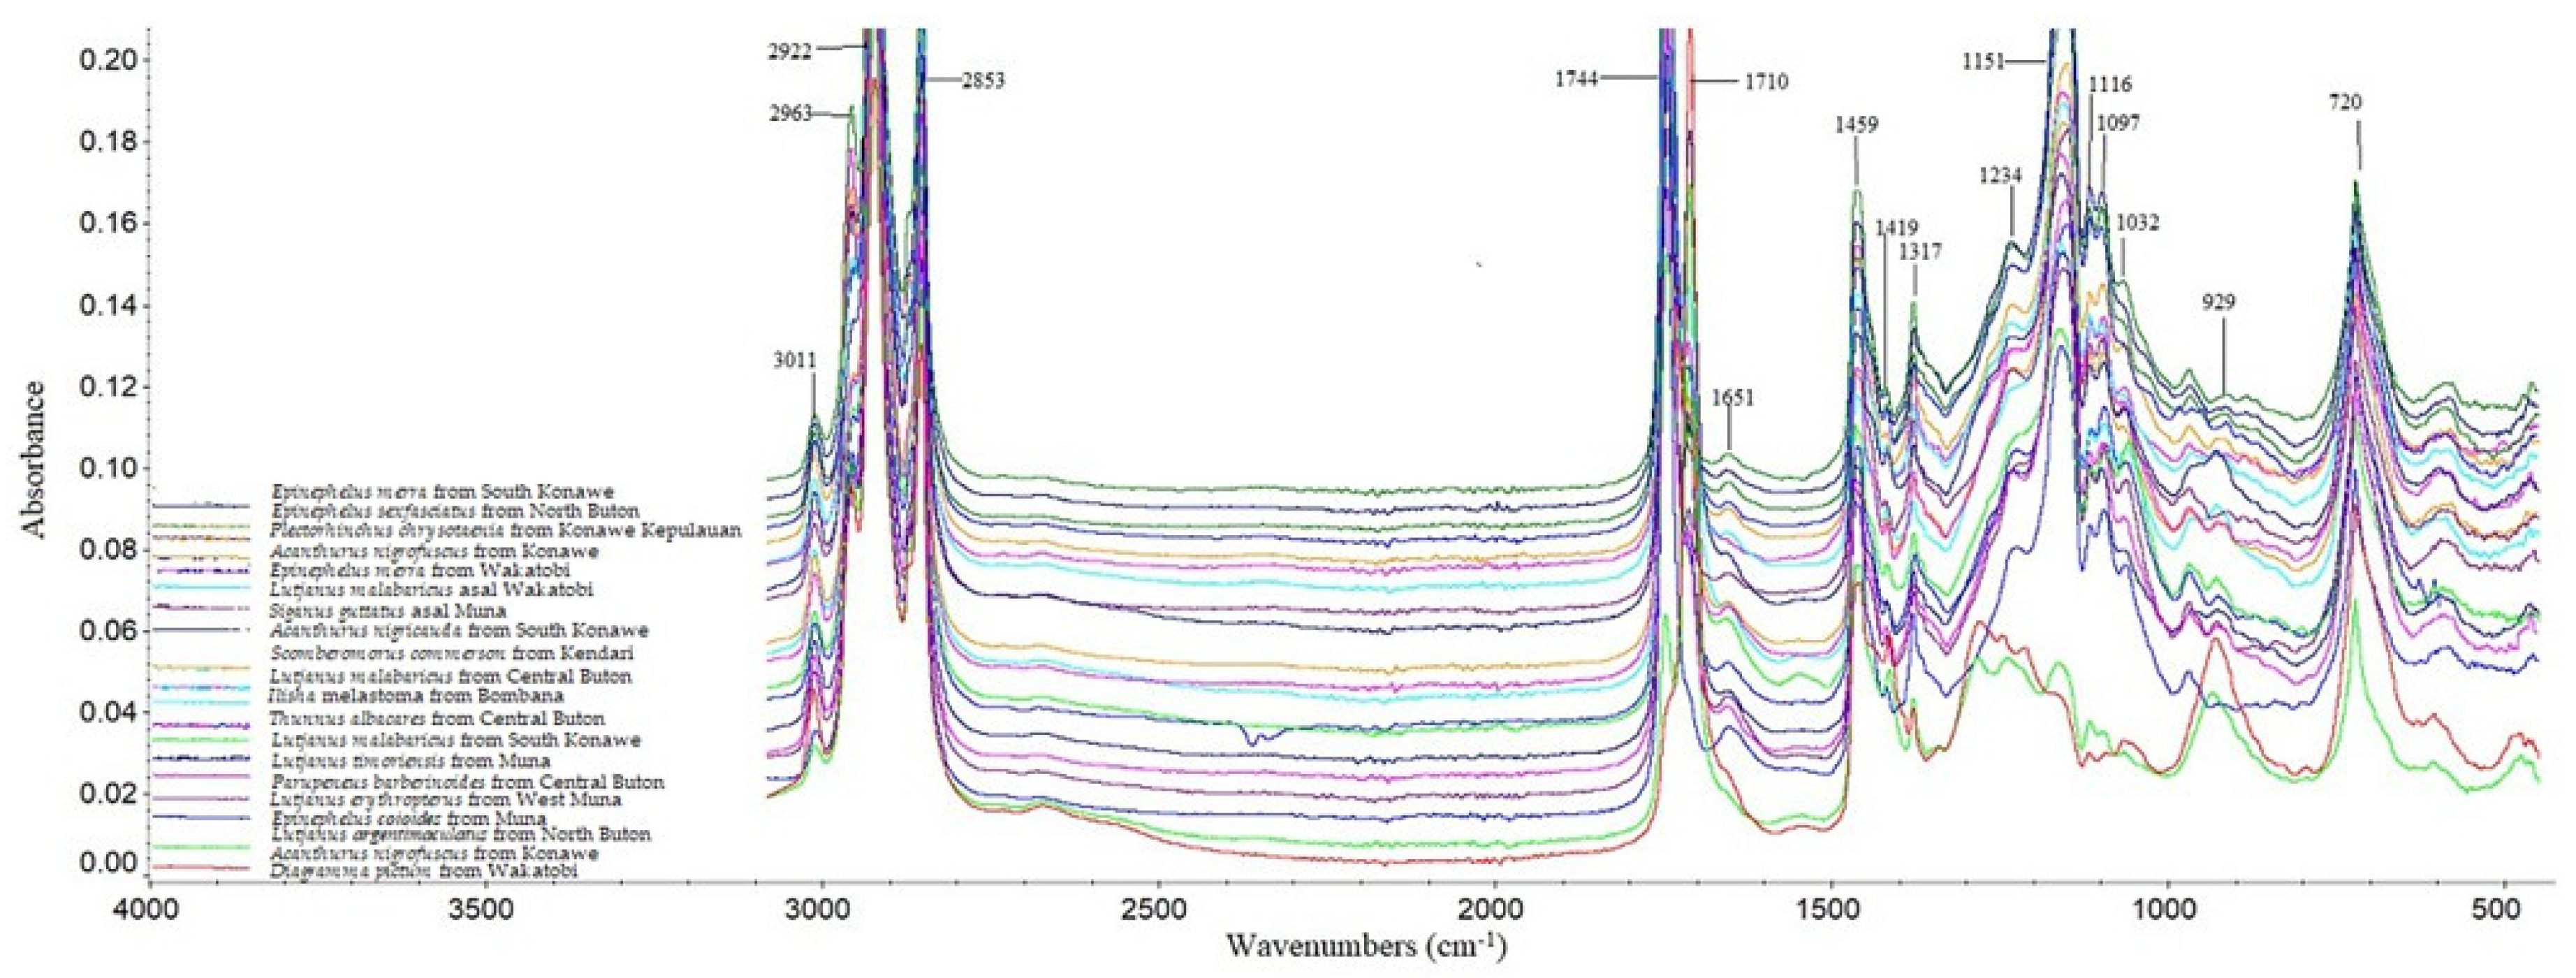
Figure 2.
The correlation between actual value and FTIR spectroscopy predicted values as determined using multivariate regression of partial least square of DHA [A], EPA [B] along with residual analysis [C].
Figure 2.
The correlation between actual value and FTIR spectroscopy predicted values as determined using multivariate regression of partial least square of DHA [A], EPA [B] along with residual analysis [C].
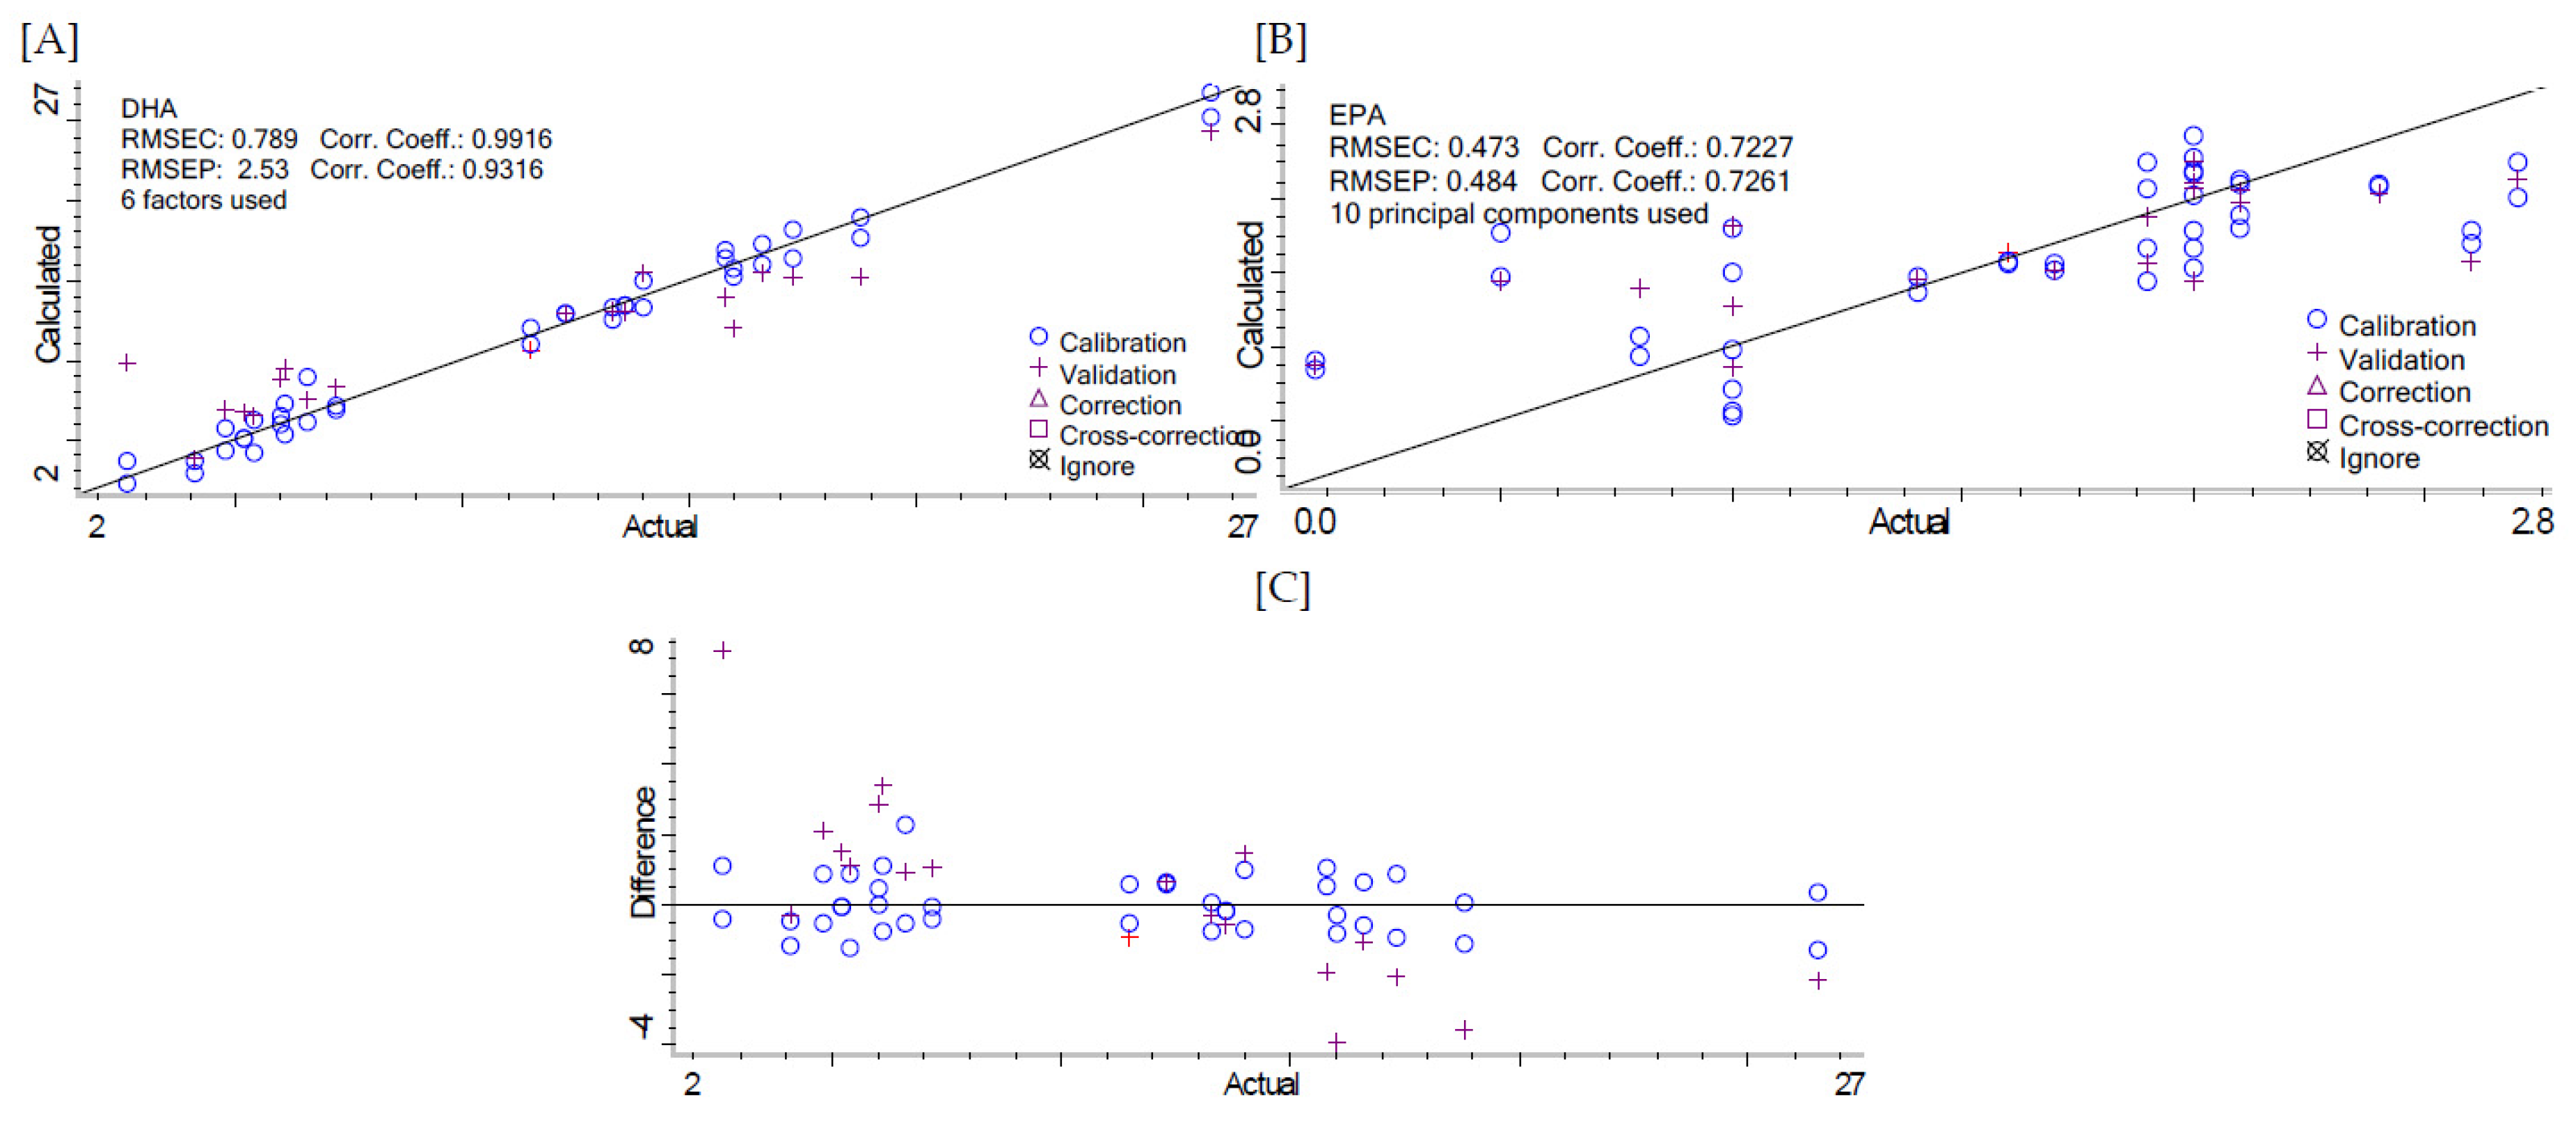

Table 1.
The concentrations of ω-3 in fish oils as determined using gas chromatography with flame ionization detector.
Table 1.
The concentrations of ω-3 in fish oils as determined using gas chromatography with flame ionization detector.
| No. | Samples | Eicosapentaenoate (%) |
Docosahexaenoate (%) |
Eicosatrienoate (%) |
Linolenate (%) |
|---|---|---|---|---|---|
| 1. | Lutjanus malabaricus from South Konawe | 1.6 | 11.5 | 0.4 | 0.5 |
| 2. | Epinephelus merra from South Konawe | 2.0 | 6.6 | 0.6 | 0.5 |
| 3. | Acanthurus nigricauda from South Konawe | 1.0 | 6.0 | 0.3 | 0.2 |
| 4. | Lutjanus timoriensis from Muna | 2.0 | 5.4 | 0.9 | 0.3 |
| 5. | Siganus guttatus asal Muna | 1.9 | 13.3 | 0.1 | 0.8 |
| 6. | Lutjanus erythropterus from West Muna | 2.4 | 15.8 | 0.1 | 0.2 |
| 7. | Epinephelus sexfasciatus from North Buton | 1.0 | 6.1 | 0.1 | 0.4 |
| 8 | Lutjanus argentimaculatus from North Buton | 1.0 | 4.8 | 0.1 | 1.0 |
| 9 | Lutjanus malabaricus from Central Buton | 2.7 | 18.8 | 0.2 | 0.4 |
| 10 | Parupeneus barberinoides from Central Buton | 2.0 | 14.0 | 0.2 | 0.5 |
| 11 | Thunnus albacares from Central Buton | 1.9 | 12.3 | 0.3 | 0.4 |
| 12 | Ilisha melastoma from Bombana | 1.4 | 5.2 | 0.6 | 0.7 |
| 13 | Plectorhinchus chrysotaenia from Konawe Kepulauan | 0.5 | 16.0 | 4.1 | 0.5 |
| 14 | Acanthurus xanthopterus from Konawe | 0.8 | 2.6 | 1.0 | 0.4 |
| 15 | Acanthurus nigrofuscus from Konawe | 2.6 | 4.1 | 4.9 | 1.2 |
| 16 | Scomberomorus commerson from Kendari | 2.1 | 16.6 | 0.1 | 0.5 |
| 17 | Epinephelus merra from Wakatobi | 2.0 | 17.3 | 0.4 | 0.3 |
| 18 | Epinephelus coioides from Muna | 0.1 | 7.2 | 0.3 | 0.4 |
| 19 | Lutjanus malabaricus asal Wakatobi | 1.7 | 13.6 | 0.5 | 0.3 |
| 20 | Diagramma pictum from Wakatobi | 2.1 | 26.5 | 0.2 | 0.3 |
Table 2.
The statistical performance of FTIR spectroscopy combined with multivariate regressions for the correlation modeling between actual values of DHA and predicted values.
Table 2.
The statistical performance of FTIR spectroscopy combined with multivariate regressions for the correlation modeling between actual values of DHA and predicted values.
| Multivariate Calibrations | Wavenumbers (cm-1) |
Spectra | Calibration | Validation | ||
|---|---|---|---|---|---|---|
| R2 | RMSEC | R2 | RMSEP | |||
| PLS | 4000 – 600 | Normal | 0.8736 | 2.97 | 0.8605 | 3.23 |
| First derivative | 0.9699 | 1.49 | 0.9476 | 1.96 | ||
| Second Derivative | 0.9916 | 0.789 | 0.9316 | 2.53 | ||
| 1800-600 | Normal | 0.8785 | 2.92 | 0.8723 | 3.06 | |
| First derivative | 0.4930 | 5.32 | 0.4141 | 5.58 | ||
| Second Derivative | 0.5092 | 5.26 | 0.4135 | 5.59 | ||
| 1800-900 | Normal | 0.9330 | 2.20 | 0.9298 | 2.46 | |
| First derivative | 0.4691 | 5.40 | 0.3845 | 5.67 | ||
| Second Derivative | 0.4865 | 5.34 | 0.3967 | 5.64 | ||
| 2997-2806 and 1800-900 | Normal | 0.4709 | 5.39 | 0.3777 | 5.68 | |
| First derivative | 0.4836 | 5.35 | 0.3901 | 5.65 | ||
| Second Derivative | 0.4905 | 5.33 | 0.3951 | 5.64 | ||
| PCR | 4000 – 600 | Normal | 0.8946 | 2.73 | 0.8813 | 3.12 |
| First derivative | 0.7851 | 3.79 | 0.7756 | 3.86 | ||
| Second Derivative | 0.8070 | 3.61 | 0.7493 | 4.13 | ||
| 1800-600 | Normal | 0.9055 | 2.59 | 0.8961 | 2.93 | |
| First derivative | 0.8697 | 3.02 | 0.8699 | 3.02 | ||
| Second Derivative | 0.7617 | 3.96 | 0.6472 | 4.68 | ||
| 1800-900 | Normal | 0.8261 | 3.44 | 0.8191 | 3.59 | |
| First derivative | 0.8569 | 3.15 | 0.8337 | 3.38 | ||
| Second Derivative | 0.7555 | 4.00 | 0.6319 | 4.76 | ||
| 2997-2806 and 1800-900 | Normal | 0.8640 | 3.08 | 0.8602 | 3.19 | |
| First derivative | 0.7598 | 4.97 | 0.7260 | 4.21 | ||
| Second Derivative | 0.7241 | 4.21 | 0.6073 | 4.88 | ||
*the selection condition was marked with bold
Table 3.
The statistical performance of FTIR spectroscopy combined with multivariate regressions for the correlation modeling between actual values and predicted values of EPA.
Table 3.
The statistical performance of FTIR spectroscopy combined with multivariate regressions for the correlation modeling between actual values and predicted values of EPA.
| Multivariate Calibrations | Wavenumbers (cm-1) | Spectra | Calibration | Validation | ||
|---|---|---|---|---|---|---|
| R2 | RMSEC | R2 | RMSEP | |||
| PLS | 4000 – 600 | Normal | 0.4812 | 0.600 | 0.4435 | 0.619 |
| First derivative | 0.3076 | 0.651 | 0.3871 | 0.640 | ||
| Second Derivative | 0.4474 | 0.612 | 0.5079 | 0.603 | ||
| 1800-600 | Normal | 0.2479 | 0.663 | 0.3567 | 0.652 | |
| First derivative | 0.2022 | 0.670 | 0.1889 | 0.672 | ||
| Second Derivative | 0.2123 | 0.669 | 0.1850 | 0.673 | ||
| 1800-900 | Normal | 0.2567 | 0.661 | 0.3658 | 0.650 | |
| First derivative | 0.1874 | 0.672 | 0.1733 | 0.674 | ||
| Second Derivative | 0.1808 | 0.673 | 0.1615 | 0.676 | ||
| 2997-2806 and 1800-900 | Normal | 0.3099 | 0.651 | 0.3487 | 0.644 | |
| First derivative | 0.2843 | 0.656 | 0.3600 | 0.646 | ||
| Second Derivative | 0.2978 | 0.653 | 0.3621 | 0.645 | ||
| PCR | 4000 – 600 | Normal | 0.6644 | 0.512 | 0.5303 | 0.656 |
| First derivative | 0.6818 | 0.501 | 0.6271` | 0.543 | ||
| Second Derivative | 0.7227 | 0.473 | 0.7261 | 0.484 | ||
| 1800-600 | Normal | 0.6537 | 0.518 | 0.6135 | 0.553 | |
| First derivative | 0.6563 | 0.516 | 0.6014 | 0.557 | ||
| Second Derivative | 0.7033 | 0.487 | 0.6939 | 0.506 | ||
| 1800-900 | Normal | 0.6637 | 0.512 | 0.5948 | 0.575 | |
| First derivative | 0.6546 | 0.517 | 0.5957 | 0.561 | ||
| Second Derivative | 0.6891 | 0.496 | 0.6990 | 0.496 | ||
| 2997-2806 and 1800-900 | Normal | 0.6692 | 0.509 | 0.5819 | 0.589 | |
| First derivative | 0.6874 | 0.497 | 0.6276 | 0.547 | ||
| Second Derivative | 0.6757 | 0.505 | 0.6849 | 0.502 | ||
*the selection condition was marked with bold
Table 4.
Comparison of the analytical methods between previous study and the current study for analysis of EPA and DHA.
Table 4.
Comparison of the analytical methods between previous study and the current study for analysis of EPA and DHA.
| No. | Samples | Previous methods | Ref. | Advantages of the current study |
|---|---|---|---|---|
| 1. | Analysis of EPA and DHA in fish oil capsules | GC-MS (gas chromatography-mass spectrometry) a using capillary column RTX-5SM (60 m x 0.25 mm, layer thickness 0.25 μm) | [23] | No need for sample derivatization, lower in cost, more efficient, and require minimum solvent |
| 2. | Analysis of EPA and DHA in fish oil nutritional capsules | GC-MS using a high-resolution DB-5MS capillary column (thickness: 0.25 μm, length: 30 m, diameter: 0.25 mm) | [6] | No need for sample derivatization, faster, low cost, more efficient, and require minimum solvent |
| 3. | Analysis of EPA and DHA in fish oil capsules | GC-MS using a column of PE-FFAP (nitroterephthalic acid modified polyethylene glycol, PEG bonded) | [24] | No need for sample derivatization, faster, low cost, more efficient, and require minimum solvent |
| 4. | Analysis of EPA and DHA in fish | GC-FID using a high polarity of capillary column (GC HP-88 column (60 m length, 0.25 mm ID, 0.2 μm) | [5] | No need for sample derivatization, faster, low cost, more efficient, and require minimum solvent |
| 5. | Analysis of EPA and DHA in Fish Oils | 1H-NMR (500 MHz) spectrometer | [25] | Minimum sample preparation steps, faster, low cost |
| 6. | Analysis of EPA and DHA in encapsulated marine fish oil supplements | 1H-NMR and 13C-NMR (850 MHz) spectrometer | [26] | Minimum sample preparation steps, faster, low cost |
| 7. | Analysis of EPA and DHA in fish oil supplements | 1H-NMR and 13C-NMR (850 MHz) spectrometer | [27] | Minimum sample preparation steps, faster, low cost |
| 8. | Quantification of total omega 3 and omega 6 in human plasma | LC-MS/MS reverse-phase using a C18 column (Acquity UPLC 100 × 2.1 mm, 1.7 µm BEH C18 column) | [28] | Minimum sample preparation steps, faster, low cost, efficient |
| 9. | Analysis of EPA and DHA in biological samples | LC-MS/MS reverse-phase using a C18 column (50 mm, 4.6 mm, 5 µm) | [8] | Minimum sample preparation steps, faster, low cost, efficient |
| 10. | Analysis of EPA and DHA in human plasma | HPLC-ECD (electrochemical detector) using a Develosil C30-XG-3 | [29] | Minimum sample preparation steps, faster, low cost, efficient |
Disclaimer/Publisher’s Note: The statements, opinions and data contained in all publications are solely those of the individual author(s) and contributor(s) and not of MDPI and/or the editor(s). MDPI and/or the editor(s) disclaim responsibility for any injury to people or property resulting from any ideas, methods, instructions or products referred to in the content. |
© 2023 by the authors. Licensee MDPI, Basel, Switzerland. This article is an open access article distributed under the terms and conditions of the Creative Commons Attribution (CC BY) license (http://creativecommons.org/licenses/by/4.0/).
Copyright: This open access article is published under a Creative Commons CC BY 4.0 license, which permit the free download, distribution, and reuse, provided that the author and preprint are cited in any reuse.


