Submitted:
27 April 2023
Posted:
28 April 2023
You are already at the latest version
Abstract
The assessment of disability related costs among children remains a largely under-researched subject with related questions rarely included in surveys. This paper addresses this issue through a unique mixed methods study conducted in the Philippines combining a nationally representative survey and in-depth interviews with families and health professionals. To quantify the extra costs associated with disability the research used the standard of living approach, whereby expenditure levels of families with children with and without disabilities are compared in relation to different measures of living standards. The results find consistent evidence of high extra costs among households that have children with disabilities and point to health expenses as the leading source. Using an asset index as the indicator of living standards, a child with disability is estimated to require between 40 and 80% extra expenditure to reach the same living standard of other children. However, the size of extra costs is substantially higher when the measure of standard of living relies on a broader set of deprivations. In such cases, higher estimates of extra costs are likely to be the result of the lack of an inclusive environment. Critically, this points to the need not only to provide financial support, but also inclusive services, especially in health and education.
Keywords:
disability
; children
; extra costs
; standard of living
; Philippines
1. Introduction
This paper reports findings from a mixed methods study to calculate the additional costs experienced by households with children with disabilities in the Philippines. This included both actual costs and estimates of hypothetical costs based on unmet household needs. Although it is accepted that households of children with disabilities face additional costs when compared with households with children without disabilities, these costs had not previously been quantified in the Philippines. The lack of robust data on additional costs has been a barrier to government establishing social protection policies and interventions targeting households with children with disabilities.
The research was commissioned by the Department of Social Welfare and Development (DSWD), Government of the Philippines in partnership with the United Nations Children’s Fund (UNICEF) with support from Australia’s Department of Foreign Affairs and Trade (DFAT). Although the research was initiated in 2019, data collection was not conducted until 2021-2022 due to COVID-19 restrictions. Human ethics approval was obtained from the University of Melbourne’s School of Population and Global Health Human Ethics Advisory Group (No. 2021-21437-20298-4).
The research focused on measurement of what Amartya Sen calls the ‘conversion gap’, whereby persons with disabilities incur higher expenses to achieve the same outcomes as persons without disabilities [1]. The extra costs incurred were measured using the Standard of Living (SOL) approach, which recognizes persons with disabilities spend additional money to address disability-related needs [2]. This additional expenditure results in a standard of living lower than expected based solely on the individual or household’s income level [3]. For example, a household with a person with disabilities and a household without a person with disabilities with the same income level and similar characteristics, such as location and household size should have a similar standard of living. If the two households do not, the difference is attributable to disability-related costs [4].
The SOL approach has been used to understand disability related costs in several countries, including the United Kingdom, China, Vietnam, and Cambodia [2,5,6,7,8,9,10]. Previous standard of living studies found that extra costs associated with disability varied by severity of impairment, employment status, and gender [3]. Higher extra costs associated with disability have been identified in urban areas compared to rural areas [7].
The literature indicates three main limitations associated with the SOL approach [3,4,11]. Firstly, the approach often uses available data, which means that measures of standard of living are confined to datasets that rarely include disability-related expenditure, for example expenditure on assistive devices and their maintenance. Further, measures of standard of living often use household asset indexes and subjective observations of living conditions. Secondly, the approach is an indirect method to estimate extra costs and while it does estimate the overall extra cost, it does not identify the specific items that make up the extra costs. Consequently, the approach provides limited detail to inform policy decisions. Thirdly, there is a risk of underestimating disability related costs. This is because the approach assumes that living standards can be achieved or improved through a higher disability expenditure, without delving deeper into the question of access and affordability of disability services. The achievement of improved living standards by persons with disabilities can be constrained if they do not incur disability specific expenses, which in turn results in unmet basic needs and exclusion. In other words, relying solely on what people spend results in an under-estimation of costs required if people face barriers to accessing services, services do not exist, or there is an inability to pay.
This study addressed these limitations by collecting additional data on alternative measures of standard of living, in addition to commonly used measures, and data on disability-related expenditure. The study also assessed the driving factors of extra costs from differences in consumption patterns. Moreover, the study was not limited to the calculation of an average extra cost and tested changes in disability related costs at different levels of living standards, partially resolving the underestimation issue due to inability to pay, but not necessarily the absence of services.
Data was collected through a nationally representative household survey and compared standard of living and well-being indicators between households with and without children with disabilities. Survey design, including refinement of cost categories and sampling frames, was informed by qualitative interviews with government, representative organizations, and families of children with disabilities. Post-survey qualitative interviews with families of children with disabilities provided context and informed interpretation of findings. Qualitative interviews were conducted with allied health professionals to understand potential unmet needs and related costs for different impairment types and health conditions. Interviews with allied health professionals addressed the issue that families of children with disabilities often had low awareness of health service availability. As such, families were not in a position to estimate the full extent of health related costs and benefits based on their child’s individual needs.
2. Materials and Methods
2.1. Guiding principles
The understanding the study is based on is depicted in Figure 1 and follows two assumptions. Firstly, while the measurement of living standard must be independently constructed from monetary values, we expect a positive relationship between standard of living and consumption expenditure. That is, the higher the expenditure, the higher the standard of living achieved. Secondly, the extra cost of disability is assessed in relation to a control group of households with children without disabilities. This allows extra costs to be assessed by comparing households with and without children with disabilities at the same welfare level.
The approach remains an assessment of extra costs within the constraints of what money can buy in the country under analysis. This is also influenced by the compromises that every household must make when they face budget constraints. What money can buy depends not only on the availability of services and their accessibility, but also on prevailing attitudes, behaviors, and social norms. For example, a child with disabilities might not be attending school because there is no school providing the support and assistance required for her/his attendance. Or a child might not be attending school because the parents feel ashamed of taking their child to school or bullying at school makes attendance impossible.
In applying Figure 1 we do not make any assumption on how the level of extra costs changes as we move from low to high living standards (regardless of what is depicted in Figure 1). The level of extra costs could be decreasing, stable, or increasing and is assessed during analysis. In the case of a proportional increase in the extra costs from low to high living standards, the needs of a child with disabilities can be expressed in terms of a multiplier of the needs of other children without disabilities. This multiplier can be used to adjust the equivalence scales for household level aggregates and poverty estimates.
2.2. Household survey design
The household survey was designed to collect information across what UNICEF summarizes as the four main pillars of child rights based on the UN Convention on the Rights of the Child with a specific focus on the first two pillars as presented below [12]:
- The right to survival, including adequate nutrition, healthcare, water and sanitation, and a safe place to live.
- The right to development, which includes access to quality education.
- The right to protection, including the safety of the child within the home and community.
- The right to participation, including the participation of the child in daily activities.
The household questionnaire collected information on household composition, functional difficulties of household members (using Washington Group Short Set for adults and the two Child Functioning Modules for children of different age groups), housing characteristics, school attendance, access to health services, employment and entrepreneurial activities, transfers and other incomes, consumption expenditure, and other well-being indicators. Questions about the use of the disability identification (ID) card, assistive technology, and special education were asked to relevant households based on earlier responses.
Supplementary data was collected by key informant interviews in the survey locations. Key informants were representatives of the municipality Persons with Disabilities Affairs Office and barangay captain. Information was collected on community characteristics and availability and location of services at municipality and community levels. Prices of a sample of items were also collected through visits to local shops.
The household survey was conducted between November 2021 and June 2022 with some delays from obtaining information about the lists of children with a disability ID card from Local Government Units (LGUs).
2.3. Sampling frame
The household survey used a nationally representative sample of households with children who have a disability ID card and a comparison sample of households with children without a disability ID card in the same areas. Both groups of households were administered the same questionnaire.
The sampling frame was based on official lists of children with disabilities in possession of a disability ID card obtained from LGUs. The children with disabilities were then selected by systematic random sampling. Locations (barangays) were randomly selected using probability proportional to population size in four main strata: the national capital region (NCR), and the three main groups of islands: Luzon, including the Mimaropa region, Visayas, and Mindanao. Overall, 240 locations were sampled across all 17 regions of the Philippines and involving fieldwork in 69 out of the 82 provinces.
The comparison group was sampled in relation to the households with children with disabilities from all households with children in the same block by systematic random selection. Across both groups, a total number of 2,753 interviews were successfully completed. The use of sampling weights (the inverse of the probability of selection) for the sample of children with a disability ID card provides an estimate of the overall number of children who have a disability ID card in the Philippines. The comparison group of children without a disability ID card was not drawn to be representative of all children without a disability ID card (or disability) in the country, but as a control group of children living in the same locations.
2.3. Disability measures
We used different proxies to capture the measurement of disability. These were children with a disability ID card, including listed disability type, and severity of functional difficulties based on the UNICEF Washington Group child functioning questions for both age ranges. Adults in households were also asked the Washington Group Short Set of questions.
In terms of Washington Group question responses, we consider children with disabilities to be all children for whom the carer reports at least some functional difficulty. As standard, the responses across the different functional domains were ‘no difficulty’, ‘some difficulty’, ‘a lot of difficulty’ and ‘cannot do at all’. While it has been customary to use the ‘a lot of difficulty’ cutoff to indicate disability in censuses and surveys, many carers of children with a disability ID card reported the child experienced ‘some difficulty’ only.
In analysis, we separated cases where the difficulty is reported as ‘some difficulty’, signaling a milder disability, and others where the disability is likely to be more severe (a lot of difficulty or cannot do at all).
2.4. Calculation of extra costs
We calculated extra costs using a regression model of non-monetary measures of standard of living over consumption expenditure, a measure of disability, and other control variables. Control variables included geographical location, age of household head, and size/type of households. The general regression model was as follows:
where: “LivStd” is the non-monetary living standard measure. “ln(cons)” is the household-level consumption expenditure expressed in logarithmic terms. “dis” captures disability (the presence of a child with disabilities, the severity of disability, etc). “HHtype” identifies household of different composition.
We used three alternative measures of standard of living: subjective assessments of living standards, household asset indexes, and measures of non-deprivation. The subjective assessment relied on the following question: “Please imagine a ladder with ten steps. The first represents the poorest in society and the tenth represents the richest. On what step of the ladder would you be?”. Answers have been reclassified in three groups: low for the first three steps, middle from the fourth to the sixth and high for the remaining steps. The asset index included both dwelling characteristics (quality of walls, access to drinking water, sanitation, size of dwelling, and tenure) and assets (ownership of car, motorbike, stove, fridge, personal computer, television and smart phone). It was estimated using polychoric principal component analysis, which is theoretically superior than simple principal component analysis when there are many categorical variables [see[13] ]. The value of the coefficients of the asset index are reported in the appendix. Finally, the measure of non-deprivation was based on indicators used in the multi-dimensional poverty measure developed by the Philippines Statistical Authority [14]. This includes indicators in four main dimensions: health and nutrition, housing, education, and employment, which have been adapted to focus on children. More specifically the indicators cover lack of adequate access to sanitation, water, shelter, tenure, electricity, information and communication technologies, education, and food security in line with the World Food Programme’s food consumption score [15]. The overall indicator used counted the number of non-deprivations.
The value of consumption was expressed in logarithmic terms and, as such, the disability extra cost at the household level and in terms of ratio was computed using the following expression:
where the coefficients of β are, respectively, that of disability in the numerator and that of the logarithms of consumption in the denominator.
Importantly, the above expression is at the household level and is affected by average household size and number of household members with disabilities. For example, if comparing extra costs across countries, costs will be lower in countries with larger households. For this reason, in OECD countries when using the standard of living approach, it is common to estimate the above equations using single member households or singling out households composed exclusively of persons with disabilities [2,16]. Nevertheless, assuming a simple per capita approach in moving from household to person level consumption expenditure, the extra cost per person with disabilities can be computed as follows:
A household level extra cost of 10% where there is one household member with disability and a household size of four members implies a disability extra cost of 40% for the household member with disabilities.
2.5. Qualitative data collection
An induction visit included consultations with key stakeholders, including home visits of families of children with disabilities, in Metro Manila and surrounds. Preliminary semi-structured interviews informed the household survey design. Participants were a convenience sample of seven households with children with disabilities and a representative of a parents’ association identified through Life Haven Centre for Independent Living’s, an organization of persons with disabilities (OPD), networks. Due to COVID-19 restrictions, interviews were by video call. Participants included households with more than one child with disabilities and from outside of Manila. Topics were expenses incurred; hypothetical, including for assistive products or specialized health services; opportunity costs of care, including forgone income; social participation by carers, opportunities for play and social interaction by the child.
Following the household survey, in person interviews were completed with twenty-nine households with children with disabilities. Participants were purposively selected from survey respondents to explore unmet needs in emerging priority areas from household data of foregone health services, assistive products, home adaptations and accessibility, non-enrollment in school, and support needs of parent or primary carer. As noted, supplementary interviews with eight allied health professionals were completed. This included audiologist, neurologist, occupational therapist, speech therapist, orthotist, and physiotherapist. Estimates of costs by these professionals were based on health conditions most frequently seen by the professional and ideal available treatment from birth to adulthood.
2.6. Qualitative data analysis
Interview transcripts were transcribed and translated into English language from Tagalog and/or local languages. Transcripts were inputted into NVivo software for coding and thematic analysis. A sample of transcripts were coded by two researchers and compared to produce a common code list. Initial deductive analysis was guided by the research objectives and interview guide themes. Sub-themes were identified through inductive analysis and themes adjusted as needed. Differences in interpretation were resolved by logical reasoning and discussion. No major differences of interpretation were noted.
Responses from allied health professionals were transcribed into a standard Excel format. Cost data was used to produce composite stories to illustrate potential costs associated with different health conditions. Final stories were validated by a research colleague who is a practicing pediatric occupational therapist and project stakeholders in the Philippines.
3. Results
The survey estimated that there are 325,000 children with a disability ID card in the Philippines, but also that there are many other children with functional difficulties without a disability ID card. In summary, findings show families with children with disabilities experience systematic disadvantage in comparison to families with children without disabilities. Highest rates of disadvantage were found among children with disabilities who did not have a disability ID card. The highest additional costs were on health expenditure with families of children with disabilities spending three times more than other families. Depending on the severity of disability, a child with disabilities in the Philippines requires 40% to 80% higher expenditure to reach the same standard of living as a child without disabilities. Recognizing the extra costs of disability implies that poverty rates among households with children with disabilities are at least 25% higher than what ignoring these extra costs would reveal. After taking the extra costs into account households with children with disabilities have poverty rates (percentage of poor) that are 50% higher than those of other households with children.
3.1. Quantitative findings
Table 1 reports the distribution of household types separating households with at least one child with functioning difficulties and households with children without disabilities. The table also shows the average number of children with functional difficulties in households with at least one child with functional difficulties. Nuclear families, or households composed exclusively of parents and children, represent almost two thirds of all households with children. Other households are three generation households, with grandparents, and complex household types, for example where the parents’ siblings are present or parents of at least one of the children are not in the household. There are not large differences between household types with or without children with disabilities; however, within nuclear family households with children with disabilities there tend to be more children. The average number of children with disabilities in the household is 1.16.
Table 2 shows basic descriptive statistics for households with and without children with disabilities and separates nuclear families from other types of households. All main variables used in the analysis are included: consumption expenditure in logarithm terms, the age of the household head, the household size, the location of the household and then the three variables chosen to capture the living standards. These are the asset index, the number of deprivations, and self-reported poverty position.
3.2. Regression results
Several regressions were estimated restricting the sample to certain household types, using different measures of disability (ownership of disability card and functional difficulty) and different measures of living standards. The results that prove more consistent and where it is easier to derive the extra cost for a child with disabilities comes from the sample of nuclear families (two thirds of our sample) and use of functional difficulties, including the advantage of being able to distinguish the severity of disability by reported difficulty.
Results of the regressions are reported in Table 3 together with the estimated implications of proportional extra expenditure required by the household with a child with disability to reach the same living standards of other households.
In all three models, consumption expenditure is positively correlated with the living standard measure and highly significant. Also, as predicted, the measure of disability has negative coefficients, which are consistently highly significant in the case of moderate/severe functional difficulties and smaller and with lower degree of accuracy in the case of milder functional difficulties. In terms of other explanatory variables, significant variables are similar across the asset index model and the number of deprivations model but differ in terms of the self-reported position in society model. This latter model also has a very low explanatory power suggesting a significant level of inaccuracy in the values reported for this question.
Estimates of the proportional higher expenditure incurred by families with a child with disability are different when we compare the results using the asset index coefficients and the other two models. Across all models, moderate/severe functional difficulties involve twice as much extra expenditure compared to milder functional difficulties. Much higher differences in expenditure are obtained from the models using deprivations and position in society compared to the asset index.
The proportional extra expenditure reported in Table 3 is at the household level, and estimating this at the level of the child requires making some further assumptions. In the Philippines when computing poverty estimates, income and consumption measures are simply divided by the household size. Therefore, in the case of the model using the asset index as the indicator of living standards, transforming the household level extra cost of 19% when there are children with moderate/severe functional difficulties means that the extra expenditure per child with functional difficulties can be estimated dividing by the ratio of the average number of such children and the average household size. This results in an estimate of approximately 80% extra expenditure.
Based on the estimate of extra expenditures above, we can assume that the equivalence scales for a child with moderate/severe functional difficulties is 1.8, and that for those with milder functional difficulties is 1.4. Using these equivalence scales in computing an adjusted measure of consumption results in significantly increasing poverty measures for such households. In our sample, poverty estimates for households with children who have functional difficulties increase by more than 25% relative to estimates that do not take into account the extra costs faced by children with disabilities, so that when comparing poverty rates of households with children with disabilities and other households with children their poverty rate is about 50% higher.
Analysis of consumption patterns across families with and without children with disabilities clearly showed the main sources of extra costs. The share of household budget spent on health by households with a child with disabilities is three times higher than for households with children without disabilities. Moreover, even though one third of children with disabilities are not enrolled in school, the share of education expenditure is higher among families with children with disabilities compared to other households with children. Other costs frequently cited to be higher for people with disabilities are transportation costs. This was clearly identified in qualitative interviews, but significant differences were not found in the quantitative survey. Alongside what may be prohibitive transportation costs for some, the timing of the fieldwork may have been a contributing factor as movements were restricted because of lockdowns and school closures.
3.3. Health expenditure
As shown from household survey data, highest costs related to health. Reported cost items from qualitative interviews included routine and specialist consultations, surgery, maintenance medicines, nutitional supplements, and the sourcing, fitting and maintenance of assistive devices. These were additional to the routine health costs experienced by children with and without disabilities. Highest reported costs were for specialist diagnoses and surgery at tertiary facilities, with costs in the tens of thousands of (US) dollars reported. Routine check ups were a significant source of expenditure with frequent visits (up to three times a week) to multiple specialists.
Medications were noted as the highest cost for households of children with chronic health conditions. A few respondents could source cheaper medicines, including directly from manufacturers or through contacts with medical professionals or local politicians. Vitamin supplements were commonly prescribed and expensive. Further costs included purchase of blenders, and electricity, and time and expense of individually prepared food. While an example of the use of feeding tubes was reported, simple assistive products were rarely used. For example, feeding chairs to support a child while eating.
Overall, knowledge of assistive products and devices was low. Parents often became aware of assistive products through informal sources or by chance. For example, through seeing another person using a product, including on Tik Tok. Families reported being unable to, or assumed they were unable to, afford assistive products. A family described paying significant optometrist fees and then being unable to afford the recommended glasses. Use of one assistive product did not preclude unmet needs for other products. The appropriateness and safety of existing assistive products was questioned, and costs of maintenance and replacement noted. Information was also scarce. For example, parents of a child who had outgrown her prosthetic leg did not know how to contact the charity that provided it. Buying assistive products from online market places was noted as was the use of second hand products. The use of homemade assistive products, such as canes and handrails from wood or bamboo was reported.
3.4. Adaptations to home
Adaptations to homes reduce physical barriers and promote independent use of the home by the child. Few families had adapted their homes. Adaptations were difficult in rented accomodation as they required landowner’s consent and making adaptations was often not prioritised in the face of competing demands for financial resources and time.
Reported adaptations included installing a new toilet, installing a concrete floor to aid mobility, and constructing a sleeping platform. A family reported they were rebuilding their home to provide additional space and privacy for their child. Another example was a family who wanted to install child-safe electrical sockets for their child but had not yet been able to do so. Other adjustments included purchase of mattress toppers and installation of air conditioning. Another family explained how they kept lights in their house on to assist their child with low vision. Costs of electrical bills for the air conditioner and lighting examples were considered very high.
3.5. Costs of education and learning
Not all children were enrolled in school. Among children aged 5 to 17 with a disability ID card and at least some functional difficulties enrollment was 66%, whereas enrolment among children without functional difficulties and without disability ID card was 96%. Additional costs of attending school for children with disabilities included higher fees for some special education (SPED) schools, noting the Philippines does not yet have a comprehensive system of inclusive education, and the need for a shadow, or support, teacher. Examples of the costs of a shadow teacher needing to be shared between families were reported.
Costs of travel were cited as a frequent concern across all domains, but particularly for daily school attendance. This included having to travel further to access a school with a SPED programme or, simply, to a school that would accept their child. Accompanying a child to and from school increased expenditure on public transport as well as opportunity costs of forgone work with some parents staying at the school throughout the day to support their child. A lack of reasonable accomodation was reported with simple adjustments not implemented, such children with visual impairments being seated at the back of a class. Administrative barriers to annual reenrollment each year, such as being asked to provide medical certificates, were noted.
Social costs included bullying by pupils and parents without disabilities. For example, bulling by a parent who could not accept a child with disabilities could perfom better than their child without disabilities. Also, an incident of physical assault by a teacher on a child with disabilities that led to the parents’ withdrawing their child from school. Limited social interaction and opportunities for play were reported, including parents not allowing their child outside for fear they may become sick. Overall, there was limited expenditure on play items, but the use of downloaded or online games for mobile devices was noted.
During COVID-19, remote learning was not provided by all schools. Families accessing remote learning paid extra for modules and tests. It was noted that the modules could leave a child under stimulated and bored. The example of a child with psychosocial disability attending a private SPED school was noted ads the household’s ‘heaviest expense’. The school reduced fees under COVID-19, but any savings were offset by having to buy a laptop and accessories for online learning.
3.6. Costs of care
Costs of care included financial and non-financial costs, including forgone social or economic opportunities. Care was predominantly, but not exclusively, provided by women. Primary and secondary carers included siblings, grandparents, and other family members. Care could be provided to more than one child with disabilities in a household. Among households with children with moderate/severe functional difficulties, in 24% of cases there was more than one child with functional difficulties. Qualitative interview responses shed further light on care. For example, two households had hired an outside carer at one point. In one case the cost had been paid by a relative and in the other the household could not afford to continue paying the carer. Absent parents with no further contact with the child or family were reported. Carers emphasised their role was not ‘baby sitting’ and was a full-time support role. Older carers were concerned over the future of the child with disabilities that would survive them.
No carers reported receiving emotional support for themselves or respite care. The need for additional support, such as moving a heavier or older, was noted; however, one respondent noted it was hard to trust others to provide this help. Opportunity costs included having to give up work; lost income, such as from selling goods outside of the busiest hours; and moving to lower paid jobs for more flexible work hours. One mother reported having to pay extra for ice to keep her fish fresh for sale while she accompanied her child to school. Work could be missed for extended periods when a child needed health care, particularly for travel to tertiary healthcare facilities. Two people may be needed to assist moving a child adding to travel costs and accompanying siblings miss school. Not having relatives in urban areas could result in additional costs for accomodation and food.
3.7. Allied health costs
Three composite stories were developed to illustrate potental additional health expenditure from birth to 18 years old. These were based on scenarios of ‘full intervention’, including consultations, including with multiple specialists; check-ups; medications; and assistive devices with fitting, maintenance, and replacement. Scenarios were based on services available in the Philippines; however, this does not mean all services were accessible or available in all areas. While households often underestimated these potential costs, allied professionals could overestimate, including overprescribing frequency of consultations, in their calculations. As such, the following are high end cost scenarios.
For a child with spina bifida, total health cost estimates to a family before adulthood could be in the region of USD 39,000. We also considered mulitple impairments. For a child with intellectual disability, autism, and hearing impairment the estimates reached USD 46,500. The scenario for a child with cerebral palsy and epilepsy resulted in an estmate of USD 90,000. Costs vary over time and may increase or decrease with the age of the child. These estimates are costs to the household and assume no health insurance, deductions, or other financial support. Calculations based on actual health expenditure from the household survey are assumed lower and to be based on access to a limited suite of health services.
4. Discussion
High monetary costs exist with large unmet needs. The presence of the latter and the fact that some needs cannot be addressed by money alone is probably behind the different estimates of extra costs in the regression analysis when we use different indicators of living standards. In particular, the measure of standard of living based on the count of deprivations indicates substantial extra costs estimates even though money alone cannot address them. For example, school enrolment rates are considerably lower among children with disabilities than among children without disabilities, and particularly low among children with high support needs (children who have severe difficulties - a lot of difficulty/cannot do at all - with self-care, such as feeding or dressing themselves). Among children with high support needs school enrolment remains only 50% even when the household is in the top quintile of the income distribution. More research could investigate the comparison of SOL estimates of extra costs between different measures of living standards linked to number of deprivations.
Qualitative findings highlight further barriers beyond direct financial costs that influence unmet needs. These include, both limited availability of services and imperfect knowledge of potential support for the child, incomplete understandings of actual needs of the child, stigma, and the challenges of balancing care against the financial and non-financial costs of missed socio-economic opportunities. Access to social networks, better information, and higher incomes could mitigate these issues for some. Regardless, significant challenges were reported by all households of children with disabilities participating in interviews.
Compared to previous research that used the SOL approach, critical to quantifying and understanding disability costs and unmet needs has been the study design with direct questions on disability-related expenses and unmet needs as well as qualitative interviews providing in-depth examples of the challenges faced by children with disabilities and their families. It is only through this more comprehensive assessment of extra costs and unmet needs that it is possible to develop policy solutions. On one hand, the findings of substantial monetary costs justify the creation of social protection instruments, in particular financial support that can address demand costs. However, these are clearly not sufficient, and it is necessary to also ensure specific support through the provision of services in health and education.
5. Conclusions
The findings of the study show that children with disabilities and their families incur very significant extra costs. Even using lower end estimates, the child’s extra costs range from 40 to 80 per cent depending on the severity of the disability. However, as the analysis of deprivations suggests, addressing inequities behind these extra costs and the level of unmet needs requires a range of policy instruments and programmatic interventions.
5.1. Financial support through a disability allowance
Although there are several proposed legislations in Philippines Congress that seek to provide financial assistance targeted to persons with disabilities, the Philippines has no standard disability allowance that is implemented across the country. However, there are local examples, such as in the Bangsamoro region, where since 2020 there has been a monthly stipend of PHP 500 per month for poor persons with disabilities.
Cash transfers that address at least part of the extra costs of disability offer the most flexible policy instrument likely to have direct impact on the child’s well-being and in reducing financial barriers. Specifically, in the Philippines a cash disability allowance would complement the existing discounts provided through the disability ID card, particularly as the latter provide benefits that are unequally distributed. This is especially for people living in rural areas and for those who cannot afford to pay the unsubsidized part of the cost of items and services. Such an allowance could also support access to essential services.
5.2. Expansion of services
The main source of extra costs is currently related to health costs and this could be tackled by expanding the PhilHealth benefit packages to which children with disabilities are entitled. This should be accompanied by extending eligible PhilHealth services from a limited number of tertiary hospitals in urban areas to local levels throughout the country. This could be supplemented by services and information being easily accessible at the community level, including through community-based rehabilitation and inclusive development initiatives.
5.3. Poverty measurement
Monetary poverty measures should be adapted and account for the extra costs of disabilities. This correction is essential to better assess needs and correct the under-estimation of poverty of families with members with disabilities. However, even this correction of monetary poverty indicators is not sufficient and clearly points to the usefulness of monitoring non-income dimensions of poverty, especially in dimensions and measures that are specific for the child or adult with disabilities.
Author Contributions
Conceptualization, L.C., A.R., A.M., and R.A.; methodology, LC (quant) and AR (qual); data and formal analysis, L.C. and B.H. (quant), A.R. and A.M. (qual); ethics, A.R and L.C.; writing—original draft preparation, L.C, A.R, B.H., A.M. and R.A; writing—review and editing, A.R and L.C. All authors have read and agreed to the published version of the manuscript.
Funding
This research was funded and contracted by the United Nations Children’s Fund (UNICEF), including funding from the Australian Department of Foreign Affairs and Trade (DFAT).
Institutional Review Board Statement
The study was conducted in accordance with the Declaration of Helsinki, and approved by the Ethics Committee of the University of Melbourne’s School of Population and Global Health Human Ethics Advisory Group (No. 2021-21437-20298-4).
Informed Consent Statement
Informed consent was obtained from all subjects involved in the study.
Data Availability Statement
Restrictions apply to the availability of data for ethical approval and contractual reasons. Queries should be addressed to the corresponding author.
Acknowledgments
The authors acknowledge the work of Breta Consulting in conducting the household survey and the contributions of Shafique Arif for Data Management and of Fleur Smith and Felix-Kiefel-Johnson for valuable inputs to the qualitative component, particularly concerning allied health.
Conflicts of Interest
R.A. is employed by UNICEF who funded the study. A.M. was involved in advocacy for social protection for families of children with disabilities that led to this study being commissioned by DSWD. The other authors declare no conflict of interest.
Appendix A

Table A1.
Asset index variables and coefficients.
| Variable | First Principal Component Coefficient | |
|---|---|---|
| Walls construction material: | Salvaged | -0.511 |
| Light | -0.126 | |
| Strong | 0.257 | |
| House tenure: | Without consent/papers | -0.369 |
| Rent free | -0.152 | |
| Owned | 0.107 | |
| Water access: | Un-improved | -0.206 |
| Improved | -0.039 | |
| Piped in dwelling | 0.145 | |
| Toilet type: | Un-improved | -0.541 |
| Improved | -0.370 | |
| Flush to tank | 0.041 | |
| Flush to sewer | 0.618 | |
| House squared meters | 0.234 | |
| Car ownership: | No | -0.035 |
| Yes | 0.773 | |
| Motorbike ownership: | No | -0.142 |
| Yes | 0.221 | |
| Stove with oven/gas range: | No | -0.230 |
| Yes | 0.259 | |
| Fridge/freezer ownership: | No | -0.248 |
| Yes | 0.357 | |
| Personal computer ownership: | No | -0.083 |
| Yes | 0.595 | |
| Smart phone ownership: | No | -0.411 |
| Yes | 0.091 | |
| Television ownership: | No | -0.419 |
| Yes | 0.164 | |
References
- Sen, A. The Idea of Justice; Paperback 2010.; Penguin Books: London, 2010; ISBN 978-0-14-103785-1. [Google Scholar]
- Zaidi, A.; Burchardt, T. Comparing Incomes When Needs Differ: Equivalization for the Extra Costs of Disability in the U.k. Review of Income and Wealth 2005, 51, 89–114. [Google Scholar] [CrossRef]
- Banks, L.M.; Pinilla-Roncancio, M.; Walsham, M.; Van Minh, H.; Neupane, S.; Mai, V.Q.; Neupane, S.; Blanchet, K.; Kuper, H. Does Disability Increase the Risk of Poverty ‘in All Its Forms’? Comparing Monetary and Multidimensional Poverty in Vietnam and Nepal. Oxford Development Studies 2021, 49, 386–400. [Google Scholar] [CrossRef]
- Mont, D.; Cote, A.; Hanass-Hancock, J.; Banks, L.M.; Grigorus, V.; Carraro, L.; Morris, Z.; Pinilla-Roncancio, M. Estimating the Extra Costs for Disability for Social Protection Programs. UNPRPD 2022. [Google Scholar]
- Morciano, M.; Hancock, R.; Pudney, S. Disability Costs and Equivalence Scales in the Older Population in Great Britain. Review of Income and Wealth 2015, 61, 494–514. [Google Scholar] [CrossRef]
- Pudney, S.; Hancock, R.; Morciano, M. Nonparametric Estimation of a Compensating Variation: The Cost of Disability; Institute for Social and Economic Research, 2013.
- Loyalka, P.; Liu, L.; Chen, G.; Zheng, X. The Cost of Disability in China. Demography 2014, 51, 97–118. [Google Scholar] [CrossRef] [PubMed]
- Braithwaite, J.; Mont, D. Disability and Poverty: A Survey of World Bank Poverty Assessments and Implications. Alter 2009, 3, 219–232. [Google Scholar] [CrossRef]
- Mont, D.; Cuong, N.V. Disability and Poverty in Vietnam. The World Bank Economic Review 2011, 25, 323–359. [Google Scholar] [CrossRef]
- Palmer, M.; Williams, J.; McPake, B. The Cost of Disability in a Low Income Country. 2016. [CrossRef]
- Mitra, S.; Palmer, M.; Kim, H.; Mont, D.; Groce, N. Extra Costs of Living with a Disability: A Review and Agenda for Research. Disability and Health Journal 2017, 10, 475–484. [Google Scholar] [CrossRef] [PubMed]
- What Is the Convention on the Rights of the Child? | UNICEF Thailand. Available online: https://www.unicef.org/thailand/what-is-crc (accessed on 11 April 2023).
- Kolenikov, S.; Angeles, G. socioeconomic status measurement with discrete proxy variables: is principal component analysis a reliable answer? Review of Income and Wealth 2009, 55, 128–165. [Google Scholar] [CrossRef]
- Multidimensional Poverty Index (MPI) | Philippine Statistics Authority. Available online: https://psa.gov.ph/psa-press-release-tags/multidimensional-poverty-index-mpi (accessed on 11 April 2023).
- WFP Food Consumption Score - Technical Guidance Sheet | Food Security Cluster. Available online: https://fscluster.org/bangladesh/document/wfp-food-consumption-score-technical (accessed on 9 April 2023).
- Antón, J.-I.; Braña, F.-J.; Muñoz de Bustillo, R. An Analysis of the Cost of Disability across Europe Using the Standard of Living Approach. SERIEs 2016, 7, 281–306. [Google Scholar] [CrossRef]
Figure 1.
Standard of living and the cost of disability. Source: Authors’ graphical representation.
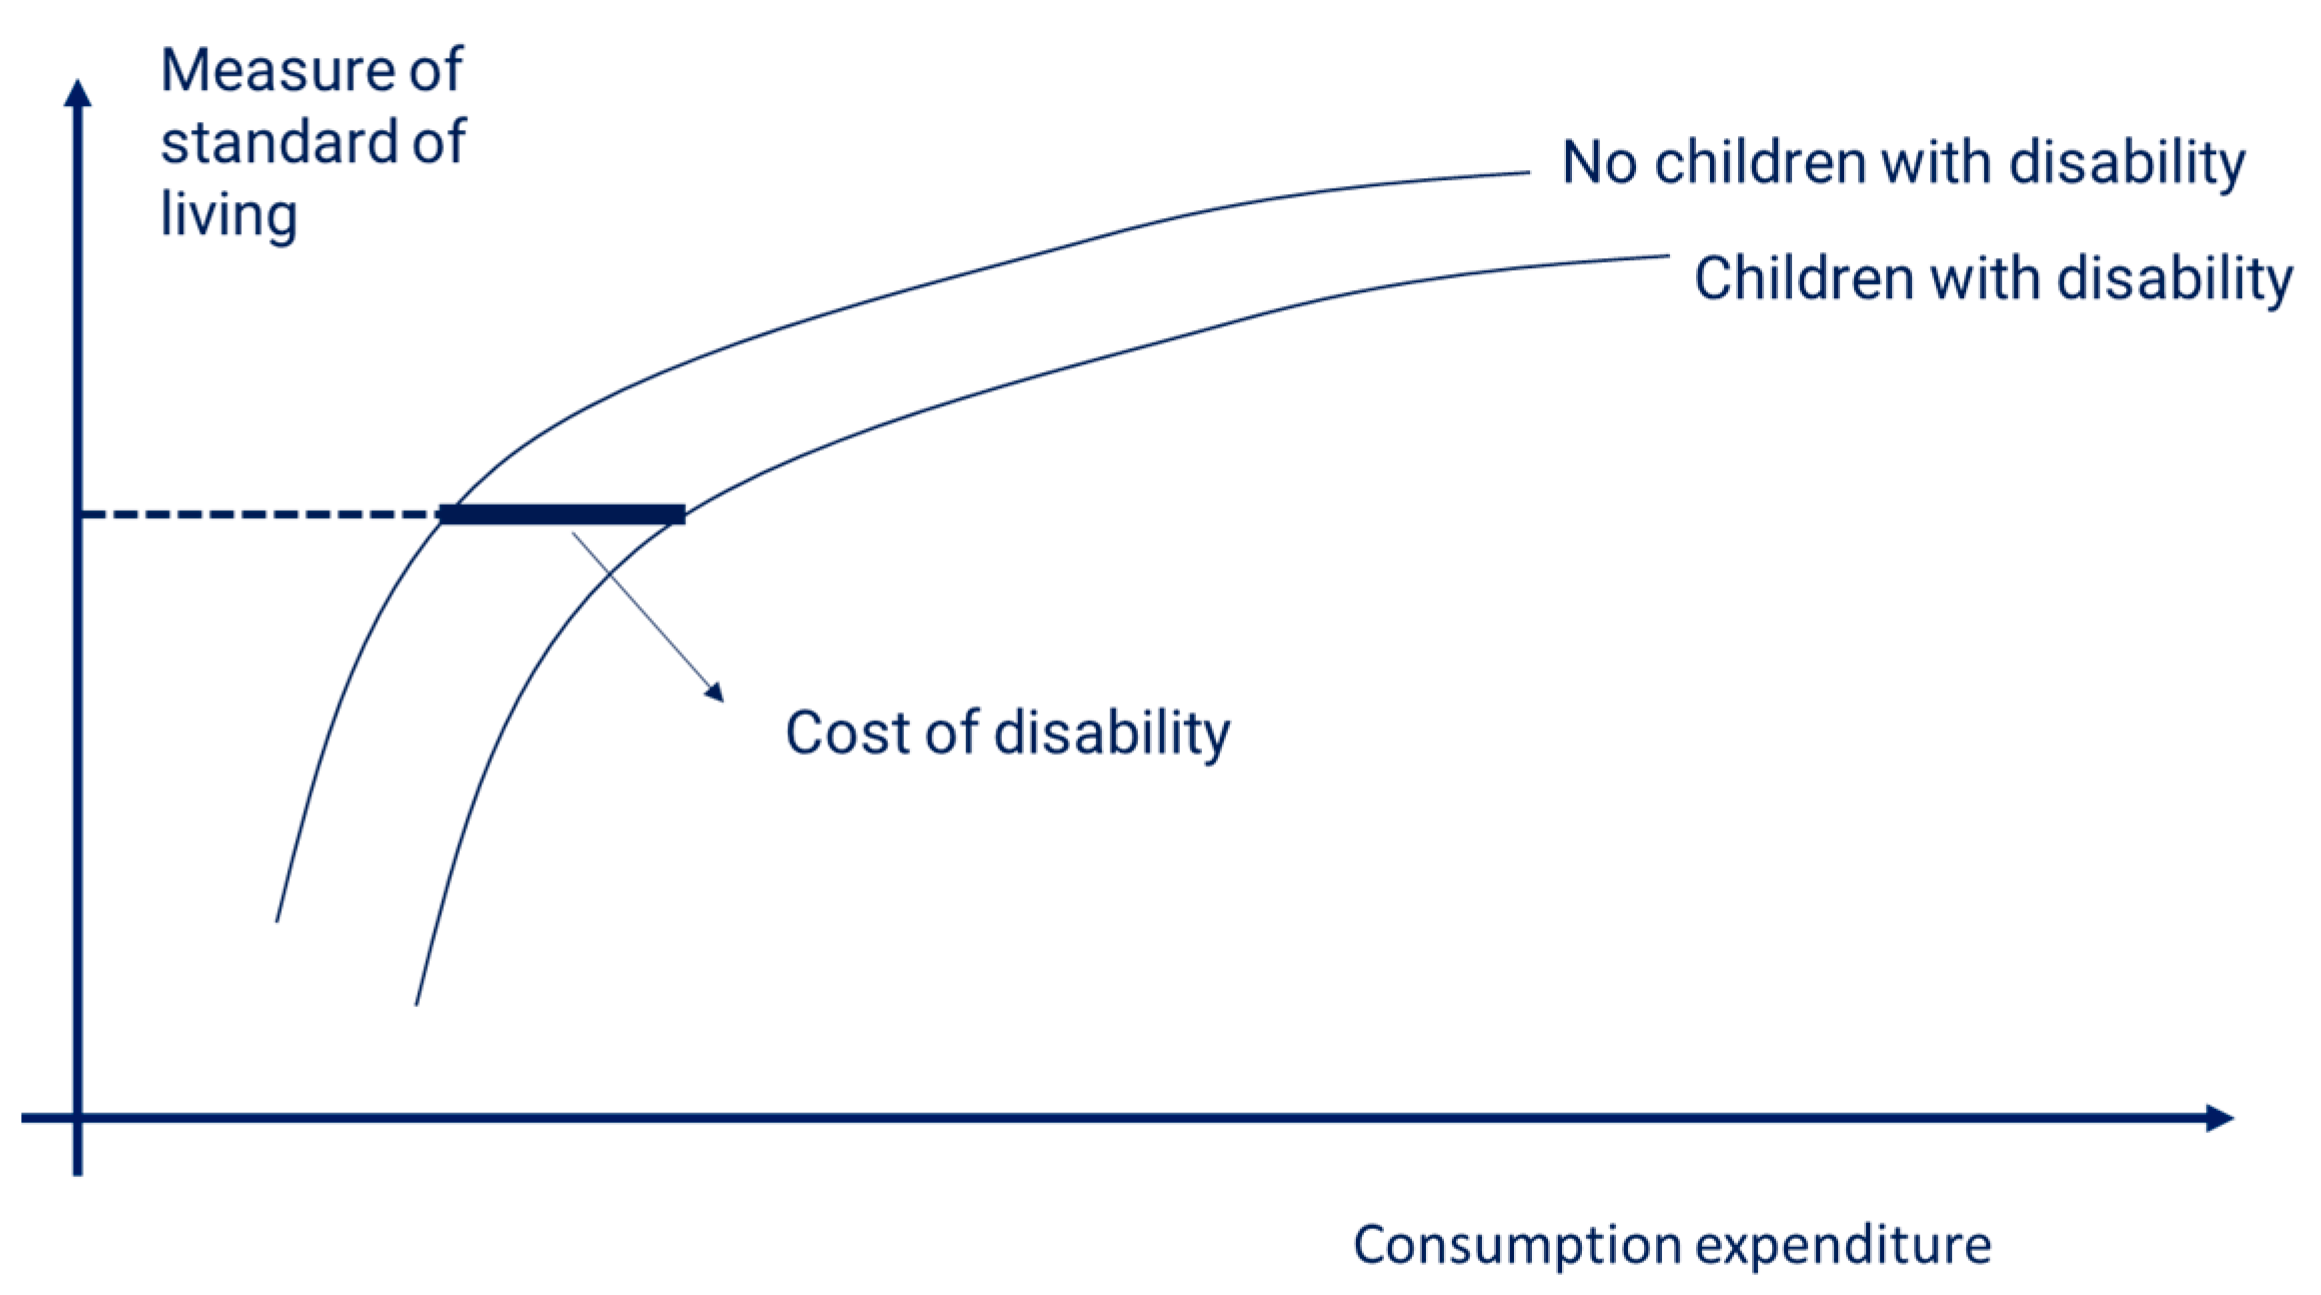
Table 1.
Distribution of household types by presence of children with disabilities and average number of children with disabilities in the household.
Table 1.
Distribution of household types by presence of children with disabilities and average number of children with disabilities in the household.
| Type of household | Disability | No Disability | Average number of children with functional difficulties |
|---|---|---|---|
| Nuclear families | 65.0 | 64.0 | 1.16 |
| Couple with 1 child | 9.1 | 12.0 | 1.00 |
| Couple with 2 children | 17.8 | 18.3 | 1.11 |
| Couple with 3 children | 16.2 | 13.1 | 1.23 |
| Couple with 4 or more children | 13.6 | 11.5 | 1.32 |
| Single parent with children | 8.3 | 9.0 | 1.05 |
| Three generation households | 16.0 | 16.2 | 1.14 |
| Other households with children | 19.0 | 19.9 | 1.17 |
| Total | 100.0 | 100.0 | 1.16 |
| Observations | 1313 | 1440 |
Table 2.
Descriptive statistics of main variables by type of household and with/without children with disabilities.
Table 2.
Descriptive statistics of main variables by type of household and with/without children with disabilities.
| Variable | Nuclear families | Other household types | ||
|---|---|---|---|---|
| Disability | No Disability | Disability | No Disability | |
| Consumption (log), mean | 9.43 | 9.34 | 9.71 | 9.55 |
| standard deviation | 0.60 | 0.56 | 0.62 | 0.62 |
| Age of household head, mean | 41.97 | 40.08 | 52.54 | 50.88 |
| standard deviation | 8.58 | 9.83 | 14.03 | 14.77 |
| Household size, mean | 4.66 | 4.47 | 5.87 | 5.45 |
| standard deviation | 1.50 | 1.46 | 2.03 | 2.04 |
| Urban areas, mean | 0.62 | 0.68 | 0.69 | 0.72 |
| standard deviation | 0.45 | 0.44 | 0.42 | 0.42 |
| Asset index, mean | -0.02 | 0.06 | 0.54 | 0.44 |
| standard deviation | 1.39 | 1.23 | 1.38 | 1.29 |
| Number of deprivations | ||||
| Three or more | 10.7 | 6.4 | 4.1 | 4.6 |
| Two | 14.2 | 11.7 | 11.1 | 9.8 |
| One | 33.6 | 29.1 | 37.7 | 34.1 |
| None | 41.6 | 52.8 | 47.1 | 51.5 |
| 100.0 | 100.0 | 100.0 | 100.0 | |
| Position in society | ||||
| Low | 36.3 | 30.5 | 28.3 | 33.0 |
| Middle | 56.2 | 57.9 | 62.5 | 59.5 |
| High | 7.5 | 11.6 | 9.2 | 7.5 |
| 100.0 | 100.0 | 100.0 | 100.0 | |
Table 3.
Regression results and estimated extra costs.
| Asset Index | Number of deprivations | Position in society | |
|---|---|---|---|
| Proportional extra expenditure | |||
| Milder functional difficulty | 1.12 | 1.31 | 1.49 |
| Moderate/severe functional difficulty | 1.19 | 1.72 | 1.70 |
| Consumption (log) | 1.151*** | 1.479*** | 0.642*** |
| Child with milder functional difficulties | -0.133** | -0.395*** | -0.258** |
| Child with severe functional difficulties | -0.201*** | -0.806*** | -0.339*** |
| Age of household head | 0.076*** | 0.144*** | -0.011 |
| Age of household head squared | -0.001*** | -0.001*** | 0.000 |
| Couple with one child | 0.177** | 0.356** | 0.009 |
| Couple with three children | -0.188*** | -0.386*** | -0.141 |
| Couple with four or more children | -0.470*** | -0.805*** | -0.260* |
| One parent with children | 0.008 | -0.080 | -0.349** |
| National Capital Region | 0.006 | 0.114 | 0.792*** |
| Urban | 0.444*** | 0.059 | -0.030 |
| Visayas | -0.589*** | -0.284 | 0.167 |
| Mindanao | -0.498*** | -0.569*** | -0.082 |
| Number of observations | 1775 | 1775 | 1773 |
| Model | OLS | Ordered logit | Ordered logit |
| Pseudo R2/Adj. R2 | 0.442 | 0.110 | 0.046 |
* is at the 90% confidence level;** is significant at the 95% confidence level; *** is significant at the 99% confidence level.
Disclaimer/Publisher’s Note: The statements, opinions and data contained in all publications are solely those of the individual author(s) and contributor(s) and not of MDPI and/or the editor(s). MDPI and/or the editor(s) disclaim responsibility for any injury to people or property resulting from any ideas, methods, instructions or products referred to in the content. |
© 2023 by the authors. Licensee MDPI, Basel, Switzerland. This article is an open access article distributed under the terms and conditions of the Creative Commons Attribution (CC BY) license (http://creativecommons.org/licenses/by/4.0/).
Copyright: This open access article is published under a Creative Commons CC BY 4.0 license, which permit the free download, distribution, and reuse, provided that the author and preprint are cited in any reuse.


