
Submitted:
15 October 2024
Posted:
16 October 2024
You are already at the latest version
Abstract
Child malnutrition is a critical public health concern that significantly hampers children's physical and mental development and has serious economic repercussions. The World Health Organization (WHO) attributes half of all deaths among children under five to malnutrition, with long-term consequences such as lower educational achievement, decreased productivity, and deepened poverty. The economic impact of child malnutrition extends beyond public health, imposing substantial costs on health systems, households, and the broader economy.
This study estimated the burden of child malnutrition in Colombia among children up to four years old using a Markov chain model from a societal perspective. The model simulated six health states, integrating direct and indirect costs, with epidemiological data and international literature guiding the transition probabilities. Surveys were conducted with caregivers to assess indirect costs. Results indicated that malnutrition accounted for 419.84 Disability-Adjusted Life Years (DALYs) per 1,000 inhabitants. The total cost of malnutrition over four years was approximately USD 243.58 million, with an annual average cost of USD 60.89 million, with 65% of the burden falling on households.
The findings emphasize the significant economic and health burden of child malnutrition, underscoring the importance of early and comprehensive interventions. Investing in child nutrition can improve health outcomes, reduce economic strain, and enhance productivity, making it a crucial priority in health and economic development agendas.
Keywords:
Protein-Caloric Malnutrition
; Growth Failure
; Burden of Disease
; Cost of Disease
1. Introduction
In 2015, the United Nations adopted the 2030 Agenda for Sustainable Development, providing an opportunity for countries and their societies to embark on a new path aimed at improving the lives of all, while leaving no one behind. This agenda set forth objectives including the elimination of poverty, combating climate change, advancing education, promoting women's equality, protecting the environment, and redesigning our cities, among other objectives. Goal two, Zero Hunger, stablished a target for 2030 to eradicate all forms of malnutrition. This includes meeting the internationally agreed targets on stunting and wasting in children under five years of age by 2030, as well as addressing the nutritional needs of adolescent girls, pregnant and lactating women, and the elderly [8].
From a conceptual standpoint, malnutrition results from prolonged food deprivation, which occurs when conditions of undernourishment persist over time in a territory. This leads to physiological adaptations in the body necessary for survival, going through acute states that can be fatal or leading to chronicity and growth arrest, with direct consequences on the proper growth and adequate development of children [9] . Malnutrition can be classified into two types: primary, which is associated with a reduction in food consumption or use (due to scarcity or access difficulties), and secondary, which is linked to an underlying pathology.
In general, primary malnutrition is entirely preventable. In Colombia, the country has the capacity to produce the food necessary for its population [10]. However, not all families have access to the necessary amounts of food to lead healthy lives. Indeed, 28.1% of households experience moderate to severe food insecurity, indicating compromised quality and variety of food, reduced food quantities, or instances of hunger [11]. Although the prevalence of malnutrition varies depending on the territorial context (as conditions differ between departments experiencing drought or food supply issues compared to those without), wasting is a phenomenon that occurs across all Colombian departments. In 2023, moderate and severe wasting affected children who were born underweight, belonged to low socioeconomic strata, or had mothers with lower educational levels. The national prevalence of moderate or severe wasting in children under five, as reported by health services for the first half of 2023, was 0.31% in Colombia, an increase from 0.27% during the same period in 2022 [12]. This reported prevalence is lower than the actual population prevalence, due to the underreporting of this condition.
Child malnutrition in Colombia continues to be an alarming issue that profoundly impacts the lives of many children. According to the National Survey of the Nutritional Situation in Colombia (ENSIN) [13], one in ten children experiences stunting, and about two out of every hundred suffer from wasting. This represents around half a million infants nationwide [14]. The root causes of this significant issue extend beyond mere food scarcity and include factors such as poverty, inadequate access to clean water, basic sanitation services, and insufficient parental education [15,16].
The consequences of child malnutrition are multifaceted. Children afflicted with malnutrition not only encounter an increased risk of mortality and susceptibility to diseases such as acute diarrheal disease (ADD) and acute respiratory infection (ARI), but their growth and cognitive development are also compromised [2,17]. This translates into challenges in learning and full development, which subsequently curtail their future opportunities and perpetuate the cycle of poverty in which they are entrenched [18,19]. Moreover, the Colombian health system incurs significant costs in addressing the complications associated with malnutrition, an aspect that has yet to be analyzed from a societal perspective.
Therefore, determining the burden of disease associated with malnutrition in a country that has the tools and resources to prevent it allows action to be taken and prevents an unjust and avoidable phenomenon from continuing its course. This research seeks to answer the following question: what is the burden of disease attributable to malnutrition in Colombia, and its economic impact from a societal perspective?
2. Methods
2.1. Study Design
A study of the economic burden of the disease was conducted, employing epidemiological methods alongside cost analysis. For estimating the burden, the methodology utilized in burden of disease studies (CES) [20] was adopted to calculate the DALYs (Disability Adjusted Life Years), which were calculated as follows:
- YLL: years of life lost to premature death (AD-LE)
- YLD: years of life lost due to disability D*PDP = (AD-AO) *DW
Where
LE: Life expectancy of the country at the time of the study
AD: Average age of death within population group
D: Duration of disability
AO: Age of onset of Disability
DW: Disability weight
2.2. Model
To estimate the DALYs, a Markov model was constructed to simulate the progression of newborn Colombian children, distinguishing between those with and without low birth weight (see Figure 1). The model's states and the possible transitions between them were developed with input from clinical experts in pediatrics and nutrition, experienced in nutritional recovery.
This model is commonly used in health decision-making to simulate the transitions of a hypothetical cohort between various health states over time. The model assumes that at the time , an individual is in the state . Each state is mutually exclusive and exhaustive. Consequently, everyone in the model can occupy only one of these states at any given time.
In this case, a discrete-time Markov chain is a sequence of random variables that comply with the Markov property which implies that the probability of moving to the next state depends only on the current state and not on the previous states. This is:
Where capability of moving from the state in time to the state in time (.The model has an associated transition matrix, , which includes all the transition probabilities from time to time (( for moving from state to state to state . The model assumes that this matrix is homogeneous in time and independent of time. Assuming a model with states, the distribution of the population among them over time is expressed as the following vector:
Where is the number of individuals that are in the state in time . Likewise, the distribution of individuals over time ) is:
Six-State Markov Model
The model is composed of six (6) states (Low birth weight, adequate weight, wasting, stunted height, wasting + stunted height, and death), where death is an absorbent state. The Markov chain is modeled with an initial cohort of 512,611 individuals, equivalent to the Colombian population of live births in 2021 (DANE)
To determine the DALYs, a Markov model was constructed (see Error! Reference source not found.) in which the probability of becoming ill due to wasting influences mortality, chronicity, morbidity and outcomes of disability associated with it according to its severity. The definition of the variables of the model was determined by consensus with clinical and thematic experts.
Newborns are classified as either having adequate weight or being underweight. In both conditions, the risk of wasting may occur, which could either resolve or lead to stunted growth. Furthermore, in all scenarios, there is a potential transition to mortality. Like the methodologies employed in burden of disease studies, the model adopts life expectancy as the time horizon for calculating the potential years of healthy life lost. However, it is important to note that the estimated burden specifically refers to children under the age of four. The model was estimatedd using RStudio Version 4.3.1.
2.3. Model Parameters Estimation
The demographic and epidemiological parameters were obtained from studies [1,21] and official sources such as the vital statistics of DANE [22] , national surveys [13], the RIPS (Individual Records of Health Service Provision) contained in SISPRO [23] (Integrated Social Protection Information System), ICBF's “Cuéntame” mission system. The disability weights for malnutrition were derived from the most recent Global Burden of Disease Study 2019 (GBD 2019), coordinated by the Institute for Health Metrics and Evaluation (IHME) [24]. For transition probabilities not available in the literature, both additive and multiplicative rules of probability were employed. Identification, measurement and costs valuation
2.3.1. Direct Costs
The direct costs associated with the burden of disease were estimated using secondary sources of information [25,26,27]. Priority was given to recent national literature to ensure the relevance and accuracy of the data in the Colombian context. To calculate the costs associated with Wasting, the costs associated with Acute Respiratory Infection (ARI) and Acute Diarrheal Disease (ADD) are used. According to the national literature, the incidence of ARI and ADD for this age group is 42% and 53%, respectively [28]. Consequently, the model allocates costs in these same proportions. Costs linked to ARI are computed based on the expenses incurred during an ARI episode. Simultaneously, the costs for ADD are calculated from the unit cost of traditional rehydration therapy combined with the expenses for general hospitalization in a high-complexity medical facility.
The estimation of costs associated with stunted height, which is assumed to result in delayed cognitive and psychomotor development, assumes that affected individuals, from the age of two up to four years, will require occupational therapy three times per week. Within this framework, it is projected that only one of these three weekly therapy sessions (approximately 33%) will be subsidized by the health system. The remaining two sessions (67%) are expected to be covered by households as out-of-pocket expenses.
For the cost analysis, an annual inflation adjustment was applied to standardize the values to the year 2023. This adjustment ensures that the costs are comparable across different time periods. Table 1 presents the per capita cost for the health system associated with each health state analyzed in the model, along with the respective sources of these data.
2.3.2. Indirect Costs
To estimate indirect costs, an information collection instrument was developed and administered to caregivers. This instrument gathered data on family income, out-of-pocket expenses, and productivity losses. Initially, a pilot test of the instrument was conducted, leading to the reorganization of some sections and the refinement of term definitions to enhance comprehension. After these modifications, forty-three surveys were conducted from 2023 to February 2024 with caregivers of children under five years old who were treated for moderate or severe wasting and/or stunting in six hospitals (both public and private) in the Department of Antioquia. To the initially estimated indirect costs, an additional amount is added after two years, representing 67% of the annual costs of occupational therapies, equivalent to USD $920 per year. This additional expense is borne by households of individuals who exhibit delayed psychomotor development due to stunted growth.
3. Results
3.1. Burden of Disease
The Markov model estimate indicates that DALYs for malnutrition in Colombia correspond to 419.84 per 1,000 inhabitants during the first four years of life. Table 2 and Figure 2 present the summary of DALY, YLL, and YLD results. The data suggest that YLL significantly contributes to the increase in DALYs over time.
3.2. Direct and Indirect Costs
After reviewing the literature on direct cost data collection, priority was accorded to studies that provided analyses of national costs. Subsequent sections detail the costs associated with wasting, particularly those linked to ARI and ADD. Additionally, costs related to height delay are outlined, specifically the expenses for delayed psychomotor development, which include three weekly occupational therapy sessions after the age of 2 years. To ensure comparability among the various cost values, all figures have been adjusted for inflation. This adjustment ensures that the presented costs reflect up-to-date and comparable economic values, facilitating more accurate interpretations.
Table 3 present the results of the direct and indirect costs per cycle and the cumulative total for the first four years.
The results of the indirect cost analysis reveal that the total reaches USD $243.576.094,12 over the four-year period analyzed. Table 3 illustrates the evolution of indirect costs for each cycle.
At the time of the survey, most children were categorized under Nutritional Recovery, followed by Home Management with follow-up and re-entry to Nutritional Recovery. Among the surveyed children, 76.19% were identified as experiencing wasting.
Regarding demographic details, the children primarily belonged to socioeconomic strata 1, 2, and 3, with a prevalence in strata 1 and 2 (91%). The majority were covered under the subsidized health insurance regime (74.4%), with 23.3% under the contributory regime, and 2.3% uninsured. None of the respondents had additional insurance or supplementary plans.
Household characteristics indicated that the largest proportion resided in stratum 1 (55.8%), with 62.8% residing in urban areas. Most households did not include children under 5 years of age, individuals over 65 years of age, pregnant women, or disabled persons (See Annex 1).
Among the categories of annual out-of-pocket expenses, transportation incurred the highest costs at $451.76 USD, followed by food at $225.88 USD, and stationery at $84.71 USD. When analyzing indirect costs by socioeconomic strata, transportation and food consistently showed the highest expenses across strata 1, 2, and 3. Additionally, the most substantial out-of-pocket expenses occurred during hospitalization, totaling $971.89 USD. Detailed figures for these expenditures are available in Annex 2, which reveals that the average annual per capita expenditure for households is $162.98 USD.
According to the characteristics of the caregivers surveyed, the average age was 37 years. A significant majority (95.35%) were mothers, and 65% were not the heads of their households. The predominant affiliation regime was subsidized (74.4%). The highest level of schooling reported was high school, with 62.8% of caregivers having this educational background. Regarding occupation, 44.19% were engaged in household chores, and 25.58% were involved in informal work. Most caregivers did not cease their activities for child care, a situation most prevalent among those engaged in household chores. This finding suggests a lack of support for child care in most cases, as detailed in Annex 3.
In terms of the economic characteristics of the households, the average income per household was observed to be $352.21 USD, while per capita income averaged $190.34 USD. It was noted that most households did not have alternative sources of income.
3.3. Economic Burden
The analysis of costs associated with malnutrition in Colombia reveals that direct costs amount to $128.92 million USD, whereas indirect costs tally up to $243.58 million USD. This results in a total cost of $372.50 million USD over the first four years of the cohort's life. Additionally, DALYs per 1,000 inhabitants are found to be 419.8. Table 4 illustrate the detailed breakdown and evolution of these costs over time.
The primary financial burden lies with indirect costs, constituting 65% of the total costs, in contrast to the 35% represented by direct costs. An increasing cost trajectory over time is noted, particularly after the second year of life, when households are required to cover two-thirds of occupational therapy costs as out-of-pocket expenses.
A comparison of these expenditures to the per capita income of individuals right above the extreme monetary poverty line and the monetary poverty line (According to the National Administrative Department of Statistics (DANE), for the year 2022, the per capita extreme monetary poverty line was set at 198,698 Colombian pesos per month, while the monetary poverty line was established at 396,864 Colombian pesos per month.) reveals significant disparities. Specifically, the average annual out-of-pocket expenditure amounts to 123.4% of the total annual income for individuals right above the extreme poverty line, and 61.8% for those right above the monetary poverty line. Such economic strains suggest that, for households, coping with an income shock resulting from child malnutrition could lead to a higher incidence of monetary and extreme monetary poverty, restricting household spending flexibility in a manner that perpetuates poverty and deepens existing inequities.
4. Discussion
Child malnutrition is a completely preventable public health issue. No child should succumb to this condition, especially in a country with abundant and diverse food resources like Colombia. This problem is linked to health inequities and serves as a catalyst for the loss of human capital and the growth potential of society. Malnutrition contributes to cognitive decline, resulting in delayed school entry, poor academic performance, and decreased graduation rates [3,18,19,28]. Poor fetal growth or stunted growth within the first two years of life leads to irreversible damage, including shorter adult stature, lower educational attainment, reduced adult income, and lower birth weight in subsequent generations.
This study represents the first comprehensive assessment of the burden of malnutrition from a societal perspective in Colombia. Our findings indicate that the DALYs for child malnutrition in the first four years of life are 419.8 per 1,000 inhabitants. Despite high health coverage, a considerable proportion of the associated costs are borne by households: of the total costs attributable to child malnutrition, 32% are indirect costs assumed by households, while 68% are direct costs covered by the health system.
Several studies have shown a correlation between birth weight, subsequent nutritional status, and the development of diseases in adult life [29,30,31]. This evidence highlights the importance of early interventions, particularly before the age of five, as a critical period for improving nutritional outcomes. According to one study, approximately 85% of children born with very low birth weight and 53% of those born with extremely low birth weight achieve normal height by the age of 4. However, children who remain short-statured at age 4 are unlikely to attain normal adult height [32].
In 2014, the most recent study on the burden of disease in Colombia was published, utilizing data from 2010. It identified low birth weight as the primary cause of disease burden among children under five years of age, with 134 total DALYs in males and 144 in females. This was followed by asphyxia and birth trauma, accounting for 46 DALYs in males and 48 in females. The study also reported protein-calorie malnutrition with 4 DALYs in males and 5 in females per 1,000 children, and lower respiratory tract infections with 8.3 DALYs in males and 9.9 in females per 1,000 children [5]. Additionally, a descriptive study conducted in Colombia reported the years of life lost due to premature mortality associated with child malnutrition, which ranged from 1,162 in 2016 to 6,411 in 2019. The years lived with disability varied from 1,239 in 2016 to 2,257 in 2019, corresponding to 2,402 DALYs in 2016 and 8,668 DALYs in 2019 [33].
According to the 2016 Global Burden of Disease (GBD) study, diarrheal diseases accounted for approximately 40,125,700 DALYs due to the incidence of diarrhea and associated fatalities among children under five years of age, resulting in about 446,000 deaths (with a range of 390,900 to 504,600) and 1.105 billion episodes (ranging from 962 million to 1.275 billion). After including long-term sequelae associated with malnutrition, diarrhea contributed to an increased total of 55,778,000 DALYs, marking an almost 40% increase (39.0%, with a range of 33.0% to 46.6%) [34].
To mitigate these effects, it is crucial to implement intervention strategies that encompass child nutrition programs and health education, particularly focusing on the first 1000 days of life. This period is critical for optimal brain growth and development [35]. The findings of this study highlight the significance of such interventions: caregivers reported that malnutrition adversely affected both the health of children and household income, with 38.1% of households experiencing a decrease in income due to child malnutrition.
Although wasting is a notifiable condition in Colombia through its epidemiological surveillance system, SIVIGILA, there are significant gaps in the reporting mechanisms. Notably, stunting does not require mandatory reporting, and the data collected do not fully reflect the population's reality due to known issues of underreporting. This discrepancy arises because not all medical consultations classify nutritional status, and not all children suffering from malnutrition, whether acute or chronic, seek healthcare services. As a result, population statistics, which are typically reported by five-year surveys conducted in 2005, 2010, and 2015 [13,36,37], should have been utilized. However, since there have been no updates since 2015, data from that year must be used as the most recent. Further research is essential, particularly longitudinal studies that explore the outcomes of child malnutrition, including changes in body composition and other developmental trajectories [38].
It can be inferred from the information reported by the National Institute of Health [12] and the Ombudsman's Office (Defensoría del Pueblo) for Colombia in 2023, that there is evidence of an increase in cases of child malnutrition both in its prevalence and in associated mortality, as there is a reported increase of 56.3% in infant mortality and 34.9% in cases of moderate and severe wasting [39].
An inverse relationship has been established between public social expenditure and stunting; that is, as public social expenditure increases, the prevalence of stunting decreases. Consequently, it is imperative that governments in Latin America allocate greater budgetary resources to formulate comprehensive early childhood care policies. Such policies are essential not only for reducing stunting rates but also for fostering long-term sustainable development in the region [40].
Within the context of the sociodemographic characteristics of households experiencing wasting, it is crucial to note that the findings of this study reflect the cyclical nature of the wasting scourge, encompassing poverty, hunger, and malnutrition. These conditions are often the result of low-paying jobs or unemployment, low educational levels among caregivers, and inadequate income to ensure food and nutrition security (FNS) in the household [41].
One of the significant challenges in studying the burden of disease for child malnutrition is achieving a level of regional and territorial disaggregation that supports intersectoral decision-making at the local level. This is crucial, as addressing the issue requires coordinated efforts across various social determinants of health. Combating child malnutrition in Colombia needs an integrated strategy that incorporates food security policies, nutrition programs, and health education. The data and studies reviewed highlight the need to approach malnutrition not only as a public health issue but also as an economic and social imperative for the country's sustainable development. Implementing effective policies and early intervention programs is vital to reducing the burden of malnutrition and enhancing the quality of life for affected children and their households.
Author Contributions: Conceptualization: Taborda and Londoño methodology Taborda, De la Hoz and Londoño. Software De la Hoz.; validation: Londoño, Taborda, De la Hoz, Burgos, Arbelaez and Pineda; formal analysis, De la Hoz, Burgos, Arbelaez and Pineda, investigation, Taborda.; resources.; data curation Londoño, Taborda.; writing—original draft preparation, Londoño AND Taborda.; writing—review and editing, Londoño, Taborda, De la Hoz, Burgos, Arbelaez and Pineda.; visualization, Londoño, Taborda, De la Hoz, Burgos, Arbelaez and Pineda.; supervision, Londoño.; project administration, Taborda and Londoño.; funding acquisition N/A. All authors have read and agreed to the published version of the manuscript.”
Funding: “This research received no external funding, was funded by the Éxito Foundation and the Santa Fé de Bogotá Foundation.
Institutional Review Board Statement: “The study was conducted in accordance with the Declaration of Helsinki, and approved by the Institutional Review Board (or Ethics Committee) of SANTA FE DE BOGOTÁ (protocol code 15280-2023 and April 24th/2023).”
Informed Consent Statement: Informed consent was obtained from all subjects involved in the study.
Data Availability Statement: Consolidated survey data are in Appendices 1 to 3.
Acknowledgments: We thank Dr. Jorge Botero and Dr. Mauricio Sierra for their contribution as clinical experts, Dr. Gilma Hernandez for her statistical contribution. In the same way, to the institutions that allowed the collection of information: Santa Ana Children's Clinic and the Council of Medellín Children's Hospital.
Conflicts of Interest: The authors declare no conflicts of interest of data; in the writing of the manuscript; or in the decision to publish the results.
Appendix A1 Consolidated Percentage Distribution of Household Characteristics for Children Under 5 Years with Malnutrition.
| Socioeconomic Strata of the Patient's Household | ||
| Variable | Frequency | Percentage |
| 1 | 24 | 55,81 |
| 2 | 15 | 34,88 |
| 3 | 4 | 9,3 |
| Total | 43 | 100 |
| Children under 5 years of age reside in their household (not including the patient) | ||
| NO | 27 | 62,79 |
| YES | 16 | 37,21 |
| Total | 43 | 100 |
| In their home reside over 65 years of age | ||
| NO | 36 | 83,72 |
| YES | 7 | 16,28 |
| Total | 43 | 100 |
| People with disabilities live in their home | ||
| NO | 40 | 93,02 |
| YES | 3 | 6,98 |
| Total | 43 | 100 |
| Area of residence | ||
| Rural | 16 | 37,2 |
| Urban | 27 | 62,8 |
Appendix A2 Consolidated annual out-of-pocket expenses, according to the time of the patient's hospitalization, category and socioeconomic status.
| Annual out-of-pocket expenses per moment regarding the patient's hospitalization | |||||
| Variable | Remarks | Average | Standard deviation | Min | Max |
| Expense Before Hospitalization | 10 | $38,81 | $32,91 | $4,71 | $84,71 |
| Spending During Hospitalization | 41 | $161,68 | $225,17 | $1,65 | $971,89 |
| Expense After Hospitalization | 4 | $38,51 | $34,53 | $12,85 | $89,41 |
| Annual Out-of-Pocket Expenses by Category | |||||
| Transport | 44 | $68,13 | $99,55 | $0,00 | $451,76 |
| Moderator Fee | 12 | $17,15 | $16,52 | $4,52 | $53,08 |
| Stationery | 7 | $19,29 | $29,48 | $1,41 | $84,71 |
| Feeding | 24 | $67,75 | $55,58 | $7,06 | $225,88 |
| Drugs | 16 | $21,07 | $22,33 | $2,35 | $75,29 |
| Devices | 7 | $2,92 | $1,31 | $1,18 | $5,41 |
| Other | 2 | $20,00 | $11,65 | $11,76 | $28,24 |
| Total, Spend | 44 | $162,98 | $228,89 | $0,00 | $971,89 |
| Annual Out-of-Pocket Expenses by Category, by Tier 1 | |||||
| Total, Spend | 24 | $115,07 | $138,01 | $7,06 | $481,55 |
| Transport | 24 | $59,95 | $89,87 | $0,00 | $338,82 |
| Moderator Fee | 7 | $16,73 | $14,72 | $7,06 | $45,18 |
| Stationery | 3 | $10,35 | $7,39 | $2,35 | $16,94 |
| Feeding | 12 | $59,10 | $47,54 | $7,06 | $176,47 |
| Drugs | 8 | $22,71 | $22,88 | $2,35 | $60,71 |
| Devices | 3 | $3,53 | $1,65 | $2,35 | $5,41 |
| Other | 2 | $20,00 | $11,65 | $11,76 | $28,24 |
| Annual Out-of-Pocket Expenses by Category, by Tier 2 | |||||
| Total, Spend | 15 | $218,43 | $310,89 | $0,00 | $971,89 |
| Transport | 15 | $78,47 | $114,27 | $0,00 | $451,76 |
| Moderator Fee | 5 | $17,73 | $20,61 | $4,52 | $53,08 |
| Stationery | 4 | $26,00 | $39,52 | $1,41 | $84,71 |
| Feeding | 9 | $64,00 | $63,96 | $9,41 | $225,88 |
| Drugs | 5 | $12,56 | $5,57 | $2,82 | $16,47 |
| Devices | 4 | $2,47 | $0,99 | $1,18 | $3,53 |
| Other | 0 | , | , | , | , |
| Annual Out-of-Pocket Expenses by Category, by Tier 3 | |||||
| Total, Spend | 4 | $283,29 | $298,33 | $23,53 | $713,41 |
| Transport | 4 | $95,53 | $124,78 | $23,53 | $282,35 |
| Moderator Fee | 0 | - | - | - | - |
| Stationery | 0 | - | - | - | - |
| Feeding | 3 | $112,94 | $56,47 | $56,47 | $169,41 |
| Drugs | 3 | $30,88 | $38,89 | $2,82 | $75,29 |
| Devices | 0 | - | - | - | - |
| Other | 0 | - | - | - | - |
Appendix A3 Consolidated percentage distribution of the characteristics of the caregiver of the child with wasting.
| Variable | Note | % |
| Mother | 41 | 95,35 |
| Second-degree relative | 2 | 4,65 |
| Type of affiliation to the general social security system of the caregiver | ||
| Uninsured | 1 | 2,33 |
| Contributory Regime | 10 | 23,26 |
| Subsidized regime | 32 | 74,42 |
| Total | 43 | 100 |
| Maximum level of schooling achieved by the caregiver | ||
| High school | 27 | 62,79 |
| Preschool | 1 | 2,33 |
| Primary | 7 | 16,28 |
| Technical - Technological | 6 | 13,95 |
| Universitario | 2 | 4,65 |
| Total | 43 | 100 |
| Most frequent occupation of the caregiver in the last 12 months. | ||
| Student | 2 | 4,65 |
| Employee | 5 | 11,63 |
| Independent | 4 | 9,3 |
| Household Chores | 19 | 44,19 |
| Informal Worker | 11 | 25,58 |
| No | 2 | 4,65 |
| Total | 43 | 100 |
| The caregiver is the head of his or her household | ||
| NO | 27 | 65,85 |
| YES | 14 | 34,15 |
| Total | 41 | 100 |
| Cessation of primary paid occupation to care for the patient | ||
| NO | 26 | 65 |
| YES | 14 | 35 |
| Total | 40 | 100 |
| During the last year she required the services of a personal support caregiver | ||
| NO | 33 | 76,74 |
| YES | 10 | 23,26 |
| Total | 43 | 100 |
| Number of months caregiver support has been required during the past 12 months | ||
| 1 | 1 | 12,5 |
| 2 | 1 | 12,5 |
| 5 | 1 | 12,5 |
| 12 | 5 | 62,5 |
| Total | 8 | 100 |
References
Disclaimer/Publisher’s Note: The statements, opinions and data contained in all publications are solely those of the individual author(s) and contributor(s) and not of MDPI and/or the editor(s). MDPI and/or the editor(s) disclaim responsibility for any injury to people or property resulting from any ideas, methods, instructions or products referred to in the content.
- Dadhich, J.P.; Faridi, M.M.A. Maternal and child nutrition. Lancet. 2013; 382(9904):1549.
- Bedoya, P.; Quino, A. Effects of child malnutrition on psychomotor development. Criteria Magazine. 2014; 21 (1)(1):225–44.
- Zea Wellmann, A.M.; Robles Bautista, E.R. Impact of child malnutrition on brain development in Guatemala. Academic Journal Knowledge Society Cunzac. 2022 Sep 29; 2(2):217–26.
- Liu J, Qi X, Wang X, Qin Y, Jiang S, Han L, et al. Evolving Patterns of Nutritional Deficiencies Burden in Low-and Middle-Income Countries: Findings from the 2019 Global Burden of Disease Study. Nutrients. 2022 Mar 1; 14(5).
- Peñaloza, R.; Salamanca, N.; Rodríguez, J.; Beltrán, A. Estimation of the burden of disease for Colombia 2010. Bogota; 2014.
- Shekar, M.; Kakietek, J.; Dayton Eberwein, J.; Walters, D. An Investment Framework for Nutrition Reaching the Global Targets for Stunting, Anemia, Breastfeeding, and Wasting Human Development. 2017.
- Ramponi, F.; Tafesse, W.; Griffin, S. Economic evaluation of interventions to address undernutrition: a systematic review. Health Policy Plan [Internet]. 2021; 36(4):533–41. Available from: https://pubmed.ncbi.nlm.nih.gov/33280036/.
- UN. Sustainable Development Goals Report. Sustainable Development Goals Report 2019 [Internet]. 2019;64. Available from: https://ods.org.mx/docs/doctos/SDG_Report2019_es.
- Alvarez Ortega, L.G. Child malnutrition, a view from various factors. Valdizana Research. 2019; 13(1):15–26.
- Villanueva-Mejía, D.F. Modern Biotechnology for Agricultural Development in Colombia. Ing Cienc. 2018 Nov 23; 14(28):169–94.
- DANE Technical bulletin of the Food Insecurity Experience Scale (FIES) [Internet]. 2023. Available from: https://www.dane.gov.co/index.
- National Institute of Health. First Semester Event Report on Wasting in Children Under 5 Years of Age, 2023. 2023.
- National University; National Institute of Health; ICBF. National Survey of Food and Nutritional Situation 2015. Vol. 1. 2015. 53 p.
- Fundación Éxito. Stunting Index. 2020.
- Marrugo-Arnedo C, Moreno-Ruiz D, Castro-Ávila R, Paternina-Caicedo Á, Marrugo-Arnedo V, Alvis-Guzmán N. Sociodemographic determinants of child nutrition in Colombia. Uninorte Health. 2015; 31(3):446–57.
- Jiménez-Benítez, D.; Rodríguez-Martín, A.; Jiménez-Rodríguez, R. Analysis of social determinants of malnutrition in Latin America. Nutr Hosp. 2010; 25(SUPPL. 3):18–25.
- Evolution of Psychomotor Development in Children from 0 to 5 Years of Age with Deficits due to Malnutrition. 2018.
- Machuca, M.; Ramírez, E.; Castilla, N. Biomarkers of malnutrition, anemia and parasitism associated with IQ in children at the Yanama educational institution, Ayacucho. Rev Inv UNSCH. 2019; 27(2):177–84.
- Alvarez Ortega, L.G. Child malnutrition, a view from various factors. Valdizana Research. 2019 Mar 8; 13(1):15–26.
- Peñaloza, Rolando; Salamanca, Natalia; Rodriguez, Jesus; Beltrán A. Estimation of the burden of disease for Colombia, 2010. Bogotá- Colombia: Universidad Pontificia Javeriana; 2010.
- Schoenbuchner SM, Dolan C, Mwangome M, Hall A, Richard SA, Wells JC, et al. The relationship between wasting and stunting: a retrospective cohort analysis of longitudinal data in Gambian children from 1976 to 2016. Am J Clin Nutr. 2019 Aug; 110(2):498–507.
- DANE Microdata: vital statistics. Microdata on Births in Colombia. 2021.
- ICBF Missionary Information System Tell, Me. Bogota; 2021.
- (IHME) I for HM and, E. Global Burden of Disease Study 2019. [Internet]. Global Health, Data Exchange. Available from: http://ghdx.healthdata.org/record/ihme-data/gbd-2019-disability-weights.
- Moyano-Ariza, L. Estimation of cost-disease for pneumonia and bronchiolitis in children under 5 years of age in Colombia. National University; 2019.
- Mejía, A.; Atehortúa, S.C.; Flórez, I.D.; Sierra, J.M.; Mejía, M.E.; Ramírez, C. Costs of oral and nasogastric rehydration compared to intravenous rehydration in children with diarrhea in Colombia. Journal of Public Health. 2017 Jan 1; 19(1):17–23.
- Ministry of Health. Study of sufficiency and risk adjustment mechanisms for the calculation of the Capitation Payment Unit. 2024.
- Mera Fernandez, B. Effect of child malnutrition on school performance. Peru; 2019.
- Hales CN, Barker DJ, Clark PM, Cox LJ, Fall C, Osmond C, et al. Fetal and infant growth and impaired glucose tolerance at age 64. BMJ. 1991 Oct 26; 303(6809):1019–22.
- Barker, D.J.P. Fetal origins of coronary heart disease. BMJ. 1995 jul 15; 311(6998):171–4.
- Gascón, M.B.; Morán, E.J.; Marín, E.S.; Cruz, A.J. Effect of pre- and postnatal malnutrition on components of metabolic syndrome on later stages of life; Systematic review. Nutr Hosp. 2014; 29(5):997–1003.
- Durá-Travé, T.; San Martín-García, I.; Gallinas-Victoriano, F.; Chueca Guindulain, M.J.; Berrade-Zubiri, S. Catch-up growth and associated factors in very low birth weight infants. An Pediatr (Engl Ed). 2020 Nov 1; 93(5):282–8.
- Quemba-Mesa, M.P.; Herrera-Tarapues, J.C.; Mendoza-Ortiz, A.; Mendoza-Ortiz, B. Epidemiological behavior of malnutrition in children under 5 years of age, Colombia 2016-2019. Science and Care Magazine. 2022 Jan 1; 19(1):71–81.
- Troeger C, Colombara D V, Rao PC, Khalil IA, Brown A, Brewer TG, et al. Global disability-adjusted life-year estimates of long-term health burden and undernutrition attributable to diarrhoeal diseases in children younger than 5 years. Lancet Glob Health. 2018 Mar; 6(3): e255–69.
- Angood, C.; Khara, T.; Dolan, C.; Berkley, J.A. Research Priorities on the Relationship between Wasting and Stunting. PLoS One. 2016 ; 11(5): e0153221.
- Profamilia, National Institute of Health, University of Antioquia, PAHO, Colombian Institute of Family Welfare. National Survey of the Nutritional Situation of Colombia, 2005 [Internet]. Ensin. 2006. 465 p. Available from: http://www.icbf.gov.co/portal/page/portal/PortalICBF/NormatividadGestion/ENSIN1/ENSIN2005/LIBRO_2005.
- Profamilia, National Institute of Health, University of Antioquia, PAHO, Colombian Institute of Family Welfare. National Survey of the Nutritional Situation of Colombia, 2010. 2011. 1–5 p.
- Wells, J.C.K. Body composition of children with moderate and severe undernutrition and after treatment: a narrative review. BMC Med. 2019 Dec 25; 17(1):215.
- Ombudsman's Office. Report malnutrition in children under 5 years of age in Colombia [Internet]. 2023. Available from: https://www.ins.gov.co/buscador-eventos/Paginas/Info-Evento.
- Terán García, L. PUBLIC EXPENDITURE AND ITS INCIDENCE IN STUNTING IN LATIN AMERICA, PERIOD 2001-2019. [Riobamba]: National University of Chimborazo; 2022.
- Onyango, A.W.; Jean-Baptiste, J.; Samburu, B.; Mahlangu, T.L.M. Regional Overview on the Double Burden of Malnutrition and Examples of Program and Policy Responses: African Region. Ann Nutr Metab. 2019; 75(2):127–30.
Figure 1.
Markov Model.
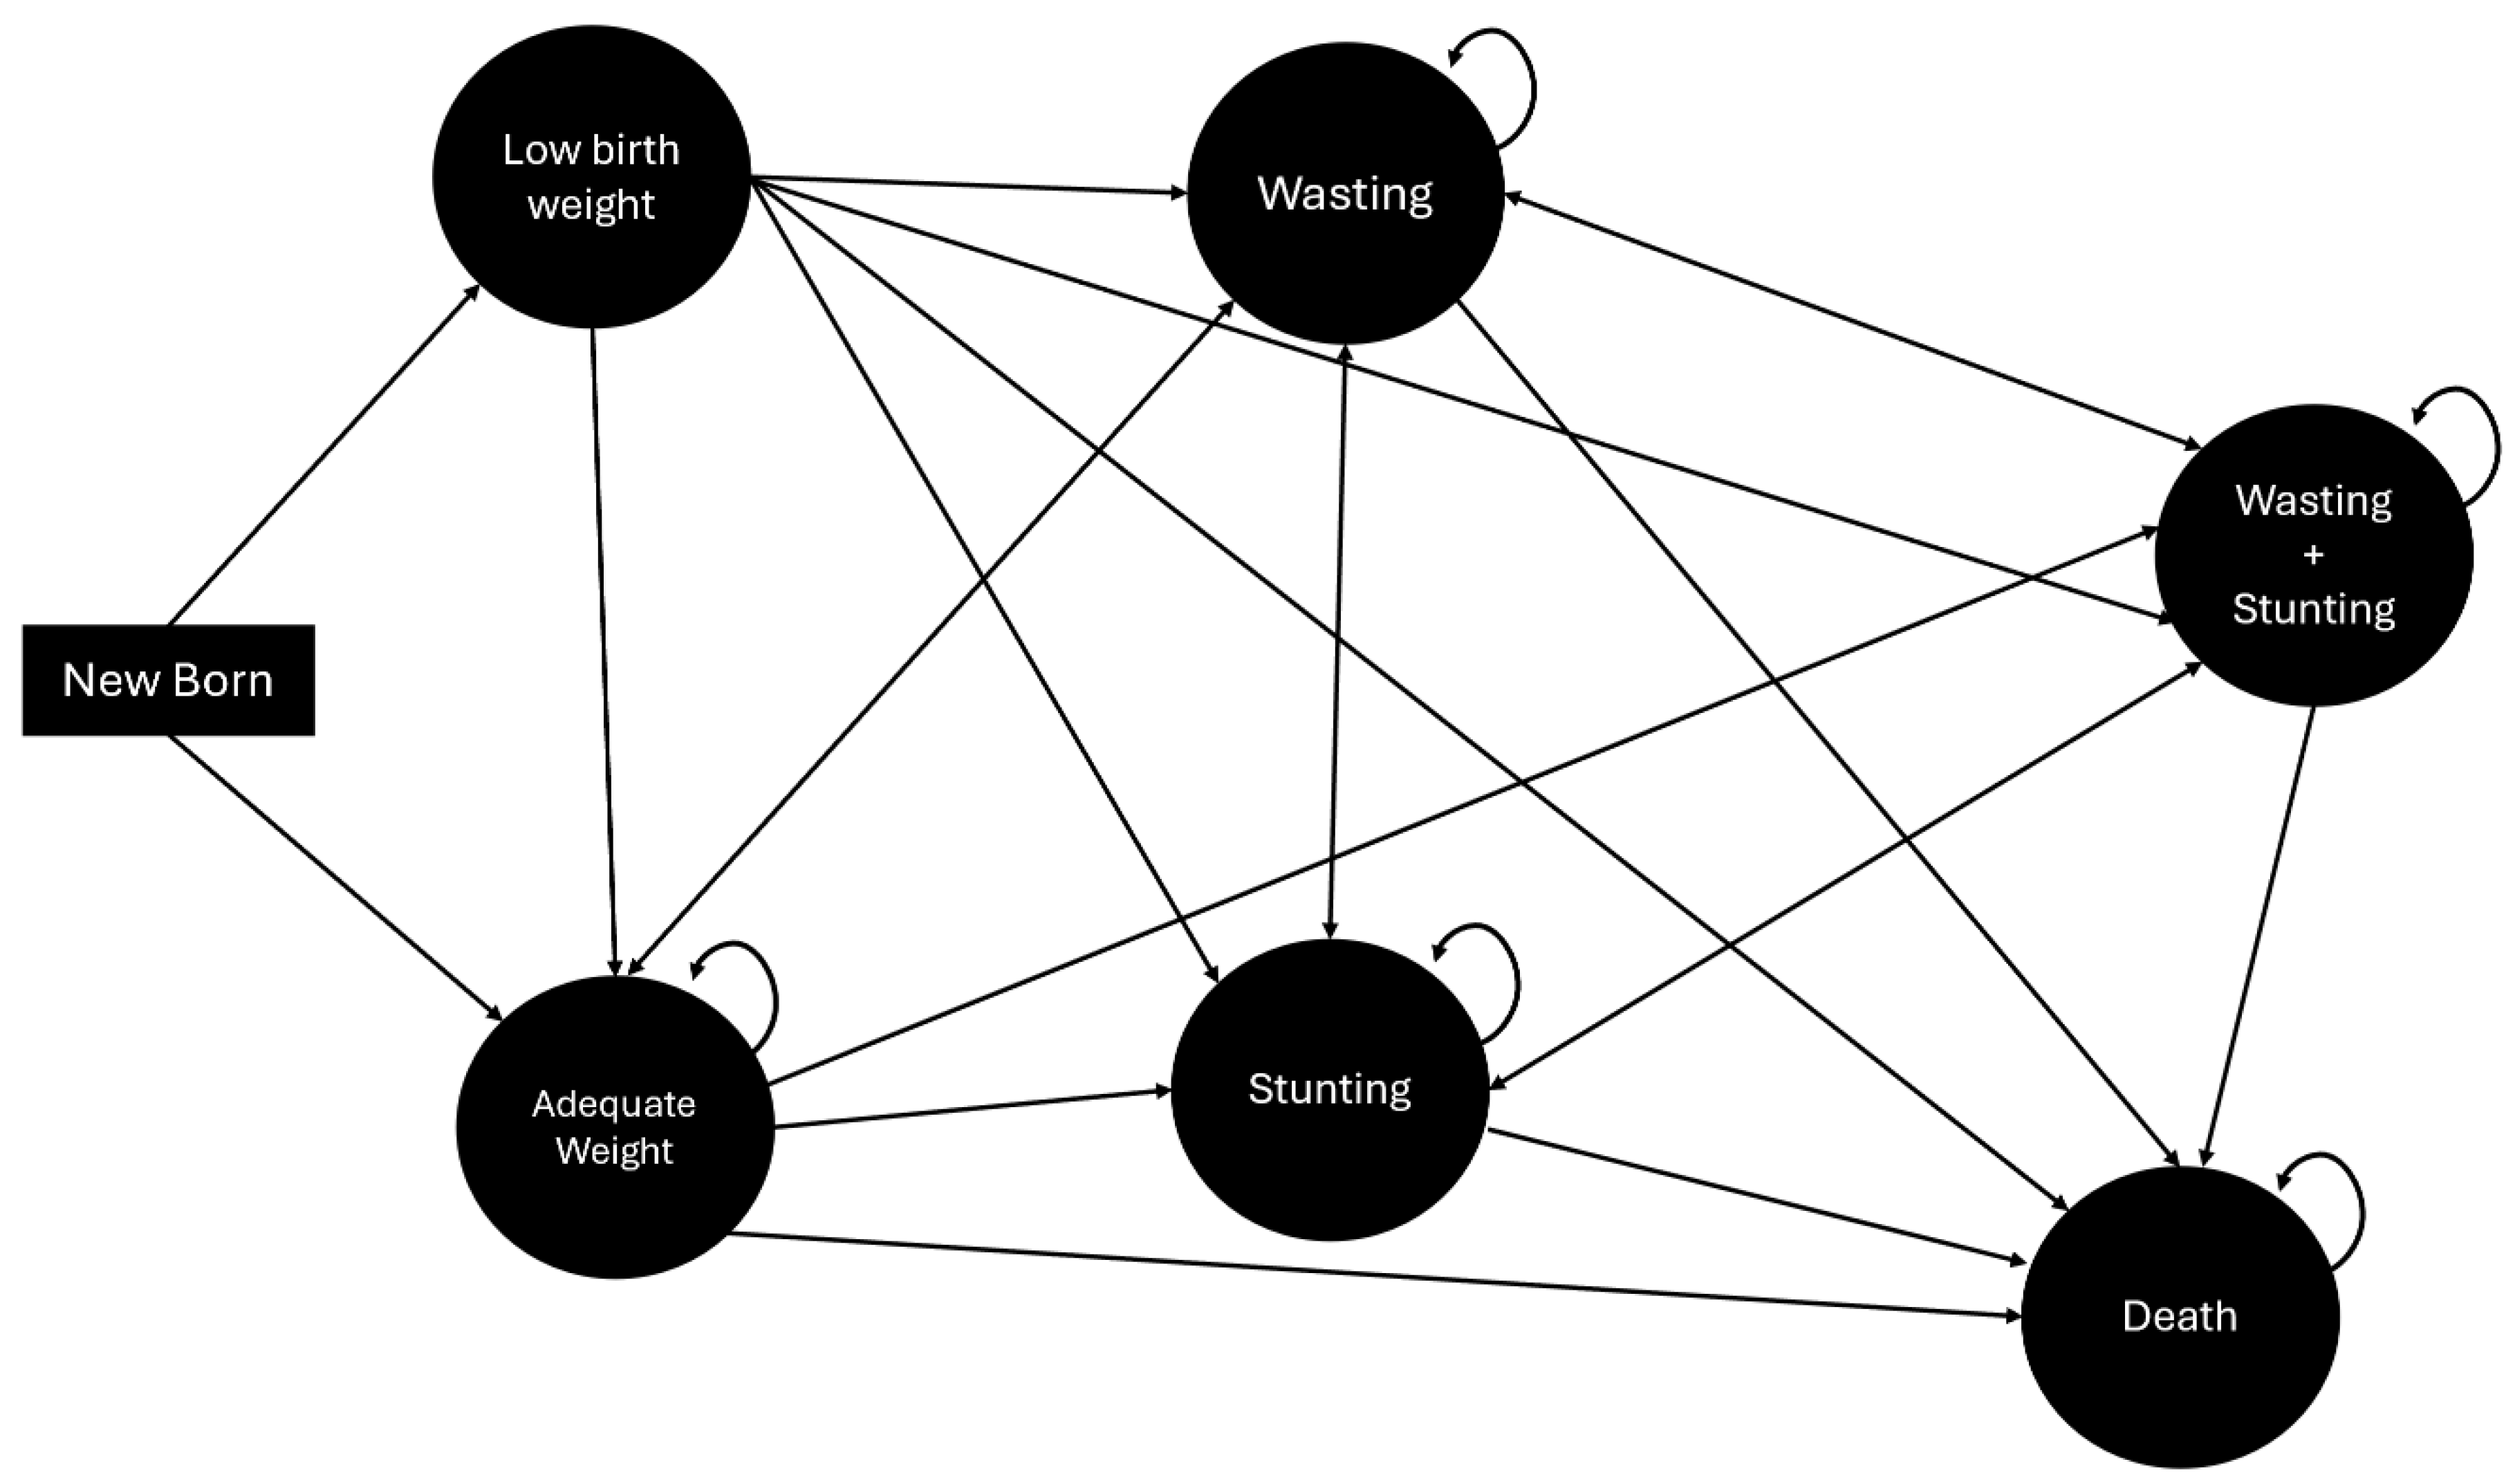
Figure 2.
Evolution of Years of Life Lost (YLL), Years of Life Lost due to Disability (YLL) and DALYs for the four cycles analyzed by the model.
Figure 2.
Evolution of Years of Life Lost (YLL), Years of Life Lost due to Disability (YLL) and DALYs for the four cycles analyzed by the model.
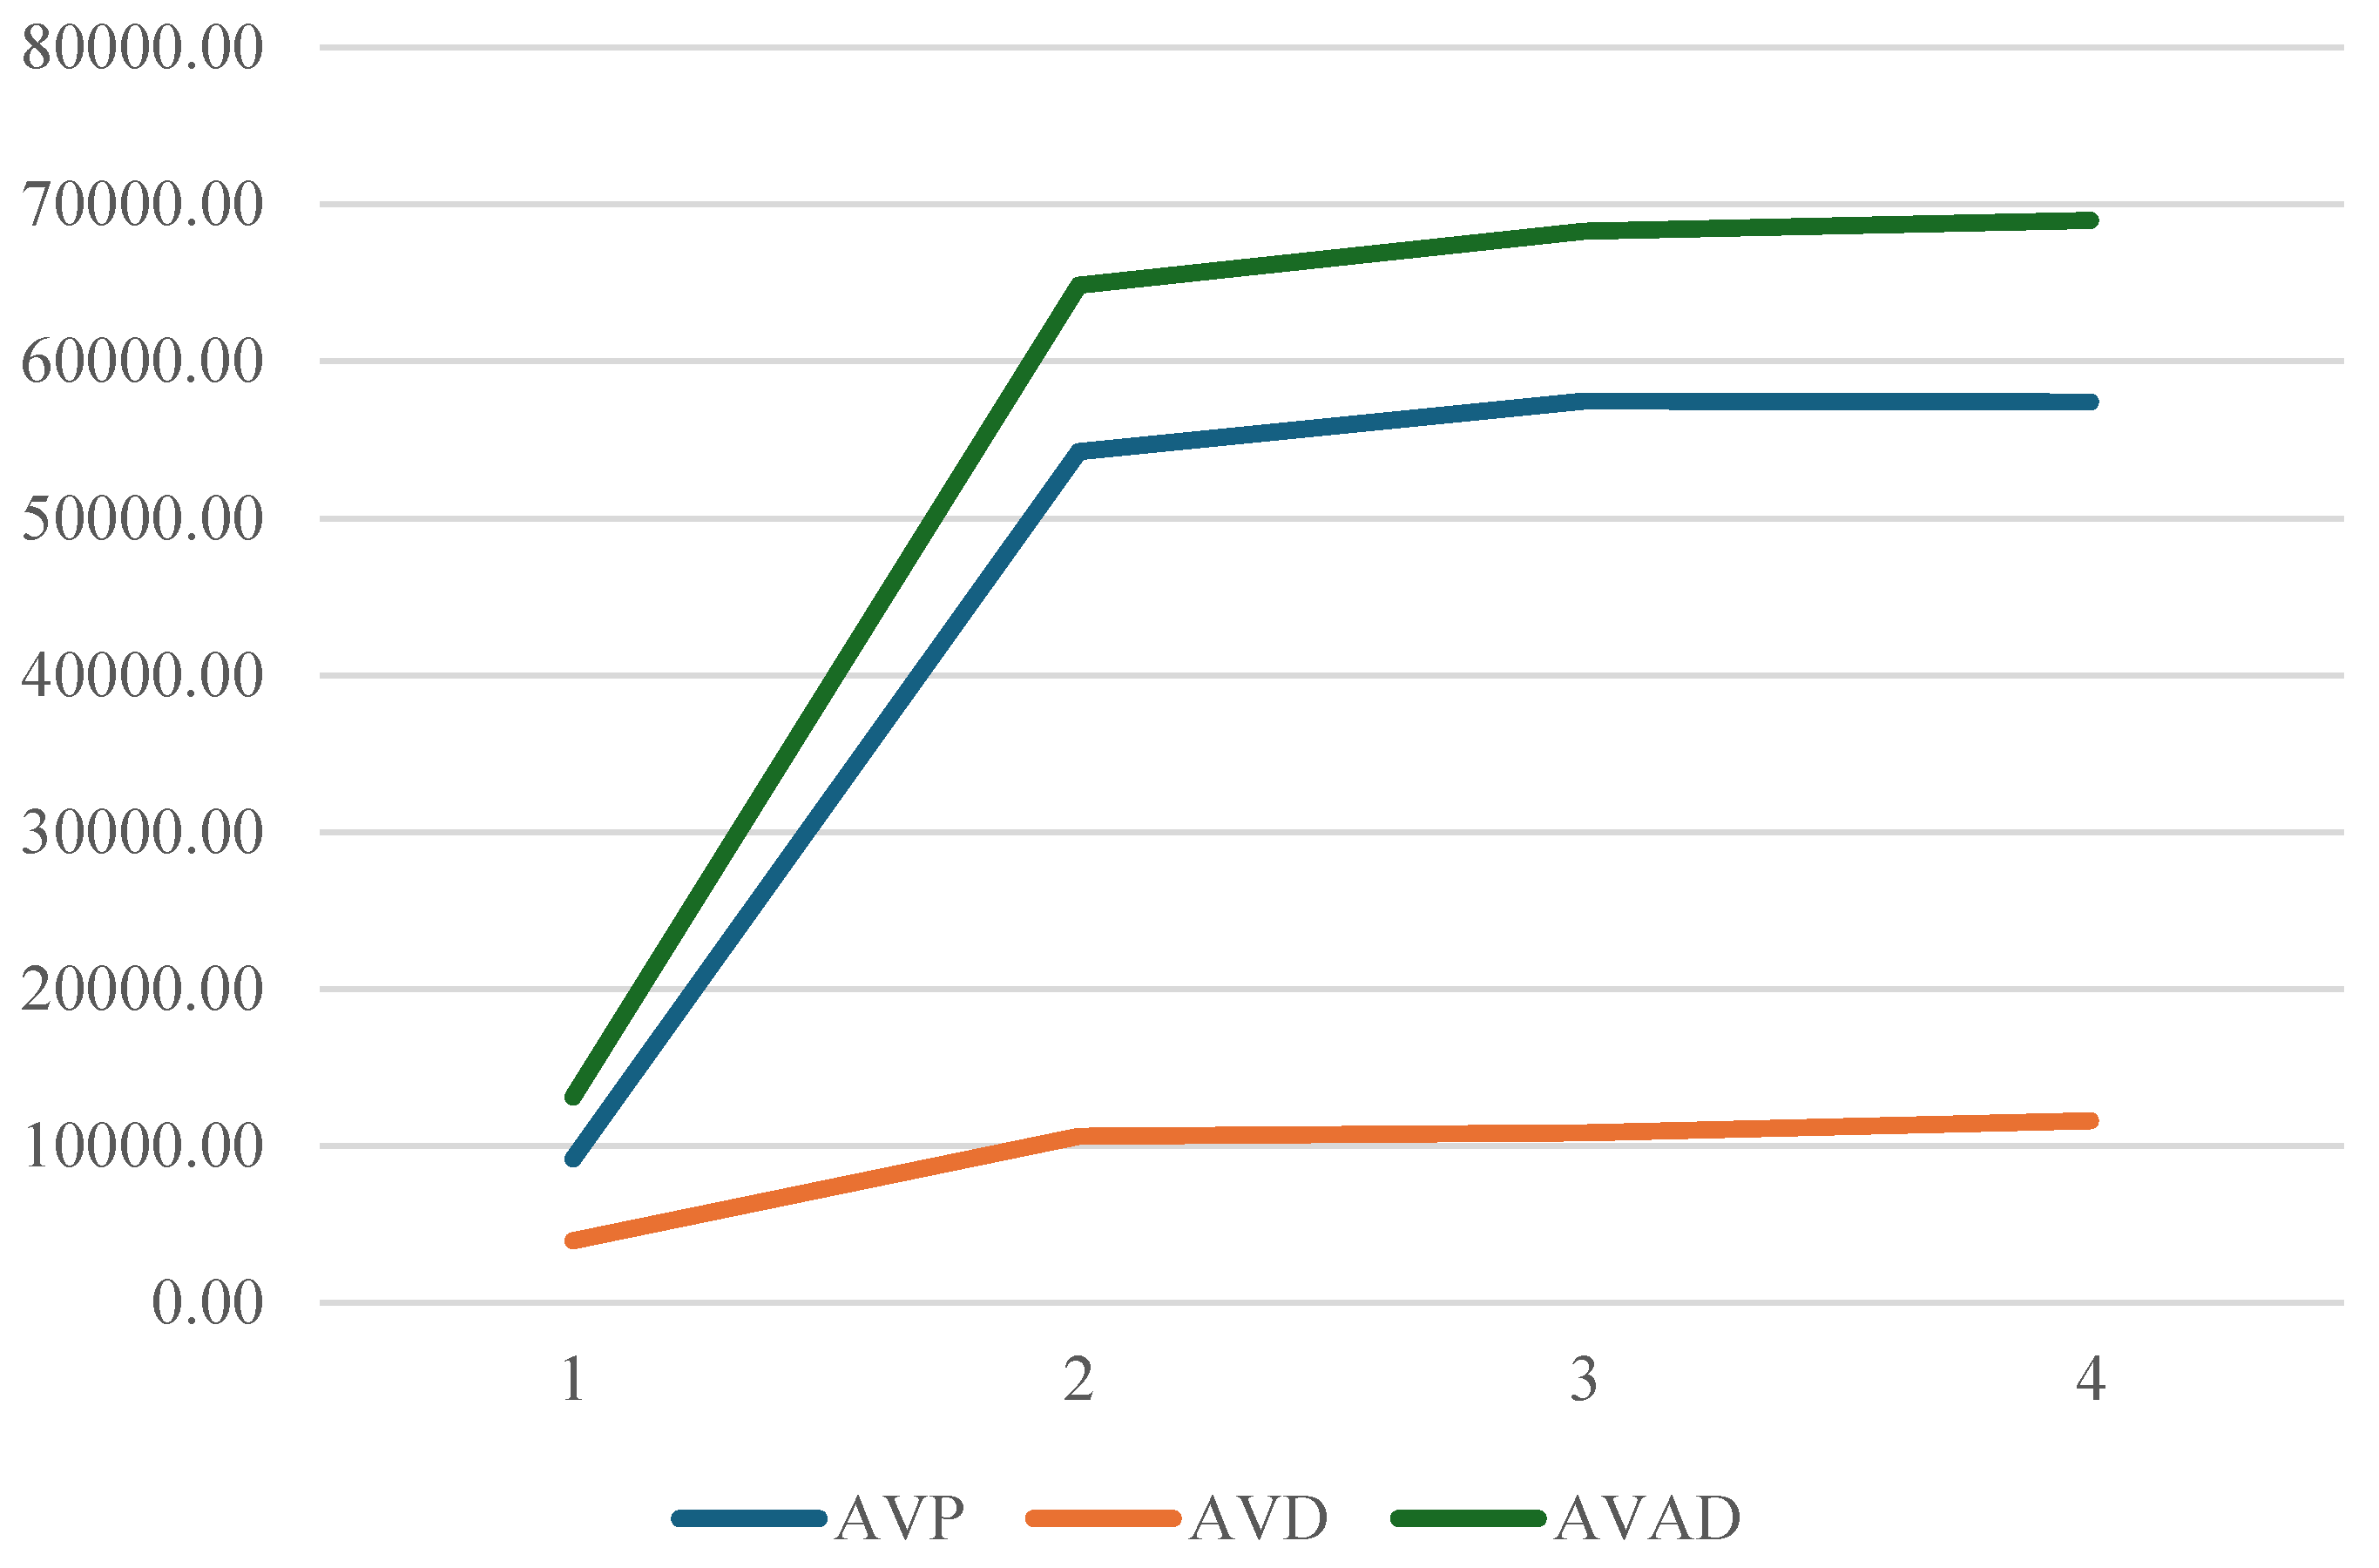

Table 1.
Per capita cost of health states analyzed in the model.
| % | Cost per capita | Source Year | Cost Per Cápita 2023 | Source | Note | |||
|---|---|---|---|---|---|---|---|---|
| Wasting (W) | ARI | 42% | USD 698.16 | 2019 | USD 956.11 | Moyano (2019) | The cost of one (1) event | |
| ADD | 53% | USD 52.60 | 2015 | USD 86.35 | Mejía et al (2016) | The unit cost of rehydration treatment, combined with general hospitalization in a high-complexity service, is calculated | ||
| Stunting (S) | Delay in Cognitive and Psychomotor Development | 100% | USD 560.52 | 2021 | USD 460.03 | Ministry of Health (2021) | Equivalent to 33% of occupational therapy costs, three times a week. | |
| (S+W) | (S+W) | 100% | . | . | USD 956.11 | Assumption | It is assumed to be equal to the maximum cost between the previous items | |
Table 2.
Years of life lost, years of life lost due to disability and DALYs for each cycle.
| t | YLL | YLD | DALYs | DALYs per-1,000 habitants |
|---|---|---|---|---|
| 1 | 9,161.57 | 3,942.97 | 13,104.54 | 25.56 |
| 2 | 54,245.38 | 10,587.72 | 64,833.10 | 126.48 |
| 3 | 57,471.01 | 10,820.21 | 68,291.22 | 133.22 |
| 4 | 57,394.77 | 11,593.28 | 68,988.04 | 134.58 |
| Total | 178,272.73 | 36,944.17 | 215,216.89 | 419.84 |
Table 3.
Direct and indirect Costs of Child Malnutrition for a Cohort of 512,611 Children Over Four Years (USD 2023).
Table 3.
Direct and indirect Costs of Child Malnutrition for a Cohort of 512,611 Children Over Four Years (USD 2023).
| Time (t) | Direct Costs | Indirect Costs |
|---|---|---|
| T=1 | $ 5.696.701,18 | $ 9.064.985,88 |
| T=2 | $ 26.443.277,65 | $ 15.305.211,76 |
| T=3 | $ 47.409.712,94 | $ 107.372.367,06 |
| T=4 | $ 49.369.400,00 | $ 111.833.529,41 |
| TOTAL | $ 128.919.089,41 | $ 243.576.094,12 |
Table 4.
Total Direct and Indirect Costs per Model Cycle (USD, 2023).
| Time (t) | Direct Costs | Indirect Costs | TOTAL |
|---|---|---|---|
| T=1 | $24,210.98 USD | $38,526.19 USD | $62,737.16 USD |
| T=2 | $112,383.93 USD | $65,047.15 USD | $177,431.08 USD |
| T=3 | $201,491.28 USD | $456,332.56 USD | $657,823.84 USD |
| T=4 | $209,819.95 USD | $475,292.50 USD | $685,112.45 USD |
| TOTAL | $547,906.13 USD | $1,035,198.41 USD | $1,583,104.54 USD |
Disclaimer/Publisher’s Note: The statements, opinions and data contained in all publications are solely those of the individual author(s) and contributor(s) and not of MDPI and/or the editor(s). MDPI and/or the editor(s) disclaim responsibility for any injury to people or property resulting from any ideas, methods, instructions or products referred to in the content. |
© 2024 by the authors. Licensee MDPI, Basel, Switzerland. This article is an open access article distributed under the terms and conditions of the Creative Commons Attribution (CC BY) license (http://creativecommons.org/licenses/by/4.0/).
Copyright: This open access article is published under a Creative Commons CC BY 4.0 license, which permit the free download, distribution, and reuse, provided that the author and preprint are cited in any reuse.


