
Submitted:
23 April 2023
Posted:
24 April 2023
You are already at the latest version
Preprints on COVID-19 and SARS-CoV-2
Abstract
The Chinese government has expressed great confidence in the role of green finance in fulfilling its carbon neutrality commitment. However, the effectiveness of green finance, especially under the impact of emergencies such as the COVID-19 pandemic scenario, requires further examination. Using data from 2000 to 2020 in China, the correlation between green finance and carbon dioxide (CO2) emissions has been analyzed, both in BaU scenario and the COVID-19 scenario. The following conclusions were drawn: (1) In BaU scenario, green finance can effectively reduce CO2 emissions, especially through government green expenditure and green credit; (2) In COVID-19 scenario, although there is no direct relationship between the pandemic and carbon emissions, the data shows that the pandemic has hindered the progress of green finance, weakened its ability to curb carbon emissions, and indirectly led to an increase in carbon emissions. This study not only clarifies the mechanism by which the COVID-19 pandemic affects carbon emissions through the green finance system but also addresses the common problem of data scarcity in green finance research.
Keywords:
Green finance
; Carbon dioxide emissions
; COVID-19 pandemic
; Impulse response model
1. Introduction
Over the last century, the average global ground temperature has increased by approximately 0.3-0.6 °C and is bound to increase another 1-3 °C by 2100. CO2 emissions comprise 77% of the total greenhouse gases. To mitigate climate change, countries worldwide have made efforts on different fronts. China’s total emissions in 2019 were 98.39 billion tons, making it the first in the world at 27.2% of global emissions1. Therefore, changes in CO2 emissions in China significantly affect global climate change. China has made many efforts toward CO2 emission reduction to promote healthy social development and exhibit its role as a responsible country. In September 2020, China announced at the United Nations General Assembly that it aims to attain carbon peak before 2030 and carbon neutrality before 2060 (a goal known as “30-60”).
The development of green finance, which can optimize resource allocation, is crucial in implementing a sustainable development strategy and facilitating the holistic green transition of economic and social development. Moreover, it benefits the research and development of renewable green energy and the upgrade of industrial infrastructure. In this case, green finance helps in the mitigation of CO2 emissions and impedes its progress.
In 2020, after the outbreak of the coronavirus disease (COVID-19), China opted for nationwide home quarantine. Consequently, production activities decreased sharply along with energy demand. However, following gradual economic recovery, CO2 emissions began increasing progressively.
This paper evaluates the efficiency of the green finance mechanism in China and its actual function on CO2 emission reduction. Further, it provides a useful reference for the transformation of economic development and the establishment of an efficient green finance system in the context of the ongoing pandemic.
The remainder of this paper is organized as follows. Section 2 gives a review of former research and Section 3 introduces data selection and methodology. Section 4 presents the simulation and results of the model in the COVID-19 pandemic context. Finally, concluding remarks and suggestions are provided in section 5.
2. Related Work
Since 2012, more and more studies focus on China’s CO2 emissions and emission reduction targets. Many studies have analyzed China’s carbon emission peak values, peak-reaching years, and the feasibility of achieving “30-60” from different perspectives [1,2,3,4,5]. Most of these studies performed empirical tests by finding the relationship between gross domestic product (GDP) or energy consumption and carbon emissions. Different methods were adopted in these studies. These include system dynamics (SD) [5,6,7,8], the IPAT model [9], life cycle assessment [10], the STIRPAT model [11], active data envelopment analysis [12], the Kaya identity method [13,14], input-output optimization mode [15], the industrial correlation model, and the multi-objective optimization model [16]. The conclusions of these studies also vary. Some scholars [4,7,14,15] believe that China could achieve its commitments while others remain uncertain [1,11,12,13]. With the increasing use of quantitative analysis tools, research on reducing carbon dioxide emissions has become more detailed. For instance, conditional judgment function, cluster analysis and other methods are used by scholars to discuss the CO2 emissions of different regions or provinces in China. The results show that some provinces have reached the peak of CO2 emission, while some have not. Therefore, CO2 emission reduction tasks should be further divided according to different production efficiency in different regions [17,18].
Finance plays an important role in resource allocation to achieve carbon peak and carbon neutrality [19]. The emission reduction behavior of enterprises requires a large number of green and low-carbon investments, most of which need to be realized by mobilizing social capital through the financial system [20,21].
There are many studies on the impact of green finance on emission reduction through corporate behavior in China.
Research on the impact of green credit on corporate performance has attracted the attention of many scholars. He et al. constructs China’s green economy development index, and took 150 listed renewable energy companies as an example to build a threshold effect model of the nonlinear relationship between renewable energy investment and green economy development index from the perspective of green credit. The results show that the impact of renewable energy investment led by green credit on the green economic development index has a double threshold effect [22]. Wen et al. find that the green credit policy since 2012 has a significant negative impact on the R&D intensity and total factor productivity (TFP) of enterprises with emission reduction requirements. To some extent, it shows that China’s current green finance policy is not friendly to the transformation of high emission enterprises [23]. Song et al. choose to analyze the impact of green credit on enterprise energy utilization. The results show that from the cross provincial panel data of China from 2007 to 2017, green credit has a positive impact on the efficient utilization of energy in China from the perspective of environmental constraints [24]. Zhang et al. investigate the impact of green credit on environmental quality from a macro perspective and discussed its mechanism by using the fixed effect model and grey correlation analysis method and using the panel data of many provinces in China from 2007 to 2016. They find that green credit improves China’s overall environmental quality indeed [25].
Scholars also have some research results on green financial instruments in the equity market. literature [26] shows that the green credit policy has significantly improved the financing convenience for green listed companies, but the impact on financing costs has not yet fully manifested. At the same time, companies listed on the ChiNext Board of the Chinese stock market can obtain green innovation premiums [27]. Tang et al. present the first empirical study on the announcement returns and real effects of green bond issuance by firms in 28 countries during 2007-2017. They document that stock prices positively respond to green bond issuance. However, a consistently significant premium for green bonds isn’t found [28].
Only a few representative studies can be found for green funds and green insurance. Literature [29] believes that green financial instruments such as green insurance and green fund have promoted the inflow of social and private funds into green industries and enterprises.
Limited by sample size, carbon market research is relatively scarce, and Literature [30] find that carbon trading pilot policies induced green innovation activities of pilot enterprises, and green innovation activities of non-state-owned enterprises had a more significant induced response intensity to carbon trading.
Additionally, instead of considering a single green financial instrument, a few scholars established evaluation indicators from the perspective of overall green financial system. They empirically investigate the path mechanism of green finance development affecting green enterprise investment, and the similar conclusions as the research on the mechanism of green credit are taken [31,32].
Existing research shows that green finance affects carbon emissions in the following ways: optimizing the allocation of financial resources, improving the tendency of technological innovation, and transmitting signals. From a macro perspective, scholars have conducted empirical tests on the inhibitory effects of green finance, including green credits, green venture capital, carbon trading, green securities, and green insurance, on CO2 emissions. Academics widely affirm the inhibitory effect of green finance on CO2 emissions; however, there is no consensus on the indicators that drive the prohibitive effect.
Based on existing research, this paper draws the following insights:
- Existing studies mostly focus on the effect of a single green financial instrument on carbon emissions. Therefore, scholars and policy makers urgently need to systematically and comprehensively consider the whole green financial system.
- Scholars generally affirm the inhibitory effect of green finance on carbon emissions, but there is no unified answer as to how effective it is and which green financial instrument has the most significant inhibitory effect.
- At present, relatively few articles have analyzed the impact of COVID-19 on carbon emissions by considering the green finance system. Therefore, the analysis based on the epidemic variables is of great significance to the construction of green finance system and ecological construction in the post-epidemic era.
Therefore, we used the vector autoregressive (VAR) model, impulse response function, and variance decomposition analysis to empirically analyze the dynamic relationship between CO2 emissions and green finance by considering the COVID-19 shock to reveal the dynamic characteristics of their interactions.
3. The data
In this study, seasonal data from China from 2000 to 2020 were selected as samples to conduct the empirical analysis. To reduce volatility, we logarithmically processed all sample data to obtain LNCO2_GDP, LNGCL, LNGPE, LNGBD, LNGSC, and LNPTM. We investigated the dynamic relationship between green finance and CO2 emissions in the context of COVID-19. Three indicators needed to be specified: the measurement of green finance, the calculation of CO2 emissions, and the quantified measurement of the impact of the pandemic.
3.1. Selection of measurements for green finance
As green finance in China has not yet fully matured and the product of green finance is relatively singular and newly produced, its data are limited. Therefore, we represented green finance from four perspectives: green credits, green expenditures, green bonds, and green securities. The definitions of the relevant indices are presented in Table 1.
- (1)
- Green credits and loans (GCL): With regard to data accessibility, this study uses the total interest expenditure of industrial enterprises and deducts interest expenditure in high-energy-consumption industries as indicators. This indicator can reflect the supportive power from financial institutions such as banks and their restraint power on high-pollution and high-energy-consumption industries. The total interest expenditure of industrial enterprises and the interest expenditure of six high-energy-consuming enterprises come from the EPS database.
- (2)
- Green expenditures (GPE): Green expenditures help support the development and operation of green projects. This study uses fiscal expenditure for environmental protection as this indicator, which can reflect the government’s supportive power toward environmental protection industries. The environmental protection data are sourced from the National Bureau of Statistics (NBS).
- (3)
- Green bonds (GBD): Green bonds are mostly state-owned businesses that represent the tendency of national policy. Concerning the continuity of the data, this study uses the amount of national debt issued multiplied by around 10% as the amount of green bonds issued before 2016. The data for green debt from 2016 to 2020 are sourced from the Wind Financial Terminal (WFT).
- (4)
- Green securities (GSCs): In the green securities market, enterprises conduct project financing by issuing green stocks, which can improve production technology and facilitate enterprise upgrading and optimization. This study uses the market value of environmental enterprises as green securities. Data are sourced from the WFT.
3.2. Selection for the measurement of carbon dioxide emissions
This study estimates the amount of CO2 produced by the burning of three main energies. The logarithmic processing of the ratio of CO2 emissions to the gross national product was taken as the explained variables, and CO2 emissions were calculated according to the following formula
where CO2 is the amount of carbon dioxide emissions; is the amount of consumption for n energy, which can be obtained by The China Statistic Book; is the emission factor of CO2 for the n energy;, and is the carbon oxidation rate of energy. The carbon oxidation rate and the emission factor of CO2 for the three types of energy are presented in Table 2.
3.3. Variable selection for pandemic shock
During the early pandemic period, home quarantine was advocated nationwide, and unnecessary trips were reduced. Additionally, the resumption of work and production was delayed in various places. Hence, passenger capacity decreased dramatically. In Figure 1, the passenger capacity in China showed a V-shaped change during the pandemic period. In January 2020, the passenger capacity in China was 1274.15 million, decreasing by 10.1% from the previous year. However, the Spring Festival travel partly offset the impact of the pandemic. In February, when the pandemic broke out widely, the passenger capacity of the country was 186.45 million, decreasing by 88.3% from the previous year. The passenger capacity began to rise gradually after this. However, by the end of the year, passenger capacity still did not recover to the level of that of the same period in the previous year, and the annual passenger volume decreased by 45.1%. Therefore, passenger capacity can be used to represent the impact of the pandemic and study the impact of green finance on CO2 emissions in the context of the pandemic.
The descriptive statistics of each variable are in Table 3.
4. Construction of Vector Autoregressive Model
The VAR model is based on the statistical properties of the data and is often used to predict interconnected time series systems and analyze the dynamic shocks of stochastic perturbations on the system of variables. The mathematical expression of the VAR(p) model is as follows:
C is the constant vector, is the autoregressive coefficient matrix, and is the vector white noise.
4.1. Augmented Dickey-Fuller test
Running the VAR model requires ensuring data stationarity, and this study uses the augmented Dickey-Fuller (ADF) unit root test to verify the stationarity of the sample. If the test result accepts the original hypothesis, then the variable data are not stationary. As shown in Table 4, at a 5% confidence level, all variables fail to reject the original hypothesis until after the second-order difference and do not contain constant and trend terms.
4.2. Johansen cointegration test
As shown in Table 4, all variables are nonstationary series, and cointegration tests need to be conducted on each variable to determine whether a long-run equilibrium relationship exists. Because it contains multiple variables, the Johansen cointegration test was used in this study.
The optimal lag order was first determined by applying the Bayesian information criterion (BIC), and then the Hannan and Quinn (HQ) information criterion. According to the information in Table 4, after the second order, Akaike information criterion, BIC, and HQ become increasingly large as the lag order increased; thus, a lag order of 2 is more appropriate; details are illustrated in Table 5.
The Johansen test has two methods, the eigenroot and maximum eigenvalue tests; the former was used in this study. As the test results in Table 6 show, a cointegration relationship existed between all variables at a 5% significance level.
4.3. Granger causality test
The Granger causality test was used to examine whether a causal relationship exists between CO2 emissions and green finance. As shown in Table 7, at the 5% confidence level, green bonds, green credits, green expenditures, and passenger traffic are Granger causes of carbon intensity, which refers to CO2 emissions per unit of GDP (CO2/GDP), when they are combined but not as individual variables. This may be because the development of green finance in China has not developed to a sufficient scale and influence to produce a significant causal relationship between individual green finance instruments and carbon intensity. Therefore, carbon intensity is still considered to be influenced by green finance and the pandemic. On the one hand, the higher the level of green finance development, the higher the number of loans obtained by environmental projects. The enterprises undertaking energy saving and emission reduction projects can also take advantage of the good green finance environment to issue green securities, which widens the source of funds. On the other hand, sufficient funding sources ensure the alternate renewal of equipment. This allows new energy sources to accelerate the replacement of old energy sources and further curb CO2 emissions.
4.4. Modeling VAR
The estimated VAR is stable if the reciprocal of all its root modes is less than 1; that is, it lies within the unit circle. As shown in Figure 2, when lag order is 2, all points are within the unit circle, indicating that the VAR model is stable.
The VAR estimates obtained for LNCO2_GDP, LNGCL, LNGPE, LNGBD, LNGSC, and LNPTM are as in Table 8.
The results of the equations are satisfactory. According to the estimation results, we know the following:
- The CO2/GDP in the current period is affected by its own lag, and the effect of lagging in one period is significantly greater than that of lagging in two periods. Furthermore, the CO2/GDP in the current period increased by 1.7941% whereas those in the previous period increased by 1%.
- The coefficient of each green financial instrument is negative, indicating that the current period’s CO2/GDP and green finance were negatively correlated; the higher the degree of green finance development, the more obvious the effect on CO2 emission reduction. Among green financial instruments, green credits have the strongest inhibitory effect on carbon emissions. However, they show an inhibitory effect only in the lag 2 period. A 1% increase in the size of green credits with a lag of two periods is associated with a 0.021827% decrease in CO2 emissions per unit of GDP in the period. Individual green financial instruments have a smaller impact on carbon emissions.
- Pandemic shocks also have an impact on CO2/GDP, with a more pronounced boosting effect than a dampening effect. The occurrence of the pandemic forces a sharp decrease in passenger traffic and a 1% decrease in passenger traffic with a lag of two periods results in a 0.013759% increase in CO2/GDP in this period.
4.5. Impulse response
The impulse response function focuses on the degree of response of the endogenous variables when given a shock from an error term. It explores the effect of this shock that reaches a maximum within a few lags and at what point this effect tapers to zero.
As shown in Figure 3, CO2/GDP (LNCO2_GDP) was subject to the largest shock in the previous period. That is, if CO2 is not fully neutralized in the current period, carbon emissions will increase faster in the next period, increasing the impact on the climate and environment. Therefore, if we do not achieve the goal of “carbon neutrality” as soon as possible, the cumulative increase in carbon dioxide will keep increasing the climate, and human survival will face a great challenge.
As shown in Figure 4a,b, the CO2/GDP (LNCO2_GDP) gradually decreases from period 1 in the face of the impact of green bonds, reaching the maximum suppression effect in period 10, and then begins to weaken. Similarly, green securities show a dampening effect on carbon emissions, with the greatest dampening effect in period 7. Both green bonds and green securities can influence carbon emissions in the short term.
As shown in Figure 4c,d, CO2/GDP (LNCO2_GDP) does not decrease immediately in the face of the shocks of green expenditures and green credits but rather first has a small increase, and then starts to decrease, showing a suppressive effect. This may be due to the lag period of the effects of green expenditures and green credits. Although green credits can cut the capital sources of high-energy-using and high-polluting enterprises to a certain extent and inhibit their expansion, the maintenance of other capital sources and enterprises’ own capital can still keep these enterprises unaffected in the short term. High-energy industries can contribute greatly to GDP growth while polluting the environment. Correspondingly, as part of fiscal spending, green expenditures can only show its long-term inhibiting effect. Initially, green expenditures may only be used for constructing environmental projects, which have not yet started their formal operations and therefore have no significant impact on carbon emissions. Once the project begins operations, the curbing effect on carbon emissions is much stronger than that of the other three and continues becoming stronger with time.
As shown in Figure 5, the impact of passenger traffic on CO2/GDP (LNCO2_GDP) fluctuates slightly but generally shows a boosting effect. On the one hand, the increase in passenger traffic will lead to the development of related industries (e.g., tourism, restaurants, and accommodation), thus contributing to GDP growth. On the other hand, the increase in passenger traffic will inevitably lead to an increase in energy consumption by all types of transportation, which, in turn, will increase CO2 emissions. Although the number of passengers decreased significantly during the pandemic, the pandemic also dealt a heavy blow to various industries, and China’s GDP experienced negative growth in the first half of 2020. Thus, it can be inferred that the pandemic caused a small increase in carbon emissions.
Additionally, green securities, green credits, and green bonds all show positive dynamic responses to the shocks of green expenditures. This shows that China’s green financial system is highly influenced by policy guidance (Figure 5). Among them, green securities show a negative dynamic response to the shock of green expenditures in the first few periods. However, it cannot be assumed that the increase in green expenditures will inhibit the development of green securities. This may be because both green credits and green bonds are under government control and are consistent in policy direction. In contrast, green securities are influenced by a series of factors, such as the economic environment, market outlook, and investors’ psychological expectations, and the response to green expenditures is volatile (Figure 6).
4.6. Variance decomposition
The contribution of each factor to carbon emissions was explored using variance decomposition. The results show that the fluctuation of CO2/GDP (LNCO2_GDP) mainly originates from its own shock, which still has a large proportion until the 30th period (Table 9). If we follow the old strategy of polluting first and then treating, then polluting, and then treating as done in Western countries, it will take considerable time and effort to restore the ecological environment. Although China’s green development has begun bearing fruit, achieving the goal of carbon neutrality is still a huge challenge.
Green finance and passenger traffic also have an impact on CO2/GDP (LNCO2_GDP). The contribution of green bonds is low in the first four periods, increases from the fifth period to a maximum of 10.6355%, and then start decreasing. The contribution of green securities gradually increases from the second period to a maximum of 13.65456% and then starts decreasing. The contribution of green credits fluctuates in the initial period and reaches a maximum of 12.60808% only in the 26th period. The contribution of green expenditures increases significantly from the 11th period onwards but continues to grow, reaching 46.06681% in the 30th period. This may be because environmental companies can quickly invest the funds raised for environmental projects due to the constraints of their business scope and their specialized expertise and talents, which in turn have an impact on CO2 emissions. However, green expenditures will only work in the long term because of the long upfront construction cycle. This is consistent with the results of the impulse response analysis.
The lack of significant Granger causality between each green finance instrument and CO2 emissions does not prove that there no causal relationship exists between green finance and carbon emissions. To illustrate the relationship between green finance and CO2 emissions more intuitively, this study explores the relationship between green finance, CO2 emissions, and the impact of the pandemic based on the results of variance decomposition and the weight of the contributions of green bonds, green credits, green expenditure, and green securities in the 25th period to carbon emissions as their respective weights in the green financial system. The contributions of these instruments to carbon emissions in period 25 are 5.71%, 12.54%, 35.45%, and 6.96%, respectively. Dividing by their total, 60.65%, we obtain their weights in the green financial system gives results of 9.41%, 20.67%, 58.45%, and 11.47%, respectively. Repeating the above steps for green finance (LNGF), CO2/GDP (LNCO2_GDP), and passenger traffic (LNPTM), a significant Granger causality was found between green finance and CO2/GDP. Granger causality was also found between green finance and pandemics and CO2/GDP. Green finance has a significant inhibitory effect on CO2/GDP, with a contribution of 71.07%, and the pandemic has a lesser positive contribution to carbon emissions. The related impulse responses and variance decomposition results are as in Figure 7 and Figure 8.
5. Conclusions
According to the impulse response results and the Granger causality test, a single green financial instrument has an inhibitory effect on CO2 emissions. However, the causal relationship is not obvious. The green financial system, composed of various green financial instruments, has an obvious inhibitory effect on CO2 emissions, and the contribution of green finance to CO2 emissions is very large. This shows the construction of the green finance system in China has achieved initial results. Green finance can realize energy conservation, emission reduction, and ecological improvement and contribute to the sustainable development of society. However, the development level of green finance in China needs to be improved.
In BaU(Basic as Usual) scenario, in the green financial system, green credits, green bonds, and green securities are also positively affected by green expenditure. The increase in green expenditure can promote the scale of other green financial instruments through policy transmission, further magnifying the effect on CO2 emissions. The importance of green expenditure in the green financial system also reflects the government’s macro-control over various industries. In the short term (e.g., periods 1-10), the order of contributions of various green financial instruments to CO2 emissions from large to small is green securities, green credits, green bonds, and green expenditure. In the long run, the order of contribution degree of each green financial instrument to CO2 emissions from high to low is a green expenditure, green credits, green securities, and green bonds.
In Covid-19 scenario, the impact of the pandemic has contributed to the rise in CO2/GDP. On the one hand, the pandemic had a direct positive impact on CO2/GDP, but the impact was small, and the contribution to CO2 emissions was low. On the other hand, the pandemic indirectly contributed to carbon emissions by affecting the development of green finance. The impulse response after changing variable order shows that the pandemic had an inhibitory effect on green bonds, green expenditure, green securities, and green credits and made a large contribution to them with a strong inhibitory effect. Therefore, the COVID-19 outbreak reduced the scale of green expenditure, green credits, and green securities, weakened the inhibition of CO2 emissions by green finance, and indirectly increased CO2/GDP.
Therefore, for China’s green financial system, this study provides the following suggestions. The existing green financial products in China still take traditional credit, insurance, securities, and other financial instruments as the main content, and these financial instruments have only simple provisions on the use of funds. Therefore, the market for green financial products in China needs further exploration. Although China has made new attempts at pollutant emission rights, carbon emission trading rights, and environmental protection technologies in recent years, mature financial products have not yet been formed, let alone widely recognized by the market. Therefore, strengthening the innovation of green financial products, developing financial instruments suitable for different scenarios, especially strengthening the effective operation of the carbon trading market, and ensuring the comprehensive and balanced development of green finance are necessary. Additionally, the pandemic indirectly affects CO2 emissions through the green finance system. Therefore, to prevent the negative impact of the pandemic on carbon peak values and carbon neutrality, the green finance system should be maintained as before the pandemic, especially green financial expenditure.
In the long run, green finance contributes the most to CO2 emission reduction through green expenditure and green credits, which are led by government and commercial banks, respectively, and their effects have a lag time. Achieving long-term development of green finance in China requires realization of market-led development so that the market can allocate resources in the fastest and most effective way. First, in addition to commercial banks, insurance companies, fund companies, and other non-bank financial institutions should also be involved. For some small and micro enterprises with immature technology and the inability to promote low-carbon development or meet the support threshold of commercial banks or policy banks, non-banking financial institutions can find individual and corporate investors to invest capital and introduce private capital to support and promote the low-carbon development of enterprises. Second, enterprises should actively participate in green development. In contrast with that in Western countries, the development of green finance in China is led by the government and dominated by financial institutions. Compared with the former two, the enthusiasm and importance of enterprises are not enough, but this is exactly where the green finance mechanism in China needs to be improved. As groups scattered in every corner of society, enterprises have enough strength and ability to participate in green finance practices. Therefore, strengthening the publicity and guidance of enterprises and improving the consciousness of the responsibility of enterprises to participate in energy conservation and emission reduction work is necessary.
Author Contributions
Wei Chen: Conceptualization, Methodology, Software. Shousong Cai: Conceptualization, Methodology, Software. Yuan Tian: Investigation, Data curation, Writing, Funding acquisition. Luxi Li: Visualization, Investigation, Writing-review & editing.
Data Availability Statement
The datasets used to support the findings of this study are available from the corresponding author upon request.
Acknowledgments
This research was supported by the Humanities and Social Sciences Foundation of the Chinese Ministry of Education “Research on the Impact of China’s OFDI on Green Technology Innovation in Countries Along the Belt and Road” (grant number 19YJCZH113) and Shanghai Decision Making Consulting Project (grant number 2022-Z-J08-B).
Conflicts of Interest
The authors declare no conflict of interest.
References
- Zhao, X.B.; Du, D. Forecasting carbon dioxide emissions. Journal of Environmental Management 2015, 160, 39–44. [Google Scholar] [CrossRef]
- Wang, Y.F.; Liang, S. Carbon dioxide mitigation target of China in 2020 and key economic sectors. Energy Policy 2013, 58, 90–96. [Google Scholar] [CrossRef]
- Auffhammer, M.; Steinhauser, R. Forecasting the path of US CO2 emissions using state-level information. Review of Economics and Statistics 2012, 94, 172–185. [Google Scholar] [CrossRef]
- He, J.K. An analysis of China’s CO2 emission peaking target and pathways. Advances in Climate Change Research 2014, 5, 155–161. [Google Scholar] [CrossRef]
- Liu, X.; Mao, G.Z.; Ren, J.; Li, R.Y.M.; Guo, J.H.; Zhang, L. How might China achieve its 2020 emissions target? A scenario analysis of energy consumption and CO2 emissions using the system dynamics model. Journal of Cleaner Production 2015, 103, 401–410. [Google Scholar] [CrossRef]
- Zhang, L.B.; Jiang, Z.J.; Liu, R.K.; Tang, M.J.; Wu, F. Can China achieve its CO2 emission mitigation target in 2030: A system dynamics perspective. Polish Journal of Environmental Studies 2018, 27, 2861–2871. [Google Scholar] [CrossRef]
- Yu, X.Y.; Wu, Z.M.; Wang, Q.W.; Sang, X.Z.; Zhou, D.Q. Exploring the investment strategy of power enterprises under the nationwide carbon emissions trading mechanism: A scenario-based system dynamics approach. Energy Policy 2020, 140, 111409. [Google Scholar] [CrossRef]
- Tian, Y.; Li, L.X. Will COVID-19 affect China's peak CO2 emissions in 2030? An analysis based on the systems dynamics model of green finance. Journal of Cleaner Production 2022, 131777. [Google Scholar] [CrossRef]
- Li, F.F.; Xu, Z.; Ma, H. Can China achieve its CO2 emissions peak by 2030? Ecological Indicators 2018, 84, 337–344. [Google Scholar] [CrossRef]
- Zhao, X.L.; Cai, Q.; Zhang, S.F.; Luo, K.Y. The substitution of wind power for coal-fired power to realize China’s CO2 emissions reduction targets in 2020 and 2030. Energy 2017, 120, 164–178. [Google Scholar] [CrossRef]
- Xu, L.; Chen, N.; Chen, Z. Will China make a difference in its carbon intensity reduction targets by 2020 and 2030? Applied Energy 2017, 203, 874–882. [Google Scholar] [CrossRef]
- Wu, L.P.; Zhu, Q.Y. Impacts of the carbon emission trading system on china’s carbon emission peak: A new data-driven approach. Natural Hazards 2021, 107, 2487–2515. [Google Scholar] [CrossRef] [PubMed]
- Qi, Y.; Stern, N.; He, J.K.; Lu, J.Q.; Liu, T.L.; King, D.; Wu, T. The policy-driven peak and reduction of China’s carbon emissions. Advances in Climate Change Research 2020, 11, 65–71. [Google Scholar] [CrossRef]
- Zheng, T.L.; Zhu, J.L.; Wang, S.P.; Fang, J.Y. When will China achieve its carbon emission peak? National Science Review 2015, 3, 8–12. [Google Scholar] [CrossRef]
- Mi, Z.F.; Wei, Y.M.; Wang, B.; Meng, J.; Liu, Z.; Shan, Y.L.; Liu, J.R.; Guan, D.B. Socioeconomic impact assessment of China’s CO2 emissions peak prior to 2030. Journal of Cleaner Production 2017, 142, 2227–2236. [Google Scholar] [CrossRef]
- He, Y.; Liao, N.; Lin, K.R. Can China’s industrial sector achieve energy conservation and emission reduction goals dominated by energy efficiency enhancement? A multi-objective optimization approach. Energy Policy 2021, 149, 112108. [Google Scholar] [CrossRef]
- Li, Y.; Wei, Y.G.; Zhang, X.L.; Tao, Y. Regional and provincial CO2 emission reduction task decomposition of China’s 2030 carbon emission peak based on the efficiency, equity and synthesizing principles. Structural Change and Economic Dynamics 2020, 53, 237–256. [Google Scholar] [CrossRef]
- Jiang, H.Y.; Duan, Y.R.; Zhang, Z.; Cao, L.B.; Xu, S.D.; Zhang, L.; Cai, B.F. Study on peak CO2 emissions of typical large cities in China. Advances in Climate Change Research 2021, 17, 131–139. [Google Scholar]
- Tian, Y.; Chen, W.; Zhu, S.Z. Does financial macroenvironment impact on carbon intensity: evidence from ARDL-ECM model in China. Natural Hazards 2017, 88, 759–777. [Google Scholar] [CrossRef]
- Fulton, M.; Capalino, R. Investing in the clean trillion: closing the clean energy investment gap; Ceres: Boston, 2014. [Google Scholar]
- IEA. World Energy Outlook; International Energy Agency: Paris, 2015. [Google Scholar]
- He, L.Y.; Zhang, L.H.; Zhong, Z.Q.; Wang, D.Q.; Green credit, F.W. renewable energy investment and green economy development: Empirical analysis based on 150 listed companies of China. Journal of cleaner production 2019, 208, 363–372. [Google Scholar] [CrossRef]
- Wen, H.W.; Lee, C.C.; Green credit policy, F.X.Z. credit allocation efficiency and upgrade of energy-intensive enterprises. Energy Economics 2021, 94, 105099. [Google Scholar] [CrossRef]
- Song, M.L.; Xie, Q.J.; Shen, Z.Y. Impact of green credit on high-efficiency utilization of energy in China considering environmental constraints. Energy Policy 2021, 153, 112267. [Google Scholar] [CrossRef]
- Zhang, K.; Li, Y.C.; Qi, Y.; Shao, S. Can green credit policy improve environmental quality? Evidence from China. Journal of Environmental Management 2021, 298, 113445. [Google Scholar] [CrossRef] [PubMed]
- Niu, H.P.; Zhang, X.Y.; Zhang, P.D. Institutional change and effect evaluation of green finance policy in China: Evidence from green credit policy. Management Review 2020, 32, 3–12, [in Chinese]. [Google Scholar]
- Fang, X.M.; Na, J.L. Stock market reaction to green innovation: Evidence from GEM firms. Economic Research Journal 2020, 55, 106–123, [in Chinese]. [Google Scholar]
- Tang, D.Y.J.; Zhang, Y.P. Do shareholders benefit from green bonds? Journal of Corporate Finance 2020, 61, 101427. [Google Scholar] [CrossRef]
- Gilbert, S.; Zhou, L.H. The knowns and unknowns of China’s green finance; The New Climate Economy: Beijing, 2017. [Google Scholar]
- Qi, S.Z.; Lin, S.; Cui, J.B. Do environmental rights trading schemes induce green innovation? Evidence from listed firms in China. Economic Research Journal 2018, 53, 129–143, [in Chinese]. [Google Scholar]
- Wang, K.S.; Sun, X.R.; Wang, F.R. Development of green finance, debt maturity structure and investment of green enterprise. Finance Forum 2019, 24, 9–19, [in Chinese]. [Google Scholar]
- Wang, K.S.; Sun, X.R.; Wang, F.R. Green finance, financing constrains and the investment of polluting enterprise. Contemporary Economic Management 2019, 41, 83–96, [in Chinese]. [Google Scholar]
| 1 |
Figure 1.
China’s passenger traffic and growth rate during the COVID-19 pandemic. Data sources: National Bureau of Statistics.
Figure 1.
China’s passenger traffic and growth rate during the COVID-19 pandemic. Data sources: National Bureau of Statistics.
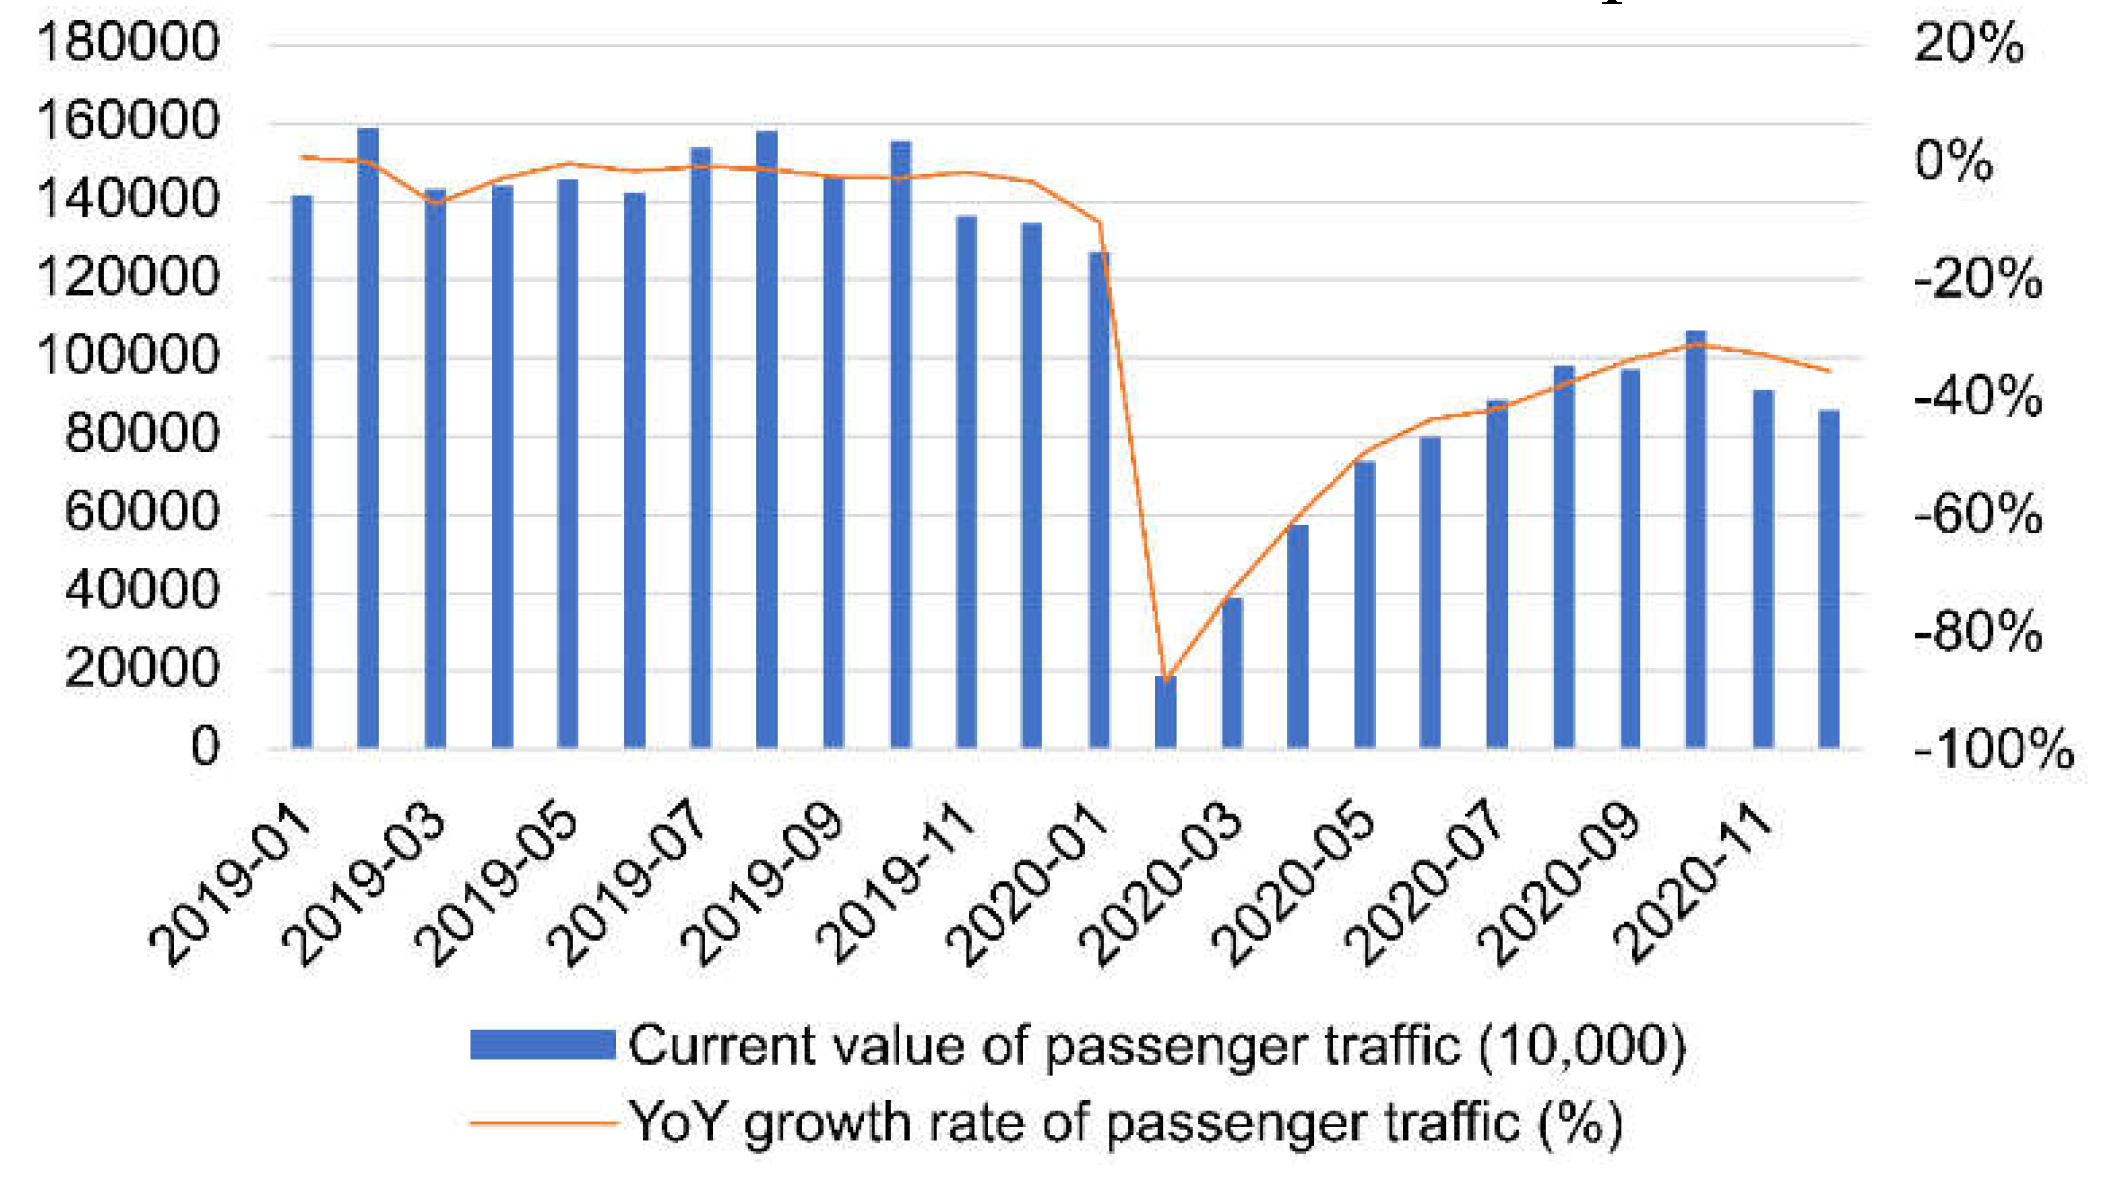
Figure 2.
Unit root test.
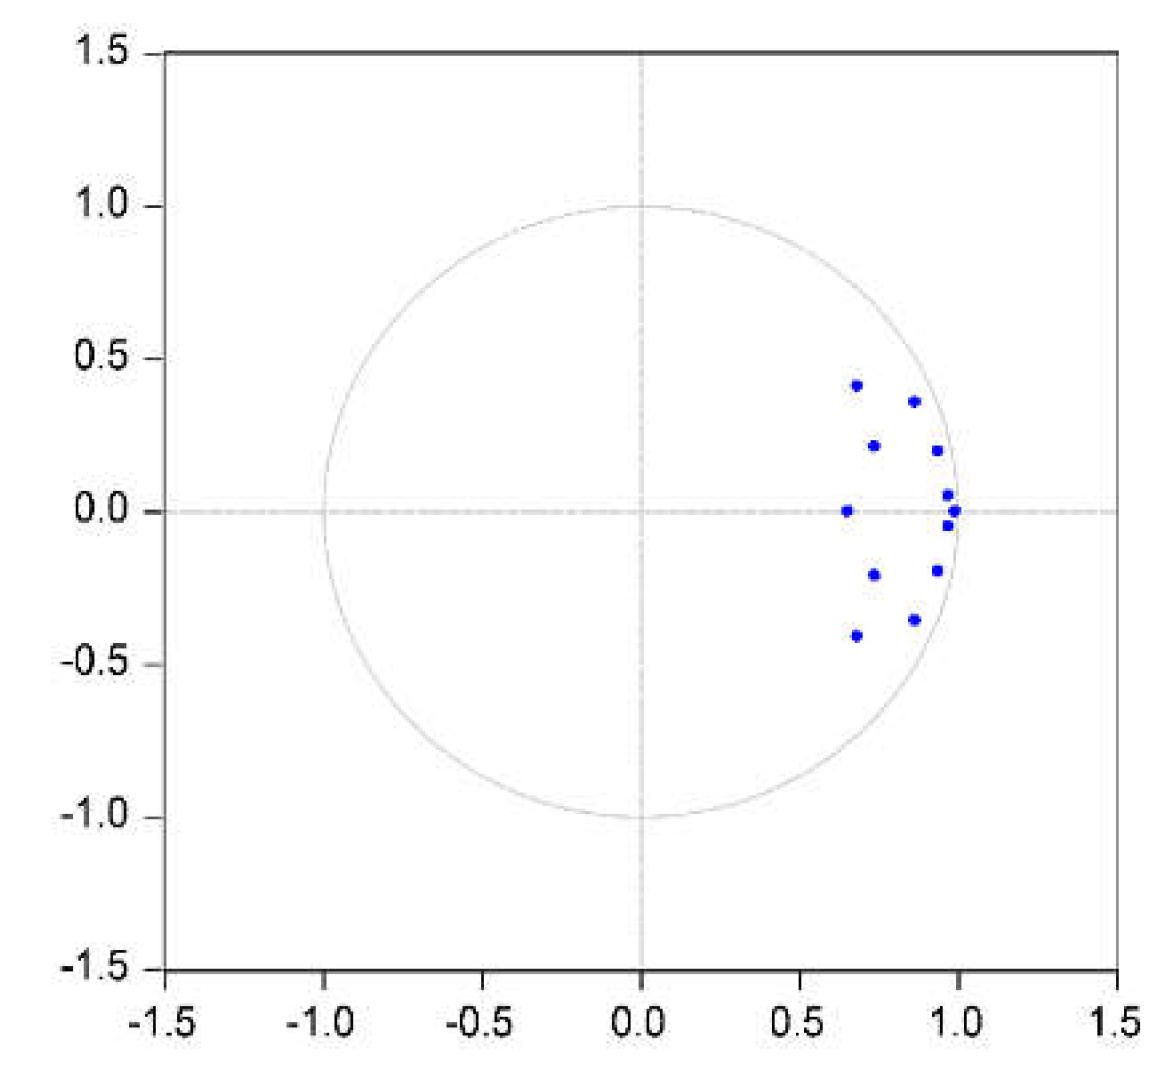
Figure 3.
Dynamic response of CO2 emissions per unit of GDP to own shocks.
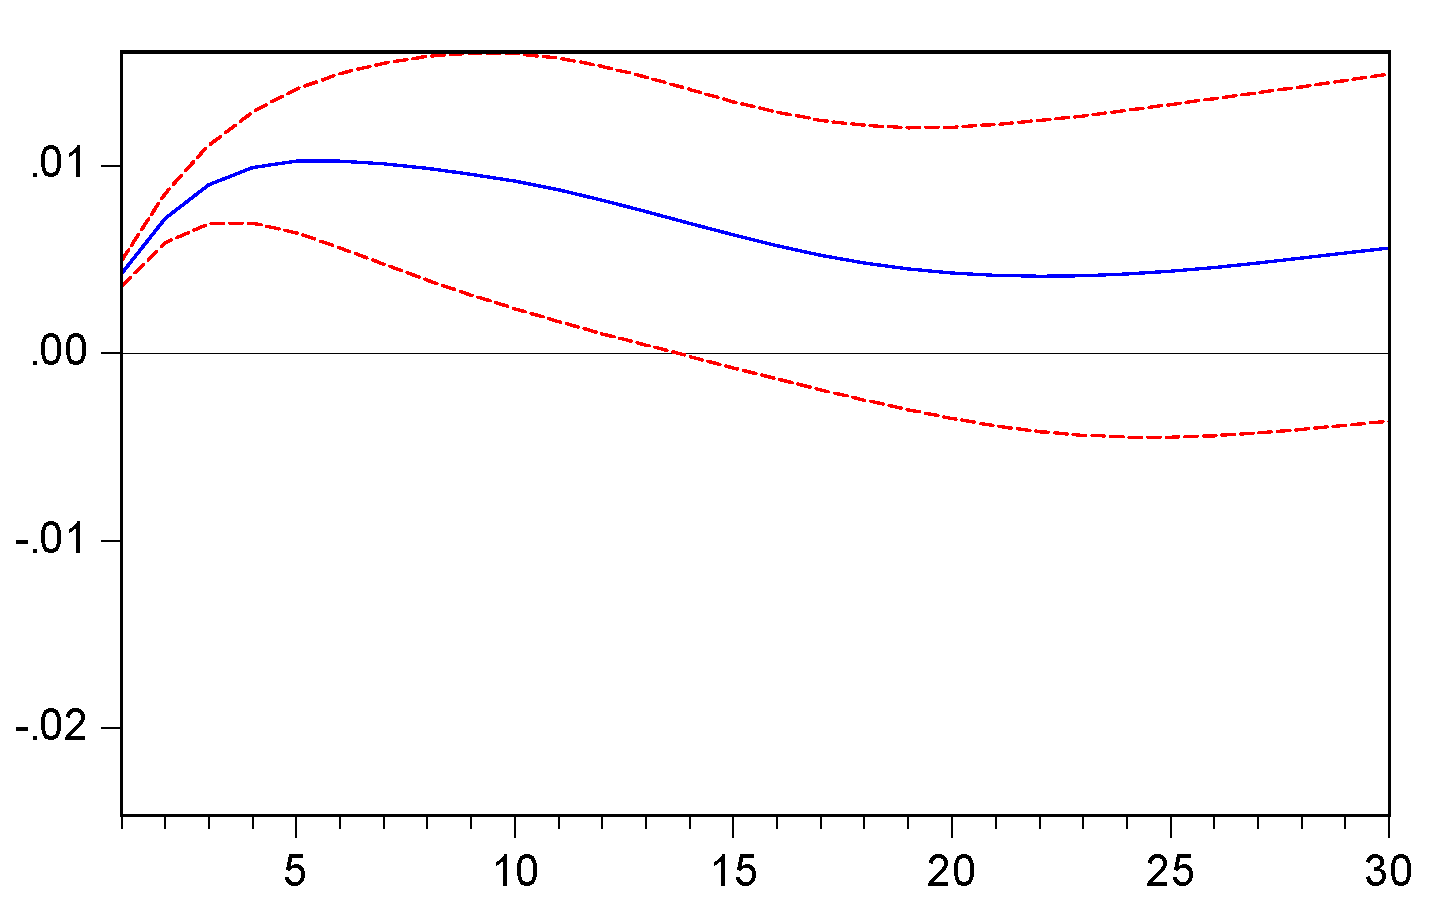
Figure 4.
Dynamic reflection of CO2 emissions per unit of GDP on green finance shocks.
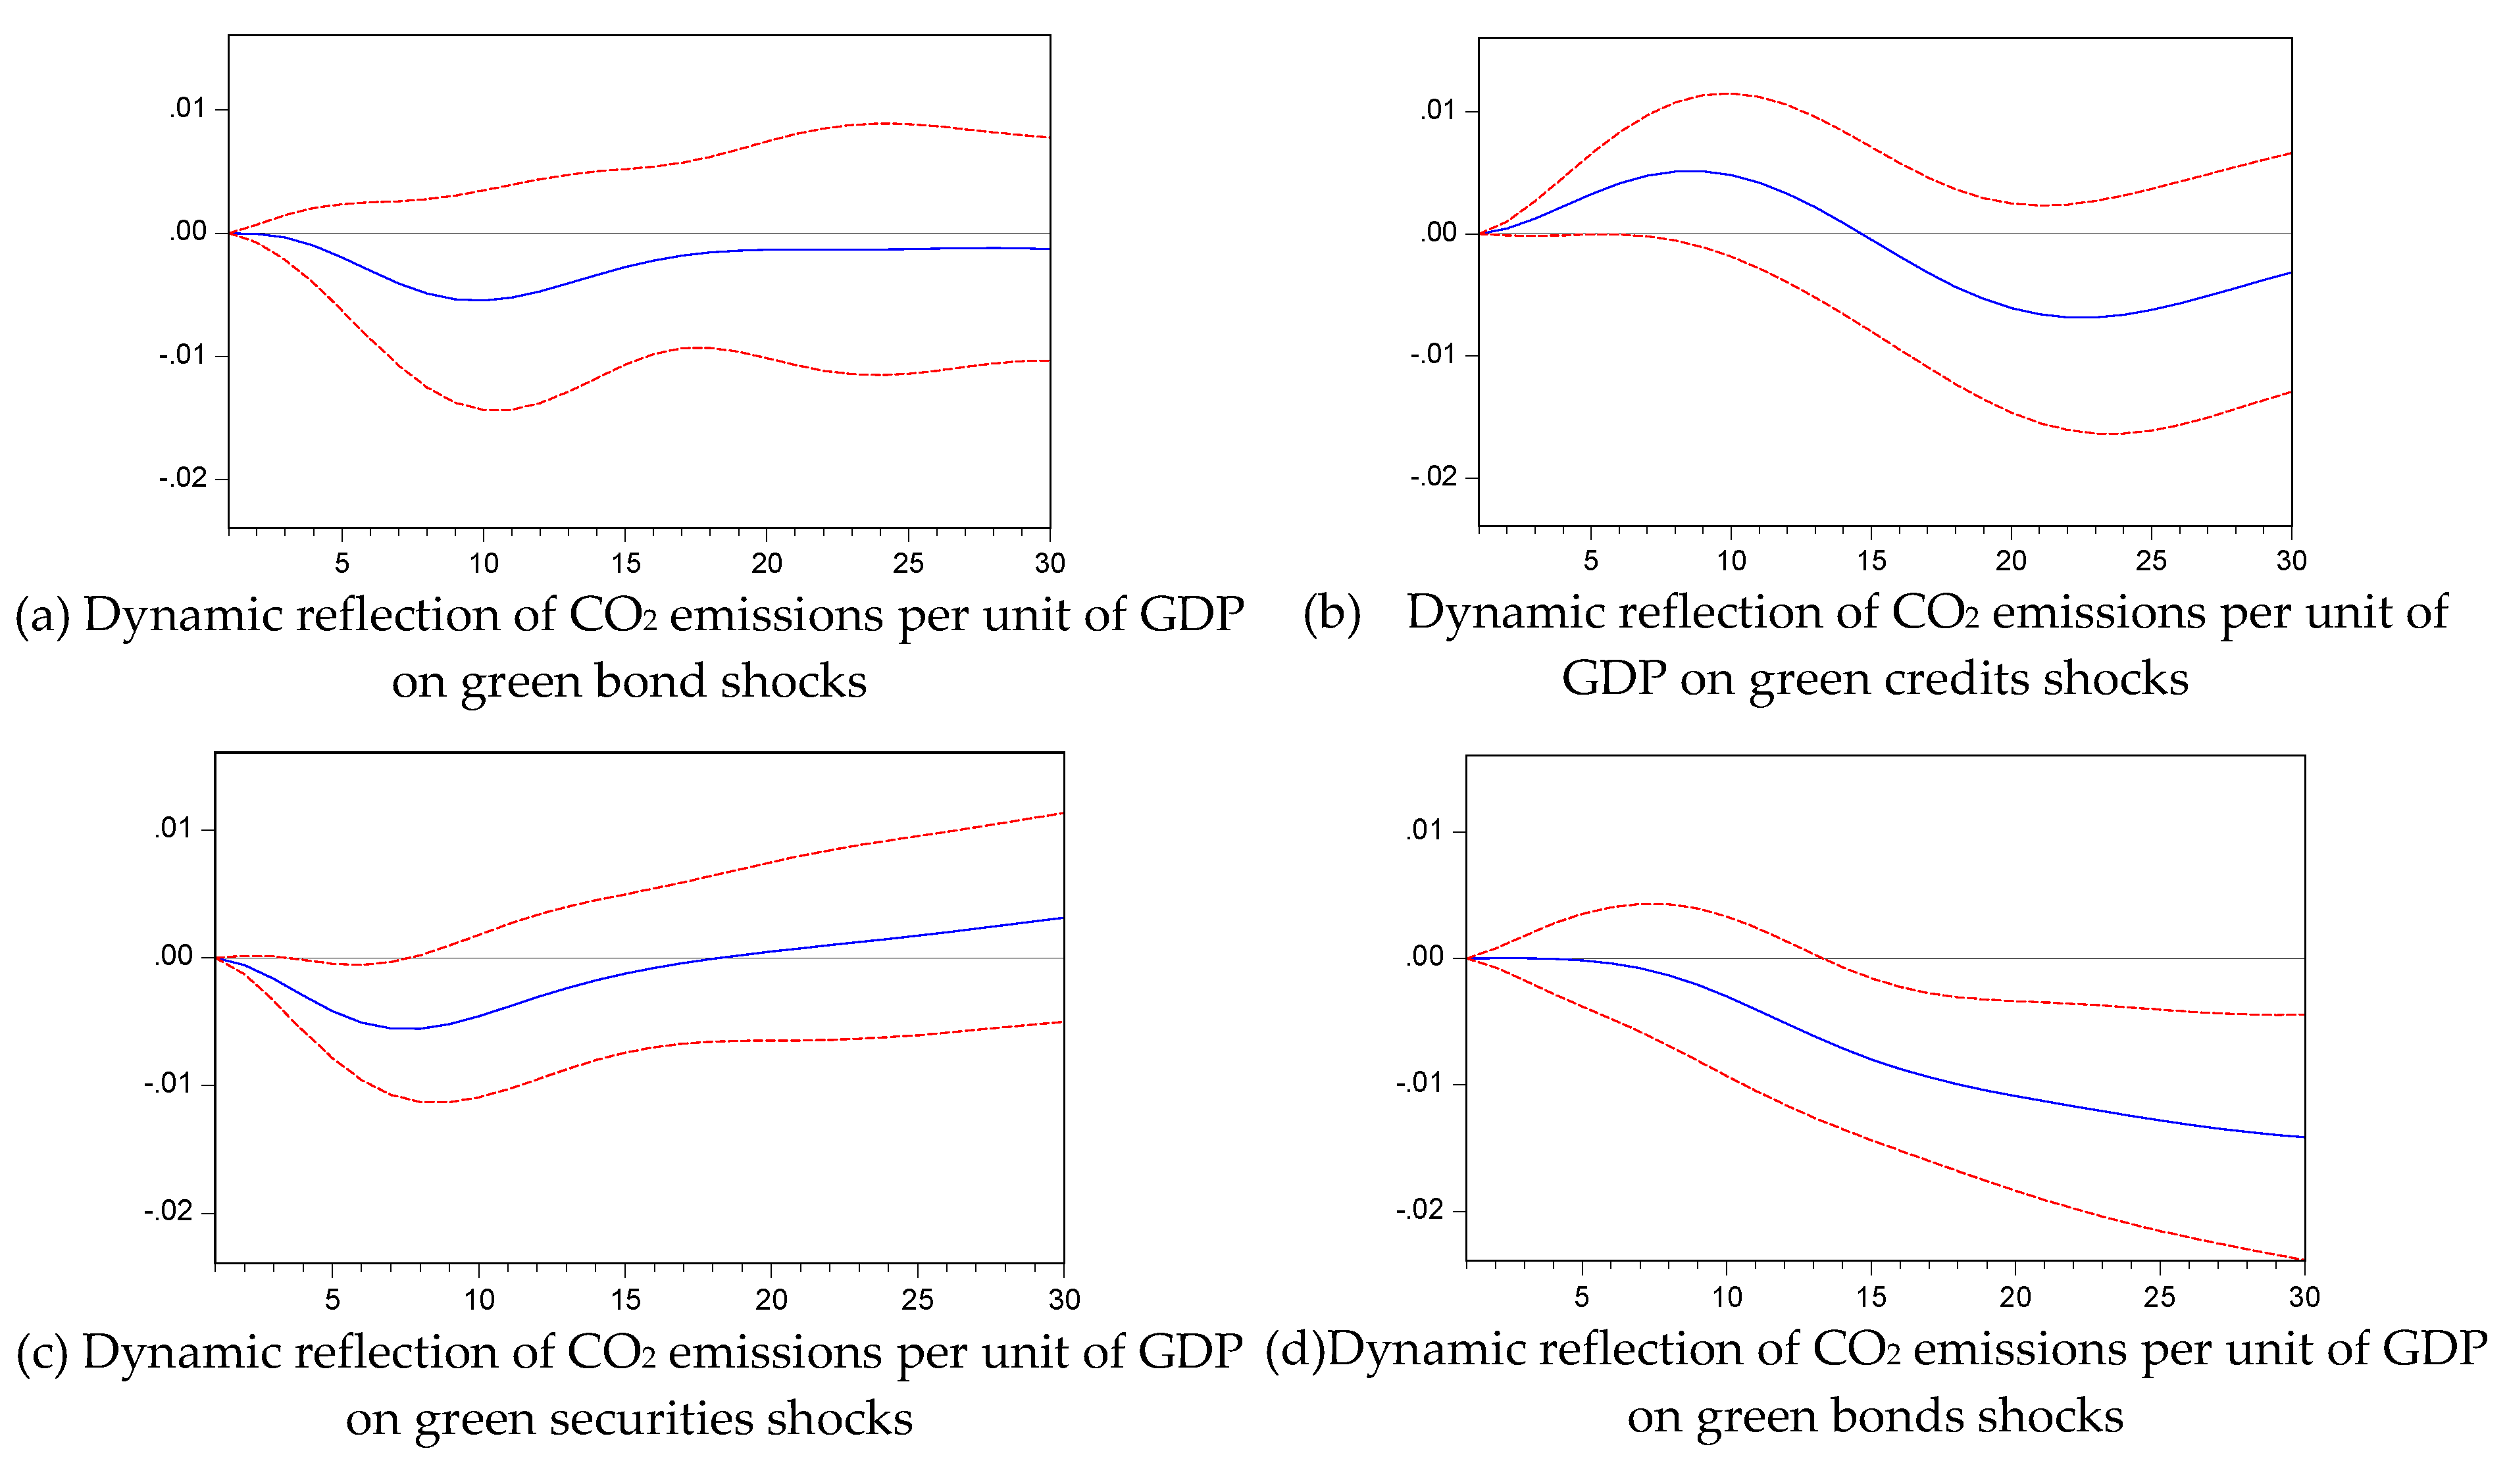
Figure 5.
Dynamic reflection of CO2 emissions per unit of GDP on passenger traffic shocks.
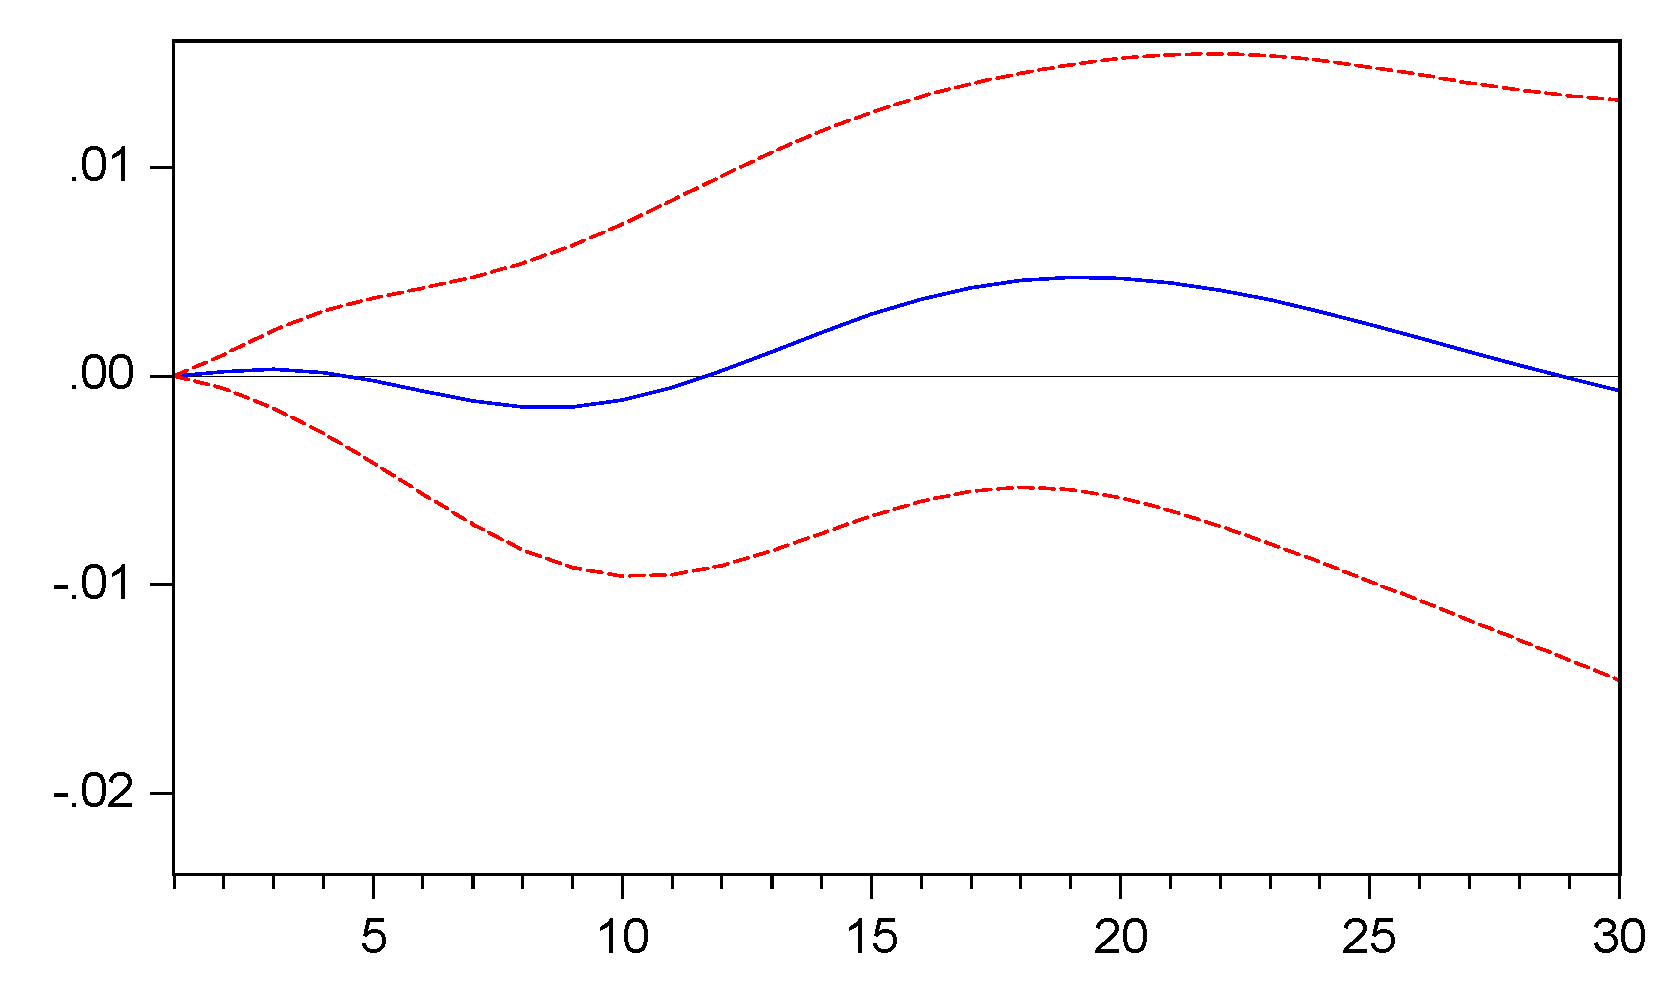
Figure 6.
Dynamic reflection of green finance on green expenditures shocks.
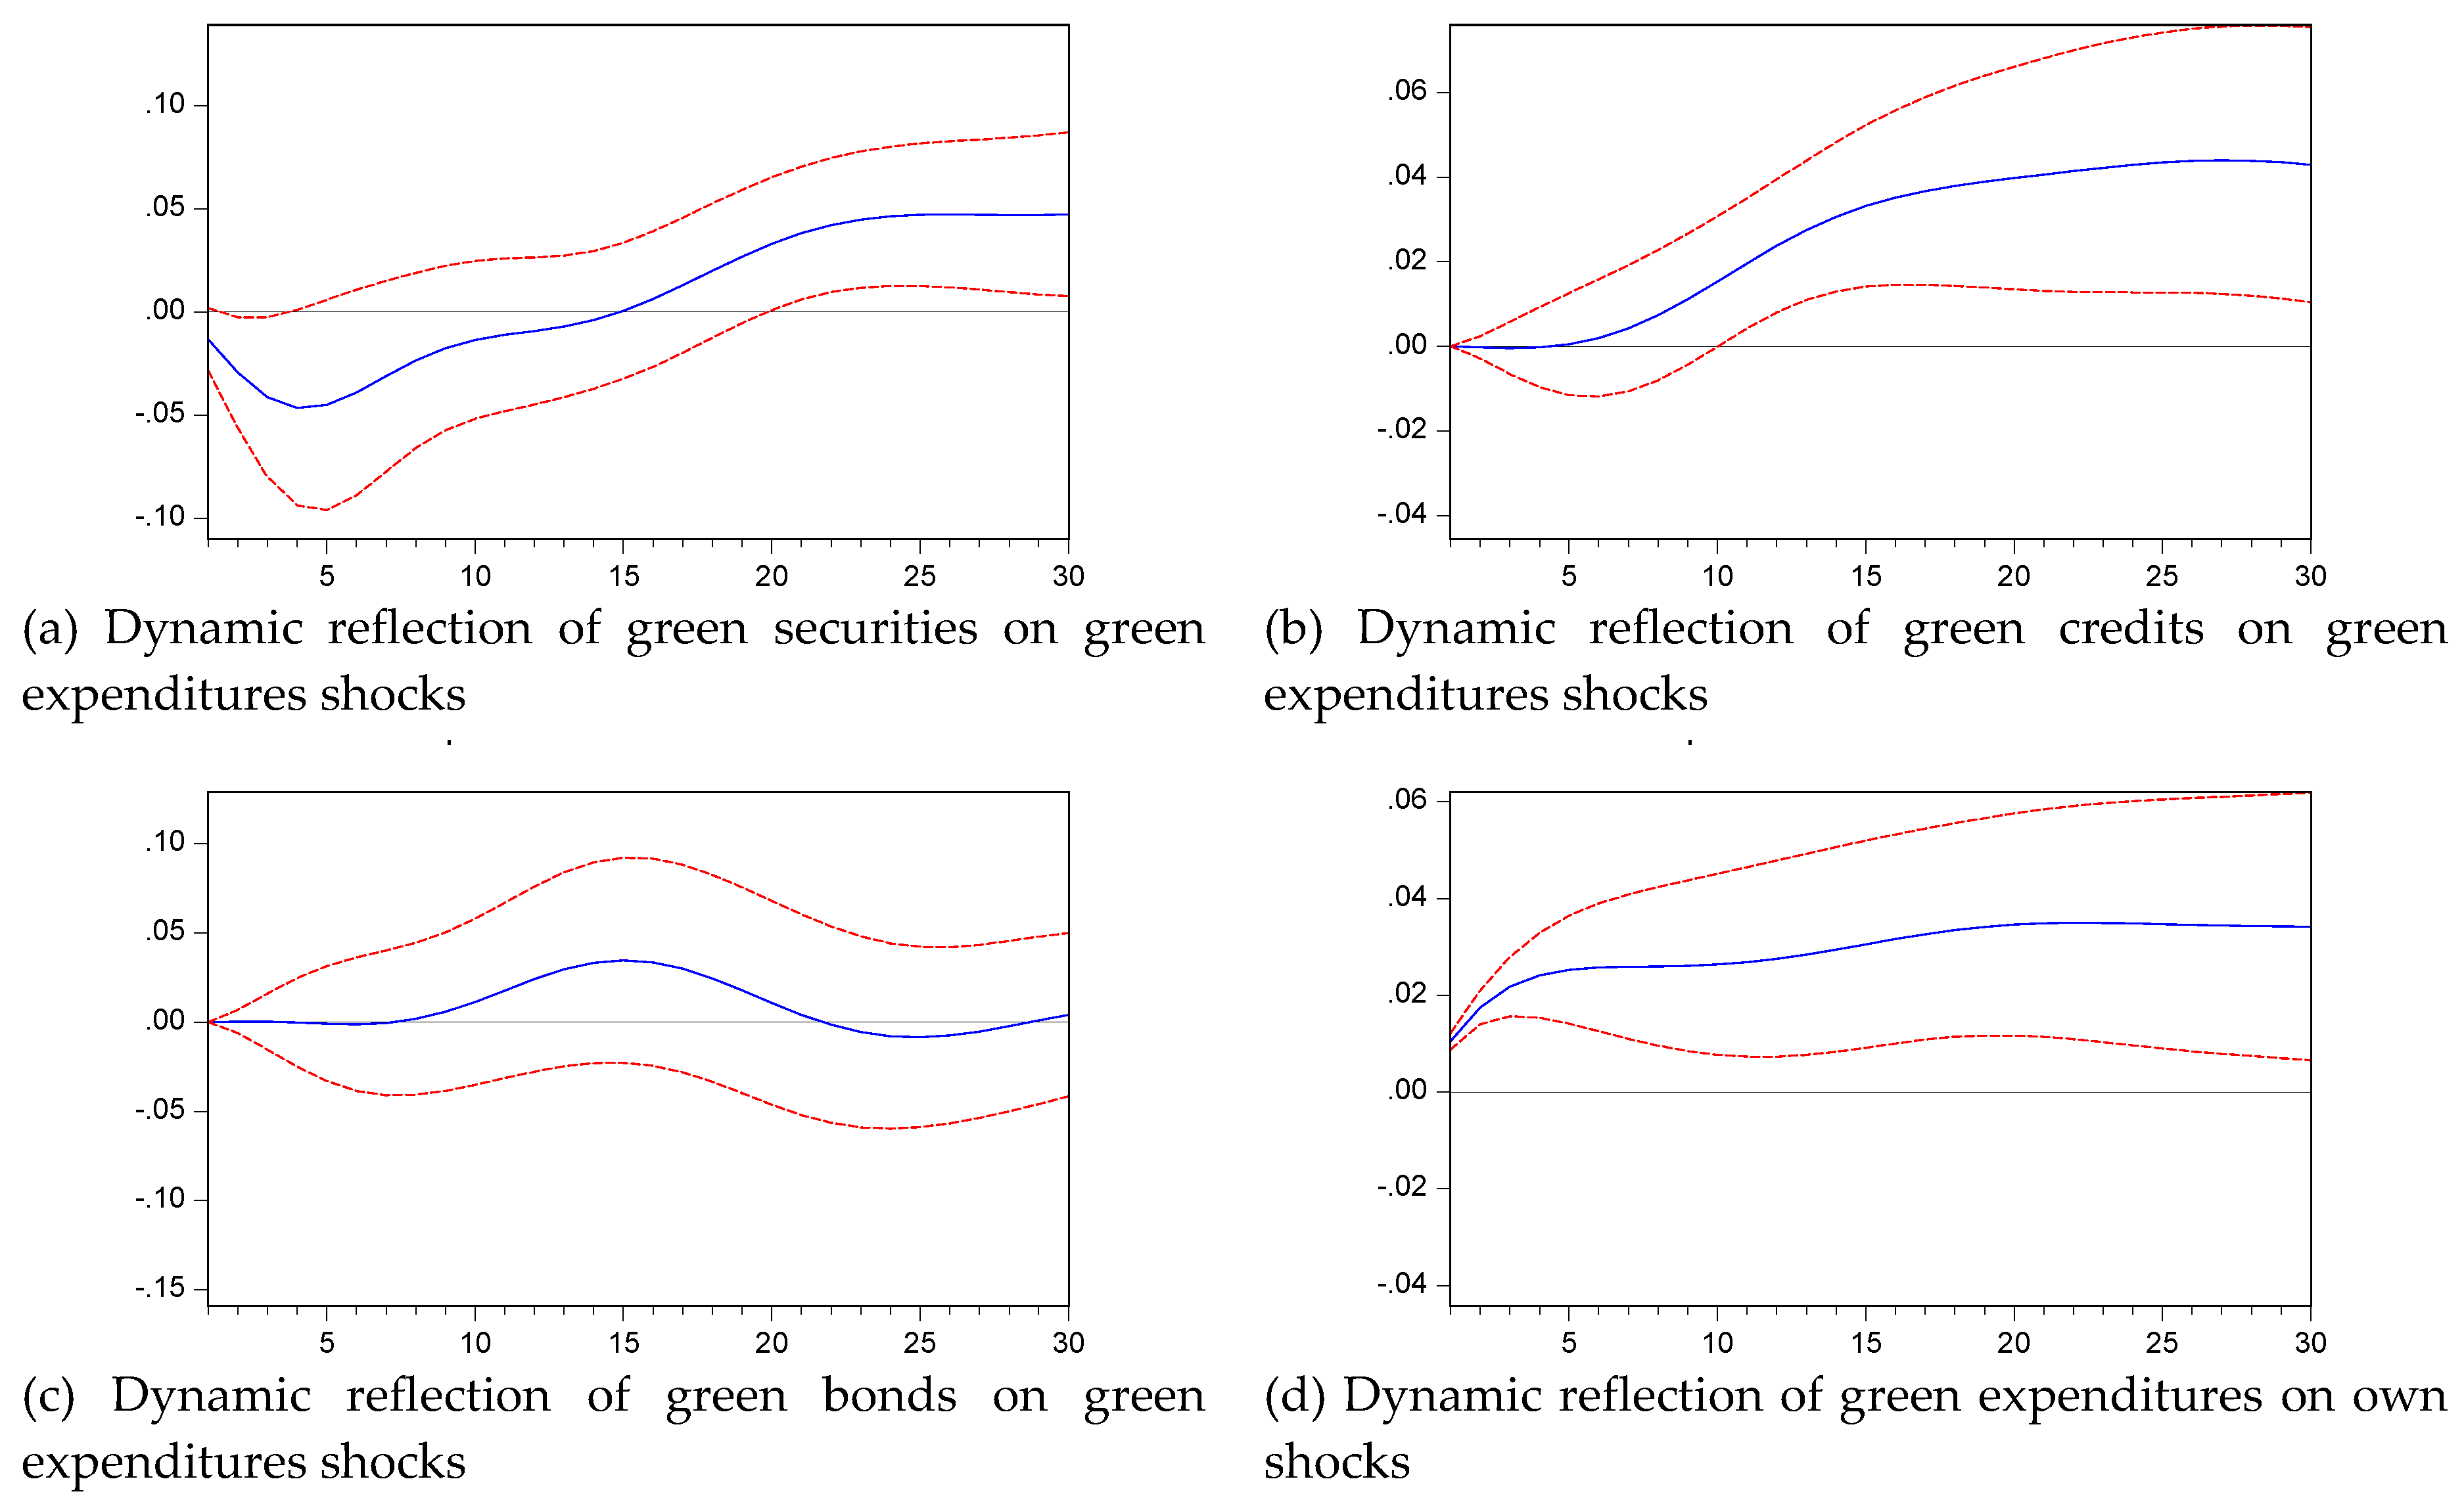
Figure 7.
Dynamic response of CO2 emissions per unit of GDP to green finance and COVID-19 shocks.
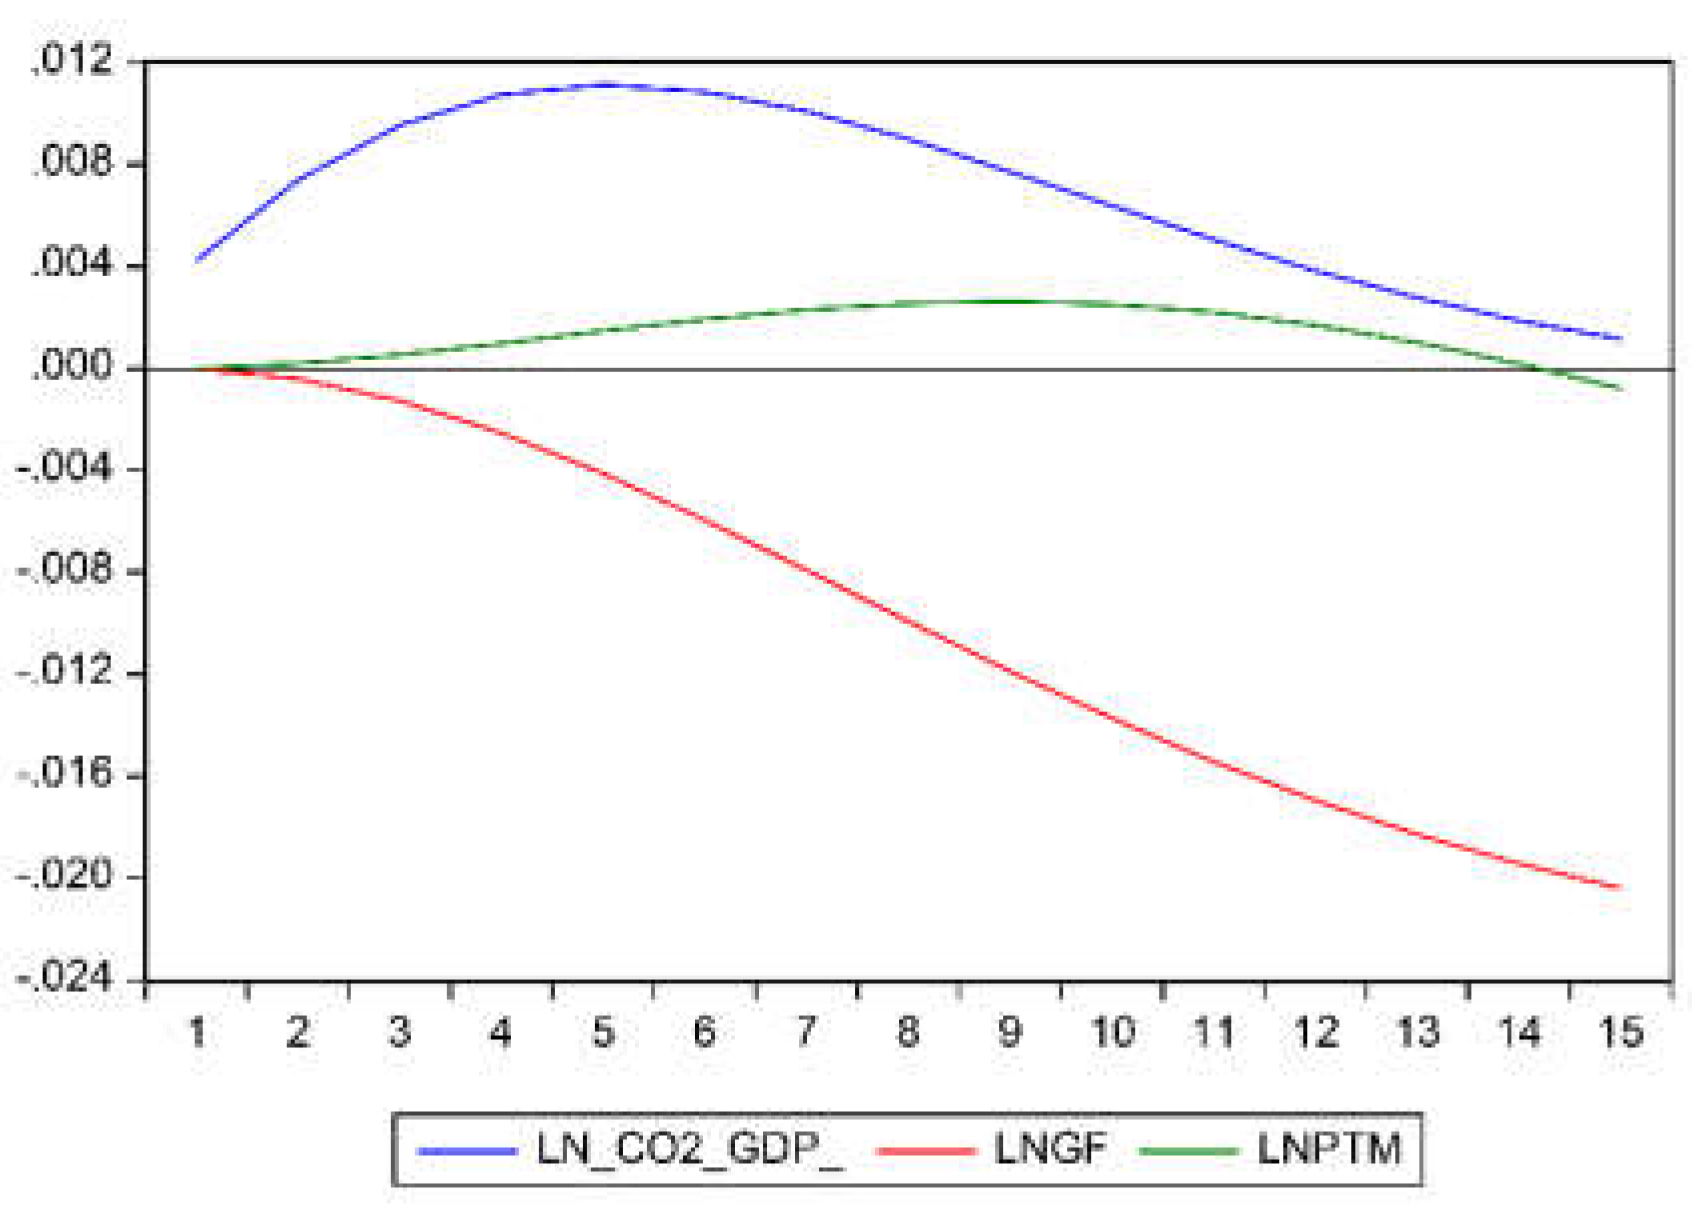
Figure 8.
Variance decomposition of LNCO2_GDP using Cholesky (d. f. adjusted) factors.
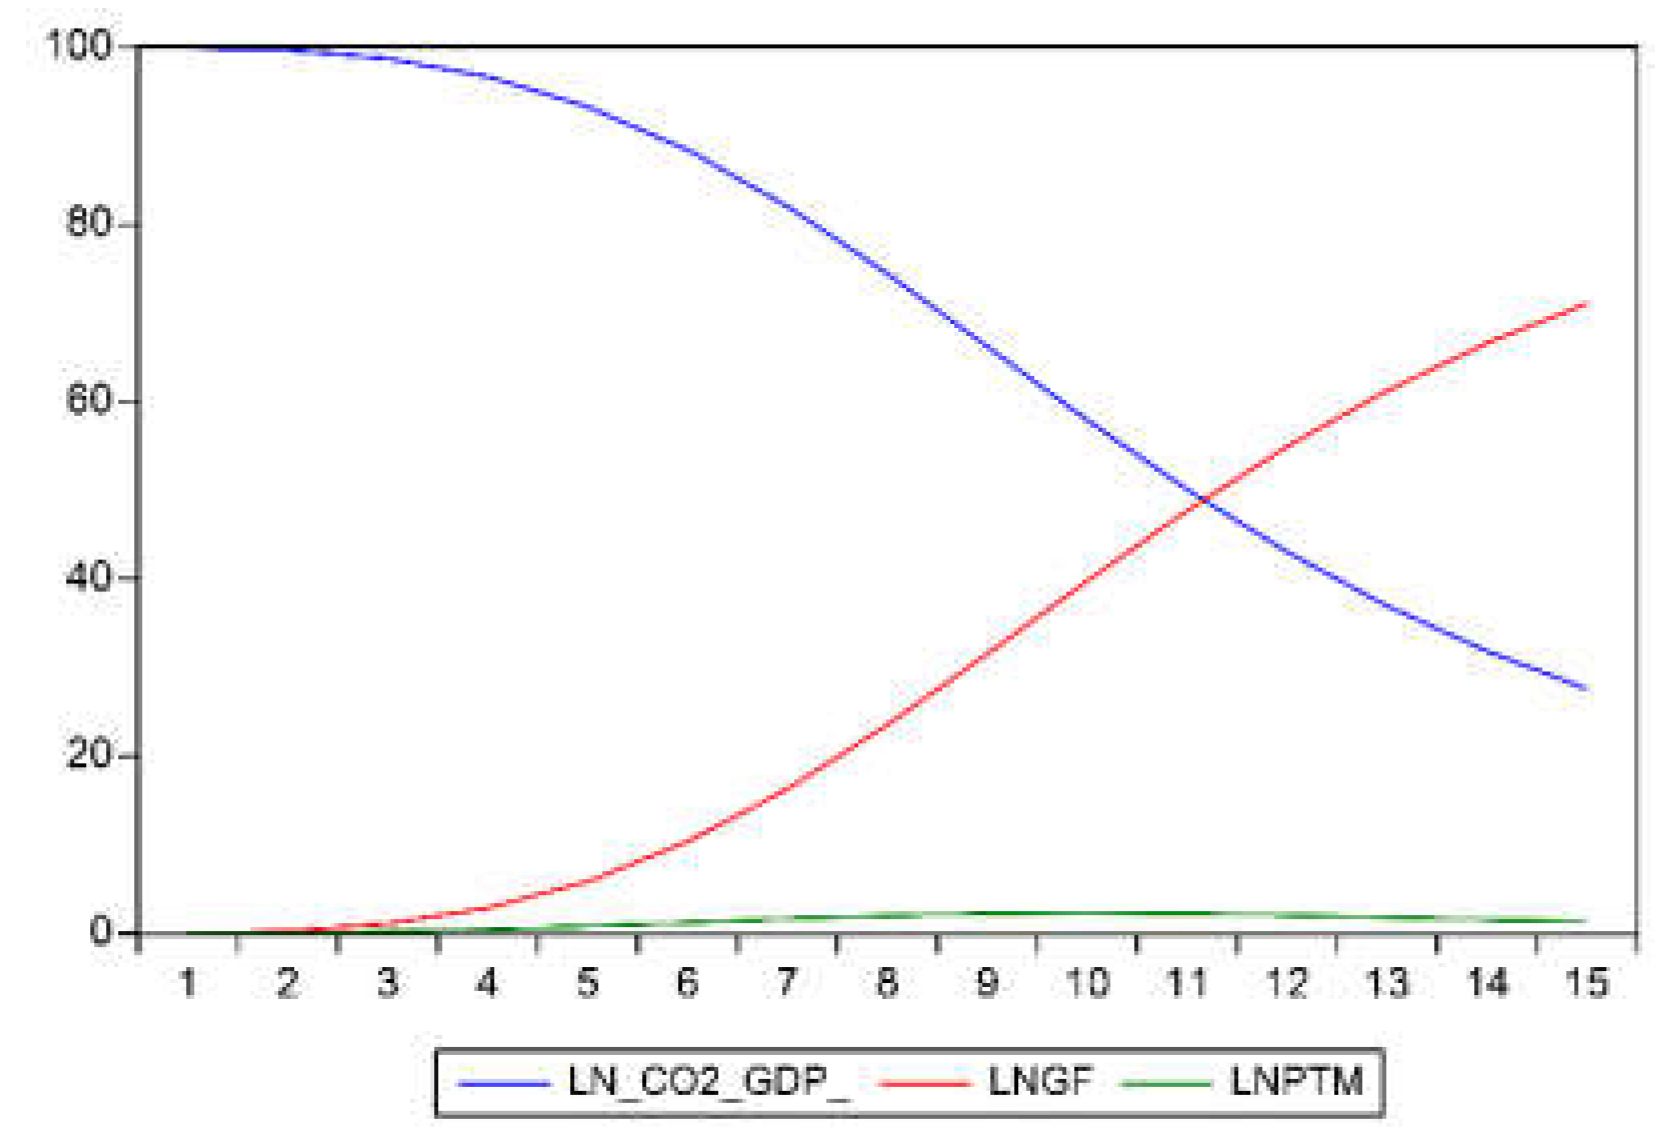

Table 1.
Variables of a green finance system.
| Sub-systems | Explanations |
|---|---|
| Green credits and loans | The total expenditure for industrial interests minus the interest expenditure for high-energy-consumption enterprises |
| Green expenditures | The fiscal expenditure for environmental protection |
| Green bonds | Bond funds raised for environmental projects |
| Green securities | The market value of environmental protection enterprises |
Note: “High-energy-consumption enterprises” refer to raw chemical and chemical product manufacturing, non-metal mining manufacturing, black metal smelting and recycling flattening, non-ferrous metal smelting and recycling flattening, oil processing, coking and nuclear fuel processing, and electricity and thermal production and supply industries.
Table 2.
Carbon oxidation rate and the emission factor of CO2 for energies.
| Energy types | Carbon oxidation rate | The emission factor of CO2 |
|---|---|---|
| Coal | 0.94 | 1.9003 kg-CO2/kg |
| Petroleum | 0.98 | 3.0202 kg-CO2/kg |
| Natural gas | 0.99 | 2.1622 kg-CO2/kg |
Source: Guidelines for compiling provincial greenhouse gas inventories launched by the National Development and Reform Commission.
Table 3.
Statistical descriptions of variables.
| LN variables | Average | Median | Maximum | Minimum | Standard deviation |
|---|---|---|---|---|---|
| LNCO2_GDP | 0.485988 | 0.474579 | 1.035509 | -0.15047 | 0.411681 |
| LNGBD | 14.28468 | 13.77700 | 17.46372 | 11.59893 | 1.639105 |
| LNGPE | 16.71820 | 17.01090 | 18.17973 | 14.97154 | 1.019039 |
| LNGCL | 17.21303 | 17.23013 | 18.07953 | 16.07061 | 0.771055 |
| LNGSC | 16.55145 | 16.66001 | 17.98807 | 15.06037 | 0.979629 |
| LNPTM | 14.54732 | 14.46867 | 15.15157 | 13.78145 | 0.295501 |
Note: The number of observations is 81. GDP, Gross domestic product; LNGCL, Logarithm of total interest expenditure of industrial enterprises and deducts interest expenditure in high-energy-consumption industries; LNGPE, Logarithm of fiscal expenditure for environmental protection; LNGBD, Logarithm of the amount of national debt issued multiplied by around 10% as the amount of green bonds issued before 2016; LNGSC, Logarithm of the market value of environmental enterprises; LNPTM, is passenger traffic, which represents the impact of the pandemic.
Table 4.
Results of the stationarity test.
| Variables | Type of test (C, T, and K) a | ADF (level) | ADF (1st diff) | ADF (2nd diff) |
|---|---|---|---|---|
| LNCO2_GDP | (0,0,2) | -3.2661(0.0796) | -1.3092(0.1746) | -8.7750*(0) b |
| LNGCL | (0,0,2) | -1.7189(0.4179) | -1.8789(0.0578) | -8.7750*(0) |
| LNGPE | (0,0,2) | -1.3273(0.6129) | -0.8702(0.3358) | -7.5426*(0) |
| LNGBD | (0,0,2) | -1.7966(0.6961) | -1.0011(0.2815) | -6.8503*(0) |
| LNGSC | (0,0,2) | -2.3692(0.3922) | -1.7743(0.0723) | -6.4316*(0) |
| LNPTM | (0,0,2) | -0.7139(0.4042) | -1.3765(0.1554) | -7.8309*(0) |
Note: a) C, T, and K denote the inclusion of a constant term, trend term, and lag order, respectively;.b) * indicates ADF value is significant at a 5% confidence level.
Table 5.
Determination of lag order.
| Lag | LogL | LR | FPE | AIC | BIC | HQ |
|---|---|---|---|---|---|---|
| 0 | 20.55455 | NA | 2.76e-08 | -0.378040 | -0.195406 | -0.304988 |
| 1 | 1015.136 | 1808.329 | 4.26e-19 | -25.27625 | -23.99781 | -24.76488 |
| 2 | 1221.221* | 342.5836* | 5.22e-21* | -29.69405* | -27.31981* | -28.74437* |
| 3 | 1233.153 | 17.97601 | 1.02e-20 | -29.06892 | -25.59887 | -27.68093 |
| 4 | 1257.268 | 32.56992 | 1.51e-20 | -28.76020 | -24.19434 | -26.93390 |
Note: * indicates the lag order selected; the smaller the value required by the AIC, SC, and HQ information criteria, the better. LR, the sequential modified LR test statistic (each test at 5% level); FPE, Final prediction error; AIC, Akaike information criterion; BIC, Bayesian Information Criterion; HQ, Hannan-Quinn information criterion; NA, not available.
Table 6.
Johansen trace test results.
| Null Hypotheses | Eigenroot | Trace statistics | 5% critical value | P-value |
|---|---|---|---|---|
| None** | 0.324789 | 114.2750 | 103.8473 | 0.0085 |
| At most 1** | 0.272949 | 83.24933 | 76.97277 | 0.0153 |
| At most 2** | 0.216836 | 58.06743 | 54.07904 | 0.0211 |
| At most 3** | 0.208412 | 38.75884 | 35.19275 | 0.0198 |
| At most 4** | 0.126081 | 20.29537 | 20.26184 | 0.0495 |
| At most 5** | 0.114972 | 9.648747 | 9.164546 | 0.0404 |
Note: ** indicates rejection of the original hypothesis at the 5% significance level.
Table 7.
Results of Granger causality test.
| Variables | Null hypotheses | Chi-Square | df | Prob. |
|---|---|---|---|---|
| LNCO2_GDP | LNGBD is not the Granger casualty of LNCO2_GDP | 5.098945 | 2 | 0.0781 |
| LNGCL is not the Granger casualty of LNCO2_GDP | 0.722147 | 2 | 0.6969 | |
| LNGPE is not the Granger casualty of LNCO2_GDP | 2.318044 | 2 | 0.3138 | |
| LNGSC is not the Granger casualty of LNCO2_GDP | 8.059023 | 2 | 0.0178 | |
| LNPTM is not the Granger casualty of LNCO2_GDP | 1.315504 | 2 | 0.518 | |
| LNGBD, LNGCL, LNGPE, LNGSC, LNPTM are not the Granger casualty of LNCO2_GDP | 27.83984 | 10 | 0.0019 |
Note: df, Degrees of Freedom.
Table 8.
Results of the VAR model.
| Explanatory variables | Explained variables | |||||
|---|---|---|---|---|---|---|
| LNCO2_GDP | LNGBD | LNGCL | LNGPE | LNGSC | LNPTM | |
| LNCO2_GDP(-1) | 1.7941 | -0.6074 | 0.0624 | -0.236 | -1.9025 | -0.6792 |
| LNCO2_GDP (-2) | -0.8563 | 0.63753 | 0.08323 | 0.20583 | 1.54735 | 0.91041 |
| LNGBD(-1) | -0.0042 | 1.65154 | 0.01952 | -0.0094 | -0.0276 | 0.02517 |
| LNGBD(-2) | -0.0011 | -0.7381 | -0.0167 | 0.01802 | -0.0354 | -0.0439 |
| LNGCL(-1) | 0.02045 | -0.0937 | 1.75472 | 0.01942 | -0.642 | -0.1155 |
| LNGCL(-2) | -0.0218 | 0.10421 | -0.8021 | 0.00204 | 0.75473 | 0.09407 |
| LNGPE(-1) | -20.2 | 0.13041 | 0.03634 | 1.66464 | -0.912 | 0.11092 |
| LNGPE(-2) | -0.0099 | 0.03148 | 0.02721 | -0.7026 | 0.94119 | 0.00012 |
| LNGSC(-1) | -0.0079 | -0.0392 | 0.02972 | 0.01237 | 1.5227 | -0.0018 |
| LNGSC(-2) | 0.00211 | 0.02305 | -0.0075 | -0.019 | -0.7032 | 0.02117 |
| LNPTM(-1) | 0.00839 | 0.07423 | -0.0597 | 0.04433 | 0.1302 | 1.65271 |
| LNPTM(-2) | -0.0138 | -0.2343 | 0.07793 | -0.0379 | -0.2177 | -0.7057 |
| R2 | 0.99991 | 0.99928 | 0.99969 | 0.99988 | 0.99501 | 0.99116 |
Table 9.
Results of variance decomposition.
| LNCO2_GDP Variance decomposition | |||||||||||||
|---|---|---|---|---|---|---|---|---|---|---|---|---|---|
| Period | LNCO2_GDP | LNGBD | LNGCL | LNGPE | LNGSC | LNPTM | Period | LNCO2_GDP | LNGBD | LNGCL | LNGPE | LNGSC | LNPTM |
| 1 | 100 | 0 | 0 | 0 | 0 | 0 | 16 | 56.3548 | 9.8663 | 8.3573 | 11.6283 | 12.0124 | 1.7808 |
| 2 | 99.1539 | 0.0023 | 0.2997 | 0.0282 | 0.4486 | 0.0674 | 17 | 53.8308 | 9.3566 | 8.2472 | 14.644 | 11.4388 | 2.4826 |
| 3 | 96.704 | 0.0769 | 1.1609 | 0.0912 | 1.868 | 0.099 | 18 | 51.0624 | 8.8074 | 8.4641 | 17.6454 | 10.8168 | 3.2038 |
| 4 | 92.5922 | 0.4153 | 2.5601 | 0.1686 | 4.1945 | 0.0693 | 19 | 48.2019 | 8.255 | 8.9693 | 20.5402 | 10.1752 | 3.8584 |
| 5 | 87.2473 | 1.2095 | 4.3107 | 0.2261 | 6.9495 | 0.0569 | 20 | 45.3904 | 7.7251 | 9.6693 | 23.289 | 9.5412 | 4.3849 |
| 6 | 81.4735 | 2.5047 | 6.1349 | 0.2342 | 9.5195 | 0.1333 | 21 | 42.7356 | 7.2335 | 10.4474 | 25.8943 | 8.9359 | 4.7534 |
| 7 | 76.0832 | 4.1585 | 7.7823 | 0.1954 | 11.4868 | 0.2938 | 22 | 40.304 | 6.7873 | 11.1929 | 28.3827 | 8.3722 | 4.961 |
| 8 | 71.6015 | 5.9238 | 9.0979 | 0.1613 | 12.7449 | 0.4706 | 23 | 38.1255 | 6.387 | 11.8201 | 30.7877 | 7.8553 | 5.0244 |
| 9 | 68.2009 | 7.559 | 10.016 | 0.2289 | 13.4058 | 0.5894 | 24 | 36.2022 | 6.0291 | 12.2754 | 33.1374 | 7.3851 | 4.9708 |
| 10 | 65.7843 | 8.8956 | 10.5256 | 0.5243 | 13.6546 | 0.6157 | 25 | 34.5189 | 5.708 | 12.5368 | 35.4474 | 6.9578 | 4.8312 |
| 11 | 64.0978 | 9.8516 | 10.6463 | 1.1795 | 13.6534 | 0.5714 | 26 | 33.0511 | 5.4179 | 12.6081 | 37.7184 | 6.5683 | 4.6363 |
| 12 | 62.8197 | 10.4183 | 10.4253 | 2.3048 | 13.5061 | 0.5258 | 27 | 31.7715 | 5.154 | 12.5109 | 39.9384 | 6.2115 | 4.4137 |
| 13 | 61.6268 | 10.6355 | 9.9471 | 3.9602 | 13.2611 | 0.5692 | 28 | 30.6541 | 4.9125 | 12.2771 | 42.0864 | 5.8837 | 4.1862 |
| 14 | 60.2488 | 10.5685 | 9.339 | 6.1339 | 12.9309 | 0.779 | 29 | 29.6758 | 4.6913 | 11.9418 | 44.1372 | 5.5821 | 3.9718 |
| 15 | 58.5108 | 10.2896 | 8.7578 | 8.7378 | 12.5141 | 1.19 | 30 | 28.8168 | 4.4894 | 11.5392 | 46.0668 | 5.3051 | 3.7827 |
Disclaimer/Publisher’s Note: The statements, opinions and data contained in all publications are solely those of the individual author(s) and contributor(s) and not of MDPI and/or the editor(s). MDPI and/or the editor(s) disclaim responsibility for any injury to people or property resulting from any ideas, methods, instructions or products referred to in the content. |
© 2023 by the authors. Licensee MDPI, Basel, Switzerland. This article is an open access article distributed under the terms and conditions of the Creative Commons Attribution (CC BY) license (http://creativecommons.org/licenses/by/4.0/).
Copyright: This open access article is published under a Creative Commons CC BY 4.0 license, which permit the free download, distribution, and reuse, provided that the author and preprint are cited in any reuse.


