
Submitted:
21 April 2023
Posted:
23 April 2023
You are already at the latest version
Abstract
This study examines the Willingness-To-Pay (WTP) of consumers and the determinants of eco-labeling for the organic cocoa powder produced in the Dong Nai UNESCO Biosphere Reserve (DNBR), Southern Vietnam. Eco-labels are designed according to Tiers of eco-labeling for biosphere reserves (BR) introduced by UNESCO include BR Destination (Tier 1), BR Quality Label (Tier 2), and Professional Certification Label (Tier 3). Questionnaires are delivered to 203 customers in the DNBR and nearby places, such as Dong Nai and HCMC. This study employs a hybrid approach using descriptive statistics, ANOVA test, and Partial Least Squares Structural Equation Model (PLS-SEM). The results indicate that gender and educational level have a positive effect on consumers' preferences. Customers are willing to pay more for cocoa powder with an eco-label than one with an organic label. Perceived food safety and product knowledge lower customers’ WTP, whereas agricultural environment and pricing concerns increase it. Tier 2 is suggested for labeling cocoa powder in the DNBR. The DNBR Management Board, together with the federal and provincial governments, should all follow a similar certification process. Increased eco-label awareness is crucial for the future of environmentally responsible shopping and responsible business practices.
Keywords:
Eco-label
; Customer
; WTP
; PLS-SEM
; Cocoa powder
; Biosphere reserve
; Dong Nai
; Vietnam.
1. Introduction
The global agricultural system is a complex network that produces food, fiber, and fuel to fulfill the needs of a growing population. However, contemporary agricultural techniques are often environmentally harmful and unsustainable. Sustainable agricultural practices are crucial to the global agriculture system's long-term existence [1]. Sustainable agricultural practices necessitate a balance between economic development, environmental protection, and social welfare to promote environmental sustainability in agriculture [2]. It is essential to guarantee social sustainability, which includes addressing social inequalities and ensuring that everyone has access to food, water, and energy [3].
Promoting sustainable agricultural practices and assuring the long-term viability of the global food system is facilitated by eco-labeling. By providing consumers with information about the environmental impact of their food choices, eco-labeling can promote environmental sustainability and generate positive change in the global agricultural system [4]. Eco-labeling is a method to differentiate products, which may result in a higher market price if consumers are environmentally conscious [5]. The success of an eco-label is contingent on the label's credibility and market demand for eco-labeled products [6]. To circumvent commercial interests, non-profit organizations administer the majority of eco-labels. Eco-labels make no distinction between applicants from various nations or regions [7]. Eco-labels can assist consumers, institutions, and governments in making environmentally responsible purchasing decisions while providing producers with a means to increase their market share [8]. They are awarded to products and services that have a smaller negative impact on the environment than similar products and services. In an endeavor to accomplish sustainability in the 21th century, eco-labeling is used on a global scale to encourage consumers to alter their consumption patterns and make more prudent use of resources and energy. In the food industry, the organic label is more well-known and popular than the various eco-labels that have been introduced. The rate of sale of food products with eco-labels remains quite low [9]. Particularly for UNESCO Biosphere Reserves (BRs), eco-labels launched by UNESCO are divided into three Tiers: (i) Geographical indication labels associated with the border of a particular geographic area (Tier 1); (ii) Quality labels of a particular geographic area (Tier 2); and (iii) Professional certification labels (Tier 3) [10].
Despite their commonalities, an eco-label is different from an organic label. Organic labeled foods are suitable for human health, have high nutrition, and do not use chemicals or harmful substances, whereas eco-labeled products meet certain criteria issued by a government agency or an organization authorized by the government, which are relatively adequate to assess the impact on the environment in different stages of the product life cycle, from primary processing, processing, packaging, distribution, and use until discarded [10]. In reality, a number of consumers misunderstand organic and eco-labels as the same thing because they both consider them to be environmentally friendly products. The success or failure of planning for eco-labeling in the food market lies in understanding consumers' awareness, needs, and willingness to pay. To increase the effectiveness of eco-labels, more efforts should be made to educate consumers about the significance of eco-labels and to ensure that products bearing eco-labels are truly sustainable and environmentally friendly [11].
To analyze and comprehend eco-labeling, both the supply and demand approaches are utilized. Figure 1 demonstrates that the supply approach emphasizes the production aspect, whereas the demand approach emphasizes the consumption aspect. The supply approach focuses on the production of products and services and determines the overall level of economic activity within an economy. This strategy emphasizes firm behavior, production processes, and the variables that influence production decisions. The supply approach acknowledges that consumer behavior dictates the overall level of economic activity. This strategy focuses on consumer behavior and their purchasing decisions for products and services. The demand approach considers variables such as income levels, inclinations and preferences, and government policies that influence the demand for products and services. On the demand side, eco-labels provide consumers with information about the environmental impact of products and services, enabling them to make informed purchasing decisions and support sustainable production practices.
In this study, the demand approach is chosen because of its advantages on customer-oriented, market-driven, policy relevance, and flexibility. Consumer preferences and WTP for designed eco-labels are examined in conjunction with DNBR-produced cocoa powder. Although several eco-labeling studies have focused on cocoa powder [12,13,14], to the best of our knowledge, there are no empirical studies examining consumer preferences and WTP for new eco-labels on organic cocoa powder in a BR. We concentrate on organic cocoa powder because it is on the rise and yields a high profit over this region. It has been 15 years since cocoa was introduced to Vietnam, but only recently has the Vietnam country's cocoa industry been truly invested and moved toward sustainable development. A WTP calculation is carried out because its results can provide information to help companies set prices for new eco-labeled foods. However, market and product facts are ignored, and customers may not give correct price opinions. Therefore, WTP should be combined with other methods to improve outcomes. In this study, we employ a hybrid approach using descriptive statistics, ANOVA test, and Partial Least Squares Structural Equation Model (PLS-SEM) to evaluate the feasibility of eco-labeling for organic cocoa powder. Customers are surveyed to determine the value they place on this food and the utmost price they would be willing to pay for it with eco-labels. Two research questions are formed:
- Are consumers willing to pay a premium for eco-labeled organic cocoa powder in DNBR? What factors influence their decisions?
- Which eco-label variety would be most suitable?
2. Methodology
2.1. Cocoa powder production in DNBR
The DNBR was recognized by UNESCO in 2011. It has core zones of 173,073 hectares (the Cat Tien National Park and the Dong Nai Cultural and Nature Reserve), a buffer zone of 349,995 hectares, and a transition zone of 446,925 hectares. Five provinces of Southern Vietnam make up the DNBR such as Dong Nai, Lam Dong, Binh Duong, Binh Phuoc, and Dak Nong. Cocoa grown in DNBR is designated as an OCOP (One Commune One Product) of Vietnam. DNBR has over 532 hectares of cocoa, of which 365 hectares have been harvested, yielding an estimated 1,200 tons of cocoa. In addition to cocoa plantations, there are also large-scale cocoa powder manufacturing facilities, such as Trong Duc Cocoa Limited Liability Company. Cocoa is labeled organic by VietGAP Label, UTZ Certified Label, and EU Import Label. VietGAP Label certifies that the agricultural product was produced in accordance with Good Agricultural Practices to ensure food safety, hygiene, and environmental protection. UTZ Certified Label is an international certification for cocoa powder products produced in accordance with sustainable standards in production, environment, society, and economy. Cocoa have not been eco-labeled as of yet. An application of eco-labeling for cocoa is required in light of the fact that DNBR is instituting sustainable agricultural practices. Eco-labeling can increase the cocoa powder's commercial value while maintaining environmental sustainability in agriculture.
Adoption of eco-labeling will mitigate the following obstacles to cocoa powder production and consumption in DNBR as below:
- Low awareness: The majority of cocoa farmers in DNBR are still unfamiliar with the advantages of eco-labeling. Some individuals still do not comprehend the standards and requirements for eco-labeling evaluation and certification.
- High investment costs: To meet the standards and obtain eco-labeling, cocoa powder producers must invest a substantial amount of money in the construction of cultivation systems, quality management, and product control. This may cause producers to be concerned about increased costs and decreased profits; and
- Competition from products without eco-labeling: Despite the fact that cocoa powder with eco-labeling can provide higher economic value, products without eco-labeling remain fiercely competitive on the market. Eco-labeling can therefore make it difficult for local producers to compete.
2.2. Data analysis methods
2.2.1. Descriptive statistics, Cross Tabulation, and ANOVA test
Descriptive statistics used in this study give a summary of the data and help us comprehend its qualities, laying the groundwork for drawing inferences and making decisions based on the data. Mean, median, standard deviation, percentile rank, and correlation coefficient are quantitative measures used to characterize data [15]. Two-variable data can be summarized using cross tabulation. It is a vital strategy for data analysis and helps in comprehending the connection between variables, and also makes it a useful tool for analyzing qualitative data.
An analysis of variance (ANOVA) test determines if three or more data sets differ statistically. ANOVA compares data sets for variance differences [16]. ANOVA tests can assess quantitative and qualitative survey data. One-way, two-way, and three-way ANOVAs exist: one-way ANOVA tests statistical significance between three or more data sets; two-way ANOVA analyzes three variables—two independents and one dependent; and the three variables were analyzed using three-way ANOVA (Howell, 1987). F-statistics and p-values report ANOVA findings: if the p-value is below threshold, the data sets differ significantly [17]. In this study, one-way ANOVA is used to test hypotheses as below:
- “Male and female customers concern about food safety, agricultural environment, and pricing in various ways and have varied product expertise about cocoa powder produced in DNBR”; and
- “Customers with varying educational levels concern about food safety, agricultural environment, and pricing in various ways and have varied product expertise about cocoa powder produced in DNBR”.
2.2.2. WTP calculation
The average of maximum amount of money that 203 surveyed customers are willing to pay for an eco-labeled organic cocoa powder produced in DNBR is calculated by the formula (1)…(4) as below:
Where: Y1i is customer’s willingness to pay for organic labeled cocoa powder; Y2i is a customer's willingness to pay for Tier 1 eco-labeled cocoa powder; Y3i is a customer's willingness to pay for Tier 2 eco-labeled cocoa powder; Y4i is customer's willingness to pay for Tier 3 eco-labeled cocoa powder.
2.2.3. PLS-SEM
SEM is a statistical methodology used to test and to confirm theories about how multiple variables relate to one another, by examining the interdependence between variables and identifying the underlying relationships that drive them [18]. SEM includes Covariance-Based SEM (CB-SEM) and Partial Least Squares SEM (PLS-SEM). While CB-SEM is a variant of SEM that is particularly well-suited for modeling data with a normal distribution, PLS-SEM is particularly well-suited for modeling complex, non-normal data and for making predictions in situations where sample sizes are small. PLS-SEM focuses on identifying the latent variables that drive observed variable relationships, rather than on estimating the covariance structure among observed variables. PLS-SEM is widely used in fields such as business, management, marketing, and social sciences, where researchers need to model complex relationships between variables in order to better understand underlying constructs and to develop and test theoretical models [18].
In this study, PLS-SEM is used to analyze the determinants of customers' willingness to pay (WTP) following these steps: (1) build hypotheses; (2) develop theoretical model; (3) develop a survey questionnaire; (4) conduct a reliability and validity analysis; (5) estimate the relationships between constructs, the strength and direction of these relationships; (6) evaluate model by examining the goodness-of-fit statistics, such as R-squared, Q-squared, and RMSE; and (7) interpret results by examining the regression weights, path coefficients, and other output from PLS-SEM analysis, and draw conclusions about the determinants of customers' WTP.
At the first step, four hypotheses regarding the effects of consumer’s preferences on WTP are built. The relationship between the concern of consumers to food safety and their WTP a premium for a cocoa powder with an eco-label have been examined. Consumers with greater food safety knowledge are substantially more WTP a premium for eco-labeled mixed cocoa than those with less knowledge [19]. Consumers who had a greater understanding of the environmental impact of food production are more likely to choose eco-labeled products and pay a premium for them. Increasing consumer education and awareness about food safety and environmental sustainability could result in a greater demand for cocoa powder with eco-labels and more sustainable food production practices. The first hypothesis in this analysis is as follows:
“The WTP a premium for the health benefit of the eco-labeled organic cocoa powder is higher the greater the consumers’ food safety concern” (Hypothesis H1).
Agricultural environmental concern and WTP for eco-labeled foods are positively correlated in Vietnam [20]. Different regions of China corroborate a similar relationship between environmental concern and WTP for eco-labeled products [21]. In Denmark, consumers who care about the environment and are knowledgeable about environmental issues are willing to pay more for eco-labeled products [22]. Environmentally conscious consumers are more willing to pay a significant premium for eco-labeled foods, which offer both environmental and health benefits [19]. These studies suggested that increasing consumer awareness and education regarding environmental sustainability can lead to an increase in demand for eco-labeled products, resulting in environmentally sustainable food production and consumption practices. Based on a review of the literature, the second hypothesis is as follows:
"The greater the consumer's attention to the environment, the greater the WTP premium for the environment and the life benefit of the eco-labeled organic cocoa powder" (Hypothesis H2).
The relationship between consumers’ price sensitivity and their WTP a premium for eco-labeled cocoa powder is investigated. Less price-sensitive consumers are more likely to pay a premium for eco-labeled products, which provide both environmental and health benefits [19]. These findings suggest that increasing consumer awareness of the benefits of eco-labeled foods could increase demand, even among less price-sensitive consumers. Accordingly, the third hypothesis is as follows:
“Consumers' WTP for the eco-labeled organic cocoa powder will increase with decreasing pricing concern” (Hypothesis H3).
The relationship between consumer knowledge of eco-labeling and their WTP for eco-labeled cocoa has been studied internationally. Consumers with a greater comprehension of eco-labels are more likely to choose eco-labeled foods and pay a higher price for them [22]. Consumers who are knowledgeable about eco-labeling and their benefits are willing to pay a higher premium for eco-labeled foods that offered environmental and health benefits [19]. Therefore, the fourth hypothesis is as follows:
“Greater consumer knowledge of eco-label increases WTP a premium for the health benefit of an eco-labeled organic cocoa powder” (Hypothesis H4).
At the second step, we develop a theoretical model describing the effect of 4 determinants of consumers’ preferences (food safety concern, agricultural environment concerns, pricing concerns, and product expertise) on their WTP for eco-labeled organic cocoa powder in the DNBR (Figure 2). Four above hypotheses are embedded in this model. Once the questionnaire is built and the survey is completed (step 3), PLS-SEM is applied to test and to confirm the theoretical model about the interdependence between customers' preferences and their WTP (step 4 to 7).
2.2.4. Data collection
We develop a structured questionnaire for customer interviews. In addition to respondents' demographic information, the questionnaire is divided into two sections.
Part 1 consists of questions for customers’ preferences measured using a 5-point Likert scale. There are 12 questions divided equally among 4 groups: ‘Food safety concern’ (FS) (‘the food safety of the product’ – FS1; ‘the quality of the product’ – FS2; ‘the origin of the product’ – FS3), ‘Agricultural environmental concerns’ (EN) (‘large-scale pesticide and chemical fertilizer contamination’ – EN1; ‘the consequences of agriculture environmental pollution’ – EN2; ‘the states of agriculture environmental pollution’ – EN3), ‘Pricing concerns’ (PP) (‘compatibility with consumers' payment capabilities’ – PP1; ‘Cocoa powder prices reflect product value’ – PP2; ‘cocoa powder prices compared to others’ – PP3), and ‘Product expertise’ (PK) (‘cocoa powder product is organic’ - PK1; ‘cocoa powder product is supervised by DNBR Management Board’ - PK2; ‘International standards verify cocoa powder quality’ – PK3).
The questions in Part 2 pertain to the customers’ WTP level. Figure 3 shows that a design of an organic label and three eco-labels for four varieties of 250g box of cocoa powder: (A) Vietnamese organic cocoa powder (Organic label); (B) DNBR-made cocoa powder (Tier 1 eco-label); (C) DNBR-supervised cocoa powder products (Tier 2 eco-label); and (D) International quality-certified cocoa powder (Tier 3 eco-label). The characteristics of the product categories are clearly noted under the labels.
Our survey aims to gather information on customers' preferences and WTP for organic cocoa powder sold in cocoa shops in the DNBR, and nearby areas in Dong Nai province, and HCMC. To achieve this, we offered respondents a price range with 6 levels for each type of product, ranging from 3 $US (market price) to 4 $US. Each level had a price difference of 0.2 $US. In addition, there is an open answer option for respondents who are willing to pay a higher price for the food.
We obtained a total of 203 valid responses from our survey, with 102 males (50.25%) and 101 females (49.75%). The age range of the respondents is quite diverse, with 20 of them being under 20 years old. The majority of respondents are aged 20-25, with 66 respondents (32.51%) falling in this age group. In terms of education level, the majority of respondents has graduated from colleges and universities, accounting for 121 people (51.69%). The next highest education level is high school, with 37 people (18%) having completed this level. Table 1 provides a summary of the background characteristics of the surveyed customers.
5. Results
5.1. Descriptive statistics and ANOVA test
Table 2 displays the levels of customer concern food safety, agricultural environment, product prices, and product expertise. Customers are most concerned in food safety and the agricultural environment. Most interesting items are the food safety of the organic cocoa powder (mean(FS1) = 4.65), followed by the quality of the product (mean(FS2) = 4.60), the origin of the product (mean(FS3) = 4.47), large-scale pesticide and chemical fertilizer contamination (mean(EN1) = 4.38), the consequences of agriculture environmental pollution (mean(EN2) = 4.26), the states of agriculture environmental pollution (mean(EN3) = 4.18, and compatibility with consumers' payment capabilities (mean(PP1) = 4.04).
Table 3 illustrates the effect of customers’ gender and educational level on their preferences regarding food safety concern, agricultural environment concern, pricing concern, and product expertise. The plurality of males and females (48.28% and 48.77%, respectively) are in agreement. There are no significant gender differences in regards to the food safety concern. However, the gender of a consumer influences their concerns regarding agricultural environment and prices. Concerns about the agricultural environment and the price of cocoa powder vary between males and females. 90.15% of surveyed customers, including 43.35% of males and 46.80% of females, express their concerns regarding the agricultural environment. 81.77% of consumers, including 38.92% of males and 42.86% of females, consider price. Males are less concerned about the product's impact on the environment and its cost than females. Regarding education, the majority of surveyed consumers possess a bachelor's degree or higher. This indicates that graduates are interested in all aspects of a product, including food safety, agricultural environment, product pricing, and product expertise.
Table 4 presents the results of the F-Test two-sample for variances for male and female consumers separately, indicating whether there are significant differences between the genders in the level of customers’ preferences variables. P(F ≤ f), p = 0.27 > = 0.05, indicating that the p-value exceeds the significance level of 0.05. This indicates that there are no significant gender differences in regards to food safety. Therefore, hypothesis “Males and females are concerned about food safety in various ways” is denied, which states that males and females have different food safety concerns.
The results of P(F ≤ f) = 0.023 indicates that there is a significant difference between the genders when it comes to environmental awareness. Therefore, there is no reason to disregard hypothesis "Males and females are concerned about agricultural environment in various ways". Several previous studies have a same conclusion that women tend to pay more attention to food safety, including how to use and store food [23], or women frequently have a greater awareness of food safety and are more proactive in ensuring food safety for their families [24].
Males and females exhibit different levels of concern regarding the price of the cocoa powder (p = 0.033 < 0.05). This is consistent with a previous study finding that women tend to be more meticulous in comparing product prices before purchasing goods, especially when shopping for consumer products [25].
Males and female customers differ in their comprehension of personal products (p = 0.018 < 0.05), confirming the hypothesis “Male and female customers have varied product expertise about cocoa powder produced in DNBR”. This is consistent with a previous study finding that women tend to be more meticulous and detail-oriented when it comes to understanding products, including understanding product ingredients, usage, and effects [25].
Table 5 displays the results of the F-Test for variances using two samples. P(F ≤ f), p = 0.006 = 0.05, indicating that the p-value is less than the significance threshold of 0.05. This indicates that there is a significant difference in educational attainment regarding food safety. Customers with varying levels of education are concerned about product safety in various ways. A significant difference in educational level regarding agricultural environment concern (0.026 < 0.05) indicates that the hypothesis "Customers with varying educational levels concern about agricultural environment in various ways" is acceptable. However, there is no significant difference between educational level and product price and product expertise (0.98 > α = 0.05 and 0.275 > α = 0.05, respectively). Both hypotheses "Customers with varying educational levels concern about pricing in various ways" and "Customers with varying educational levels have varied product expertise about cocoa powder produced in DNBR" are rejected.
5.2. Willingness to Pay
We compute customers’ WTPs in $US using the formula (1) shown before, as well as the following findings from performing descriptive statistics:
The results show that the WTP range for cocoa powder with organic label is fluctuate from 3 to 3.05 ± 0.24 $US. Consumers are willing to pay this price because organic labeling is more common than eco-labeling. However, when applying three types of eco-labels to the organic cocoa powder, the WTP of consumers increases gradually according to each level of Tier labels. WTP for eco-labeling range from 3.31 ± 0.31 $US to 3.94 ± 0.43 $US, with higher prices indicating higher quality products and better experiences for consumers. Customers’ WTPs for eco-labeling Tier 1, 2, and 3 are 0.37, 0.62, and 1.0 $US more than the price of an organically labeled cocoa powder, respectively. Figure 5 demonstrates that customers are willing to pay the most for Tier 3 Eco-label, which is more than 1.5 times higher than the Tier 2 and nearly 3 times greater than the Tier 1.
5.3. Determinants of customers’ WTP
a) Reliability test
Each group of observed variables belonging to each group of food safety concern (FS), agricultural environment concerns (EN), price concerns (PP), product expertise (PK), and WTP for the product (Y) undergo Cronbach's Alpha testing to determine the reliability of the scale. A variable is eliminated when its Cronbach's Alpha coefficient is less than 0.6. Observed variables with a total correlation coefficient of less than 0.3 or that decrease the group's Cronbach's Alpha value are considered garbage variables and are excluded from the factor's scale. Table 6 demonstrates that Cronbach's Alpha if Item Deleted is less than Cronbach's Alpha for each factor, with the exception of the variable Y1. Variable Y1 is eliminated and the remaining ones are retained. The Cronbach Alpha analysis procedure selects 5 groups of observed variables for each latent variable, as shown in Table 6. A total of 15 observed variables are included according to reliability test.
b) EFA
Table 7 shows that EFA results performed according to the principal component analysis (PCA) with Promax rotation. The total variance extracted is 71.051%. The observed variables are correlated with each other in components. The factor rotation matrix shows that the factor loading coefficients of the observed variables are not less than 0.5, indicating that these variables reflect independent factors. Five components with 15 variables are included in further CFA. The KMO (Kaiser-Meyer-Olkin) measure PCA has a value of 0.720, satisfying the condition 0.5 ≤ KMO ≤ 1. Bartlett's Test of Sphericity with Approx. Chi-Square = 1190.017, df = 105, and sig.= 0.000. So, PCA is in good agreement with the actual data. Test the correlation between the observed variables.
c) CFA
Chi-square (CMIN), Chi-square adjusted to degrees (CMIN/df), Comparative Fit Index (CFI), Tucker & Lewis Index (TLI), and Root Mean Square Error Approximation (RMSEA) are used to measure how well the CFA model suits the sample data. The model is deemed excellent if 1 < χ2/df < 3, and in two cases, χ2/df < 3 (with sample N ≤ 200) and χ2/df < 5 (with sample N ≥ 200) are distinct. A model is regarded acceptable if its GFI, CFI, and TLI are less than 0.9, p is greater than 0.5, and CMIN/df is less than 3. The model is compatible with the data when CFI and TLI are less than 0.9, CMIN/df is less than 0.2, and RMSEA is less than 0.08.
The results of the CFA model calibration indicate that the Chi-square/degree of freedom (χ2/df) is satisfactory, indicating the model's fitness (p < 0.0001). Both the comparative fit index and goodness-of-fit are above 0.9 (CFI = 0.939 and GFI = 0.916); the root mean square error of approximation is moderate (RMSEA = 0.065); and the PCLOSE is 0.06. The value of these indices reveals that the derived data are compatible with the scale model. Due to the likelihood functions, the significance of the model is determined by computing the Chi-squared statistic. The chi-square value is 1,854 while the p-value is 0.000. The outcomes indicate that the WTP model is statistically significant at 1% and above.
Figure 6.
Calibration results of the CFA.
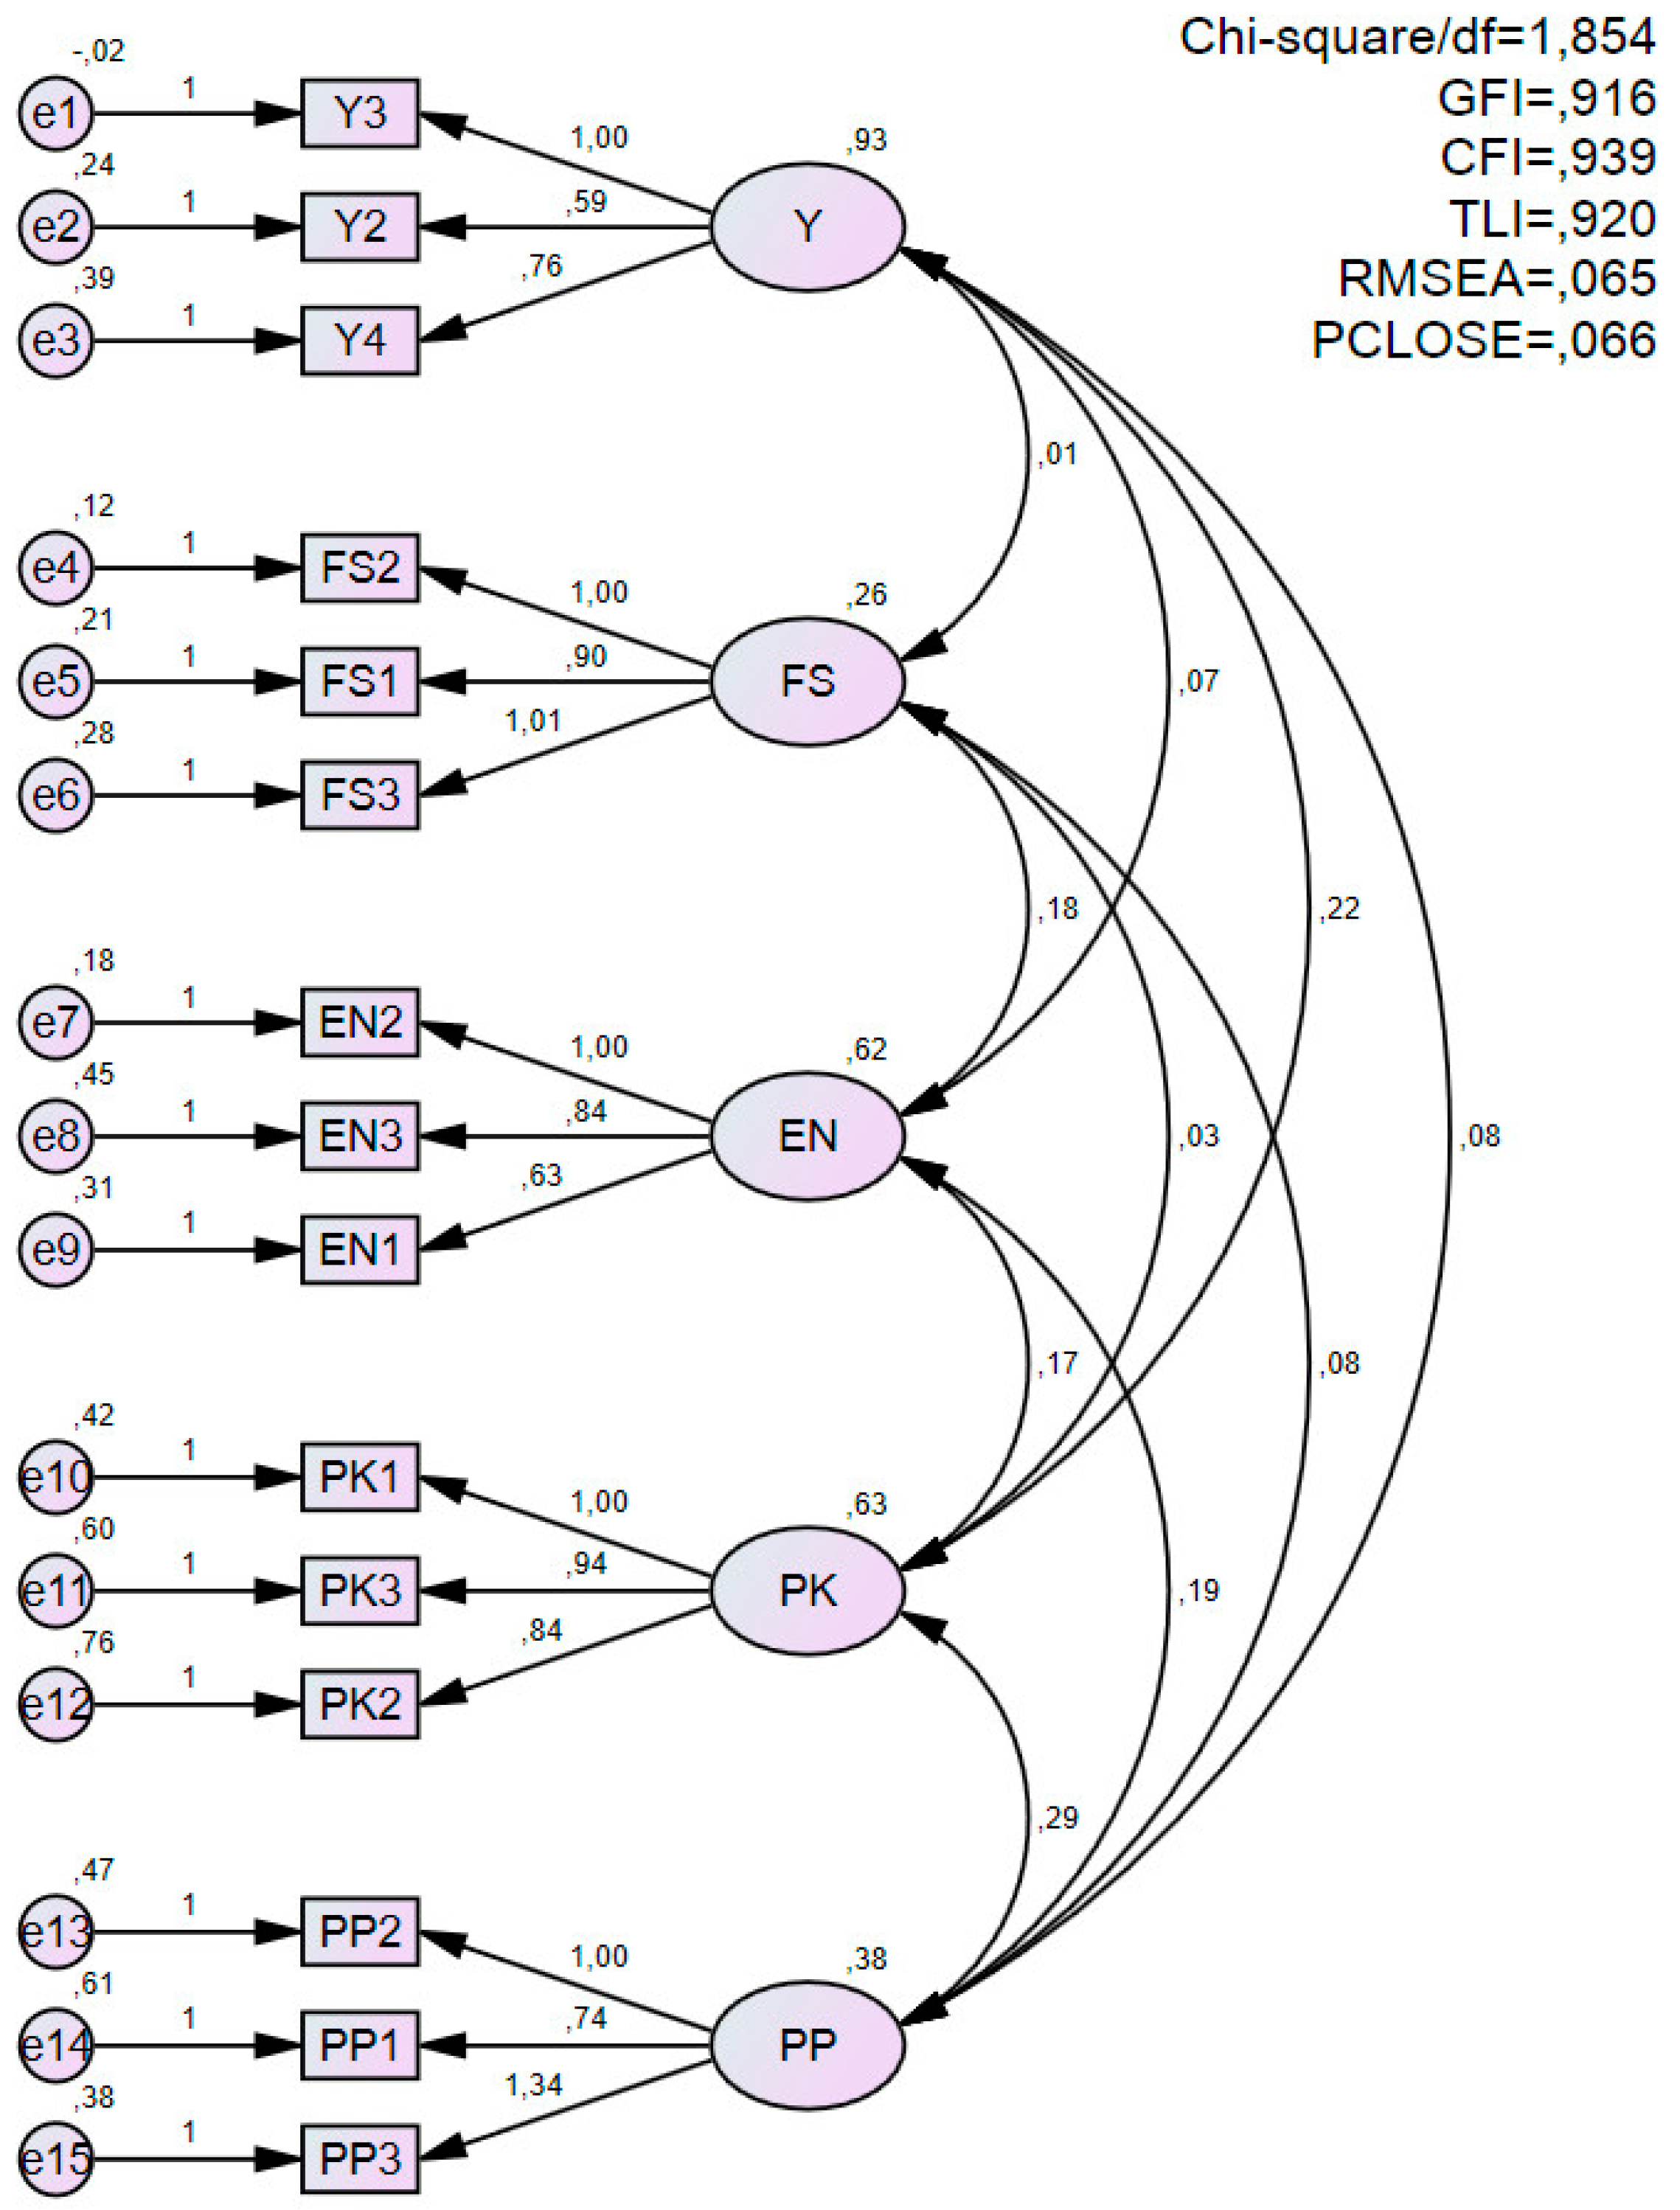
d) Testing the theoretical SEM
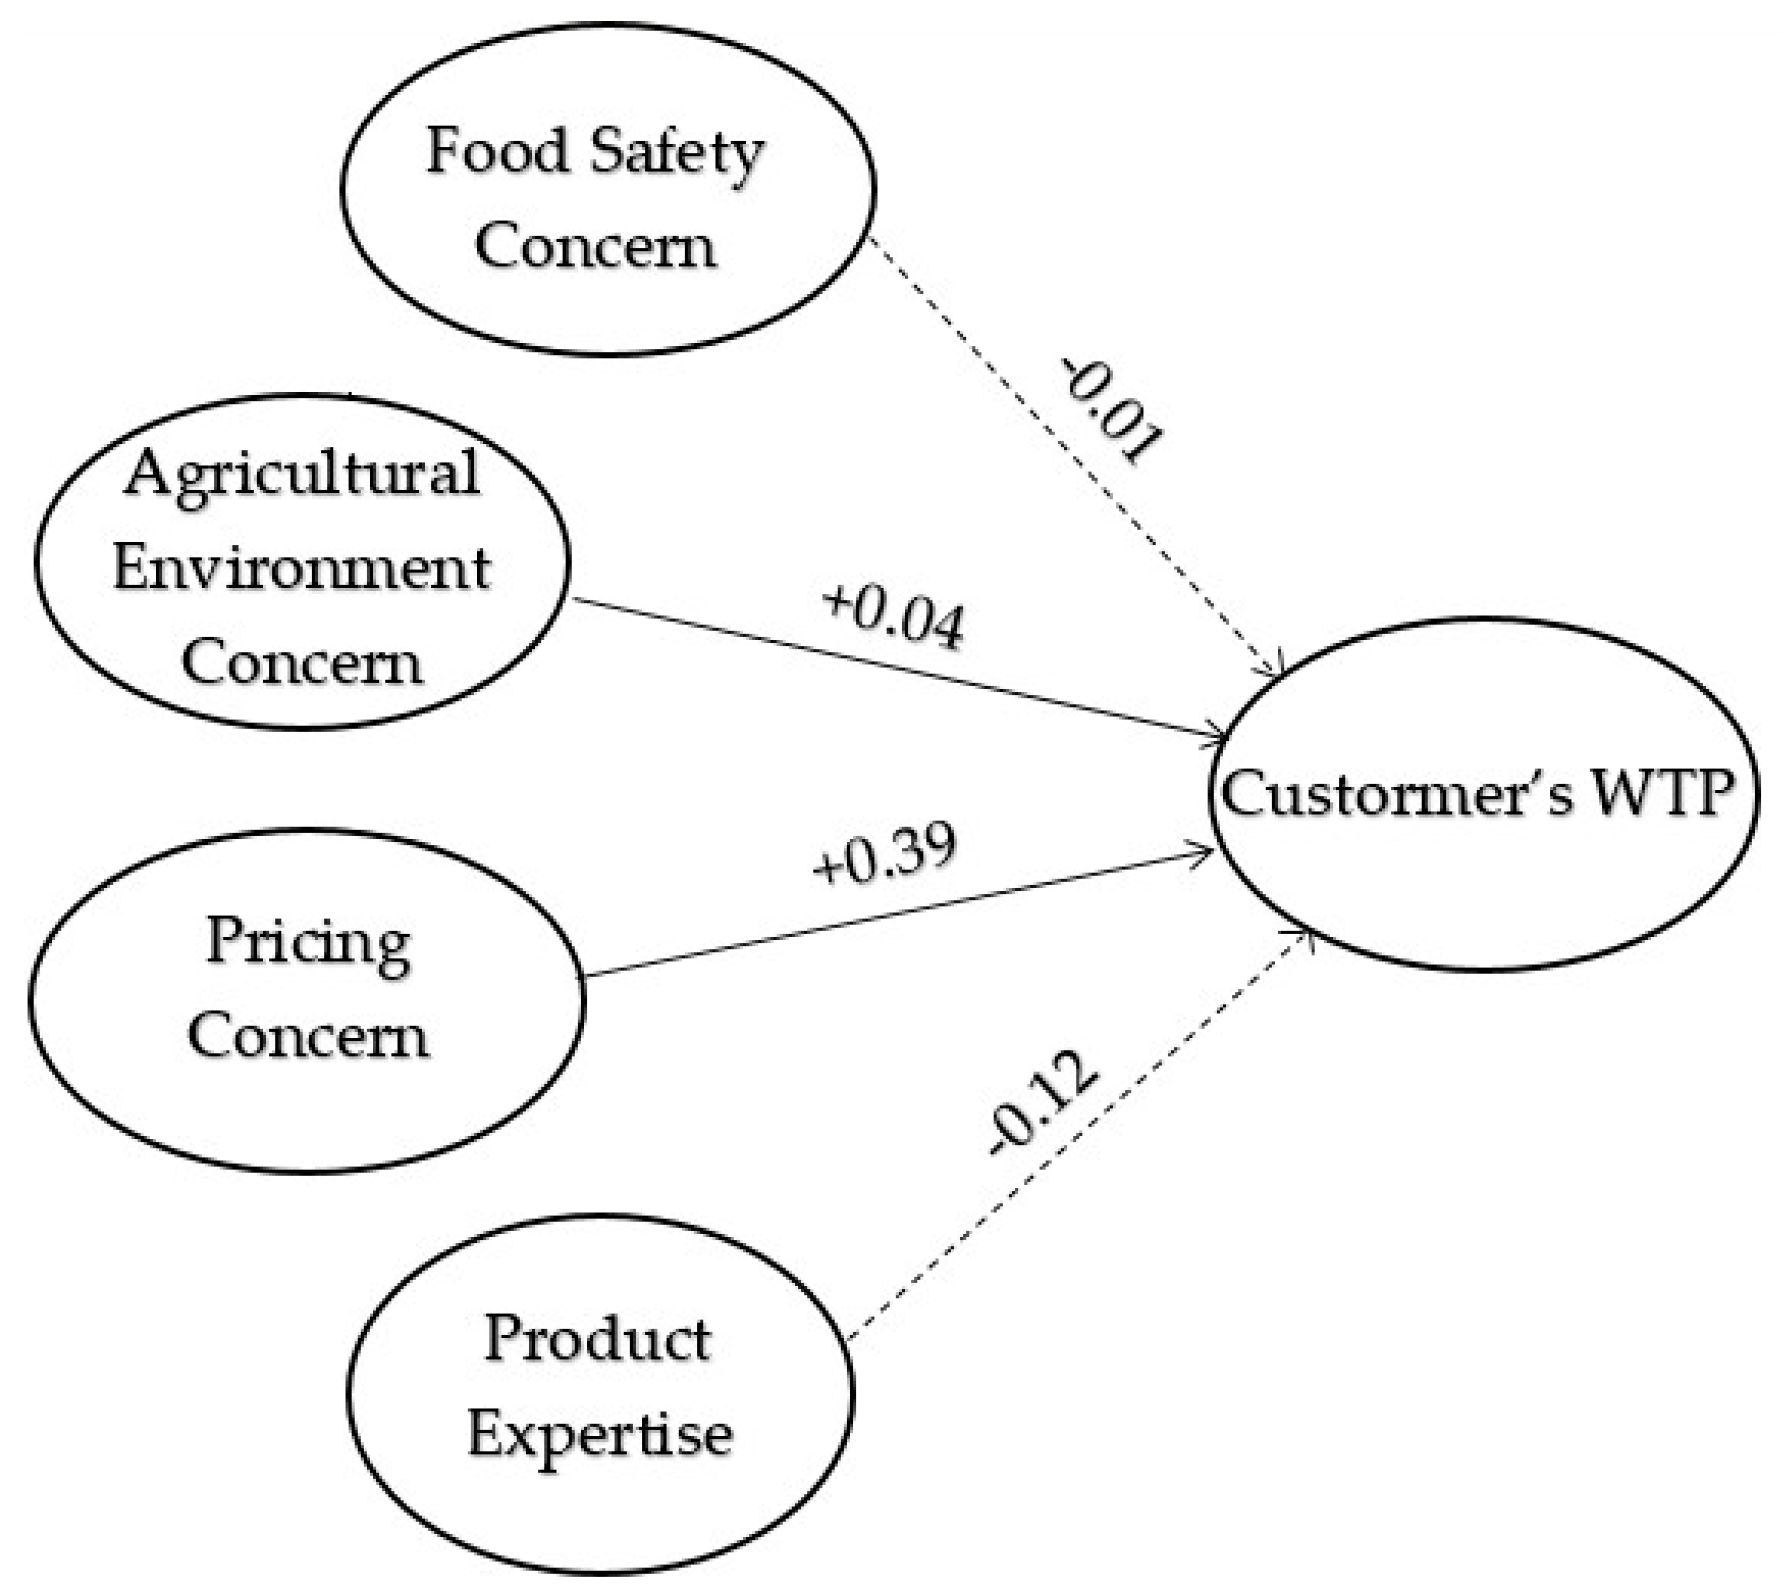
In this study, SEM is utilized to determine the influencing customers’ preferences and the extent to which each customer’s preferences variable affected their WTP for eco-labeling. The initial model is modified to make it better. Using the AMOS program, the CFA test results are modified in accordance with the MI > 10 (MI-Index), which is equivalent to modifying an χ2 with a degree of freedom. Figure 7 demonstrates that the modified CFA results fit the data: Goodness-of-Fit is substantially enhanced (χ2/df = 1.854; GFI = 0.916; TLI = 0.920; CFI = 0.939; RMSEA = 0.065; PCLOSE = 0.066). The statistically significant regression coefficients between 'Food safety concern' (FS), 'Agricultural environment concern' (EN), 'Pricing concerns' (PP), 'Product expertise' (PK), and 'Customers’ WTP' (Y). The independent variables that comprise the variable Y being measured have discriminant validity.
e) Bootstrapping
To estimate the coefficients and standard errors, a bootstrap sample of size 500 is constructed. Table 8 displays the outcomes: (1) The coefficients are listed in the Mean column, (2) their average difference with non-bootstrap estimation is listed in the Bias column, and (3) the standard error differences are listed in SE-Bias. Using the Critical Ratio (CR), a test was conducted to determine whether the Bias = 0 hypothesis is supported. At a 5% level of significance, the hypothesis is rejected if CR is less than 1.96. The test validates the SEM model's robust estimates, and the theoretical SEM model is acceptable.
6. Discussions, policy recommendations and conclusions
6.1. Discussions
The DNBR is a significant move forward in developing natural capitals in a sustainable manner, which has a positive effect on the economies of Dong Nai province and neighboring HCMC, Vietnam. To implement the action plan for the development of eco-labels in UNESCO BRs, MAB Vietnam (the Vietnam National Commission for UNESCO's Man and the Biosphere Programme) has promoted eco-labeling seminars for organic foods and OCOP (One Commune One Product) of Vietnam in these regions over the past few years. The benefits of eco-labeling for BRs are numerous, including bolstering local economies, providing potential benefits to both consumers and producers, promoting environmental and biodiversity conservation, and assisting in the operation of models for sustainable development [10]. Particularly for DNBR, eco-labeling creates added value for cocoa, one of the most significant organically produced agricultural products in this region. This study employs the demand approach, focusing on consumers’ preferences and their WTP. Understanding the preferences of consumers is essential for businesses because it enables them to design and market their products and services more effectively. In addition, knowing WTP of consumers aids in determining the market value of a product and the pricing strategy a business should implement. According to descriptive statistics, surveyed consumers care not only about the food safety and the price of product, but also about the agricultural environment's sustainability; therefore, the application and implementation of eco-labeling on cocoa powder are crucial for DNBR. The maximum price a consumer is willing to pay for an eco-labeled cocoa product ranges from 3.31 to 3.94 $US, which is higher than the maximum price for an organically labeled product, provides empirical evidence to support the above statement.
A variety of factors, including personal taste, lifestyle, cultural heritage, social status, and prior experiences, can influence the preferences of customers. The ANOVA test examines the effect of the gender and educational background of consumers on their preferences. Both males and females are equally concerned with food safety. There is no significant distinction between male and female customers’ concerns regarding food safety. Because environmental degradation from agricultural practices affects everyone's health and quality of life, gender plays a role in determining how concerned consumers are about the agricultural environment. Since females care more about health and the environment than males, they are more inclined to buy organic foods [24,25]. Cost is more important to customers than quality. The results also indicate that these factors are influenced by an individual's level of education. Graduated consumers have a greater personal interest in and familiarity with the product.
The analysis of factors affecting consumers' WTP is significantly more complex than their preferences. WTP is frequently determined by both the customer's preferences and other factors, such as the product or service's perceived value, the customer's income level, and the availability of substitutes. In this study, SEM is used to construct a model that illustrates the relationships between a set of observed variables and a set of latent variables, such as food safety concern, agricultural environment concern, price concern, product expertise, and customers' willingness to pay. Concerns regarding food safety, the agricultural environment, prices, and product expertise influence the WTP of consumers in various ways.
Figure 7 shows that a concentration on food safety and product expertise decreased consumers' WTP. It implies that as consumers gain more product knowledge and become more concerned with food safety, they will have less disposable income to spend on eco-labeled organic cocoa powder. Possible causes include customers' preferences that eco-labeling is more expensive than organic labeling and consumers' inability to afford eco-labeled foods due to increased spending on food safety. Several previous studies reached the same conclusion. For instance, in China, food safety concerns have a negative effect on consumers' WTP. Consumers' WTP decreases as their food safety concerns increase. This trend can be attributed to the fact that consumers who are concerned about food safety are more likely to actively seek out information and education on the subject than to simply pay a higher price for the product [26]. In addition, other variables, such as brand loyalty, product scarcity, etc., may influence the effect of food safety concerns on consumers' WTP.
The relationship between customers’ agricultural environment concern and their WTP are positive. As the importance of environmental issues increases, consumers are more likely to pay a premium for eco-labeled organic cocoa powder. One possible explanation for this is that businesses want consumers to assume that purchasing organic foods with eco-labels reduces their individual responsibility to protect the environment. Therefore, when people become more environmentally conscious, they are prepared to pay a tad more for products with an eco-label. The packaging and manufacturing of this product have minimal environmental impact. As consumers become more environmentally conscious and willing to pay a premium for products that contribute to environmental protection, the market for eco-labeled products is expected to expand.
Concern for prices has a positive impact on consumers' WTP. The results of the study indicate that if the cocoa powder's price continues to rise, consumers may become less likely to purchase it. If this food is deemed valuable, consumers may be willing to pay a higher price. This study finding is consistent with those of others; for example, product quality and customer satisfaction are important to consumers. WTP for organic products can be influenced by the market [27,28,29,30,31,32]; company image, offered pricing, and consumer trust have an effect on their willingness to pay for green food products [31,33,34]; consumers' value perceptions play a significant role in determining how much they are willing to pay for environmentally friendly products [35,36,37].
Figure 8.
A structural model for determinants of customers’ WTP for eco-labeling organic cocoa powder in DNBR, Vietnam.
Figure 8.
A structural model for determinants of customers’ WTP for eco-labeling organic cocoa powder in DNBR, Vietnam.
Higher prices are connected with higher labels because consumers will pay more for better features. BRs manufacture and distribute organic foods to safeguard biodiversity-rich environments and human life. Unique items get greater prices. We recommend going with Tier 2 eco-label that have been reviewed and approved by the DNBR management board. When the organic cocoa powder is manufactured under the careful watch of the administration of the DNBR, it will ensure that all legislation and norms pertaining to the preservation of the environment and the biodiversity will be adhered to. This contributes to ensuring the region's continued sustainable development and serving as the driving force behind a green economy. We discover that consumers do not have a great deal of knowledge regarding international certifications, but this lack of knowledge does not have a significant impact on their desire to pay for items when we analyze the components that affect willingness to pay for products. Consequently, as the decision that is both the safest and the most advantageous, we advise going with Tier 2 eco-label. At the same time, we believe that it is essential to develop policies that educate the general public and help them become more aware of the significance of carrying the appropriate international certifications for each product. This will help customers grasp the relevance of certifications, much in the same way that they understand the value of eco-labels, and it may lead to an increasing readiness to pay more for items that have been certified.
6.2. Policy recommendations
The findings of this study implies that customers' preferences and their WTP are significant factors in their purchasing decisions for eco-labeled cocoa powder, which provides information to guide the development and implementation of eco-label programs in BRs of Vietnam.
Firstly, it is the intention of eco-label programs for organic goods grown in UNESCO BRs to accurately reflect the attitudes and interests of its consumers with regards to environmental sustainability generally and sustainable agricultural practices particularly. The most significant sustainability requirements for organic foods may be identified through demand-side research, and then the criteria for eco-labels can be developed to reflect these findings. Products with an eco-label have met strict criteria for their raw materials, materials, manufacturing technology, and environmental management in order to guarantee environmental and health safety, reduce their impact on the environment, and get approval or recognition from a relevant body. The Vietnam eco-label indicates that a product or service has been certified as environmentally friendly by a competent Vietnamese agency. Products' conformity to Vietnam's eco-label criteria are monitored, analyzed, and assessed by quality assessment and environmental monitoring agencies. Vietnam's Law of Environment Protection 2020 states that the country would accept environmentally friendly products and services from other countries that have signed mutual recognition agreements with Vietnam. The Vietnam Ministry of Natural Resources and Environment (MONRE) also provides guidance and inspections to businesses and people whose goods and services have been awarded the Vietnam eco-label for environmental friendliness. Vietnam's eco-label program certifies environmentally friendly goods and services for a period of 36 months. The central government of Vietnam supports initiatives to certify products and services in accordance with Vietnam's eco-label criteria.
Secondly, to further promote increased participation in sustainability projects, both central and provincial governments provide cash incentives to enterprises that have earned eco-label certification. Eco-label certification may help businesses save money by qualifying them for tax credits or subsidies that allow them to invest in renewable energy or reduce waste without negatively impacting their bottom line. Financial incentives for eco-label certification might encourage more companies to put sustainability at the forefront of their product development and marketing efforts. Positive changes for the environment and for society as a whole may arise from this trend toward greener industrial practices and consumer goods. Governments may also contemplate rewarding companies financially for going above and beyond the minimum standards required for eco-label certification. Businesses who go above and above in their sustainability efforts and earn higher certification levels, for instance, may be eligible for additional rewards and publicity. The government provides companies with tools and assistance in order to help them get an eco-label. To create and execute sustainable practices, firms may need access to training programs, technical support, and other resources.
Finally, the DNBR Management Board could increase consumer awareness of eco-labels and make the certification process more transparent and accessible. Increasing consumer awareness of eco-labels is crucial for promoting sustainable consumption and encouraging companies to employ environmentally responsible practices. Utilizing their status as a respected authority on environmental issues and sustainability, the DNBR management board can play a crucial role in this endeavor. To accomplish this objective, the BNBR management board could develop a searchable online database or directory of certified products. This would facilitate consumers' access to information regarding the environmental impact of the products they are contemplating purchasing, allowing them to make informed decisions based on their values and priorities. In addition to providing a database or directory, the management board could strive to make the certification procedure more open and transparent. This could involve providing plain and readily understandable information about the certification criteria, such as the environmental impact of the products and the specific sustainability criteria that were evaluated. By making the eco-label certification process more transparent and accessible, the DNBR Management Board can contribute to a greater understanding and appreciation of the significance of sustainable consumption. In turn, this can encourage more companies to implement environmentally responsible practices and invest in the development of sustainable products and services. This can ultimately contribute to the preservation of natural resources and the community's long-term health and prosperity.
6.3. Conclusions
Overall, eco-labeled organic cocoa powder in DNBR attract premium customers. Surveyed customers are ready to pay a maximum amount of 3.31 to 3.94 $US for eco-labeling an organic cocoa powder, which is more than the maximum price for an organic product. Customers decide WTP based on their preferences. Food safety and product expertise lowered WTP, whereas agricultural environment and pricing concerns increased it.
The DNBR Management Board is recommended to evaluate and approve the Tier 2 eco-label. Eco-labeling might provide multiple benefits for stakeholders in DNBR. Both central and provincial governments and DNBR Management Board should simplify certification. For sustainable consumerism and corporate environmental responsibility, eco-label awareness must rise.
Author Contributions
Conceptualization, An Thinh Nguyen, Van Dinh Ha and Huy Kien Ngo; Formal analysis, An Thinh Nguyen, Ngoc Anh Le, Phuong Mai Khong, Ngoc Tram Thi Do and Minh Thuan Trinh; Investigation, Ngoc Anh Le, Phuong Mai Khong, Ngoc Tram Thi Do, Minh Thuan Trinh, Tuan Dat Nguyen, Tran Quoc Khanh Ngo, Linh Chi Vu, My Luong Thi Do, Anh Tu Le, Binh Minh Tran and Van Thuong Nguyen; Methodology, An Thinh Nguyen and Van Dinh Ha; Project administration, Van Dinh Ha, Huy Kien Ngo and Anh Tu Le; Software, Huy Kien Ngo; Validation, An Thinh Nguyen; Writing – original draft, An Thinh Nguyen, Phuong Mai Khong, Ngoc Tram Thi Do and Minh Thuan Trinh; Writing – review & editing, An Thinh Nguyen, Van Dinh Ha and Huy Kien Ngo.
Funding
This study was supported by the Vietnamese National Project “Study on the current status, needs, proposals and trial application of a model of building, using and managing eco-labels for products and services in the UNESCO Biosphere Reserves of Vietnam”, code ĐTĐLXH-07/20.
Acknowledgments
The authors would like to thank officials, locals, and customers who were most collaborative in the execution of the field investigation, and in providing discussion opportunities on the results.
Conflicts of Interest
The authors declare no conflict of interest.
References
- Mertz, O.; Ravnborg, H.M.; Lövei, G.L.; Nielsen, I.; Konijnendijk, C.C. Ecosystem services and biodiversity in developing countries. Biodivers Conserv 2007, 16, 2729–2737. [Google Scholar] [CrossRef]
- El-Ashry, M.T. Balancing economic development with environmental protection in developing and lesser developed countries. Air & Waste 1993, 43, 18–24. [Google Scholar]
- Bilali, H.E.; Callenius, C.; Strassner, C.; Probst, L. Food and nutrition security and sustainability transitions in food systems. Food and Energy Security 2019, 8, e00154. [Google Scholar] [CrossRef]
- Salzman, J. Informing the green consumer: the debate over the use and abuse of environmental labels. Industrial Ecology 1997, 1, 11–21. [Google Scholar] [CrossRef]
- Chen, X.; Gao, Z.; Swisher, M.; House, L.; Zhao, X. Eco-labeling in the Fresh Produce Market: Not All Environmentally Friendly Labels Are Equally Valued. Ecological Economics 2018, 154, 201–210. [Google Scholar] [CrossRef]
- Salladarré, F.; Brécard, D.; Lucas, S.; Ollivier, P. Are French consumers ready to pay a premium for eco-labeled seafood products? A contingent valuation estimation with heterogeneous anchoring. Agricultural Economics 2016, 47, 247–258. [Google Scholar] [CrossRef]
- Bonsi, R.; Hammett, A.L.; Smith, B. Eco–labels and International Trade: Problems and Solutions. World Trade 2008, 42, 407–432. [Google Scholar]
- Hameed, I.; Idrees, W. Eco Labels and Eco Conscious Consumer Behavior: The Mediating Effect of Green Trust and Environmental Concern. Management Sciences 2018, 5, 86–105. [Google Scholar] [CrossRef]
- Bruce, C.; Laroiya, A. The Production of Eco-Labels. Environ Resource Econ 2007, 36, 275–293. [Google Scholar] [CrossRef]
- Adhe, L.; Fenesia, W.; Katriana, T. Good Practices on Applying Eco-labeling in Asia and the Pacific Biosphere Reserves. 2019, 6, 20-40. 2023. Available online: https://unesdoc.unesco.org/ark:/48223/pf0000373540 (accessed on 19 March 2023).
- Gallastegui, I.G. The use of eco-labels: a review of the literature. European Environment 2002, 12, 316–331. [Google Scholar] [CrossRef]
- Clapp, J.; Fuchs, D. Corporate Power in Global Agrifood Governance. MIT Press, 2009, 328 pp.
- Fairtrade International. Cocoa. 2021. Available online: https://www.fairtrade.net/product/cocoa.
- UTZ. Cocoa. 2021. Available online: https://utz.org/what-we-offer/cocoa/.
- Chatterjee, S.; Hadi, A.S. Regression analysis by example (5th ed.). John Wiley & Sons, chapter 2, "Descriptive Statistics and Simple Regression Analysis, 2015.
- Hinkle, D.E.; Wiersma, W.; Jurs, S.G. Applied Statistics for the Behavioral Sciences. Houghton Mifflin; 5th edition, 2002, 756 pages.
- Montgomery, D.C.; Peck, E.A.; Vining, G.G. Introduction to Linear Regression Analysis. Wiley Series in Probability and Statistics, 2021, 704 pages.
- Hair, J.F.; Black, W.C.; Babin, B.J.; Anderson, R.E.; Tatham, R.L. Multivariate data analysis. Pearson Education 2010, 31, 351–352. [Google Scholar]
- Verain, M.C.D.; Bartels, J.; Dagevos, H.; Sijtsema, S.J. Exploring the gap between consumers' knowledge and behavior regarding sustainable seafood. Appetite 2014, 79, 159–166. [Google Scholar]
- Ha, V.D.; Thinh, N.A.; Anh, L.N. Eco-labeling for Green Economic Development in the Buffer Zones and Transition Areas of the World Biosphere Reserves in Vietnam. VNU Journal of Economics and Business 2021, 1, 3. [Google Scholar]
- Shen, J. Understanding the determinants of consumers' willingness to pay for eco-labeled products: an empirical analysis of the China environmental label. Service Science and Management 2012, 87–94. [Google Scholar] [CrossRef]
- Thøgersen, J. How may consumer policy empower consumers for sustainable lifestyles? Consum Policy 2005, 28, 143–177. [Google Scholar] [CrossRef]
- CDC, US. People with a higher risk of food poisoning, 2022. Available online: https://www.cdc.gov/foodsafety/people-at-risk-food-poisoning.html.
- 24. CARE. Gender Equality and Women’s Empowerment in the context of Food Security and Nutrition. A Scoping Paper 2020, 42 pages.
- Hirst, A.; Ashwin, I. M. Cross cultural difference between online shoppers in London and Bangkok. International Review of Business Research Papers 2009, 5, 167–191. [Google Scholar]
- Yu, X.; Gao, Z.; Zeng, Y. Willingness to pay for the “Green Food” in China. Food Policy 2014, 45, 80–87. [Google Scholar] [CrossRef]
- Gil, J.M.; Gracia, A.; Sánchez, M. Market segmentation and willingness to pay for organic products in Spain. The International Food and Agribusiness Management Review 2000, 3, 207–226. [Google Scholar] [CrossRef]
- Didier, T.; Lucie, S. Measuring consumer's willingness to pay for organic and Fair Trade products. International Journal of Consumer Studies 2008, 32, 479–490. [Google Scholar] [CrossRef]
- van Doorn, J.; Verhoef, P.C. Willingness to pay for organic products: Differences between virtue and vice foods. International Journal of Research in Marketing 2011, 28, 167–180. [Google Scholar] [CrossRef]
- Kimenju, S.C.; De Groote, H. Consumer willingness to pay for genetically modified food in Kenya. Agricultural Economics 2008, 38, 35–46. [Google Scholar] [CrossRef]
- Clemons, E.K. How information changes consumer behavior and how consumer behavior determines corporate strategy. Management Information Systems 2008, 25, 13–40. [Google Scholar] [CrossRef]
- Janssen, M.; Hamm, U. Product labelling in the market for organic food: Consumer preferences and willingness-to-pay for different organic certification logos. Food Quality and Preference 2012, 25, 9–22. [Google Scholar] [CrossRef]
- Bonn, M.A.; Cronin, J. J.; Cho, M. Do Environmental Sustainable Practices of Organic Wine Suppliers Affect Consumers’ Behavioral Intentions? The Moderating Role of Trust. Cornell Hospitality Quarterly 2016, 57, 21–37. [Google Scholar] [CrossRef]
- Namkung, Y.; Jang, S. Are Consumers Willing to Pay more for Green Practices at Restaurants? Hospitality & Tourism Research 2017, 41, 329–356. [Google Scholar]
- Wong, V.; Turner, W.; Stoneman, P. Marketing Strategies and Market Prospects for Environmentally-Friendly Consumer Products. British Journal of Management 1996, 7, 263–281. [Google Scholar] [CrossRef]
- Lin, P.C.; Huang, Y.H. The influence factors on choice behavior regarding green products based on the theory of consumption values. Cleaner Production 2012, 22, 11–18. [Google Scholar] [CrossRef]
- Gulzari, A.; Wang, Y.; Prybutok, V. A green experience with eco-friendly cars: A young consumer electric vehicle rental behavioral model. Retailing and Consumer Services 2022, 65, 102877. [Google Scholar] [CrossRef]
Figure 1.
Two approaches in the eco-labeling study.
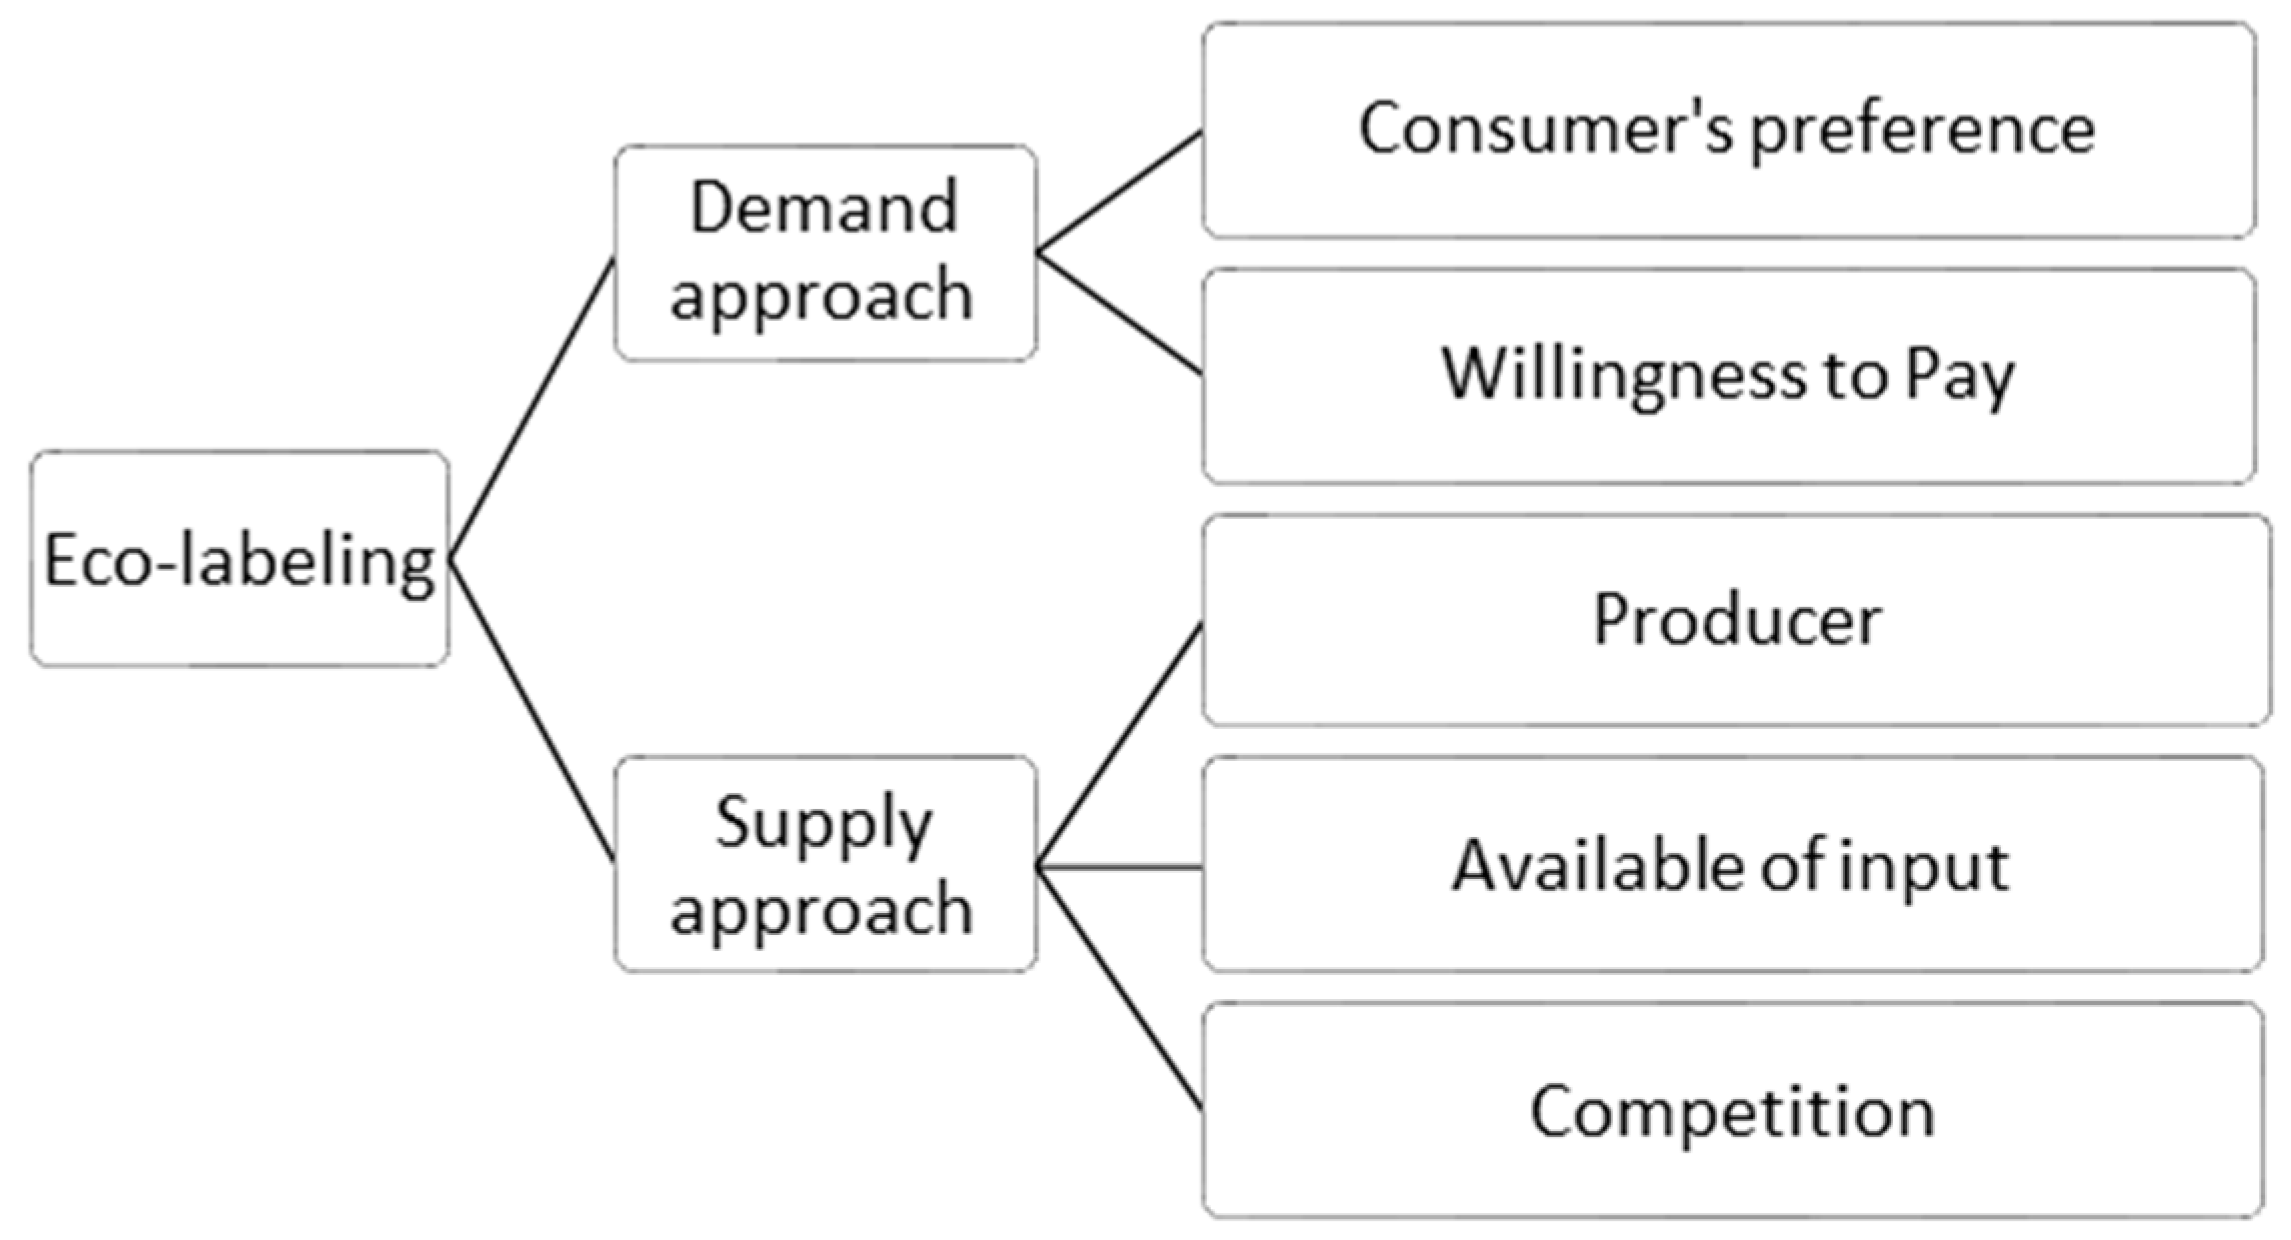
Figure 2.
A theoretical model of customers' preferences influencing their WTP for eco-labeled organic cocoa powder.
Figure 2.
A theoretical model of customers' preferences influencing their WTP for eco-labeled organic cocoa powder.
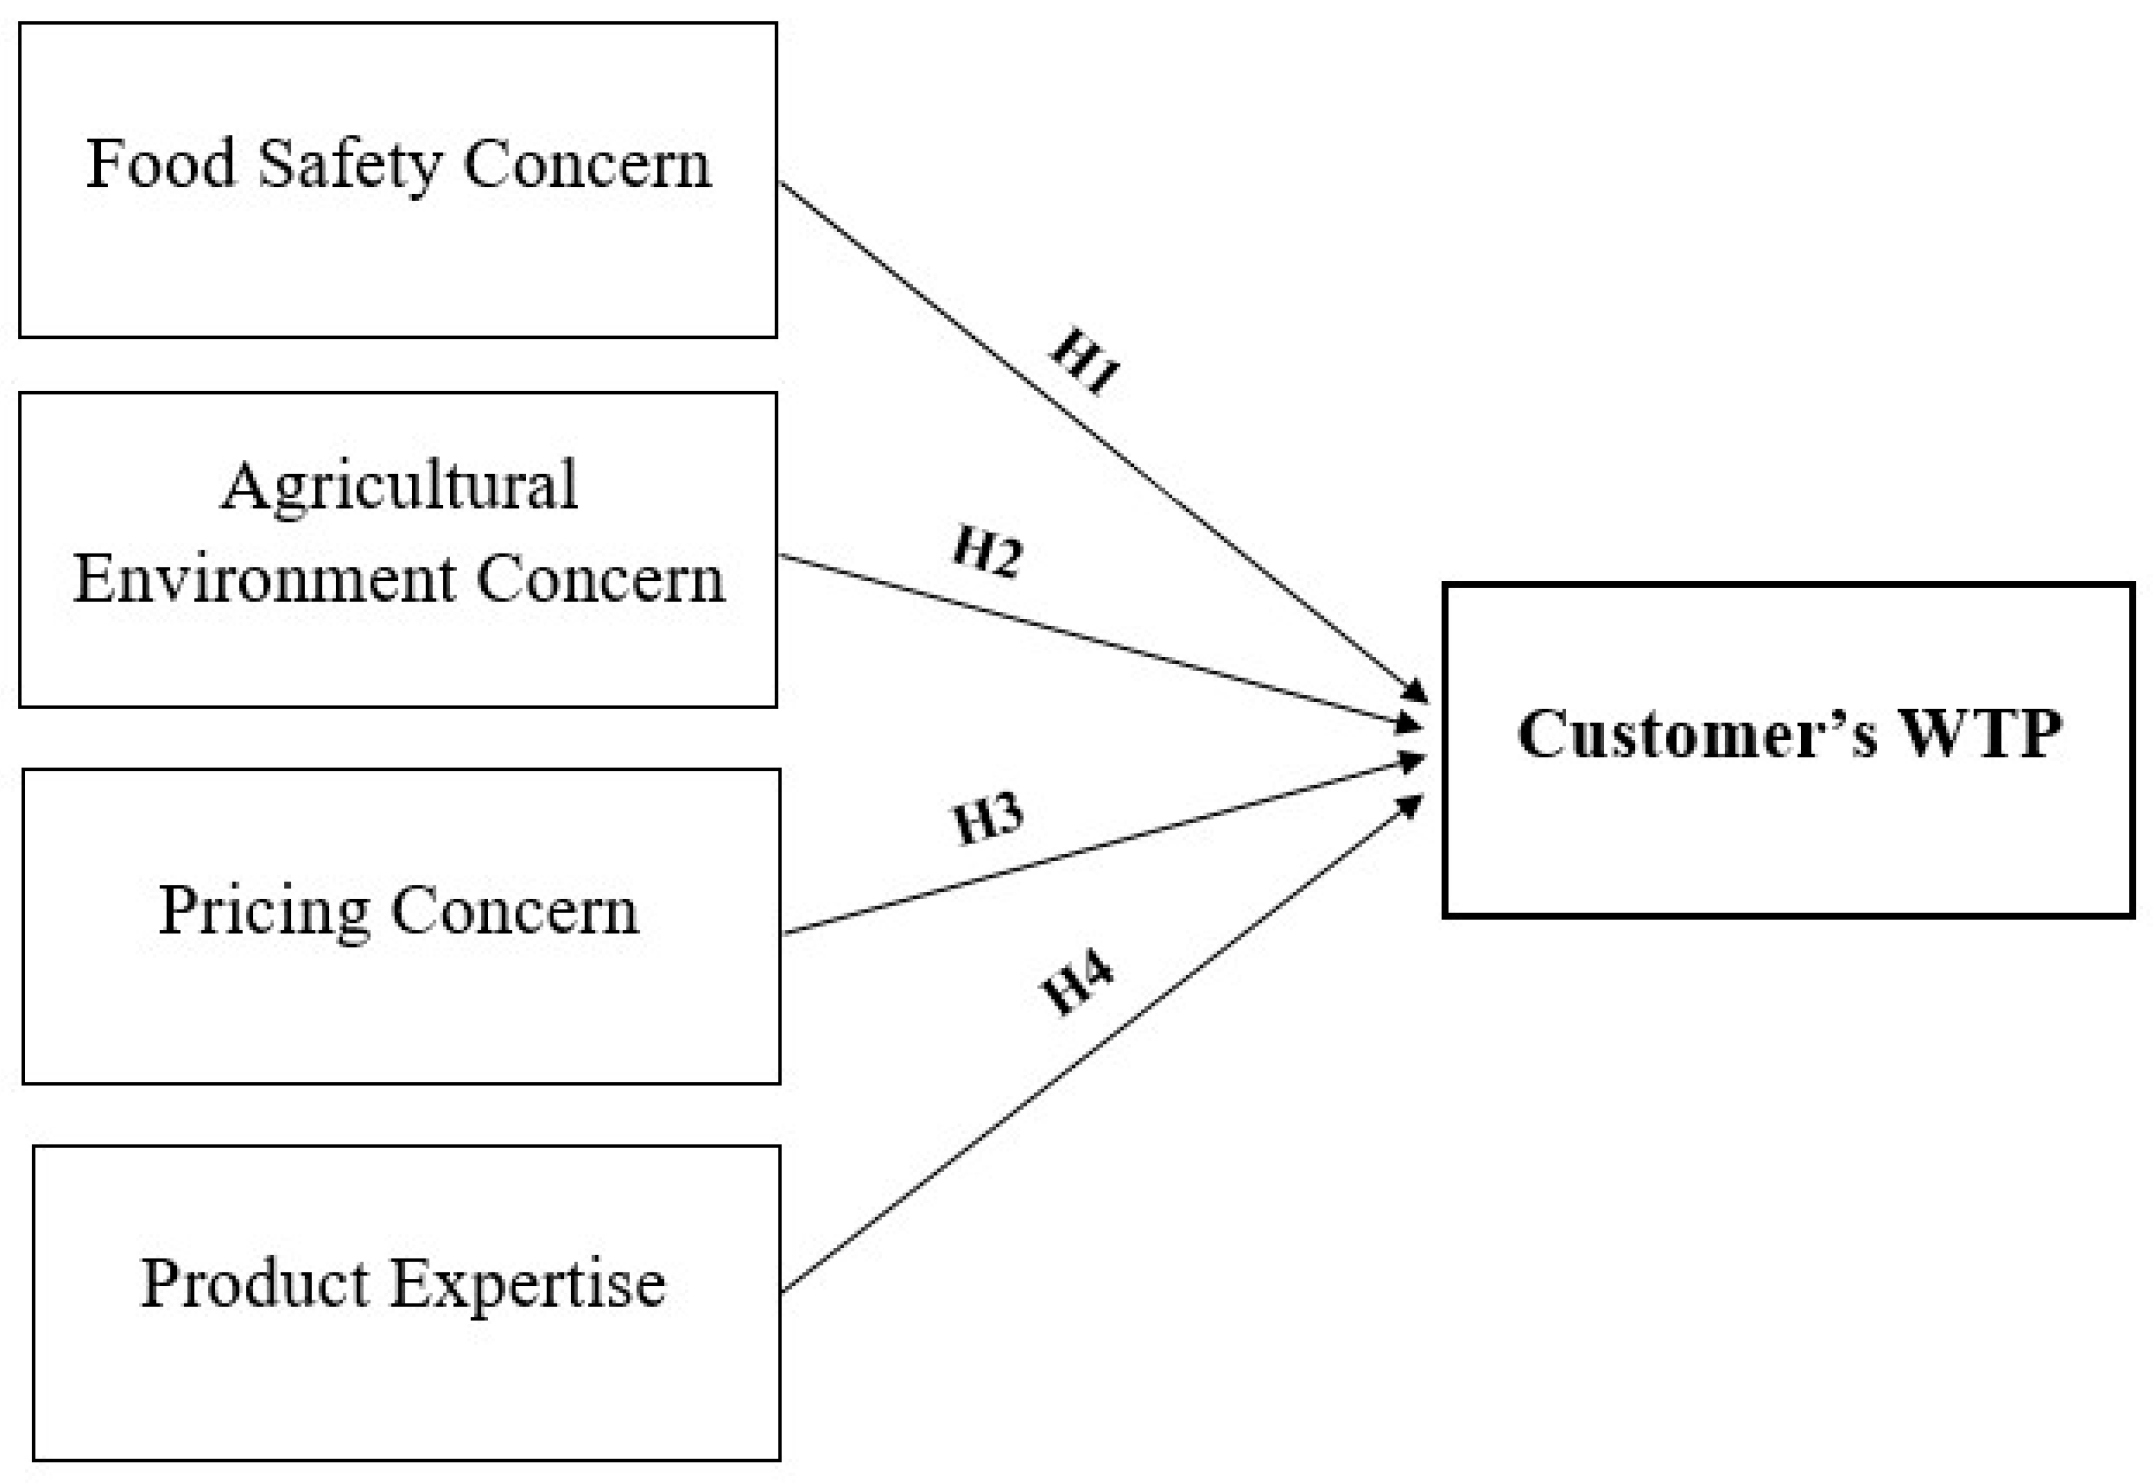
Figure 3.
Box of cocoa powder with an organic label and eco-labels.
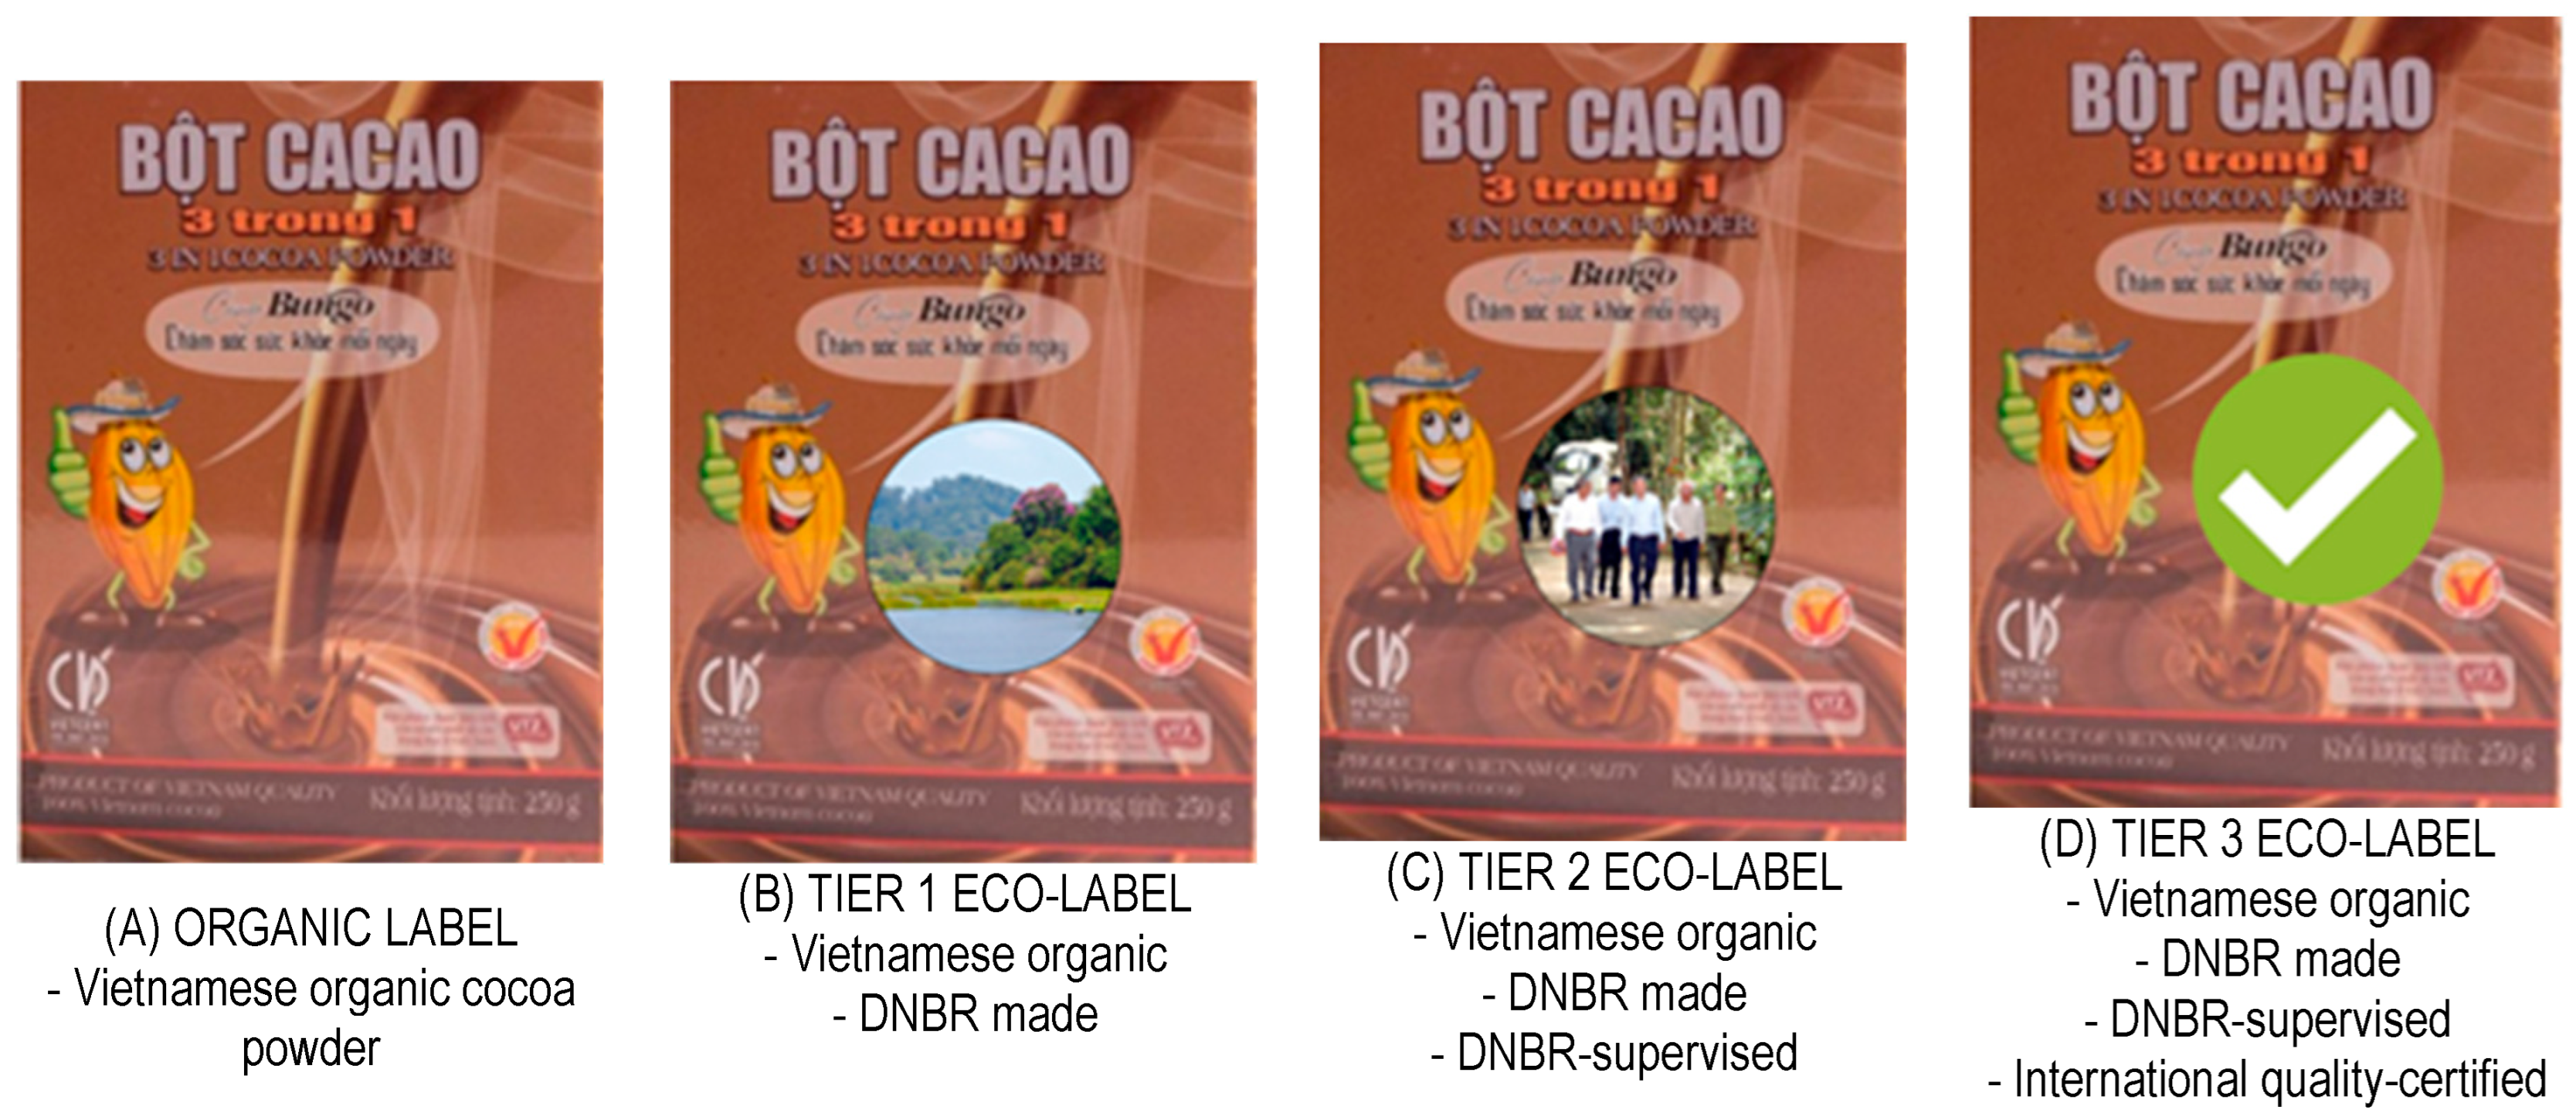
Figure 5.
Statistical chart illustrating customers’ WTPs for eco-labeling.
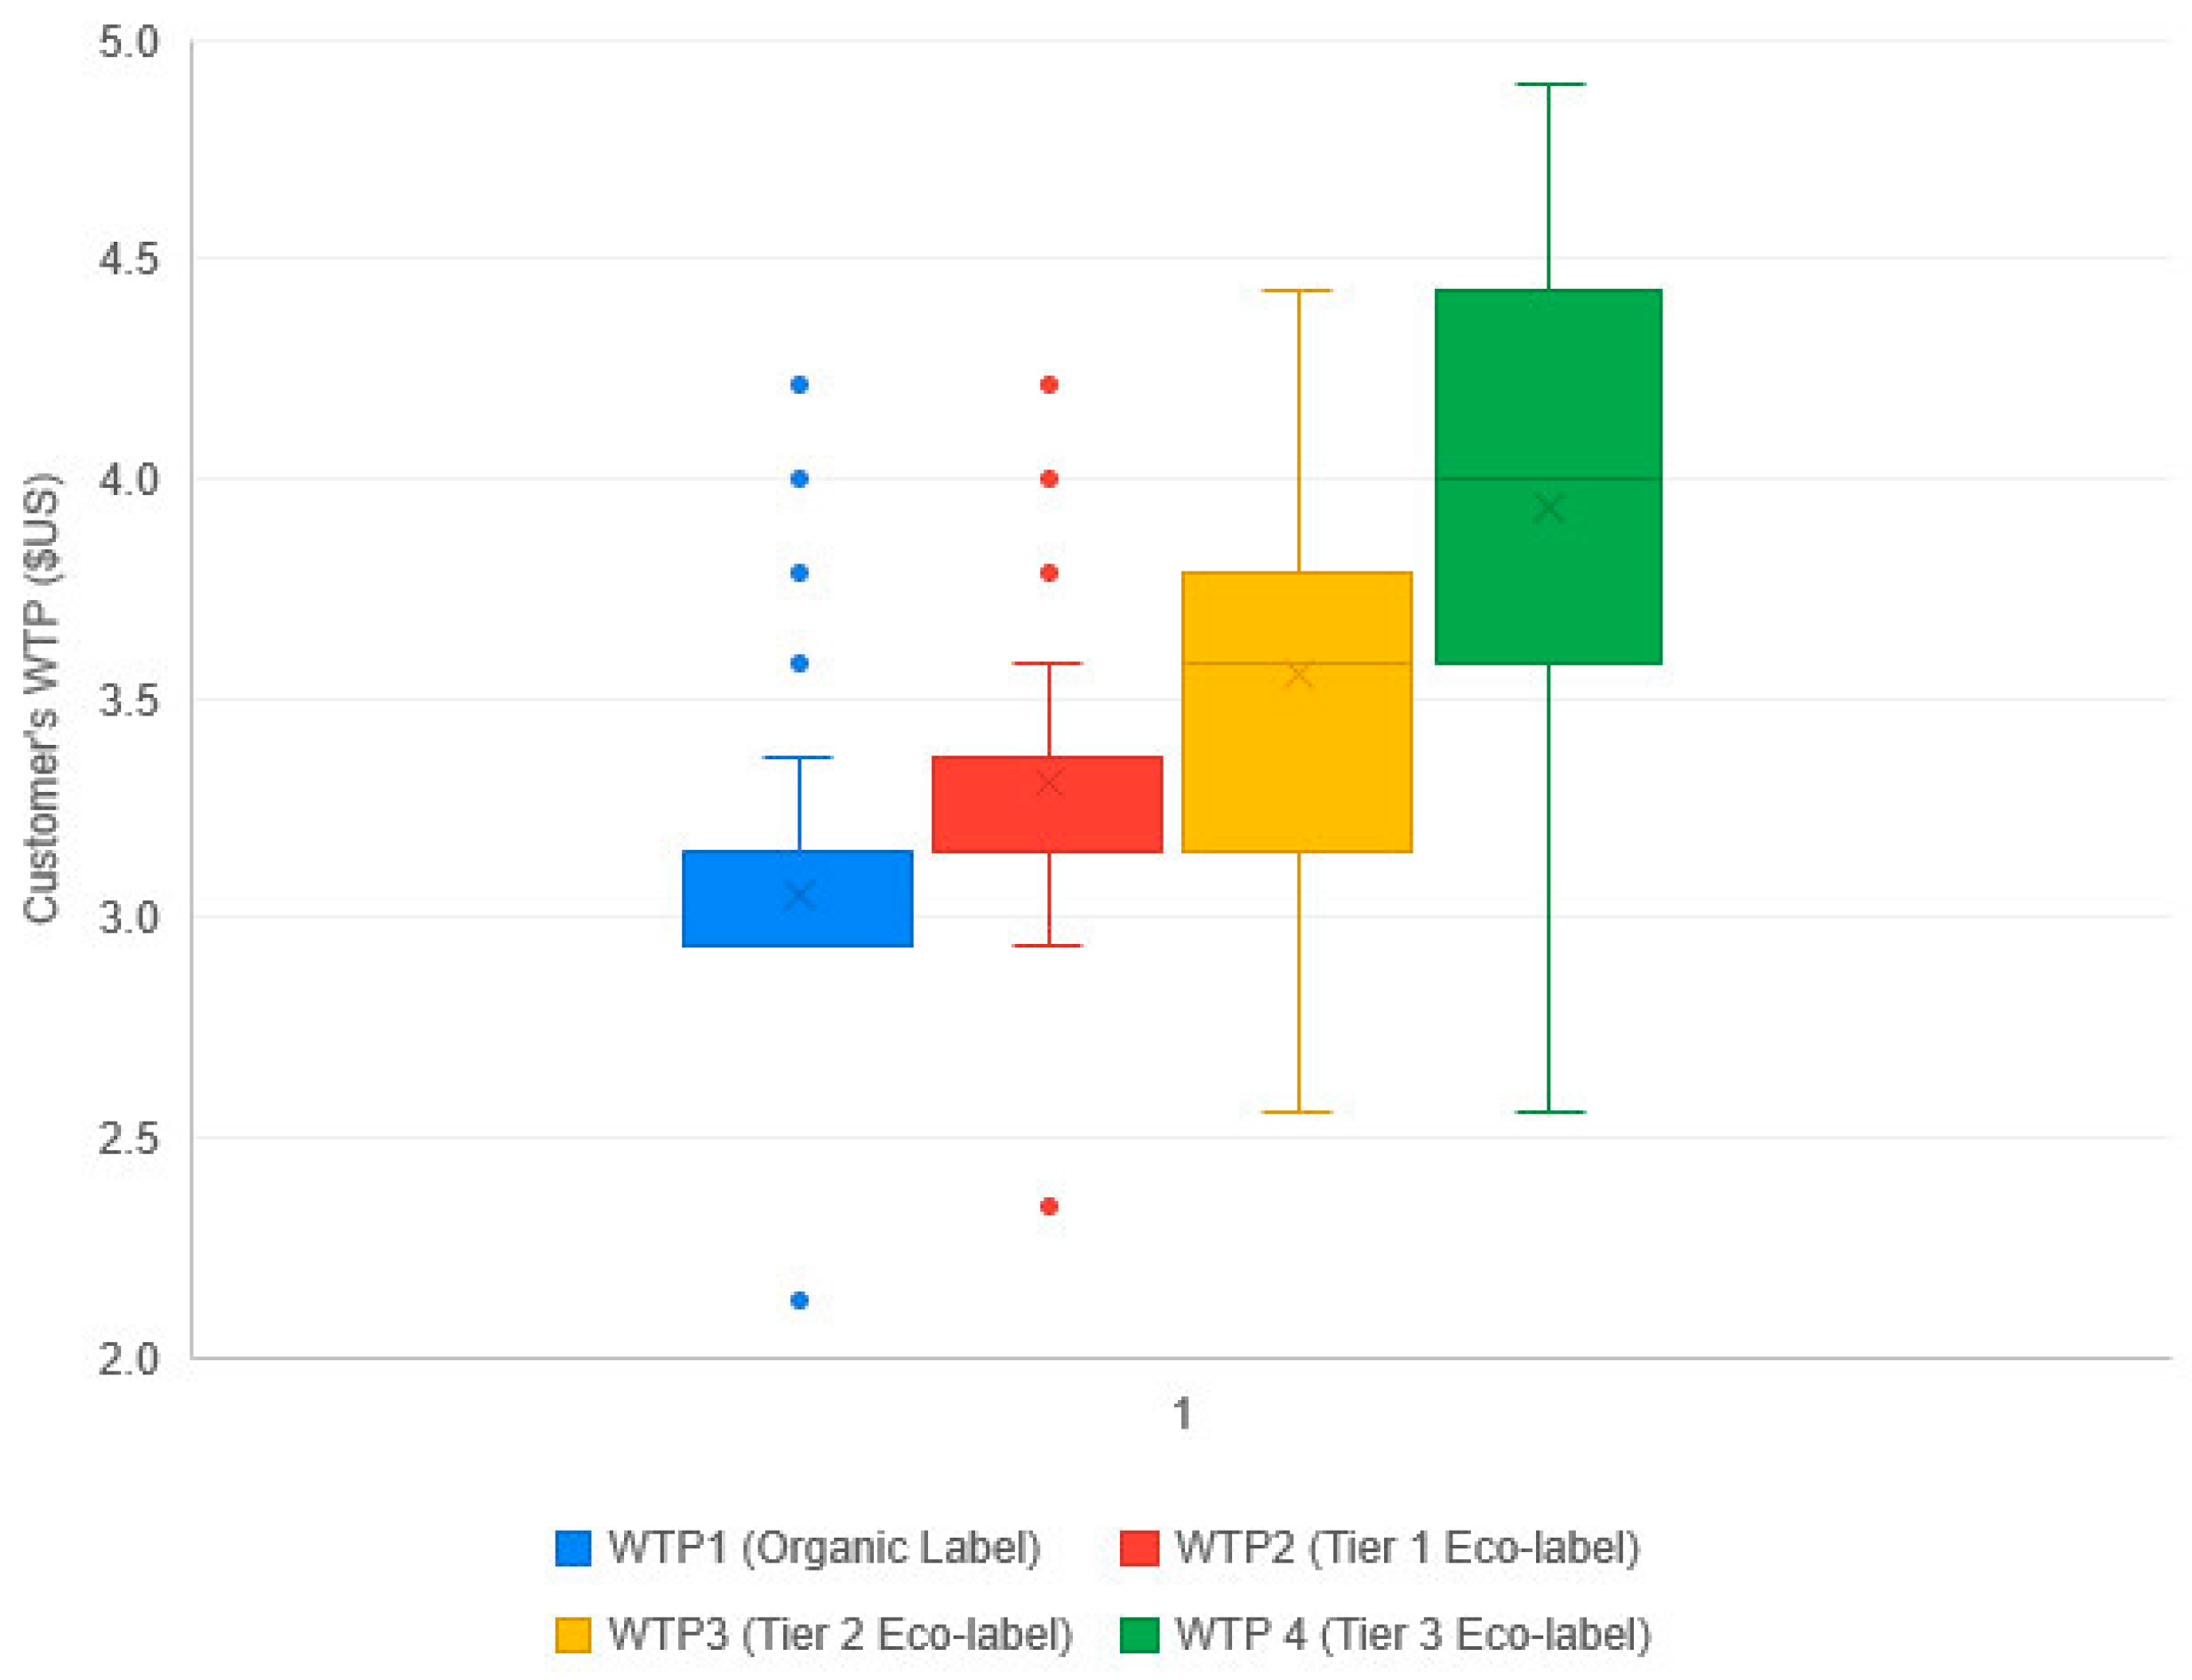
Figure 7.
Structural model for customers’ preferences affecting their WTP for eco-labeling organic cocoa powder in the DNBR, Vietnam (Loads of paths of the alternative structural model determining the composite reliability model) (Source: Own elaboration using software AMOS).
Figure 7.
Structural model for customers’ preferences affecting their WTP for eco-labeling organic cocoa powder in the DNBR, Vietnam (Loads of paths of the alternative structural model determining the composite reliability model) (Source: Own elaboration using software AMOS).
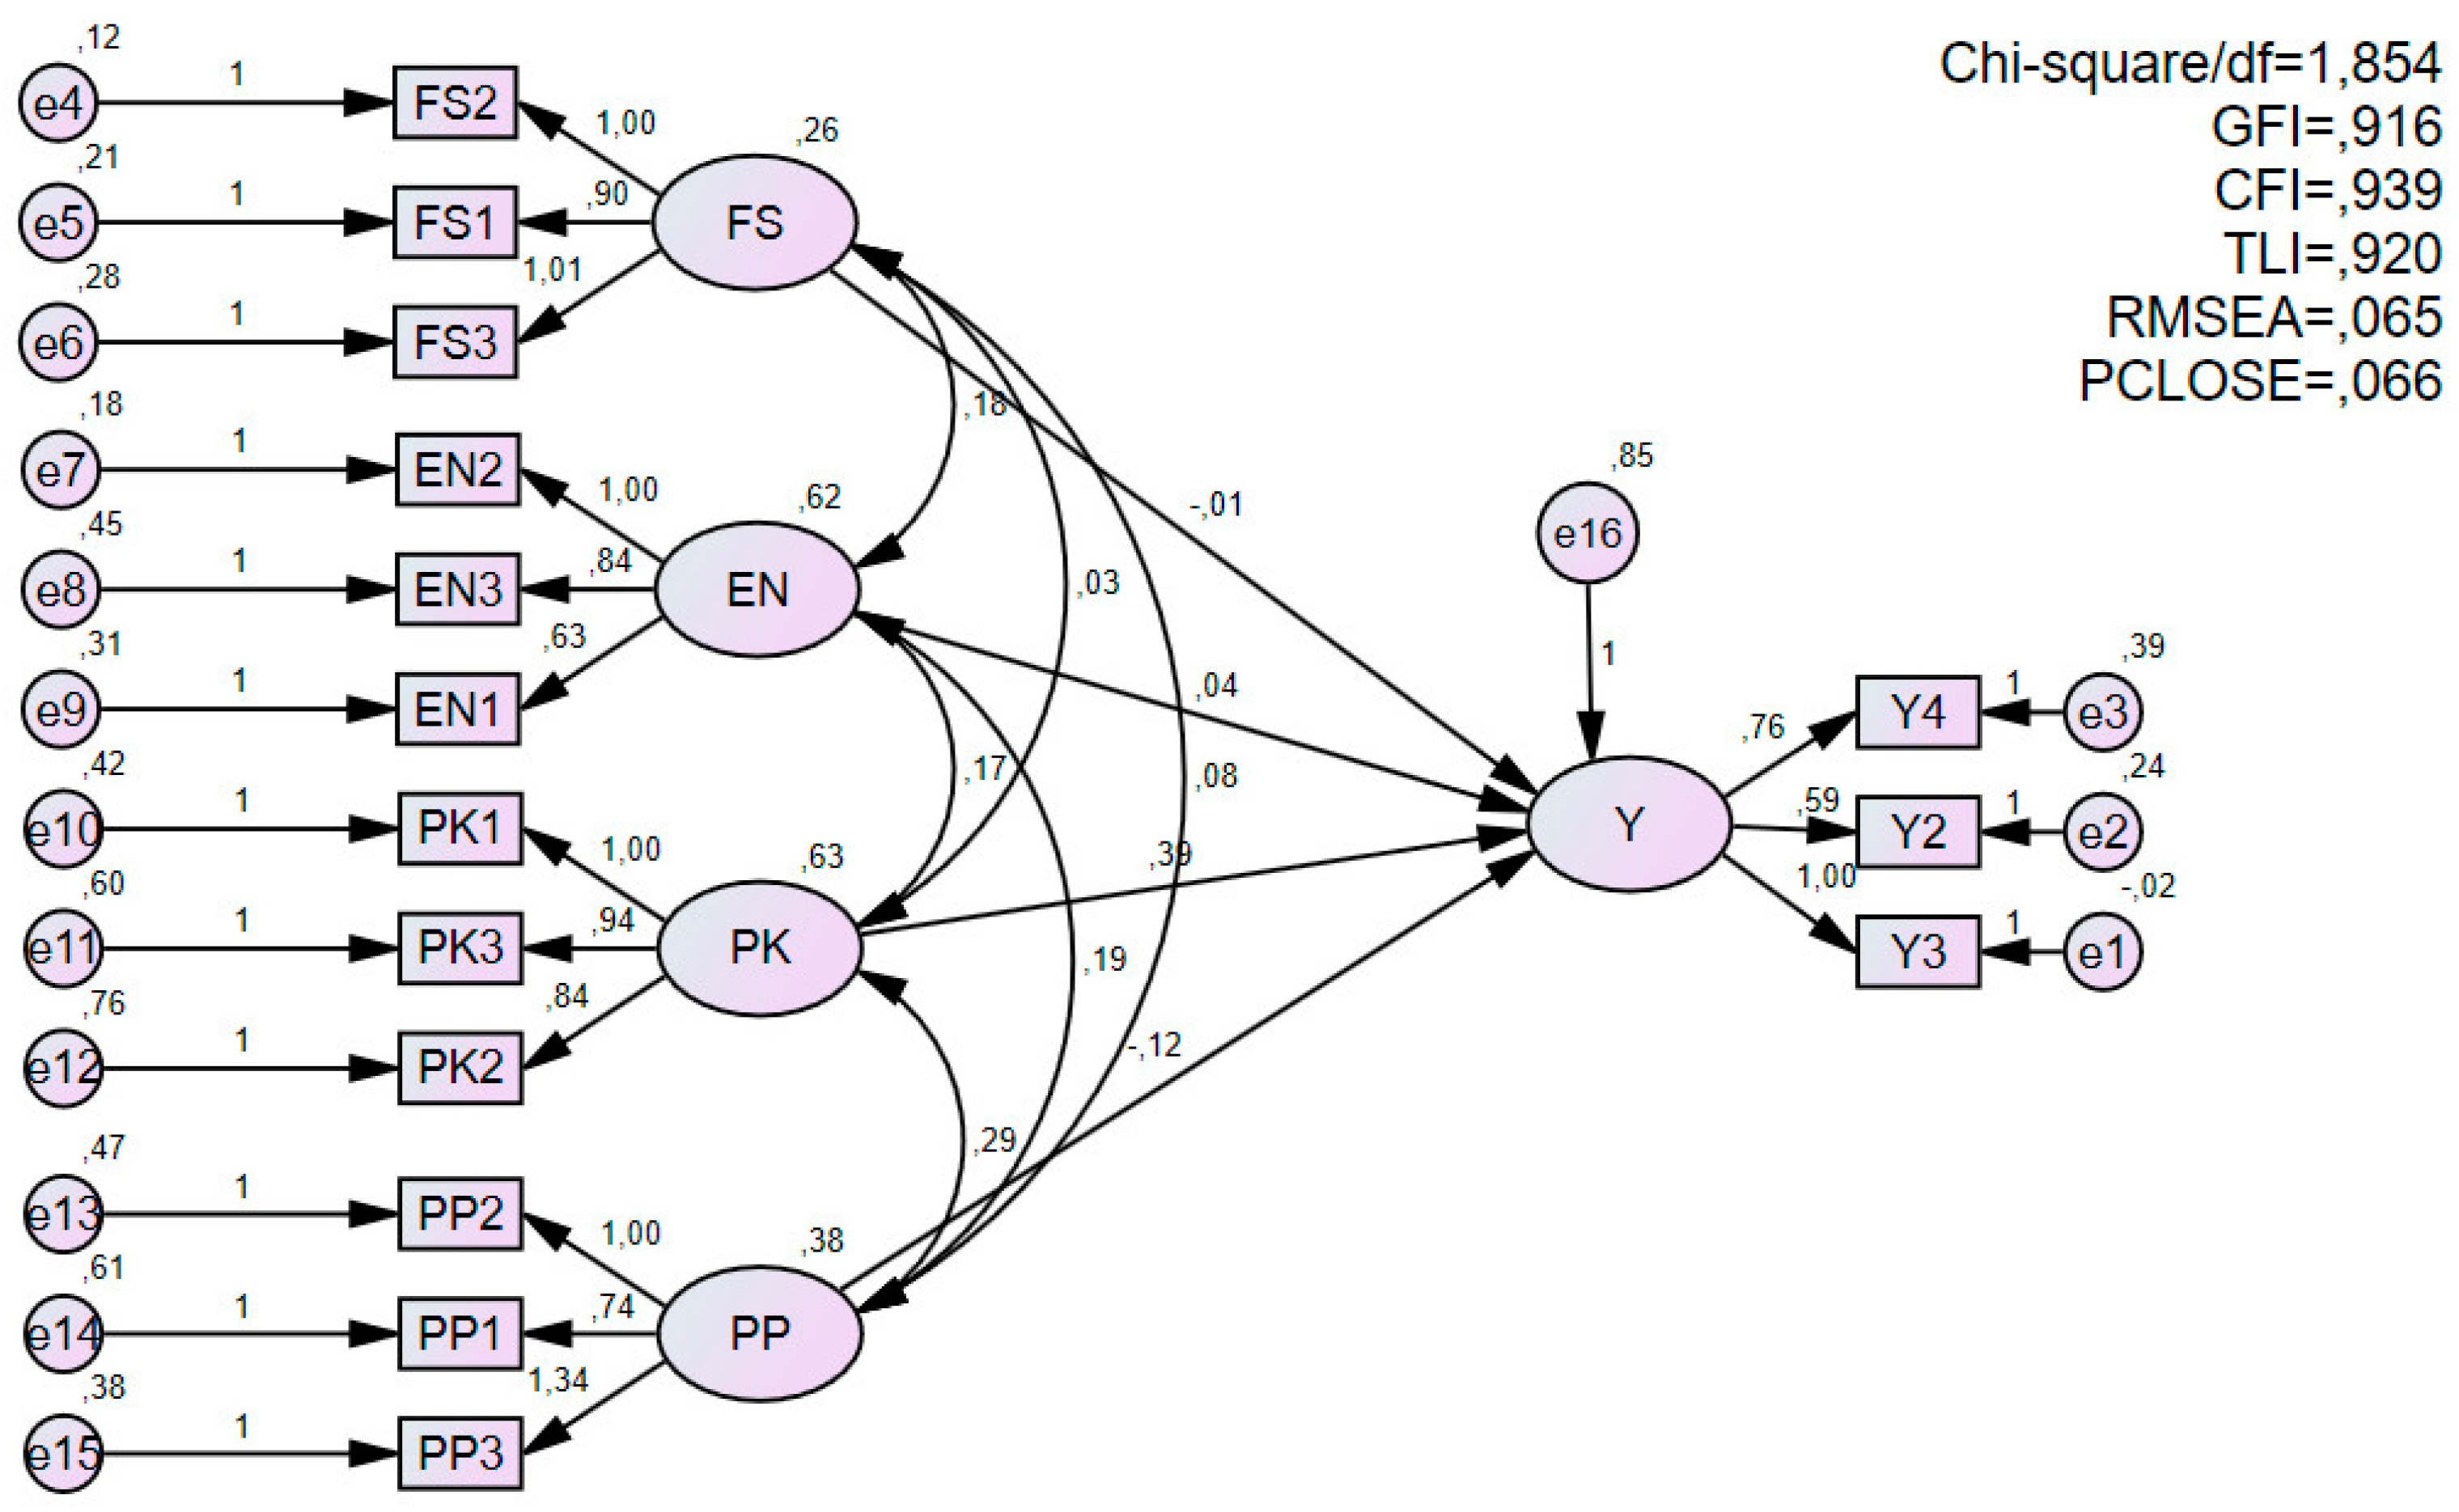

Table 1.
A summary of the background characteristics of the surveyed customers.
| Characteristics | Number (n = 203) |
Percentage (%) | |
|---|---|---|---|
| Gender | Male | 102 | 50.25 |
| Female | 101 | 49.75 | |
| Age | Under 20 | 20 | 9.85 |
| 20-25 | 66 | 32.51 | |
| 26-30 | 46 | 22.66 | |
| 31-40 | 38 | 18.72 | |
| Over 40 | 33 | 16.26 | |
| Educational level | Primary | 1 | 0.49 |
| Middle School | 10 | 4.93 | |
| High school | 37 | 18.23 | |
| Graduate | 121 | 59.61 | |
| Postgraduate | 34 | 16.75 | |
Table 2.
Descriptive statistics results.
| Items | Mean | Std. Dev | Min | Max |
|---|---|---|---|---|
| Food safety concern (FS) | ||||
| The food safety of the product (FS1) | 4.65 | 0.65 | 2 | 5 |
| The quality of the product (FS2) | 4.60 | 0.62 | 2 | 5 |
| The origin of the product (FS3) | 4.47 | 0.75 | 1 | 5 |
| Agricultural environment concern (EN) | ||||
| Large-scale pesticide and chemical fertilizer contamination (EN1) | 4.38 | 0.75 | 1 | 5 |
| The consequences of agriculture environmental pollution (EN2) | 4.26 | 0.90 | 1 | 5 |
| The states of agriculture environmental pollution (EN3) | 4.18 | 0.94 | 1 | 5 |
| Pricing concern (PP) | ||||
| Compatibility with consumers' payment capabilities (PP1) | 4.04 | 0.91 | 1 | 5 |
| Cocoa powder prices reflect product value (PP2) | 3.82 | 0.92 | 1 | 5 |
| Cocoa powder prices compared to others (PP3) | 3.76 | 1.03 | 1 | 5 |
| Product expertise (PK) | ||||
| Cocoa powder product is organic (PK1) | 3.74 | 1.03 | 1 | 5 |
| Cocoa powder product is supervised by DNBR Management Board (PK2) | 3.63 | 1.09 | 1 | 5 |
| International standards verify cocoa powder quality (PK3) | 3.88 | 1.08 | 1 | 5 |
Table 3.
Cross tabulation (unit: %).
| Food safety concern (FS) |
Agricultural environment concern (EN) |
Pricing concern (PP) |
Product expertise (PK) |
|||||||||
|---|---|---|---|---|---|---|---|---|---|---|---|---|
| disagree | neutral | agree | disagree | neutral | agree | disagree | neutral | agree | disagree | neutral | agree | |
| Gender | ||||||||||||
| Male | 1.48 | 0.49 | 48.28 | 3.45 | 3.45 | 43.35 | 4.93 | 6.40 | 38.92 | 7.88 | 6.40 | 35.96 |
| Female | 0.49 | 0.49 | 48.77 | 0.99 | 1.97 | 46.80 | 2.46 | 4.43 | 42.86 | 1.97 | 5.42 | 41.38 |
| Total | 1.97 | 0.99 | 97.04 | 4.43 | 5.42 | 90.15 | 7.39 | 10.84 | 81.77 | 9.85 | 11.82 | 77.34 |
| Education | ||||||||||||
| Primary school | 0.00 | 0.00 | 0.49 | 0.49 | 0.00 | 0.00 | 0.00 | 0.49 | 0.00 | 0.00 | 0.49 | 0.00 |
| Middle school | 0.49 | 0.49 | 3.94 | 1.48 | 0.00 | 3.45 | 0.00 | 0.00 | 4.93 | 0.00 | 0.99 | 3.94 |
| High school | 1.48 | 0.00 | 17.73 | 0.49 | 0.99 | 15.76 | 1.48 | 1.48 | 15.27 | 2.46 | 0.49 | 15.27 |
| Graduate | 0.99 | 0.49 | 58.13 | 1.97 | 2.96 | 54.68 | 2.96 | 7.88 | 48.77 | 6.40 | 7.88 | 45.32 |
| Post-graduate | 0.00 | 0 | 16.75 | 0.00 | 1.48 | 15.27 | 2.96 | 0.99 | 12.81 | 0.99 | 1.97 | 13.79 |
| Total | 2.96 | 0.99 | 97.04 | 4.43 | 5.42 | 89.16 | 7.39 | 10.84 | 81.77 | 9.85 | 11.82 | 78.33 |
(Where: disagree = [1,3); neutral = [3]; agree = (3,5]).
Table 4.
F-Test two-sample for variances to test hypothesis: “Male and female customers concern about food safety, agricultural environment, and pricing in various ways and have varied product ex-pertise about cocoa powder produced in DNBR”.
Table 4.
F-Test two-sample for variances to test hypothesis: “Male and female customers concern about food safety, agricultural environment, and pricing in various ways and have varied product ex-pertise about cocoa powder produced in DNBR”.
| Gender | Food safety concerns (FS) |
Agricultural environment concerns (EN) |
Price concerns (PP) |
Product expertise (PK) |
|---|---|---|---|---|
| df | 202 | 202 | 202 | 202 |
| MS | 0.317 | 0.52 | 0.57 | 0.74 |
| F | 1.23 | 5.22 | 4.63 | 7.53 |
| P(F ≤ f) one-tail | 0.27 | 0.023 | 0.033 | 0.018 |
| Prob > chi2 | 0.12 | 0.185 | 0.015 | 0.022 |
Table 5.
F-Test two-sample for variances to test hypothesis: “Customers with varying educational levels concern about food safety, agricultural environment, and pricing in various ways and have varied product expertise about cocoa powder produced in DNBR”.
Table 5.
F-Test two-sample for variances to test hypothesis: “Customers with varying educational levels concern about food safety, agricultural environment, and pricing in various ways and have varied product expertise about cocoa powder produced in DNBR”.
| Educational level | Food safety concerns (FS) |
Agricultural environment concerns (EN) |
Price concerns (PP) |
Product expertise (PK) |
|---|---|---|---|---|
| df | 202 | 202 | 202 | 202 |
| MS | 0.32 | 0.52 | 0.57 | 0.74 |
| F | 3.74 | 2.83 | 0.69 | 1.29 |
| P(F ≤ f) one-tail | 0.006 | 0.026 | 0.598 | 0.275 |
| Prob > chi2 | 0.001 | 0.67 | 0.107 | 0.997 |
Table 6.
Test Cronbach's Alpha scale.
| Observed variables | Cronbach’s Alpha | Cronbach's Alpha if Item Deleted |
|---|---|---|
| Food safety concern (FS) | ||
| The food safety of the product (FS1) | 0.778 | 0.728 |
| The quality of the product (FS2) | 0.629 | |
| The origin of the product (FS3) | 0.748 | |
| Agricultural environment concern (EN) | ||
| Large-scale pesticide and chemical fertilizer contamination (EN1) | 0.777 | 0.770 |
| The consequences of agriculture environmental pollution (EN2) | 0.559 | |
| The states of agriculture environmental pollution (EN3) | 0.741 | |
| Price concern (PP) | ||
| Compatibility with consumers' payment capabilities (PP1) | 0.695 | 0.696 |
| Cocoa powder prices reflect product value (PP2) | 0.548 | |
| Cocoa powder prices compared to others (PP3) | 0.547 | |
| Product expertise (PK) | ||
| Cocoa powder product is organic (PK1) | 0.733 | 0.598 |
| Cocoa powder product is supervised by DNBR Management Board (PK2) | 0.700 | |
| International standards verify cocoa powder quality (PK3) | 0.640 | |
| WTP for the product (Y) | ||
| WTP for the organic labeled product (Y1) | 0.874 | 0.898 |
| WTP for the Tier 1 eco-labeled product (Y2) | 0.804 | |
| WTP for the Tier 2 eco-labeled product (Y3) | 0.769 | |
| WTP for the Tier 3 eco-labeled product (Y4) | 0.858 |
Table 7.
Pattern matrix of principal component analysis (PCA) with Promax rotation.
| Observed variables | Components | ||||
|---|---|---|---|---|---|
| 1 | 2 | 3 | 4 | 5 | |
| Willingness to pay for the Tier 2 eco-labeled product (Y3) | 0.939 | ||||
| Willingness to pay for the Tier 1 eco-labeled product (Y2) | 0.872 | ||||
| Willingness to pay for the Tier 3 eco-labeled product (Y4) | 0.861 | ||||
| The quality of the product (FS2) | 0.880 | ||||
| The food safety of the product (FS1) | 0.800 | ||||
| The origin of the product (FS3) | 0.745 | ||||
| The consequences of agriculture environmental pollution (EN2) | 0.928 | ||||
| The states of agriculture environmental pollution (EN3) | 0.806 | ||||
| Large-scale pesticide and chemical fertilizer contamination (EN1) | 0.723 | ||||
| Cocoa powder product is organic (PK1) | 0.805 | ||||
| International standards verify cocoa powder quality (PK3) | 0.802 | ||||
| Cocoa powder product is supervised by DNBR Management Board (PK2) | 0.796 | ||||
| Cocoa powder prices reflect product value (PP2) | 0.830 | ||||
| Compatibility with consumers' payment capabilities (PP1) | 0.779 | ||||
| Cocoa powder prices compared to others (PP3) | 0.708 | ||||
(KMO and Bartlett’s Test: Kaiser-Meyer-Olkin (KMO) measure of Sampling Adequacy = 0.720; Bartlett's Test of Sphericity: Approx. Chi-Square = 1190.017; df = 105; Sig. = 0.000).
Table 8.
Test of bootstrap (Source: Own elaboration using software AMOS).
| Parameter | SE | SE-SE | Mean | Bias | SE-Bias | CR |
|---|---|---|---|---|---|---|
| Y ← FS | 0.205 | 0.006 | -0.003 | 0.004 | 0.009 | 0.444 |
| Y ← EN | 0.133 | 0.004 | 0.038 | -0.002 | 0.006 | -0.333 |
| Y ← PK | 0.155 | 0.005 | 0.389 | -0.001 | 0.007 | -0.142 |
| Y ← PP | 0.185 | 0.006 | -0.114 | 0.002 | 0.008 | 0.250 |
| Y3 ← Y | 0.000 | 0.000 | 1.000 | 0.000 | 0.000 | 0.000 |
| Y2 ← Y | 0.048 | 0.002 | 0.588 | 0.001 | 0.001 | 1.000 |
| Y4 ← Y | 0.059 | 0.002 | 0.766 | 0.002 | 0.003 | 0.666 |
| FS2 ← FS | 0.000 | 0.000 | 1.000 | 0.000 | 0.000 | 0.000 |
| FS1 ← FS | 0.153 | 0.005 | 0.909 | 0.010 | 0.007 | 1.428 |
| FS3 ← FS | 0.144 | 0.005 | 1.014 | 0.001 | 0.006 | 0.166 |
| EN2 ← EN | 0.000 | 0.000 | 1.000 | 0.000 | 0.000 | 0.000 |
| EN3 ← EN | 0.140 | 0.004 | 0.847 | 0.011 | 0.006 | 1.833 |
| EN1 ← EN | 0.107 | 0.003 | 0.627 | -0.003 | 0.005 | -0.600 |
| PK1 ← PK | 0.000 | 0.000 | 1.000 | 0.000 | 0.000 | 0.000 |
| PK3 ← PK | 0.171 | 0.005 | 0.961 | 0.021 | 0.008 | 2.625 |
| PK2 ← PK | 0.143 | 0.005 | 0.832 | -0.003 | 0.006 | 0.500 |
| PP2 ← PP | 0.000 | 0.000 | 1.000 | 0.000 | 0.000 | 0.000 |
| PP1 ← PP | 0.140 | 0.004 | 0.745 | 0.005 | 0.006 | 0.833 |
| PP3 ← PP | 0.209 | 0.007 | 1.366 | 0.024 | 0.009 | 2.666 |
Disclaimer/Publisher’s Note: The statements, opinions and data contained in all publications are solely those of the individual author(s) and contributor(s) and not of MDPI and/or the editor(s). MDPI and/or the editor(s) disclaim responsibility for any injury to people or property resulting from any ideas, methods, instructions or products referred to in the content. |
© 2023 by the authors. Licensee MDPI, Basel, Switzerland. This article is an open access article distributed under the terms and conditions of the Creative Commons Attribution (CC BY) license (https://creativecommons.org/licenses/by/4.0/).
Copyright: This open access article is published under a Creative Commons CC BY 4.0 license, which permit the free download, distribution, and reuse, provided that the author and preprint are cited in any reuse.


