
Submitted:
14 April 2023
Posted:
17 April 2023
You are already at the latest version
Abstract
The method propose in this study for stock market multi-objective mathematical model was linear programming using simplex algorithms to optimize the portfolio in the Nigerian Stock Market. The study selected five banks from the list of operators in the market and data were gathered from the banks to have individual market performances over a period of 5years. The data collected contains: Geometric Mean of Monthly Capital Gain Yields and Annual Capital Gain Yields from which Dividend Yields (%) were deducted to arrive Actual rate of return for the banks and the expected rate of return. Furthermore, the risk of semi-absolute deviation below the expected return is reduced. The data was analysed using Python programming because of some clauses in the data gathered. At first, the data assumes integer (-or +) and random in nature. As such, Python programming is one of the software suitable for such solution since the barrier for additivity is broken. Based on the analysis, the study therefore conclude that the potential investor(s) should invest in 13 units of investment x(GTbank Plc), 3 units of First Bank Plc`s Investment (y), 450 units of Zenith bank`s investment (z), and 8 units of Wema bank`s investment (m), and no units of investment of (n) Access bank. These investment quantities will result in the Optimal profit of p= 12797.902 billion naira.
Keywords:
Multi-objective Model
; Annual Rate of returns
; Expected Rate of returns
; Dividend Yields
; Capital gain
Introduction
A portfolio in finance is a collection of financial investments such as stocks, bonds, commodities, cash, and cash equivalents, including closed-end funds and exchange traded funds (ETFs). In general, stocks, bonds, and cash are thought to be the foundation of a portfolio, though this is not always the case. A portfolio may include a diverse range of assets, such as real estate, art, and private investments. An investor must critically examine the future performance of trading securities before committing capital, because investing in assets in Nigeria can be frustrating if funds allocation and future returns are not properly considered. These facts are still relevant to every investor, but they are insufficient to predict investment volatility. This is why smart investors choose multiple firms in the market, keeping in mind the levels and nature of the risks evolving within the market environment, as well as the availability of risk-mitigation mechanisms, in order to fully optimize profit in the market. Portfolio optimization is critical in asset management because it allows investors to manage their risk exposure. Portfolio optimization problems have been studied in various studies, particularly in finance and operations research, based on different risk measurements.
The investment expected returns are calculated based on asset historical performance as a measure of portfolio risks and returns, and the variance is measured as the dispersion of returns. As a result, because the optimal portfolio is determined by an investor's risk-return preference, there is no single optimized portfolio that can satisfy all investors (Yaoyao, 2007). Investors, on the other hand, face two types of risk: unsystematic risk and systematic risk. The formal is the inherent risk of an asset, which can be mitigated by owning a large number of assets. These risks do not provide sufficient information about the overall risk of the portfolio. While the latter is also known as portfolio risk, it is the risk associated with the market that cannot be eliminated (Malkielm 2003). Furthermore, the covariance between different asset returns indicates the portfolio's variability or risk. As a result, a well-diversified portfolio includes assets with low or negative correlations (Malkielm 2003).
Portfolio selection is a significant investment issue in the stock market that affects both individuals and institutions such as banks and brokerage firms. The primary goal is to allocate a limited amount of capital among various investment opportunities in order to maximize the expected return from the sale of acquired assets. Other investment objectives include high dividend yields, low risk, and rapid growth. Individual investors may prioritize various goals based on their financial situation, risk tolerance, and investment time horizons. Finding the optimal risk-return balance is central to the portfolio selection problem because high return is correlated with high risk (Jahangiri, Pourghader Chobar, Ghasemi, Abolghasemian, and Mottaghi, 2021; Tirkolaee, Mardani, Dashtian, Soltani, and Weber, 2020; Hesham & Mohammed, 2021). As a result, the cost prices of shares and their returns are random in nature. Thus, portfolio selection is a difficult task without proper planning and evaluation of alternatives (Jayanti, Susanta & Debasish, 2020).
However, Markowitz proposed a mean-variance model to solve portfolio optimization selections in 1950, but the model failed to account for multi-dimensional objectives. The expected return in the model is given by the average of the stock's return over time, and the risk is calculated by the variance of these returns. The mean-variance model's main idea is to treat individual asset returns as random variables and to use the value of expected return and variance to quantify return and investment risk, respectively (Zhang et al., 2018).
However, various methods for modeling portfolio optimization problems have been proposed, including multi-objective models that are either linear or nonlinear in nature (Zheng & Zheng, 2022). V. Pareto, a French-Italian economist, later developed the multi-objective model as an alternative to the one proposed by Markowitz. The multi-objective approach combines multiple objectives, such as ƒ1(λ), ƒ2(λ), ƒ3(λ), ……….. ƒn(λ), into a single objective function by assigning a weighting coefficient to each objective. The standard solution technique is to use the single-objective method to minimize a positively weighted convex sum of the objectives, in such that
For Pareto’s optimization, a point x* in the feasible design space S is Pareto optimal if and only if there does not exist another point x in the set S such that f(x) ≤ f(x*) with at least one fi(x) > fi(λ*). The inequalities between vectors apply to every component of each vector; e.g., f(x) ≤ f(x*) implies f1 ≤ f1*, f2 ≤ f2*, and so on. Because investors want to limit risk while also maximizing projected return, the portfolio optimization problem can be viewed as a multi-objective optimization problem. Further, the recent studies in this field operation research as well as finance show that the simplex algorithms technique can successfully solve the portfolio Optimization problem, since it is capable of dealing with multi-objectives. In the study, we intend to introduce Linear Programming using the Simplex Algorithm to optimize the portfolio investment traded on the Nigerian Stock Exchange floor, using some selected banks.
Statement of the Study
The modern portfolio theory assumes that a rational investor wants the highest possible return for a given level of risk, and the lowest possible risk for a given level of expected return. There are also extreme investors who are only concerned with maximizing return (while disregarding risk) or minimizing risk (disregard expected return). As a result, this study intends to Optimizing the Stock Portfolio using Multi-Objectives Mathematical model.
Aim and Objectives of the study
In this research, an attempt was made to Optimizing Stock Portfolio using Multi-Objectives Mathematical model. I specifically select the investment objectives in the form of a multi-objective model and solve using Simplex Algorithm, which is one of the most widely used methods in the field of Operation research.
Methodology
Optimizations and Minimization Formulation
Let assume an investor intends to invest (Ĩ) in the Nigerian Stock Exchange Ƞth Market of assets. Let λ represent the proportion of wealth invested in the Ƞth asset, with Ƞ = 1, 2,..., n. Then, λ1 + λ2 + λ3 +………… + λn = 1, and Ĩ(λ) = λ(Ƞ). Where Ĩ, denotes invested amount in the Ƞth assets. To formulate model for the portfolio selection, there is need for three types of monthly average return per unit of each asset proposed to purchase.
Let represent monthly expected rate of return for each unit of the Ƞth asset, calculated as an average monthly return over a period of nth years (i.e, 5 years). Then, monthly expected rate of return () =
= Average monthly return on the Ƞth asset`s unit, estimated over a period of 1 year
= Annual dividend received from per unit of the Ƞth asset.
Then, we establish the objectives of the portfolio, where
where D is the dividend growth
Where:
= of two disjoint subset A and B | then the return for the tth month of ith asset is at least equal to the asset's expected return. And B | then, , i.e. the return for the tth month of ith asset is less than its expected return. Then
On the other hand if , i =1, 2, ... n , then: . Thus for the tth month of the period T, the sum of the risk associated with the portfolio λ = (λ1, λ2, λ3,……, λn ) is given by T, the average risk is represented by:
Based on the functions stated above, the monthly return (percent) () can be generated using:
The expression must also be evaluated using the parameters defined above in order to calculate the semi-absolute deviation of below the expected return (). Alternatively, most of the parameters needed for the study have been evaluated from the banks` annual reports from between the period of (2015-2019). The expected annual return was computed using: the market risks, Free-risk, the market standard deviation (β) (see, Appendix A). Below is the table showing the data on annual expected returns for the selected banks` investments for 5 years in the stock market.
Simplex Algorithms Formulation
Before solving for the optimal solution, the constants of linear programming must be adequately observed. At first, all linear programs must be in standard form, which has three requirements: must be a maximization or minimization problem, all linear constraints should be in , and; . These conditions are always satisfied by using basic algebra and substitution to transform any given linear program. Standard form is required because it provides an ideal starting point for solving optimization problems as efficiently as possible using the Simplex method. In this study, we shall establish the simplex algorithms using the expected rate of return, for maximization functions say:
Objective Functions
This function was previously defined in equation (4) – (6) showing the total return on investment from the investment portfolio. To establish maximization objectives for the investments in the five years of the selected banks, there is need to transpose data in the table below and let each bank investments assume:
Where:
= GTbank Plc Actual Annual Rates of Return on the Investments
= First Bank Plc Actual Annual Rates of Return on the Investments
= Zenith Bank Actual Annual Rates of Return on the Investments
= Wema Bank Actual Annual Rates of Return on the Investments
= Access Bank Actual Annual Rates of Return on the Investments

Table 1.
Stocks Annual Rates of Return(%).
| GTbank | -24.25 | -9.23 | 29.15 | 39.95 | -115.86 |
| FBN | 13.04 | 27.9 | -1.16 | 21.29 | -88.26 |
| Zenith | 94.58 | -2.61 | 21.76 | 59.87 | -96.32 |
| Wema | -23.63 | -14.38 | -32.27 | 160.62 | -8.13 |
| Access | -0.9 | -16.53 | 130.83 | 132.74 | -149.7 |
Source: Researchers` computation, 2023.
Table 2.
Transpose of Annual Rates of Return on the Investments.
| -24.25 | 13.04 | 94.58 | -23.63 | -0.9 | |
| -9.23 | 27.9 | -2.61 | -14.38 | -16.53 | |
| 29.15 | -1.16 | 21.76 | -32.27 | 130.83 | |
| 39.95 | 21.29 | 59.87 | 160.62 | 132.74 | |
| -115.86 | -88.26 | -96.32 | -8.13 | -149.7 |
Source: Researchers` computation, 2023.
Table 3.
Simulation of the Transpose of Annual Rates of Return on the Investments.
| z | |||||
| -24.25 | 13.04 | 94.58 | -23.63 | -0.9 | 11.768 |
| -9.23 | 27.9 | -2.61 | -14.38 | -16.53 | -2.97 |
| 29.15 | -1.16 | 21.76 | -32.27 | 130.83 | 29.662 |
| 39.95 | 21.29 | 59.87 | 160.62 | 132.74 | 82.894 |
| -115.86 | -88.26 | -96.32 | -8.13 | -149.7 | -91.654 |
Source: Researchers` computation, 2023.
The above multi-objective optimization problems was solved by simulating the objectives through its average to obtain a grand objective and solve with respect to the five constraint functions using Python programming.
Subject to:
Here, the data obtained on expected rate of returns (i.e, see Appendix A) and the banks` market capitalizations are used.
For convenience, let the
The objective function and the constraint functions are now restated:
Subject to:
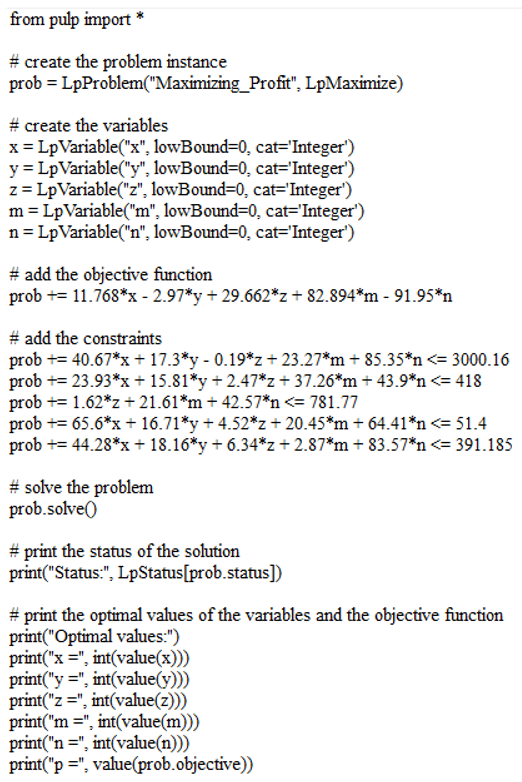
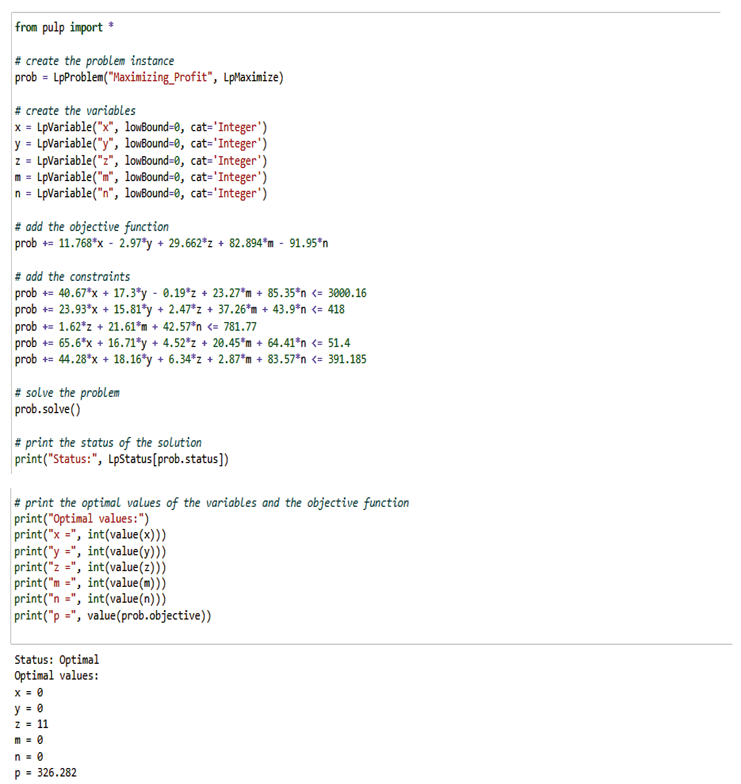
The optimal solution indicates the values of the decision variables x, y, z, m, and n that maximize the objectives function p =11.768x - 2.97y + 29.662z + 82.894m - 91.95n while satisfying all the given constraints. In this case, the optimal values are x=13, y=3, z=450, m=8, and n=0. These values indicate that in order to optimize the objective function, the potential investor(s) should invest in 13 units of investment x(GTbank Plc), 3 units of First Bank Plc`s Investment (y), 450 units of Zenith Bank`s investment (z), and 8 units of wema bank`s investment (m), and no units of investment of (n) access Bank. These investment quantities will result in the Optimal profit of p= 12797.902 billion naira. It is important to note that the optimal solution is based on the given data, and any change to the problem data may result in a different optimal solution. Therefore, it is always important to verify the solution in the context of the problem and ensure it makes sense.
Conclusions
Specifically, the objective of this study was to optimizing the stock portfolio using simplex algorithms for five selected investment in the Nigerian Stock Market. It could be read from the above literature that there is no single model to fully satisfy an investors` selection needs and that the application of simplex algorithms ensures no perfect system as the data gathered were random variables which in one way or the other collided with the constant of the model. So therefore, the investor can optimized the system by investing in 450 units of Zenith Bank`s investment, 13 units of GTbank (investment) and 3 units of First Bank Plc`s Investment (y), and 8 units of wema bank`s investment (m). These investment quantities will result in the Optimal profit of p= 12797.902 billion naira
Suggestion for further study
The study focused on optimizing the stock portfolio using simplex algorithms for five selected investment in the Nigerian Stock Market. At presence, few studies exist on the subject matter, therefore I would suggest that:
- More research is needed to evaluate and analyze the optimizing the stock portfolio using two or more operation research model and compare their efficiencies
- Since the current research was carried out in only one industry (Banking), more studies need to be done in the market, assuming the investor is radically considering more than one industries say, banking and real estate.
- A study can also be conducted to determine the extent to which stock market optimization has impacted the stock market growth in Nigeria.
Appendix A
| Geometric Mean of Monthly CGY and Annual CGY(%) | ||||||||
| BANKS | 2015 | 2016 | 2017 | 2018 | 2019 | |||
| GTB | GM of Monthly Capital Gain Yields | -1.12 | -0.3 | 2.8 | 3.6 | -8.72 | ||
| Annual Capital Gain Yields | -13.44 | -3.6 | 33.6 | 43.2 | -104.64 | |||
| FBN | GM of Monthly Capital Gain Yields | 1.49 | 2.59 | 0.06 | 1.8 | -6.5 | ||
| Annual Capital Gain Yields | 17.88 | 31.08 | 0.72 | 21.6 | -78 | |||
| Zenith | GM of Monthly Capital Gain Yields | 7.68 | 0.18 | 2.04 | 4.74 | -7.08 | ||
| Annual Capital Gain Yields | 92.16 | 2.16 | 24.48 | 56.88 | -84.96 | |||
| Wema | GM of Monthly Capital Gain Yields | -1.22 | -0.45 | -1.81 | 12.97 | -0.44 | ||
| Annual Capital Gain Yields | -14.64 | -5.4 | -21.72 | 155.64 | -5.28 | |||
| Access | GM of Monthly Capital Gain Yields | 0.08 | -1.01 | 8.67 | 10.48 | -11.2 | ||
| Annual Capital Gain Yields | 0.96 | -12.12 | 125.76 | 125.76 | -134.4 | |||
| Dividend Yields (%) | ||||||||
| BANKS | 2015 | 2016 | 2017 | 2018 | 2019 | |||
| GTB | 9.69 | 5.33 | 7.25 | 6.85 | 2.5 | |||
| FBN | 6.33 | 5.77 | 1.94 | 2.11 | 3.76 | |||
| Zenith | 5.26 | 4.95 | 4.76 | 1.75 | 4.28 | |||
| Wema | 7.77 | 8.53 | 8.74 | 7.99 | 2.41 | |||
| Access | 1.94 | 3.4 | 0 | 0 | 2.09 | |||
| Stocks Actual Annual Rates of Return (%) | ||||||||
| BANKS | 2015 | 2016 | 2017 | 2018 | 2019 | |||
| GTB | GM of Monthly Capital Gain Yields | -1.12 | -0.3 | 2.8 | 3.6 | -8.72 | ||
| Annual Capital Gain Yields | -13.44 | -3.6 | 33.6 | 43.2 | -104.64 | |||
| -14.56 | -3.9 | 36.4 | 46.8 | -113.36 | ||||
| Dividend Yields (%) | 9.69 | 5.33 | 7.25 | 6.85 | 2.5 | |||
| Annual Return | -24.25 | -9.23 | 29.15 | 39.95 | -115.86 | |||
| FBN | GM of Monthly Capital Gain Yields | 1.49 | 2.59 | 0.06 | 1.8 | -6.5 | ||
| Annual Capital Gain Yields | 17.88 | 31.08 | 0.72 | 21.6 | -78 | |||
| 19.37 | 33.67 | 0.78 | 23.4 | -84.5 | ||||
| Dividend Yields (%) | 6.33 | 5.77 | 1.94 | 2.11 | 3.76 | |||
| Annual Return | 13.04 | 27.9 | -1.16 | 21.29 | -88.26 | |||
| Zenith | GM of Monthly Capital Gain Yields | 7.68 | 0.18 | 2.04 | 4.74 | -7.08 | ||
| Annual Capital Gain Yields | 92.16 | 2.16 | 24.48 | 56.88 | -84.96 | |||
| 99.84 | 2.34 | 26.52 | 61.62 | -92.04 | ||||
| Dividend Yields (%) | 5.26 | 4.95 | 4.76 | 1.75 | 4.28 | |||
| Annual Return | 94.58 | -2.61 | 21.76 | 59.87 | -96.32 | |||
| Wema | GM of Monthly Capital Gain Yields | -1.22 | -0.45 | -1.81 | 12.97 | -0.44 | ||
| Annual Capital Gain Yields | -14.64 | -5.4 | -21.72 | 155.64 | -5.28 | |||
| -15.86 | -5.85 | -23.53 | 168.61 | -5.72 | ||||
| Dividend Yields (%) | 7.77 | 8.53 | 8.74 | 7.99 | 2.41 | |||
| Annual Return | -23.63 | -14.38 | -32.27 | 160.62 | -8.13 | |||
| Access | GM of Monthly Capital Gain Yields | 0.08 | -1.01 | 8.67 | 10.48 | -11.2 | ||
| Annual Capital Gain Yields | 0.96 | -12.12 | 125.76 | 125.76 | -134.4 | |||
| 1.04 | -13.13 | 134.43 | 136.24 | -145.6 | ||||
| Dividend Yields (%) | 1.94 | 3.4 | 3.6 | 3.5 | 4.1 | |||
| Annual Return | -0.9 | -16.53 | 130.83 | 132.74 | -149.7 | |||
| Stocks Total Risk, Beta and Alpha Records | ||||||||
| BANKS | 2015 | 2016 | 2017 | 2018 | 2019 | |||
| GTB | Total Risk σ | 8.93 | 13.75 | 8.53 | 9.46 | 13.54 | ||
| Computed Beta β | 0.58 | 0.69 | 1.29 | 0.42 | 2.14 | |||
| Adjusted Beta β | 0.72 | 0.79 | 1.19 | 0.61 | 1.76 | |||
| Alpha α | 8.21 | 12.96 | 7.34 | 8.85 | 11.78 | |||
| FBN | Total Risk σ | 8.91 | 9.7 | 6.52 | 13.1 | 7.5 | ||
| Computed Beta β | -0.13 | 0.11 | 0.62 | 1.3 | 0.75 | |||
| Adjusted Beta β | 0.25 | 0.41 | 0.75 | 1.2 | 0.83 | |||
| Alpha α | 8.66 | 9.29 | 5.77 | 11.9 | 6.67 | |||
| Zenith | Total Risk σ | 0 | 0 | 5.66 | 6.35 | 9 | ||
| Computed Beta β | 0 | 0 | 0.84 | 0.31 | 0.7 | |||
| Adjusted Beta β | 0 | 0 | 0.89 | 0.54 | 0.8 | |||
| Alpha α | 0 | 0 | 4.77 | 5.81 | 8.2 | |||
| Wema | Total Risk σ | 17.62 | 12.34 | 1.24 | 10.8 | 18.64 | ||
| Computed Beta β | 1.63 | 0.46 | 0.11 | 0.23 | 1.43 | |||
| Adjusted Beta β | 1.42 | 0.64 | 0.41 | 0.49 | 1.29 | |||
| Alpha α | 16.2 | 11.7 | 0.83 | 10.31 | 17.35 | |||
| Access | Total Risk σ | 14.51 | 16.14 | 2.85 | 27.2 | 12.51 | ||
| Computed Beta β | 0.83 | 1.02 | -0.34 | -0.87 | 2.08 | |||
| Adjusted Beta β | 0.82 | 1.01 | 0.11 | -0.25 | 1.72 | |||
| Alpha α | 8.43 | 15.13 | 2.74 | 27.45 | 10.79 | |||
| Expected Rates of Return (%) | ||||||||
| BANKS | Years | Rm | Rf | Rm-Rf | β | ER | AR | AR-ER |
| GTB | 2015 | 50.64 | 15.02 | 35.62 | 0.72 | 40.67 | 62.73 | 22.06 |
| 2016 | 18.12 | 14.21 | 3.91 | 0.79 | 17.3 | -8.11 | -25.41 | |
| 2017 | 0.96 | 7 | -6.04 | 1.19 | -0.19 | 0.94 | 1.13 | |
| 2018 | 32.52 | 8.8 | 23.72 | 0.61 | 23.27 | 39.03 | 15.76 | |
| 2019 | 51.48 | 6.91 | 44.57 | 1.76 | 85.35 | 45.7 | -39.65 | |
| FBN | 2015 | 50.64 | 15.02 | 35.62 | 0.25 | 23.93 | -8.2 | 23.93 |
| 2016 | 18.12 | 14.21 | 3.91 | 0.41 | 15.81 | 24.21 | 15.81 | |
| 2017 | 0.96 | 7 | -6.04 | 0.75 | 2.47 | 36.85 | 2.47 | |
| 2018 | 32.52 | 8.8 | 23.72 | 1.2 | 37.26 | 2.66 | 37.26 | |
| 2019 | 51.48 | 6.91 | 44.57 | -0.83 | 43.9 | 23.71 | 43.9 | |
| Zenith | 2015 | |||||||
| 2016 | ||||||||
| 2017 | 0.96 | 7 | -6.04 | 0.89 | 1.62 | 7.11 | 5.49 | |
| 2018 | 32.52 | 8.8 | 23.72 | 0.54 | 21.61 | 29.24 | 7.63 | |
| 2019 | 51.48 | 6.91 | 44.57 | 0.8 | 42.57 | 58.63 | 16.06 | |
| Wema | 2015 | 50.64 | 15.02 | 35.62 | 1.42 | 65.6 | -34.13 | -99.73 |
| 2016 | 18.12 | 14.21 | 3.91 | 0.64 | 16.71 | -12.23 | -28.84 | |
| 2017 | 0.96 | 7 | -6.04 | 0.41 | 4.52 | -5.4 | -9.92 | |
| 2018 | 32.52 | 8.8 | 23.72 | 0.49 | 20.42 | -21.72 | -42.14 | |
| 2019 | 51.48 | 6.91 | 44.57 | 1.29 | 64.41 | 155.64 | 91.23 | |
| Access | 2015 | 50.64 | 15.02 | 35.62 | 0.82 | 44.23 | 40.92 | -14.69 |
| 2016 | 18.12 | 14.21 | 3.91 | 1.01 | 18.16 | 29.54 | -13.8 | |
| 2017 | 0.96 | 7 | -6.04 | 0.11 | 6.34 | -12.12 | -18.46 | |
| 2018 | 32.52 | 8.8 | 23.72 | -0.25 | 2.87 | 104.04 | 101.17 | |
| 2019 | 51.48 | 6.91 | 44.57 | 1.72 | 83.57 | 127.85 | 44.28 | |
References
- Hesham, K. A. & Mohammed, A. A. (2021). Stock Market Portfolio Selection Using Linear Programming. 51st Annual Conference of The Decision Sciences Institute.
- Jahangiri, S. Pourghader, A., Ghasemi, P. Abolghasemian, M. and Mottaghi, V. (2021). Simulation-Based Optimization: Analysis of the Emergency Department Resources under COVID-19 Conditions, International Journal of Industrial and Systems Engineering, vol. 1(1), 1–10. [CrossRef]
- Jayanti N., Susanta B., Debasish B. (2020). Portfolio optimization in share market using multi-objective linear programming. International Journal of Mathematics and Computer Research, 8(8): 2112-2123. [CrossRef]
- Malkiel, B. G. (2003). A Random Walk Down Wall Street. W.W.Norton & Company, New York.
- Tirkolaee, E. B. Mardani, A. Dashtian, Z. Soltani, M. and Weber, G. W. (2020). A novel hybrid method using fuzzy decision making and multi-objective programming for sustainable reliable supplier selection in two-echelon supply chain design. Journal of Cleaner Production, 250. [CrossRef]
- Yaoyao, C. D. (2007). A Multi-Objective Approach to Portfolio Optimization. Rose-Hulman Undergraduate Mathematics Journal.8(1).1-18.
- Zhang, Y., Li, X., & Guo, S. (2018). Portfolio selection problems with Markowitz’s mean– variance framework: a review of literature. Fuzzy Optimization and Decision Making, 17(2), 125-158. [CrossRef]
- Zheng Y. and Zheng, J. (2022). A novel portfolio optimization model via combining multi-objective optimization and multi-attribute decision making. Applied Intelligence,52(5); 5684–5695. [CrossRef]
Disclaimer/Publisher’s Note: The statements, opinions and data contained in all publications are solely those of the individual author(s) and contributor(s) and not of MDPI and/or the editor(s). MDPI and/or the editor(s) disclaim responsibility for any injury to people or property resulting from any ideas, methods, instructions or products referred to in the content. |
© 2023 by the authors. Licensee MDPI, Basel, Switzerland. This article is an open access article distributed under the terms and conditions of the Creative Commons Attribution (CC BY) license (http://creativecommons.org/licenses/by/4.0/).
Copyright: This open access article is published under a Creative Commons CC BY 4.0 license, which permit the free download, distribution, and reuse, provided that the author and preprint are cited in any reuse.


