
Submitted:
21 March 2023
Posted:
22 March 2023
You are already at the latest version
Abstract
Near-neutral pH and low redox potentials (EH) are considered favorable conditions for radionuclides immobilization in deep repository systems in clay geological formations. Cigeo is a future Industrial Centre for Geological Disposal for Nuclear Waste (NW) for high-level and intermediate level long-lived radioactive waste, to be built in France, at 500 m depth within the Callovo-Oxfordian clay formation. Deep knowledge of the mechanisms and kinetics of corrosion occurring at the external surface of tubings made of API 5L X65 carbon steel (CS-X65) in contact with COx pore water, is essential for a reversible NW management of the Cigeo site. By using robust handmade electrodes and electrochemical and gravimetric techniques, this work aimed to determine the corrosion phenomenology and kinetics of CS-X65 in contact with COx pore water flowing continuously through a Multi-Parameter Probe (MPP) device, placed at 500 m depth, for more than 180 days. It also aimed at demonstrating the reliability and the robustness of the measurement methodology for the corrosion evaluation of the metallic liner of the future nuclear waste disposal site. Two iron oxidants were encountered, oxygen, who was depleted, and proton, who was accompanied by hydrogen sulfide. Corrosion mechanisms and kinetics were well established for two CS-X65, electrochemically perturbed and not. The corrosion thickness loss rates stand between 0.016 and 0.032 mm/y.
Keywords:
Carbon steel
; corrosion
; kinetics
; pore water
; Callovo-Oxfordian clay formation
; electrochemical techniques
; solid and robust sensors.
1. Introduction
1.1. General context
France derives about 70% of its electricity from nuclear energy, due to a long-standing policy based on energy security. In 2016, nuclear energy generated 60.9% of the current radioactive waste1. The rest came from research (26.6%), defense (8.7%), non-nuclear industries (3.3%) and medicine (0.5%). Among them, 3.1% were long-lived radioactive waste of high-level (0.2%) and medium-level (2.9%) which concentrated 94.9% and 4.5% of the level of radioactivity.
Deep geological facility (DGF) is internationally recognized as one of the options to manage the high-level and intermediate level long-lived radioactive waste (HLRW and ILW-LLRW respectively). Indeed, near-neutral pH and low redox potentials (EH) are considered favorable conditions for immobilization of most of radionuclides in deep repository systems in clay geological formations [1].
In France, the objective of Andra [2], the National Radioactive Waste Management Agency, which is in charge of the long-term radioactive waste management, is to conceive and built the future Industrial Centre for Geological Disposal (Cigeo) to protect humans and the environment from the danger of long-lived radioactive waste over the very long term [1,2,3,4].
The Callovo-Oxfordian clay formation (COx) is a water-saturated environment is composed of clay minerals, organic matter, various oxides and sulfides [5-12]. Its temperature ranges between 20 and 25 °C (at 500 m under the ground), its pH between 7.2 and 7.7, its EH is -200 to -180 mV/SHE (a measurable and reproducible steady state with a mixed redox potential of COx is controlled by S(-II)/S° redox couple constituting pyrite and Fe(III)/Fe(II) redox couple constituting the smectites [13,14], with a pCO2 equals to 8.10-3 atm. For this purpose, the COx formation has been selected as host rock for Cigeo [2].
Cigeo should consist of separate disposal zones for HLRW and intermediate level ILW-LLRW, connecting drifts and technical facilities. HLRW disposal cell (Figure 1) consists of a steel API lined micro-tunnel measuring approximately 60-70 cm in diameter and around 100 m in length. The initial annular space between the outer surface of the sleeve and the host rock is filled with a cement grout called “MREA” (cement and bentonite mixed-based grout). The MREA material imposes corrosion-limiting environmental conditions.
Andra [2] has launched a R&D program to evaluate monitoring systems and techniques dedicated to the surveillance of HLRW disposal cells. Part of monitoring objectives is to evaluate the condition of retrievability. One of the key parameters in HLRW retrieval operations in the DGF is the corrosion evaluation of the metallic liner material.
The carbon steels corrosion phenomenology and kinetics evaluation remain an important challenge in long term measurement. In laboratories, kinetic corrosion measurements can be given in a direct way, according to mass loss of exposed steel coupons, or indirectly, according to the evolution of electrochemical parameters related to the reactions induced by the corrosion phenomena. This latter measurement encounters however three major difficulties for on-site and long term measurement: i) its definition, which requests a broad spectrum of multi-disciplinary knowledge, but also its representativeness, ii) the operating conditions chosen for the measurement may differ from the mode of analyzed corrosion phenomena and iii) its implementation, made delicate by the developments in the electroanalytical technologies, and that can disturb the phenomena taking place locally.
This work aims to develop a continuously method to follow-up the corrosion kinetics of carbon steel API 5L X65 (CS-X65) from HLRW metallic liner material. To achieve this purpose, we have chosen, optimized and validated a specific methodology based on robust and complementary electrochemical measurement techniques on metallic electrodes. The performance of the approaches is evaluated in different environmental conditions regarding the DGF. One of these operating conditions is the long-lasting contact of the external surface of metallic liner, made of carbon steel 5L X65 (CS-X65), with the natural and anoxic pore water of COx (see §2.2).
1.2. Short review on corrosion assessment studies of various carbon steels in related environements
General and basic knowledge on corrosion of Fe° in oxic and anoxic aqueous solutions is given in the Appendix A.
Various experiments, undertaken within the Andra scientific framework, have brought some knowledge about the corrosion behavior of various carbon steel types in contact with natural or reconstituted COx pore water, in contact or not with the COx argillites, under various temperature, pressure and microbiology conditions [15-22], in agreement with the evolution of the physical and chemical parameters during the storage.
Some constraints specific to on-site conditions have been considered:
- The temperature increase due to radioactive disintegration (25 °C ≤ T ≤ 90 °C).
- The wide range of redox potentials over the Pourbaix diagram due to gas emissions such as O2 due to excavation, H2 due to release from radioactive waste and metal corrosion, H2S due to the activity of sulfate-reducing bacteria (SRB).
The corrosion assessment studies were conducted using mostly Electrochemical Impedance Spectroscopy (EIS) with measurements performed at OCP at variable frequency ranges (ordinarily from 1 MHz to 1 mHz). The Voltammetry at ±50 mV around Open Circuit Potential (VaOCP) was used primarily to avoid the very perturbing one Linear Polarization of Tafel Plots, and finally the Linear Polarization Resistance (LPR) (±20 𝑚𝑉 around OCP) was systematically used. The gravimetric or mass loss method was also used. This empirical method for effectively measuring the rate of corrosion of steels is the one that makes it possible to validate electrochemical measurements.
Martin et al. [16] have studied, in laboratory, during more than 800 days, the electrochemical behavior of A37 low alloyed steel immersed in a synthetic COx pore water at 90°C, in the presence of a mass fraction of 10% of COx argillites. In the same time, they have also investigated the evolution of the mass loss of some A37 coupons. Experiments were conducted under anaerobic conditions, at a pH value of 7.6. By using electrochemical impedance spectroscopy (EIS), authors showed that the instantaneous corrosion rate, which reached initially 100 µm/y, obviously decreased reaching 1 μm/year after 19-20 months. By using mass loss and post-mortem surface analyses, authors confirmed the pseudo-passive behavior of carbon steel under the investigated conditions, from the 20th day and during the whole experiment (800 days). This pseudo-passive behavior, which induced a decrease of the instantaneous corrosion rate of the carbon steel, was expressed by the presence of layers of corrosion deposits. The nature of these layers varied with time. At the beginning of the experiment, chukanovite (Fe2(CO3)(OH)2) was the main the corrosion layer. Afterwards, Fe2(CO3)(OH)2 constituted the internal corrosion product onto which siderite (FeCO3) deposited and evolved into magnetite (Fe3O4).
This pseudo-passive behavior of carbon steel was also described by Schleger et al. [17] who characterized, by µXRF and Raman spectroscopy, SEM-EDX, and XRD, the corrosion interface of P235 low-alloy carbon steel coupons reacted in clay porewater seeping in a test chamber in situ in the Callovo-Oxfordian formation of the Meuse-Haute Marne Underground laboratory, during 1800 days, in the temperature range 25-85°C. In addition to chukanovite layer, disordered Fe phyllosilicate was also identified as internal corrosion deposit. Using the assumption that carbon steel is corroded by generalized corrosion, the P235 carbon steel rate, which was estimated by mass loss, was approximately less than 10 µm/y. This corrosion rate was approximately 15 µm/y in the presence of pore water of COx containing a mass fraction of COx argillites ranging from 1 to 50% and 5 µm/y a mass fraction of compact COx ranging from 60 to 90%. Instantaneous corrosion rate measurements using EIS showed a very slight increase of corrosion rate during the first weeks of immersion (around 90 µm/y). Then, after a few tens of days, a fast decrease occurred, which became more progressive in the consecutive hundreds of days, until reaching values lower than 10 µm/y when the pseudo-passive layers have been formed.
In parallel, in the same type of test chamber, Necib et al. [18-19] led gravimetric tests during 1800 days on samples of steels P235, P275 and SA516 immersed in the natural pore water in contact with its gas, with a gradual rise in temperature during 77 days, until 85°C. They observed a decrease in the pH from 7 (initial pH) to 4.5, then an increase up to 7; the pH drop being due to the oxidation of the pyrite (FeS2) in the presence of the initially trapped oxygen in the test chamber whose depletion yields pH stabilization close to value of natural COx pore. Corrosion rates was about 250 µm/y during the fall of pH, and of 10 µm/y under stabilized anaerobic conditions at pH 7.
El Hajj et al. [20] showed the influence of sulfate-reducing bacteria (SRB) activity (producing H2S) on the corrosion rate of PG395GH type carbon steel by comparing in anaerobic conditions, sterilized and non-sterilized media, with pore water as well as saturated COx argillites at 30°C and 120 bars of pressure (to simulate deep geological conditions). They found by µRaman analysis the presence of mackinawite as corrosion product in the non-sterilized media, and Fe-oxyhydroxydes such as lepidocite and ferihydrite in sterilized conditions. The global corrosion rate is two times greater in the non-sterilized conditions. Saturated COx formation thus contains enough nutriments to support a bacterial development leading to H2S production and thus induce corrosion. However, authors noted, that this role could be neglected in the presence of dihydrogen (H2) gas produced via corrosion. Indeed, with high amount of H2, there is no more sufficient interstitial free water for the transport of matter useful for the proliferation of the microorganisms.
El Mendili et al. [21-22], in the presence of synthetic water of COx and the COx argillites showed the formation of magnetite (Fe3O4) and of siderite (FeCO3), indicating the presence of a bacterial activity, at 30°C. At 90°C, the bacterial activity is inhibited, and a layer of ferrous sulfide (FeS, pyrrhotite) is produced by the reduction of the pyrite present in COx by hydrogen. Corrosion rates were of about 1 and 2 µm/y for sterilized and not sterilized samples, respectively.
All these previous studies have particularly characterized the nature of the corrosion products formed under various conditions, over long periods [17]. They highlighted the reputation of the electrochemical and mass loss techniques for corrosion assessment and the importance of continuous monitoring of the surrounding medium during long term corrosion assessment. A larger-scale study in a actual environment was thus conducted at the Bure Underground Research Laboratory (URL). This paper presents a complete and comparative study to measure the corrosion rates and characterize main mechanisms, using handmade robust electrodes and three electrochemical techniques. Voltammetry around open circuit potential (VAOCP), Linear Polarization Resistance (LPR) technique (±20 𝑚𝑉 around OCP) and Electrochemical Impedance Spectroscopy (EIS) measurements performed at OCP at frequency range of 1 MHz-1 mHz, were selected to minimize corrosion induced by the electrochemical techniques themselves. Experiments used API 5L X65 carbon steel (CS-X65). Gravimetric technique was applied to validate the corrosion measurement based on electrochemical techniques. For a better insight into long term corrosion measurements, a Multi-Parametric Device with Innovative Solid Electrodes [23] was also used for the monitoring of temperature, pH, Redox-Potential, S(-II) content and OCP of CS-X65.
2. Materials and Methods
2.1. Carbon steel API 5L X65 characteristics and electrodes designed for corrosion studies
The tubings to be used as receptors for canisters are made of carbon steel (Figure 2a), whose chemical composition and some physical properties are given in Table 1. This tubing was reprocessed for designing and constructing API 5L X65 carbon steel electrodes (Figure 1a) to be used for corrosion studies. The body of electrodes (diameter 12 mm) is in Polyether Ether Ketone (PEEK). The exposed metal is a cylinder of 5 mm diameter and 3 mm high, for a total exposed surface (lateral and one basal) of 0.64 cm².
2.2. COx pore water characteristics and borehole device for supplying pore water
2.2.1. COx pore water
The investigated “corrosive “medium is a well-balanced pore water with the Callovian Oxfordian claystone (COx) formation in Bure (France). The pore water chemistry with the dissolved major elements [5, 6, 11] is given in the Table 2.
2.1.2. Borehole supplying COx pore water and device for contact with sensors and electrodes
A borehole, the EPT1201-Clay 322, [24] created at the roof of the NED/GED gallery of the Underground Research Laboratory of Andra at Bure (France) is allowing to supply COx pore water to two Multi-Parameter Probe holders (MPP1-; MPP-2; Figure 3a and 3b, see §2.2.1). The physical and chemical parameters of the COx pore water was monitored in situ by various probes inserted in two MPPs (among them, temperature, pH and redox potential are mainly useful for this study) and by regular chemical analyses on recovered water samples.
2.3. Experimental setup for studying the corrosivity of COx water against CS-X65
2.2.1. Multi-Parameter Probe (MPP) holders, MPP-1 and MPP-2 and designed electrodes
Two innovative MPPs holders were designed and constructed for long term monitoring with various electrodes (which are fittingly inserted to the MPPs) when pore water is passing through the MPPs holders. As shown on Figure 3 and Figure 4, each of MPP holder has an insertion capacity for 20 electrodes. The electrodes were disposed vertically in four lines (L1 to L4) and horizontally, concentrically and in cross in five plateaus (P1 to P5) of four electrodes each (Figure 4a and 4b). MPP-1 and MPP-2 holders are fed in series and in ascending direction of circulation (Figure 3a and 2b), with a continuous flowrate of COx pore water, fixed by a flow controller at 2.5 mL.h-1, (=60 g/day) and remained constant during 180 days. The internal volume of each MPP, when electrodes are inserted, is about 80 mL, which means that the MPP volume is renewed every 32 h (1.33 days). The total eluted volume through the MPPs was 10.92 L that corresponds to about 136.5 column volumes (flushings) in 180 days. The water circuit ends into a hermetically sealed Tedlar Bag, which weighs the water by a precision balance connected to a DAC.
An electrochemical triplet was used for electrochemical corrosion measurement only (Figure 4b). Located on the plateau P3 of MPP-2, it is constituted of a solid reference electrodes Ag/AgCl(s)y, designed for long term use as reference electrodes (RE), a Platinum electrode as counter electrode (CE) and an CS-X65, as working electrode (WE) to which are applied the external electrochemical disturbances.
Several electrodes of MPP-2 holder, among them one Platinum (for Redox potential measurement), three Ag2S/Ag (for S(-II) detection and quantification), two Iridium (for redox measurement as Platinum electrode) and two Sb2O3/Sb (for pH determination after conversion of their potentials, two FeS2 (for discerning their proper behavior) and two Inox (for other electrochemical behaviors), were monitored versus Ag/AgCl(s)4 reference electrode.
In particular, another CS-X65 electrode, named free, located on the plateau P2 (Figure 4b left), was used as control electrode (remained without external electrochemical disturbances). Only its OCP was measured versus Ag/AgCl(s)4. In order to test the robustness of all Ag/AgCl(s) solid reference electrodes, their potentials were monitored versus the Ag/AgCl internal reference of an E-514-pH electrode, which is known as without glycerol pH electrode, from Scan Messtechnik GmbH (Brigittagase, Austria).
2.2.2. Electrochemical apparatuses, pHmeters, data logger
A potentiostat-galvanostat impedancemeter, VersaStudio 4000A (AMETEK, Inc. Berwyn, PA, USA) using classical electrochemical techniques was connected to an isolated electrochemical triplet present in MPP-2 plateau 3 (P3). Two pH-meters WTW (delivering output signals in Volt for temperature and pH) were used and connected to a 3700A Data Acquisition System (Keithley Instruments, Inc. Cleveland, OH, USA), handled by a computer via KickStart-2 software.
2.2.3. Electrochemical techniques
The corrosion of CS-X65 WE electrode of the triple in contact with natural COx pore water was monitored using various electrochemical techniques: Voltammetry at ±50 𝑚𝑉 around Open Circuit Potential of CS-X65 (VaOCP), Linear Polarization Resistance (LPR) technique (±20 𝑚𝑉 around OCP of CS-X65) or Electrochemical Impedance Spectroscopy (EIS) measurements performed at OCP at frequency range of 1 MHz-1 mHz.
The corrosion current density, CCR or Jcorr, [25] was determined from the electrochemical measurement of the polarization resistance Rp, by linear polarization resistance (LPR), VaOPC, or electrochemical impedance spectroscopy (EIS) [26-28]. Knowing Rp, Jcorr was calculated using the Stern–Geary equation (Eq. 1) [29-30]:
where Jcorr is the corrosion current density (A.m−2), B is the Stern-Geary constant (V), Rp is the polarization resistance (Ω), A is the exposed (polarized) surface of steel (m2), and βa and βc are the anodic and cathodic Tafel constants (V), respectively. This is quick and easily observed; however, the Jcorr values are sometimes unrealistic because it is the exchange current obtained by fitting the anodic and cathodic branches of the current-overpotential curve [31]. This is reason why Tafel plots were banished for this long term study. The analysis of Nyquist plots of EIS measurements showed equivalent electrical circuit (EEC), thus revealing and explaining interactions occurring at the steel surface.
All these techniques have been largely investigated and validated in laboratory conditions, more specifically for uniform corrosion. At the end of the immersion, the CCD of the electrode was obtained and converted in corrosion rates (thicknesses) in mm/y. The corrosion rates, accompanying the overall corrosion reaction during the immersion period, will be compared and discussed in relation to the conditions in the aqueous medium.
2.2.4. Gravimetric or mass loss technique
The gravimetric technique, used to estimate the corrosion thickness loss, is based on experimental determination of weight loss and the surface area of samples of carbon steel profiles after the attack by exposition to corrosive environment. ASTM G1-90 was the standard norm applied for this analysis. Detailed procedure can be seen in the reference [32-36]. Weight loss is obtained after removing corrosion products by means a chemical treatment including an inhibitor in solution to avoid overoxidation of the metal surface once the corrosion products have been fully eliminated. From the gravimetric experiment, the corrosion thickness loss equation (Eq. 2), CRg, was obtained from the relationship of the weight loss WLoss (in g) with the volumetric mass (or density) of the iron ρ (0.00785 g.mm3), exposed surface area of specimen S (in mm²) and immersion time T (in years):
3. Results
3.1. Monitoring of temperature and potentials of solid reference Ag/AgCl electrodes
The change of the temperature, which reigned in the cupboard close to MPP external surface, and supposed to be equal to that of the interior, is given on Figure B1 in Appendix B. Temperature ranged from 24 and 35°C.
The Ag/AgCl(s)4 electrode, showed great stability and robustness over 180 days. This is not the case for the internal reference of a commercial pH electrode (see on Figure B2 in Appendix B the temporal variations of AgCl3, AgClc and AgCl4 vsRefpH2). Thus, all handmade Ag/AgCl solid electrodes can be considered as reliable and robust reference electrodes during the experiment. All potentials are converted versus SHE.
3.2. Monitoring of potentials of solid electrodes including CS-X65 free
Figure 5 shows the redox potential of the pore water (green line), which was monitored by using Platinum electrode vs SHE and the potentials of both Sb/Sb2O3 (mV vs SHE). In the same Figure 5 the potentials of both Sb/Sb2O3 were converted in pH values (Figure 5, violet and red colors) according to a previous study conducted at atmospheric pressure and/or in a glove box (PCO2 = 8.10-3 atm; PO2 ≈ 10−6 atm) [23]. Figure 6 presents the OCP temporal variations of three other electrodes (AgCl3, IrO2 and FeS2) in addition to Platinum and Ag2S. Figure 7 presents the OCP of Pt, Ag2S, Sb2O3, AgCl3(s) and CS-X65 versus pH during 180 days in a Pourbaix type diagram.
In Figure 7, the evolutions of Pt and Sb2O3 potentials vs pH are presented and the straight line from -360 mV to -600 mV indicates the water lower stability limit (H+/H2). The values of PtO/Pt highlight that the pore water was initially under micro-oxic, then finally under anaerobic state.
In Figure 8, the rectangle-shaped boxes show the OCP variations of PtO/Pt [150 ; 350 mV/SHE] in green color and of Sb2O4/Sb [-130 ; -240 mV/SHE] in red color as a function of pH variations [6.45 ; 7.48]. According to these values, one can conclude about the initial micro-oxic and under a certain period bout the anoxic state of the pore water.
In Figure 5, a rapid stabilization was observed for CS-X65 free potential (plateau at -520 mV/SHE). It should be noticed that the values of CS-X65 free potential vs pH in Figure 7 encircled the water limit line, which demonstrates that the corroding metal (CS-X65) is partly close to its immunity domain (thermodynamically stable) or close to a very low corrosion domain.
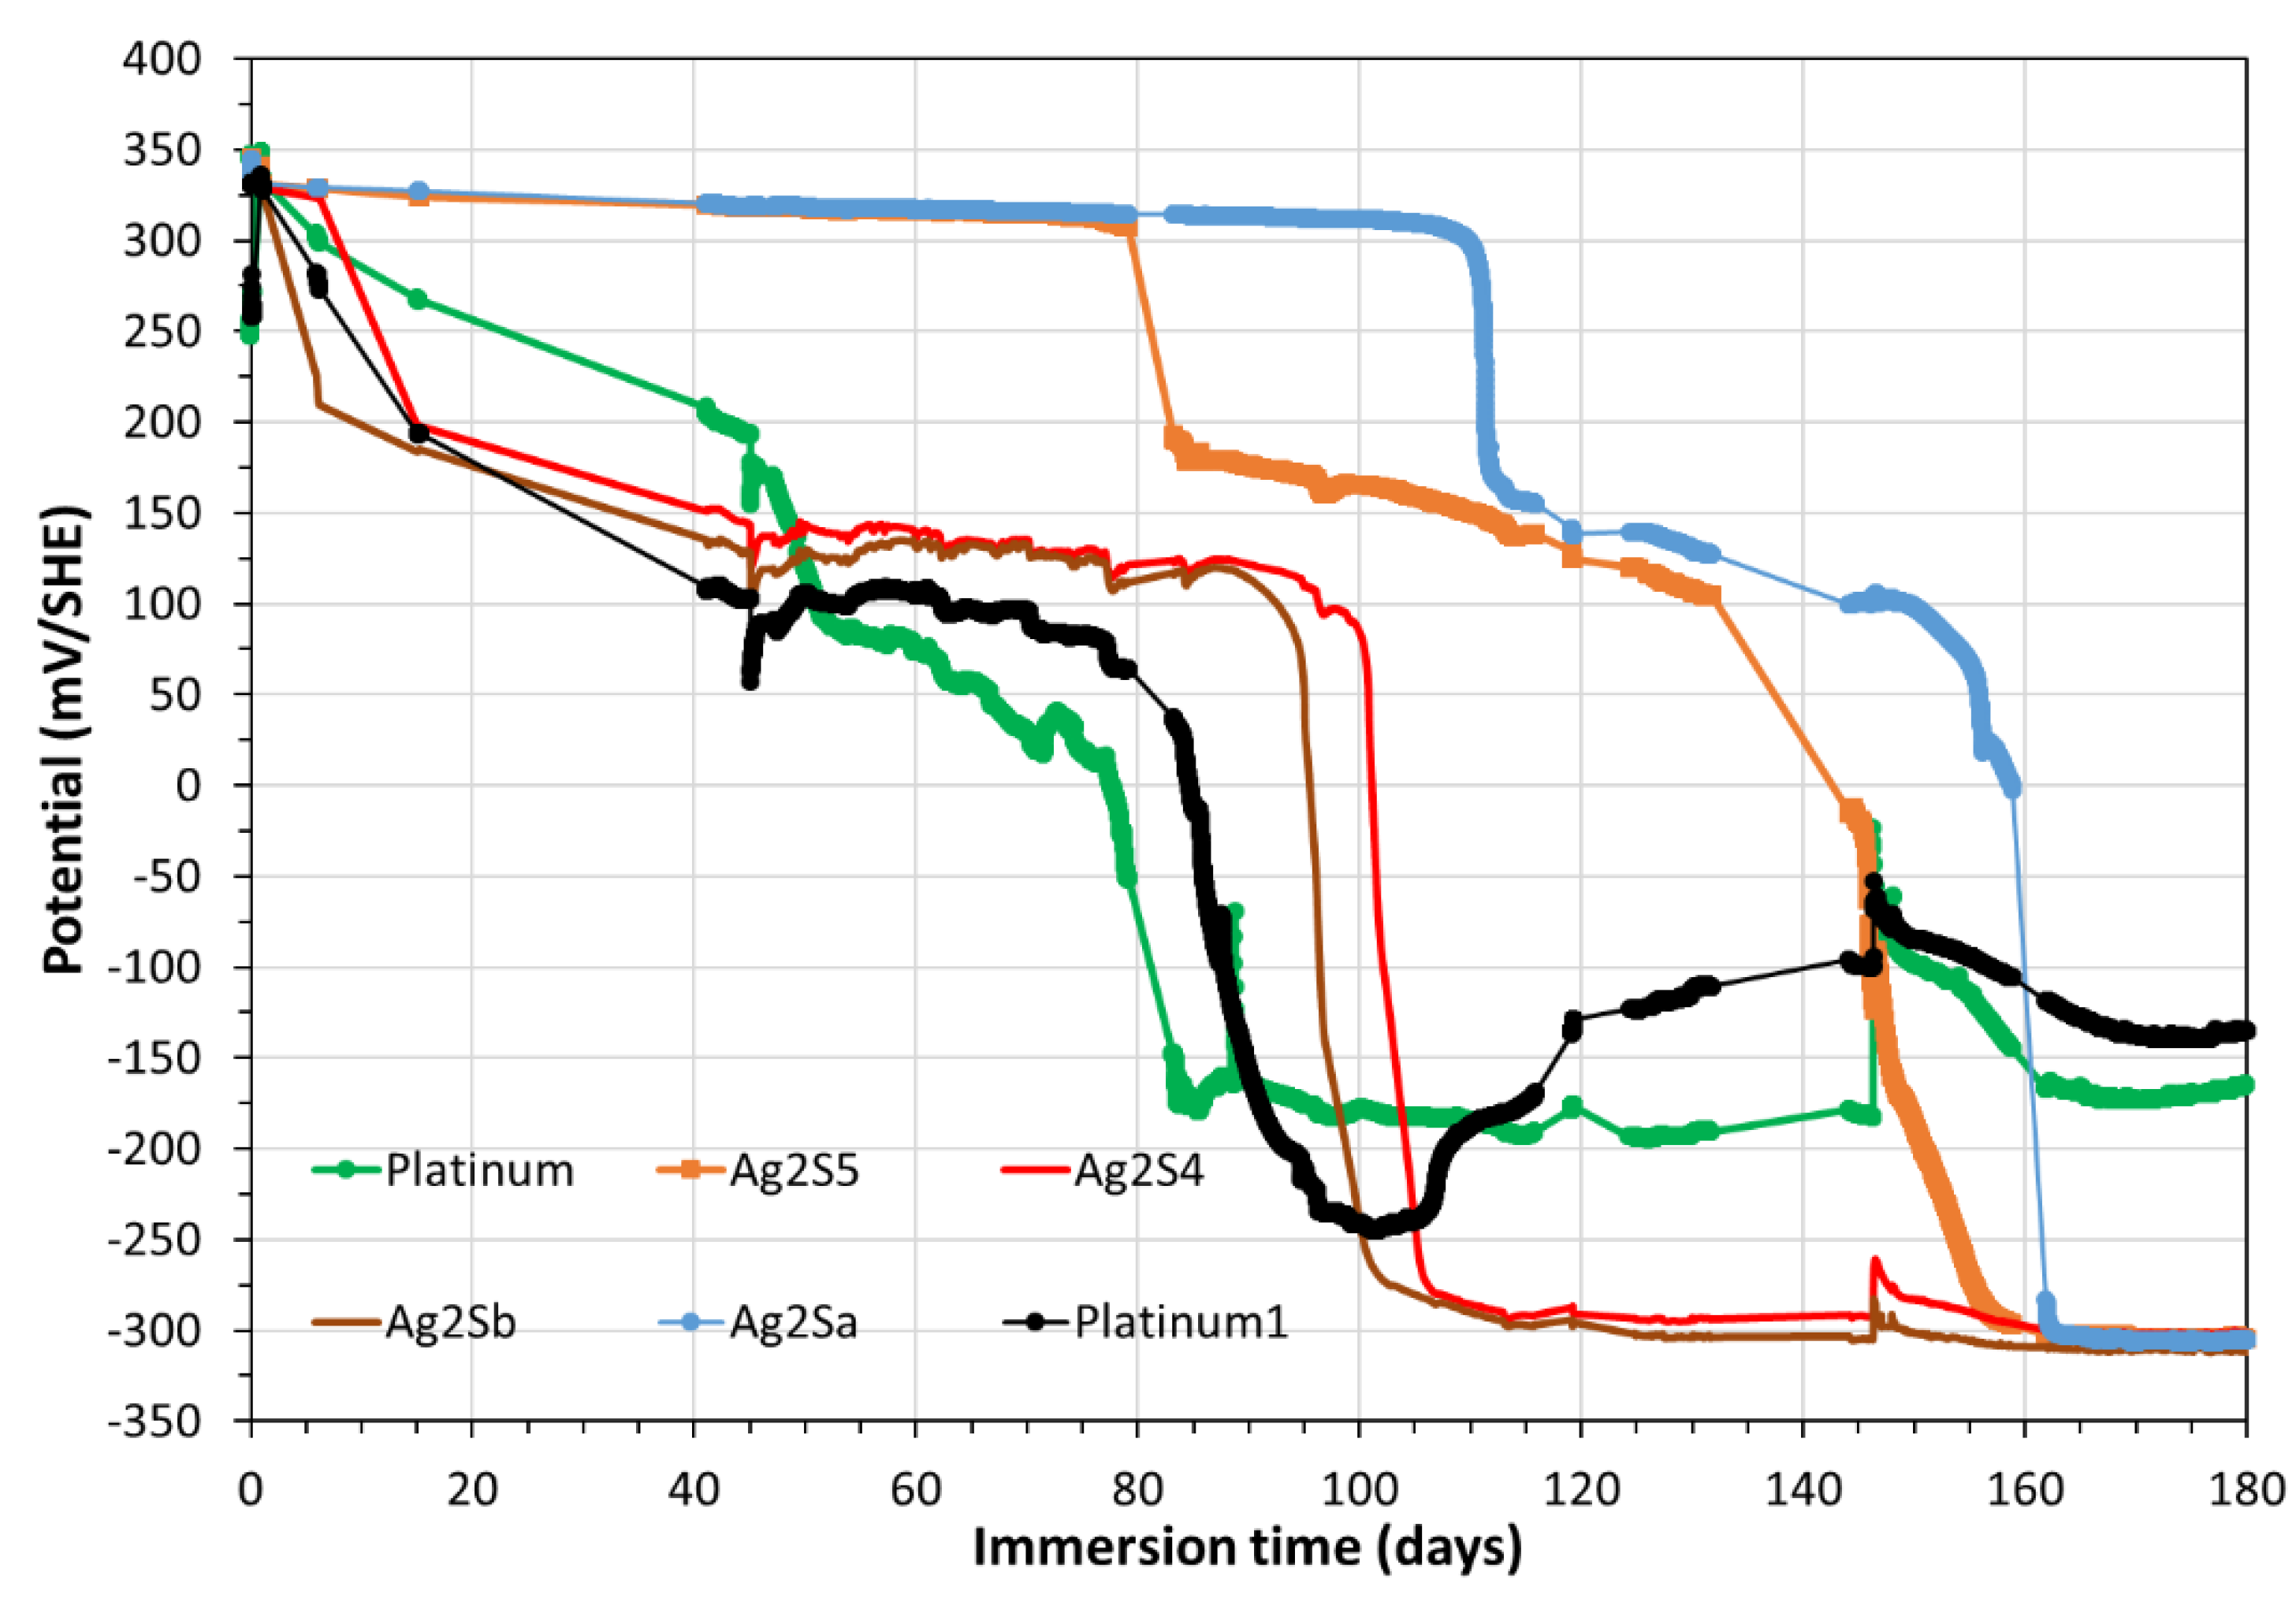
The evolutions of the electrode potentials on Figure 5, Figure 6 and Figure 7 illustrate that: i) the Platinum electrode, initially indicates oxic pore water, ii) from day 40, the potential of Pt and those of all electrodes indicate an anoxic pore water, which remains anoxic until the end of the experiment. The same phenomenon is observed in the MMP-1 (see Figure B3 in Appendix B). Thanks to the monitoring of the OCP of these electrodes, and especially those of Ag2S/Ag, we calculated a constant content of hydrogen sulfide that continuously arrives in the MMP-2 (coming from the MPP-1, series-connected with the MPP-2). From day 60, the water sulfide content in MPP-2, calculated from the potential of Ag2S/Ag at the corresponding pH equals to 0.03206 mg/L (or 10-6 M of sulfide).
3.3. Electrochemical corrosion measurements on the triplet including CS-X65 working electrode
The OCP of CS-X65 WE during the 180 days was measured versus Ag/AgCl(s)y solid electrode and was converted with respect to SHE in Figure 9. Its comparison with OCP values for CS-X65 free (Figure 5) shows a great similarity except, for CS-X65 WE, during the periods of polarizations applied to CS-X65 WE by diverse electrochemical techniques for corrosion measurements, the most disturbing of them was VaOCP at ±50 𝑚𝑉/OCP of CS-X65 WE.
The analysis of impedance diagrams, in Nyquist mode, that were obtained by EIS at the beginning of the experiments, present only one capacitive loop that corresponds to a traditional Randles electrical equivalent circuit model Re(Q/Rp) (Figure 10a and 10b). Re and Rp are the electrolyte resistance and the polarization resistance, respectively. The flattened shape of the capacitive loop shows a frequency dispersion represented here by a pseudo capacitance, Q, or constant phase element (CPE). Additionally, the degree of flattening of the loop depends on the interfacial boundary conditions in the equation of admittance Y°= Qn, where the exponent n is relative to the dispersive character of the interface (i.e., with an exponent of n = 1, the CPE is purely capacitive, while n = 0 represents purely resistive contributions). The n values remain constant, during 180 days, around 0.8 and the cutoff frequency is close to 3 Hz.
Figure 11 shows the temporal variation of the diameter of the capacitive loop, given by Rp value. It appears that the system becomes increasingly resistive during the first 20 days of immersion, representing a significant decrease of the corrosion rate. Then, in a very abrupt way, the size of the diameter comes back to the one obtained during the first days to stabilize after 50-55 days. This corrosion phase is highlighted at high frequency Nyquist plot in Figure 10a. It is associated with an additional phenomenon to the CS-X65-COx pore water interface in the form of another capacitive loop, whose cut-off frequency is close to 630 kHz.
It should be noted also that the loop of charge transfer is increasingly incomplete from fourth month of immersion in the COx pore water.
The value of the electrolyte Re, also varies, passing from 87 ohms at the beginning of the experiment to 72 ohms at the end (Figure 10b). This variation obtained gradually all along measurements, thus represents a real continuous increase, but very weak, conductivity in water of MPP-2, the electrodes being rigid and motionless. This variation of conductivity here is not correlated with the variation of the corrosion current densities, other phenomena being more important, like the accumulation of ions and some solids in suspension in the lower part of MMP-2.
In order to calculate the corrosion current density, CCD or Jcorr, the Geary-Stern parameter B value is needed (see equation 1). B was obtained by VaOCP assessed at each point, and was found to vary from 18 to 13 mV (average value at 14 mV), thus allowing to determine the “instantaneous” CCD and the “instantaneous” corrosion rate (CR) of the carbon steel during the 180 days following equation (3).
With M, the molar mass of Fe (g/mol); Jcorr the CCD (A); z: the number of exchanged electrons (for Fe° oxidation z equals 2); F: Faradic constant (C/mol e-); ρ the iron density (g.cm-3); S: exposed surface area (cm2).
Figure 12 presents the evolution of CCDs (left axis in µA/cm²) and CRs (in right axis in mm/y) of CS-X65 as a function of time during 180 days, determined by three different electrochemical techniques.
By integrating the CCDs of the Figure 12 it was calculated the cumulated thickness loss (in mm) as a function of time (0 to 0.5 years) and this is presented in Figure 13.
In Figure 13, considering a linear extrapolation of the CRs (mm/y) obtained during the last exposition period (0.3 -0.5 year) up to 1 year, the corrosion rates in mm/y obtained at 1 year were as follows:
CREIS (mm/y) =0.0220; CRLPR (mg/y) =0.0270; CRVaOCP (mm/y) =0.0325
The average corrosion rate was calculated as 0.0272 mm/y with an average standard deviation of 0.0027 mm/y.
In Figure 13, by multiplying by 2 the end values of the CRs (mm/y) obtained during 0.5 year, the corrosion rates in mm/y obtained at 1 year were as follows:
CREIS (mm/y) =0.0210; CRLPR (mg/y) =0.0240 ; CRVaOCP (mm/y) =0.0300
The average corrosion rate was calculated as 0.025 mm/y with an average standard deviation of 0.0025 mm/y.
3.4. Mass loss corrosion measurements on the CS-X65 electrode (working and free)
By applying the methodology for mass loss (weighing the electrodes before and after exposition for 180 days and desquamation) and according to equation 2, where T equals 0.5 year and S equals 64 mm², and Wloss 8.0 mg, and 4.0 mg for CS-X65 WE and CS-X65 free respectively, the corresponding values of corrosion thickness loss were obtained are 0.032 mm/y and 0.016 mm/y. This is an important indication about the corrosion of the electrochemically perturbed sample; his corrosion is twofold greater than those of unperturbed one. These values are, when compared to those of Figure 13 are close. These unique averaged corrosion rates were estimated considering that the corrosion is uniform.
4. Discussion
The electrode potentials versus time, provided continuously by the monitored probes on Figure 5 and Figure 6, but also these potentials versus pH on Figure 7, make it possible to identify the evolutions in the COx pore water, in contact with the CS-X65 during 180 days. The total duration of contact can be divided in two main periods.
The first period, from 0 to 40 days, is characterized by oxic pore water. The potential values of PtO/Pt probe (and also those of the other probes) highlight initially an oxic water, which progressively became micro-aerobic.
The second period, from day 40 to 180 days, is characterized by an anoxic water, but which passes from the total absence of O2 to the progressive presence of hydrogen sulfides. The potential values of PtO/Pt and also those of all electrodes and especially those of Ag2S/Ag, by their decrease, indicate an anoxic pore water, which progressively becomes more reducing until the end of the experiment. The potential values of the Ag2S/Ag probe revealed initially a slight constant decrease, and, after a staircase phenomenon after 100 days and then around 160 days, which is characteristic of the presence of sulfides.
The previous elements allow to understand the variations of CCDs or CRs or CTLs, which were estimated thanks to the three electrochemical techniques (Figure 12 and 13).
During the first period, before day 40, all three CCDs (and CRs) were decreased sharply in the first hours (Figure 12), and remained stable. Especially, CCDs from EIS and LPR were close during the first 40 days. This situation seems to correspond to an actual oxidant limitation and a protective deposit on the CS-X65 surface. Dissolved dioxygen concentration is depleted progressively over time as shown the OCP values of the electrodes (Figure 5, Figure 6 and Figure 7), an anoxic state is reached after 40 days of immersion. Indeed, the drop of the CCDs from the first ten days of immersion (matching to a strong increase of Rp) corresponds to the formation of a pseudo passive layer generated by various iron oxides. The iron corrosion comes from the reduction of dissolved dioxygen confined in the water (reaction 2 in Appendix A) and implemented according the overall equation (reaction 4 in Appendix A). The high and constant n values relative to the dispersive character of the interface show the rather homogeneous character of the layer generated by the iron oxidation and therefore its protective role for CS-X65 during the first 40 days.
During the second period, after day 40, all three CCDs (and CRs), were increased progressively, until reaching and stabilizing between 2 and 3 µA/cm², without any change in the flow rate or other apparent operating conditions, except temperature (see temperature evolution in Figure B1 present in the appendix B). However, there is no correlation between small temperature variations and the CCD values. This drastic change in CCDs indicates a change in the oxidant nature and the corrosion phenomenon and kinetics in its presence. The oxidant there is H+, according to half electrochemical reaction (5 in Appendix A) and the overall electrochemical reaction (7 in Appendix A). In parallel, Nyquist mode diagrams show that a new interface is formed at high frequency after 46 days which corresponds to the formation of iron sulfides probably firstly as amorphous iron sulfides and some days after as mackinawite [36-40]. These sulfides in turn act as a pseudo protective layer for the CS-X65 allowing to stabilize the CCD.
Figure 12 highlights that the values of the CCDs (in µA/cm²) obtained using the three techniques are close. Their initial light divergences start in the third month and are increased more and more, with a value given by EIS, lower than that provided by the LPR and VaOCP. The greatest difference being 15 % between the LPR and the EIS up to 4 months after the beginning of the experiments. Between 165 and 180 days, the measured CCDs fluctuated within 1.8 µA/cm² (EIS), 2.8 µA/cm² (LPR) and 3.0 µA/cm² (VaOCP). This is a difference of 40% between the two extreme values. The reason for this difference is that impedance signals become less accurate over time. Indeed, the capacitive loop in the low frequencies is less and less well-defined. The Rp values are therefore obtained by extrapolation from the beginning of the arc. The noted divergence, which is gradually increasing between the two methods during the last two months, is the proof that EEC model Re(Q1Rp) is incomplete for the end of the experiments.
5. Conclusions
This study, carried out on site, allowed to highlight various information necessary to monitor electrochemically the corrosion of carbon steel in contact with the pore water of the COx as planned in the large-scale project of Cigeo. We have used, constantly and preferentially, solid reference electrodes, for the measurement of OCP of different selected materials and of the pH. We also used known classical electrochemical methods (selected, tested and validated here in an aqueous medium), for the corrosion parameters measurement during 180 days.
Together, potentiometric and electrochemical techniques allowed us to comprehend our measurement at every point during 180 days and finally to explain the corrosion phenomena and propose corrosion kinetics for CS-X65 steel in contact with COx pore water in terms of CCDs (µA/cm²), CRs (mm/y) and CTL (mm) as a function of time.
The materials and the techniques have been validated. Since, the use of various electrodes, especially, the reference, show a great stability for long durations in these environments and then it can be used as a reliable and robust reference electrode. Moreover, the use of a steel control probe and its comparison with the working electrode of the same nature proved that the disturbances linked to the regular electrochemical measurements have no impact on its behavior and the value of its OCP. Regarding the electrochemical techniques, VaOCP, IES and LP obtained very similar results in terms of CCDs during 180 days. The VaOCP method has the advantage to permit finding the Geary-Stern parameter, without disturbing the steel interface, thanks to a weak overpotential polarization. The EIS and LPR methods provided suitable CCD values.
Regarding the mechanism of corrosion, this study has shown that corrosion occurred during the first 40 days due to the presence of oxygen, under the investigated conditions. A protective layer has been formed very fast on the steel surface. The progressive depletion of oxygen in the water and the promotion of H+ as the new oxidant provoked an increase in the corrosion rate until the arrival of sulfides leading to iron sulfide precipitation and stabilization of the CCDs.
The average corrosion (electrochemical) rates obtained at 1 year were fluctuated between 0.0210 and 0.0272 mm/y. The gravimetrically obtained corrosion thickness loss rate for perturbed CS-X65 found to be 0.032 mm/y, and is two-fold greater than those of unperturbed one (0.016 mm/y). These results are in agreement with previous work by Necib et al. [18-19].
These results are very encouraging. Within the framework of the Cigeo project, it is now important to carry out corrosion tests over longer periods and detailed analyzes to characterize precisely the deposits in the surface of CS-X65 during and at the end of the experiment.
Author Contributions
I.I. and K.G.S. are co-directors of the Doctoral Thesis of Y.V.S.M. Conceptualization, S.B., J.B. and I.I.; methodology, all authors; software, all authors; validation, all authors; formal analysis, all authors; investigation, all authors; data curation, all authors; writing—original draft preparation, Y.V.S.M. and I.I.; writing—review and editing, all authors.; visualization, all authors; supervision, SB, J.B. K.G.S. and I.I.; project administration, B.J. and I.I.; funding acquisition, SB, B.J. and I.I. All authors have read and agreed to the published version of the manuscript.
Funding
Part of this work was supported by the French National Agency for Radioactive Waste Management (Andra) as part of the PhD thesis of M. Sano Moyeme. This research also was funded by BRGM and Andra, in the Framework of CINECOR project (2020-2023), grant numbers 20080531 for Andra-UT3 and 20080523 for Andra-BRGM and also in the Framework of VITCOR project (2020-2023), grant number 20081088 for Andra-BRGM.
Data Availability Statement
The data presented in this study are available on request from the corresponding authors.
Acknowledgments
The authors thank Melanie LUNDY, Myriam AGNEL, Yannick LINARD, Patrick DELAGE and Philippe TABANI, for substantial assistances during the experiment on the Underground Research Laboratory of Andra at Bure, France. The authors thank: SCODIP from Orléans, France (Yannik LEGUEUNIC), for fabricating the electrodes and SOLEXPERT from Vandoeuvre-lès-Nancy, France, for manufacturing the multi-parametric devices.
Conflicts of Interest
The authors declare no conflict of interest.
Appendix A
General and basic knowledge on corrosion of Fe° implies oxidation of Fe° to Fe2+, according the half electrochemical reaction (1):
Fe° → Fe2 + 2e-
In oxic aqueous conditions, the oxidant for Fe° is the dissolved oxygen, (half electrochemical reactions 2 and 3):
O2 + 4H+ + 4e- → 2H2O
O2 + 2H2O + 4e- → 4OH-
An overall electrochemical reaction can be:
2Fe° + O2 + 2H2O → 2Fe2+ + 4OH-
Fe2+ can be oxidized to Fe3+ and oxides like Fe(OH)3, Fe(OH)2, Fe3O4 (FeO-Fe2O3) can occur.
In anoxic aqueous conditions, the oxidant is H+ or H2O (half electrochemical reactions 5 and 6).
2H+ + 2e- → H2(g)
2H2O + 2e- → H2(g) + 2OH-
Two overall electrochemical reactions can be:
Fe° + 2H+ → Fe2 + H2(g)
Or Fe° + 2H2O → Fe2 + H2(g) + 2OH-
The presence hydrogen sulfide (H2S/HS-/S2-) in the solution can yield iron sulfides instead of Fe2+ free, or as a function of pH its complexes with OH-, Fe(OH)2 or other iron oxy-hydroxides.
Appendix B
Figure 1.
Temporal variation, during 180 days, of the temperature values, which reigns in the cupboard close to MPP-2 external surface, and supposed to be equal to that of the interior.
Figure 1.
Temporal variation, during 180 days, of the temperature values, which reigns in the cupboard close to MPP-2 external surface, and supposed to be equal to that of the interior.
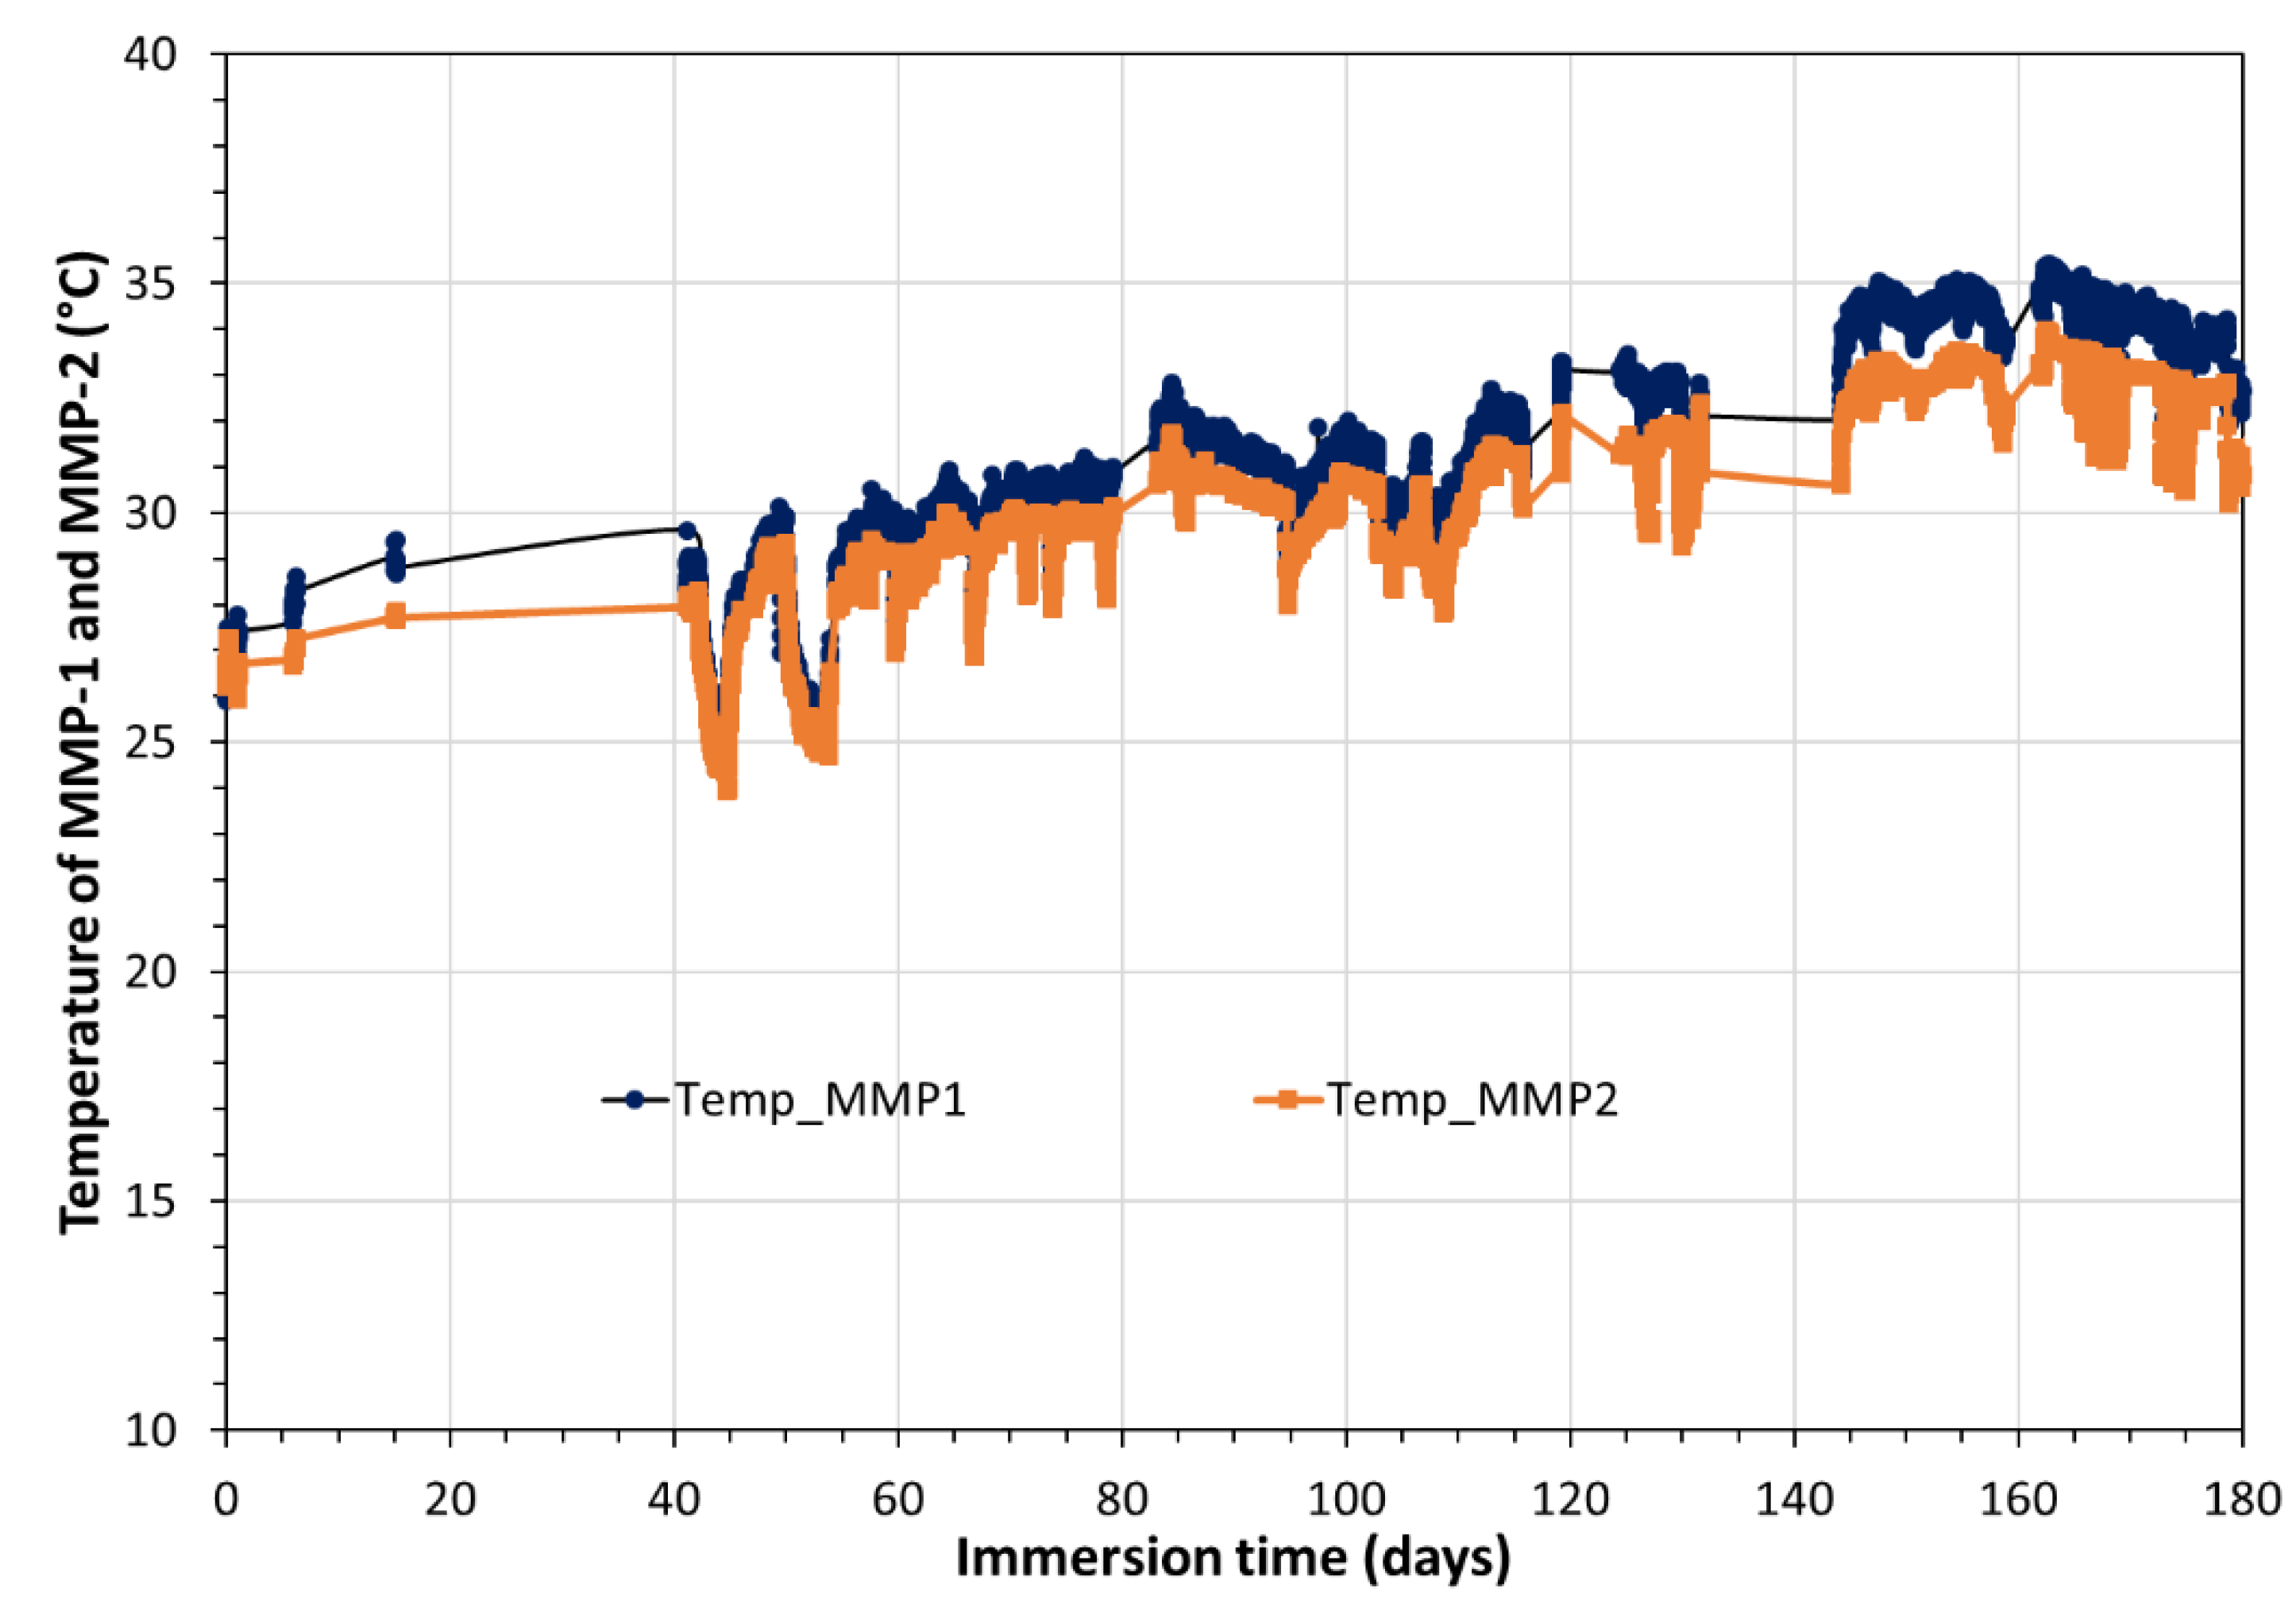
Figure 2.
Temporal variation, during 180 days, of potential values (mV) of: i) AgClc; AgCl3 vs AgCl4 and ii) AgClc; AgCl3; AgCl4 vs RefpH2. RefpH2 is the internal AgCl reference of pH electrode (Scan) at the position L1P3 in MMP-2.
Figure 2.
Temporal variation, during 180 days, of potential values (mV) of: i) AgClc; AgCl3 vs AgCl4 and ii) AgClc; AgCl3; AgCl4 vs RefpH2. RefpH2 is the internal AgCl reference of pH electrode (Scan) at the position L1P3 in MMP-2.
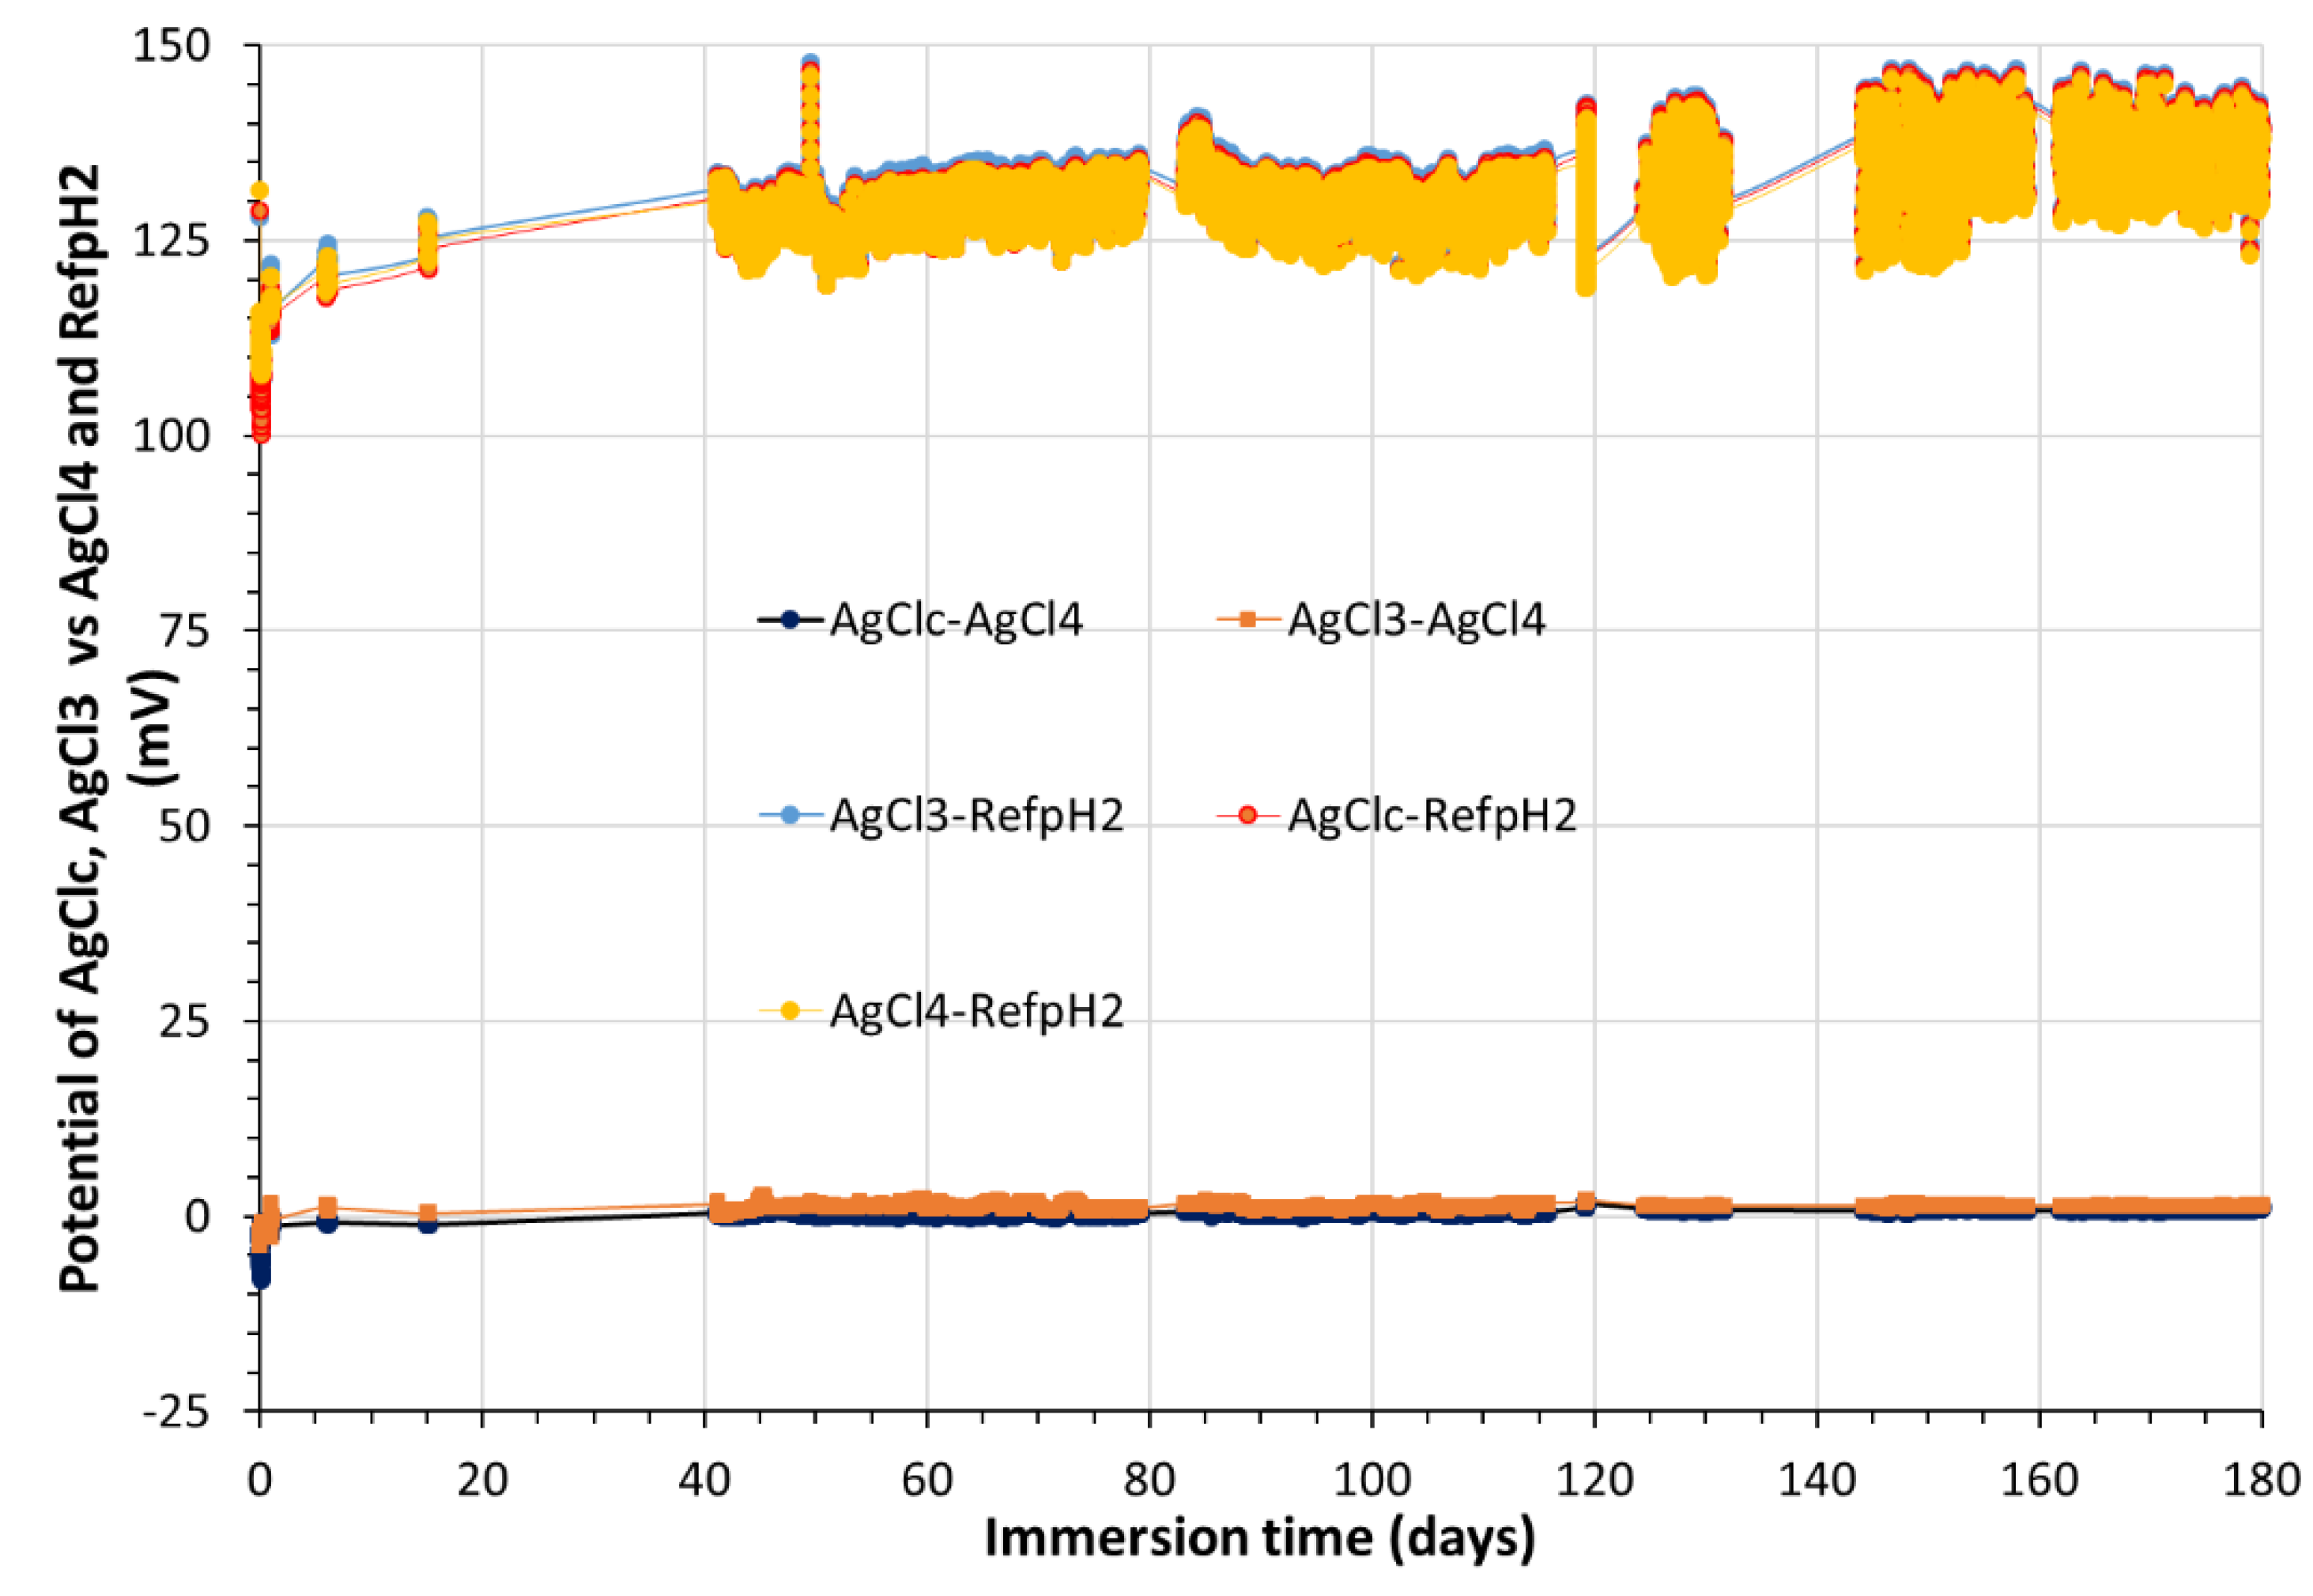
Figure 3.
Temporal variation during 180 days of the OCP (mV/SHE) of two Pt, and four Ag/Ag2S, electrodes of the MMP-1.
Figure 3.
Temporal variation during 180 days of the OCP (mV/SHE) of two Pt, and four Ag/Ag2S, electrodes of the MMP-1.
| 1 |
National inventory of radioactive materials and waste (https://inventaire.andra.fr/)
2018 edition of the National Inventory. (based on figures at the end of 2016
https://international.andra.fr/sites/international/files/2021-11/Andra-MAJ_Essssentielss_2021-21_02Fev_ENsdpdf%20%5Bpreview%5D_0.pdf
|
References
- Altmann, S. “Geo”chemical research: A key building block for nuclear waste disposal safety cases. J. Contam. Hydrol. 2008, 102, 174–179. [Google Scholar] [CrossRef] [PubMed]
- French national radioactive waste management agency – Andra. Available online: https://international.andra.
- Han, T.; Shi, J.; Chen, Y.; and Li, Z. Effect of chemical corrosion on the mechanical characteristics of parent rocks for nuclear waste storage. Sci. Technol. Nucl. Install. 2016, 2016, 7853787. [Google Scholar] [CrossRef]
- Jonsson, M. , Radiation effects on materials used in geological repositories for spent nuclear fuel. ISRN Mater. Sci. 2012, 2012, 639520. [Google Scholar] [CrossRef]
- Gaucher, E.C.; Robelin, C.; Matray, J.M.; Négrel, G.; Gros, Y.; Heitz, J.F.; Vinsot, A.; Rebours, H. Cassagnabère, A., Bouchet, A. ANDRA underground research laboratory: interpretation of the mineralogical and geochemical data acquired in the Callovian–Oxfordian formation by investigative drilling. Phys. Chem. Earth 2004, 29, 55–77. [Google Scholar]
- Gaucher, E.C.; Blanc, P.; Bardot, F.; Braibant, G.; Buschaert, S.; Crouzet, C.; Gautier, A.; Girard, J.P.; Jacquot, E.; Lassin, A.; Negrel, G.; Tournassat, C.; Vinsot, A.; Altmann, S. Modelling the porewater chemistry of the Callovian-Oxfordian formation at a regional scale. Comptes Rendus Geosciences 2006, 338, 917–930. [Google Scholar]
- Gaucher, E.C. , Tournassat, C. Pearson, F.J., Blanc, P., Crouzet, C., Lerouge, C., Altmann, S. A robust model for pore-water chemistry of clayrock. Geochim. Cosmochim. Acta, 2009; 73, 6470–6487. [Google Scholar] [CrossRef]
- Fernández, A.M.; Sánchez-Ledesma, D.M.; Tournassat, C.; Melón, A.; Gaucher, E.C.; Astudillo, J.; Vinsot, A. Applying the squeezing technique to highly consolidated clayrocks for pore water characterization: Lessons learned from experiments at the Mont Terri Rock Laboratory. Appl. Geochem. 2014, 49, 2–21. [Google Scholar]
- Tournassat, C.; Vinsot, A.; Gaucher, E.C.; Altmann, S. Chapter 3 - Chemical conditions in clay-rocks Natural and Engineered Clay Barriers. In Natural and Engineered Clay Barriers, 1st ed.; Tournassat, C., Steefel, C.I., Bourg, I.C., Bergaya, F., Eds.; Elsevier: Amsterdam, The Nederlands, 2015; pp. 71–100. [Google Scholar]
- Tournassat, C.; Steefel, C.I.; Bourg, I.C.; Bergaya, F. Chapter 1 - Surface Properties of Clay Minerals, in: Natural and Engineered Clay Barriers, 1st ed.; Tournassat, C., Steefel, C.I., Bourg, I.C., Bergaya, F., Eds.; Elsevier: Amsterdam, The Nederlands, 2015; pp. 5–31. [Google Scholar]
- Vinsot, A.; Appelo, C.A.J.; Cailteau, C; Wechner, S. ; Pironon, J.; De Donato, P.; De Cannière, P.; Mettler, S.; Wersin, P.; Gäbler, H.E. CO2 data on gas and pore water sampled in situ in the Opalinus Clay at the Mont Terri rock laboratory. Phys. Chem. Earth 2008, 33, 54–60. [Google Scholar] [CrossRef]
- Vinsot, A.; Mettler, S.; Wechner, S. In situ characterization of the Callovo-Oxfordian pore water composition. Phys. Chem. Earth 2008, 33, 75–86. [Google Scholar] [CrossRef]
- Betelu, S. , Ignatiadis, I. , Tournassat, C., Redox potential measurements in a claystone. In Proceedings of the Clay Conference, Davos, Switzerland, 24-27 September 2017; Abstract Number 111. [Google Scholar]
- Betelu S, Ignatiadis I., Tournassat C. Redox potential measurements in Callovian Oxfordian claystone: Insights into the nature of the mineral(s) responsible for the redox reactivity. In Proceedings of the Clay Conference, Nancy, France, 13-16 June 2022; Abstract Number Clay00387.
- Crusset, D.; Deydier, V.; Necib, S.; Gras, J.M.; Combrade, P.; Féron, D.; Burger, E. Corrosion of carbon steel components in the French high-level waste programme: evolution of disposal concept and selection of materials. Corros. Eng. Sci. Technol. 2017, 52, 17–24. [Google Scholar] [CrossRef]
- Martin, F.A.; Perrin, S.; Bataillon, C. Evaluating the corrosion rate of low alloyed steel in Callovo-Oxfordian clay: towards a complementary EIS, gravimetric and structural study. MRS Online Proc. Libr. 2012, 1475, 471–476. [Google Scholar] [CrossRef]
- Schlegel, M.L.; Necib, S.; Daumas, S.; Blanc, C.; Foy, E.; Trcera, N.; Romaine, A. Microstructural characterization of carbon steel corrosion in clay borehole water under anoxic and transient acidic conditions. Corros. Sci. 2016, 109, 126–144. [Google Scholar] [CrossRef]
- Necib, S.; Linard, Y.; Crusset, D.; Schlegel, M.L.; Daumas, S.; Michau, N. Corrosion processes of C-steel in long-term repository conditions. Corros. Eng. Sci. Technol. 2017, 52, 127–130. [Google Scholar] [CrossRef]
- Necib, S.; Linard, Y.; Crusset, D.; Michau, N.; Daumas, S.; Burger, E.; Romaine, A.; Schlegel, M.L. Corrosion at the carbon steel clay borehole water and gas interfaces at 85 °C under anoxic and transient acidic conditions. Corros. Sci. 2016, 111, 242–258. [Google Scholar] [CrossRef]
- El Hajj, H.; Abdelouas, A.; Grambow, B.; Martin, C.; Dion, M. Microbial corrosion of P235GH steel under geological conditions, Phys. Chem. Earth 2010, 35, 248–253. [Google Scholar] [CrossRef]
- El Mendili, C.Y. , Abdelouas, A., Bardeau, J.F. Corrosion of P235GH carbon steel in simulated Bure soil solution. J. Mater. Enviro. Sci. 2013, 4, 786–791. [Google Scholar]
- El Mendili, C.Y. , Abdelouas, A. , Karakurt, G., Aït Chaou, A., Essehli, R., Bardeau, J.F., Grenèche, J.M. The effect of temperature on carbon steel corrosion under geological conditions Appl. Geochem. 2015, 52, 76–85. [Google Scholar] [CrossRef]
- Daoudi, J.; Betelu, S.; Tzedakis, T.; Bertrand, J.; and Ignatiadis, I. A Multi-Parametric Device with Innovative Solid Electrodes for Long-Term Monitoring of pH, Redox-Potential and Conductivity in a Nuclear Waste Repository. Sensors 2017, 17, 1372. [Google Scholar] [CrossRef] [PubMed]
- Lundy, M.; Garitte, B.; Lettry, Y.; Vinsot, A. Water Rock Interaction [WRI 14] Experimental design for in situ characterization of the Callovo-Oxfordian pore water composition at 85 °C. Procedia Earth Planet. Sci. 2013, 7, 533–536. [Google Scholar] [CrossRef]
- Bard, A.J.; Faulkner, L.R. Electrochemical Methods: Fundamentals & Applications, 2nd ed. John Wiley & Sons: Hoboken, NJ, USA, 2000; ISBN 978-0-471-04372-0.
- Rodrigues, R.; Gaboreau, S.; Gance, J.; Ignatiadis, I.; Betelu, S. Reinforced concrete structures: A review of corrosion mechanisms and advances in electrical methods for corrosion monitoring. Constr. Build. Mater. 2021, 269, 121240. [Google Scholar] [CrossRef]
- Fahim, A.; Ghods, P.; Isgor, O.B.; Thomas, M.D.A. A critical examination of corrosion rate measurement techniques applied to reinforcing steel in concrete. Mater. Corros. 2018, 69, 1784–1799. [Google Scholar] [CrossRef]
- Ribeiro, D.V.; Abrantes, J.C.C. Application of electrochemical impedance spectroscopy (EIS) to monitor the corrosion of reinforced concrete: A new approach. Constr. Build. Mater. 2016, 111, 98–104. [Google Scholar] [CrossRef]
- Stern, M.; Geary, A.L. Electrochemical polarization: I. A theoretical analysis of the shape of polarization curves. J. Electrochem. Soc. 1957, 104, 56–63. [Google Scholar] [CrossRef]
- Andrade, C.; Alonso, C. Test methods for on-site corrosion rate measurement of steel reinforcement in concrete by means of the polarization resistance method. Mater. Struct. 2004, 37, 623–643. [Google Scholar] [CrossRef]
- Ignatiadis, I.; Amalhay, M. Experimental study of corrosion of two stainless steels during the oxidative bacterial dissolution of pyrite using mass loss and electrochemical techniques. International Journal of Mineral Processing 2001, 62, 199–215. [Google Scholar] [CrossRef]
- ASTM G16-13(2019); Standard Guide for Applying Statistics to Analysis of Corrosion Data. ASTM International: West Conshohocken, PA, USA, 2019.
- Haynie, F.H. Statistical treatment of data, data interpretation and reliability. In Corrosion Tests and Standards: Application and Interpretation, 2nd ed.; Baboian, R., Ed.; ASTM International: West Conshohocken, PA, USA, 2005; pp. 83–88. [Google Scholar]
- Roberge, P. R. Statistical interpretation of corrosion test results. In ASM Handbook: Corrosion: Fundamentals, Testing and Protection, 10th ed.; Cramer, S.D., Covino, B.S., Eds.; ASM International: West Conshohocken, PA, USA, 2003; pp. 425–429. [Google Scholar]
- Panchenko, Y.M.; Marshakov, A.I.; Igonin, T.N.; Kovtanyuk, V.V.; and Nikolaeva, L.A. Long-term forecast of corrosion mass losses of technically important metals in various world regions using a power function. Corros. Sci. 2014, 88, 306–316. [Google Scholar] [CrossRef]
- Amalhay, M.; Abou Akar, A.; Ignatiadis, I. Overview of the deposition phenomena in geothermal wells in the Paris Basin. In Proceedings of the World Geothermal Congress, Worldwide Utilization of Geothermal Energy; Barbier, E., Frye, G., Iglesias, E., Palmason, G., Eds.; International Geothermal Association (IGA): Auckland, New Zealand; pp. 2497–2502.
- Amalhay, M.; Cotiche, C.; Ignatiadis, I. Study of the electrochemical behavior of a carbon-steel in a real and treated geothermal environment. In Proceedings of the World Geothermal Congress, Worldwide Utilization of Geothermal Energy; Barbier, E., Frye, G., Iglesias E., Palmason, G., Eds. International Geothermal Association (IGA): Auckland, New Zealand, 1995; Volume 4, pp. 2369–2374. [Google Scholar]
- Amalhay, M.; Ignatiadis, I. Study of the behavior of a carbon-steel in a natural or modified and treated geothermal environment. In Proceedings of the International Symposium, Eurocorr’ 96, Nice, France, 24-26 September 1996; 15; Session II: Corrosion inhibitors. Abstract Number P; pp. 1–4. [Google Scholar]
- Ignatiadis, I.; Amalhay, M. The effect of iron sulfide deposits on corrosion of carbon steel in a natural and treated geothermal water using electrochemical techniques and X-ray diffractometry. In Proceedings of the International Symposium, Eurocorr’ 96, Nice, France, 24-26 September 1996. Session II: Corrosion inhibitors. P. 21; pp. 1–4. [Google Scholar]
- Rickard, D.; Luther, G.W.I. Chemistry of Iron Sulfides. Chem. Rev. 2007, 38, 514–562. [Google Scholar] [CrossRef]
Figure 1.
Cross section of French concept of the high-level radioactive waste (HLRW) storage in Deep geological facility (DGF).
Figure 1.
Cross section of French concept of the high-level radioactive waste (HLRW) storage in Deep geological facility (DGF).
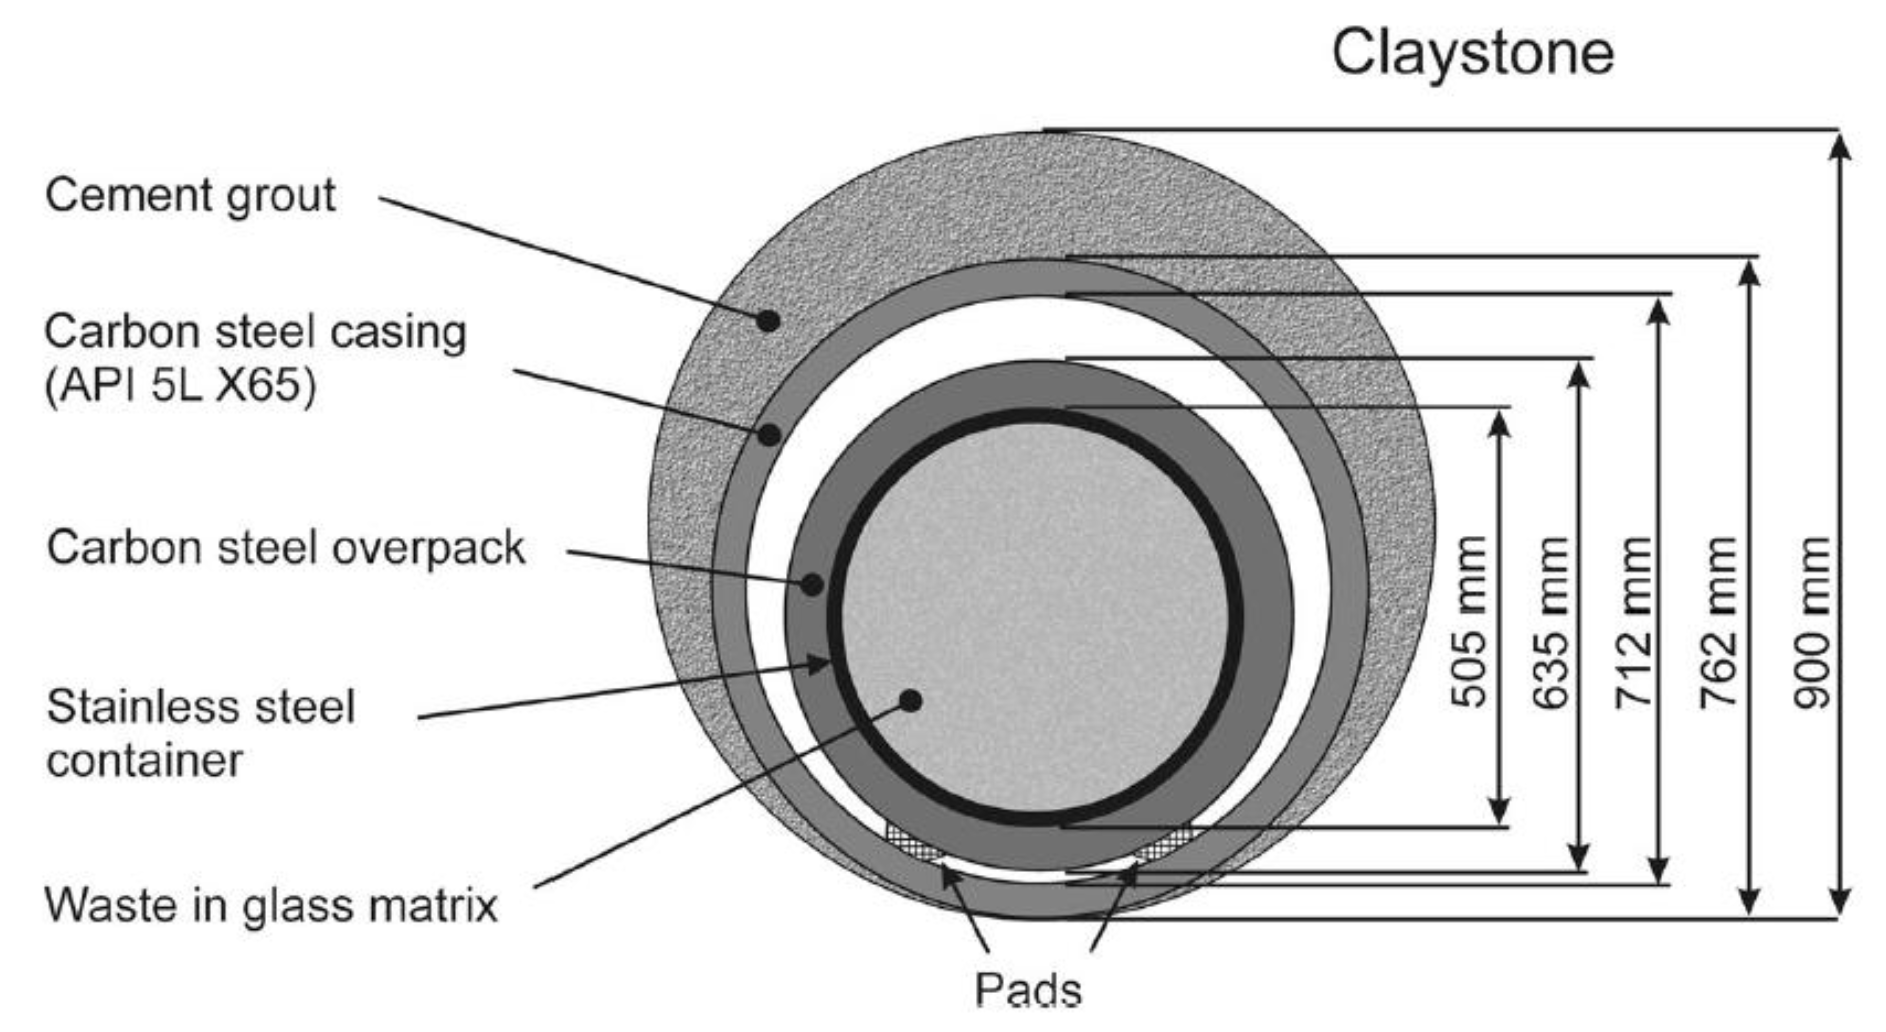
Figure 2.
a) Tubings to be used as receptors for canisters are made of CS-X65. b) CS-X65 electrodes with a body in PEEK designed and constructed to be used for corrosion studies when inserted to the MPP-2 device (see §2.2.1). Electrode dimensions are 5 mm diameter and 3 mm high with an exposed surface of 0.64 cm².
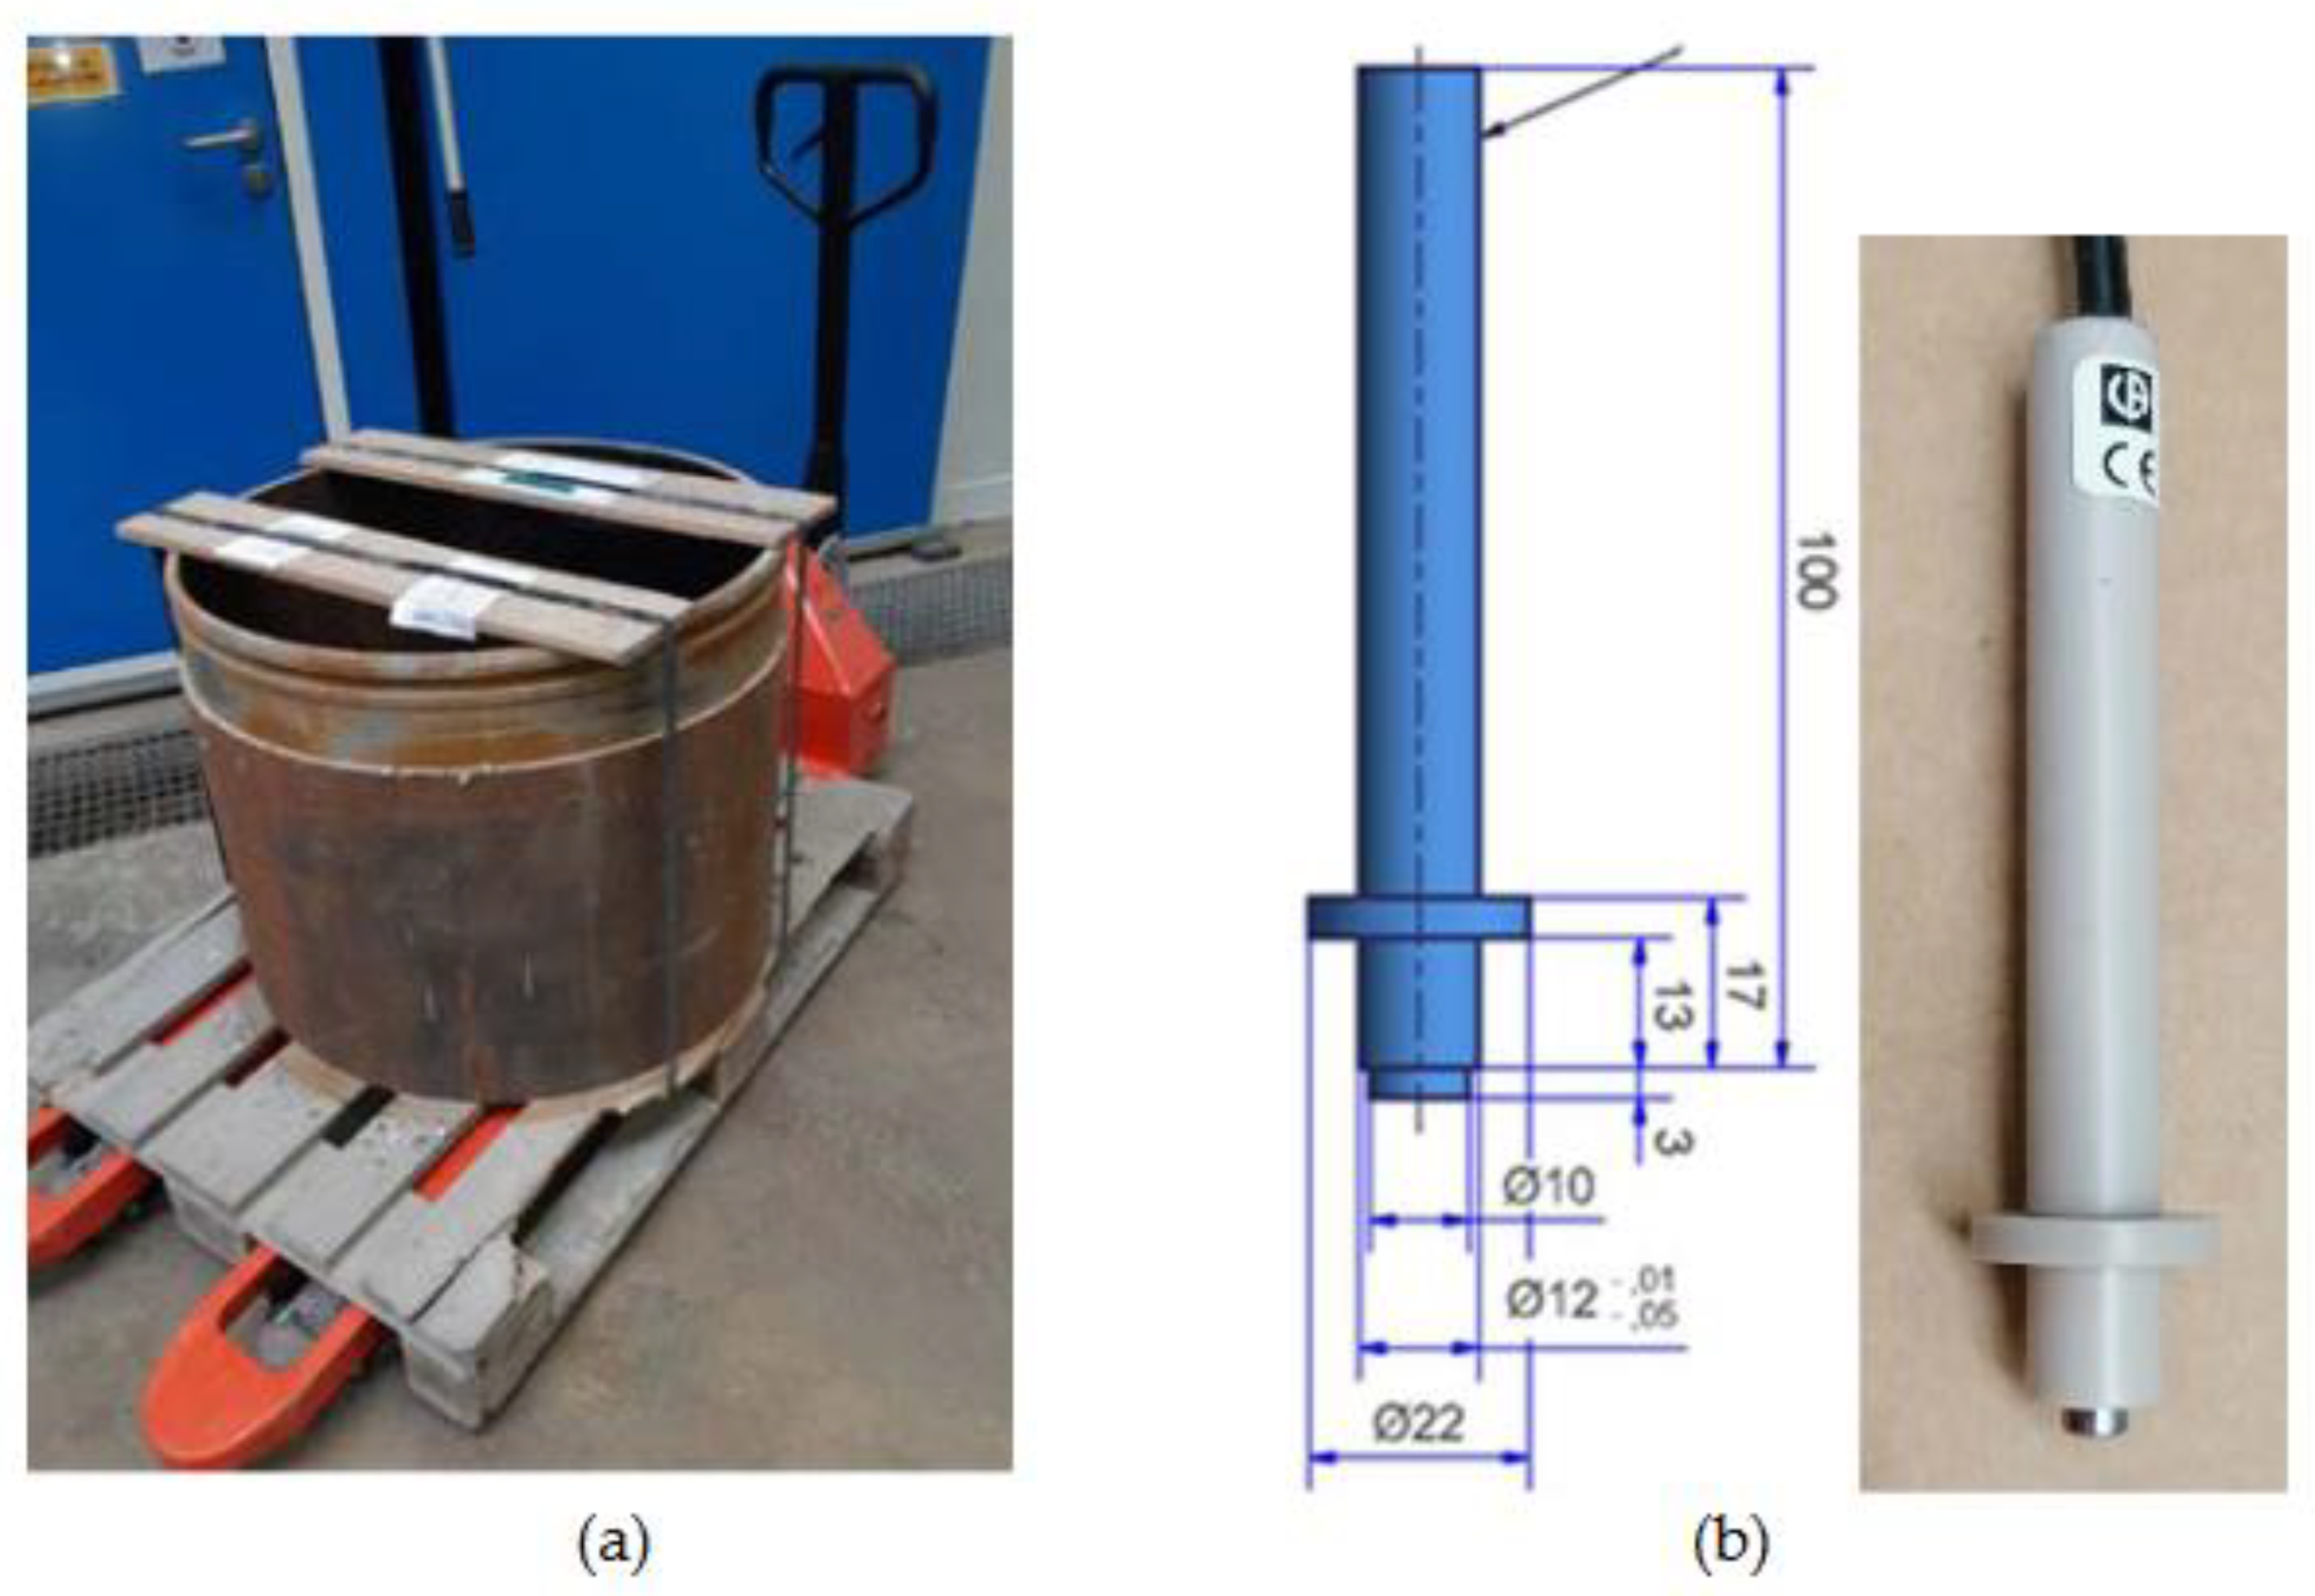
Figure 3.
a. Schematic representation of the device within Underground Research Laboratory (URL) of ANDRA (Bure, France) with illustration of the circuit allowing supplying COx pore water to the two Multi-Parametric Probe holders (MPPs). b. Cupboard (dimensions: 90×50×200 cm) with inside 2 MPPs & instruments (Computer, DAQ, pHmeters, flow controller, a precision balance connected to DAC). c. Outside of cupboard, a Potentiostat-Galvanostat, Impedancemeter.
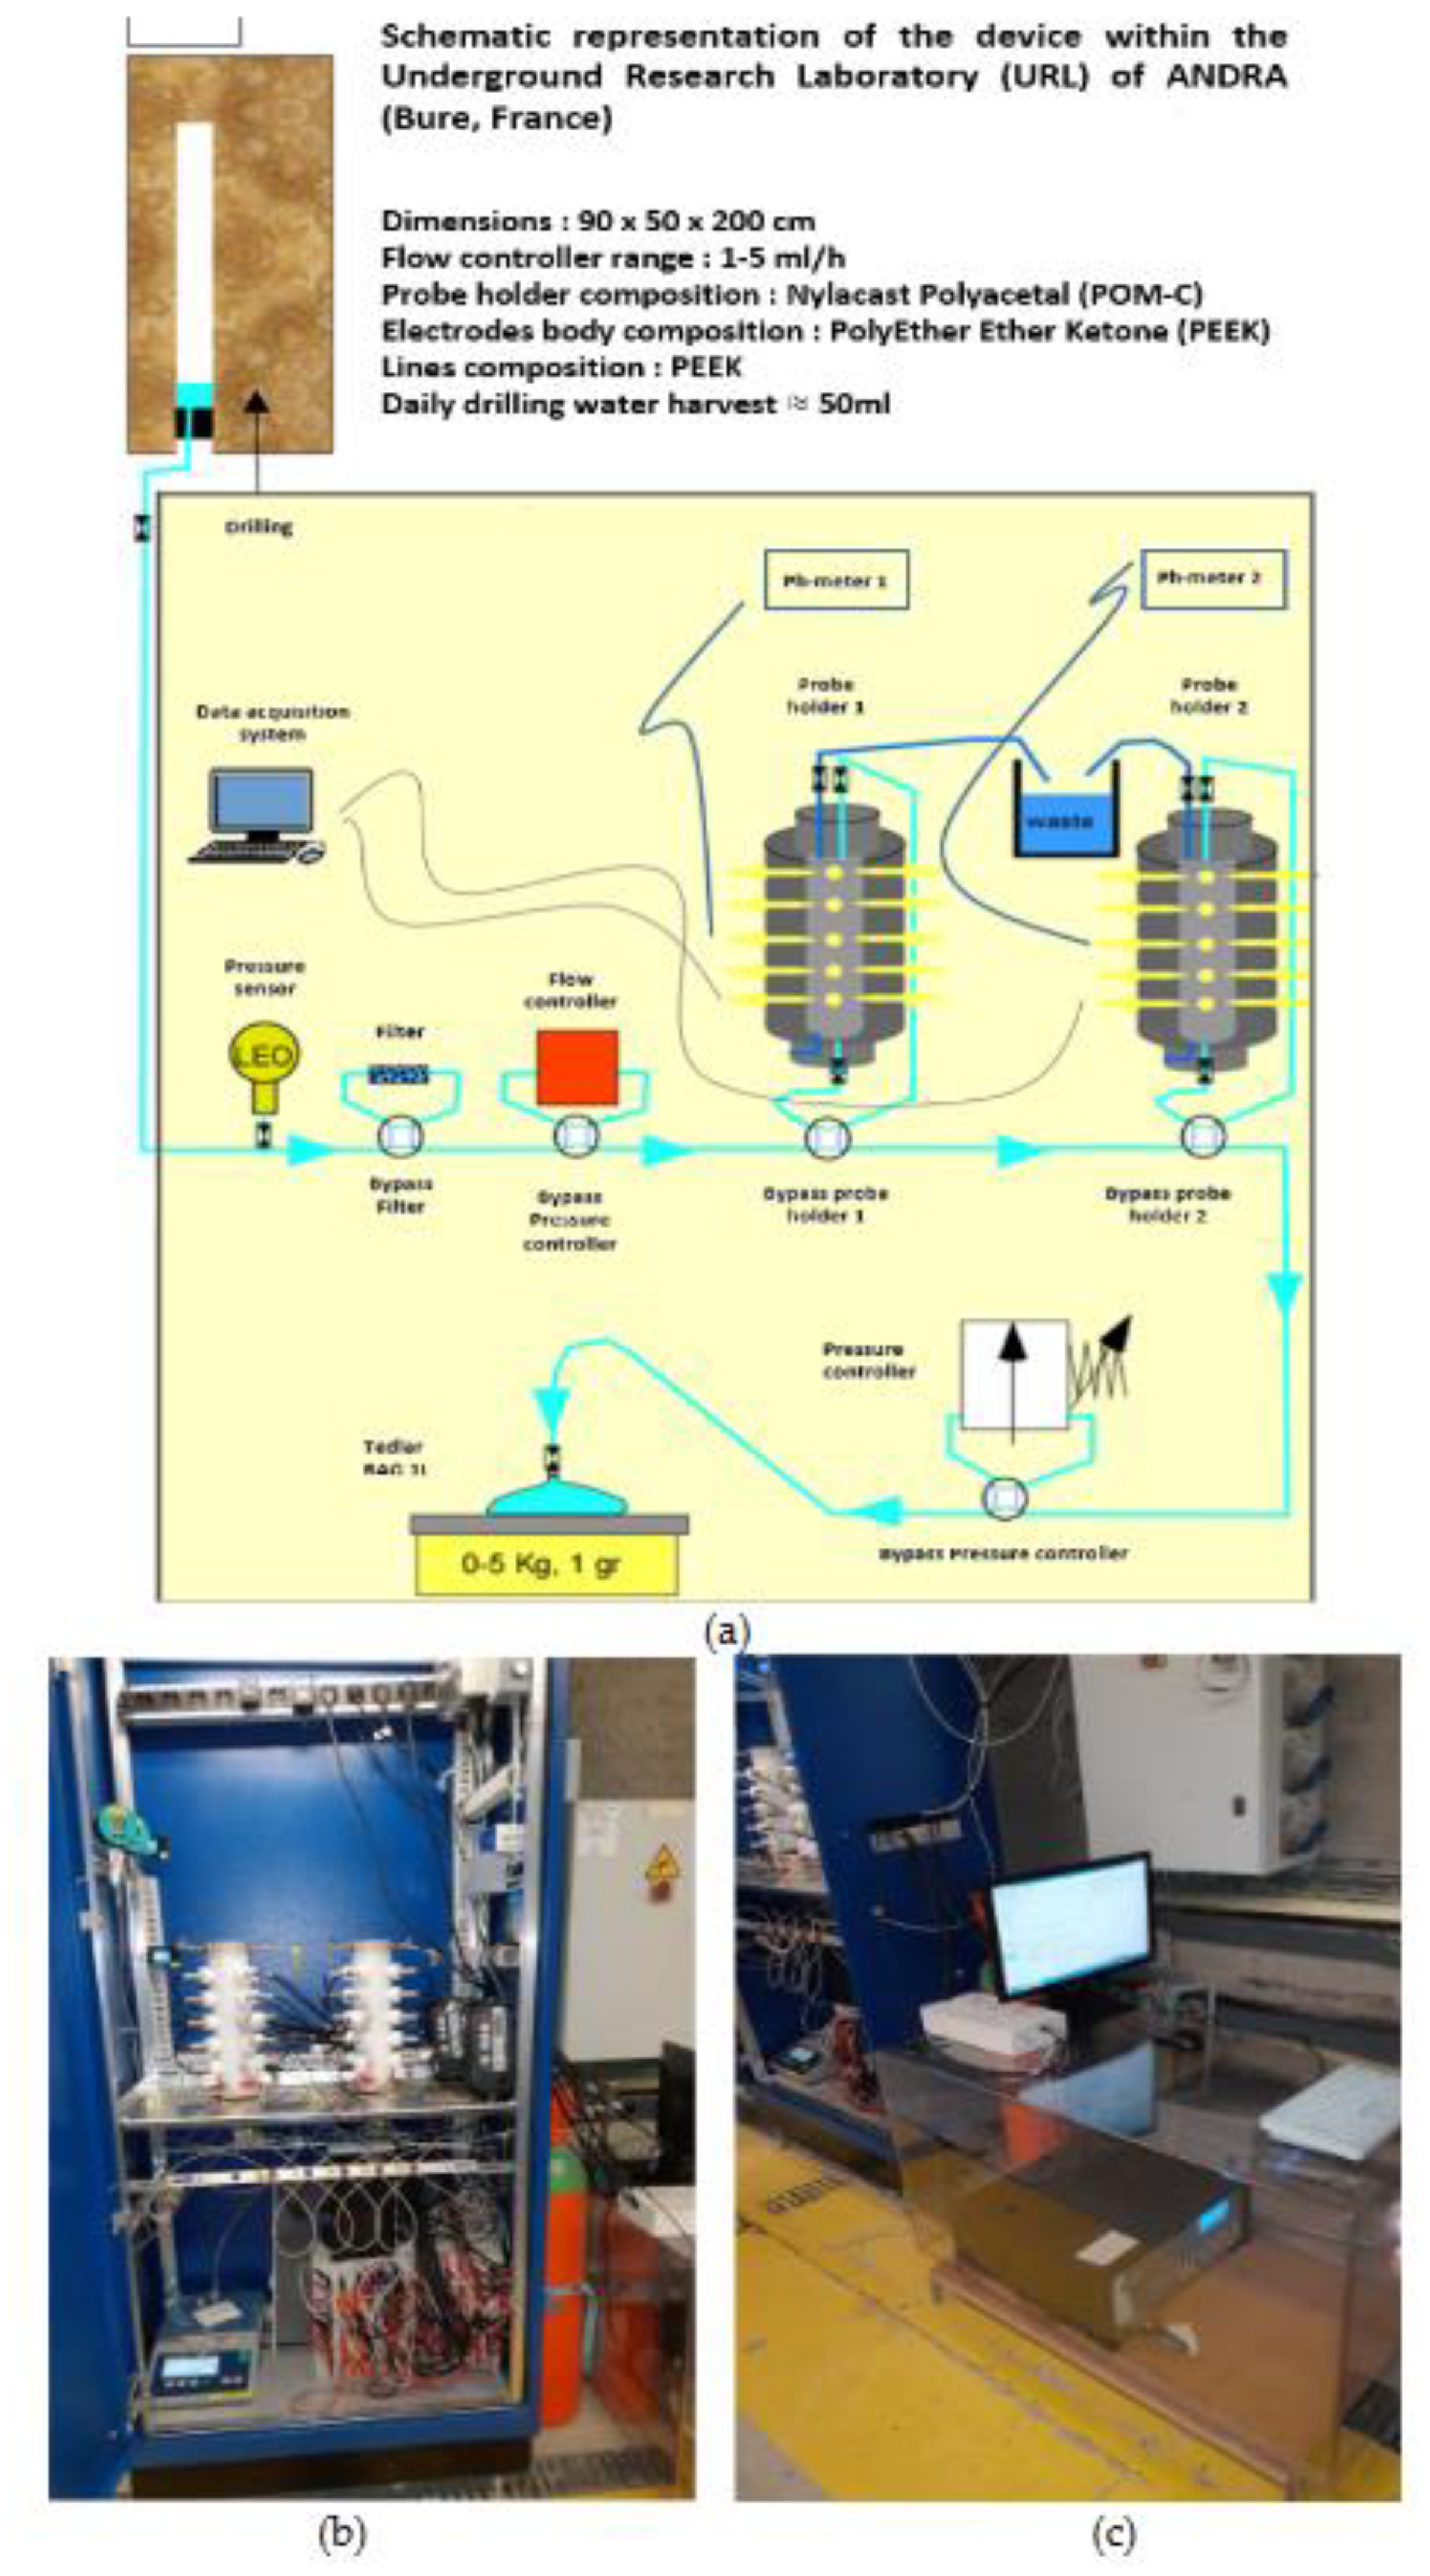
Figure 4.
(a) Two views of the same MPP-2 with an electrochemical triplet with its electrodes positioned in the same plateau (P3) at central level of the MPP-2. (b) Left: Plateau P2 with schematic representation of the doublet for monitoring of the OCP of X65free (L2P2) versus Ag/AgCl(s)4) (L4P2). Right: Plateau P3 with schematic representation of the electrochemical triplet connected to the Potentiostat-Galvanostat for corrosion monitoring.
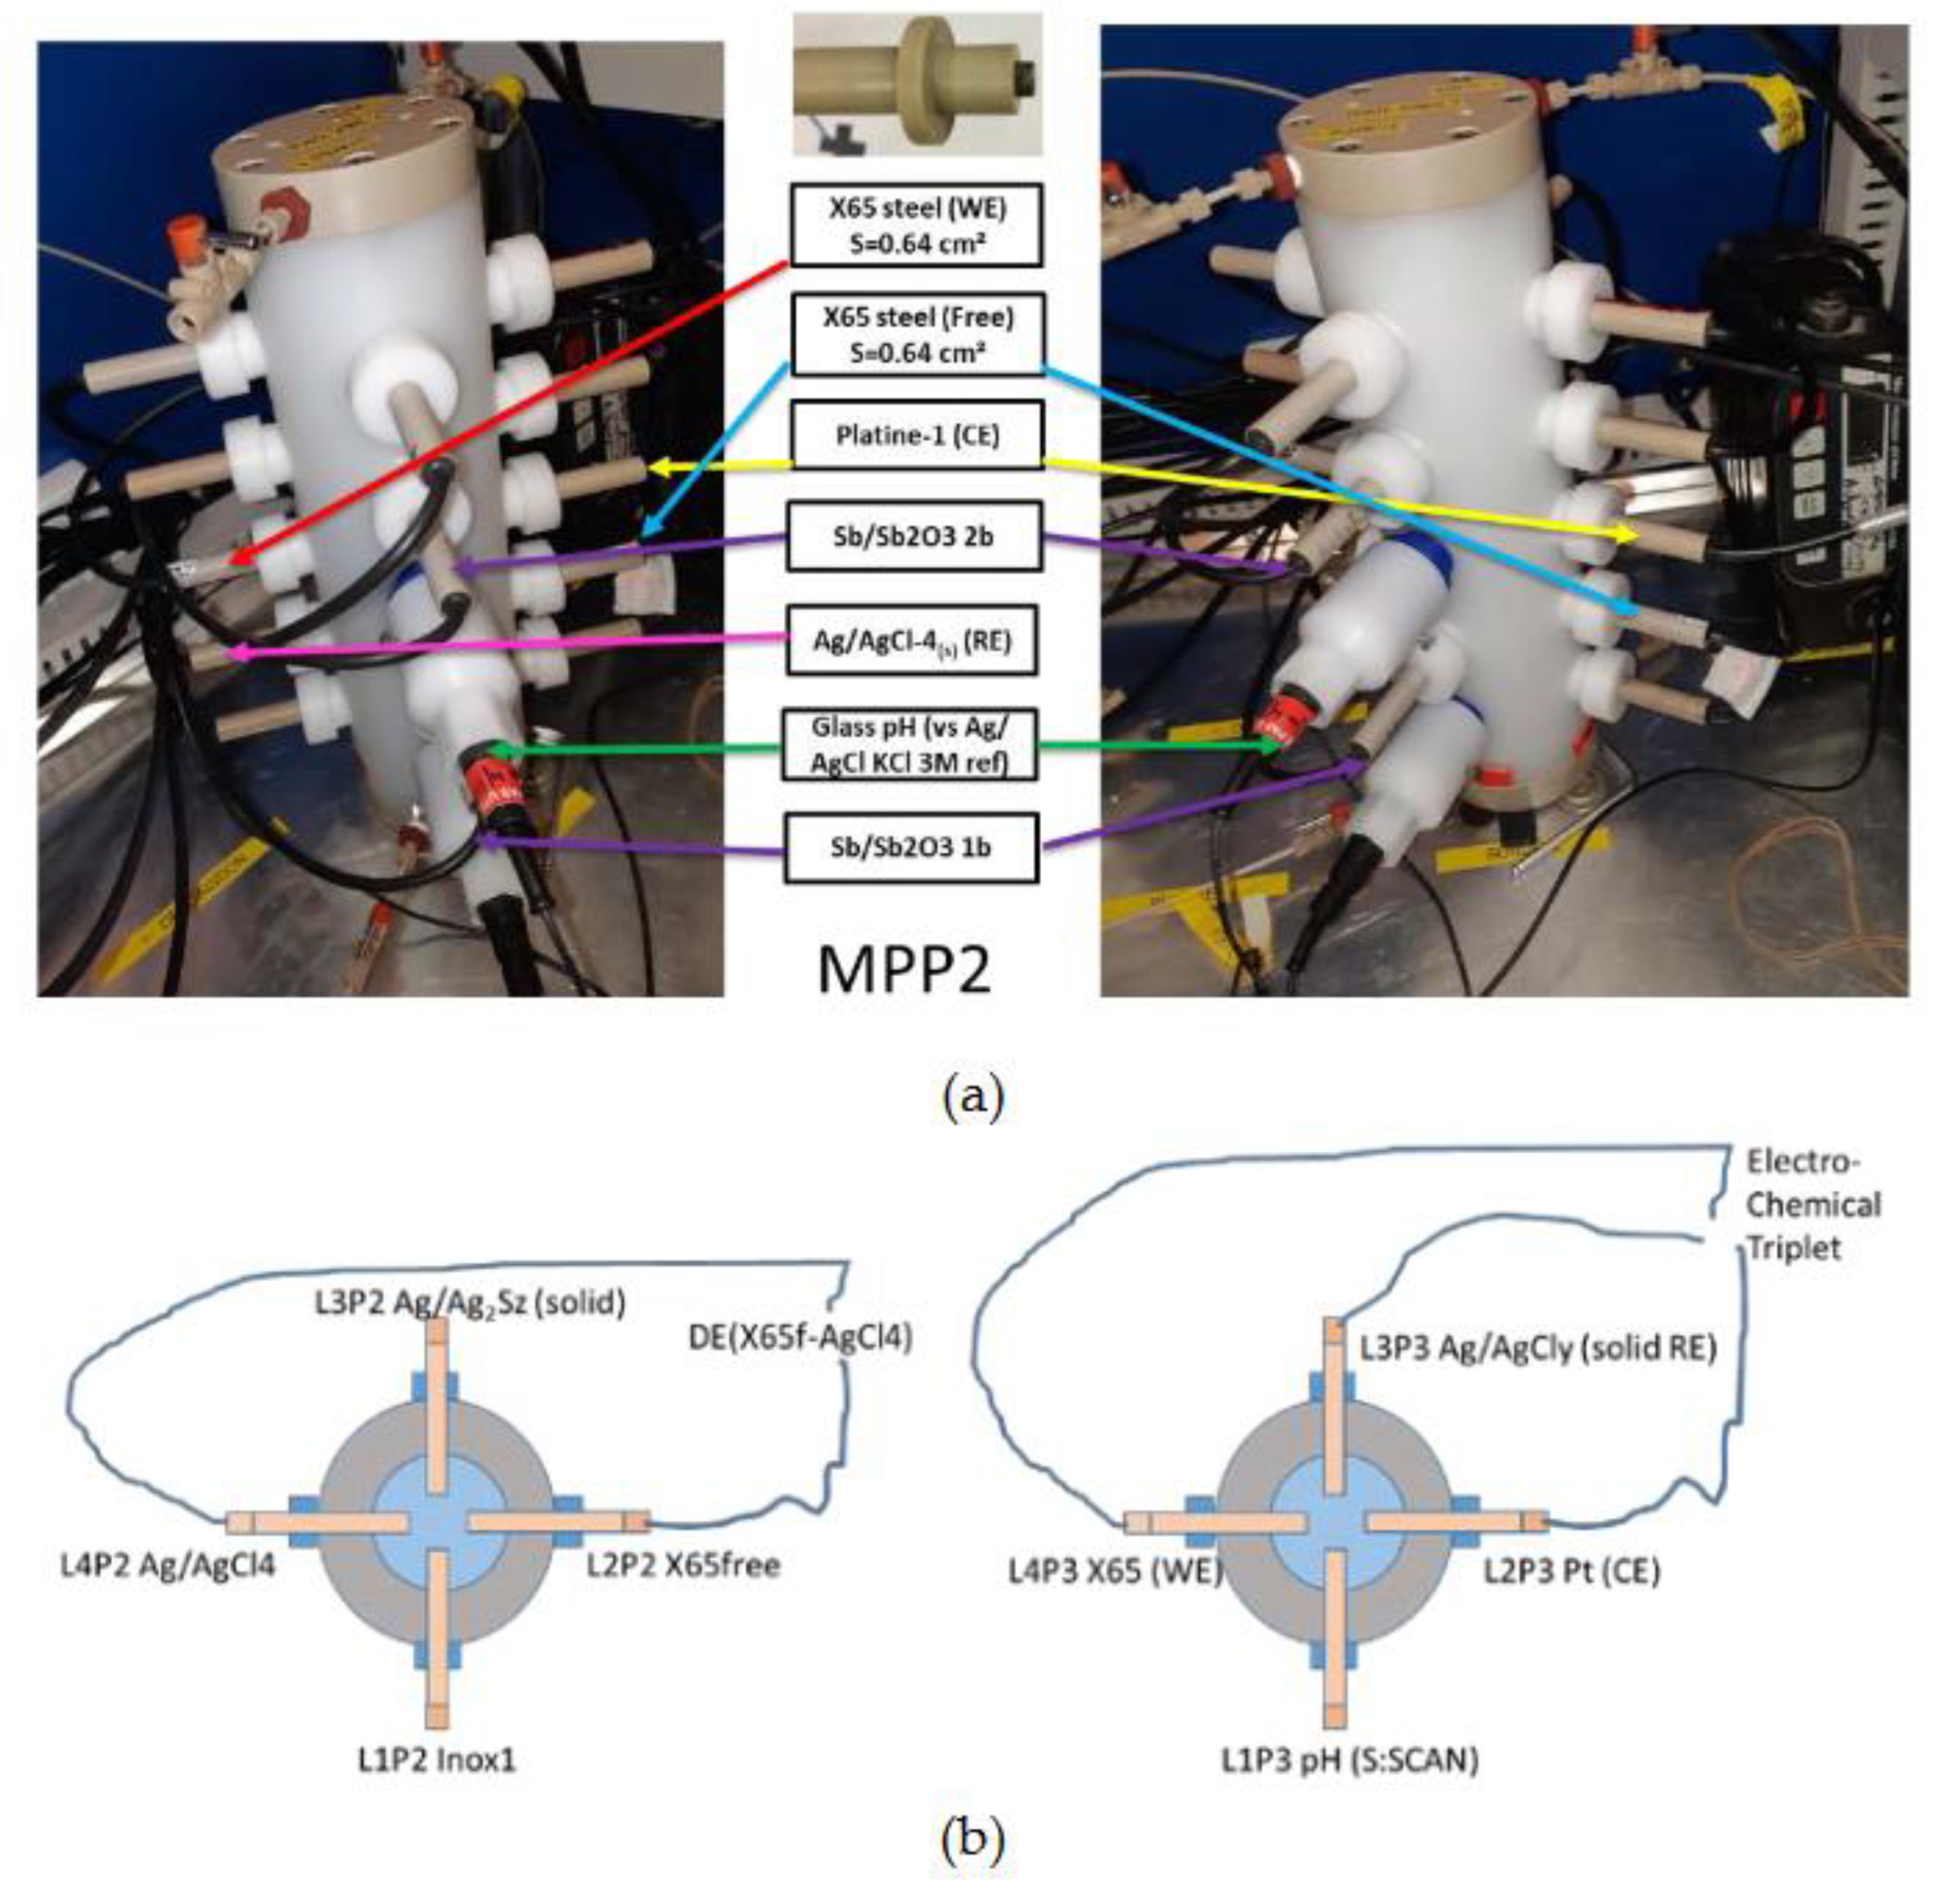
Figure 5.
Temporal variation during 180 days of the OCP (mV/SHE) of Pt, Ag/Ag2S, Sb/Sb2O3, CS-X65 free electrodes (left axis) and of the pH (right axis) resulted from the conversion of Sb/Sb2O3 potentials.
Figure 5.
Temporal variation during 180 days of the OCP (mV/SHE) of Pt, Ag/Ag2S, Sb/Sb2O3, CS-X65 free electrodes (left axis) and of the pH (right axis) resulted from the conversion of Sb/Sb2O3 potentials.
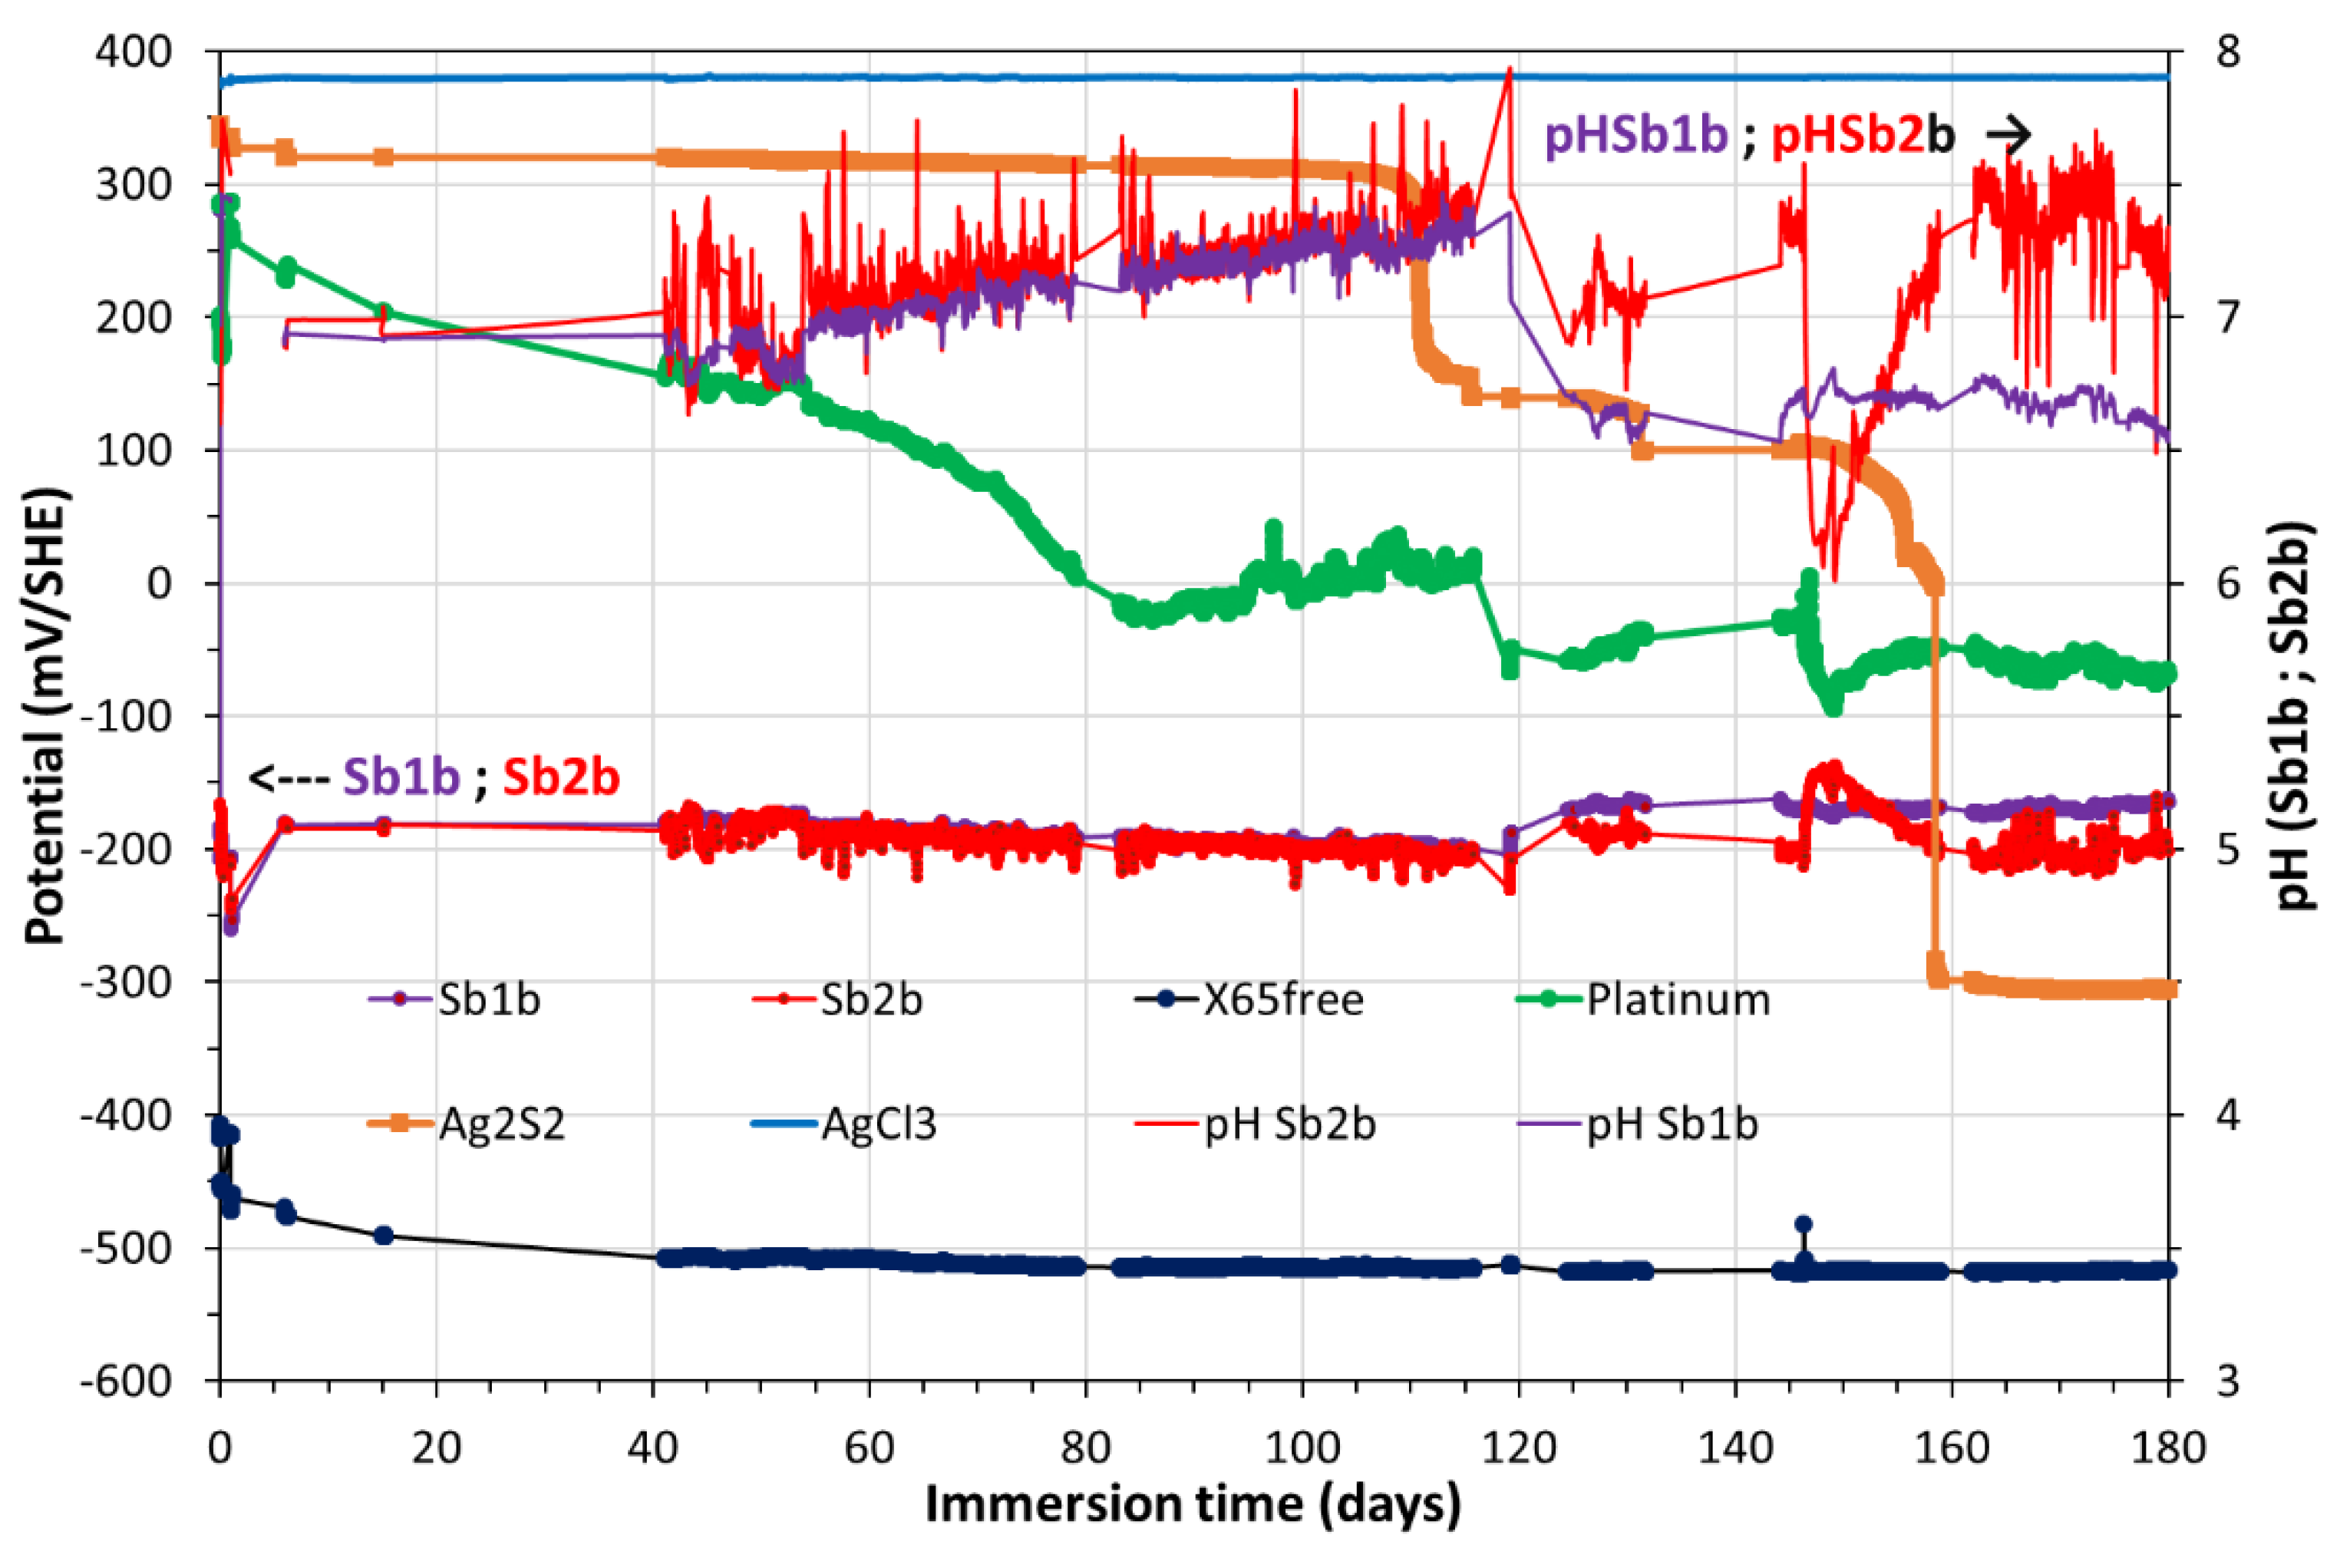
Figure 6.
Temporal variation, during 180 days, of the OCP (mV/SHE) of Pt, Ag/AgCl, Ag/Ag2S, FeS2 and IrO2 electrodes.
Figure 6.
Temporal variation, during 180 days, of the OCP (mV/SHE) of Pt, Ag/AgCl, Ag/Ag2S, FeS2 and IrO2 electrodes.
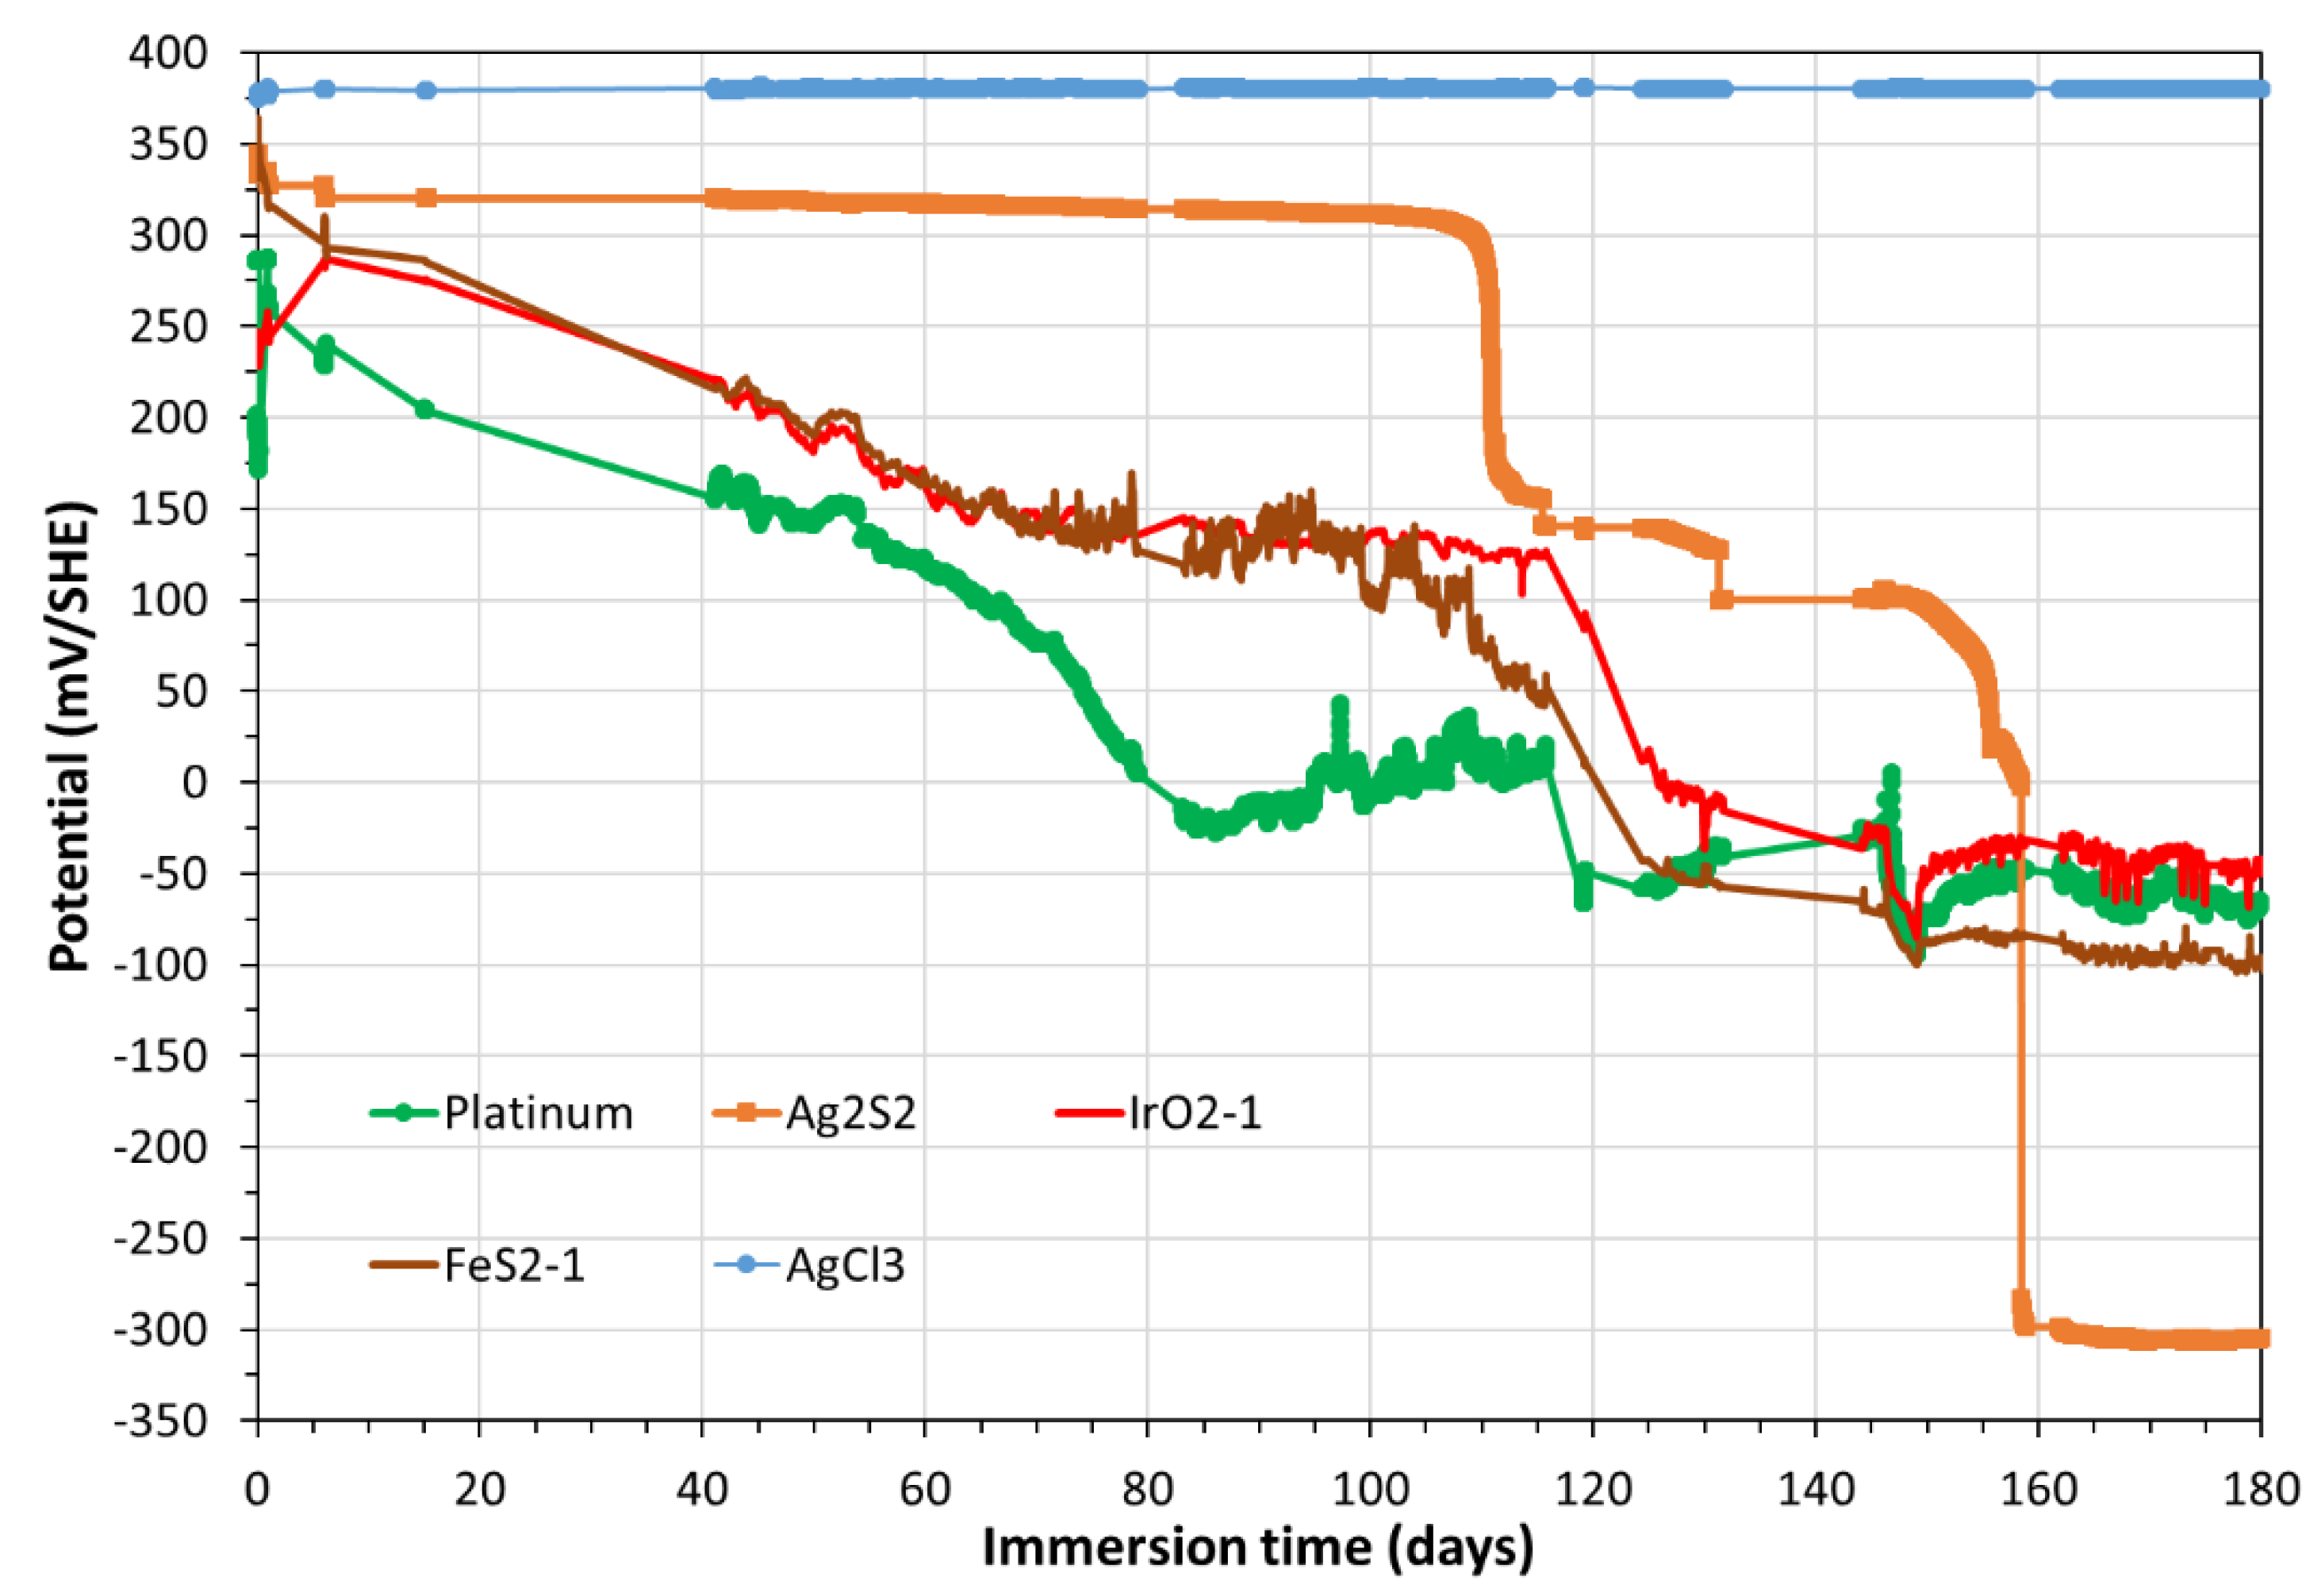
Figure 7.
Variation of Pt, Ag2S, Sb2O3, AgCl3(s) and CS-X65 free potentials versus pH during 180 days in Pourbaix type diagram. Straight line from -360 to -600 mV/SHE indicates the water lower stability limit (H+/H2) and clearly shows by the values of PtO/Pt first the micro-oxic and lastly the anoxic state of the pore water.
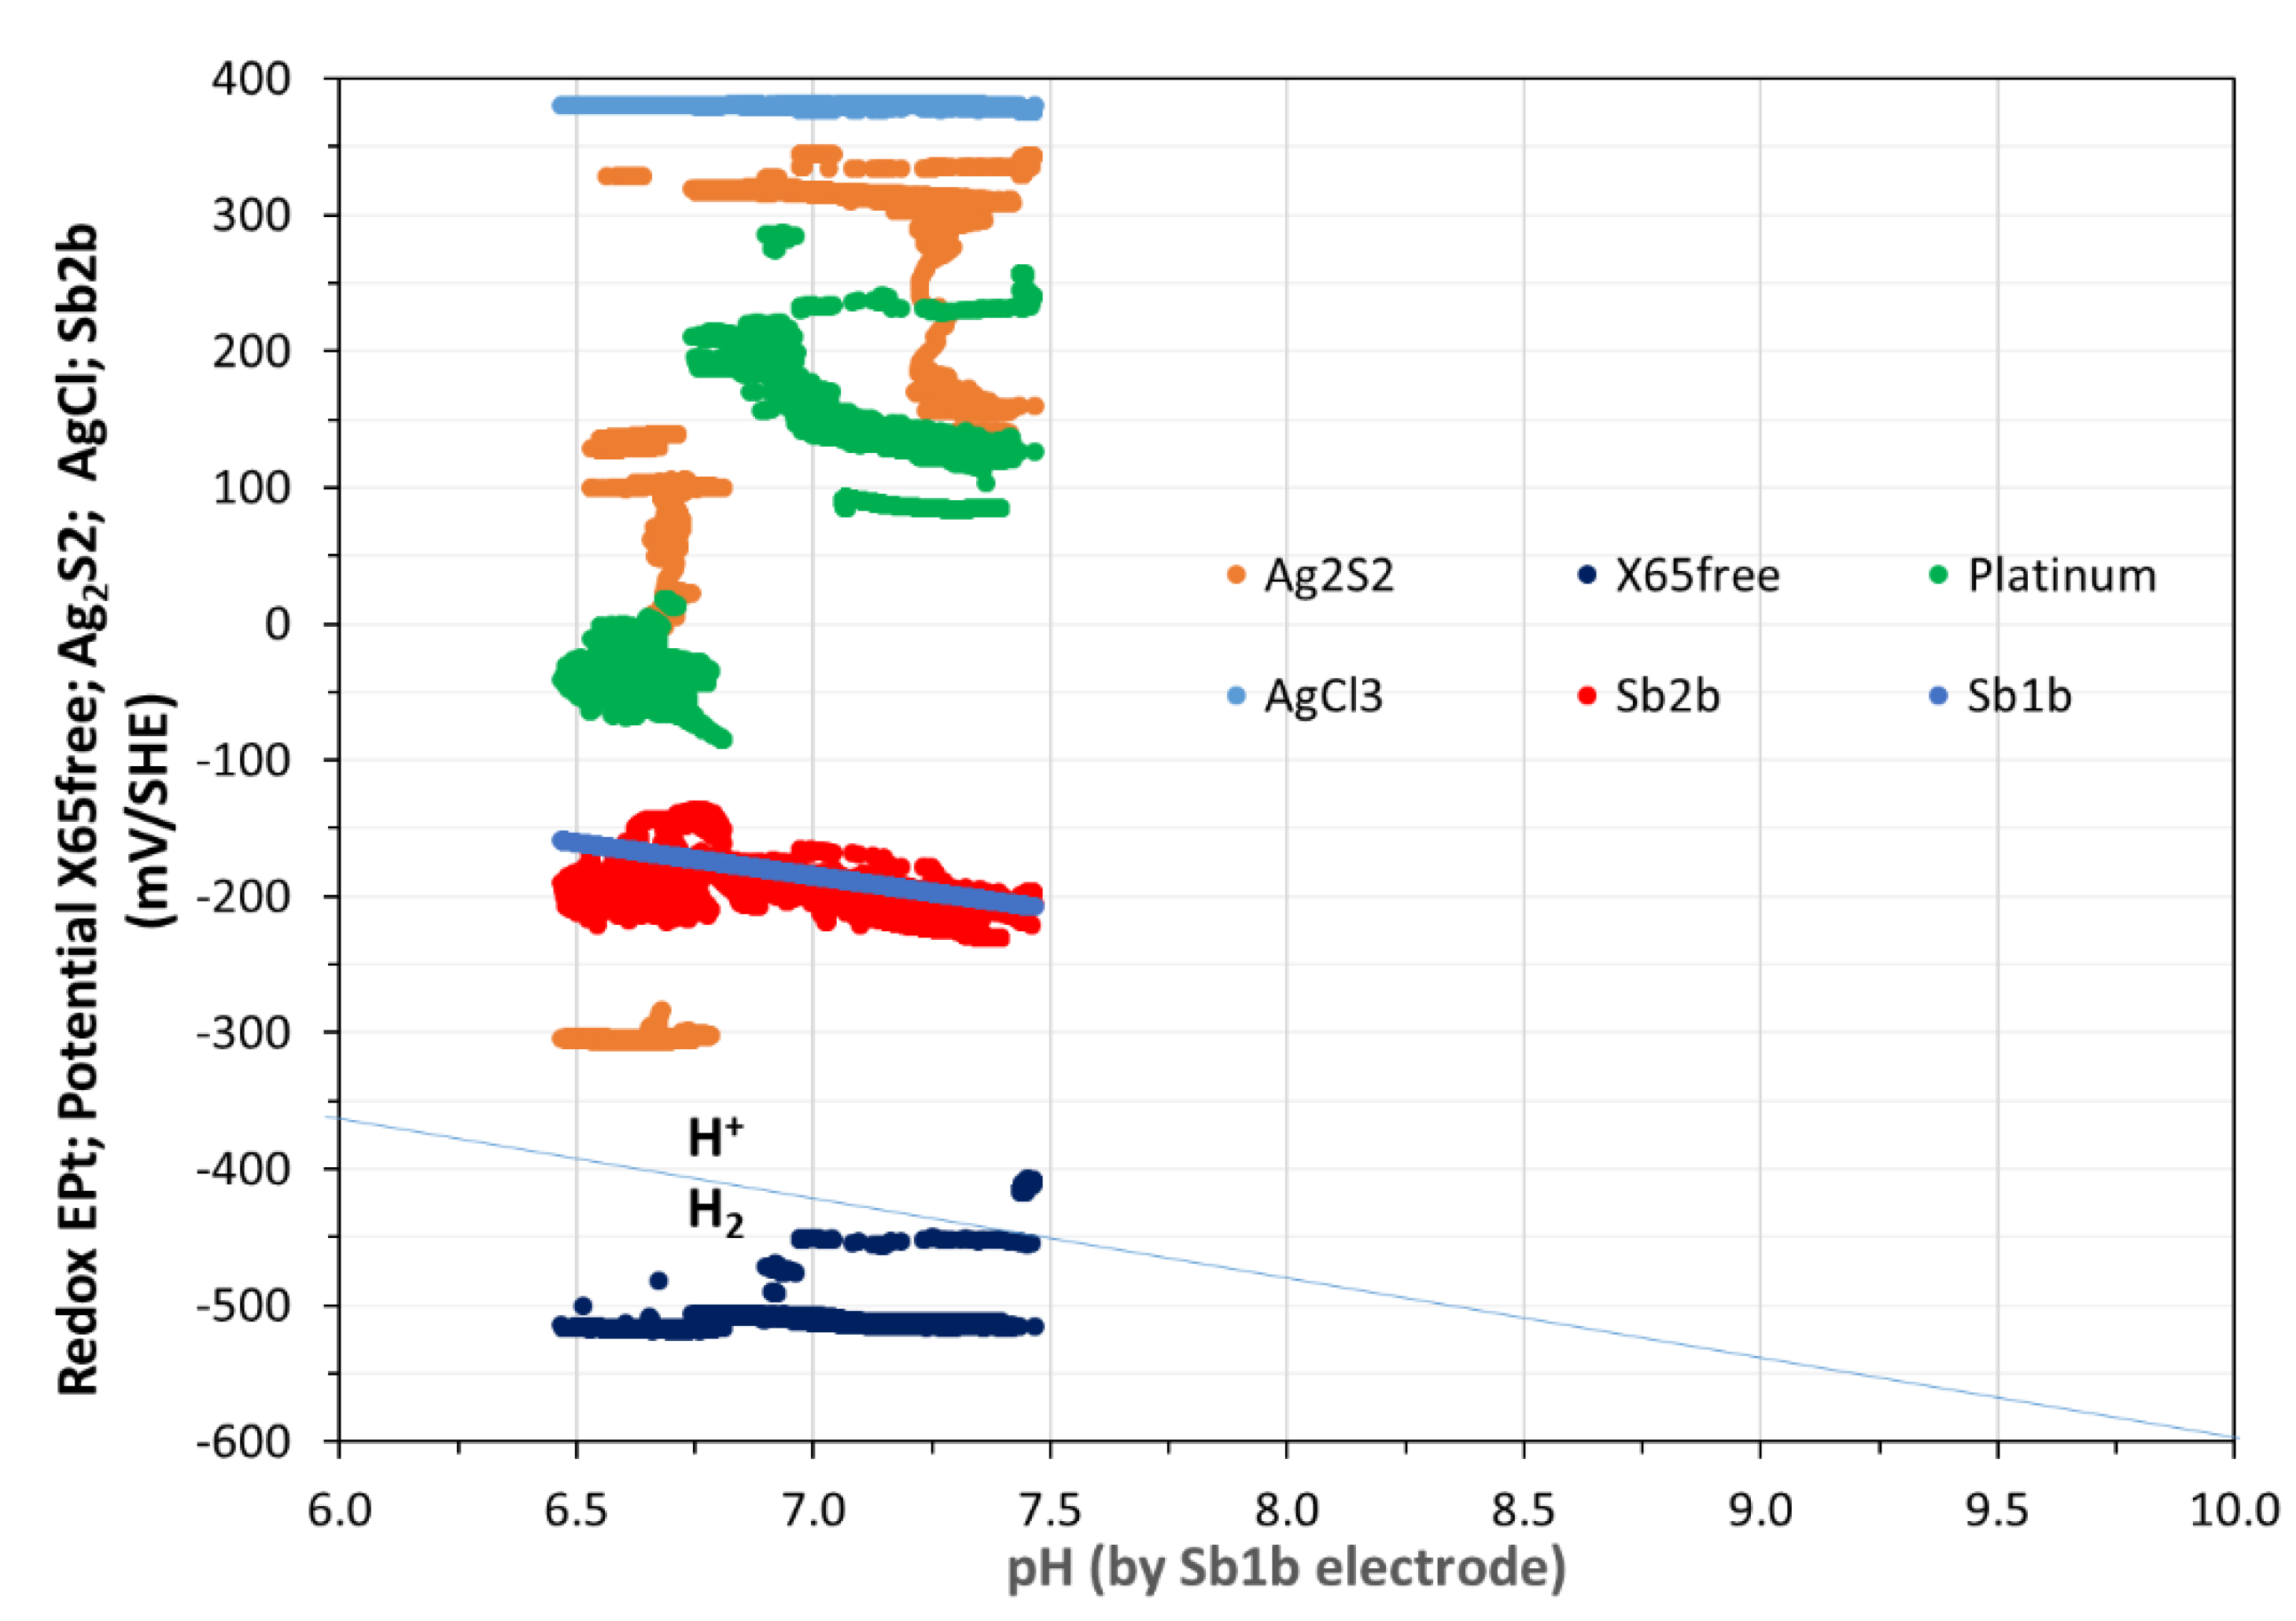
Figure 8.
Sb2O3/Sb and PtO/Pt calibration curves under AP (pO2=0.2 atm; black symbols) and in GB (pO2=10-6 atm; gray symbols) at 25°C. The variations of Pt and Sb2O3 potentials vs pH clearly show the micro-oxic and lastly anoxic state of the pore water. PtO/Pt and Sb2O3/Sb have near to Nernstian behavior. Green and red rectangles bordered the evolutions of Platinum and Sb2O3 respectively.
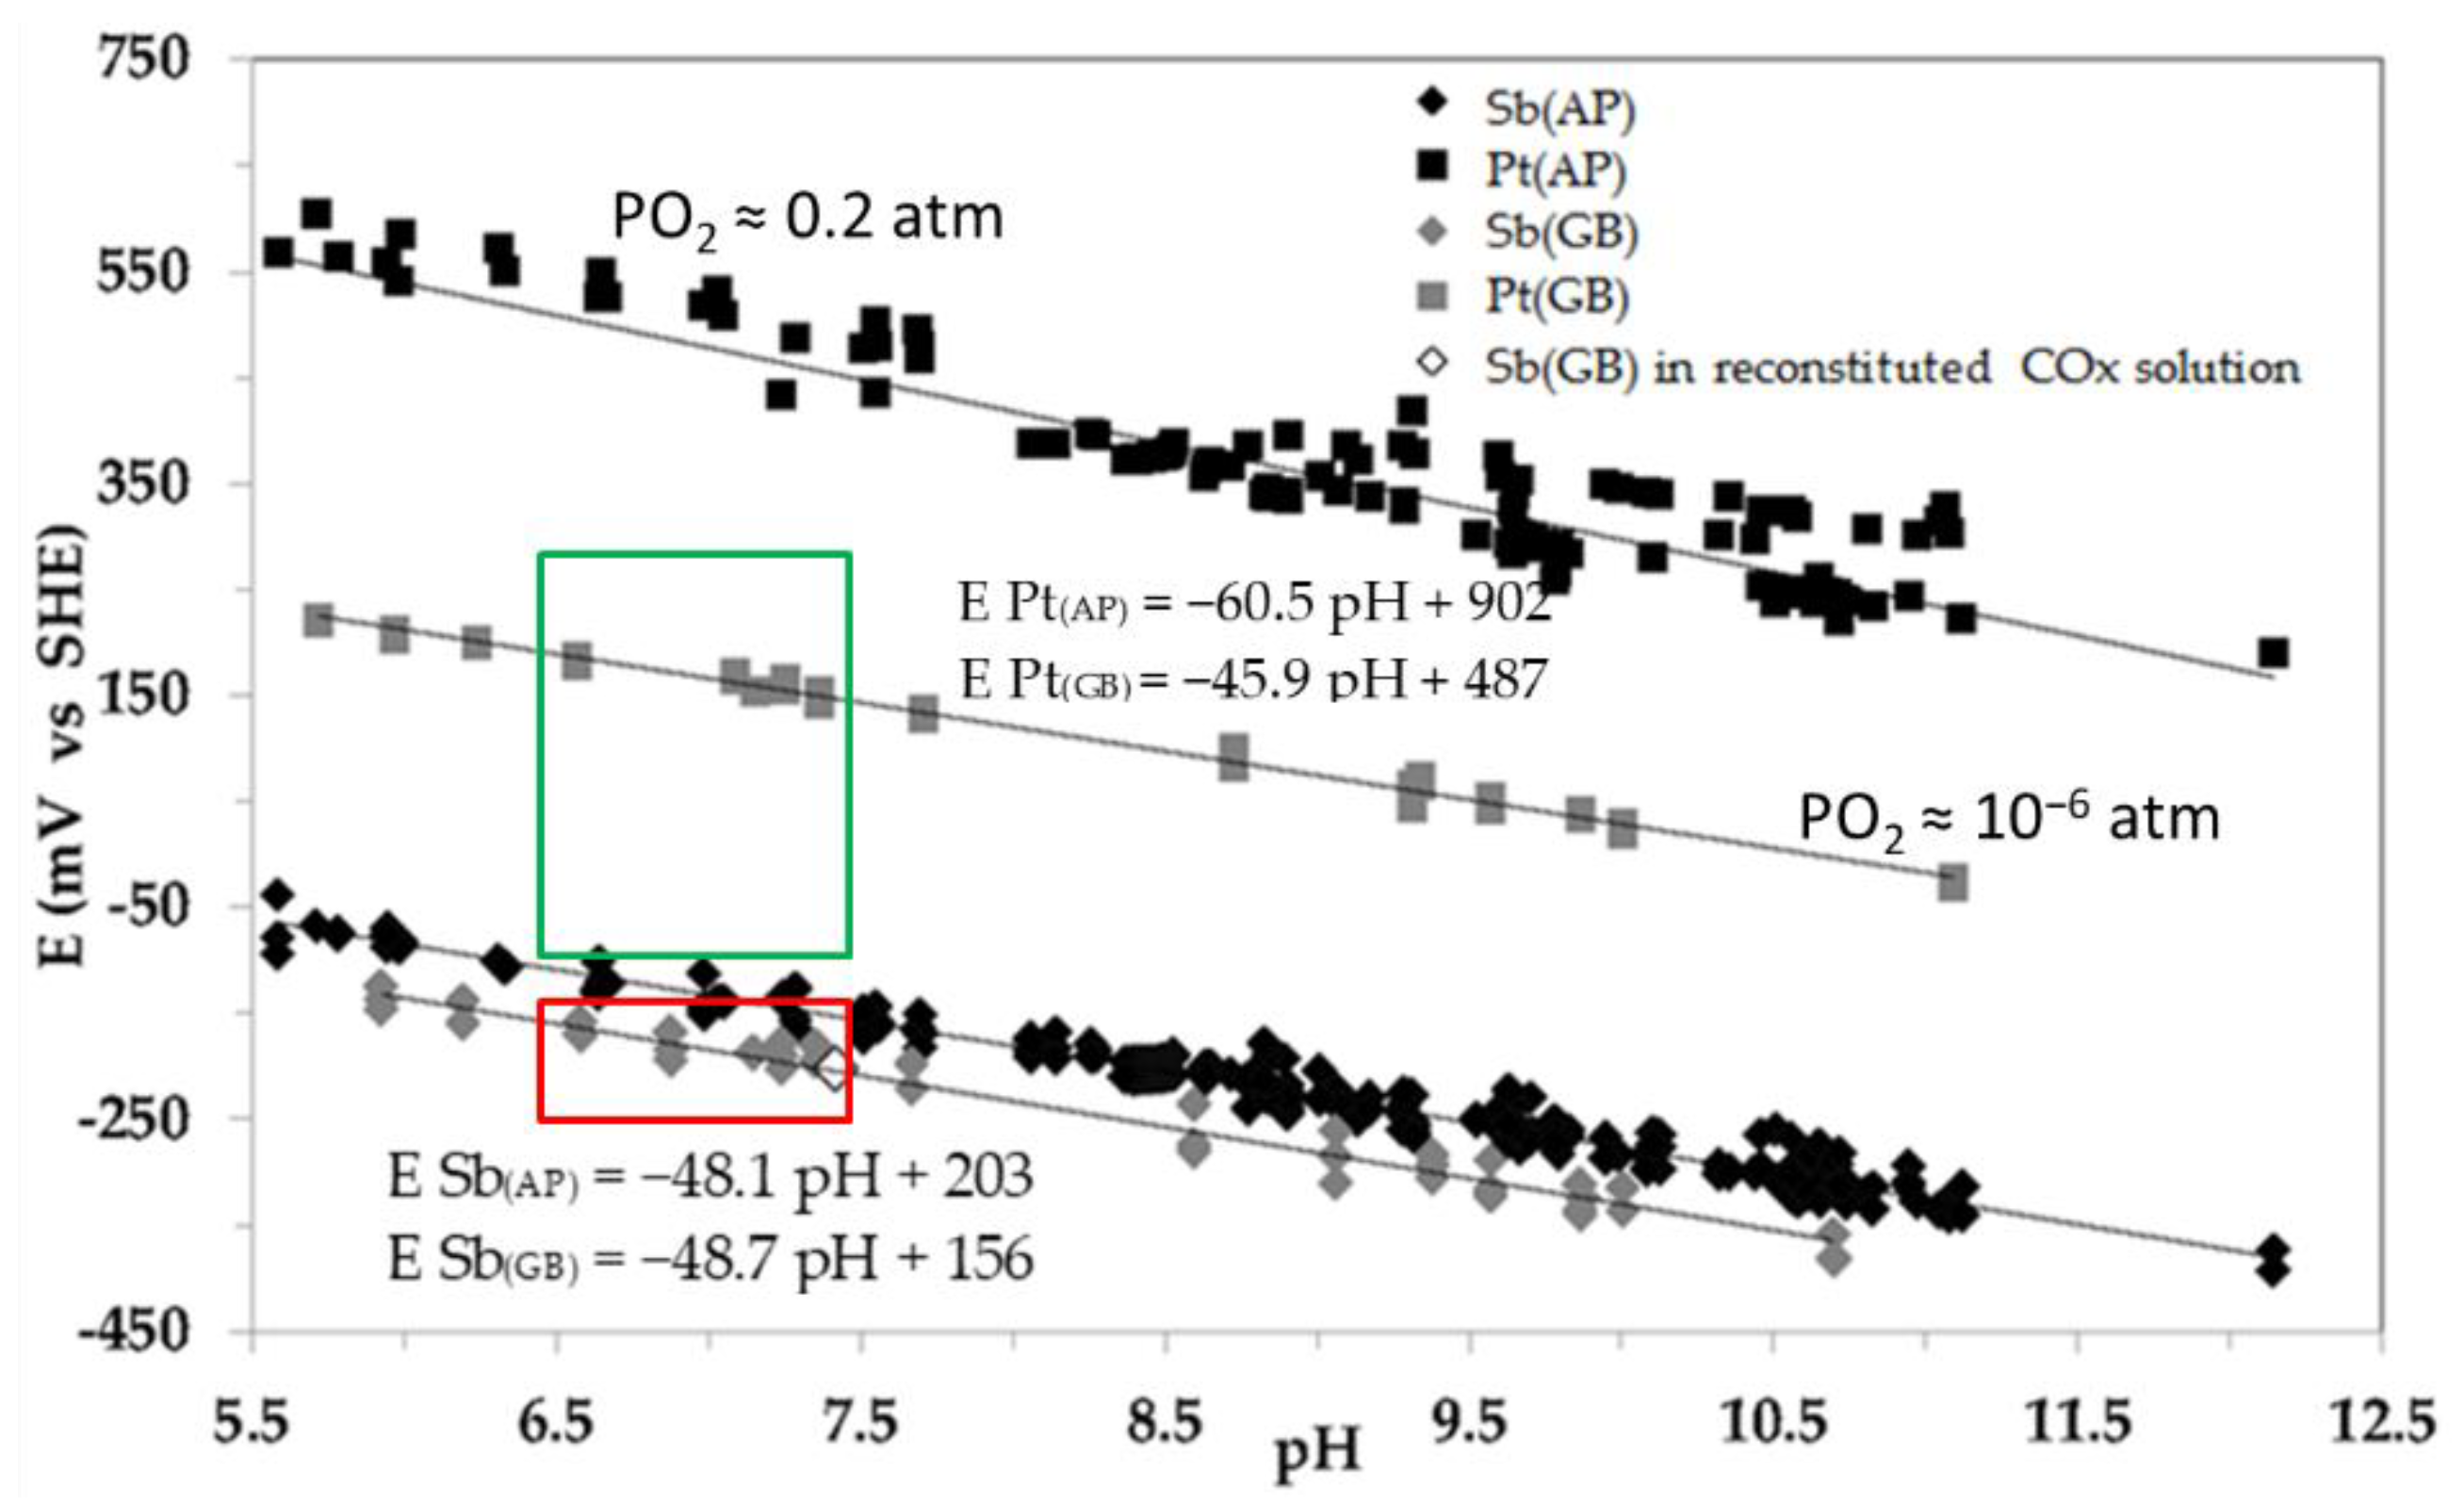
Figure 9.
Temporal variation of the OCP of CS-X65 WE electrode versus SHE during 180 days.
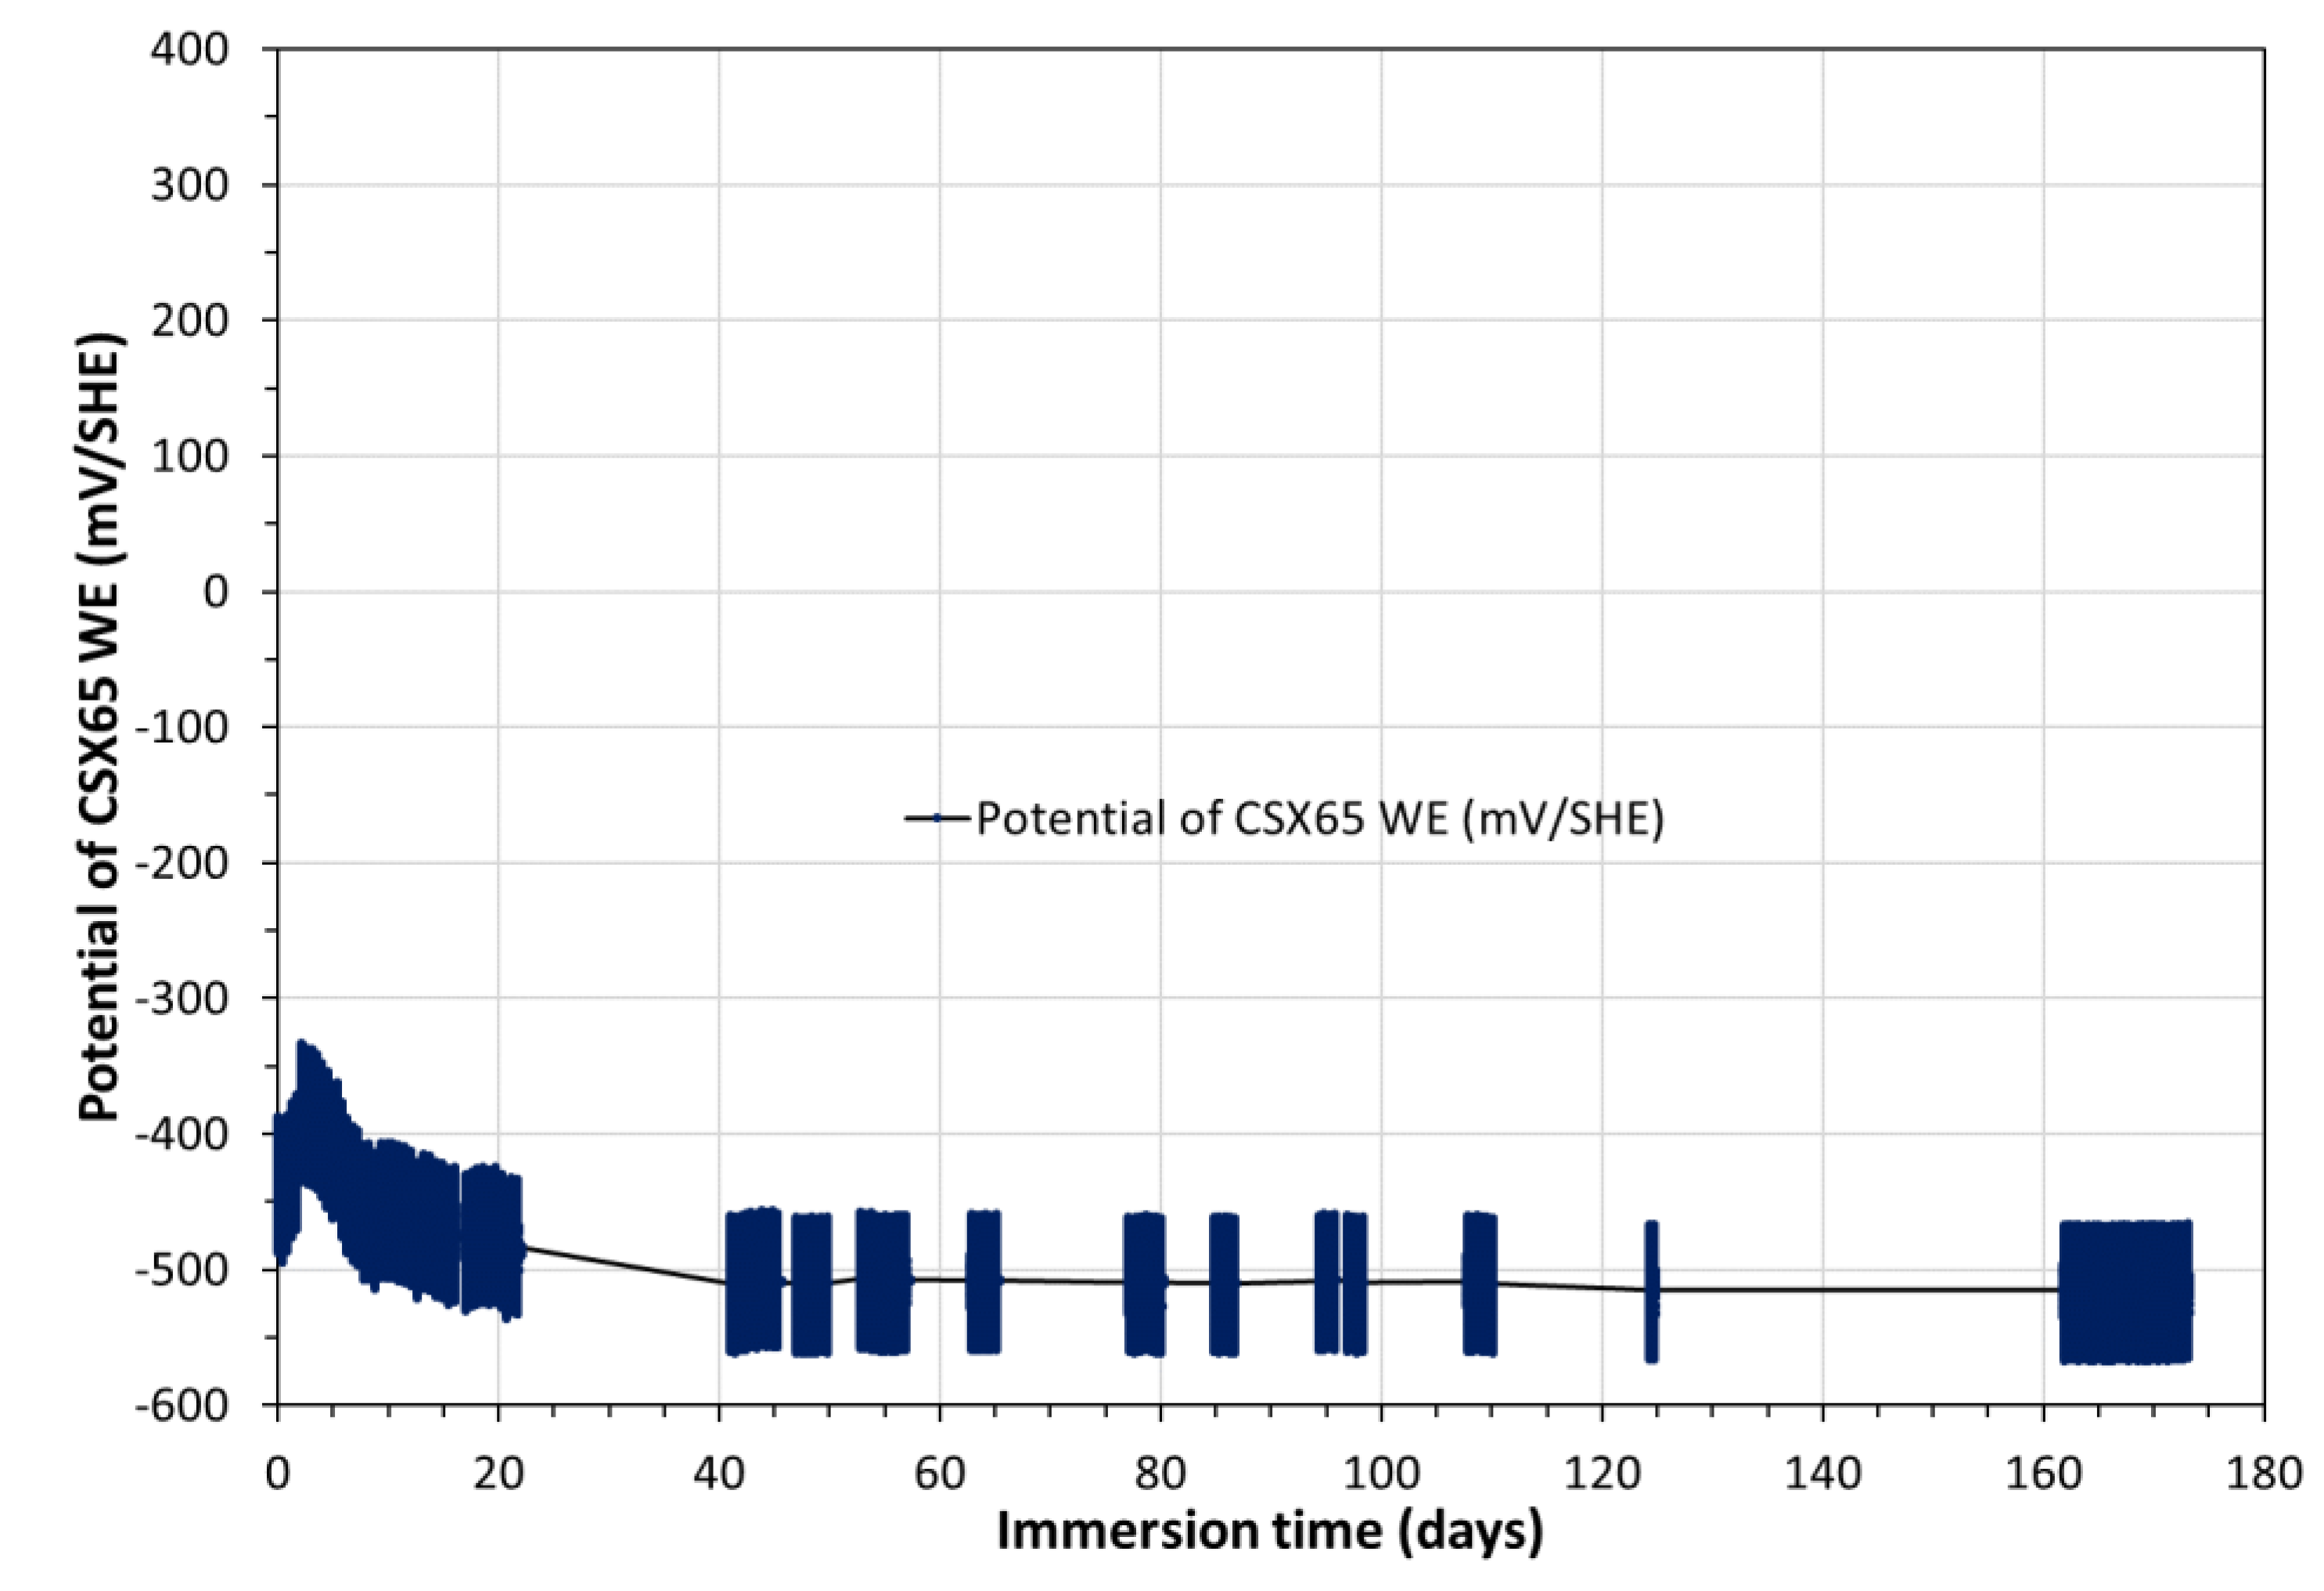
Figure 10.
Impedance diagrams in Nyquist mode, obtained from the beginning of the experiments during 180 days: a) at low frequencies; b) at high frequencies.
Figure 10.
Impedance diagrams in Nyquist mode, obtained from the beginning of the experiments during 180 days: a) at low frequencies; b) at high frequencies.
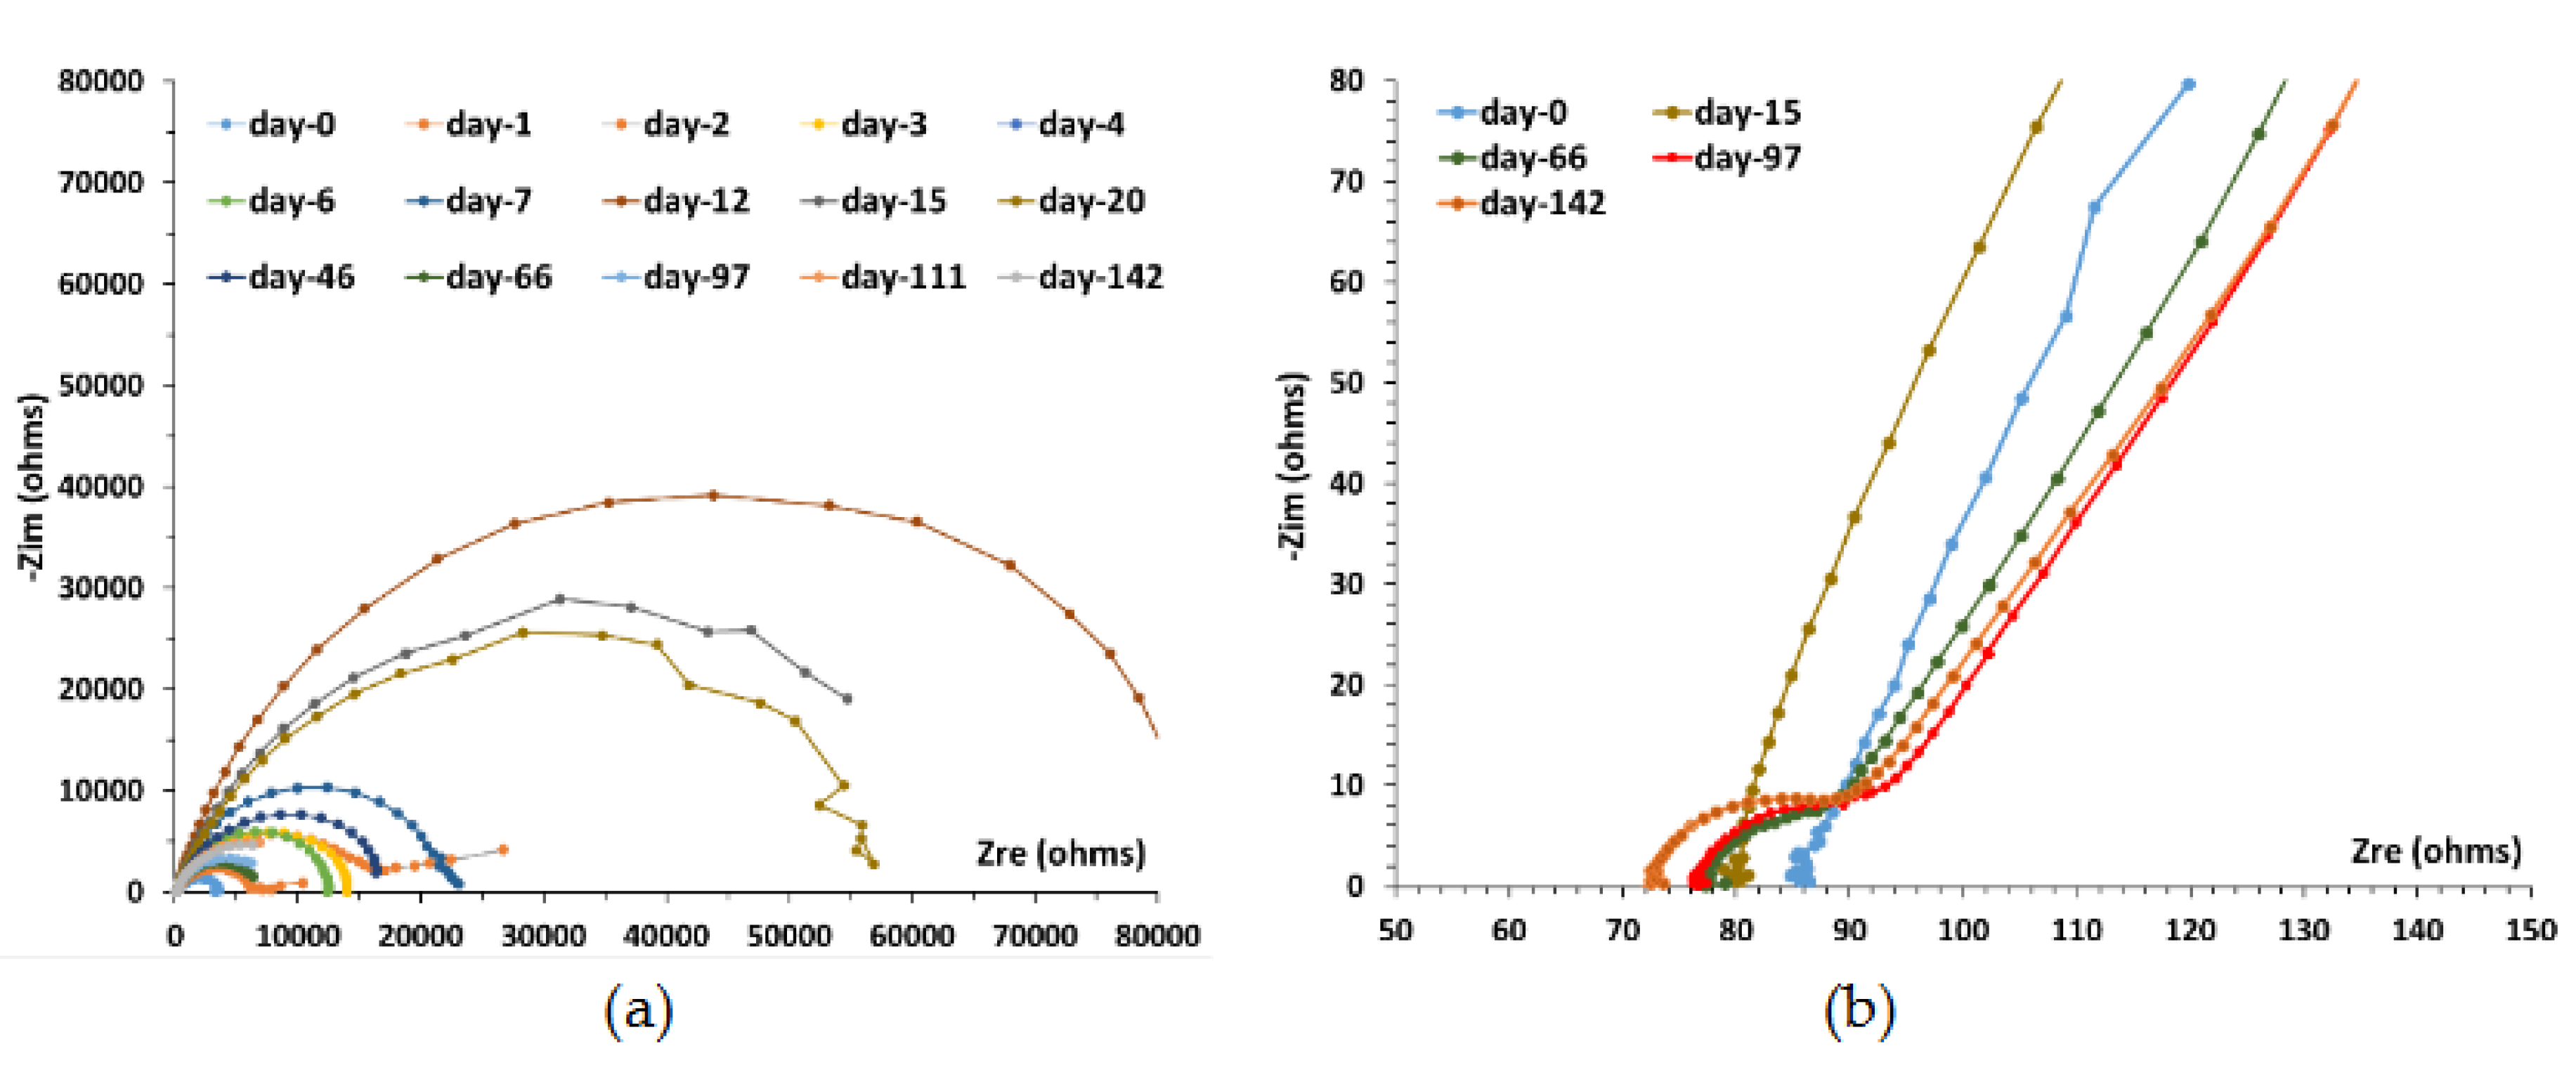
Figure 11.
Temporal variation of the values of Rp, the polarization resistance, and n, the exponent relative to the dispersive character of the interface, using model Re(Q / Rp), during 180 days.
Figure 11.
Temporal variation of the values of Rp, the polarization resistance, and n, the exponent relative to the dispersive character of the interface, using model Re(Q / Rp), during 180 days.
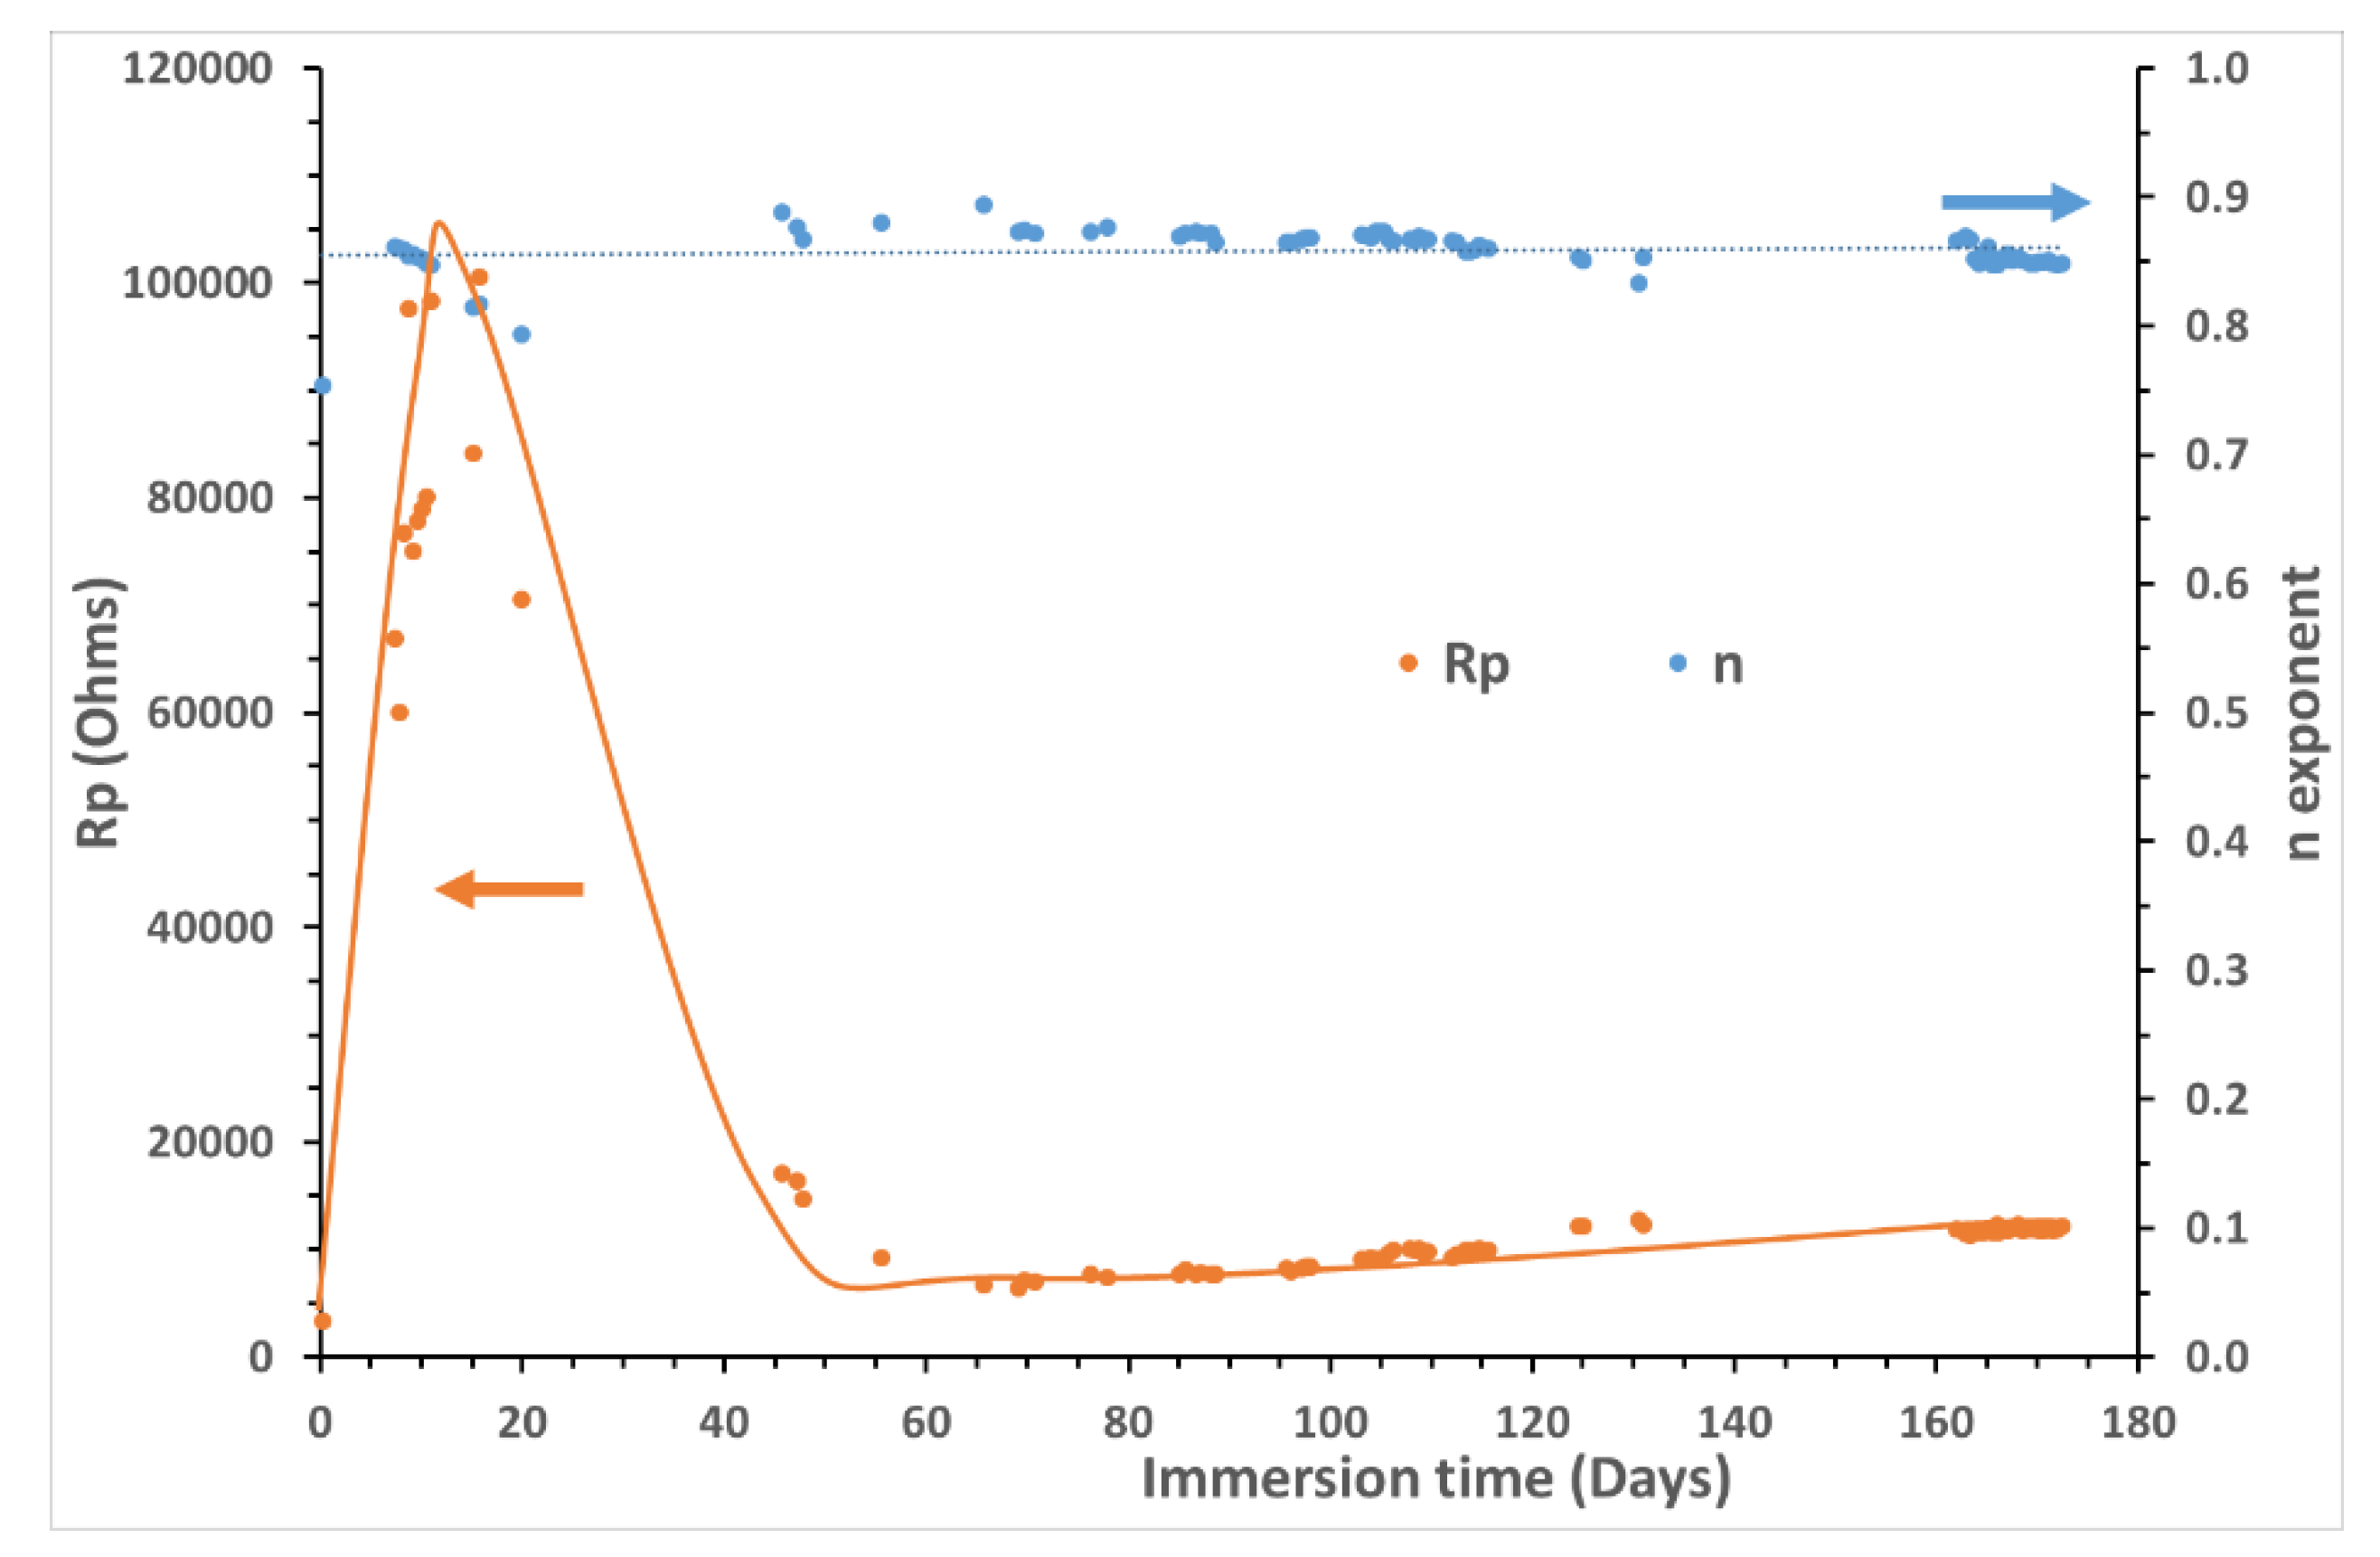
Figure 12.
Evolution of CCDs (left axis in µA/cm²) and CRs (right axis in mm/y) of X65 steel as a function of time during 180 days, determined by three different electrochemical techniques.
Figure 12.
Evolution of CCDs (left axis in µA/cm²) and CRs (right axis in mm/y) of X65 steel as a function of time during 180 days, determined by three different electrochemical techniques.
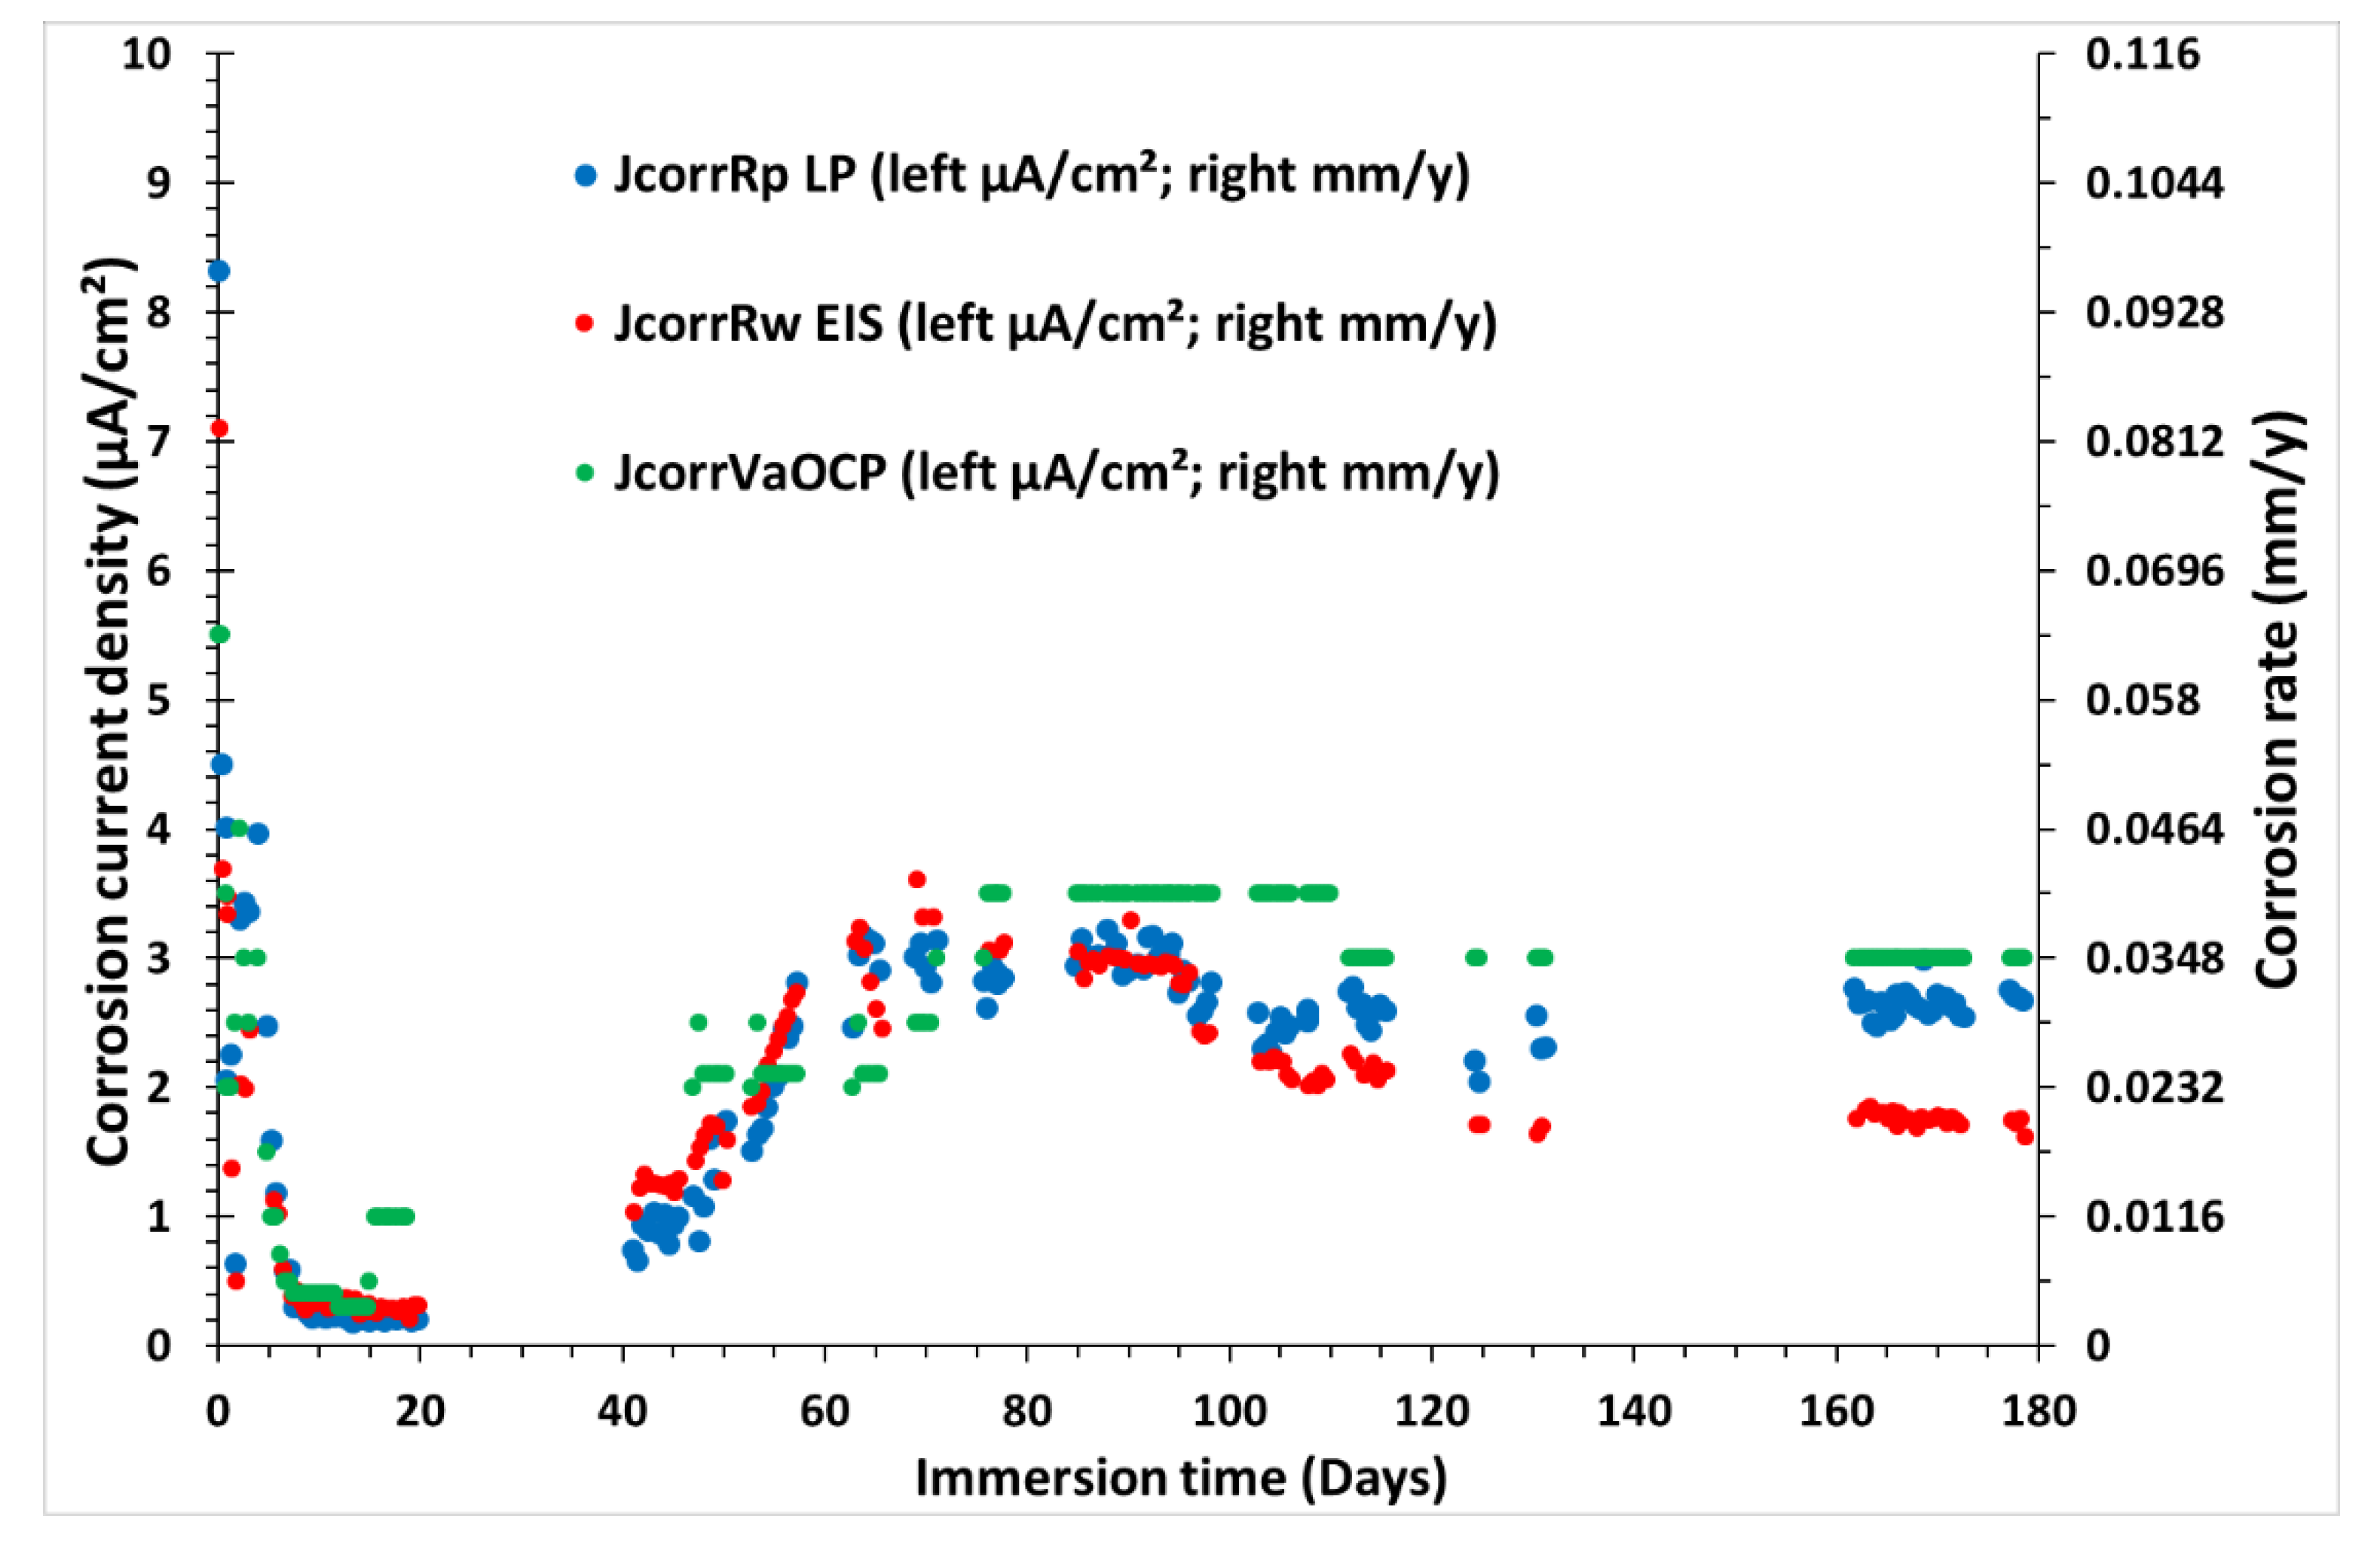
Figure 13.
Evolution of cumulated thickness loss (in mm) of CS-X65 steel as a function of time during 180 days (0.5 y), determined by three different electrochemical techniques.
Figure 13.
Evolution of cumulated thickness loss (in mm) of CS-X65 steel as a function of time during 180 days (0.5 y), determined by three different electrochemical techniques.
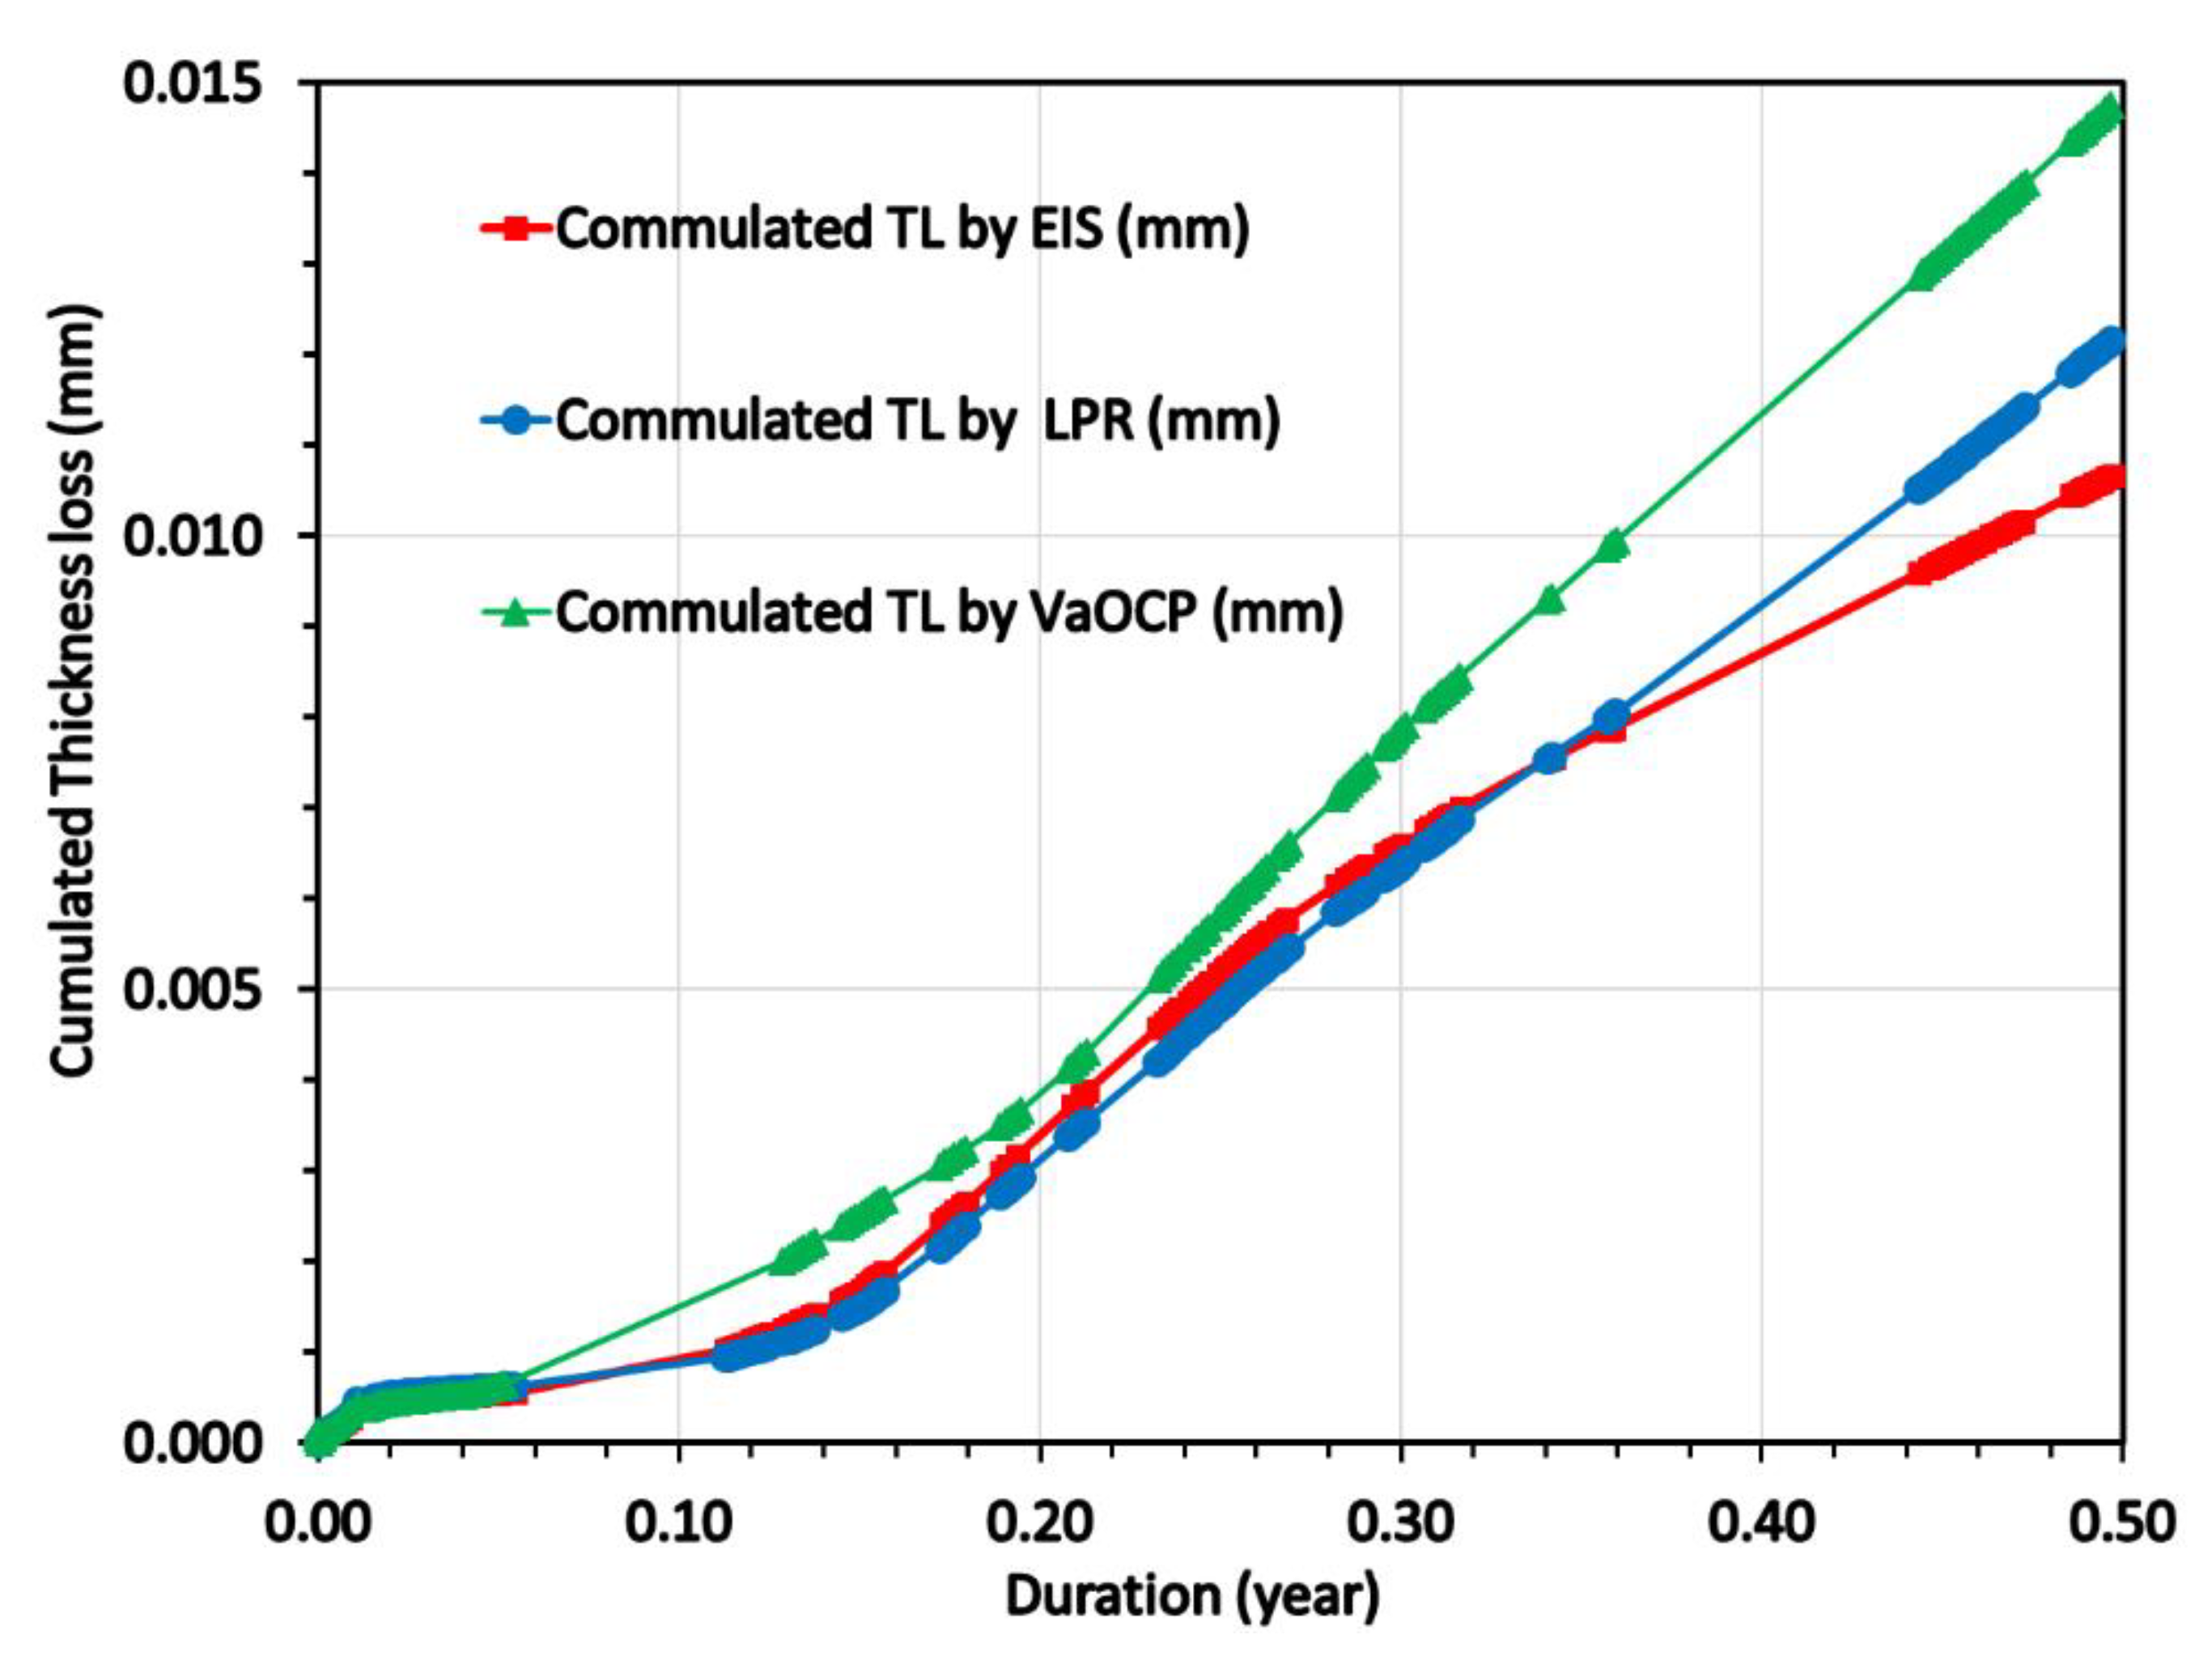

Table 1.
Carbon steel API 5L X65 chemical composition and some physical properties (* from which value the name API 65 originates).
Table 1.
Carbon steel API 5L X65 chemical composition and some physical properties (* from which value the name API 65 originates).
| Elements | Chemical composition (% mass) | Physical properties | Value | |
|---|---|---|---|---|
| C | 0.16 | Yield Strength (min. (KSI) | 65* | |
| Mn | 1.65 | Tensile Strength (min. KSI) | 77a | |
| Si | 0.45 | Yield to tensile (ratio max.) | 0.93 | |
| Ti | 0.06 | Elongation (%) | 18 | |
| P | 0.02 | |||
| S | 0.01 | |||
| V | 0.07 | |||
| Nb | 0.05 | |||
| Fe | ~97.53 | |||
Table 2.
Porewater chemistry of COx formation with major elements in mmol.L-1.
| Elements or chemistry | Concentration (mM) or Value | Elements | Concentration (mM) | ||
|---|---|---|---|---|---|
| pH | 7.35 | K | 7.07 | ||
| EH (mV vs SHE) | -180 | Ca | 14.8 | ||
| Ionic strength | 116.0 | Mg | 14.1 | ||
| C(4) | 1.29 | Sr | 1.12 | ||
| S- | 34.0 | Si | 0.0943 | ||
| Cl- | 30.1 | Fe | 0.0940 | ||
| Na | 32.0 | Al | 0.0000086 | ||
Disclaimer/Publisher’s Note: The statements, opinions and data contained in all publications are solely those of the individual author(s) and contributor(s) and not of MDPI and/or the editor(s). MDPI and/or the editor(s) disclaim responsibility for any injury to people or property resulting from any ideas, methods, instructions or products referred to in the content. |
© 2023 by the authors. Licensee MDPI, Basel, Switzerland. This article is an open access article distributed under the terms and conditions of the Creative Commons Attribution (CC BY) license (http://creativecommons.org/licenses/by/4.0/).
Copyright: This open access article is published under a Creative Commons CC BY 4.0 license, which permit the free download, distribution, and reuse, provided that the author and preprint are cited in any reuse.


