Submitted:
21 April 2023
Posted:
21 April 2023
Read the latest preprint version here
Abstract
Tiller angle (TA) is one of the most important agronomic traits which directly affected plant architecture, photosynthetic efficiency, and planting density of rice. Although many quantitative trait loci (QTL) and associated genes for tiller angle have been identified, the detection of QTL for TA still required emphasis. In this study, 238 micro-core germplasm populations were used for genome-wide association analysis (GWAS) of the tiller angle. The frequency distribution of TA was shown to be continuous in 2018 and 2019, five QTL designated as qTA1, qTA2, qTA6, qTA9, qTA12, and two QTL designated as qTA1, qTA1-1 were detected in 2018 and 2019, respectively. These QTL explained phenotypic variation ranged from 5.94% to 12.38%. Among them, qTA2 and qTA6 are new QTL for TA, and only qTA1 was detected repeatedly in two years. 253 germplasm from the 3K Rice Genome Project were used for candidate gene and haplotypes analysis, the candidate gene and haplotypes analyzed showed LOC_Os01g67770, LOC_Os02g35180 and LOC_Os09g38130 were the candidate gene of qTA1, qTA2, and qTA9, respectively. The results of this study provide insight into the genetic improvement of plant architecture in rice.
Keywords:
Rice
; GWAS
; tiller angle
; QTL
; Haplotype
Highlights
- A total of 238 micro-core germplasm populations were used for genome-wide association analysis (GWAS) of the TA.
- Rice Genome Project were used for candidate gene and haplotypes analysis, the candidate gene and haplotypes analyzed showed LOC_Os01g67770, LOC_Os02g35180 and LOC_Os09g38130 were the candidate gene of qTA1, qTA2, and qTA9, respectively.
- The results of this study provide insight into the genetic improvement of plant architecture in rice.
1. Introduction
Rice (Oryza sativa) is the staple food for more than half of the world's population and increasing rice production is crucial to ensuring global food security (Al-Tamimi et al. 2016). Rice TA is defined as the angle between the vertical line and the side tillers with maximum inclination, reflects the spreading degree of rice plant architecture, is a key agronomic trait determining rice grain yield by affecting planting density (Wang et al. 2022; Cai et al. 2023).
Human long-term cultivation practice showed that the construction of rice ideotype can significantly improve rice yield (Wang et al. 2022). TA is affected by both genetic and environmental factors. TA QTL and gene mining is the basis for genetic improvement of plant architecture in rice (Wang et al. 2018; Huang et al. 2011; Zhao et al. 2011).
Previous studies showed that TA is a complex quantitative trait, and TA-related QTL has been explored in rice via different rice genetic populations. Dozens of QTL for TA were detected over recent decades, which are mainly located on chromosomes 1, 2, 3, 5, 7, 8, 9, 11, and 12 of rice, and some major QTL, such as qTAC8, qTAC9, and qTA3 were future fine mapping (Li et al. 1999; Qian et al. 2001; MacMillan et al. 2006; Li et al. 2006; Yu et al. 2007; Jiang et al. 2007; Zhang et al. 2013; Dong et al. 2016; He et al. 2017). But regrettably, only TAC1, PROG1, TAC3 and TIG1were successively cloned by map-base cloning (Yu et al. 2007; Jiang et al. 2007; Tan et al. 2008; Jin et al. 2008; Dong et al. 2016; Zhang et al. 2019). Researchers have screened many TA mutants from different mutant libraries, and many studies on TA mutants have shown that TA also is controlled by quality genes. TA-related genes have been explored in rice via different mutant plants. Dozens of genes for TA were fine mapping over recent decades, la1, lazy1, Ostil1, tac2, lpa1, onac16-1D, fuct-1, CR-wox6 and CR-wox11, osarf17, la2, tac4 and lta1 (Takeshi et al. 2007; Li et al. 2007; Yoshihara et al. 2007; Mao et al. 2007; Fang et al. 2009; Wu et al. 2013; Sakuraba et al. 2015; Harmoko et al. 2016; Liu et al. 2016; Hu et al. 2020; Li et al. 2020; Chen et al. 2020; Li et al. 2021; Pan et al. 2022), etc. Only LAZY1, OsNAC2, LAP1, ONAC106, FucT, WOX6 and WOX11, OsARF17, LAZY2, LTA1 and LAZY3 were detected, and these genes are major genes of TA in rice (Takeshi et al. 2007; Li et al. 2007; Yoshihara et al. 2007; Fang et al. 2009; Wu et al. 2013; Sakuraba et al. 2015; Harmoko et al. 2016; Liu et al. 2016; Hu et al. 2020; Li et al. 2020; Chen et al. 2020; Li et al. 2021; Pan et al. 2022; Cai et al. 2023). Most of these cloned QTL and genes regulate TA via playing an important role in regulating gravity perception, auxin transport, or redistribution under gravity stimulation of rice shoots (Takeshi et al. 2007; Li et al. 2007; Yoshihara et al. 2007; Zhang et al. 2018; Li et al. 2019; Furutani et al. 2020; Zhao et al. 2023; Li et al. 2021; Hu et al. 2020;). Such as TAC1, TIG1, OsPIN1, LAZY1, and OsPIN2 regulate rice TA by affecting the asymmetric distribution of auxin (Yu et al. 2007; Jiang et al. 2007; Mao et al. 2007; Dong et al. 2016; Zhang et al. 2019; Hu et al. 2020; Li et al. 2021); downstream of the auxin gravity response gene, WOX6 and WOX11 can regulate TA in rice, while HSFA2D and LAZY1 regulate TA through the auxin-mediated asymmetric expression of WOX6 and WOX11 (Tan et al. 2008; Jin et al. 2008; Yoshihara et al. 2007; Zhang et al. 2018). Plant phytohormones also affected TA; there is evidence showing that gibberellin (GA) is also involved in regulating TA. OsGRF7 regulates rice plant architecture by regulating the synthesis and signaling pathways of auxin and gibberellin (Chen et al. 2020). All of these results indicated that the genetic regulation of TA is complex, the distribution of these QTL (genes) and excellent alleles of genes in germplasm is still not clear, and the application of cloned genes in production practice needs to be strengthened. Currently, GWAS is performed using core accessions with strong polymorphisms in target traits, has the advantages of extensive genetic variation, high reliability, high accuracy, and is an effective method to study TA, which provides information to analyze the natural variation and evolutionary change of TA (Wang et al. 2018; Huang et al. 2011; Zhao et al. 2011; Bai et al. 2022; Bai et al. 2022;).
In this study, GWAS was performed for TA using 238 micro-core germplasm resources, detected QTL and preliminarily analyzed candidate genes. Then, for new candidate genes, we selected 253 germplasm resources part of 3K Rice Genome Project to confirm the haplotype and the distribution of elite haplotypes of these candidate genes. A new candidate gene, qTA1, was discovered by GWAS in two consecutive years. The qPCR results indicated that cytokinin response regulator qTA1 significantly differential expression in rice stem base, TA of elite haplotype is larger. These results could help geneticists and breeders to better understand the distribution of elite haplotype. Meanwhile, this study also provides germplasm and genetic resources for the genetic improvement of TA in rice.
2. Materials and Methods
2.1. Plant Materials
238 micro-core germplasm populations divided into 6 subgroups including 51 Indica (IND), 61 Tropical Japonica (TRJ), 50 Temperate Japonica (TEJ), 39 Australasia (AUS), 30 Admixture (ADMIX), and 7 Aromatic(AROMATIC)(Zhao et al. 2011). 253 germplasm resources from 3K Rice Genome Project divided into 12 subgroups (Wang et al. 2018). Detailed information regarding these varieties, including their geographical origin, were listed in (Figure 1A,B; Supplement File. A1).
2.2. Phenotypic identification of TA
238 micro-core germplasm were planted in Liuyang, Changsha, Hunan Province in 2018 and 2019(E: 113.82, N: 28.32), seeds sowed on May 20 and seedlings transplanted on June 15 to 16; 253 germplasm resources from 3K Rice Genome Project planted in the experimental site of Liuyang in 2020, Six plants per row, one seedling per hill, with a density of 25 cm ×25 cm, and each accession was planted in 4 rows. Field management is carried out by normal field production. TA was measured at the heading stage of each germplasm (Shen et al. 2005), 5 plants were measured for each germplasm, and the average value was taken as the TA value.
2.3. GWAS for TA in rice
Population genotype data was downloaded from Rice Diversity (http://www.ricediversity.org/), A total of 34,453 SNP markers were used for GWAS (missing data > 90 %, minor allele frequency > 0.01), GWAS analysis was performed using the mixed linear model (MLM) of the association analysis software TASSEL 5.2 (Bradbury et al., 2007), with P<1×10⁻³ as the threshold. There were two or more significant SNP loci in the physical location of 200 kb, which was identified as one QTL. The highest R2 value of SNP loci in the QTL interval represents the contribution rate of the corresponding associated region (Zhao et al, 2011). Manhattan and Q-Q plots were drawn by R package CMplot.
2.4. Candidate gene screening
Referring to the Nipponbare genome annotation (https://rapdb.dna.affrc.go.jp/), 100 Kb upstream and downstream of the QTL locus were used as the candidate gene prediction interval, and the predicted genes, conserved hypothetical proteins, reducing transposons and transposons were deleted. At the same time, the relative expression levels of plant expression tissues and plant endogenous hormones in the functional candidate genes in the QTL interval predicted by the rice expression profile database (https://ricexpro) were used to select genes with relatively higher expression levels as candidate genes. the gene with the most significant hit within a local LD block constructed around the QTL was screened as the candidate gene (Shin et al., 2005). The R package ‘LDheatmap’ was used to draw the heatmap of pairwise LDs. All non-synonymous mutation SNPs in the 2Kb promoter region, exons, introns and downstream 1Kb promoter region of the gene were selected by using the comprehensive database of rice genomic variation and functional annotation (http://ricevarmap.ncpgr.cn/) published by Huazhong Agricultural University. SNP loci with primary allele frequency (Primary Allele Frequency)>80% and deletion rate (DEL Frequency)>8% were screened, high-density association and gene-based haplotype analyses were carried out to detect candidate genes of QTL for TA by using 253 accessions from 3K RGB germplasm. Haplotypes of each candidate gene carried by at least 15 accessions were used for multiple comparisons (Zhao et al. 2011). Duncan’s multiple comparison tests (5% significance level) followed by one-way ANOVA were completed with SPSS 25.
2.5. RNA extraction and expression analysis
To verify whether the detected QTL-related genes affect the TA. Total RNAs were isolated from stem base of rice at the tillering stage bases using a TRIzol kit (Invitrogen) according to the user’s manual. Total RNA was treated with DNase I and used to synthesize cDNA with the HiScript reverse transcriptase System. Quantitative reverse transcription qPCR was implemented with SsoFast EvaGreen Supermix Kit (Bio-Rad) on the CFX96 Real-time system (Bio-Rad) following the manufacturer’s instructions. Rice OsActin gene (LOC_Os03g50885) was used as the internal reference gene and gene specific primers are listed in (Supplement table A1). The 2-△△ct method was used to calibrate relative expression levels of target genes with the reference gene (Livak et al. 2001).
3. Results
3.1. Phenotypic variation in TA among 238 micro-core germplasm populations
There were large variations in TA throughout the population in 2018 and 2019. The TA ranges from 9.63 ° to 55.66 ° in 2018 and 14.59 ° to 47.76 ° in 2019, with an average of 27.86 ° and 25.82 °, the coefficient of variation (CV) was 24.23 % and 25.43 %, respectively. The absolute values of population skewness were 0.86 and 0.85, and the kurtosis was 1.42 and 0.67, respectively (Supplement Table A2), which indicated the frequency distribution of TA showed an approximately normal distribution (Figure 2A,B). Correlation analysis showed that TA was significantly positive correlated in two years, and the correlation coefficient was 0.987(Figure 2C), indicated that genetics had a greater impact on TA than environmental factors. Statistical analysis of TA in different subgroups in the two years showed that there was no significant difference in other subgroups except for AUS and AROMATIC in 2018.
3.2. GWAS analysis for TA
GWAS analysis was performed of the 238 germplasm populations of TA in 2018 and 2019, based on the threshold (P value =1.0×10⁻³), a total of 42 SNPs significantly associated with TA were identified, and these SNPs distribute on rice Chr 1, 2, 6, 9, and 12(Table 1). Based on these significant SNPs, we finally identified 6 QTL for TA. Among these QTL, qTA1, qTA2, qTA6, qTA9, qTA9-1, qTA12 were detected in 2018, qTA1 and qTA1-1 was detected in 2019 (Figure 3). These QTL explained phenotypic variation ranged from 5.94% to 12.38% (Table 1). Among them, qTA2 and qTA6 are new QTL for TA(Supplement Table 3), and only qTA1 was repeated detected in 2018 and 2019, this indicated that qTA1 was stably expressed in different years. Referring to the previous study, TAC1, TAC3, and TIG1 were major genes controlling TA. The P value of the SNP flanked by these genes were1.7×10-3, 3.2×10⁻² and 3.9×10⁻¹, below the threshold (P=1.0×10⁻³) in this study. We furtherly analyze the haplotypes, the results showed that there was no significant difference in TA between different haplotypes, the results showed that the SNPs flanked by these genes did not influence TA, this could be the cause why we did not detect TAC1, TAC3, and TIG1 in this study (Supplement Figure A3, Supplement Figure A4, Supplement Figure A5).
3.3. Candidate gene identification and haplotype analyses for TA
To search for the candidate genes in six QTL, we choose the genes mainly expressed in stem or node based on the expression profile in Rice Expression Database(http://expression.ic4r.org/), and then excluded the genes encoding retrotransposon or transposon protein based on their function annotations (https://www.rmbreeding.cn). 12 annotated genes, including Zinc finger protein, auxin response factor and cytokinin response in qTA1, qTA2, qTA6, qTA9and qTA12, respectively. were preliminary excavated (Table 2). Then the high-density association and gene-based haplotype analyses were used for identifying the candidate genes by using 253 germplasm resources from 3K Rice Genome Project. We finally mining three candidate genes for qTA1 qTA2 and qTA9. Did not find appropriate candidate genes for qTA2, qTA6 and qTA9-1 based on the results of haplotype analyses. In the region of qTA1, 7 SNPs were used for high-density association analysis. The annotated gene with the most significant hit was LOC_Os01g67770 (Figure 4A). three major haplotypes were detected among 253 accessions based on three SNPs in the LOC_Os01g67770 promoter, five SNPs in the coding region, and one SNP in the 3’-UTR region (Figure 4B). Significant differences for TA were observed among the three haplotypes. Hap1, Hap2 and Hap3 contain 75, 70 and 90 accessions, respectively. Hap1, had the highest mean TA (25.60 °). And showed a significantly higher mean TA than the Hap2 (Figure 4C,D). Hap1 was mainly composed of XI-1A and CA subgroups, and Hap2 was mainly composed of GJ-tmp and GJ- trp subgroups (Figure 4E). In the region of qTA2, 8 SNPs were used for high-density association analysis. The annotated gene with the most significant hit was LOC_Os02g35180 (Figure 5A). Two major haplotypes were detected among 253 accessions based on three SNPs in the LOC_Os02g35180 promoter, three SNPs in the coding region, one SNP in encoding region, and one SNP in the 3’-UTR region (Figure 5B). Significant differences for TA were observed among the three haplotypes. Hap1, Hap2 contain 112 and 92 accessions, respectively. Hap1, had the highest mean TA (23.62 °). And showed a significantly higher mean TA than the Hap2 (Figure 5C,D). Hap1 were mainly composed of XI-1A, XI-1B, and XI-adm subgroups, and Hap2 were mainly composed of XI-1A, XI-1B, and XI-adm subgroups (Figure 5E). In the region of qTA9, 8 SNPs were used for high-density association analysis. The annotated gene with the most significant hit was LOC_Os09g38130 (Figure 6A). Two major haplotypes were detected among 253 accessions based on four SNPs in the LOC_Os09g38130 promoter, one SNPs in the coding region, one SNP in encoding region, and one SNP in the 3’-UTR region (Figure 6B). Significant differences for TA were observed among the three haplotypes. Hap1, Hap2 contain 112 and 92 accessions, respectively. Hap1, had the highest mean TA (27.03 °). And showed a significantly higher mean TA than the Hap2 and Hap3(Figure 6C,D). Hap1 and Hap2 is mainly composed of XI-1A, XI-1B, and XI-adm subgroups, Hap3 is mainly composed of GJ-adm, GJ-tmp and GJ-trp subpopulations (Figure 6E). The above results showed that the elite haplotype of the TA mainly existed in the indica rice subgroup, and the TA haplotype of the indica rice subgroup was the elite haplotype. To further certify the LOC_Os01g67770, LOC_Os02g35180 and LOC_Os09g38130 are the candidate gene of qTA1, qTA2 and qTA9, qRT-PCR were used for analyzed the relative expression level of LOC_Os01g67770, LOC_Os02g35180 and LOC_Os09g38130 in ten accessions, the results showed that relative expression level of these genes are positively associated with TA, this indicated that LOC_Os01g67770, LOC_Os02g35180 and LOC_Os09g38130 may be the candidate genes of these QTL (Figure 4, Figure 5 and Figure 6).
4. Discussion
TA of rice affected by the genetic factor of accessions and environmental factors, genetic effects explained more of the variation, environment factors, such as the planting density per unit area, field management, Light and temperature etc., also significantly affected TA (Wang et al. 2022). Plant type can be divided into plant morphology and plant type, the generalized plant type refers to the organic combination of the morphological characteristics of the plant body, including roots, stems, leaves, and ears, and the physiological functions directly related to the light energy utilization of the plant population; narrow plant type refers to the morphological characteristics and spatial arrangement of plants (Donald. 1968). The ideal plant type is to cultivate an excellent canopy structure, so that the crop can maximize the capture of solar energy, improve the photosynthetic efficiency of the population, and maximize the economic yield under the limited light conditions during the whole growth period (Wang et al. 2022). Cultivating rice varieties with suitable TA, low shading, large photosynthetic area and high light energy utilization rate can effectively improve the yield of rice population. Natural variation is the form of variation that is significant in the evolution of developmental processes, genetic analysis of rice TA QTL derived from natural variation is of great significance for genetic improvement of rice plant type (Tan et al. 2008; Jin et al. 2008; Huang et al. 2011; Zhao et al. 2011). Compared with QTL mapping, GWAS enables the identification of causal loci at high-resolution and is a powerful tool for detecting favorable alleles in natural resources (Bai et al. 2011).
4.1. Abundant variations of TA in rice germplasm
In this study, our results showed that there was no significant difference in TA among different subpopulations in different years, and no significant difference in the variation amplitude and coefficient of variation of TA among the same subpopulations, this indicated that TA is greatly affected by environmental factors; we detected six QTL for TA in 2018, total explained about 47.79% of phenotypic variance, but just detected two QTL for TA in 2019, total explained 14% of phenotypic variance. these results showed that the expression of QTL for TA easily affected by environment factors.
4.2. Comparison of GWAS results with previously reported results
TA plays a vital role in rice production, it can directly affect plant architecture, photosynthetic efficiency, and planting density of rice, so appropriate TA is beneficial for improving rice production (Tan et al. 2008; Jin et al. 2008). Although significant progress in cloning of genes (QTL) involved in regulating TA has been made recently in rice, few of these genes was used in rice breeding for ideal architecture, and the distribution of alleles of TA in germplasm remain largely unknown. Then, we comparison of GWAS results with previously reported results of TA (Supplement Table A3), in our study, qTA1(id1024678), qTA1-1(id1024648), qTA2(id2008457), qTA6(id6000160), qTA9(id9007808), and qTA12(id12007801) for TA were detected in 2018 and 2019. and only qTA1 were repeatedly detected in two years, qTA1 explains 12.38% and 5.94% of phenotypic variance in 2018 and 2019, respectively. QTa1 which controls TA was firstly mapped between RG173-RG532 (Li et al. 1999), which locates on the same region with qTA1 and qTA1-1, suggesting that QTa1 may be an allele of qTA1 or qTA1-1. qTA-9, was mapped between RG662-CT100 (Qian et al. 2001), which locates on the same region with qTA9 and qTA9-1, suggesting that qTA-9 may be an allele of qTA9 or qTA9-1. qTA-12, was mapped between RG461-G148 (Qian et al. 2001), suggesting that qTA12 may be an allele of qTA-12. On the interval of qTA2 and qTA6, we did not find any QTL for TA reported before, this indicated that qTA2 and qTA6 may be the new QTL for TA.
4.3. Identification of candidate genes for TA
It was reported that the plant endogenous hormones IAA, GA, BR, and SL can affected TA (Wang et al. 2022). D2, encoding a key enzyme in BR biosynthesis, positive regulates TA in rice (Dong et al. 2022). TAC1, LAZY1 and PROG1 regulate TA via involving in auxin polar transport (Yu et al. 2007; Jiang et al. 2007; Takeshi et al. 2007; Li et al. 2007; Yoshihara et al. 2007; Tan et al. 2008; Jin et al. 2008). In this study, consulting the relevant literature, the expression profile in Rice Expression Database and the results of haplotype analyses, LOC_Os01g67770, was finally identified as the candidate gene of qTA1, it encodes cytokinin-signaling B-type response regulator, three SNPs in the promoter, five SNPs in the coding region, and one SNP in the 3’-UTR region, caused significant difference in TA between three haplotypes. Hap1 is the superior haplotype conferring largest TA. LOC_Os02g35180, was identified as the candidate gene of qTA2, it encodes a cytokinin-responsive type-A response regulator. three SNPs in the promoter, three SNPs in the coding region, one SNP in encoding region, and one SNP in the 3’-UTR region, caused significant difference in TA between two haplotypes. Hap1 is the superior haplotype conferring largest TA. LOC_Os09g38130, identified as the candidate gene of qTA9, it encodes an auxin efflux carrier component, four SNPs in the promoter, one SNPs in the coding region, one SNP in encoding region, and one SNP in the 3’-UTR region caused significant difference in TA between three haplotypes. Hap1 is the superior haplotype conferring largest TA.
In the future, CRISPR/Cas9 could be applied, further verify the function of these genes and apply they in molecular breeding of ideotype.
5. Conclusions
We detected six QTL for TA by GWAS within 238 rice accessions, and screened 3 new candidate genes for qTA1, qTA2 and qTA9 vivo high-density association and gene-based haplotype analyses. Then we used the qRT-PCR to further validated the LOC_Os01g67770, LOC_Os02g35180 and LOC_Os09g38130 are the candidate gene of qTA1, qTA2 and qTA9, respectively. The identification of those candidate genes and their elite haplotypes will provide a promising source for molecular breeding of ideotype in rice.
Supplementary Materials
The following supporting information can be downloaded at the website of this paper posted on Preprints.org.
Author Contributions
Conceptualization, H.J. and Z.H.; methodology, H.J.; software, G.J.; validation, G.J., L.X. Y.Y. and H.X; formal analysis, G.J. and H.X.; investigation, G.J.; resources, H.J.; data curation, G.J.; writing—original draft preparation, G.J.; writing—review and editing, H.J. and Z.H.; visualization, G.J., and L.X.; supervision, Z.H.; project administration, H.J.; funding acquisition, H.J.
Funding
This research was funded by the National Natural Science Foundation of China, grant number 31701065.
Data Availability Statement
The data will be available upon specific request to the Authors.
Acknowledgments
We thank Institute of Crop Sciences, Chinese Academy of Agricultural Sciences and United States Department of Agriculture for providing the 3K core germplasm and micro-core germplasm of rice, respectively.
Conflicts of Interest
The authors declare that they have no conflict of interest.
References
- Al-Tamimi N, Brien C., Oakey H, Berger B, Saade S, Ho YS, Schmöckel SM, Tester M, Negrão S (2016) Salinity tolerance loci revealed in rice using high-throughput non-invasive phenotyping. [J]. Nature communications 7(1).
- Bai S, Hong J, Su S, Li Z, Wang W, Shi J, Liang W, Zhang D (2022) Genetic basis underlying tiller angle in rice (Oryza sativa L.) by genome-wide association study. Plant Cell Rep 41 (8):1707-1720.
- Bradbury PJ, Zhang Z, Kroon DE, Casstevens TM, Ramdoss Y, Buckler ES (2007) TASSEL: software for association mapping of complex traits in diverse samples [J]. Bioinformatics 23(19): 2633-2635.
- Cai Y, Huang L, Song Y, Yuan Y, Xu S, Wang X, Liang Y, Zhou J, Liu G, Li J, Wang W, Wang Y (2023) LAZY3 interacts with LAZY2 to regulate tiller angle by modulating shoot gravity perception in rice. Plant Biotechnol J.
- Che X, Splitt BL, Eckholm MT, Miller ND, Spalding EP (2023) LAZY1 interaction at the plasma membrane controls Arabidopsis branch angle and gravitropism. The Plant journal: for cell and molecular biology 13(2), 211-224.
- Chen S, Huang Y, Han, Zhang S, Yang Q, Li Z, Zhang Y, Mao R, Fan L, Liu Y, Chen Y, Xie X (2022) Blocking Rice Shoot Gravitropism by Altering One Amino Acid in LAZY1. International journal of molecular sciences 23(16).
- Chen Y, Dan Z, Gao F, Chen P, Fan F, Li S (2020) Rice GROWTH-REGULATING FACTOR7 Modulates Plant Architecture through Regulating GA and Indole-3-Acetic Acid Metabolism. [J]. Plant Physiol 184: 393-406.
- Donald C M (1968) The breeding of crop ideotypes [ J]. Euphytica 17:385-403.
- Dong H, Zhao H, Xie W, Han Z, Li G, Yao W, Bai X, Hu Y, Guo Z, Lu K, Yang L, Xing Y (2016) A Novel Tiller Angle Gene, TAC3, together with TAC1 and D2 Largely Determines the Natural Variation of Tiller Angle in Rice Cultivars. PLoS Genet Nov 4;12(11).
- Fang L, Sang X, Yang Z, Ling Y, Wang L, He G (2009) Analysis and Gene Mapping of a Rice Tiller Angle Mutant tac2. [J]. Chinese Journal of Rice Science 23 (3) :315-318.
- Furutani M, Hirano Y, Nishimura T, Nakamura M, Taniguchi M, Suzuki K, Oshida R, Kondo C, Sun S, Kato K, Fukao Y, Hakoshima T, Morita MT (2020) Polar recruitment of RLD by LAZY1-like protein during gravity signaling in root branch angle control. Nature communications 11(1), 76.
- Harmoko R, Yoo JY, Ko KS, Ramasamy NK, Hwang BY, Lee EJ, Kim HS, Lee KJ, Oh, DB, Kim DY, Lee S, Li Y, Lee SY, Lee KO (2016) N-glycan containing a core α1,3-fucose residue is required for basipetal auxin transport and gravitropic response in rice (Oryza sativa). New Phytol 212 (1):108-22.
- He J, Shao G, Wei X, Huang F, Sheng Z, Tang S, Hu P (2017) Fine mapping and candidate gene analysis of qTAC8, a major quantitative trait locus controlling tiller angle in rice (Oryza sativa L.) [J]. Plus One 12(5): e0178177.
- Hu Y, Li S, Fan X, Song S, Zhou X, Weng X, Xiao J, Li X, Xiong L, You A, Xing Y (2020) OsHOX1 and OsHOX28 Redundantly Shape Rice Tiller Angle by Reducing HSFA2D Expression and Auxin Content. Plant Physiol 184 (3):1424-1437.
- Huang X, Zhao Y, Wei X, Li C, Wang A, Zhao Q, Li W, Guo Y, Deng L, Zhu C, Fan D, Lu Y, Weng Q, Liu K, Zhou T, Jing Y, Si L, Dong G, Huang T, Lu T, Feng Q, Qian Q, Li J, Han B (2011) Genome-wide association study of flowering time and grain yield traits in a worldwide collection of rice germplasm. Nat Genet 44 (1):32-9.
- Jiang J, Tan L, Zhu Z, Fu Y, Liu F, Cai H, Sun C (2012) Molecular evolution of the TAC1 gene from rice (Oryza sativa L.). [J]. J Genet Genomics 39: 551-60.
- Jin J, Huang W, Gao JP, Yang J, Shi M, Zhu MZ, Luo D, Lin HX (2008) Genetic control of rice plant architecture under domestication [J]. Nat Genet. 40: 1365-9.
- Li C, Zhou A, Sang T (2006) Genetic analysis of rice domestication syndrome with the wild annual species, Oryza nivara. [J]. New Phytologist 170(1):185-193.
- Li H, Sun H, Jiang J, Sun X, Tan L, Sun C (2021) TAC4 controls tiller angle by regulating the endogenous auxin content and distribution in rice. Plant Biotechnol J 19 (1):64-73.
- Li P, Wang Y, Qian Q, Fu Z, Wang M, Zeng D, Li B, Wang X, Li J (2007) LAZY1 controls rice shoot gravitropism through regulating polar auxin transport [J]. Cell Res 17: 402-10.
- Li Y, Li J, Chen Z, Wei Y, Qi Y, Wu C (2020) OsmiR167a-targeted auxin response factors modulate tiller angle via fine-tuning auxin distribution in rice. Plant Biotechnol J Feb 15;18(10):2015–26.
- Li Z, Liang Y, Yuan Y, Wang L, Meng X, Xiong G, Zhou J, Cai Y, Han N, Hua L, Liu G, Li J, Wang Y (2019) OsBRXL4 Regulates Shoot Gravitropism and Rice Tiller Angle through Affecting LAZY1 Nuclear Localization. Mol Plant 12 (8):1143-1156.
- Li Z, Paterson AH, Pinson S, Stansel JW (1999) RFLP facilitated analysis of tiller and leaf angles in rice (Oryza sativa L.) [J]. Euphytica 109(2):79-84.
- Liu JM, Park SJ, Huang J,Lee, EJ, Xuan, YH, Je BI, Kumar V, Priatama RA, Raj KV, Kim SH, Min MK, Cho JH, Kim TH, Chandran AK, Jung KH, Takatsuto S, Fujioka S, Han, CD (2016). Loose Plant Architecture1 (LPA1) determines lamina joint bending by suppressing auxin signalling that interacts with C-22-hydroxylated and 6-deoxo brassinosteroids in rice. Journal of experimental botany 67(6), 1883-95.
- Livak KJ, Schmittgen TD (2001) Analysis of relative gene expression data using real-time quantitative PCR and the 2(-Delta Delta C(T)) Method. Methods 25 (4):402-8.
- MacMillan K, Emrich K, Piepho, HP, Mullins CE, Price AH (2006) Assessing the importance of genotype x environment interaction for root traits in rice using a mapping population. I: a soil-filled box screen. Theor Appl Genet 113 (6):977-86.
- Mao C, Ding W, Wu Y, Yu J, He X, Shou H, Wu P (2007) Overexpression of a NAC-domain protein promotes shoot branching in rice. New Phytol 176 (2):288-298.
- Pan X, Li Y, Zhang H, Liu W, Dong Z, Liu L, Liu,S, Sheng X, Min J, Huang R (2022) The chloroplast-localized protein LTA1 regulates tiller angle and yield of rice. The Crop Journal (08):952-961.
- Qian Q, He P, Teng S, Zeng D, Zhu L (2001) QTLs analysis of tiller angle in rice (Oryza sativa L.). [J]. Journal of Genetics & Genomics 28(1):29-32.
- Sakuraba Y, Piao W, Lim JH, Han SH, Kim YS, An G, Paek NC (2015) Rice ONAC106 Inhibits Leaf Senescence and Increases Salt Tolerance and Tiller Angle. Plant Cell Physiol 56 (12):2325-39.
- Sang D, Chen D, Liu G, Liang Y, Huang L, Meng X, Chu J, Sun X, Dong G, Yuan Y, Qian Q, Li J, Wang Y (2014) Strigolactones regulate rice tiller angle by attenuating shoot gravitropism through inhibiting auxin biosynthesis. Proc Natl Acad Sci U S A. 111 (30):11199-204.
- Shen S, Zhuang J, Bao J, Zheng K, Xia Y, Shu Q (2005) QTL analysis of maximum tillering angle of rice [J]. Journal of Agricultural Biotechnology (01):16-20.
- Shin JH, Blay S, Mcneney B, Graham J (2006) LDheatmap: an R function for graphical display of pairwise linkage disequilibria between single nucleotide polymorphisms. Journal of statistical software 16(3):1–10.
- Takeshi Y, Moritoshi I (2007) Identification of the Gravitropism-Related Rice Gene LAZY1 and Elucidation of LAZY1-Dependent and -Independent Gravity Signaling Pathways. Plant and Cell Physiology 48(5): 678-688.
- Tan L, Li X, Liu F, Sun X, Li C, Zhu Z, Fu Y, Cai H, Wang X, Xie D, Sun C (2008) Control of a key transition from prostrate to erect growth in rice domestication. [J]. Nat Genet 40: 1360-4.
- Wang W, Gao H, Liang Y, Li J, Wang Y (2022) Molecular basis underlying rice tiller angle: Current progress and future perspectives. Mol Plant 15 (1):125-137.
- Wang W, Mauleon R, Hu Z, Chebotarov D, Tai S, Wu Z, Li M, Zheng T, Fuentes RR, Zhang F, Mansueto L, Copetti D, Sanciangco M , Palis KC, Xu J, Sun C, Fu B, Zhang H, Gao Y, Zhao X, Shen F, Cui X, Yu H, Li Z, Chen M, Detras J, Zhou Y, Zhang X, Zhao Y, Kudrna D, Wang C, Li R, Jia B, Lu J, He X, Dong Z , Xu J, Li Y, Wang M, Shi J, Li J, Zhang D, Lee S, Hu W, Poliakov A, Dubchak I, Ulat VJ, Borja FN, Mendoza JR, Ali J, Li J, Gao Q, Niu Y, Yue Z, Naredo MEB, Talag J, Wang X, Li J, Fang X, Yin Y, Glaszmann JC, Zhang J, Li J, Hamilton RS, Wing RA, Ruan J, Zhang G, Wei C, Alexandrov N, McNally KL, Li Z, Leung H (2018) Genomic variation in 3,010 diverse accessions of Asian cultivated rice[J]. Nature 557(7703).
- Wu X, Tang D, Li M, Wang K, Cheng Z (2013) Loose Plant Architecture1, an INDETERMINATE DOMAIN protein involved in shoot gravitropism, regulates plant architecture in rice. Plant Physiol 161 (1):317-29.
- Yoshihara T, Iino M (2007) Identification of the gravitropism-related rice gene LAZY1 and elucidation of LAZY1-dependent and -independent gravity signaling pathways. Plant Cell Physiol 48 (5):678-88.
- Yu B, Lin Z, Li H, Li X, Li J, Wang Y, Zhang X, Zhu Z, Zhai W, Wang X, Xie D, Sun C (2007) TAC1, a major quantitative trait locus controlling tiller angle in rice The Plant Journal 52(5): 891-898.
- Zhang N, Yu H, Yu H, Cai Y, Huang L, Xu C, Xiong G, Meng X, Wang J, Chen H, Liu G, Jing Y, Yuan Y, Liang Y, Li S, Smith SM, Li J, Wang Y (2018) A Core Regulatory Pathway Controlling Rice Tiller Angle Mediated by the LAZY1-Dependent Asymmetric Distribution of Auxin. Plant Cell 30 (7):1461-1475.
- Zhang W, Tan L, Sun H, Zhao X, Liu F, Cai H, Fu Y, Sun X, Gu P, Zhu Z, Sun C (2019) Natural Variations at TIG1 Encoding a TCP Transcription Factor Contribute to Plant Architecture Domestication in Rice. [J]. Mol Plant 12: 1075-1089.
- Zhang Y, Dong S, Zhang Y, Chen T, Zhao Q, Zhu Z, Zhou L, Yao S, Zhao L (2013) Construction of Molecular Genetic Linkage Map Based on a RIL Population of Rice and Detection of QTLs for Tiller Angle[J]. agricultural science & technology 14(005) :P.689-694.
- Zhao K, Tung CW, Eizenga GC, Wright MH, Ali ML, Price AH, Norton GJ, Islam MR, Reynolds A, Mezey J, McClung AM, Bustamante CD, McCouch SR (2011) Genome-wide association mapping reveals a rich genetic architecture of complex traits in Oryza sativa. [J]. Nat Commun 2: 467.
- Zhao L, Zheng Y, Wang Y, Wang S, Wang T, Wang C, Chen Y, Zhang K, Zhang N, Dong Z, Chen F (2023) A HST1-like gene controls tiller angle through regulating endogenous auxin in common wheat. Plant Biotechnol J 21 (1):122-135.
Figure 1.
Geographic distribution core germplasm. (A) 238 germplasm geographic distribution; (B) 253 3K germplasms geographic distribution.
Figure 1.
Geographic distribution core germplasm. (A) 238 germplasm geographic distribution; (B) 253 3K germplasms geographic distribution.
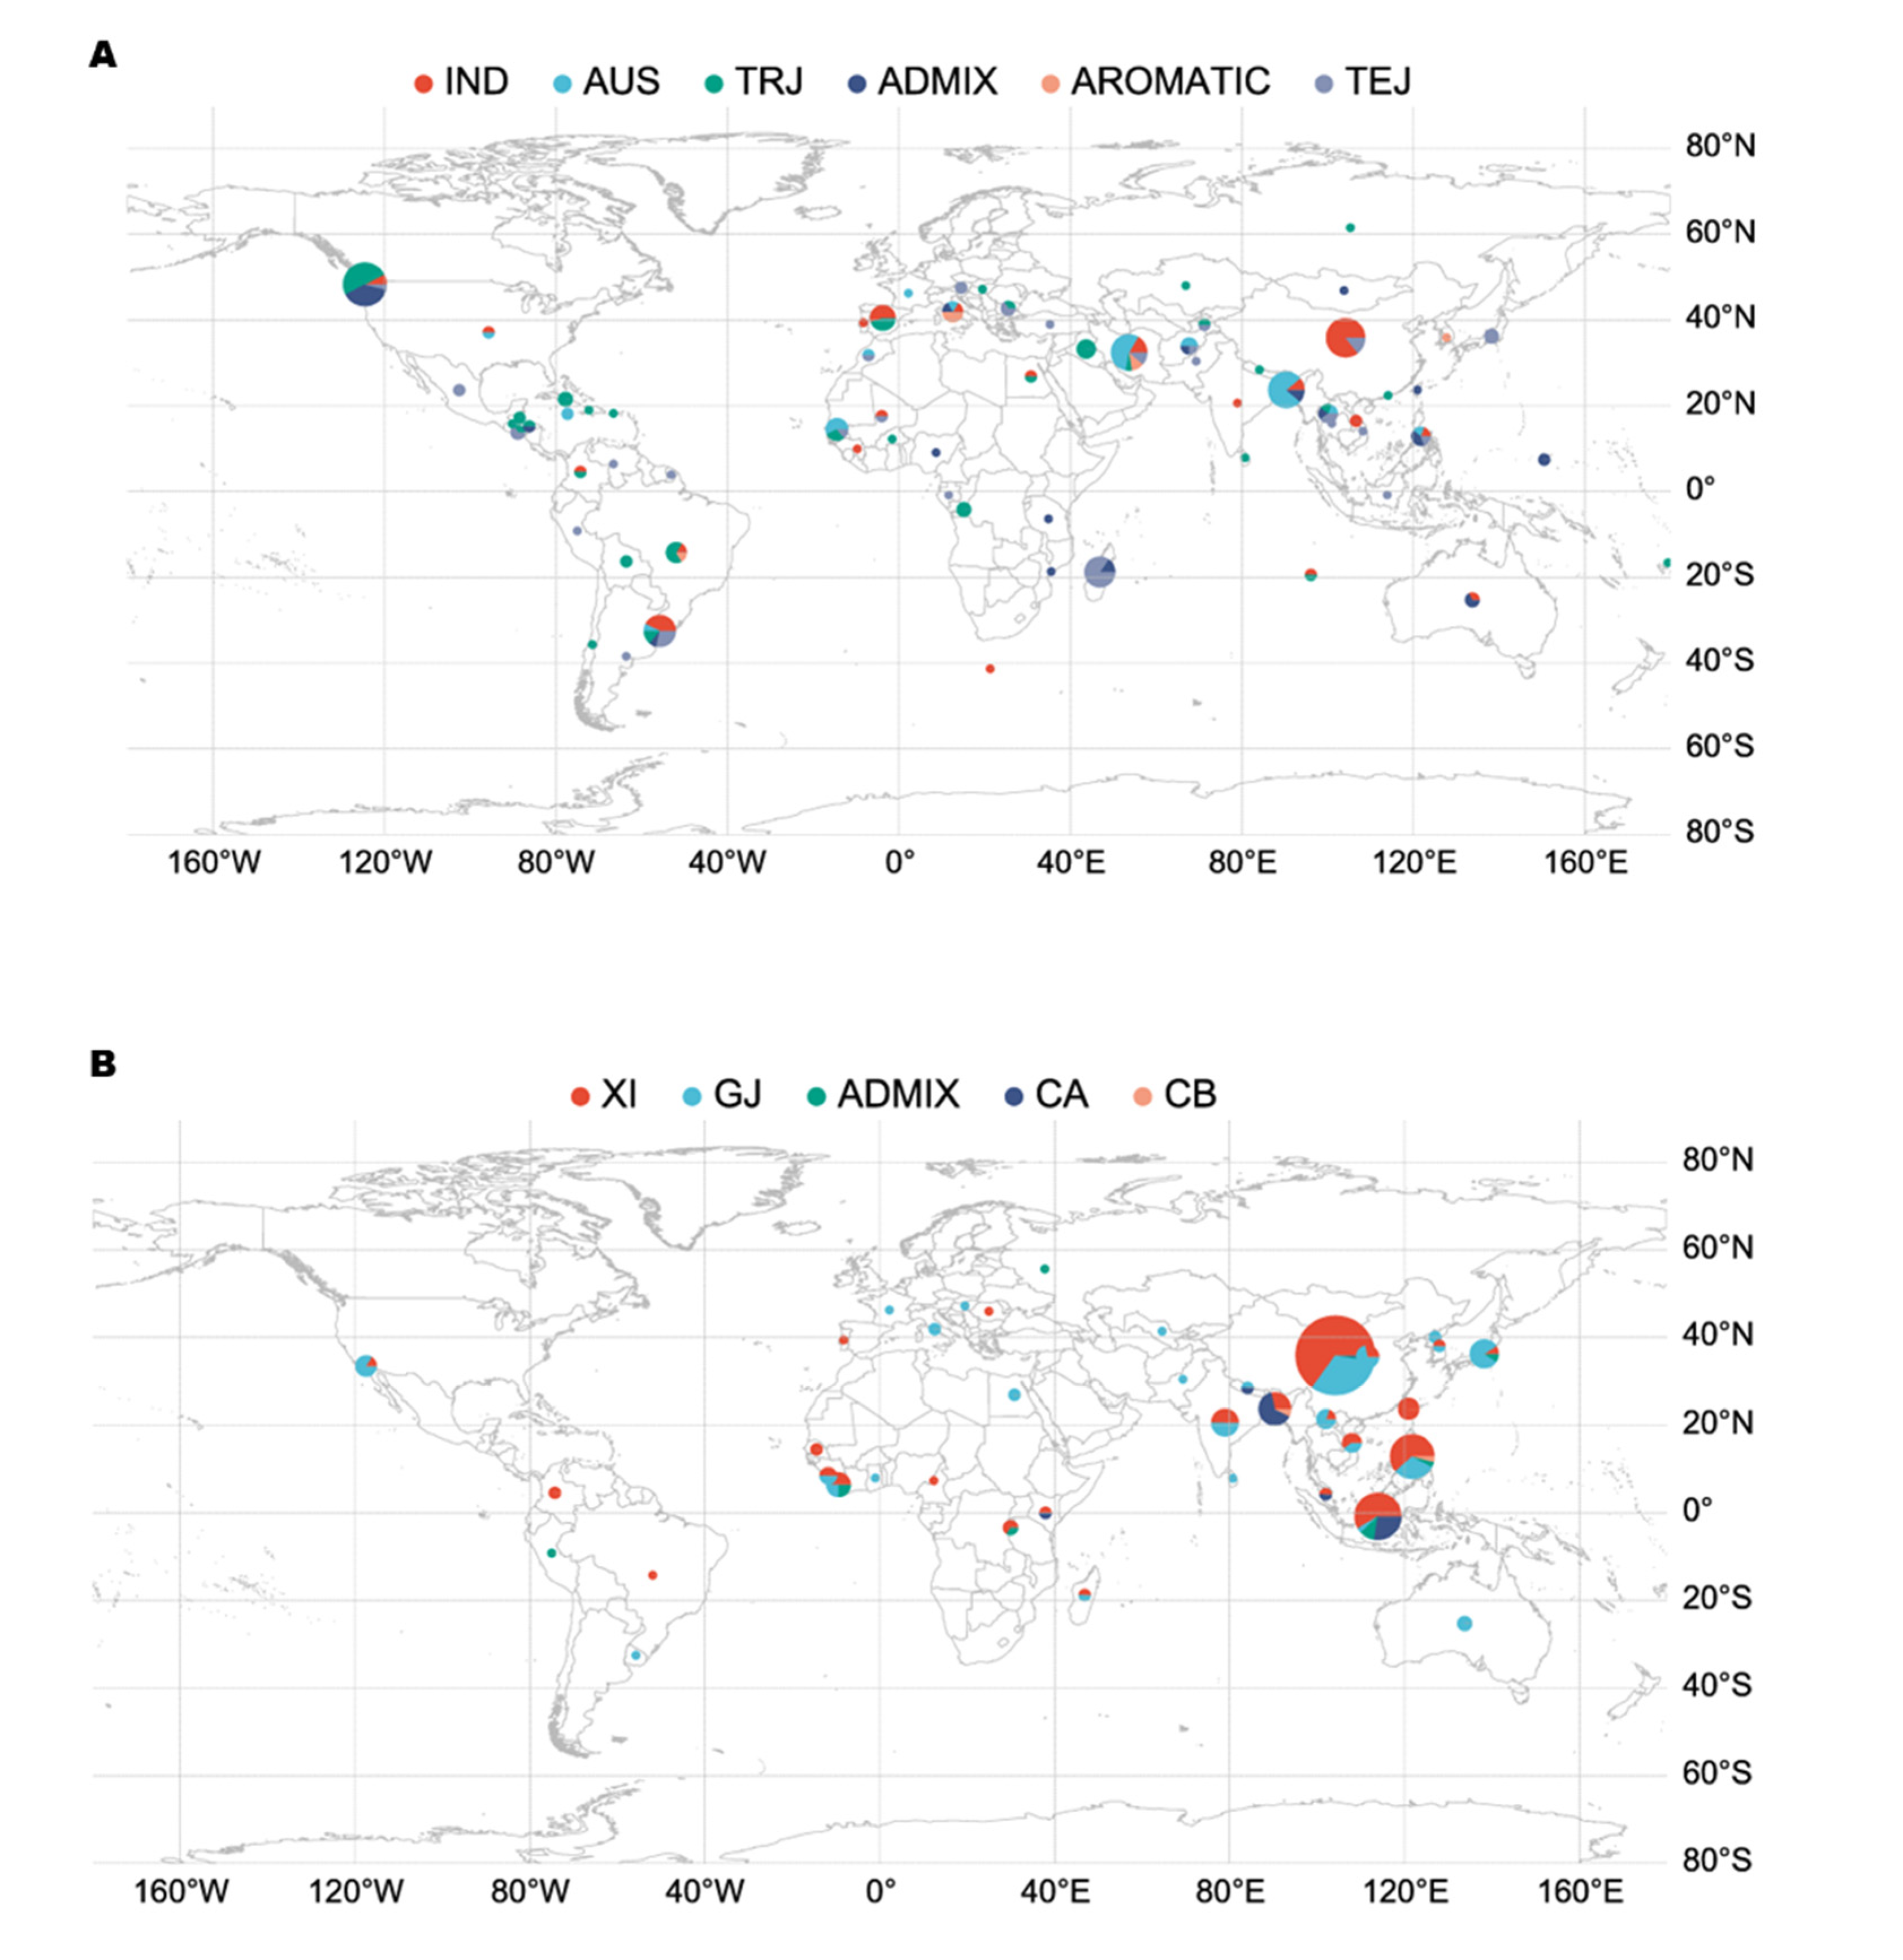
Figure 2.
The variation of TA in 238 rice accessions. (A) and (B) the distribution of TA values of 238 accessions in 2018 and 2019, respectively; (C) Correlation coefficients for TA values of 238 accessions in 2018 and 2019; (D) and (E) distribution of TA values within subgroups in 2018 and 2019, respectively. Data represent mean ± SD from five replicates. Different lowercase letters indicate significant differences among different subpopulations based on Duncan’s new multiple-range test (p <0.05).
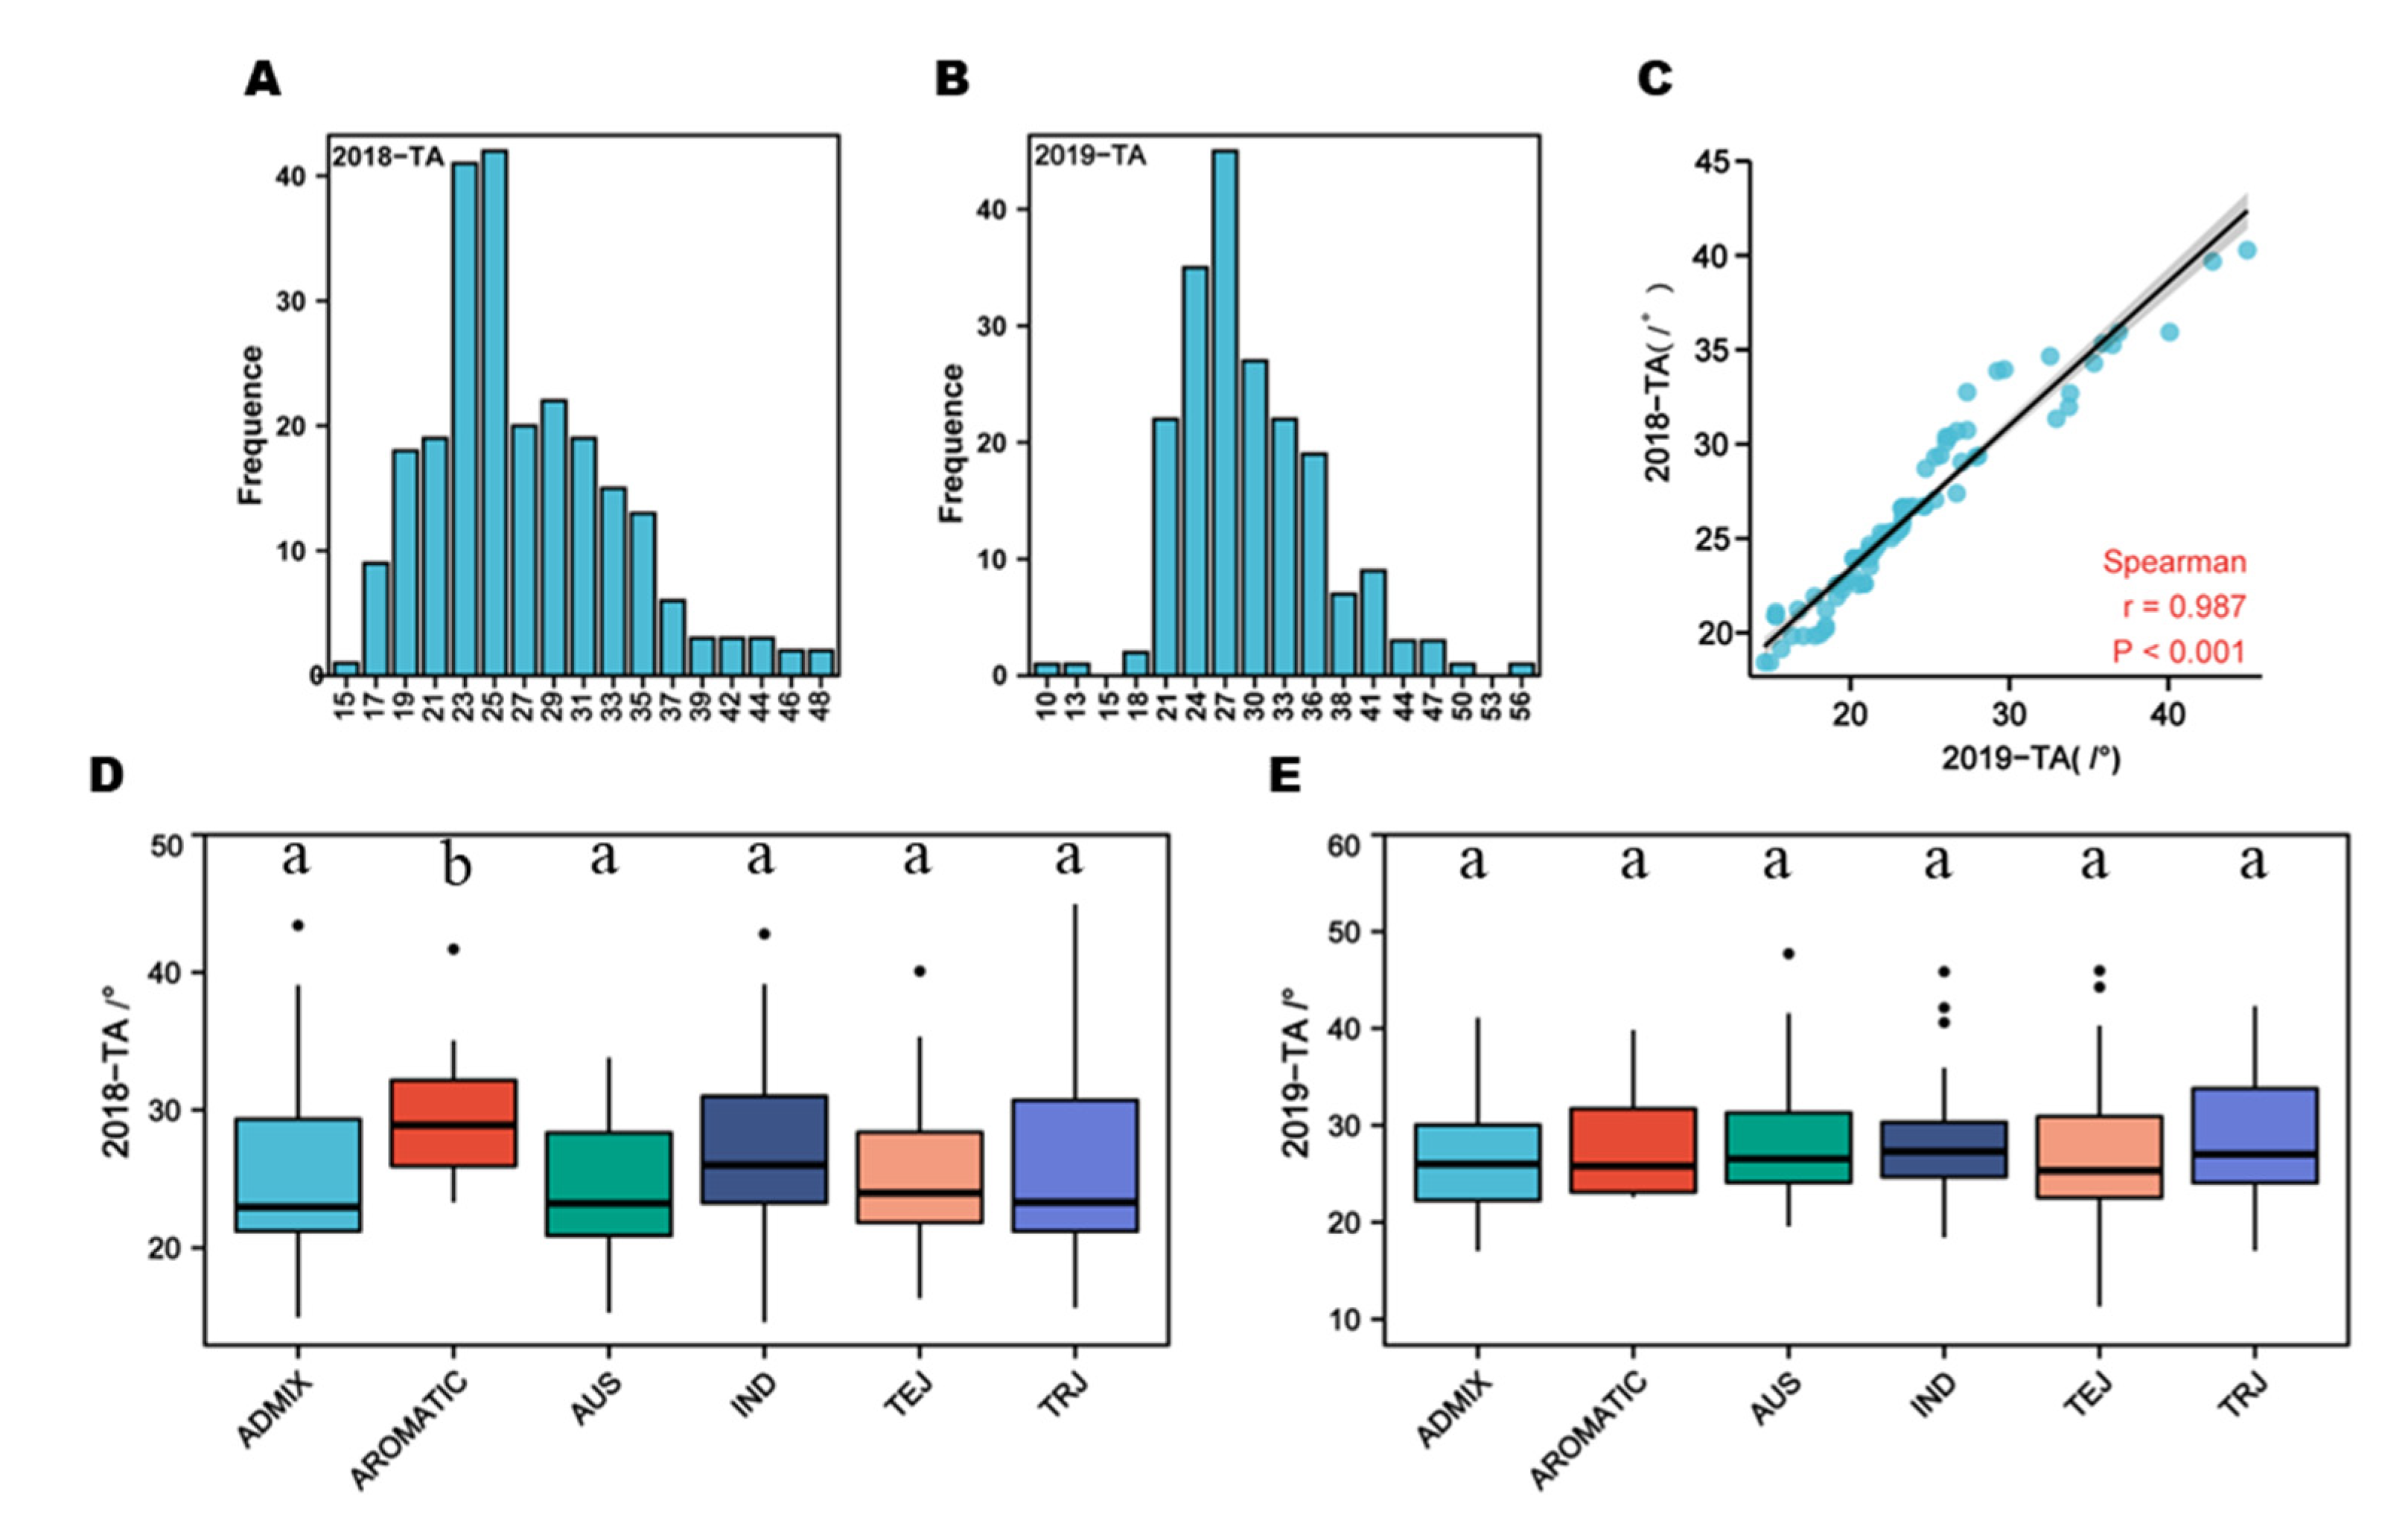
Figure 3.
Genome-wide association analysis for TA in rice. (A) and (C) Manhattan plots of genome-wide association analysis in 2018 and 2019, respectively; (B) and (D) Q-Q plots of genome-wide association analysis in 2018 and 2019, respectively.
Figure 3.
Genome-wide association analysis for TA in rice. (A) and (C) Manhattan plots of genome-wide association analysis in 2018 and 2019, respectively; (B) and (D) Q-Q plots of genome-wide association analysis in 2018 and 2019, respectively.
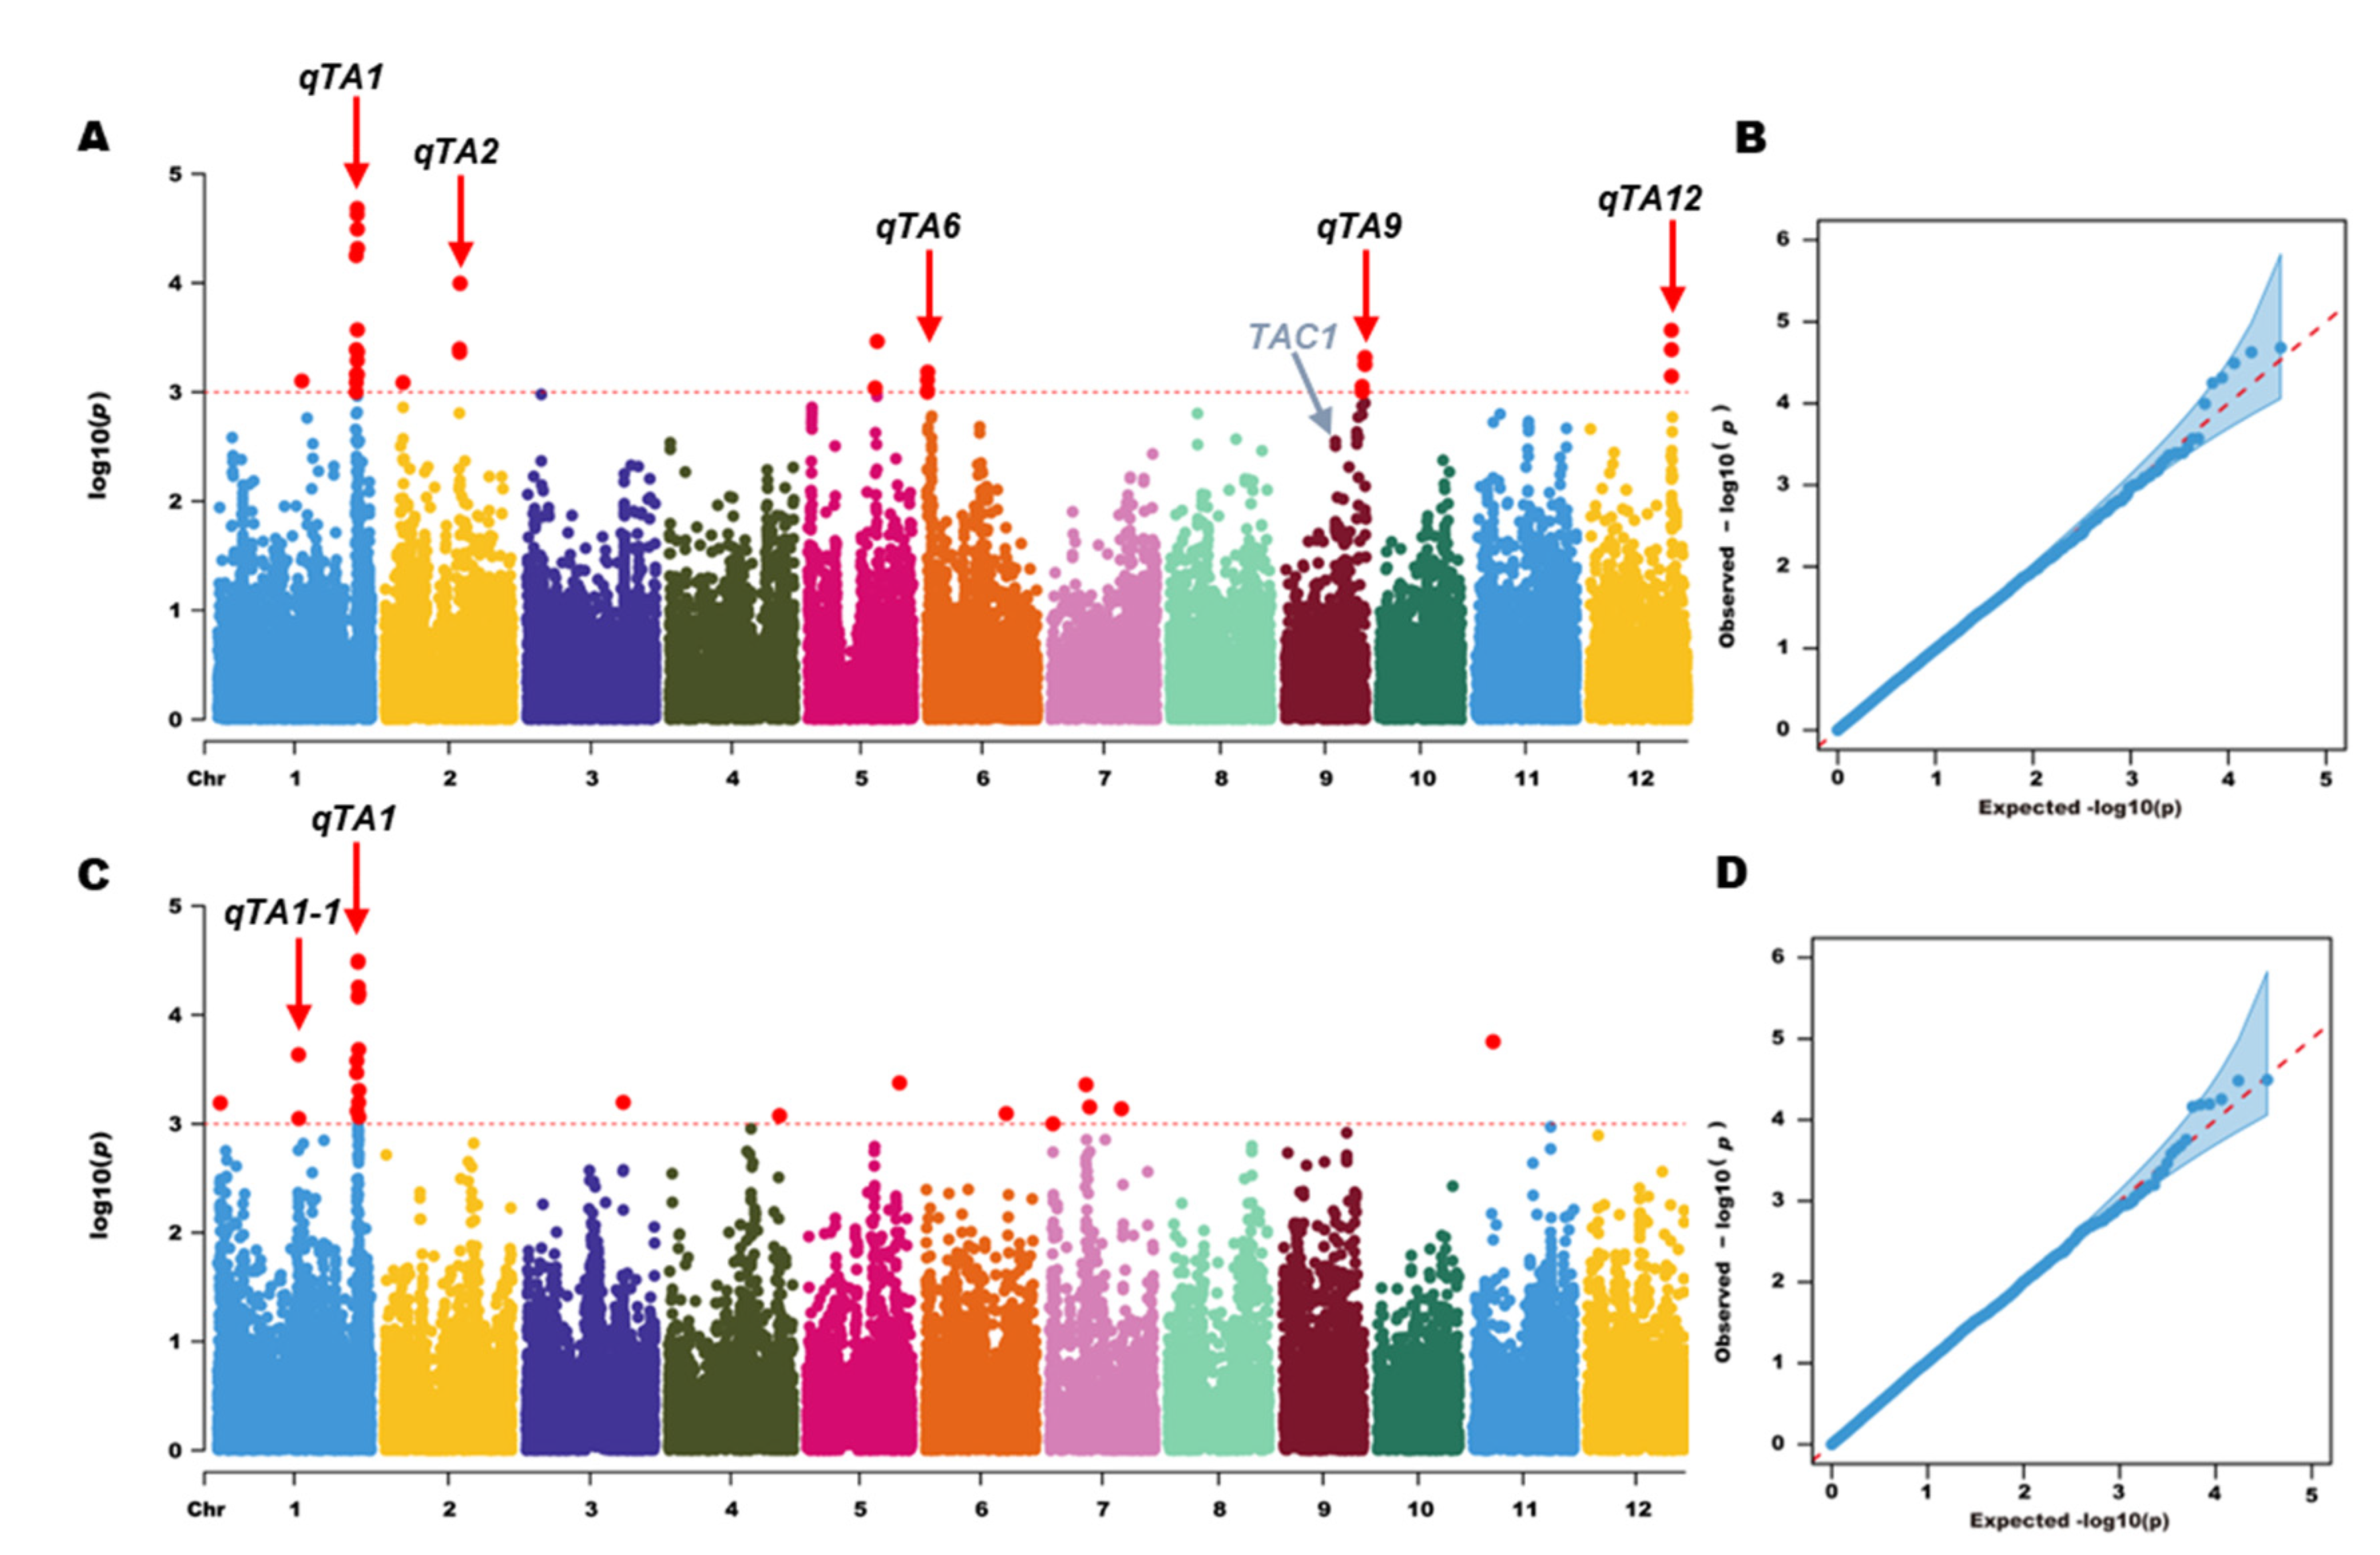
Figure 4.
LOC_Os01g67770 haplotype significance analysis. (A) linkage disequilibrium plot for SNPs with -log10(p) value > 3 in qTA1 on Chr. 1; (B) Schematic representation of LOC_Os01g67770 structure and the positions of 7 SNPs used for haplotype analysis, bar=100bp; (C) Comparisons of TA values among accessions with different haplotypes. *p ≤ 0.05, **p ≤ 0.01; (D) the subpopulation composition of LOC_Os01g67770 haplotypes for TA.
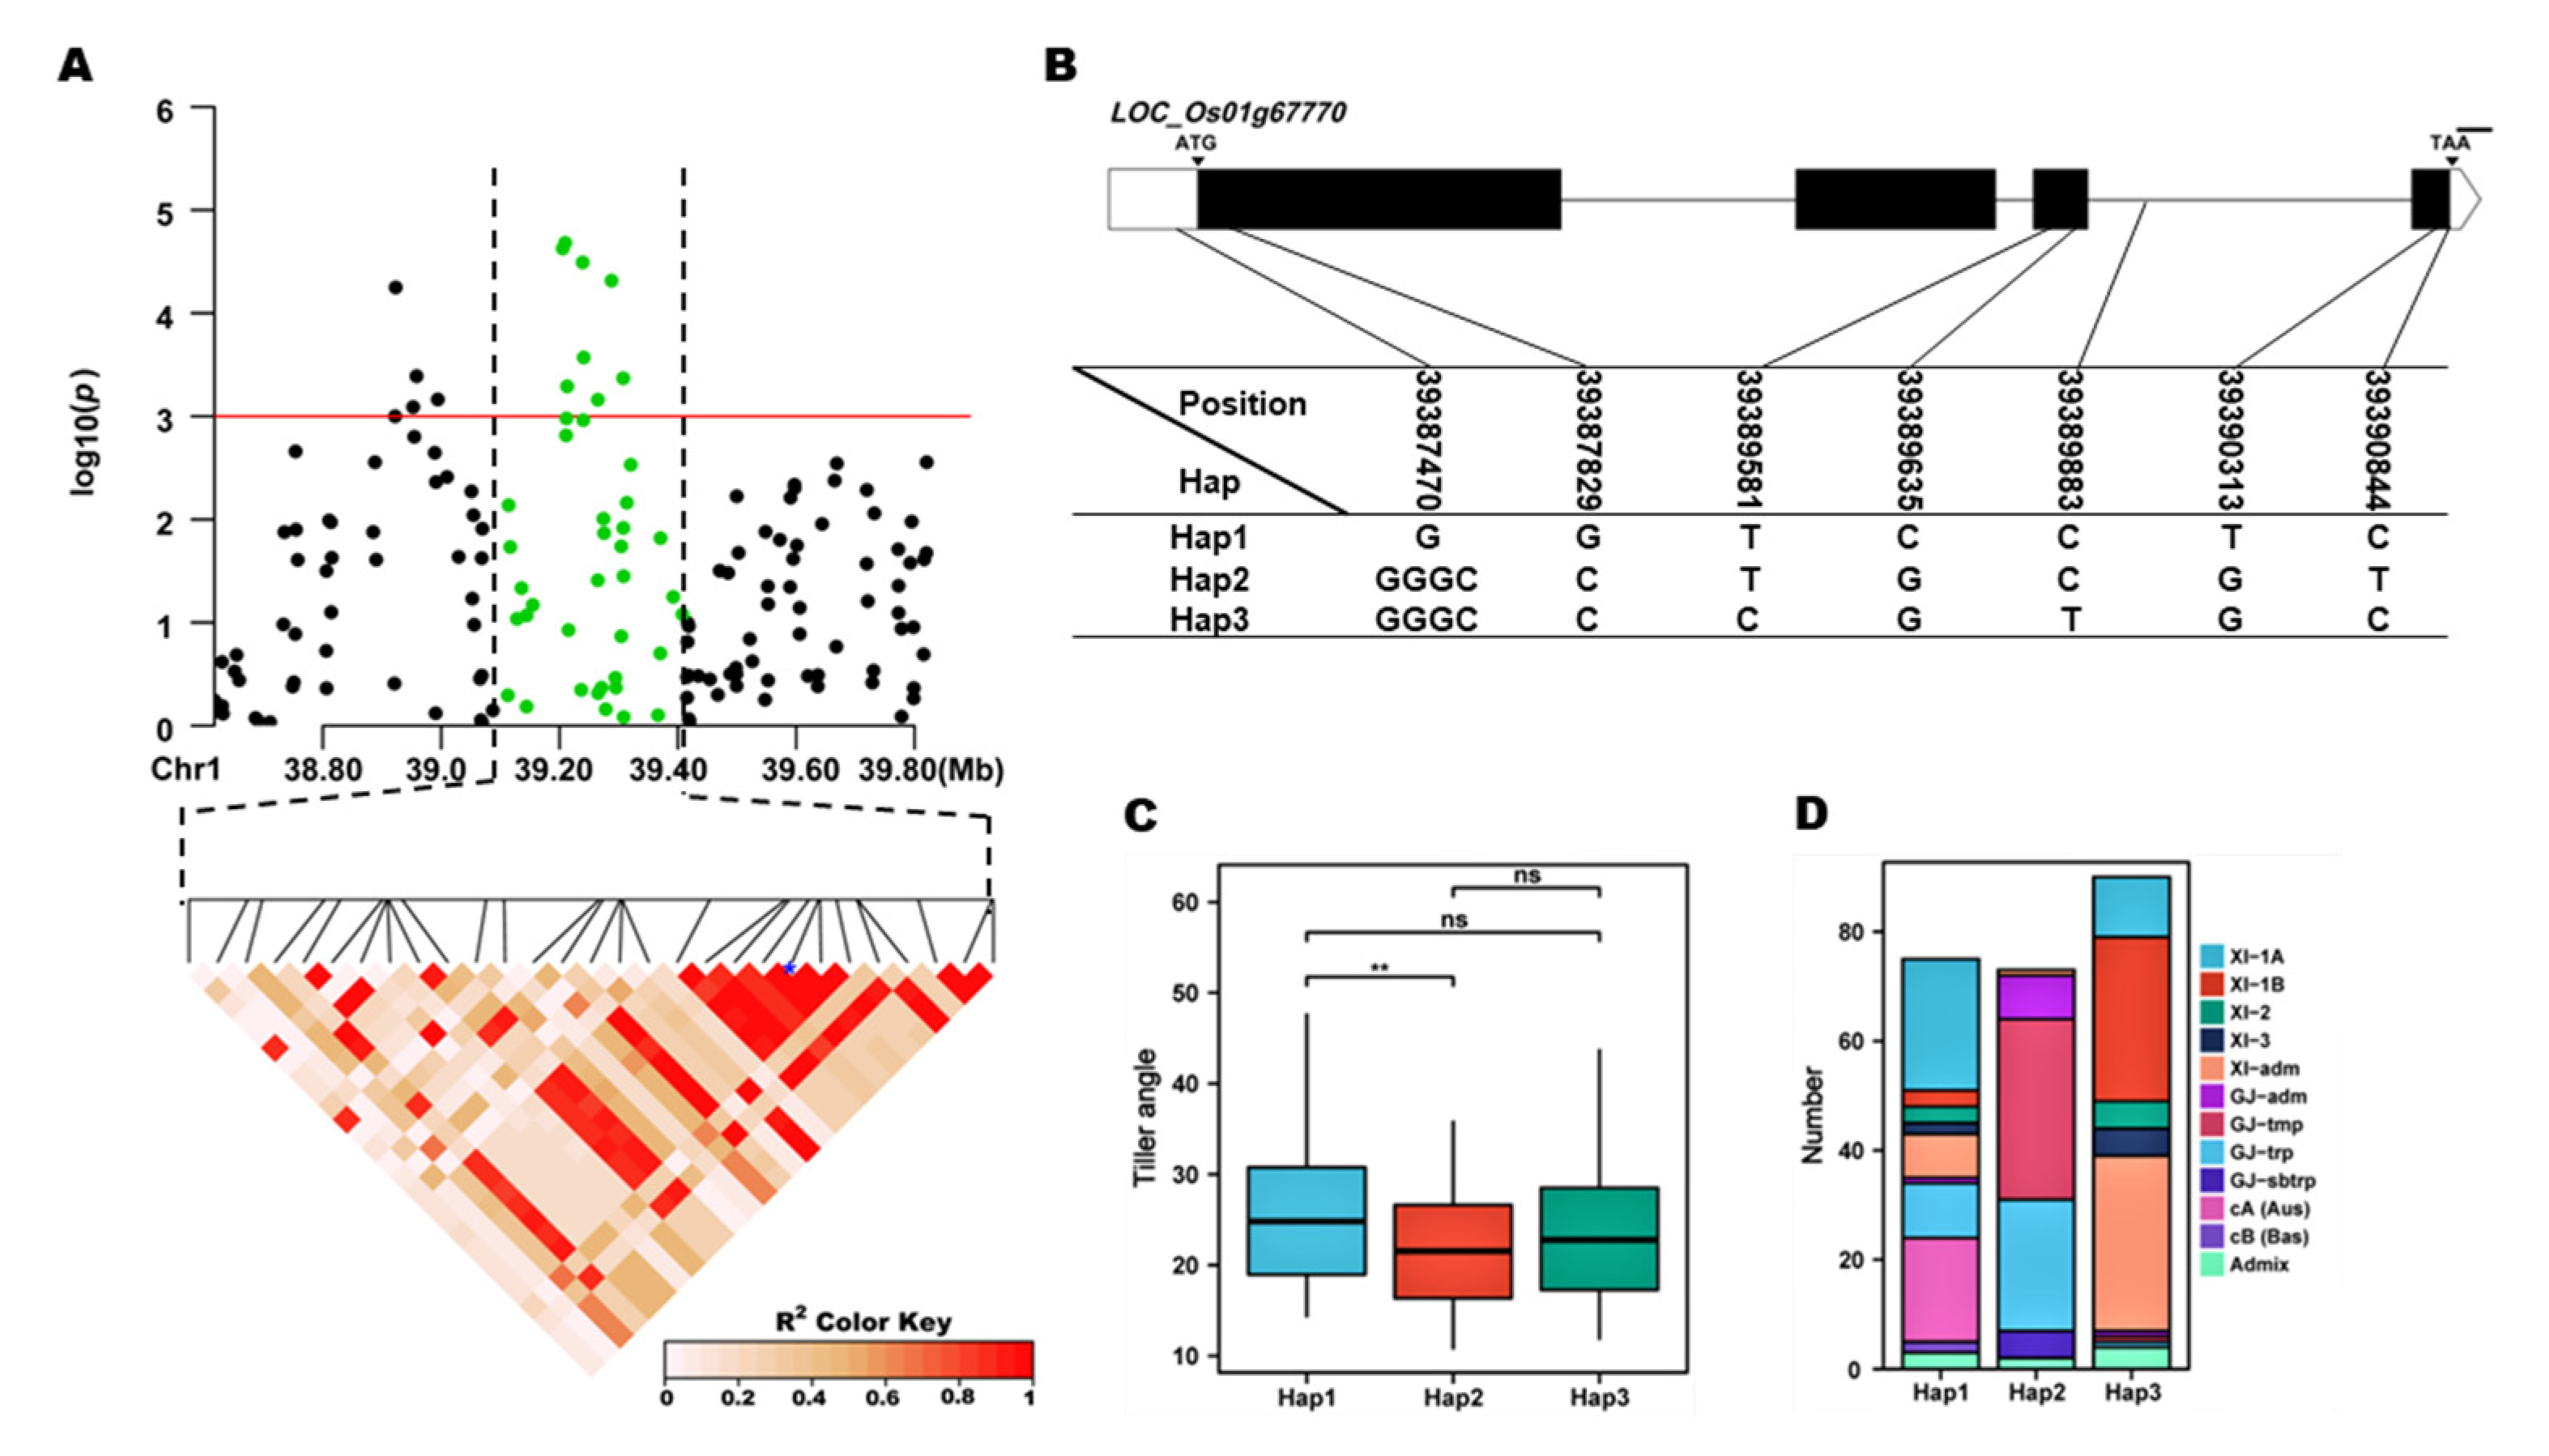
Figure 5.
LOC_ Os02g35180 haplotype significance analysis. (A) linkage disequilibrium plot for SNPs with -log10(p) value > 3 in qTA1 on Chr. 2; (B) Schematic representation of LOC_ Os02g35180 structure and the positions of 7 SNPs used for haplotype analysis, bar=100bp; (C) Comparisons of TA values among accessions with different haplotypes. *p ≤ 0.05, **p ≤ 0.01; (D) the subpopulation composition of LOC_ Os02g35180 haplotypes for TA.
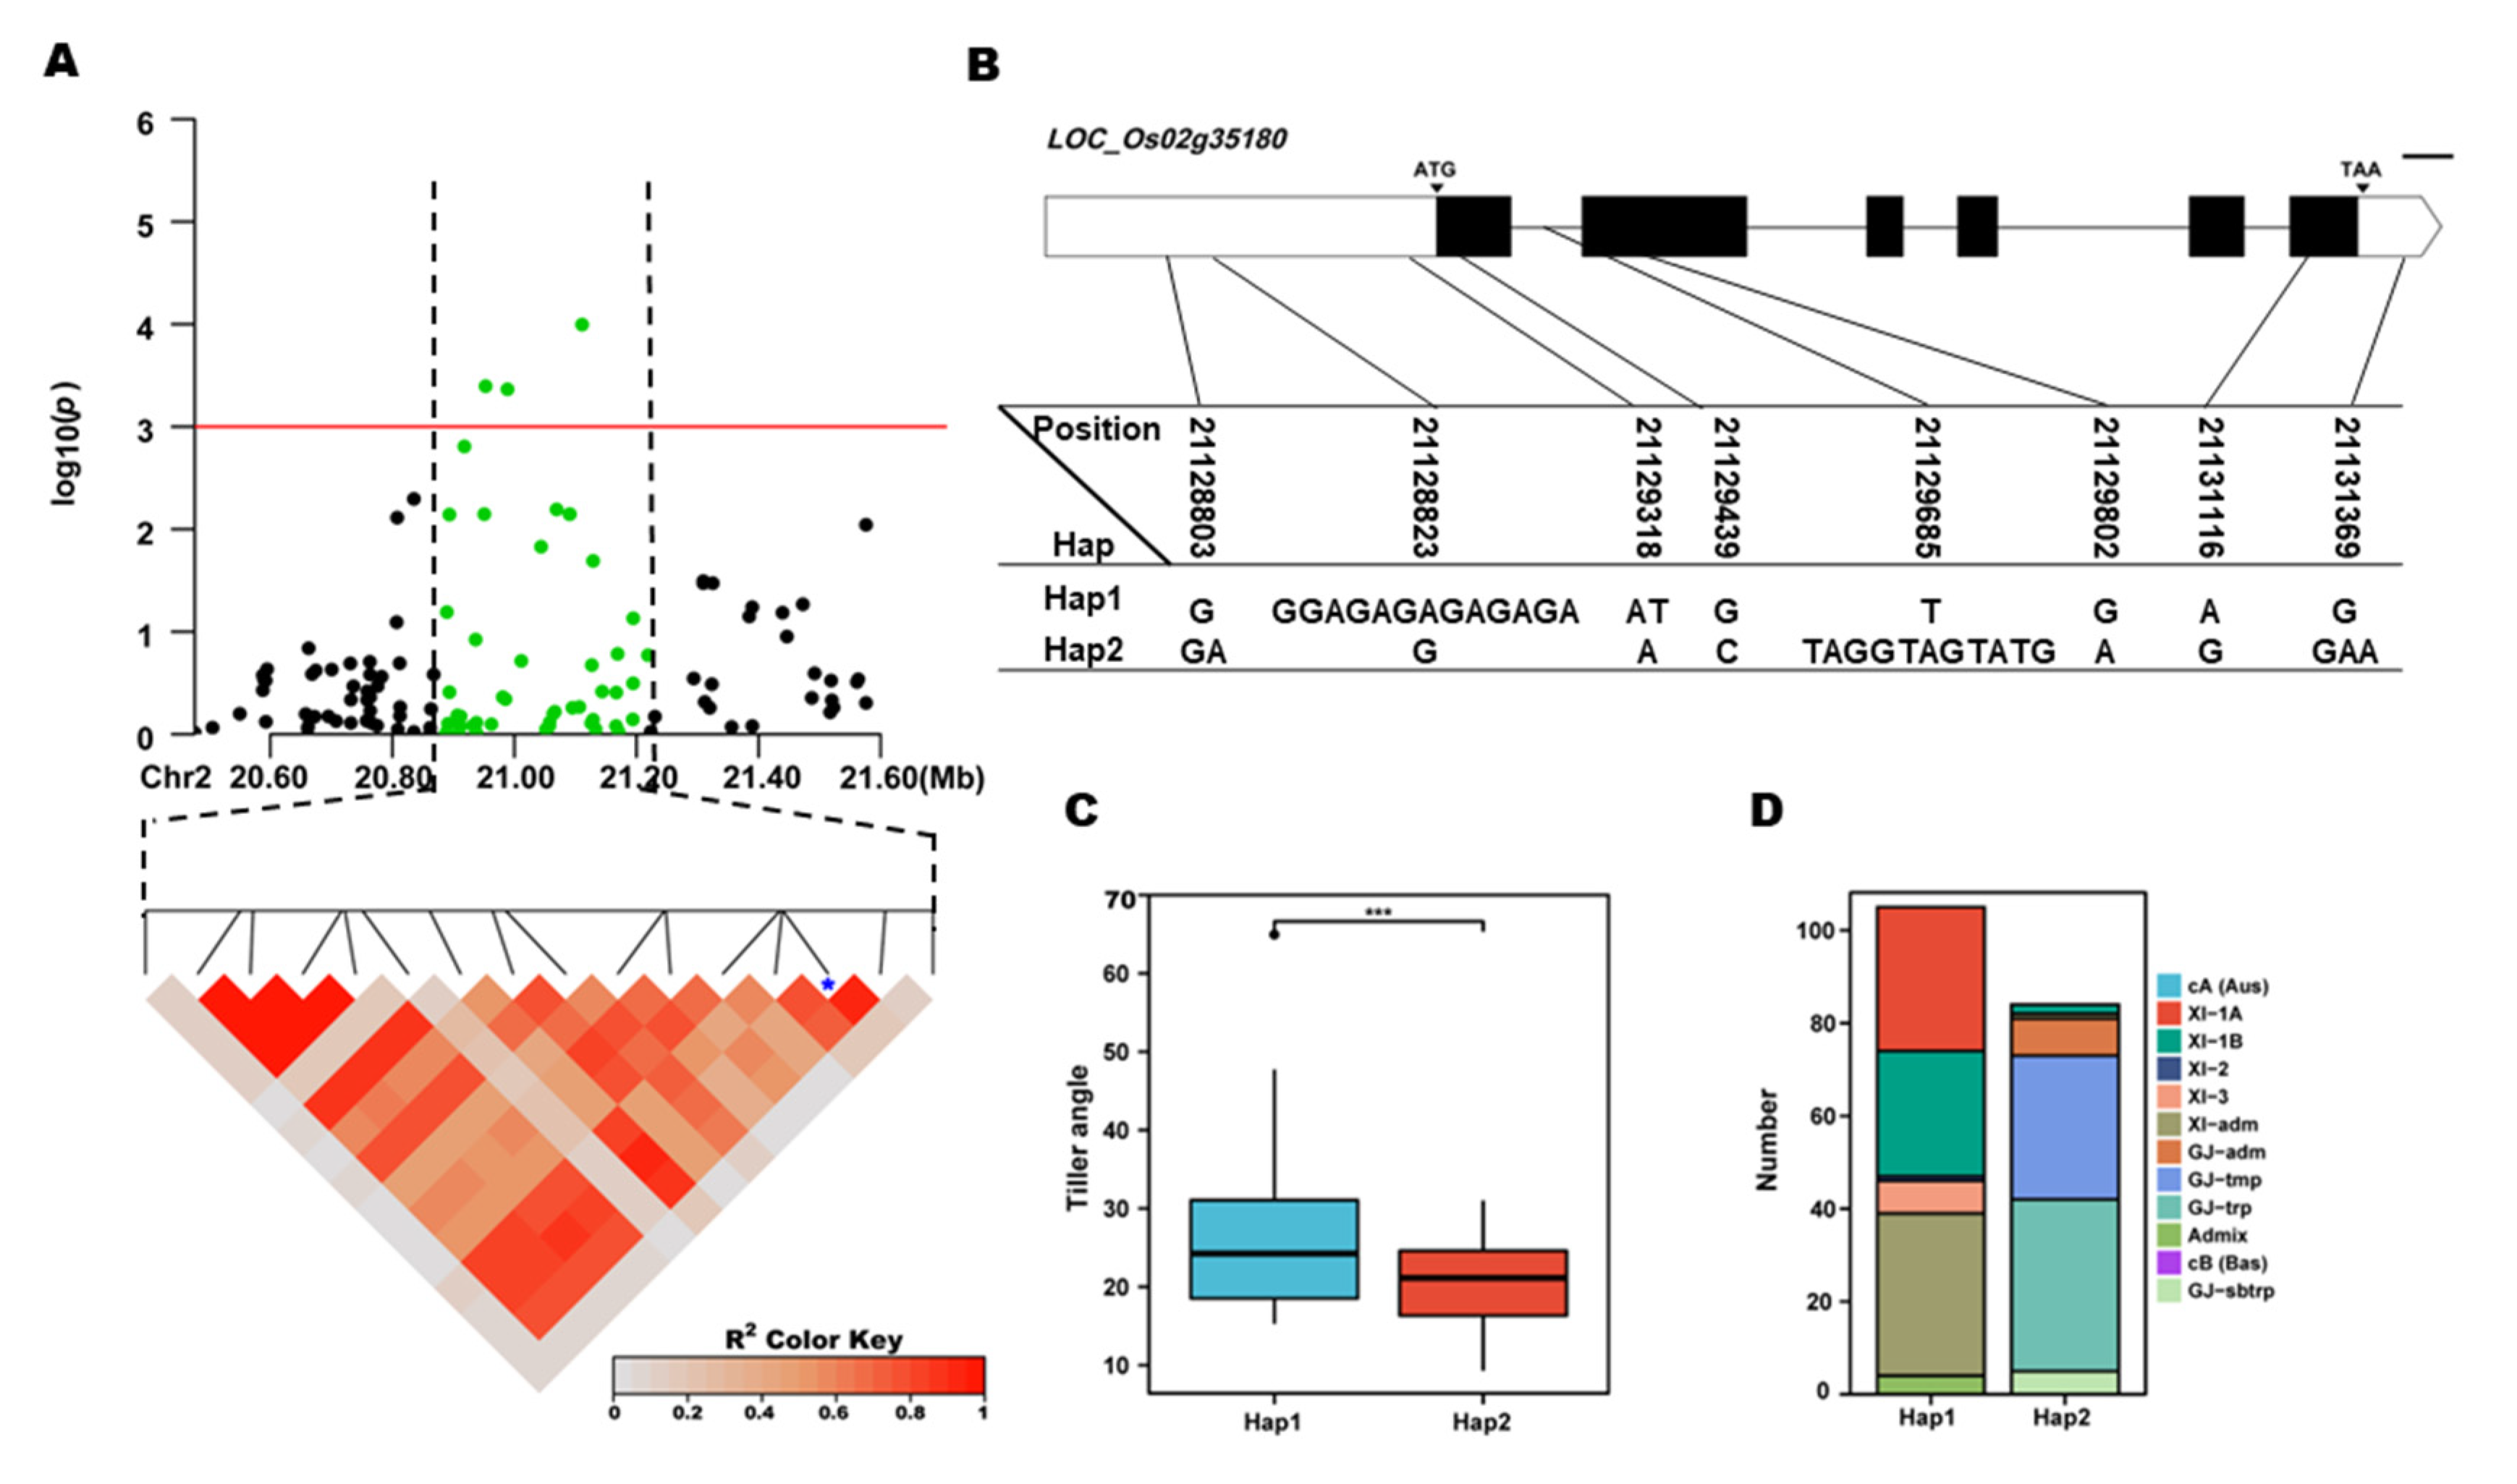
Figure 6.
LOC_Os09g38130 haplotype significance analysis. (A) linkage disequilibrium plot for SNPs with -log10(p) value > 3 in qTA1 on Chr. 9; (B) Schematic representation of LOC_Os09g38130 structure and the positions of 7 SNPs used for haplotype analysis, bar=100bp; (C) Comparisons of TA values among accessions with different haplotypes. *p ≤ 0.05, **p ≤ 0.01; (D) the subpopulation composition of LOC_Os09g38130 haplotypes for TA.
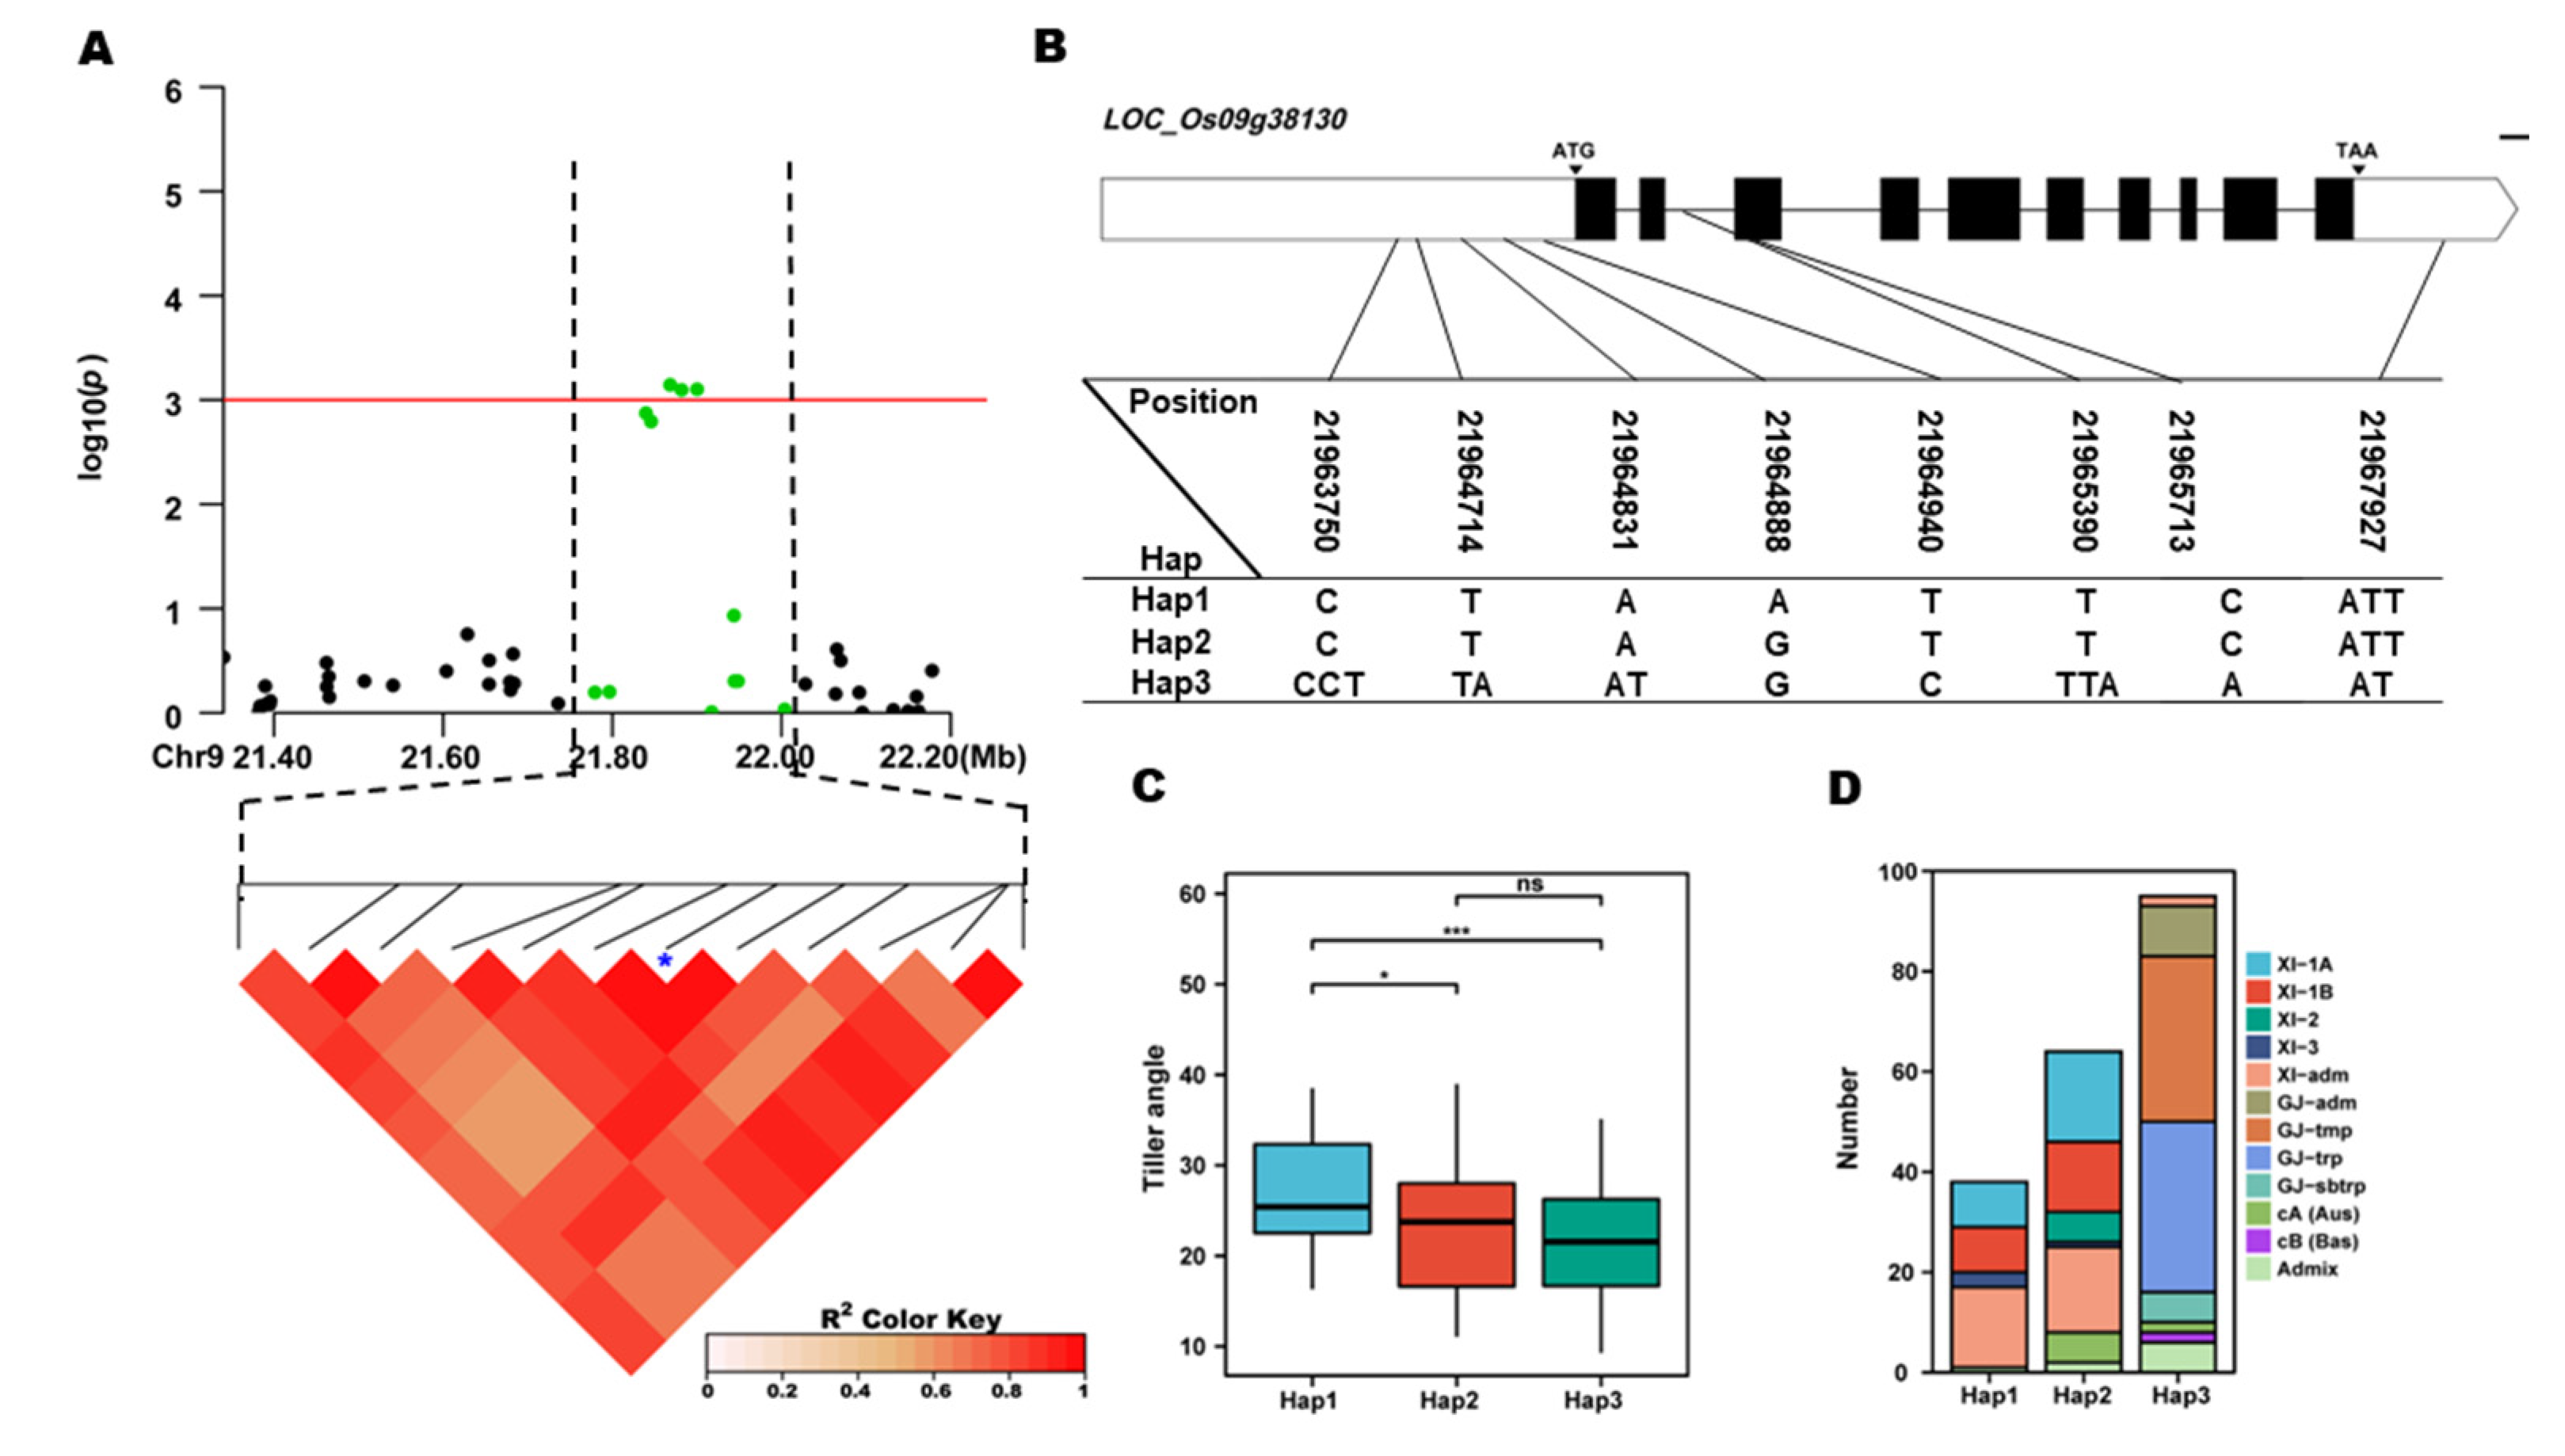
Figure 7.
Expression verification the function of candidate genes. (A) Comparisons of TA values between accessions with larger TA and accessions with litter TA, *** p ≤ 0.001; (B), (C) and (D) relative expression level of LOC_Os01g67160, LOC_Os02g35180, and LOC_Os09g38130 in stem node of accessions. Rice OsActin gene (LOC_Os03g50885) was used as the internal reference gene, the 2-△△ct method was used to calibrate relative expression levels of target genes with the reference gene.
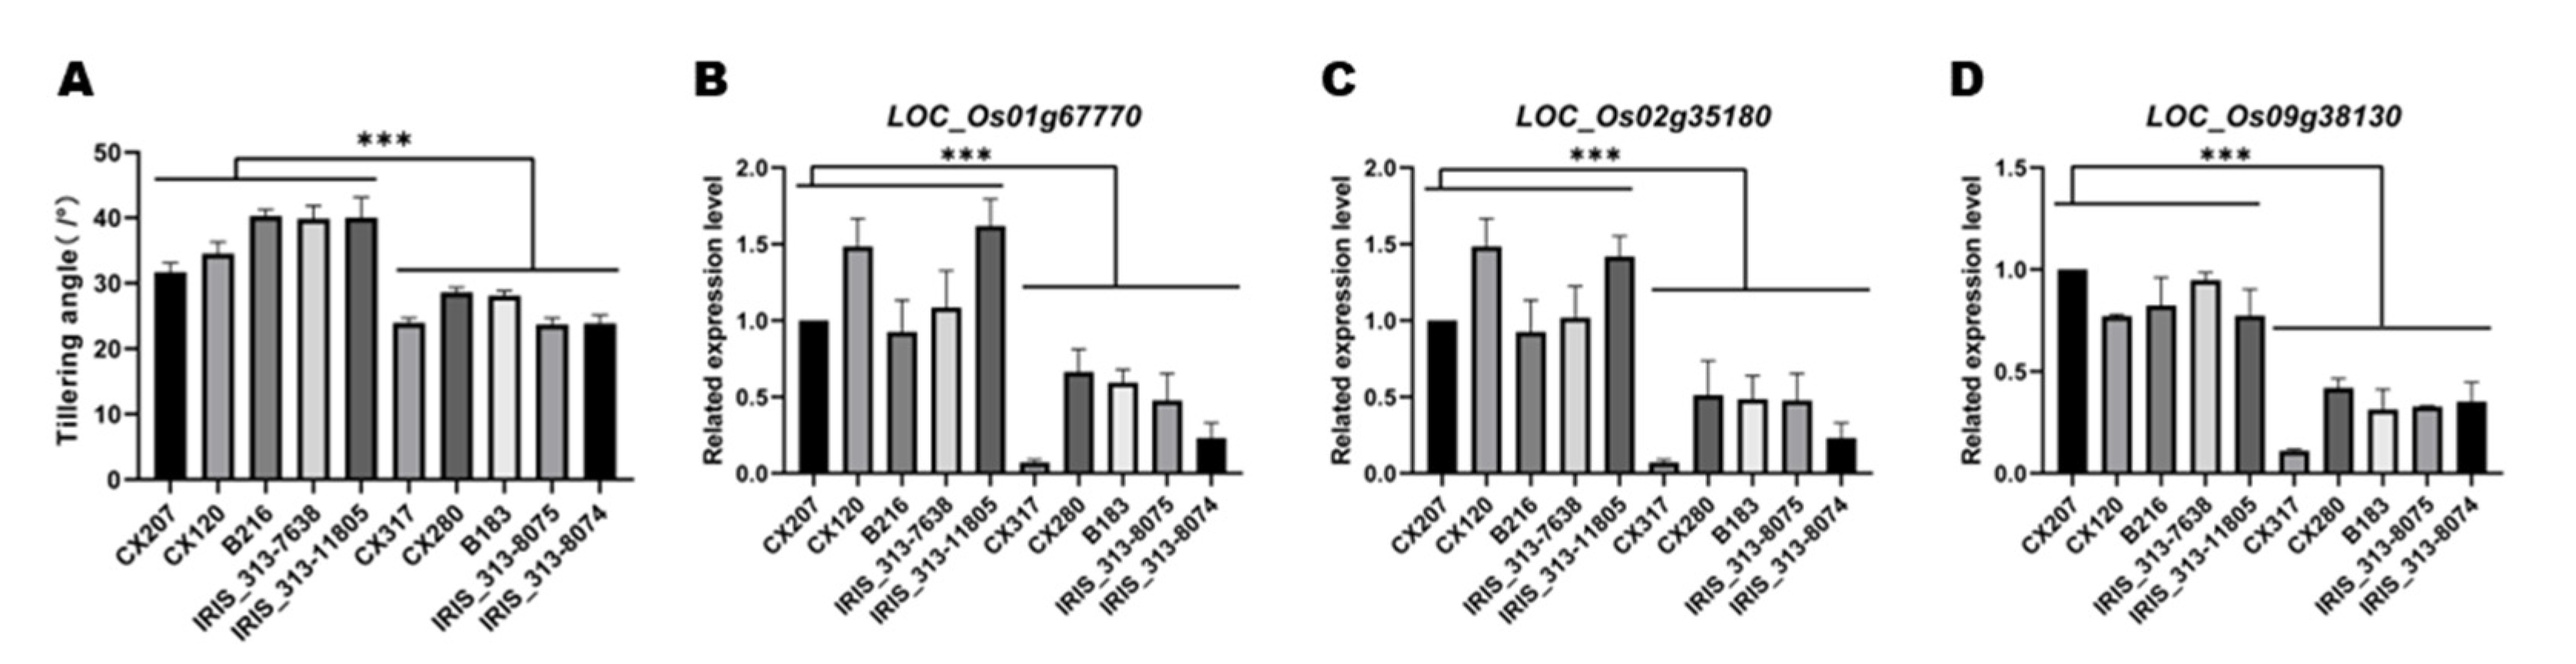

Table 1.
List of QTL for TA identified by GWAS.
| Treatment | QTL | Chr | SNP | Position | P-value | R2 |
|---|---|---|---|---|---|---|
| 2018 Liuyang |
qTA1 | 1 | id1024678 | 38923066 | 5.63E-05 | 12.38% |
| qTA2 | 2 | id2008457 | 21110964 | 1.01E-04 | 6.95% | |
| qTA6 | 6 | id6000160 | 342503 | 6.54E-04 | 7.06% | |
| qTA9 | 9 | id9007421 | 21868430 | 8.87E-04 | 6.61% | |
| qTA12 | 12 | id12007801 | 22996012 | 2.71E-04 | 8.00% | |
| qTA1-1 | 1 | id1013058 | 22837243 | 2.32E-04 | 6.07% | |
| 2019 Liuyang |
qTA1 | 1 | id1025079 | 39548160 | 3.29E-05 | 8.20% |
Table 2.
Candidate genes and function annotations of QTL for TA.
| QTL | Candidate gene | Description |
|---|---|---|
| qTA1 | LOC_Os01g67770 | Two-component response regulator, response to cytokinin stimulus |
| LOC_Os01g66890 | Broad Complex BTB domain with TAZ zinc finger and Calmodulin-binding domains | |
| LOC_Os01g66970 | Zinc finger, C3HC4 type domain-containing protein | |
| qTA2 | LOC_Os02g35140 | Auxin response factor 7 |
| LOC_Os02g35150 | Zinc finger CCCH domain-containing protein | |
| LOC_Os02g35180 | OsRR2 type-A response regulator, response to auxin stimulus | |
| qTA6 | LOC_Os06g01620 | Plant-specific transcription factors maintain bud tip meristem uncertainty |
| qTA9 | LOC_Os09g38110 | RING-H2 finger protein |
| LOC_Os09g38130 | Auxin efflux carrier component, response to auxin stimulus | |
| qTA9-1 | LOC_Os09g39400 | Histidine-containing phosphotransfer protein |
| LOC_Os09g39660 | C2H2 zinc finger protein | |
| qTA12 | LOC_Os12g37430 | PAPA-1-like conserved region family protein/ zinc finger protein |
Disclaimer/Publisher’s Note: The statements, opinions and data contained in all publications are solely those of the individual author(s) and contributor(s) and not of MDPI and/or the editor(s). MDPI and/or the editor(s) disclaim responsibility for any injury to people or property resulting from any ideas, methods, instructions or products referred to in the content. |
© 2023 by the authors. Licensee MDPI, Basel, Switzerland. This article is an open access article distributed under the terms and conditions of the Creative Commons Attribution (CC BY) license (http://creativecommons.org/licenses/by/4.0/).
Copyright: This open access article is published under a Creative Commons CC BY 4.0 license, which permit the free download, distribution, and reuse, provided that the author and preprint are cited in any reuse.


