
Submitted:
12 February 2023
Posted:
16 February 2023
You are already at the latest version
Abstract
Fresh water is an increasingly scarce resource in both urban and rural developments. As a response to this challenge, non-potable water reuse is on the rise. This research explored a potential off-grid system for water purification, consisting of a staircase wetland with terracotta pot plants working as a filter for greywater. The study further investigated the physicochemical properties of the greywater and the soil before and after the wetland purification. Results showed that the filtered water satisfied all requirements for water reuse, e.g., pH, turbidity, and total coliforms. The research then uniquely investigated the effect of greywater on the soil biodiversity and soil biomass using soil DNA extraction and the tea bag index testing method. The filtered greywater absorbed by soil decomposed the soil faster and stabilized it better compared to tap water-absorbed soil or unfiltered greywater. The DNA generation sequencing revealed no significant differences in alpha diversity between control and treatment samples. The beta diversity differences were significant. This nature-based solution can lead to reduced load on the sewage system, resulting in less wastewater generation.
Keywords:
sustainability
; water recycling
; grey water reuse
; soil biodiversity
; climate change
; water scarcity
1. Introduction
The United Nations Sustainable Development Goal (SDG) Target 6.3 [1] states: “By 2030, improve water quality by reducing pollution, eliminating dumping and minimizing release of hazardous chemicals and materials, halving the proportion of untreated wastewater and substantially increasing recycling and safe reuse globally”. One action to achieve this goal can be in the form of nature-based solutions which are “actions to protect, sustainably manage, and restore natural or modified ecosystems, that address societal challenges effectively and adaptively, simultaneously providing human well-being and biodiversity benefits” [2]. Nature-based solutions promote nature as a medium for climate mitigation and adaptation, such as the use of untreated wastewater for sustainable practices. The untreated wastewater includes the so-called greywater (GW), which is defined as all household wastewater except for toilet flushes (e.g., wastewater produced in bathtubs, sinks, showers, and laundry machines) [3]. With over two billion people living in high water stress globally [4], the reuse of the generated GW from buildings is now imperative. A sustainable water usage technique will also reduce pressure on the sewerage systems of the buildings. To use the water sustainably, a nature-based solution in the form of a constructed wetland is a very eco-friendly strategy.
Constructed wetlands were the first nature-based solutions applied to GW treatment [5]. To improve the water quality, constructed wetlands are a comprehensive approach to unify plants and microorganism's security [6]. Constructed wetlands are man-made wetlands, designed and constructed like a natural wetland systems for the treatment of wastewater [7]. They also include a sand filter, usually as the last filtration layer of the GW treatment process. The sand filter is filled with sand, in which bacteria grows over time, helping the continuous water filtration process. A biological layer develops on the sand surface with time and is known as the schmutzdecke [8]. The biological activity is stimulated by the accumulation of organic and inorganic debris and particulate matter on this layer [9]. The schmutzdecke plays a major role in the removal of particulate matter [8].
The constructed wetland has been recognized in several recent investigations as an environment-friendly wastewater treatment alternative [74,75,76,77,78] and as a sustainable means of treating stormwater. Compared to centralized systems, they have proved to be financially more advantageous in construction, operation, and maintenance [81]. This ascendency of the constructed wetland over conventional systems is due to its process stability under changing environmental conditions [69,82]. Currently, different types of wetlands are usually employed: surface flow wetlands, subsurface flow wetlands, and hybrid systems [72]. Their differences lie in the flow of water. In surface flow wetlands, water flows above ground, and generally has a soil bottom, emergent vegetation, and a water surface above the substrate. The water moves slowly through the wetland above the substrate. The near-surface layer of water is aerobic while the deeper waters and the substrate are usually anaerobic [10]. Whereas, subsurface flow wetlands are designed to keep the water level below the top of the rock or gravel media, thus minimizing human and ecological exposure [11]. Sub-surface flow wetlands can be classified into two basic flow systems: horizontal flow (HF) and vertical flow (VF). Horizontal and vertical flow systems have similar contaminant removal mechanisms, but different hydraulics [12]. In horizontal subsurface flow wetlands, the wastewater flows only through the substrate and flows horizontally [13]. Vertical systems are constructed so that water moves uniformly down or up through the substrate [14]. Different types of constructed wetlands may be combined to utilize the advantages of the different systems [83,84]. The VF-HF and HF-VF constructed wetlands are the most common hybrid systems [85].
In the last two decades, environmental, economic, and energy benefits arising from the reuse of GW treated by nature-based solutions have been recognized:
- Environmental benefits include recovering water resources and minimizing sewage production [5].
- Economic benefits are the reduction of water supply costs (through water recycling), which results in reduced household water bills [15].
- Energy benefits in the form of limited energy generation per family per year by reusing the greywater with the installed turbines, pipe system, storage and disinfection in high rise buildings [16].
The use of domestic GW for irrigation is becoming increasingly common in both developed and developing countries to cope with water scarcity. In the domestic household, GW is generated in high volume with a lower level of pollution [17]. However, its use may affect the microbial activity in the rhizosphere, which is the soil volume around the root that is strongly affected by root functioning [18]. This classical definition describes the rhizosphere as a four-dimensional (4D) object: 3D for volume and time for functioning [19]. The use or reuse of GW for growing plants may affect microbial activity, as the surfactants degrade the rhizosphere, and the use of plant transpiration and subsequent condensation to purify water [20]. The effectiveness of microbial communities associated with the rhizosphere and the physiology and internal dynamics of plants play important roles in GW reuse. Also, GW has the potential to increase soil alkalinity if applied on garden beds over a long time. It was observed [21] that the reuse of GW with a pH above 8 can lead to increased soil pH and reduced availability of some micro-nutrients for plants, thus affecting their growth. Therefore it is essential to check the properties of soil and plants each year, at the same time of the year, to build up a track record [22].
Considering its benefits, the reuse of GW in buildings is a growing trend in the market [23,24]. This study aims to reduce water consumption in more households but can be scaled up for commercial buildings, and industries in the future by reusing GW [25]. To investigate the effective use of GW, this research first reviews the literature about the available and existing nature-based solutions for GW treatment. Secondly, it identifies properties, guidelines, and policies on water reuse, defining an assessment matrix that can be employed to evaluate whether a GW treatment system is successful or not. Thirdly, it undertakes an empirical investigation of a novel nature-based system, through the following: (a) water testing: physiochemical tests of the GW and tap water; (b) soil testing: physiochemical tests of soil; and (c) biomass findings: tea bag index method and soil DNA extraction. Lastly, it draws conclusions and future recommendations for an efficient reuse of GW.
1.1. Greywater Classification, Parameters, and Guidelines
Greywater can be classified based on the organic content, which is determined by the source of the waste water; e.g., the GW collected from a kitchen sink has more organic content than GW from a bathtub. The two major types are light greywater (LGW) and dark greywater (DGW). LGW sources are bathrooms, showers, tubs, hand basins, and bathroom sinks, whereas DGW includes laundry facilities (washing and rinsing), dishwashers, and in some studies, also kitchen sinks [26,27,28,29,30]. Further classes of these two types are based on the composition of GW related to the products/elements contained in that particular source, as shown in Table 1. In this research, a nomenclature based on an alphabetical index is used to differentiate the GW origin.
The GW characteristics vary according to their origin [33]. The largest source of GW, with the least contamination, is Class A (light greywater). Class A has only 7% of total daily pollutant loads in domestic households [34] and originates from washbasins. Parametric studies that focused on the washbasin or Class A GW only have been summarized in Table 2.
The guidelines for GW reuse vary at national, provincial, and organizational levels worldwide as shown in Table 3. For example, the total concentration of coliforms is limited to 2.2 cfu/100 mL in the United States [45] but is reduced to 10 cfu/ 100 mL for the Australian state of New South Wales [46].
1.2. Soil Properties and Biodiversity
Understanding the GW reuse guidelines alone is not enough to ensure a safe and healthy ecosystem for plants to grow in. It is also important to investigate the plant's soil behavior due to the GW. Water is a fundamental factor in determining the health of an ecosystem where plants can grow, especially regarding soil properties. By absorbing GW, the soil may be damaged by harmful microorganisms, impeding plants’ growth. In this context, soil microbial biomass (bacteria, fungi, and protozoa), which is the mass of the soil organic matter's living components, can be employed as a proxy for the overall health of an ecosystem. Microbial biomass decomposes plant and animal waste, as well as organic matter in the soil, releasing carbon dioxide. This process of putting the organic matter back into the soil stabilizes the soil with time.
Changes in microbial productivity can also be used to predict changes in overall soil organic matter [51]. There is no consensus on the best method to quantify soil microbial biomass under diverse conditions either because the results have not been very reliable, or the procedures are too labor-intensive or too expensive [52,53]. As a way to overcome these difficulties, a combination of different methods can be used contextually to quantify the soil microbial mass. Amongst the most common methods used are the following:
- The chloroform fumigation-incubation (CFI) and chloroform fumigation-extraction (CFE) methods are biochemical techniques used to determine the distribution and diversity of soil microorganisms [54]. Fumigation methods give an estimate of microbial biomass as a whole and are related to microbial abundance rather than microbial biodiversity [55], as they measure the CO2 emissions of the microbial population alive and link it to the metabolism of that population. These methods are not accurate but are broadly used as they are very economical.
- Spectrophotometric methods are easy and rapid methods employed to find soil properties [56]. Based on near-infrared spectral absorption various elements of the soil can be simultaneously detected [57]. When these methods are used, it is possible to infer information about the mineral and organic composition of the soil, as well as microbial soil life [58], as the method can identify bacteria as gram-positive or gram-negative [58] through reflectance of a certain type of light [59]. However, these methods lack a clear perception of biodiversity due to low sensitivity and selectivity [60].
- Phospholipid fatty acids (PLFAs) are key components of microbial cell membranes. The analysis of PLFAs extracted from soils can provide information about the overall structure of terrestrial (microorganisms from soil and freshwater) microbial communities [61].
- The tea bag plantation method is used to find the decomposition rate of the soil that had absorbed the GW. The Tea Bag Index (TBI) method is a standardized and economical method to quantify microbial-driven decomposition by measuring the tea mass after being buried in soil over a certain period [62]. This decomposition rate (k) results from increased microbial biomass (cell formations) and higher metabolic activity. Two different tea types are widely accepted for this test: rooibos and green. Each data point corresponds to a replica, i. e. a pair of tea bags includes one rooibos and one green tea bag. Rooibos tea is easy to decompose, while green tea is characterized by a slower rate of decomposition. The fraction of green tea that remains after the rooibos tea is fully decomposed is used to estimate the amount of biomass that is fixed in the soil, which is called stabilization (S). The TBI is calculated from both types of tea and is based on these two factors (S and k). Hence, the 'S' indicates the amount of material that remains in the soil, and ‘k’ is the amount lost as a byproduct of the decomposition. Both ‘S’ and ‘k’ are functions of the initial and final weights of their respective tea bags [62].
- DNA sequencing is a method used to gather information about organisms and their environment [63]. The sequencing is done through a two-stage process. Firstly, with commercial DNA kits, the cells are broken down, involving mechanical and chemical processes [64]. Secondly, short single-stranded DNA fragments, known as primers, are amplified by artificial replication [65]. The amplified DNA fragments are then sequenced, and a taxonomy of all the different kinds of bacteria is generated. Based on that taxonomy, diversity indexes are calculated, namely the alpha (α) and beta (β) [66]. α-diversity is local diversity, which counts the types of microbes in a sample [67]. The higher the species richness the greater the α-diversity of a particular sample. α-diversity occurs within a given area within a region that is smaller than the entire distribution of the species [68]. β-diversity compares all the different kinds of microbes between two or more samples [69]. It gives an estimation of how similar or dissimilar the microbes of different communities are in different samples. β-diversity is the rate of change in species richness that occurs with a change in spatial scale [68]. Both α and β diversities are determined from the Phylogenetic tree, which is a representation of the evolutionary relationships among various taxa [70]. A simple calculation of the diversities is shown in Figure 1.
In Figure 1 the α-diversity, refers to the diversity within a particular habitat patch or ecosystem. It corresponds to the number of species within a patch. Among patch diversity, is the β-diversity, referring to the diversity between habitat patches or ecosystems. It corresponds to the total number of species that are unique to each of the ecosystems being compared.
The choice of diversity index and parameters depends on the sensitivity of the index to sample size, emphasis on rare or abundant taxa, and emphasis on species richness or species evenness [72]. DNA tests give a higher resolution of bacterial and fungal diversification, quantification of functional groups, and identification of microbes (up to species and genes level) [73].
The reuse of GW is an emerging field of research. However, despite the known effects of GW on soil physicochemical properties [90,91], the impact of GW on soil microbial species remains significantly underexplored. In this paper, for the first time, the impact of the GW on the soil microbial species is studied. This research not only studied the quality of purified GW through a specific constructed wetland working as a filtering medium but also the effects of GW on the soil species using the tea bag index and DNA tests. This allowed the microbial communities and multiple physicochemical attributes of the soil before and after absorbing GW to be correlated.
2. Materials and Methods
This study employs the following testing protocol. First, a GW soap was made that is similar in properties to Class A greywater. Second, a novel prototype of staircase wetlands (vertical constructed wetlands) was designed and fabricated, and the capacity of the plants in the staircase wetland to filter and purify GW was tested for eight weeks. Third, a soil biomass study using the tea bag index and soil DNA sequencing tests was carried out (after GW treatment was stopped) to determine the effects of irrigating plants with GW. The sequence of the events and tests is shown in the methodology flow chart (Figure 2).
Physicochemical tests on the soil were performed after taking soil samples around the plant before and after the treatment of GW. Tea bag index testing was done after the GW supply was stopped. Similarly, the soil samples were also collected for a soil DNA study before and after passing through the wetlands.
The soil and water physicochemical properties before and after absorbing the GW were evaluated according to the methods shown in Table 5. Except for pH and EC, all other tests were performed by Envirolab services in Sydney, NSW.
2.1. GW Soap Recipe
To produce Class A GW, water from the tap was mixed with a special GW soap, specifically designed for this experiment. Firstly, products commonly found in washroom sinks were tested to assess their pH by mixing 10 g of each product with 50 g of water, as shown in Table 4. The ingredients were tested with water to know their pH spectrum (acidic or alkaline). Products that could not blend well with the soap recipe such as mouthwash was not included.
The preparation of the GW soap followed a variation of the traditional soap recipe. First, 50 g of caustic soda was gently dissolved in 90 mL of distilled water to produce a lye solution. The solution was set to cool for 20 minutes. In the meantime, 200 g of coconut oil was melted in a microwave and then mixed with 100 g of olive oil and, subsequently, mixed with the lye solution. The mixture was stirred in a stainless steel immersion blender for 10 minutes until the solution was emulsified. The solution was then heated slowly for 50 minutes and let cool until it dropped below 80 °C. At this point, 40 g of toothpaste and 20 g of shaving cream were added to the solution. The mix was then added to a 650 mL plastic container and covered with a towel for a slow cooldown. After two weeks, the soap-like synthetic greywater was obtained, as shown in Figure 3a. Every week a slice of the soap was placed in the wash basin sink as shown in Figure 3b. The GW was supplied for a period of 8 weeks. In some weeks to increase the effect of GW, the solution was made more concentrated.
To increase the number of coliform bacteria in the influent greywater, small quantity of sheep manure (15-20g) was also added from the sink in specific weeks mentioned in the results and analysis section. This addition affected testing parameters 1.6 and 1.7 shown in Table 5.
2.2. Construction and Arrangement of Staircase Wetland
A vertical wetland in the form of a staircase was constructed. The staircase provided a base for terracotta plant pots that contained the wetlands while allowing the GW to flow under the action of gravity through the wetlands. Weekly testing of the GW samples before and after passing through the staircase wetland was performed.
Five terracotta pots (70 cm x 30 cm x 30 cm) were placed on five steps of a staircase, giving the look of a staircase garden. The five plant pots contained five strata (S1, C, S2, S2, and S4), with each stratum at a different height from the ground. The second stratum was the control stratum (C), which was irrigated with tap water and did not receive any GW. Terracotta pots were used because they are made of durable natural material, with a traditional aesthetic sense. The heavy pots provided firmness when placed on the staircase. Also, the thick clay walls of the pot helped to buffer temperature changes, which can stress and damage the roots of a plant [74]. A Silasec - waterproofing cement additive [75] was used on the inside of the plant pots providing a protective barrier; the cement additive coating dried in 24 hours as shown in Figure 4a. Prior to placing substrate material layers within the system, holes were drilled on either side of the terracotta pots to allow the flow of water from one pot to another under the action of gravity. Hydroponic clay pebbles were used as the first layer from the bottom. A sheet of geo fabric, shown in Figure 4b was used to separate the soil from substrate media. The soil then slowly dispersed over each terracotta pot until it was a few centimeters from the top. Wetland plants were planted in each pot at a depth of 5 to 10 cm. Four of the strata (S1, S2, S2, and S4), were then connected utilizing a plastic pipe to allow the flow of GW between each pot. The effluent flowed from one unit to the other under the action of gravity. Three plants were used in the constructed wetlands strata (S): Phalaris Arundinacea (S1 and C, Rhynchospora colorata H. Pfeiff (S2 and S2), and Zantedeschia aethiopica Spreng (S4), as shown in Figure 3c. These plants are commonly known as Gardener's-Garters, Starrush Whitetop, and Calla Lily, respectively. All three were selected based on previous reports showing their efficiency in converting GW to potentially reusable non-potable water in the literature review and existing examples [76,77].
The soil in conjunction with the plant absorbs the nutrient-rich GW as it filters it into reusable GW. The different substrate mediums in the terracotta plant pots ensure the contaminants from the GW are removed. The different small-diameter media (sand, clay pebbles, and gravel) below the soil layer have shown effectiveness [78] in treating GW. These layers in the pots cause slow water filtration, giving enough time for microorganisms and plants to remove nutrients from GW and ensuring that no soil is passed through from one pot plant to the next [79].
The sink at the top of the staircase was cylindrical, having a diameter of 36 cm and a height of 16 cm. The sink was programmed automatically to flow out 10 liters of water a day (in equal intervals) to the GW tank placed below the sink, as shown in Figure 4b. The overflow of the GW from the tank was discharged into the terracotta plant pots. After filtering from the pots under the action of gravity, the GW progressed into the sand filter and finally, the purified GW got collected in a water tank, as shown in Figure 4b.
The system had a multi-layered sand filter, coated with silicon Silasec cement additive before arranging the substrate layers. Except for the washed sand as the topmost layer in the filter, there were layers of hydroponic clay pebbles (like the terracotta plant pots) and gravel at the bottom. The gravel layer was at the bottom to ensure adequate drainage The layers were separated by geo fabric. The plastic pipes from the fourth terracotta pot were running straight into the sand filter. The overflow GW coming was collected in the water tank. Whereas the retained GW in the sand filter was creating the biofilm layer, known as the Schmutzdecke.
Water samples were collected every week from the sink and the water tank. A cross-section of the pots and sand filter is shown in Figure 5b,c.
Physicochemical tests on the soil were performed after taking soil samples from the plant pots before and after the treatment of GW. Tea bag index testing was done after the GW supply was stopped. Similarly, the soil samples were also collected for a soil DNA study before and after passing through the wetlands.
The soil and water physicochemical properties before and after absorbing the GW were evaluated according to the methods shown in Table 5. Except for pH and EC, all other tests were performed by Envirolab services in Sydney, NSW.
2.3. Tea Bag Plantation in Staircase Wetland
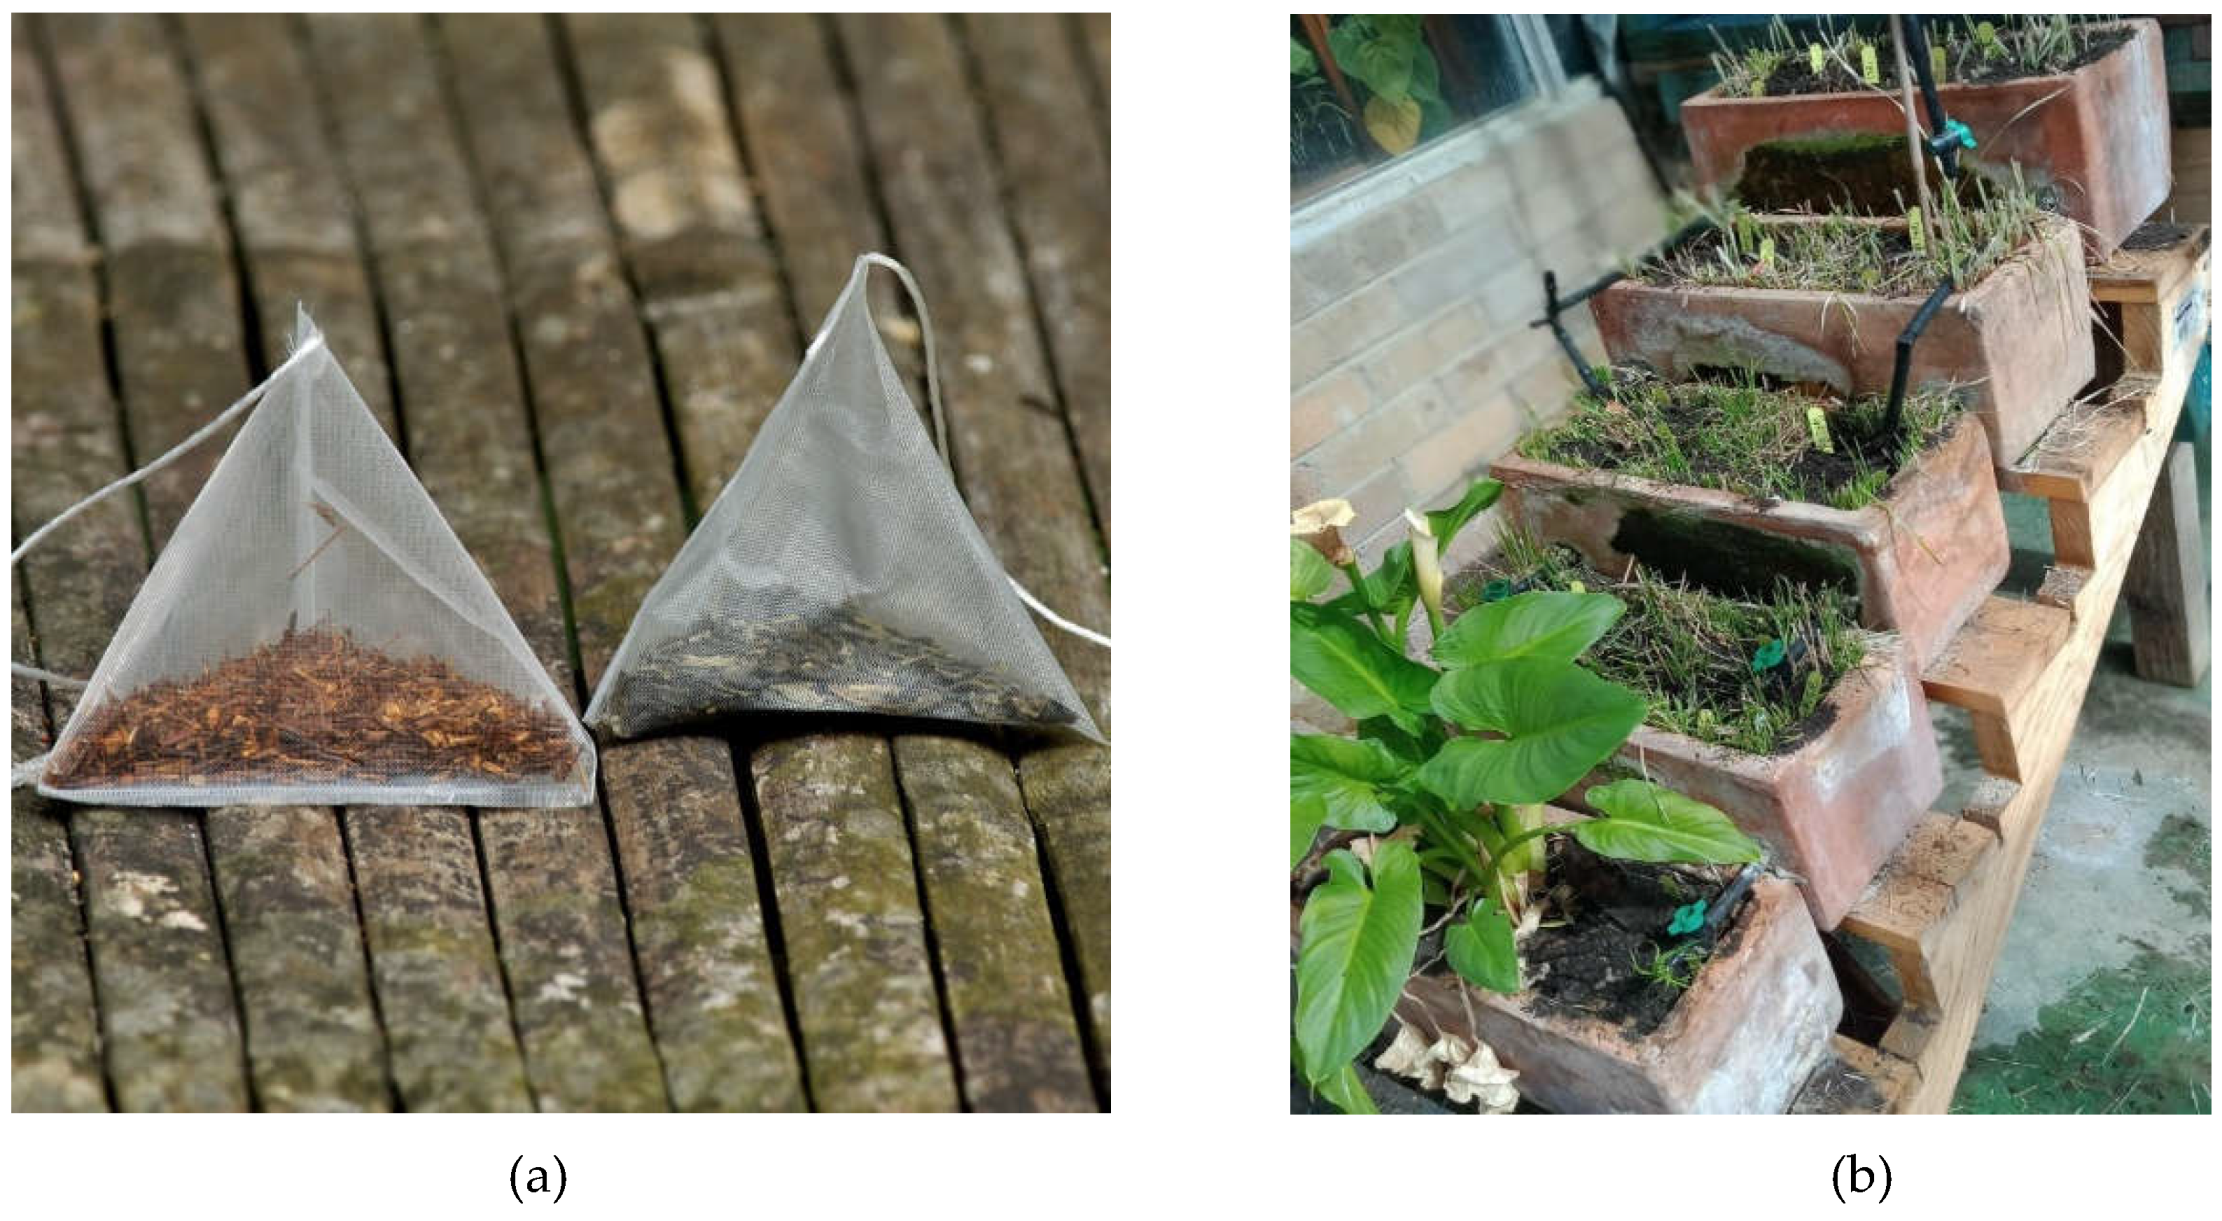
The tea bag index (TBI) method uses code-specific Lipton™ brand, i.e., Pyramid bags – EAN 8,714,100,770,542 and EAN 8,722,700,188,438, shown in Figure 6a. They are distributed by specific European grocery shops, e.g., Dutch supermarkets and Dutch Expat Shop. These particular Lipton tea bags from The Netherlands were used because they are standardized and tested tea bags used in the literature [80]. The tea bags were planted inside the soil in the form of replicates. Each replicate consisted of one green and one rooibos tea bag, making a pair. The primary reason for using two different types of tea bags in a single replicate was to assess the dynamics of two different types of material under the same environment and conditions [62]. Coding was done for the tea bag replicates based on their location, incubation time, and replicate number, e.g., the S1t4R2 code given to a replicate meant Stratum 1, time 4 days, and replicate 2. The stratum (S) refers to the terracotta pot plant, the time frame (t) is the number of days (incubation time) a replicate remained planted, and R2 means the replicate number (pair number) dig out at that particular t. The teabags were taken at incubation times (t) equal to 4, 7, 25, 35 and 246 days. The number of replicates varied for t=4, 7, and 25 days=had only one replicate, while t= 35 and 246 days had three replicates each (mean value was taken with error bars). The tea bags for t = 4 days were not considered because of getting damaged while digging them out.
The tea bags were planted the day the testing of the GW was completed. Before planting, the initial weight of the bags was noted, and a yellow tag was placed on the top of each replica’s plantation place to record the location as shown in Figure 6b below.
Figure 6.
(a) Tetrahedron-shaped synthetic tea bags used for Tea Bag Index (TBI) experiments, Rooibos tea (left) and Green tea (right) (b) Yellow stacks placed on the top of tea bag replicates of the planted areas.
Figure 6.
(a) Tetrahedron-shaped synthetic tea bags used for Tea Bag Index (TBI) experiments, Rooibos tea (left) and Green tea (right) (b) Yellow stacks placed on the top of tea bag replicates of the planted areas.
The main events of the TBI experimental process are described below:
Day 1- All replicates were weighed and planted in Stratum 1, 2, and 5.
Day 4 - The t4 replicates were taken out and stored in the refrigerator at 4 °C.
Day 7 - The t7 replicates were taken out. To remove the wet soil and the moisture, the replicates were put in the oven for a week at 50 °C.
Day 14 - The replicates were taken out of the oven. The dry soil around the replicates was removed through desiccation, and their final weights were noted.
Day 25 - The t25 replicates were taken out of the soil and stored in the refrigerator.
Day 35 - The t35 replicates were taken out of the soil and placed in the oven alongside the t25 replicates for one week at 50 °C.
Day 42 - The t25 and t35 replicates were taken out of the oven.
Day 246 - The t246 replicates were taken out of the soil and then stored in the oven for seven days before weighing their final weights. After desiccation, their final weights were noted.
The TBI method assumes that any litter incorporated into the soil consists of a labile (decomposable) and a recalcitrant (stable) fraction. Let M0 be the initial mass of the litter and Mt its mass at time t, to define the mass fraction as m(t)=M0/Mt. The decomposition is assumed to obey an exponential law with two reaction rates [81]:
Where a is the labile fraction, k is the decomposition rate of the labile fraction, (1-a) is the recalcitrant fraction and k’ is the decomposition rate of the recalcitrant fraction. The reaction rate of the recalcitrant fraction k’ is considered to be small incomparison to the labile fraction k, so that for small times Equation (1) can be reduced to
The TBI method used two different litters: The green tea, a labile litter, and the rooibos, a more recalcitrant litter. They show contrasting decomposition rates. We use subindexes “g” and “r” to encode the parameters of the green tea and the rooibos tea.
The parameter of the exponential model of Equation (2) were obtained by non linear regression. The range of values for variables ‘a’ and ‘k’ of Equation (2) was generated. Based on that range, the best possible fit was plotted. The generated curve touched most of the experimentally plotted points, and inferred values of a function where no experimental data was available.
If k is assumed constant, it can be obtained by isolating it from Equation (2):
In some cases the reaction rate may change with time. This is the case of the fractal kinetics That is characterized by a power-law dependency of the reaction rate with time [81]). OIn this case the reaction rate can be calculated by considering two-time points t1 and t2 in Equation (1):
where m1 and m2 are the fractions (m1 > m2) of the rooibos biomass that remains after incubation times t1 and t2 (t2 > t1). The reaction rate ‘k’ can be computed by isolating k and a from Equations (6) and (7). The resulting equations are:
These equations can be solved iteratively by using an initial guess for ‘a’ chosen from the range given by the curve fit in Equation (2); then compute k from Equation (6); next correcting a using Equation (7). The parameters k and a are iterative calculated using Eqs.(6) and (7). By using an appropriate initial guess value of ‘a’ this procedure is applied until k converges to a given value.
During this decomposition, some parts of the labile compounds stabilizes and become recalcitrant tea [82]. Environmental factors play important role in this stabilisation [83] resulting in a deviation of the actual decomposed fraction (i.e. limit value) ‘a’ from the hydrolysable (i.e. chemically labile) fraction H. This aberration can be interpreted as the suppressing effect of the environmental conditions on the decomposition of the labile fraction and will be referred to as stabilisation factor S:
The stabilization factor (S) was calculated as follows [80]:
where, Hg is the hydrolysable fraction of the green tea equal to 0.842. This constant value of Hg for green tea was quantified by the method proposed by Van Soest [84], in which the use of two detergents divides the plants cells into less digestible cell walls and mostly digestible cell contents (contains starch and sugars).
The decomposable fraction of rooibos tea ar was predicted as follows:
Where hydrolysable fraction constant of rooibos tea.
2.4. Soil DNA Tests
Before the treatment of GW, the soil samples (300 g) from each stratum were taken and stored at a temperature of -18°C. After the treatment of GW was completed another 300 g sample from each stratum was taken. All the soil samples were sent to the Metagen lab in Queensland [85] for DNA sequencing. The detailed methodology of the DNA sequencing technique used is shown in Appendix C.
2.5. Statistical Analysis
Statistical analyses were performed in the Microbiome Analyst [86] and R environment [87].The high dimensional β-diversity data generated in Microbiome analyst tool was further studied in the R environment using the UMAP and t-SNE analysis data techniques.
UMAP (Uniform Manifold Approximation and Projection) [88] and t-SNE(t-distributed stochastic neighbor embedding) [89] are a novel manifold learning technique for dimension reductions. Both takes high dimensional data and outputs a low dimensional graph, meaning a graph that can easily be looked at by showing the same relationship seen in high-dimensional data. In this study, dimensionality reduction is performed on pairwise β-diversity dissimilarities between samples. This quantifies differences in the overall taxonomic composition between two samples species. t-SNE moves the high dimensional β-diversity graph to a lower dimensional space points by points (β-diversity points), UMAP compresses that graph. UMAP is more time-saving due to the clever solution in creating a rough estimation of the high dimensional graph instead of measuring every point. Clustered β-diversity points are identified using Similarity scores. Similarity scores are calculated by taking the distances between each pair of high-dimensional points. Therefore, the nearest neighbor parameter of a reference point is the most important parameter in calculating the Similarity scores [88]. The higher Similarity scores (or a high β-diversity index) indicates a low level of similarity between soil species and vice versa [90]. The study looks into the Similarity scores of the soil samples before and after the use of GW treatment.
In this study, the first distinction (α and β diversity) has been the focus. The Chao 1 technique for the qualitative α-diversity and the Bray-Curtis dissimilarity index for the qualitative β-diversity is used. Also, the taxonomic phylum classification has been studied.
3. Results and Analysis
The experimental results were organized in three sections: Water tests, soil tests, and soil biomass (tea bag index and DNA sequencing)
3.1. Water Tests
Firstly, the tap water parameters were tested. The tap water only irrigated the control sample (C). The properties of tap water were found to be pH (6.8), EC (0.23 mS/cm), turbidity (<5NTU), TSS (<5 mg/L), FC (<10 cfu/100 mL), TC (92 cfu/100 mL) and BOD (<5 cfu/100 mL).
The GW results contain ‘before (influent)’ and ‘after (effluent)’ samples of water, shown in Figure 7a,b respectively. The Before samples were those samples of water that were collected before the treatment of GW and After samples were collected after the soil was treated with GW.
The turbidity levels were very high in the Before samples, shown in Figure 8a but the After samples always fell in the range of acceptable standards for irrigation water, as <5 NTU turbidity was noted in all the After samples. Sand filter was the primary factor in this decrease in turbidity [91]. The filtration system of the staircase wetland always kept the TSS value of the After samples shown in Figure 8bwithin the acceptable range of the water quality standards.
In Figure 9a, for the first three weeks (Week 1-3), there was no significant change noted in the pH of the Before and After samples. Because the GW entering and leaving the system had approximately equal pH range of > 7 or < 7.5. To check the credibility of the system, it was important to make the GW solution more concentrated while entering the wetlands. Therefore, the pH of the water entering the system (Before samples) was made more alkaline and was > 8 from weeks 4 to 8 but the water leaving the system (After samples) ranged again from > 7 to < 7.5. The purified GW remained in the acceptable standards shown in Table 3.
The EC value for Before samples kept increasing over time, as shown in Figure 9b. The After samples started at 0.34 mS in the first week and increased to 0.48 mS in week 8. An increase of 0.1 – 0.15 mS per week was noticed from week 3 onwards because the concentration of GW was increased from that week. This meant that increased concentration of GW resulted in an increase in EC, also shown in [92]. The purified GW EC value always remained in the acceptable level for irrigation water ( < 1.5 mS/cm) [93].
The BOD value for the water entering the system (Before samples) increased with time at an average rate of 7.22 mg/L per week as shown in Figure 9c. This rate of increase was related to the accumulation of the GW in the GW tank over a period of time [94]. The BOD of the After samples were always found below 5 mg/l, satisfying the water reuse guidelines mentioned in Table 3.
Despite increasing the faecal and total coliform values by ten times (from <10 to <100) of the Before samples from week 5, shown in Figure 10a,b, the filtration system of the staircase wetland still produced acceptable water quality values for the After samples. It meant the system was capable of cleaning even higher volumes of faecal and total coliform.
The GW sampling results proved the credibility of staircase wetland filtering ability because all the parameters after GW treatment were in the range of local and international standards (mentioned in Table 3) or in the same range as the tap water.
The water retention time of the purified GW in the water pot was seven days. From weeks 6 to 8 the retention time was increased to 14 days but the results were still the same for all the parameters. The only visible difference with the After samples was a light brownish color, which was because of the soil type used in the terracotta pot plants. The soil used was highly organic causing increased dissolved organic carbon, making the After samples light brown [95].
3.2. Soil Tests
Physiochemical tests of soil were done to measure different soil parameters, e.g., pH, electrical conductivity, total organic carbon, total nitrogen, and cation exchange capacity.
The soil pH values in Figure 11a for all the strata showed no significant change compared to before treatment; a normal soil pH varies between 6.5 and 7.2 [96]. Acidic soils have a pH of <7 and basic soils have a pH of >7 [97]. The soil became neutral, shown by Stratum 5 having a pH value of 6.9 at the end of the experiment, due to the action of hydroponic rocks as the base layer in all the strata, but overall the GW was not found to disturb the soil pH.
Electrical conductivity is one of the soil properties that is associated with the nature of soil composition (particle size distribution, mineralogy), structure (porosity, pore size distribution, connectivity), water content, and temperature [98]. It measures the amount of salts in soil (salinity of soil). The EC of before testing the soil sample (1856 µS/cm) shown in Figure 11b was in the range of fair to poor according to the EC suitability for irrigation chart [99]. With the GW treatment, it became 773 µS/cm in Stratum 4, which falls in the range of good to fair, also making it non-saline [100]. The EC in Stratum 1 was 263 µS/cm because of the high quantity of GW. The use of GW treatment left a positive impact on the EC of the soil.
Soils that have a total organic carbon (TOC) percentage >18% are considered as highly organic. As shown in Figure 12a the Control and Stratum 1 soil samples had approximately the same TOC percentage of 25% and 26%, respectively (1 mg/kg = 0.0001%). The GW treatment and the filtering across all the strata resulted in an increase of approximately 7% in S4. There is a decrease of 5% in the Control soil sample, which means TOC is directly proportional to the use of GW treatment. TOC transcends all chemical, physical, and biological soil property categories, thus being recognized as the most significant single soil health indicator [101,102] and is tied to several soil functions [103].
The percentage of total nitrogen (TN) was found to be low in the soil used to show in Figure 12b. The Before testing soil sample only had 7100 mg/kg (0.71%) of TN. Soil TN plays a key role in pedogenic processes, in addition to contributing to soil fertility [104]. The maximum TN found was in Stratum 1, which was only 1% more than the Before testing soil. The GW treatment didn’t increase the TN levels in the soil.
Cation exchange capacity (CEC) is the total capacity of soil to hold exchangeable cations. Soil with a CEC of >20 meq/100 g is considered to have characteristics of heavy clay soils and organic peats [105]. Also, such soil will have high nutrient status and high water holding capacity. In this study, all the stratum had a value >20 meq/100 g shown in Figure 12c. Due to filtration in staircase wetlands, the CEC value kept decreasing from Stratum 1 to Stratum 4 and decreased by approximately 34% in eight weeks.
3.3. Soil Biomass
3.3.1. Tea Bag Results
This project enabled 30 tea bag index in-field incubations (replicates included). However, not all the tea bag incubations ended in completed or meaningful measurements. The reasons for this incompletion include tea bags getting damaged during the withdrawal process from the soil or remaining inside the soil for too long (296 days) resulting in a complete decomposition. The ratio of the final weight to the initial weight of green and rooibos tea bags (in Control, Stratum 1, and 4) is shown in Figure 13.
The green tea mass loss averaged 62 % in C, 66 %, and 63 % in S1 and S4 respectively. The rooibos tea mass loss average 39 %, 39 %, and 43 % in C, S1, and S4 respectively shown in Figure 13.
The decomposition rate patterns for all the stratums are shown in Figure 14 and Figure 15. The mean decomposition rates for incubation time (t) 0 to 35 in C were 0.05 ± 0.0015, 0.08 ± 0.0033 in S1, and 0.08 ± 0.0030 in S4 respectively, as shown in Figure 14. The decomposition rate decreased non-linearly in C and S4 but increased in S1. As a gradual increase of approximately 3% was noted in the S1 decomposition rate, from 25 to 35 days of incubation, indicating the gradual opening of tissue internal structure by the microflora [81]. The main reason for this increased decomposition with time in S1 is the decrease in the concentration of the GW because the irrigation was stopped. The Carbon: Nitrogen (C: N) ratio increased in S1 from 33:1 to 42:1 in S4. The soil samples were taken before the TBI experiment started, therefore the carbon through filtration of the wetlands got accumulated in S4. If in case, more soil tests had been done later (during the TBI experimentation phase), the C: N would have decreased.
A high decomposition rate (k) was found in S4 initially, the main reason is the high TOC and pH values in S4 (shown in Figure 14) compared to S1 and C. The degradation processes increase between pH 6.5 and 8 [106]. The k value decreases by day 35 in S4 because it was not receiving any GW (the irrigation was stopped). The decomposition was always low in the C compared to S1 and S4, showing a clear effect of the GW on the decomposition rates.
Time-dependent reaction rates have been observed in experimental studies of reaction kinetics (reaction rate) [107]. The reaction rate ranged from 0.05 to 0.01 in C (0 - 246 days), 0.07 to 0.03 in S1 (0 - 35 days), and 0.15 to 0.01 in S4 (0 - 35 days), as shown in Figure 15. This decrease in the reaction rate with time across all stratum was also shown in Keuskamp et al. [62,108]. The faster reaction rate in S4 can be related to the high pH value because S4 reached 0.01 in only 35 days compared to C (246 days). It also means the gravity-actioned filtering of the stair-case wetland not only increased the TOC levels in S4 but also increased the reaction rate. As the GW kept on getting purified from S1 to S4 increasing the decomposition rate but also increased the stabilization as shown in Figure 16. The stabilization factor of S4 (0.17) was greater than C (0.14) and S1 (0.09). These results indicate that filtered GW absorbed in the soil stabilizes the soil better compared to tap water-absorbed soil or GW-absorbed soil.
3.3.2. Soil DNA Results
Figure 17a shows a comparison of α-diversity index between the Control (C) soil samples and all the other treatment soil samples taken from all the remaining strata(S1,S2,S3,S4). One soil sample was taken from each stratum and its diversity was examined. A T-test/ANOVA statistical method was used, and the taxonomic level was Feature-level. Chao 1 is an estimator based on abundance because it requires referring to the abundance of individuals belonging to a certain class in a sample [109]. An increase in the number of species was noticed for all the samples including the control (C). The highest increase was noticed for C at 38%, followed by S1 (32%), S2 (23%), S4 (19%), and S3 (12%). This showed that the tap water caused the maximum increase in species compared to GW. Also, the specie numbers decreased as the GW filtered from S1 to S2 and on, which means, concentrated levels of GW increases species richness in soil. The difference between S1 and C was only 6%, if there were more filtering mediums of C soil, then a decreasing trend in the soil species of tap water absorbed soil would have been noticed in a sample like the S stratums.
Null hypothesis test was used to show that there is no significant difference in the α-diversity of the Control and Treatment soil samples. The ANOVA test result showed the p-value (0.66) turned out to be greater than the level of significance 0.05) [110]. Therefore, the null hypothesis was accepted (p-value > 0.05: the null hypothesis is accepted; p-value ≤ 0.05: the null hypothesis is rejected). The statistical test of the α-diversity index (measure with Chao1 index) determined that the GW treatment didn’t change the α-diversity.
The results for β-diversity, Figure 17b were analyzed using the index of Bray - Curtis coupled with Principal Coordinate Analysis (PCA) [111]. The two main components are the ordination axes represented in the 2D PCoA graph as Axis 1 and Axis 2, representing the most representative proportion of the total variance of the data (41.3% in total). Two cluster formations are noted. In the Before treatment samples; S1, S4 and S2 (Orange, Green and Pink). In the After treatment samples; S2,S3 and S4 (Green, Yellow and Pink) are closely spaced. The ‘S1’ After samples is not part of any cluster because of high concentration of GW. The β-diversity data generated by PCA method was further studied using UMAP and t-SNE methods as shown in the Figure 18.
Low Similarity scores are noted in samples S1, S2 and S4 (Before use of GW/ or week 1) in the form of a cluster as shown in Figure 18. It means the similarity is high between the species of these samples. But after the treatment of GW, they form another cluster with high similarity score indicating dissimilarities between the species. This means that GW increases the β-diversity index or the dissimilarities of the species in the soil samples. The C sample had low scores even after GW treatment, showing the clear effect of the tap water use. As S1 and C had similar plant species but still the GW effect is significant. S3 results were hard to interpret because it’s the only sample whose index becomes low after GW use in t-SNE and goes up in UMAP.
The ANOSIM test was then used to test statistically the visual graphical results by confirming the effect of GW treatment. In the ANOISM test, the null hypothesis of the β-diversity was studied which compared the variation in the abundance and composition of species (or any other taxon) between sampling units [110] in terms of the experimental treatment(S1, S2, S3, S4) and control group (C). The null hypothesis statement here was “there are no differences between the members of the treatment and control groups”. The comparison revealed a significant β-diversity between the groups (ANOSIM R: 0.35776; p < 0.039), which suggests a related effect of the treatment with the composition of the soil microbiome. The p-value was <0.05 and a positive R-value means that the intergroup variation between groups (treatment and control) is significant [110], therefore null hypothesis was rejected.

Table 6.
R value in the ANOISM test, comparing all the treatment samples (S1, S2, S3, S4) with the control (C) and within the group. If R is positive: The variation between the groups is significant. If R = 0: The dissimilarities between and within the groups are the same on average. If R is negative: The variation within the group is greater than the variation between the groups).
| C | S1 | S2 | S3 | S4 | |
|---|---|---|---|---|---|
| C | - | 1 | 0.25 | 1 | 1 |
| S1 | 1 | - | 0 | 1 | 0 |
| S2 | 0.25 | 0 | - | 0 | -0.25 |
| S3 | 1 | 1 | 0 | - | 0.5 |
| S4 | 1 | 0 | -0.25 | 0.5 | - |
It is important to note that for the control group there were only two samples, unlike the treatment group with eight samples, which could cause bias in the analysis. For future research, it is recommended to take a similar number of samples for analysis. The highest number of sequencings was done for S4. The most richness was found in the S3 sample.
Figure 19 shows the actual abundance of different types of phyla in each soil sample (before and after) from every stratum. An average of about 150,000 OTUs (operational taxonomic units) were retrieved per sample. At a phylum level, the total number of phyla identified was 24.
The phylum taxonomy is mostly dominated by Proteobacteria followed by Bacteroidetes, which has also been the case in the GW study of small-diameter gravity sewers carrying GW [112]. Proteobacteria and Bacteroidetes were also found dominant in tap water studies [113], which has been seen in C soil samples that received tap water for eight weeks. Proteobacteria is typically observed in soil libraries [114]. Proteobacteria are a phylum of Gram-negative bacteria, very common in soil environments, and are related to a wide range of functions involved in carbon, nitrogen, and sulfur cycling [115]. Their relative richness, which increases with high organic carbon availability in soils, is in line with findings from previous studies [116,117]. The highest percentage of Proteobacteria in the After samples was found in S2.2, up to 61%. It is interesting to note the percentage increase of Proteobacteria in all the strata except for S4, as it increases by 4% from S1.1 to S1.2, 3% in C, 1% in S2, and 6% in S4, but in S4 it dips by approximately 9%. The number of Bacteroidetes was high in (30%). The observation of Bacteroidetes being the second most abundant phylum in this study is compatible with the wetland study done in [118]. S4 showed a surprising increase of 1% in Bacteroidetes from S4.1 to S4.2 compared to an approximate 8% decrease each in S1 and respectively, 13% decrease in S2 and 10% in S4. Bacteroidetes are ecologically important for proper soil functioning [118]. This change in behavior of S4 soil compared to the rest can be related to the plant ecotype rather than the use of the GW, because S1, S2, and S4 have long-leaved plants.
Firmicutes experienced the greatest increase in a specific phylum when comparing Before and After samples, as they jumped from 0.5% to 7.7% in S2.2. As S2 received the GW from S1 and has a different plant community to S1, the S2 readings are mostly changed compared to S1. But S1 and C, having the same plant community, have a mostly matched phylum abundance distribution. The Actinobacteria abundance hasn’t fluctuated overall and remained steady by ±1% in all the strata.
4. Conclusions
This research presents a nature-based solution for GW treatment, by multi-attributing GW and soil heterogeneity as regulators of soil biodiversity. The findings reveal that a staircase wetland can work as a reliable filtering medium to purify GW coming from the washbasin and make it reusable for domestic usage. The collected purified water from the constructed wetland was found to be compliant with the most relevant local and international codes and guidelines. A unique insight of this study came from the investigation of the effects of GW on soil biomass, which concluded that the GW that is filtered through wetlands experiences faster decomposition and is more stable compared to tap water-absorbed soil or highly concentrated GW. This decomposition difference was noticed to be greater in rooibos tea compared to green tea. The tap water-absorbed soil was only 6% richer in soil species compared to GW. A significant difference was noted comparing the β-diversity between GW and Control stratums (ANOISM R = Positive value). The α-diversity difference was not significant (p-value > 0.05).
This study highlighted that one type of plant and large soil volumes should be used to better discern the effects of GW on soil biodiversity. The soil used in this research was found to have high organic content and also contributed to the high decomposition rate. The research also recommends using garden soil for future studies. This study opens new frontiers by suggesting that different classes of GW be used for ornamental plant irrigation in expanding metagenomics studies contributing to the identification of soil bacteria that are useful to humans and ecosystem functions.
Acknowledgments
The authors thank Alejandro Montoya and Ph.D. student Julia Soares for experimental support and helpful discussions. We also thank Theo Gresley-Daines for building the staircase for the prototype. The Metagen Australia laboratory in Queensland and the Envirolab Services in Sydney are appreciated for their support in doing the DNA soil sequencing and soil testing respectively.
Conflicts of Interest
All authors have no conflict of interest.
Appendix A - Water tests summary (average values with standard deviations)
| pH | EC (mS/cm) | Turbidity (NTU) | TSS (mg/l) | BOD (cfu/100mL) | TC (cfu/100mL) | FC (cfu/100mL) | |
| Tap water (for Control stratum - ) | 6.8 ± 0.05 | 0.23 ± 0.02 | 0.70 ± 0.10 | <5 | <5 | 92 ± 2.50 | <10 |
| Sink (before passing wetlands) | 7.14 ± 0.30 (First 3 weeks) | 0.26 ± 0.15 | 92.6 ± 18.18 | 62.6 ± 13 | 33.1 ± 8.43 | <1000 | <100 |
| 8.16 ± 0.21 (Last 5 weeks) | |||||||
| Water tank (after passing wetlands) | 7.57 ± 0.20 (First 3 weeks) | 0.31 ± 0.09 | 0.68 ± 0.31 | <5 | <5 | 90.83 ± 5.56 | <10 |
| 7.46 ± 0.14 (Last 5 weeks) |
Appendix B - Soil tests summary (average values with standard deviations)
| pH | EC | TOC | TN | CEC | MC | Tea Bag Index Tests | Phylum Taxonomy | ||||
| ‘k’ | ‘S’ | Before GW Use | After GW Use | ||||||||
| Before treatment soil sample | 6.53 ± 0.05 | 1865 ± 51.31 |
300000± 10000 | 7100± 265 | 37.6 ± 0.57 |
60.6 ± 0.57 |
- |
- | 38% Bacteroidetes 53% Proteobacteria 2% Acidobacteria 2% Actinobacteria 1% Firmicutes 4% Others |
30% Bacteroidetes 56% Proteobacteria 3.5% Acidobacteria 2.5% Actinobacteria 3.5% Firmicutes 5% Others |
|
| Stratum - S1 | 6.53± 0.03 | 263 ± 3.33 |
266666± 3333 |
8033± 120 | 35.6 ± 0.33 |
67.3 ± 0.33 |
0.17 | 0.10 | 34% Bacteroidetes 55% Proteobacteria 1.5% Acidobacteria 3% Actinobacteria 1% Firmicutes 5% Others |
26% Bacteroidetes 59% Proteobacteria 4% Acidobacteria 4% Actinobacteria 1% Firmicutes 6% Others |
|
| Control Stratum - | 6.50 | 1093 ± 23.3 |
253333± 3333 |
6533± 67 |
38.3 ± 0.33 |
63.3 ± 0.33 |
0.24 | 0.08 | 38% Bacteroidetes 53% Proteobacteria 2% Acidobacteria 2% Actinobacteria 1% Firmicutes 4% Others |
30% Bacteroidetes 56% Proteobacteria 3.5% Acidobacteria 2.5% Actinobacteria 3.5% Firmicutes 5% Others |
|
| Stratum – S2 | - | - | - | - | - | - | - | - | 29% Bacteroidetes 60% Proteobacteria 3% Acidobacteria 3% Actinobacteria 1% Firmicutes 4% Others |
17% Bacteroidetes 61% Proteobacteria 5% Acidobacteria 3% Actinobacteria 8% Firmicutes 6% Others |
|
| Stratum – S3 | - | - | - | - | - | - | - | - | 28% Bacteroidetes 55% Proteobacteria 4% Acidobacteria 3% Actinobacteria 4% Firmicutes 6% Others |
18% Bacteroidetes 61% Proteobacteria 5% Acidobacteria 3% Actinobacteria 6.5% Firmicutes 6% Others |
|
| Stratum – S4 | 6.90 ± 0.05 | 773 ± 5.77 |
31444 ± 5773 |
7500± 100 | 25 | 66.3 ± 0.57 |
0.20 | 0.10 | 25% Bacteroidetes 65% Proteobacteria 2.5% Acidobacteria 2.5% Actinobacteria 1% Firmicutes 4% Others |
25% Bacteroidetes 57% Proteobacteria 5% Acidobacteria 3% Actinobacteria 5% Firmicutes 5% Others |
|
Appendix C - DNA Extraction Technique Used in the Metagen Lab Queensland
The 16S rRNA gene sequencing technique used for DNA extraction in this soil study was used for the identification, classification, and quantitation of microbes [119]. DNA of each stratum was extracted from 10 g subsamples of soil using a modification of the modular universal DNA extraction protocol [120]. Briefly, this involved 10 g soil samples being mixed with sterile garnet sand and lysis buffer before being processed in a SPEX 2010 Geno Grinder homogenizer (SPEX SamplePrep, NJ) at 1700 strokes per minute for 10 minutes. After centrifugation to remove soil particles, 9 mL of the supernatant was treated with a flocculant solution designed to remove humic acid contaminants. Samples were again centrifuged, and DNA was recovered from 10 mL of the supernatant using SPRI beads [121]. The purified DNA was then eluted in 200 µl of Tris-HCl pH 8.0 and was assessed for yield and quality using the Quantifluor dsDNA system (Promega, MI) and agarose gel electrophoresis.
The metabarcoding of eukaryotic and bacterial/archaeal communities was conducted using the primer sets NF1/18S2rB [122] and Pro341F/Pro805R [123], respectively. A two-step PCR protocol was used to generate dual-indexed amplicons adapted from the Illumina protocol for 16S Metagenomic Sequencing Library Preparation. The naïve Bayesian Classifier was used to assign taxonomy to genus level for the 16S amplicon with version 128 of the Silva reference database [124].
Appendix D - Teabag Index (TBI) Calculation Sheets
TBI index calculation sheet for Control.
| Equation (2) | Equation (8) | Equation (2) | Equation (3) | Equation (6) | Equation (7) | |||||||
|
Time (t) |
M0/Mt – Green Tea |
ag (0.6936 to 0.8342) |
k (0.08278 to 0.1422) |
m(t) |
S |
M0/Mt – Rooibos Tea |
ar (0.4111 to 0.7279) |
k (0.0168 to 0.09136) |
m(t) |
Constant ‘k’ |
Variable ‘k’ |
ar |
| 0 | 1 | - | - | 1 | - | 1 | - | - | 1 | - | - | - |
| 7 | 0.61 | 0.72 | 0.10 | 0.62 | 0.14 | 0.79 | 0.55 | 0.03 | 0.86 | 0.06 | 0.05 | 0.59 |
| 25 | 0.31 | 0.72 | 0.10 | 0.32 | 0.14 | 0.62 | 0.55 | 0.03 | 0.65 | 0.05 | 0.03 | 0.49 |
| 35 | 0.31±0.010 | 0.72 | 0.10 | 0.29 | 0.14 | 0.58±0.008 | 0.55 | 0.03 | 0.58 | 0.05±0.001 | 0.02 | 0.39 |
| 246 | 0.25±0.004 | 0.72 | 0.10 | 0.27 | 0.14 | 0.41±0.015 | 0.55 | 0.03 | 0.44 | - | 0.01 | 0.29 |
TBI index calculation sheet for Control.
| Equation (2) | Equation (8) | Equation (2) | Equation (3) | Equation (6) | Equation (7) | |||||||
|
Time (t) |
M0/Mt – Green Tea |
ag (0.6936 to 0.8342) |
k (0.08278 to 0.1422) |
m(t) |
S |
M0/Mt – Rooibos Tea |
ar (0.4111 to 0.7279) |
k (0.0168 to 0.09136) |
m(t) |
Constant ‘k’ |
Variable ‘k’ |
ar |
| 0 | 1 | - | - | 1 | - | 1 | - | - | 1 | - | - | - |
| 7 | 0.58 | 0.76 | 0.11 | 0.58 | 0.09 | 0.77 | 0.56 | 0.05 | 0.82 | 0.07 | 0.07 | 0.56 |
| 25 | 0.26 | 0.76 | 0.11 | 0.28 | 0.09 | 0.56 | 0.56 | 0.05 | 0.57 | 0.07 | 0.05 | 0.50 |
| 35 | 0.26±0.009 | 0.76 | 0.11 | 0.25 | 0.09 | 0.52±0.012 | 0.56 | 0.05 | 0.51 | 0.08±0.003 | 0.03 | 0.30 |
| 246 | 0.23±0.021 | 0.76 | 0.11 | 0.23 | 0.09 | 0.40±0.013 | 0.56 | 0.05 | 0.43 | - | - | - |
TBI index calculation sheet for Stratum 1.
| Equation (2) | Equation (8) | Equation (2) | Equation (3) | Equation (6) | Equation (7) | |||||||
|
Time (t) |
M0/Mt – Green Tea |
ag (0.6121 to 0.7858) |
k (0.1064 to 0.2179) |
m(t) |
S |
M0/Mt – Rooibos Tea |
ar (0.2254 to 0.9446) |
k (-0.01546 to 0.09644) |
m(t) |
Constant ‘k’ |
Variable ‘k’ |
ar |
| 0 | 1 | - | - | 1 | - | 1 | - | - | 1 | - | - | - |
| 7 | 0.52 | 0.69 | 0.16 | 0.52 | 0.17 | 0.74 | 0.58 | 0.04 | 0.85 | 0.09 | 0.15 | 0.37 |
| 25 | 0.32 | 0.69 | 0.16 | 0.31 | 0.17 | 0.58 | 0.58 | 0.04 | 0.62 | 0.09 | 0.06 | 0.38 |
| 35 | 0.28±0.010 | 0.69 | 0.16 | 0.30 | 0.17 | 0.56±0.008 | 0.58 | 0.04 | 0.55 | 0.08±0.003 | 0.01 | 0.25 |
| 246 | 0.30±0.057 | 0.69 | 0.16 | 0.30 | 0.17 | 0.35±0.050 | 0.58 | 0.04 | 0.41 | - | - | - |
TBI index calculation sheet for Stratum 4.
References
- Water, U. Target 6.3 – Water quality and wastewater. Sustainable Development Goal 6 2022. Available from: https://www.sdg6monitoring.org/indicators/target-63/.
- IUCN, I.U.f.C.o.N. Nature-based Solutions. 2022 [cited 2022. Available from: https://www.iucn.org/commissions/commission-ecosystem-management/our-work/nature-based-solutions.
- Eriksson, E., et al., Characteristics of grey wastewater. Urban Water, 2002. 4(1): p. 85-104.
- UNICEF. Water scarcity. 2022 [cited 2022. Available from: https://www.unicef.org/wash/water-scarcity.
- Boano, F., et al., A review of nature-based solutions for greywater treatment: Applications, hydraulic design, and environmental benefits. Science of The Total Environment, 2020. 711: p. 134731.
- Agency, E.P. Economic Beneifts of Wetlands. 2006. Available from: https://nepis.epa.gov/Exe/ZyNET.exe/2000D2PF.TXT?ZyActionD=ZyDocument&Client=EPA&Index=2006+Thru+2010&Docs=&Query=&Time=&EndTime=&SearchMethod=1&TocRestrict=n&Toc=&TocEntry=&QField=&QFieldYear=&QFieldMonth=&QFieldDay=&IntQFieldOp=0&ExtQFieldOp=0&XmlQuery=&File=D%3A%5Czyfiles%5CIndex%20Data%5C06thru10%5CTxt%5C00000000%5C2000D2PF.txt&User=ANONYMOUS&Password=anonymous&SortMethod=h%7C-&MaximumDocuments=1&FuzzyDegree=0&ImageQuality=r75g8/r75g8/x150y150g16/i425&Display=hpfr&DefSeekPage=x&SearchBack=ZyActionL&Back=ZyActionS&BackDesc=Results%20page&MaximumPages=1&ZyEntry=1&SeekPage=x&ZyPURL.
- Wu, H., et al., A review on the sustainability of constructed wetlands for wastewater treatment: Design and operation. Bioresource Technology, 2015. 175: p. 594-601.
- Yildiz, B.S., 18 - Water and wastewater treatment: biological processes, in Metropolitan Sustainability, F. Zeman, Editor. 2012, Woodhead Publishing. p. 406-428.
- Klancko, R.J., Drinking Water Regulation and Health. Frederick W. Pontius, ed. 2003. John Wiley and Sons, New York. 1,029 pp. $150 cloth. Environmental Practice, 2005. 7(1): p. 56-57.
- Davis, L., A handbook of constructed wetlands: a guide to creating wetlands for: agricultural wastewater, domestic wastewater, coal mine drainage, stormwater in the Mid-Atlantic Region. 1995.
- Halverson, N., Review of Constructed Subsurface Flow vs. Surface Flow Wetlands. 2004.
- Halverson, N., Review of constructed subsurface flow vs. surface flow wetlands. 2004, Savannah River Site (SRS), Aiken, SC (United States).
- Kadlec, R.H. and S. Wallace, Treatment wetlands. 2008: CRC press.
- Stottmeister, U., et al., Effects of plants and microorganisms in constructed wetlands for wastewater treatment. Biotechnology advances, 2003. 22(1-2): p. 93-117.
- Byrne, J., et al., Quantifying the Benefits of Residential Greywater Reuse. Water, 2020. 12(8).
- Hadad, E., et al., Simulation of dual systems of greywater reuse in high-rise buildings for energy recovery and potential use in irrigation. Resources, Conservation and Recycling, 2022. 180: p. 106134.
- J, N., Waste water reuse studies and trial in Canberra. . Desalination. 106(106): p. 399–405.
- Hiltner, L., Uber nevere Erfahrungen und Probleme auf dem Gebiet der Boden Bakteriologie und unter besonderer Beurchsichtigung der Grundungung und Broche. Arbeit. Deut. Landw. Ges. Berlin, 1904. 98: p. 59-78.
- Kuzyakov, Y. and B.S. Razavi, Rhizosphere size and shape: Temporal dynamics and spatial stationarity. Soil Biology and Biochemistry, 2019. 135: p. 343-360.
- Garland, J.L., et al., Graywater processing in recirculating hydroponic systems: phytotoxicity, surfactant degradation, and bacterial dynamics. Water Research, 2000. 34(12): p. 3075-3086.
- Christova-Boal, D., R.E. Eden, and S. McFarlane, An investigation into greywater reuse for urban residential properties. Desalination, 1996. 106(1): p. 391-397.
- Australia, L.S. Testing soils and plants. 2015 [cited 2020. Available from: https://www.landscape.sa.gov.au/mr/publications/testing-soils-and-plants.
- FIEMG, Construction industry chamber, in Construction Sustainability Guide. 2008. p. 60.
- Proença, L.C. and E. Ghisi, Assessment of Potable Water Savings in Office Buildings Considering Embodied Energy. Water Resources Management, 2013. 27(2): p. 581-599.
- Couto, E.d.A.d., et al., Greywater treatment in airports using anaerobic filter followed by UV disinfection: an efficient and low cost alternative. Journal of Cleaner Production, 2015. 106: p. 372-379.
- Leonard, M., et al., Field study of the composition of greywater and comparison of microbiological indicators of water quality in on-site systems. Environmental Monitoring and Assessment, 2016. 188(8): p. 475.
- Judd, B.J.A.P.P.J.R.S.S., Grey water characterisation and its impact on the selection and operation of technologies for urban reuse. Water science and technology : a journal of the International Association on Water Pollution Research, 2004. 50(2): p. 157–164.
- Hourlier, F., et al., Formulation of synthetic greywater as an evaluation tool for wastewater recycling technologies. Environmental technology, 2010. 31: p. 215-23.
- Harsha, S.F.A., Deletic; Belinda E. Hatt; Perran L.M., Cook, Nitrogen removal in greywater living walls: Insights into the governing mechanisms. Water, 2018. 10(4).
- Ghaitidak, D.M. and K.D. Yadav, Characteristics and treatment of greywater—a review. Environmental Science and Pollution Research, 2013. 20(5): p. 2795-2809.
- Michael, L.P., Coghlan, Domestic water use study in Perth, Western Australia 1998-2001. 2003, Water corporation: Perth Australia.
- Gopalsamy, P., G. Edwin, and N. Muthu, Constructed Wetlands for the Treatment of Domestic Grey Water: An Instrument of the Green Economy to Realize the Millennium Development Goals. 2013. p. 313-321.
- Edwin, G.A., P. Gopalsamy, and N. Muthu, Characterization of domestic gray water from point source to determine the potential for urban residential reuse: a short review. Applied Water Science, 2014. 4(1): p. 39-49.
- Friedler, E., Quality of Individual Domestic Greywater Streams and its Implication for On-Site Treatment and Reuse Possibilities. Environmental Technology, 2004. 25(9): p. 997-1008.
- Shaikh, I.N. and M.M. Ahammed, Quantity and quality characteristics of greywater: A review. Journal of Environmental Management, 2020. 261: p. 110266.
- BANACH, J.L. and H.J. van der FELS-KLERX, Microbiological Reduction Strategies of Irrigation Water for Fresh Produce. Journal of Food Protection, 2020. 83(6): p. 1072-1087.
- Saroj BP, S.M.G., Performance of greywater treatment plant by the economical way for Indian rural development. International Journal of ChemTech Research, 2011. 3(4): p. 1808–1815.
- Samayamanthula, D.R., C. Sabarathinam, and H. Bhandary, Treatment and effective utilization of greywater. Applied Water Science, 2019. 9(4): p. 90.
- Oktor, K. and D. Çelik, Treatment of wash basin and bathroom greywater with Chlorella variabilis and reusability. Journal of Water Process Engineering, 2019. 31: p. 100857.
- Zipf, M.S., I.G. Pinheiro, and M.G. Conegero, Simplified greywater treatment systems: Slow filters of sand and slate waste followed by granular activated carbon. Journal of Environmental Management, 2016. 176: p. 119-127.
- Al-Jayyousi, O.R., Greywater reuse: towards sustainable water management. Desalination, 2003. 156(1): p. 181-192.
- Jefferson, B., et al., Grey water characterisation and its impact on the selection and operation of technologies for urban reuse. Water Science and Technology, 2004. 50(2): p. 157-164.
- Jamrah, A., et al., Evaluating greywater reuse potential for sustainable water resources management in Oman. Environmental Monitoring and Assessment, 2007. 137(1): p. 315.
- Ziemba, C., et al., Chemical composition, nutrient-balancing and biological treatment of hand washing greywater. Water Research, 2018. 144: p. 752-762.
- Division, U.S.E.P.A.O.o.W.M.M.S., N.R.M.R.L.T. Transfer, and S. Division, Guidelines for water reuse. 2004: US Environmental Protection Agency.
- Health, N.S.W., Greywater reuse in Sewered single Domestic Premises. Sydney: NSW Government. 2000.
- Donovan, J.F. and J.E. Bates, Guidelines for Water Refuse. 1980.
- James, D., et al., Grey water reclamation for urban non-potable reuse - challenges and solutions a review. 2016.
- Sanz, L.A. and B.M. Gawlik, Water reuse in Europe. European Commission–Joint Research Centre–Institute for Environment and Sustainability, 2014.
- Bastian, R. and D. Murray, Guidelines for water reuse. EPA Office of Research and Development: Washington, DC, USA, 2012.
- Ltd, S.Q.P. Fact Sheets Microbial Biomass. 2020. Available from: http://www.soilquality.org.au/factsheets/microbial-biomass-qld#:~:text=Soil%20microbial%20biomass%20(bacteria%2C%20fungi,dioxide%20and%20plant%20available%20nutrients.
- Hartmann, M., et al., Distinct soil microbial diversity under long-term organic and conventional farming. The ISME Journal, 2015. 9(5): p. 1177-1194.
- Makarov, M.I., et al., Determination of carbon and nitrogen in microbial biomass of southern-Taiga soils by different methods. Eurasian Soil Science, 2016. 49(6): p. 685-695.
- Kandeler, E., Chapter 7 - Physiological and Biochemical Methods for Studying Soil Biota and Their Functions, in Soil Microbiology, Ecology and Biochemistry (Fourth Edition), E.A. Paul, Editor. 2015, Academic Press: Boston. p. 187-222.
- Zhang, Z., et al., Soil bacterial quantification approaches coupling with relative abundances reflecting the changes of taxa. Scientific reports, 2017. 7(1): p. 4837-4837.
- Phillips, K. Methods of Soil Analysis Using Spectrophotometric Technology. 2015. Available from: https://blog.hunterlab.com/blog/color-measurement/methods-soil-analysis-using-spectrophotometric-technology/#:~:text=Compared%20to%20other%20methods%20of,of%20various%20soil%20materials%20simultaneously.
- Ben-Dor, E., et al., Imaging Spectrometry for Soil Applications, in Advances in Agronomy. 2008, Academic Press. p. 321-392.
- Chon, N.Q., Soil microbial biomass. 2021, Eurofins.
- Berezin, S., et al., Replacing a Century Old Technique - Modern Spectroscopy Can Supplant Gram Staining. Scientific reports, 2017. 7(1): p. 3810-3810.
- Assadi, Y., M.A. Farajzadeh, and A. Bidari, 2.10 - Dispersive Liquid–Liquid Microextraction, in Comprehensive Sampling and Sample Preparation, J. Pawliszyn, Editor. 2012, Academic Press: Oxford. p. 181-212.
- Quideau, S.A., et al., Extraction and Analysis of Microbial Phospholipid Fatty Acids in Soils. Journal of visualized experiments : JoVE, 2016(114): p. 54360.
- Keuskamp, J.A., et al., Tea Bag Index: a novel approach to collect uniform decomposition data across ecosystems. Methods in Ecology and Evolution, 2013. 4(11): p. 1070-1075.
- Zwolinski, M., DNA Sequencing: Strategies for Soil Microbiology. Soil Science Society of America Journal - SSSAJ, 2007. 71.
- Alberts B; Johnson A; Lewis J, e.a., Isolating, Cloning, and Sequencing DNA, in Molecular Biology of the Cell. 2002, Garland Science: New York.
- Oleg A. Shchelochkov. Primer. 2022. Available from: https://www.genome.gov/genetics-glossary/Primer.
- Martins, I.S., et al., Ant taxonomic and functional beta-diversity respond differently to changes in forest cover and spatial distance. Basic and Applied Ecology, 2022. 60: p. 89-102.
- Willis, A.D., Rarefaction, Alpha Diversity, and Statistics. Frontiers in Microbiology, 2019. 10.
- Moore, J.C., Diversity, Taxonomic versus Functional, in Encyclopedia of Biodiversity (Second Edition), S.A. Levin, Editor. 2013, Academic Press: Waltham. p. 648-656.
- Knight, C.A.L.R., Species divergence and the measurement of microbial diversity. Federation of European Microbiological Societies FEMS, Microbiol Rev 2008. 32: p. 557–578.
- Choudhuri, S., Chapter 9 - Phylogenetic Analysis**The opinions expressed in this chapter are the author’s own and they do not necessarily reflect the opinions of the FDA, the DHHS, or the Federal Government, in Bioinformatics for Beginners, S. Choudhuri, Editor. 2014, Academic Press: Oxford. p. 209-218.
- Sirami, C., Biodiversity in heterogeneous and dynamic landscapes, in Oxford Research Encyclopedia of Environmental Science. 2016.
- Morris, E.K., et al., Choosing and using diversity indices: insights for ecological applications from the German Biodiversity Exploratories. Ecology and evolution, 2014. 4(18): p. 3514-3524.
- Cho, J.C. and J.M. Tiedje, Bacterial species determination from DNA-DNA hybridization by using genome fragments and DNA microarrays. Applied and environmental microbiology, 2001. 67(8): p. 3677-3682.
- Janssen, D. Choosing Clay or Plastic Pots for Plants. 2022. Available from: https://lancaster.unl.edu/hort/articles/2002/clay-or-plastic-pots.
- Bondall. Silasec - Waterproofing Cement Paint. 2021. Available from: https://www.bondall.com/concrete-additives/silasec/.
- Wolverton, B.C. and J.D. Wolverton, Growing Clean Water: Nature's Solution to Water Pollution. 2001: WES, Incorporated.
- Chowdhury, R. and J. Sulaiman Abaya, An Experimental Study of Greywater Irrigated Green Roof Systems in an Arid Climate. Journal of Water Management Modeling, 2018. 2018.
- Pradhan, S., S.G. Al-Ghamdi, and H.R. Mackey, Greywater treatment by ornamental plants and media for an integrated green wall system. International Biodeterioration & Biodegradation, 2019. 145: p. 104792.
- Oh, K.S., et al., Optimizing the in-line ozone injection and delivery strategy in a multistage pilot-scale greywater treatment system: System validation and cost-benefit analysis. Journal of Environmental Chemical Engineering, 2015. 3(2): p. 1146-1151.
- Keuskamp, J.A., et al., Tea Bag Index: a novel approach to collect uniform decomposition data across ecosystems. Methods in Ecology and Evolution, 2013. 4(11): p. 1070-1075.
- Dossou-Yovo, W., et al., Tea Bag Index to Assess Carbon Decomposition Rate in Cranberry Agroecosystems. Soil Systems, 2021. 5(3): p. 44.
- Prescott, C.E., Litter decomposition: what controls it and how can we alter it to sequester more carbon in forest soils? Biogeochemistry, 2010. 101(1): p. 133-149.
- Berg, B. and V. Meentemeyer, Litter quality in a north European transect versus carbon storage potential. Plant and Soil, 2002. 242(1): p. 83-92.
- Soest, P.V., Use of detergents in the analysis of fibrous feeds. II. A rapid method for the determination of fiber and lignin. Journal of the Association of official Agricultural Chemists, 1963. 46(5): p. 829-835.
- Australia, M. 2021. Available from: https://metagen.com.au/.
- MicrobiomeAnalyst. 2021. Available from: https://www.microbiomeanalyst.ca/.
- R-Project. 2021. Available from: https://www.r-project.org/.
- McInnes, L., J. Healy, and J. Melville, Umap: Uniform manifold approximation and projection for dimension reduction. arXiv preprint arXiv:1802.03426, 2018.
- Van der Maaten, L. and G. Hinton, Visualizing data using t-SNE. Journal of machine learning research, 2008. 9(11).
- Xiao, H., J. Liu, and F. Li, Both alpha and beta diversity of nematode declines in response to moso bamboo expansion in south China. Applied Soil Ecology, 2023. 183: p. 104761.
- Association, I.W. Simple Options to Remove Turbidity. 2022. Available from: https://www.iwapublishing.com/news/simple-options-remove-turbidity.
- Pinto, U., B.L. Maheshwari, and H.S. Grewal, Effects of greywater irrigation on plant growth, water use and soil properties. Resources, Conservation and Recycling, 2010. 54(7): p. 429-435.
- Merhaut, D.J. Get Cultured: Monitoring electrical conductivity of irrigation water and rooting media. 2022. Available from: https://ucnfanews.ucanr.edu/Articles/Get_Cultured/Monitoring_electrical_conductivity_of_irrigation_water_and_rooting_media_593/.
- Delzer, G. and S. McKenzie, FIVE-DAY BIOCHEMICAL 7.0 OXYGEN DEMAND.
- Kritzberg, E.S., et al., Browning of freshwaters: Consequences to ecosystem services, underlying drivers, and potential mitigation measures. Ambio, 2020. 49(2): p. 375-390.
- Bolan, N.S. and K. Kandaswamy, pH, in Encyclopedia of Soils in the Environment, D. Hillel, Editor. 2005, Elsevier: Oxford. p. 196-202.
- Fearnside, P.M., The effects of cattle pasture on soil fertility in the Brazilian Amazon: consequences for beef production sustainability. Tropical Ecology, 1980. 21(1): p. 125-137.
- Bai, W., L. Kong, and A. Guo, Effects of physical properties on electrical conductivity of compacted lateritic soil. Journal of Rock Mechanics and Geotechnical Engineering, 2013. 5(5): p. 406-411.
- services, B.p. Electrical Conductivity Conversion Chart. 2022. Available from: http://bps.net.au/cms/wp-content/uploads/2015/04/EC-Conversion-Chart.pdf.
- coalition, S.D.s.h. Soil Electrical Conductivity. 2022. Available from: https://www.sdsoilhealthcoalition.org/technical-resources/chemical-properties/soil-electrical-conductivity/.
- Doran, J.W. and T.B. Parkin, Quantitative Indicators of Soil Quality: A Minimum Data Set, in Methods for Assessing Soil Quality. 1997. p. 25-37.
- Lal, R., Soil health and carbon management. Food and Energy Security, 2016. 5(4): p. 212-222.
- Lal, R., Societal value of soil carbon. Journal of Soil and Water Conservation, 2014. 69(6): p. 186A-192A.
- Binkley, D. How Nitrogen-Fixing Trees Change Soil Carbon. in Tree Species Effects on Soils: Implications for Global Change. 2005. Dordrecht: Springer Netherlands.
- Organization, S.Q. Cations and Cation Exchange Capacity. 2022. Available from: https://www.soilquality.org.au/factsheets/cations-and-cec-tas.
- Neina, D., The role of soil pH in plant nutrition and soil remediation. Applied and Environmental Soil Science, 2019. 2019.
- Kopelman, R., Fractal Reaction Kinetics. Science, 1988. 241(4873): p. 1620-1626.
- Duddigan, S., et al., Chemical underpinning of the tea bag index: an examination of the decomposition of tea leaves. Applied and Environmental Soil Science, 2020. 2020.
- Chao, A. and C.-H. Chiu, Species Richness: Estimation and Comparison, in Wiley StatsRef: Statistics Reference Online. p. 1-26.
- Xia, Y., J. Sun, and D.-G. Chen, Statistical analysis of microbiome data with R. Vol. 847. 2018: Springer.
- Whitehead, H. and S. Dufault, Techniques for analyzing vertebrate social structure using identified individuals. Adv Stud Behav, 1999. 28: p. 33-74.
- Zheng, T., et al., Greywater: Understanding biofilm bacteria succession, pollutant removal and low sulfide generation in small diameter gravity sewers. Journal of Cleaner Production, 2020. 268: p. 122426.
- Zhang, C., et al., The Bacterial Community Diversity of Bathroom Hot Tap Water Was Significantly Lower Than That of Cold Tap and Shower Water. Frontiers in Microbiology, 2021. 12.
- Janssen, P.H., Identifying the Dominant Soil Bacterial Taxa in Libraries of 16S rRNA and 16S rRNA Genes. Applied and Environmental Microbiology, 2006. 72(3): p. 1719-1728.
- Spain, A.M., L.R. Krumholz, and M.S. Elshahed, Abundance, composition, diversity and novelty of soil Proteobacteria. The ISME Journal, 2009. 3(8): p. 992-1000.
- Fierer, N., M.A. Bradford, and R.B. Jackson, TOWARD AN ECOLOGICAL CLASSIFICATION OF SOIL BACTERIA. Ecology, 2007. 88(6): p. 1354-1364.
- Eilers, K.G., et al., Shifts in bacterial community structure associated with inputs of low molecular weight carbon compounds to soil. Soil Biology and Biochemistry, 2010. 42(6): p. 896-903.
- Wolińska, A., et al., Bacteroidetes as a sensitive biological indicator of agricultural soil usage revealed by a culture-independent approach. Applied Soil Ecology, 2017. 119: p. 128-137.
- Sciences, L. 16S rRNA Gene Sequencing for identification, classification and quantitation of microbes. 2021. Available from: https://lcsciences.com/16s-rrna-gene-sequencing-for-identification-classification-and-quantitation-of-microbes/#:~:text=16S%20rRNA%20gene%20sequencing%20is,(ex%20human%20gut%20microbiome).
- Lever, M.A., et al., A modular method for the extraction of DNA and RNA, and the separation of DNA pools from diverse environmental sample types. Frontiers in Microbiology, 2015. 6.
- Oberacker, P., et al., Bio-On-Magnetic-Beads (BOMB): Open platform for high-throughput nucleic acid extraction and manipulation. PLOS Biology, 2019. 17(1): p. e3000107.
- PORAZINSKA, D.L., et al., Evaluating high-throughput sequencing as a method for metagenomic analysis of nematode diversity. Molecular Ecology Resources, 2009. 9(6): p. 1439-1450.
- Takahashi, S., et al., Development of a Prokaryotic Universal Primer for Simultaneous Analysis of Bacteria and Archaea Using Next-Generation Sequencing. PLOS ONE, 2014. 9(8): p. e105592.
- Quast, C., et al., The SILVA ribosomal RNA gene database project: Improved data processing and web-based tools. Nucleic acids research, 2012. 41.
Figure 1.
Illustration of the concept of α and diversity. Colored symbols represent species and circles represent habitat patches [71].
Figure 1.
Illustration of the concept of α and diversity. Colored symbols represent species and circles represent habitat patches [71].

Figure 2.
Flowchart of the GW methodology of the experiment. The black circles show the number of weeks from the start of the experiment. The events are shown on the horizontal line and all the tests are shown through a vertical line with a colored dot head (legends).
Figure 2.
Flowchart of the GW methodology of the experiment. The black circles show the number of weeks from the start of the experiment. The events are shown on the horizontal line and all the tests are shown through a vertical line with a colored dot head (legends).
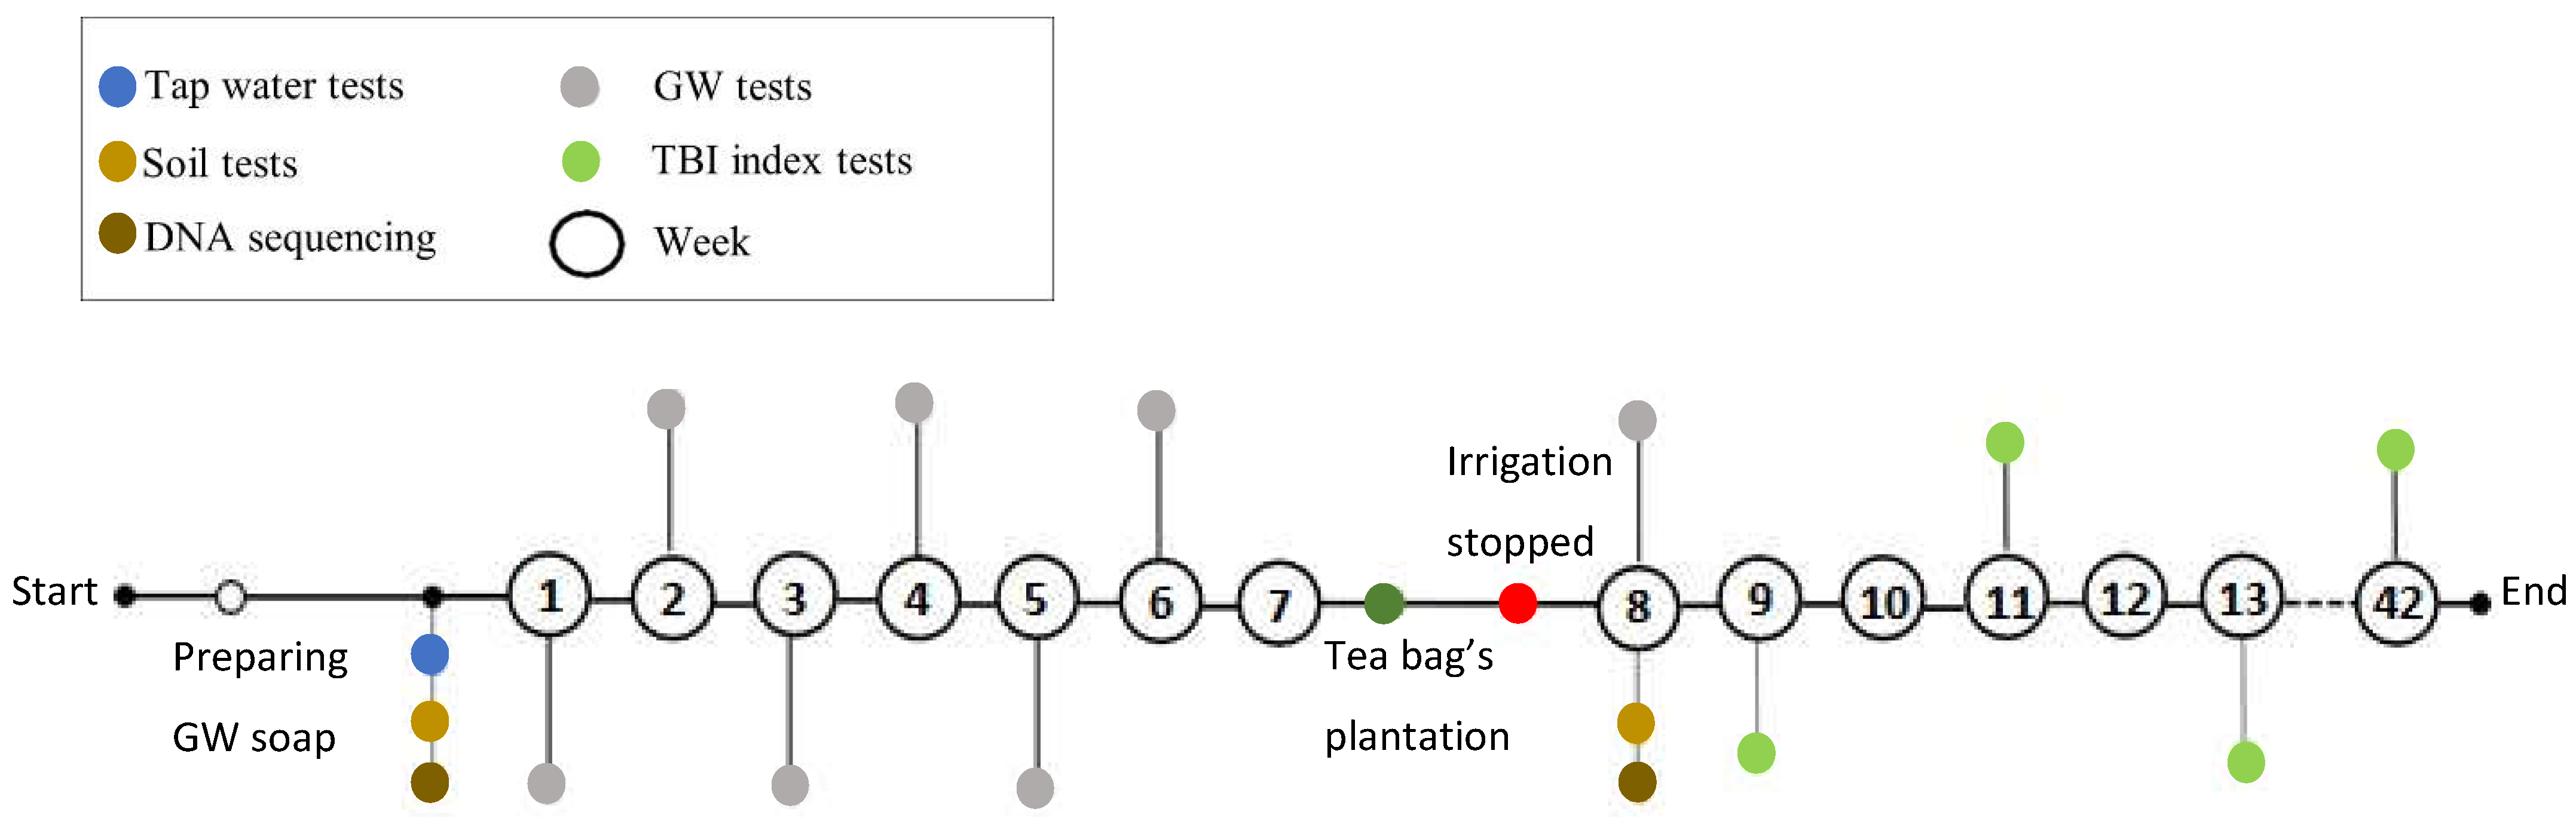
Figure 3.
(a) Greywater soap slices (b) Soap slice placed in sink to generate GW for irrigation.
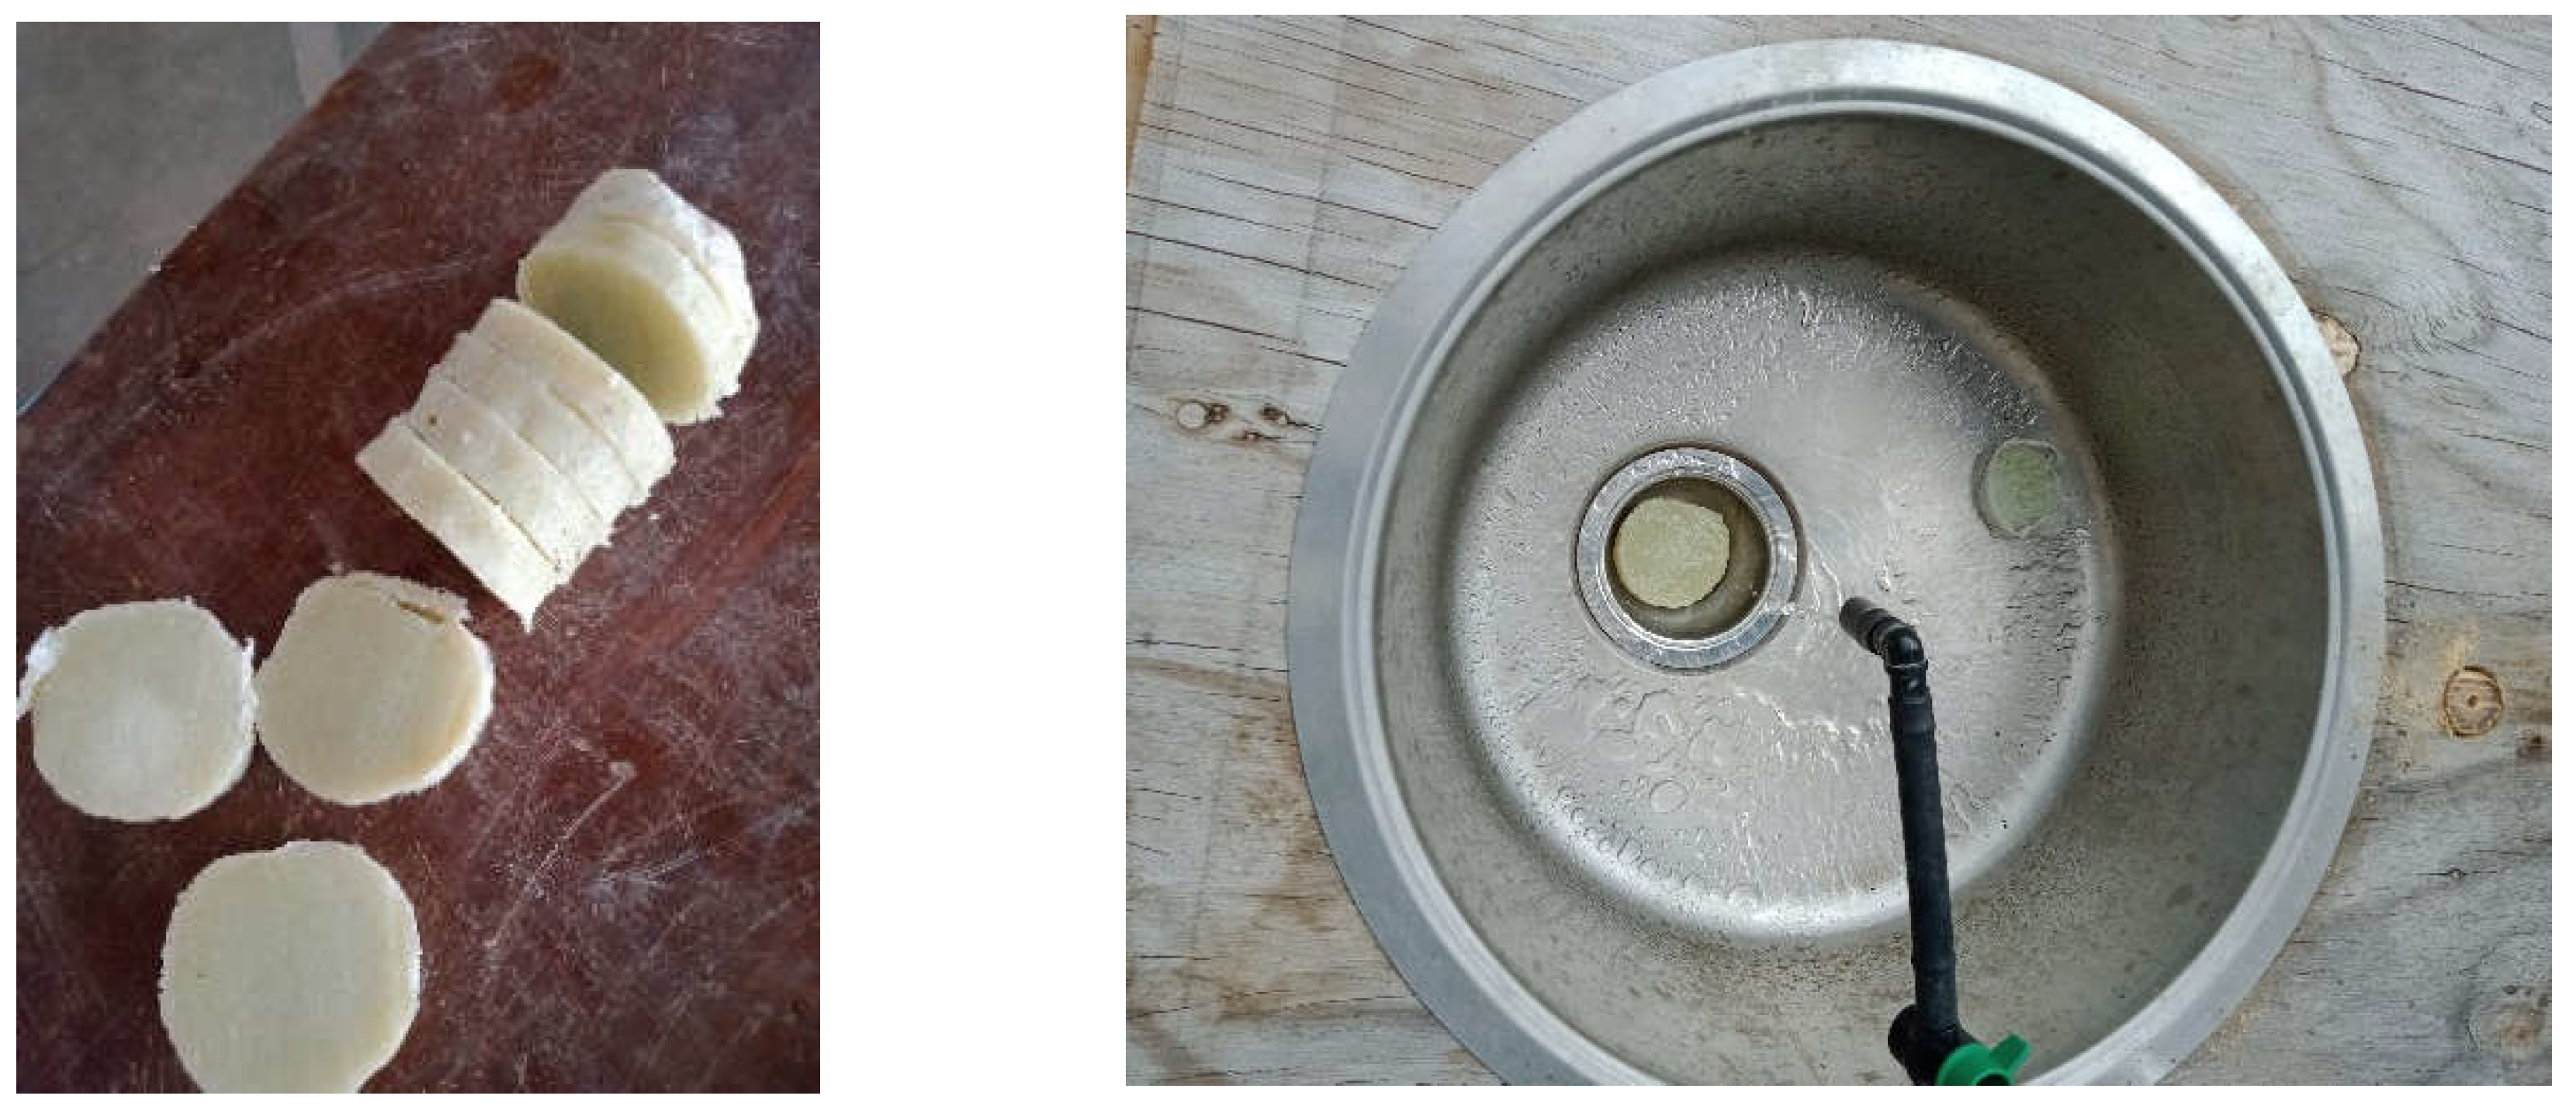
Figure 4.
(a) Preparing the terracotta pot plants by arranging the substrate layers. (b) 3D model of the experiment, showing all the strata and their respective plant species (Phalaris Arundinacea in S1 and C, Rhynchospora colorata H. Pfeiff in S2 and S4, Zantedeschia aethiopica Spreng in S4). (c) The experimental set-up in the Off-grid tech lab at The University of Sydney. (d) Developed biofilm layer (Schmutzdecke) in the sand filter.
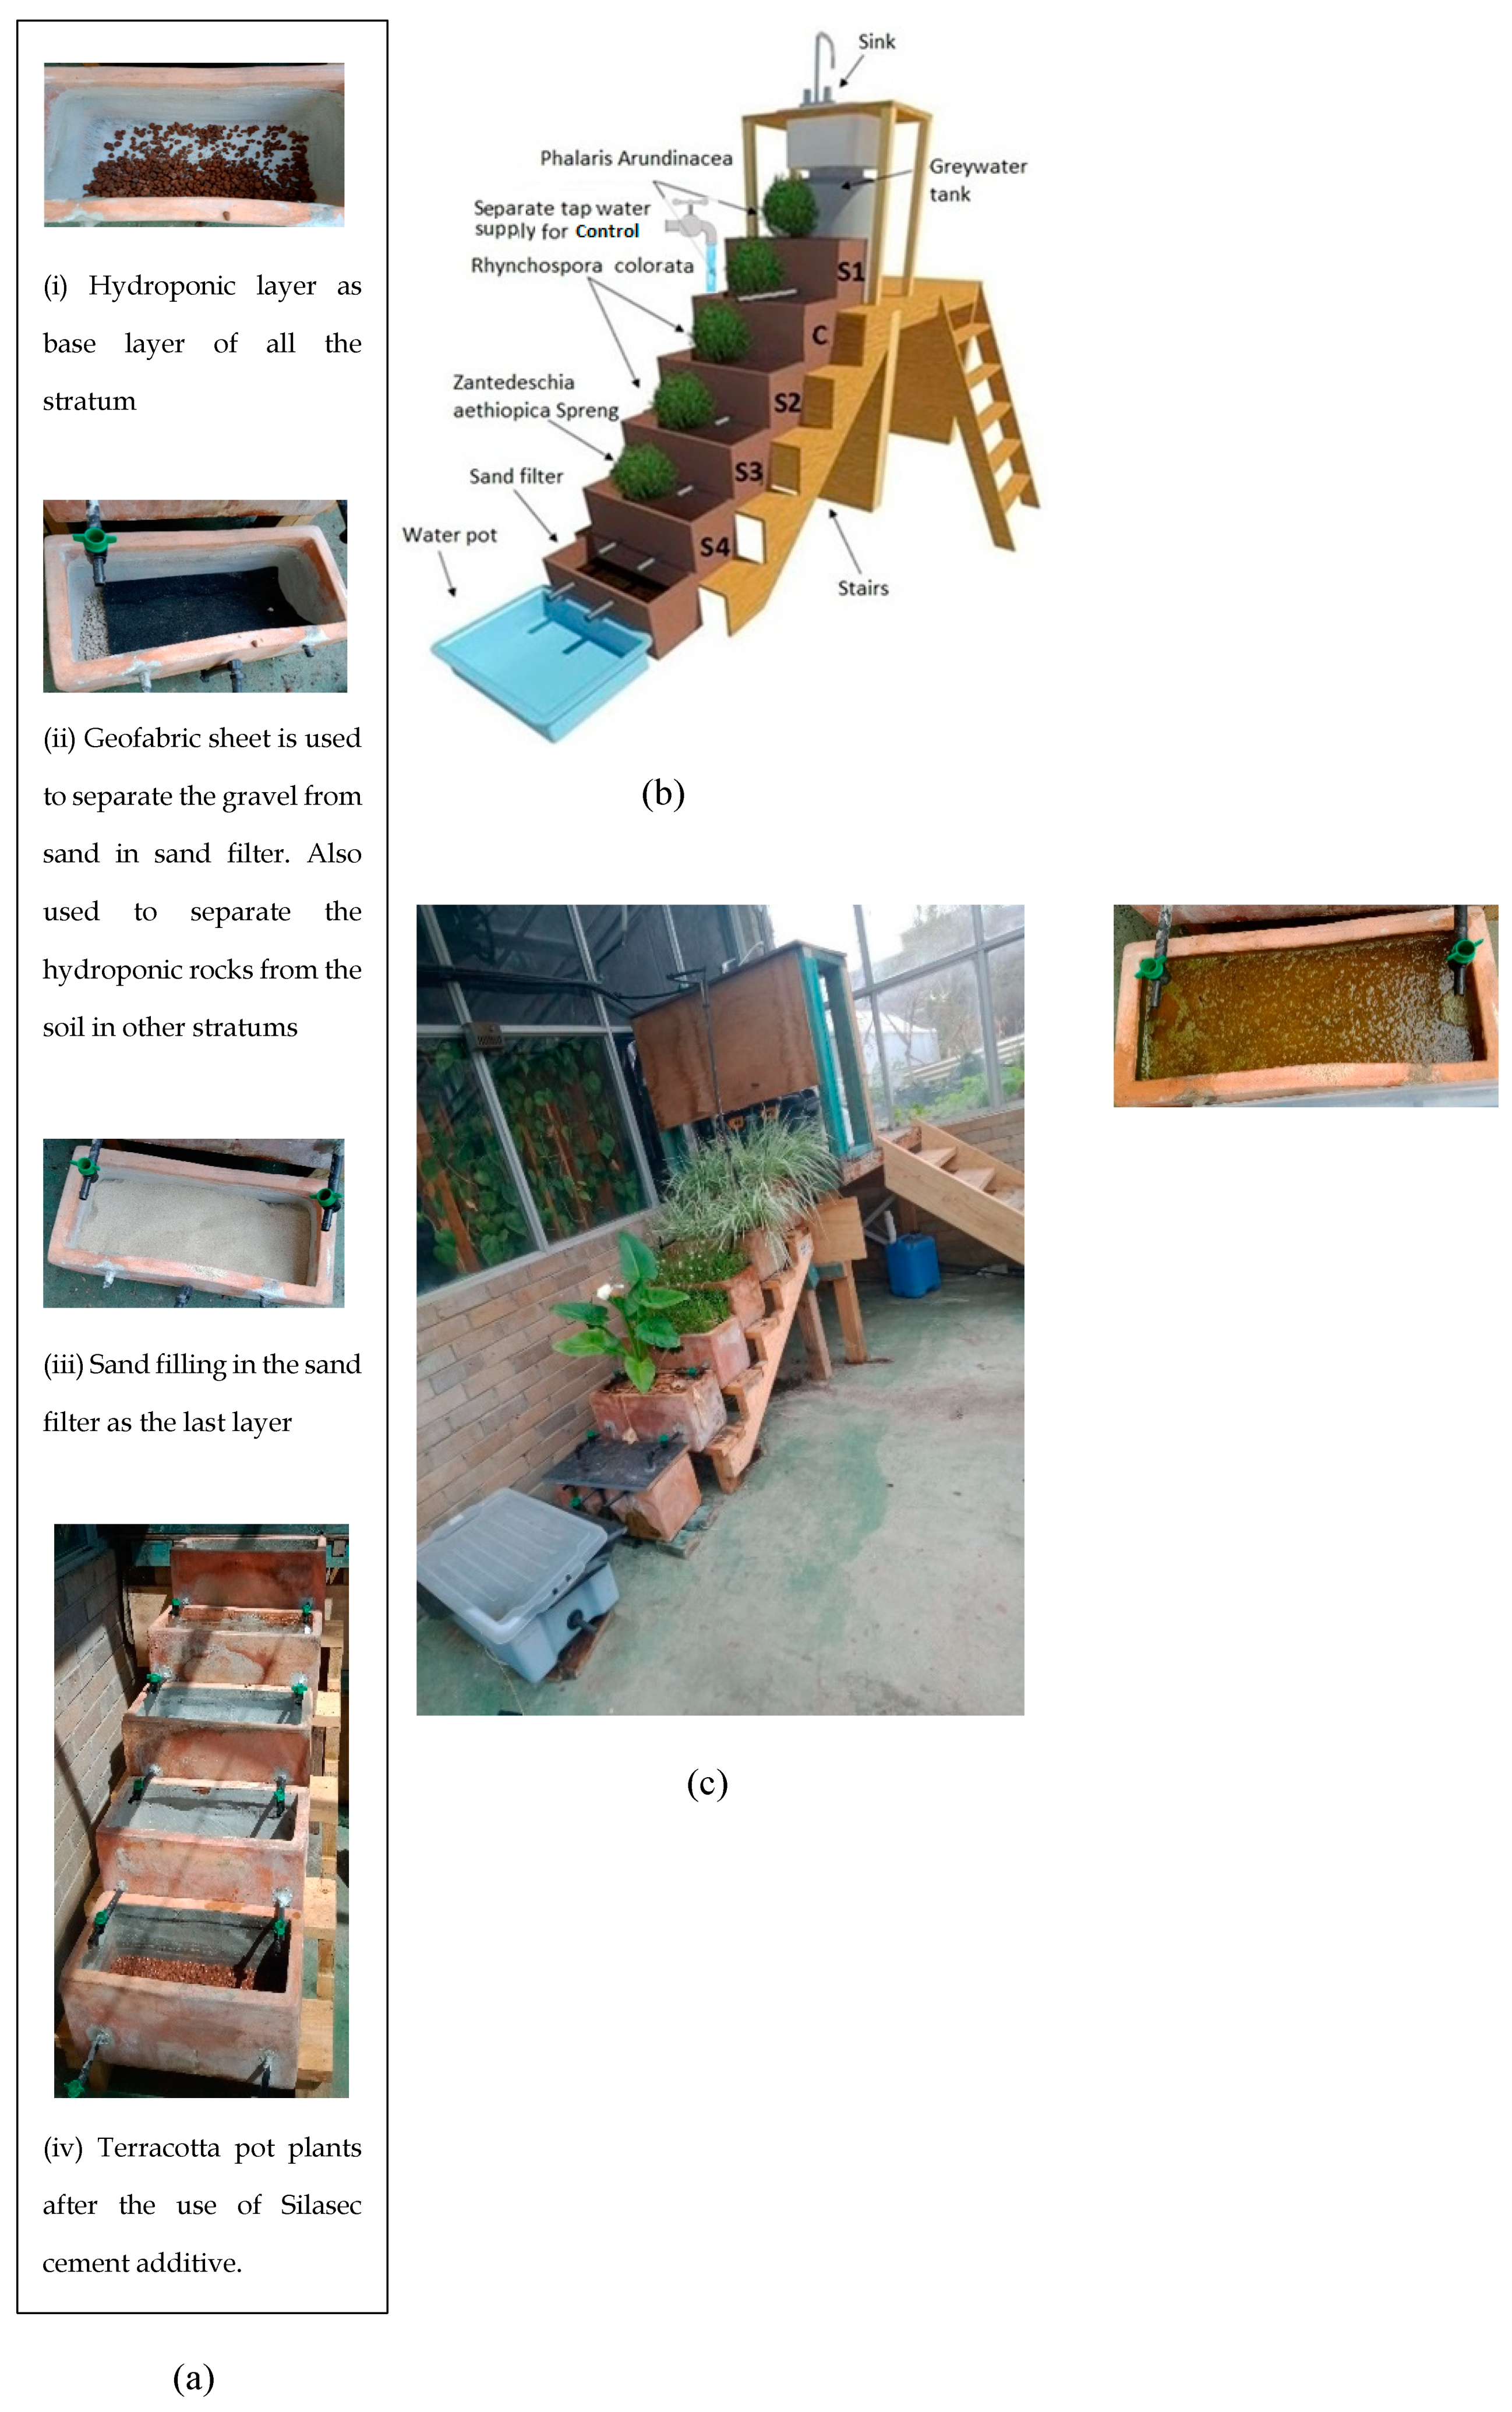
Figure 5.
(a) Terracotta pot plant dimensions (b) Section view of the terracotta pot used as stratum for plants (c) Section view of the terracotta pot used as a sand filter.
Figure 5.
(a) Terracotta pot plant dimensions (b) Section view of the terracotta pot used as stratum for plants (c) Section view of the terracotta pot used as a sand filter.
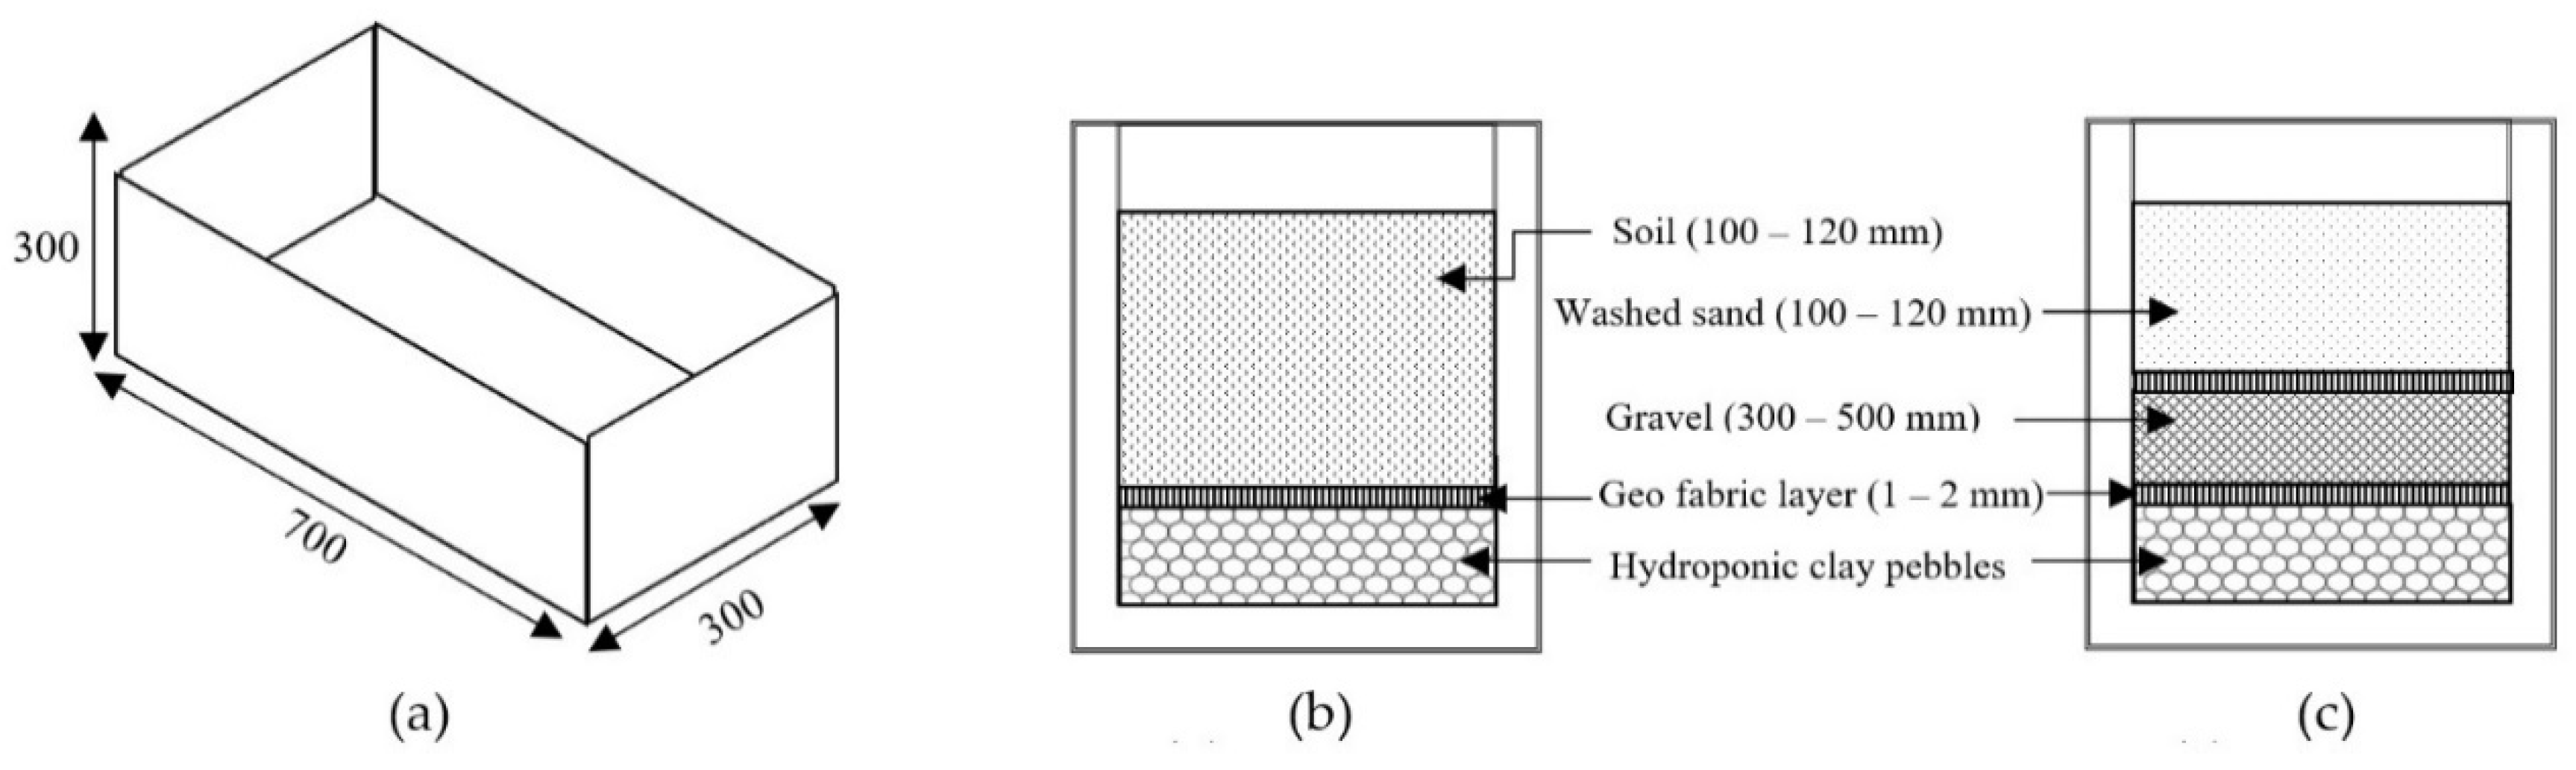
Figure 7.
The Before ‘B’ (influent) and After ‘A’ (effluent) samples of GW examined for water testing parameters.
Figure 7.
The Before ‘B’ (influent) and After ‘A’ (effluent) samples of GW examined for water testing parameters.
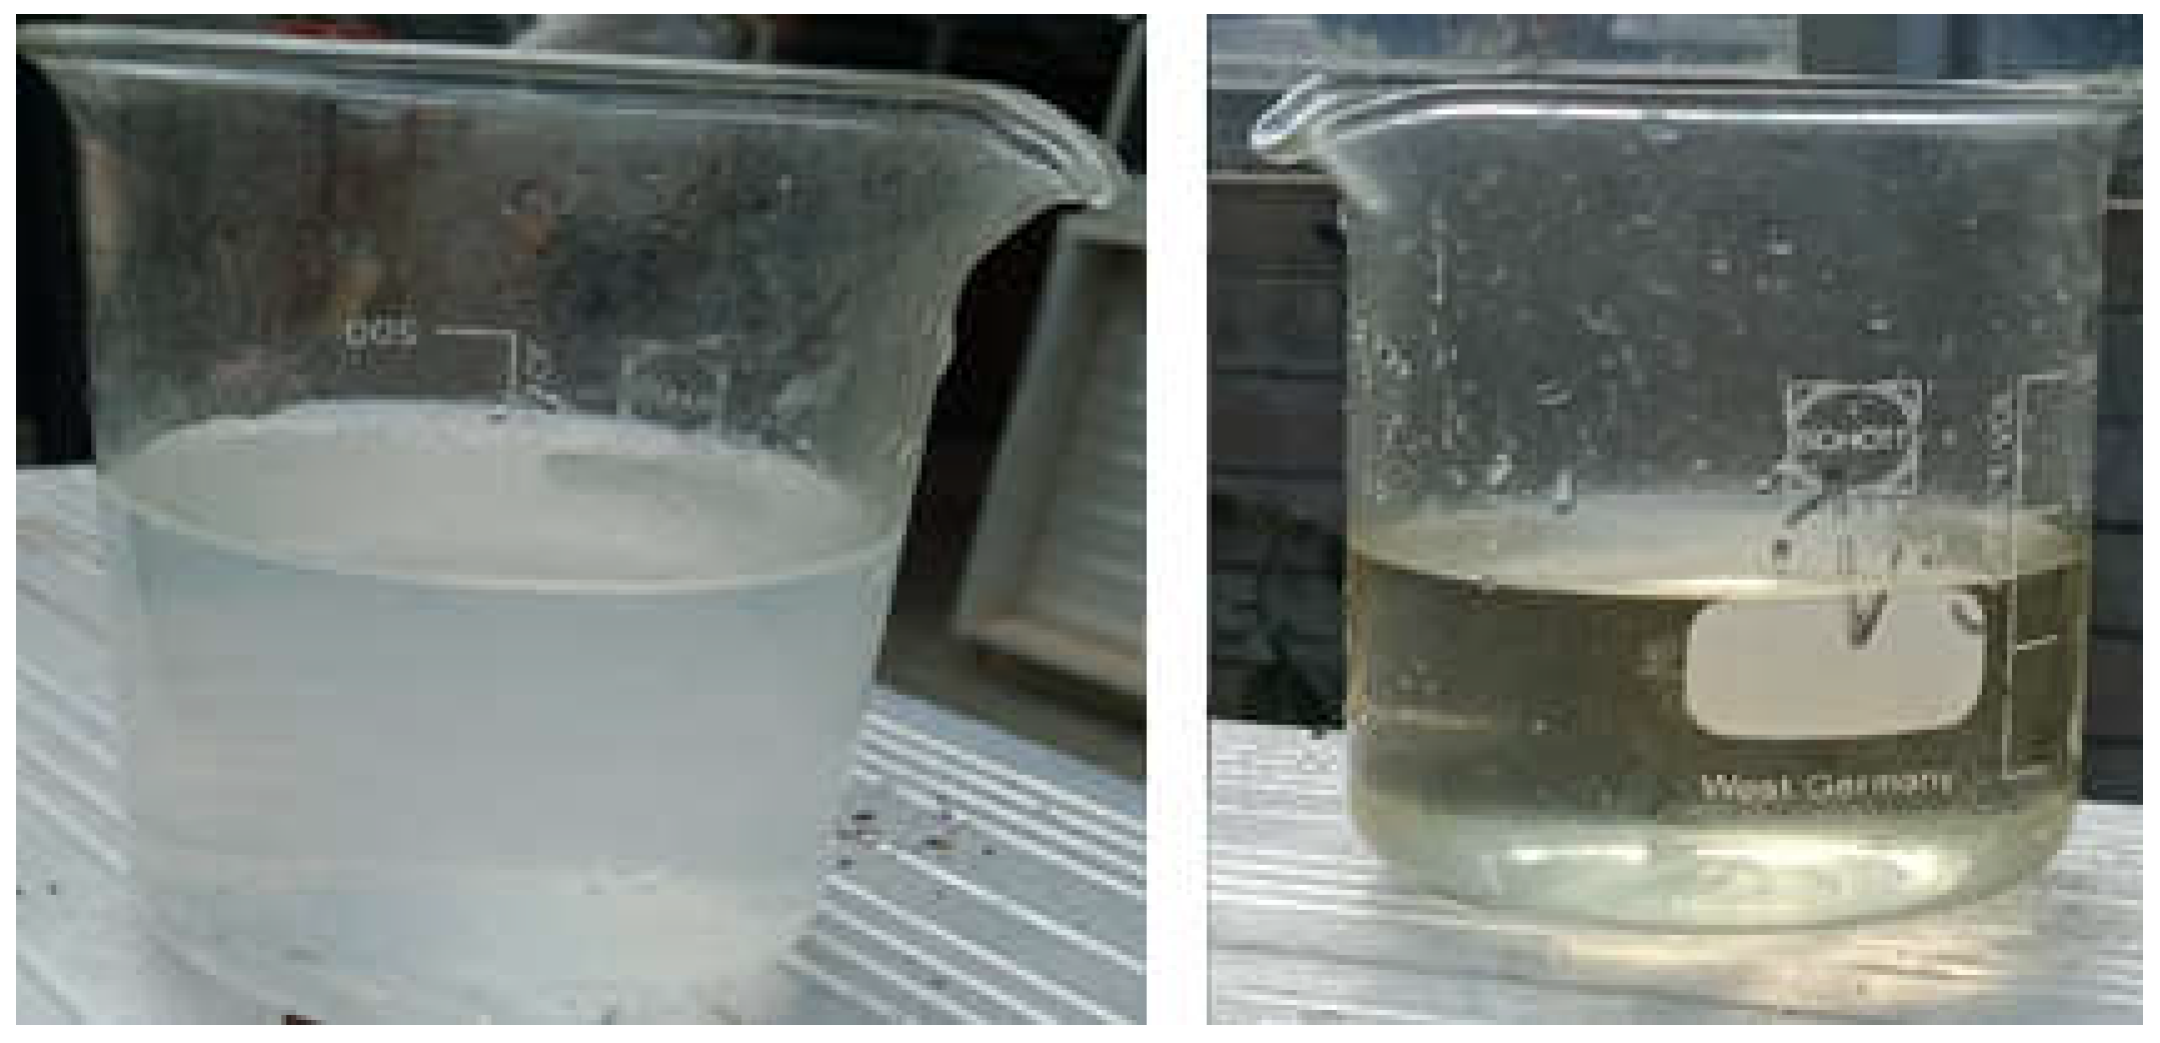
Figure 8.
The physical parameters (Turbidity and TSS) from weeks 4 to 8. The GW was not concentrated in the initial weeks, therefore physical parameters were not found in those weeks.
Figure 8.
The physical parameters (Turbidity and TSS) from weeks 4 to 8. The GW was not concentrated in the initial weeks, therefore physical parameters were not found in those weeks.
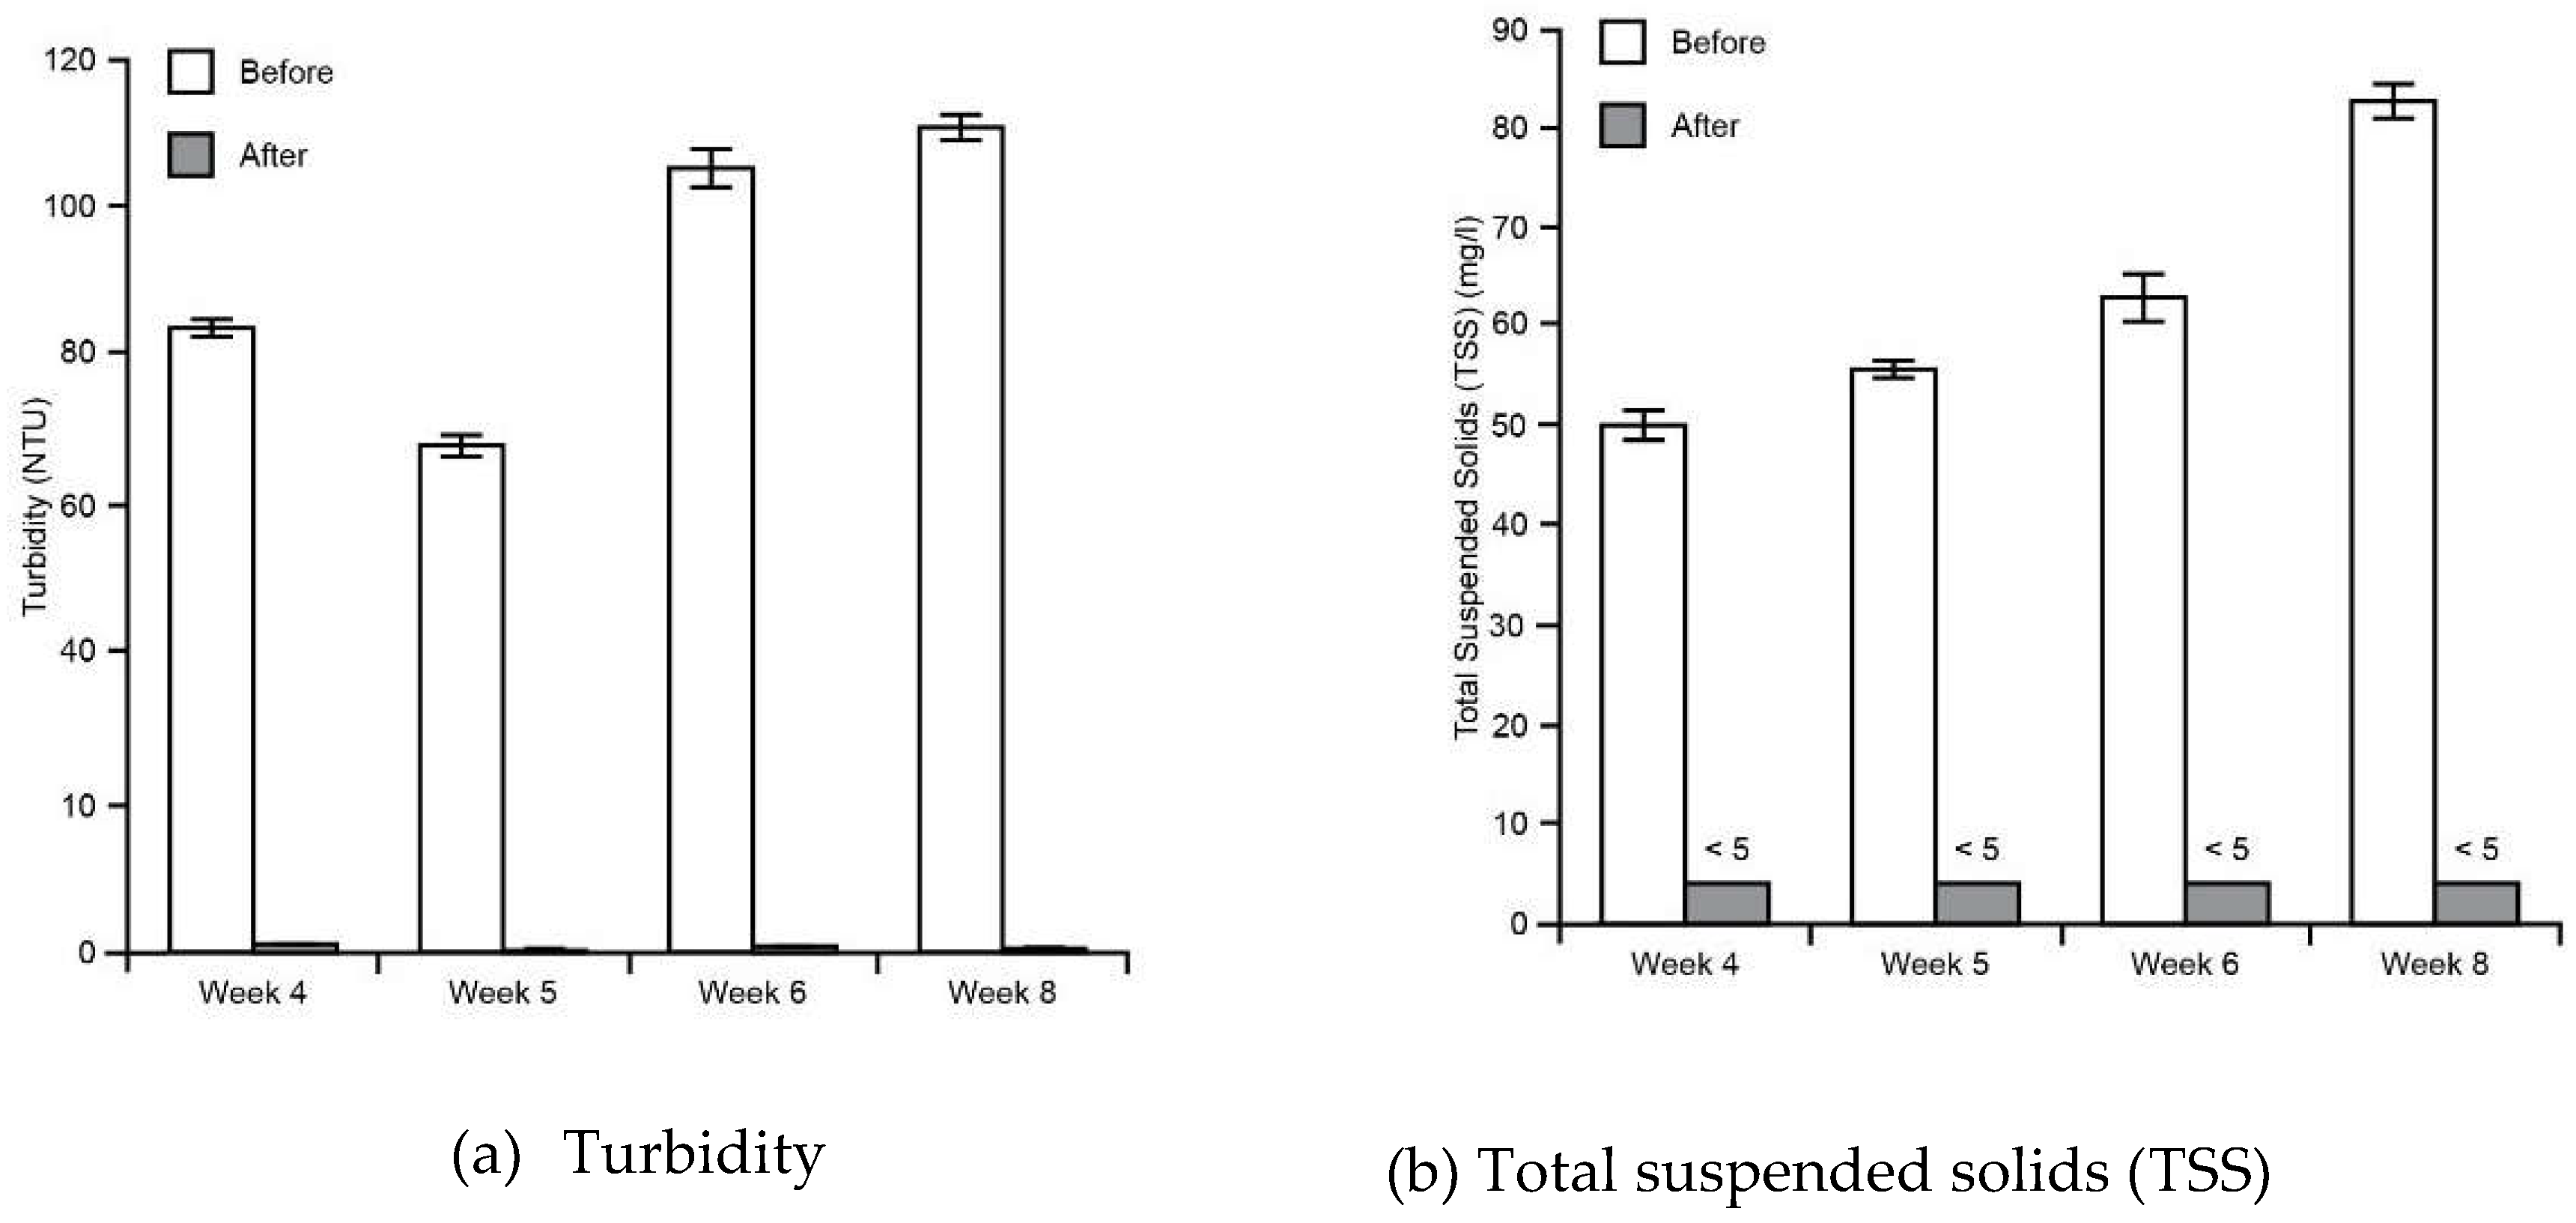
Figure 9.
The chemical parameters (pH, Electrical conductivity, and BOD). BODs only measured from week 4-8.
Figure 9.
The chemical parameters (pH, Electrical conductivity, and BOD). BODs only measured from week 4-8.
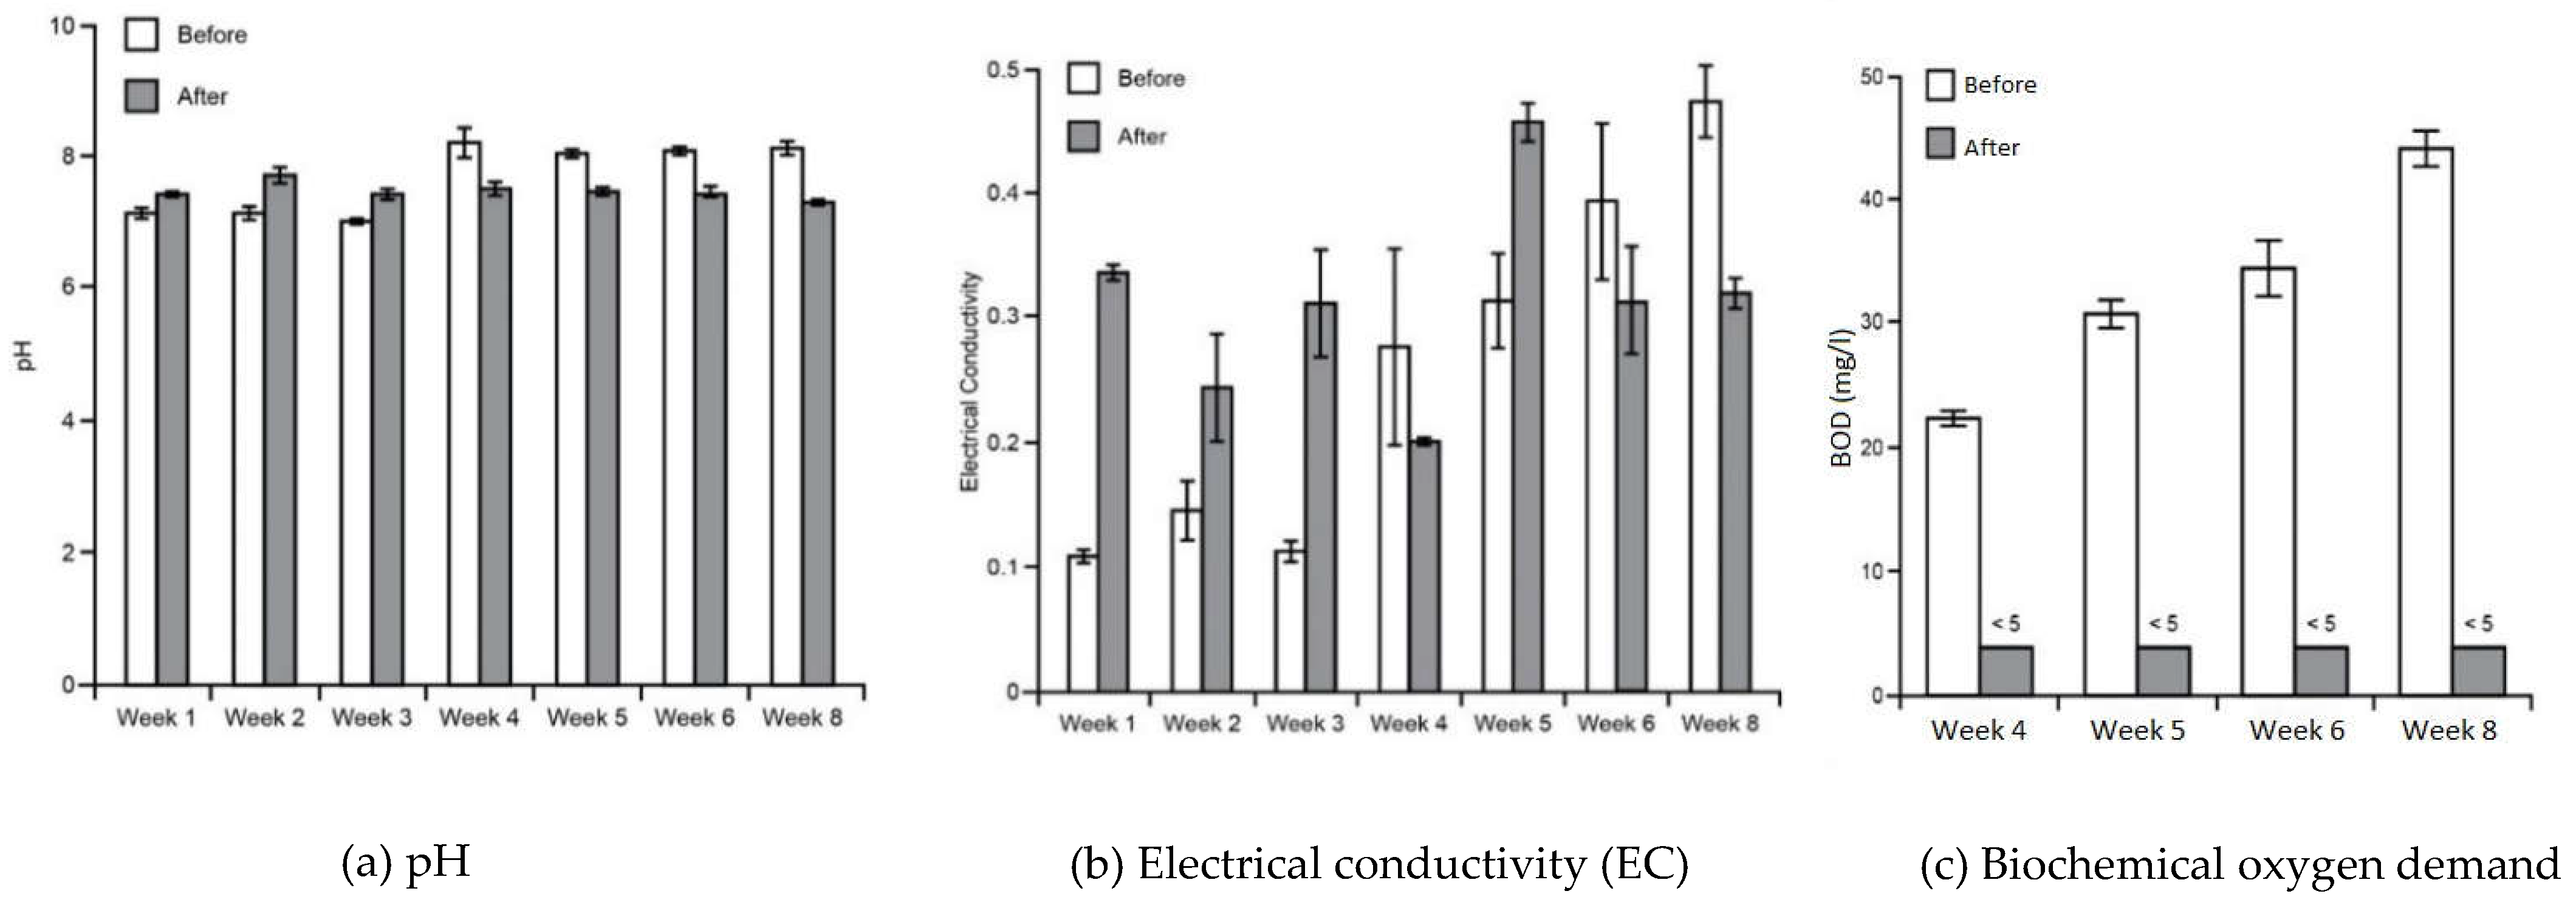
Figure 10.
Microbiological parameters (Faecal and Total coliforms). The coliforms level were increased in the Before samples from week 5 by adding sheep manure.
Figure 10.
Microbiological parameters (Faecal and Total coliforms). The coliforms level were increased in the Before samples from week 5 by adding sheep manure.
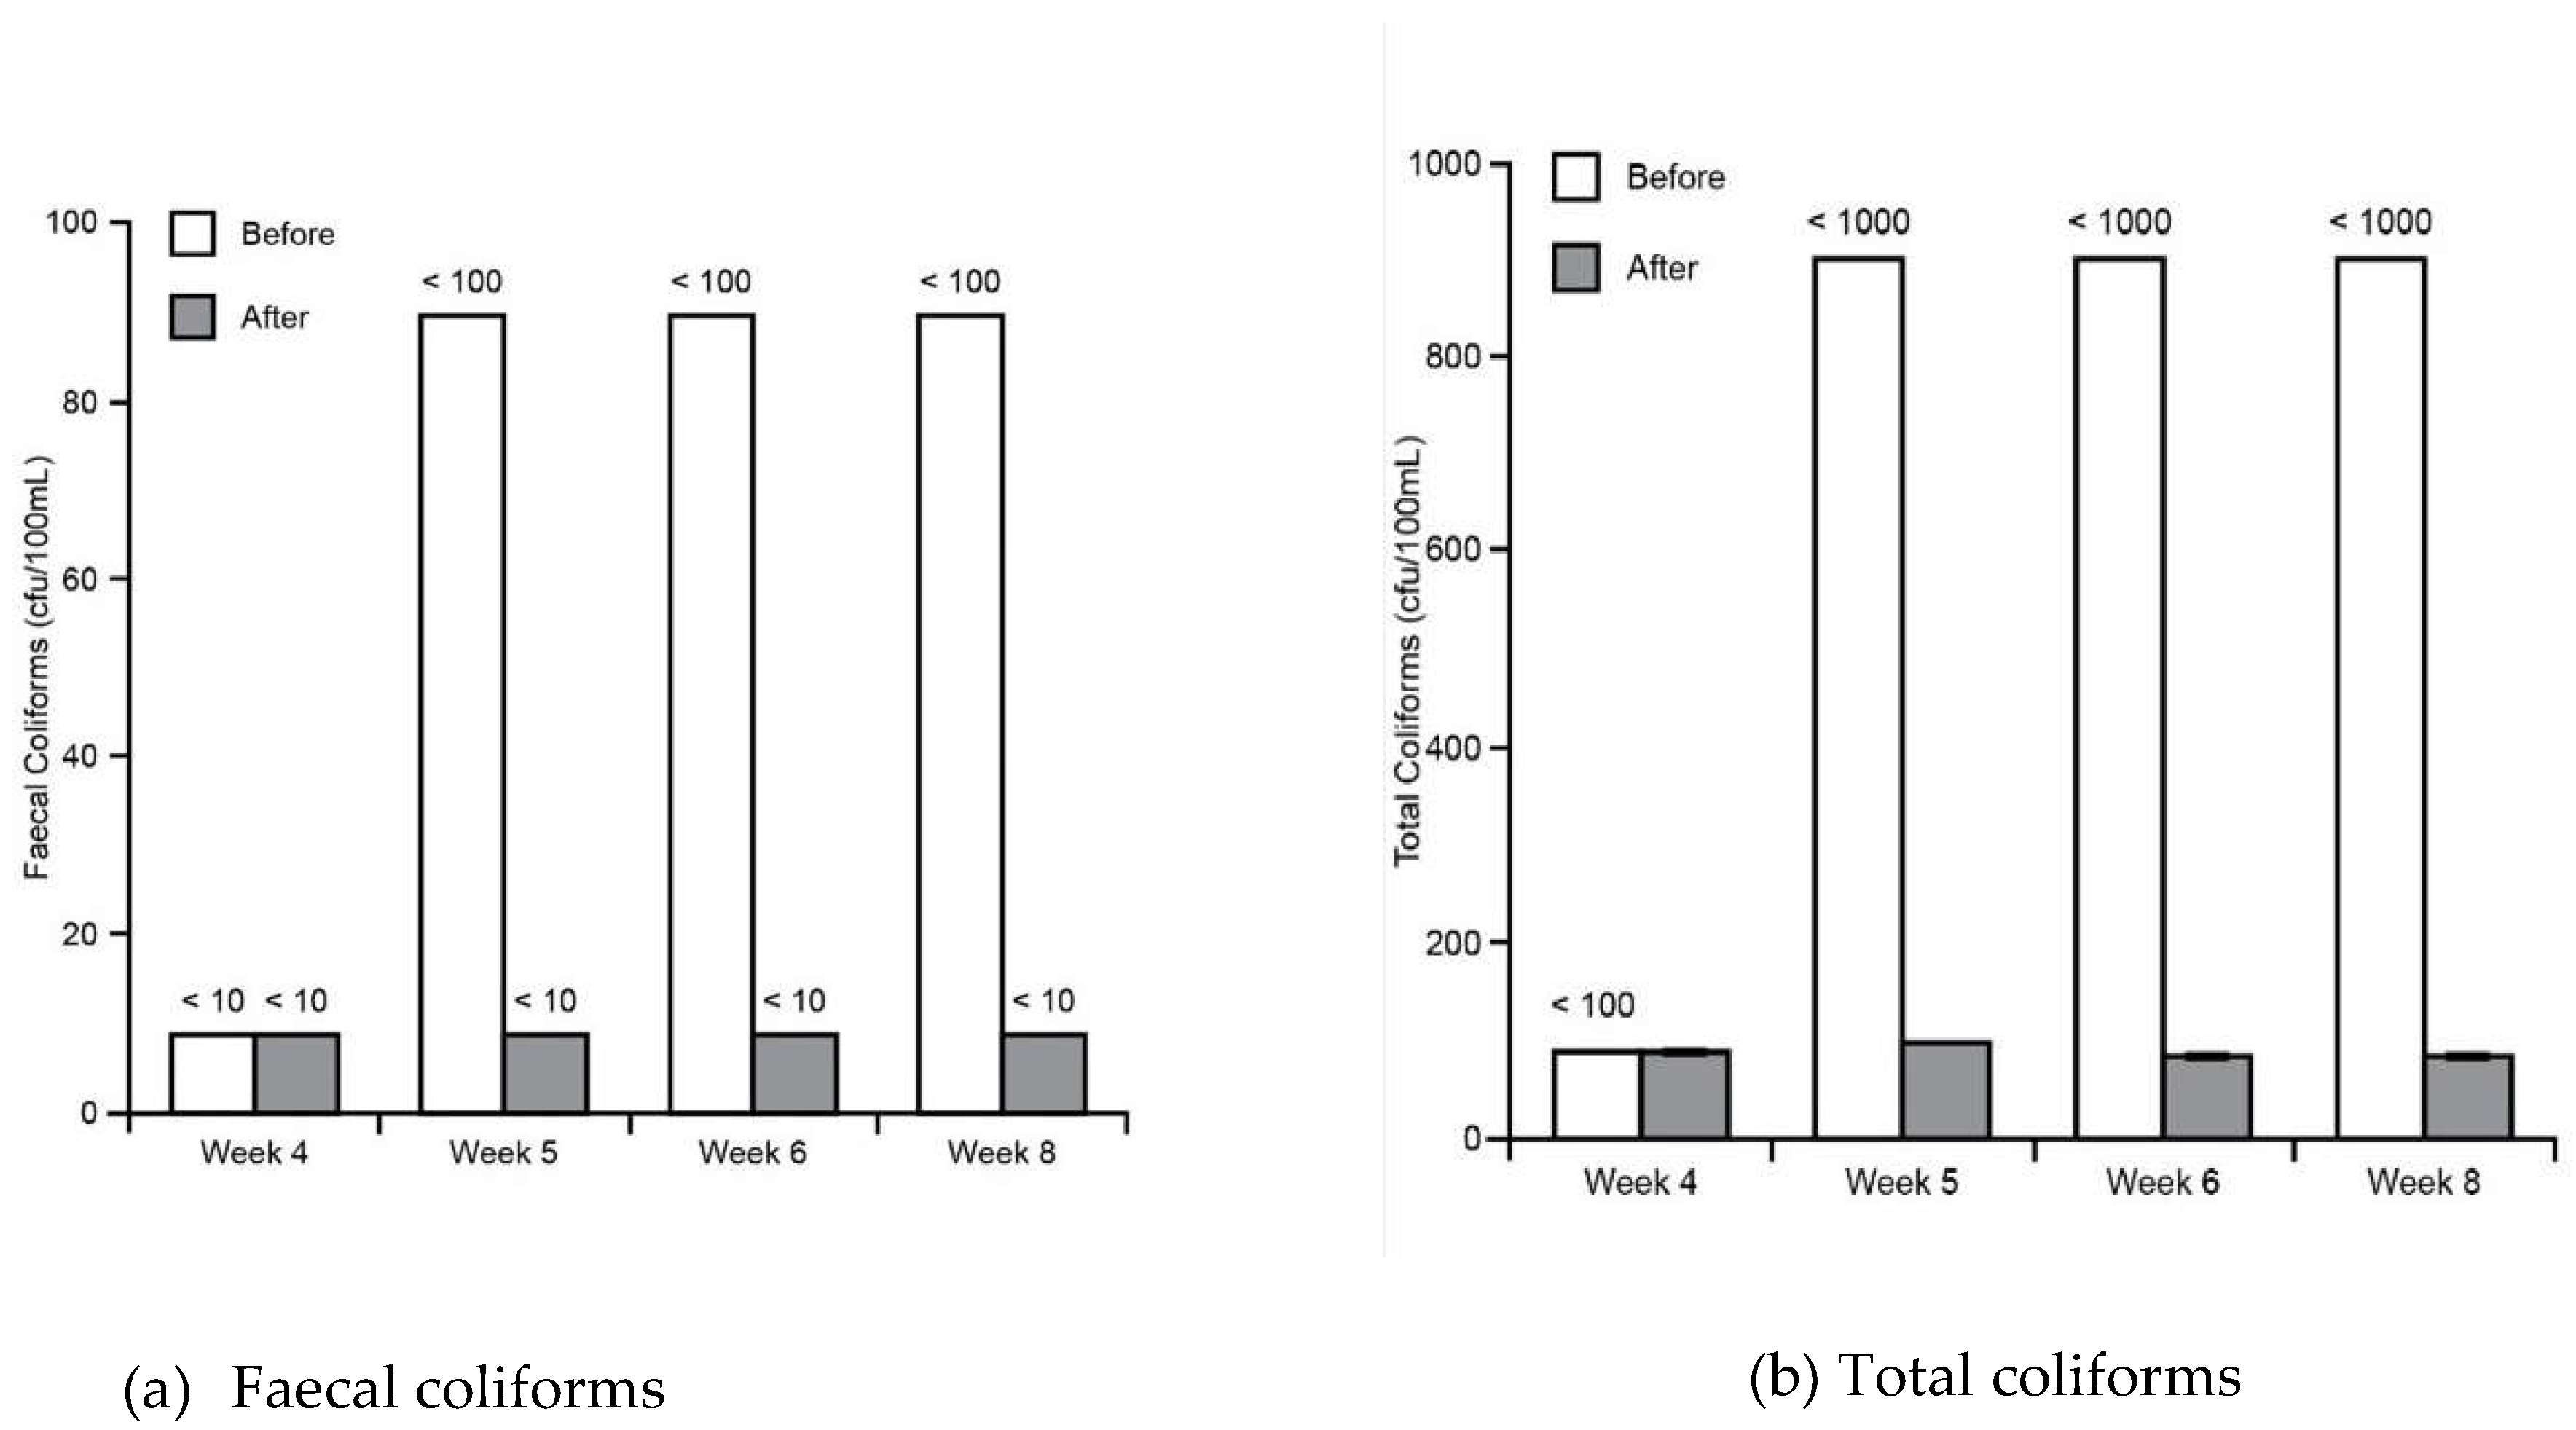
Figure 11.
Comparing the Physiochemical properties of soil (pH and Electrical conductivity) between “Before treatment soil (BTS)”, Control soil sample, Stratum 1 (S1) and Stratum (4).
Figure 11.
Comparing the Physiochemical properties of soil (pH and Electrical conductivity) between “Before treatment soil (BTS)”, Control soil sample, Stratum 1 (S1) and Stratum (4).
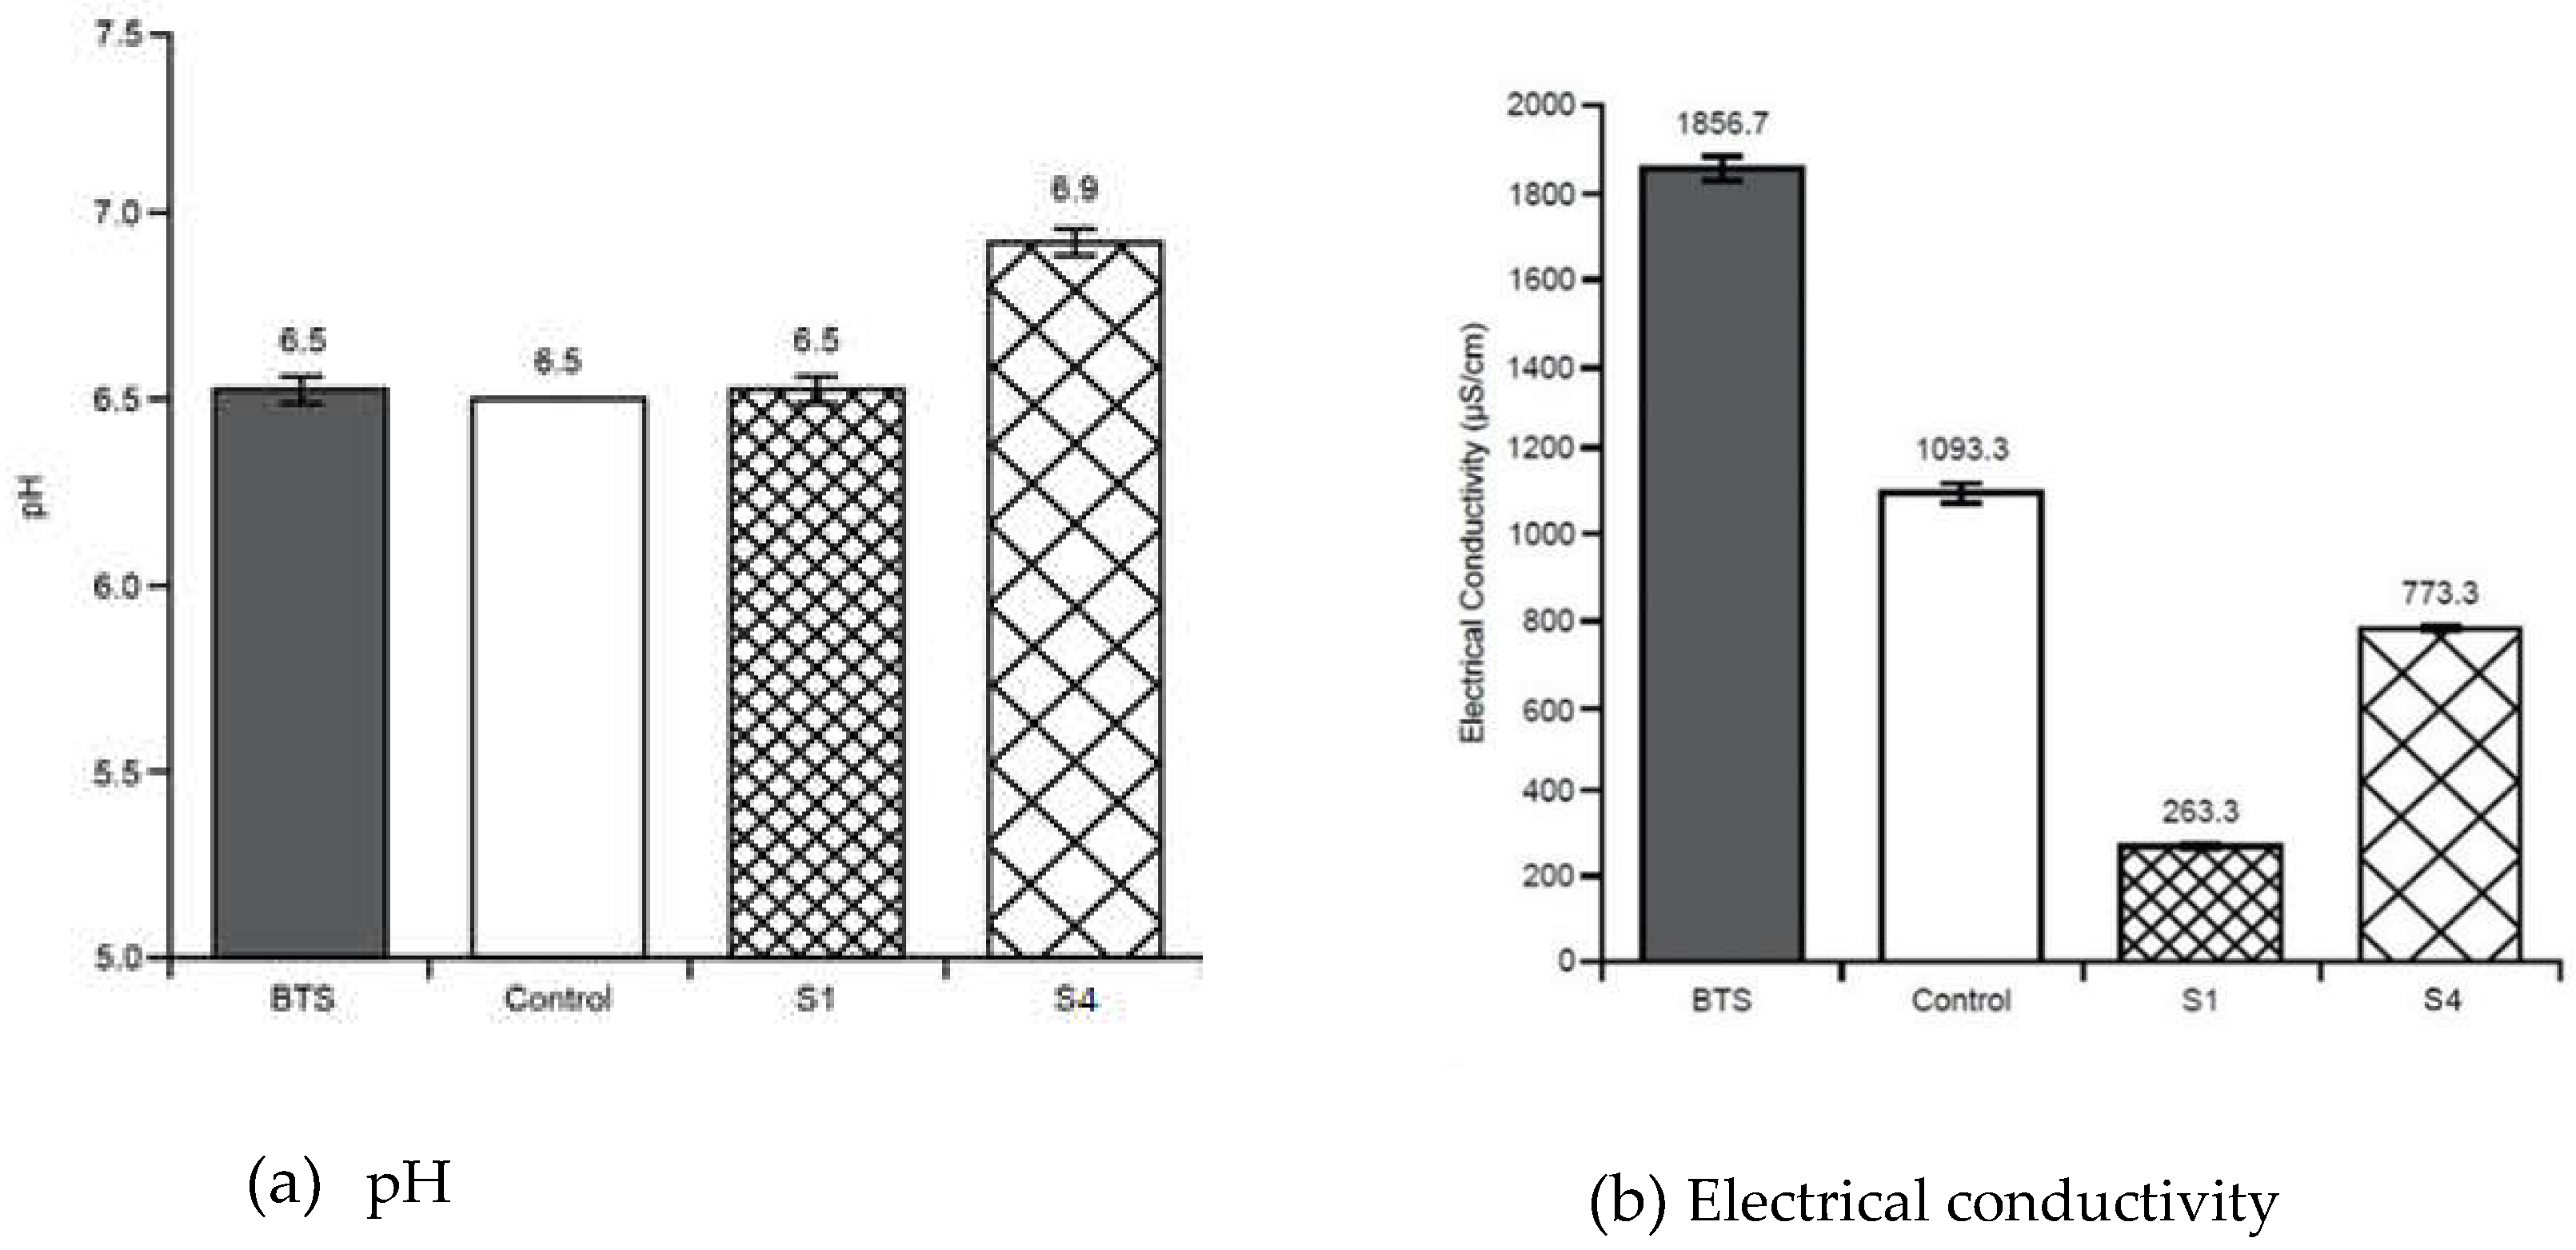
Figure 12.
Comparing the Physiochemical properties of soil (Total organic carbon, Total nitrogen and Cation exchange capacity) between “Before treatment soil (BTS)”, Control soil sample, Stratum 1 (S1) and Stratum 4 (S4).
Figure 12.
Comparing the Physiochemical properties of soil (Total organic carbon, Total nitrogen and Cation exchange capacity) between “Before treatment soil (BTS)”, Control soil sample, Stratum 1 (S1) and Stratum 4 (S4).
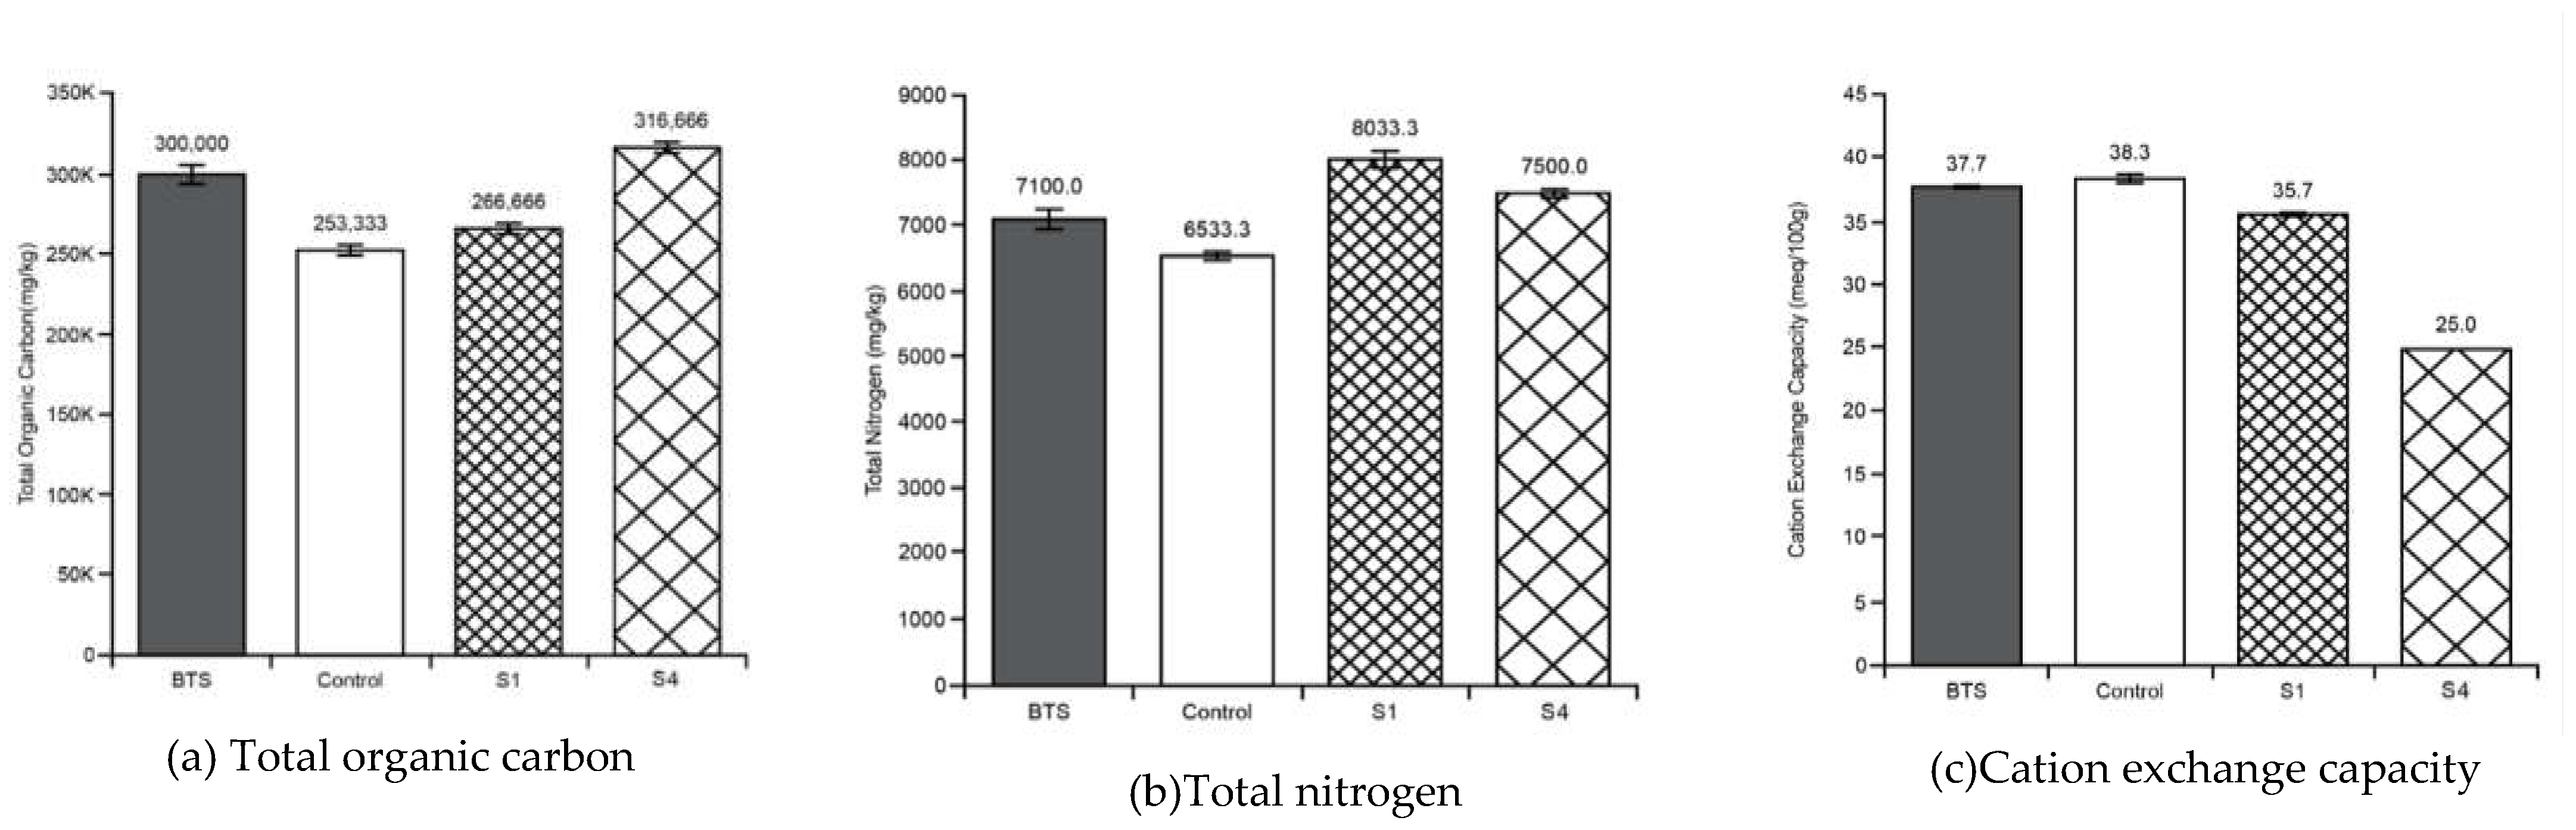
Figure 13.
The relative mass of tea bags as measured in laboratory incubations for rooibos tea (RT) and green tea (GT) bags in Control (C), Stratum 1 (S1), and Stratum 4 (S4). The shapes with error bars are experimental data and the curve is extrapolated up to 250 days, using cftool command of MATLAB, the equation m(t) = ae-kt +(a-1) was generated. The equation is shown for all the curves, where ‘e’ stands for Euler's number constant equal to 2.71, ‘t’ is the decomposition time coefficient, ‘a’ being the labile fraction, and ‘k’ is the decomposition fraction (with 95% confidence bounds). Coefficients a and k are different for every stratum and tea type, shown in Table 1, Table 2 and Table 3.
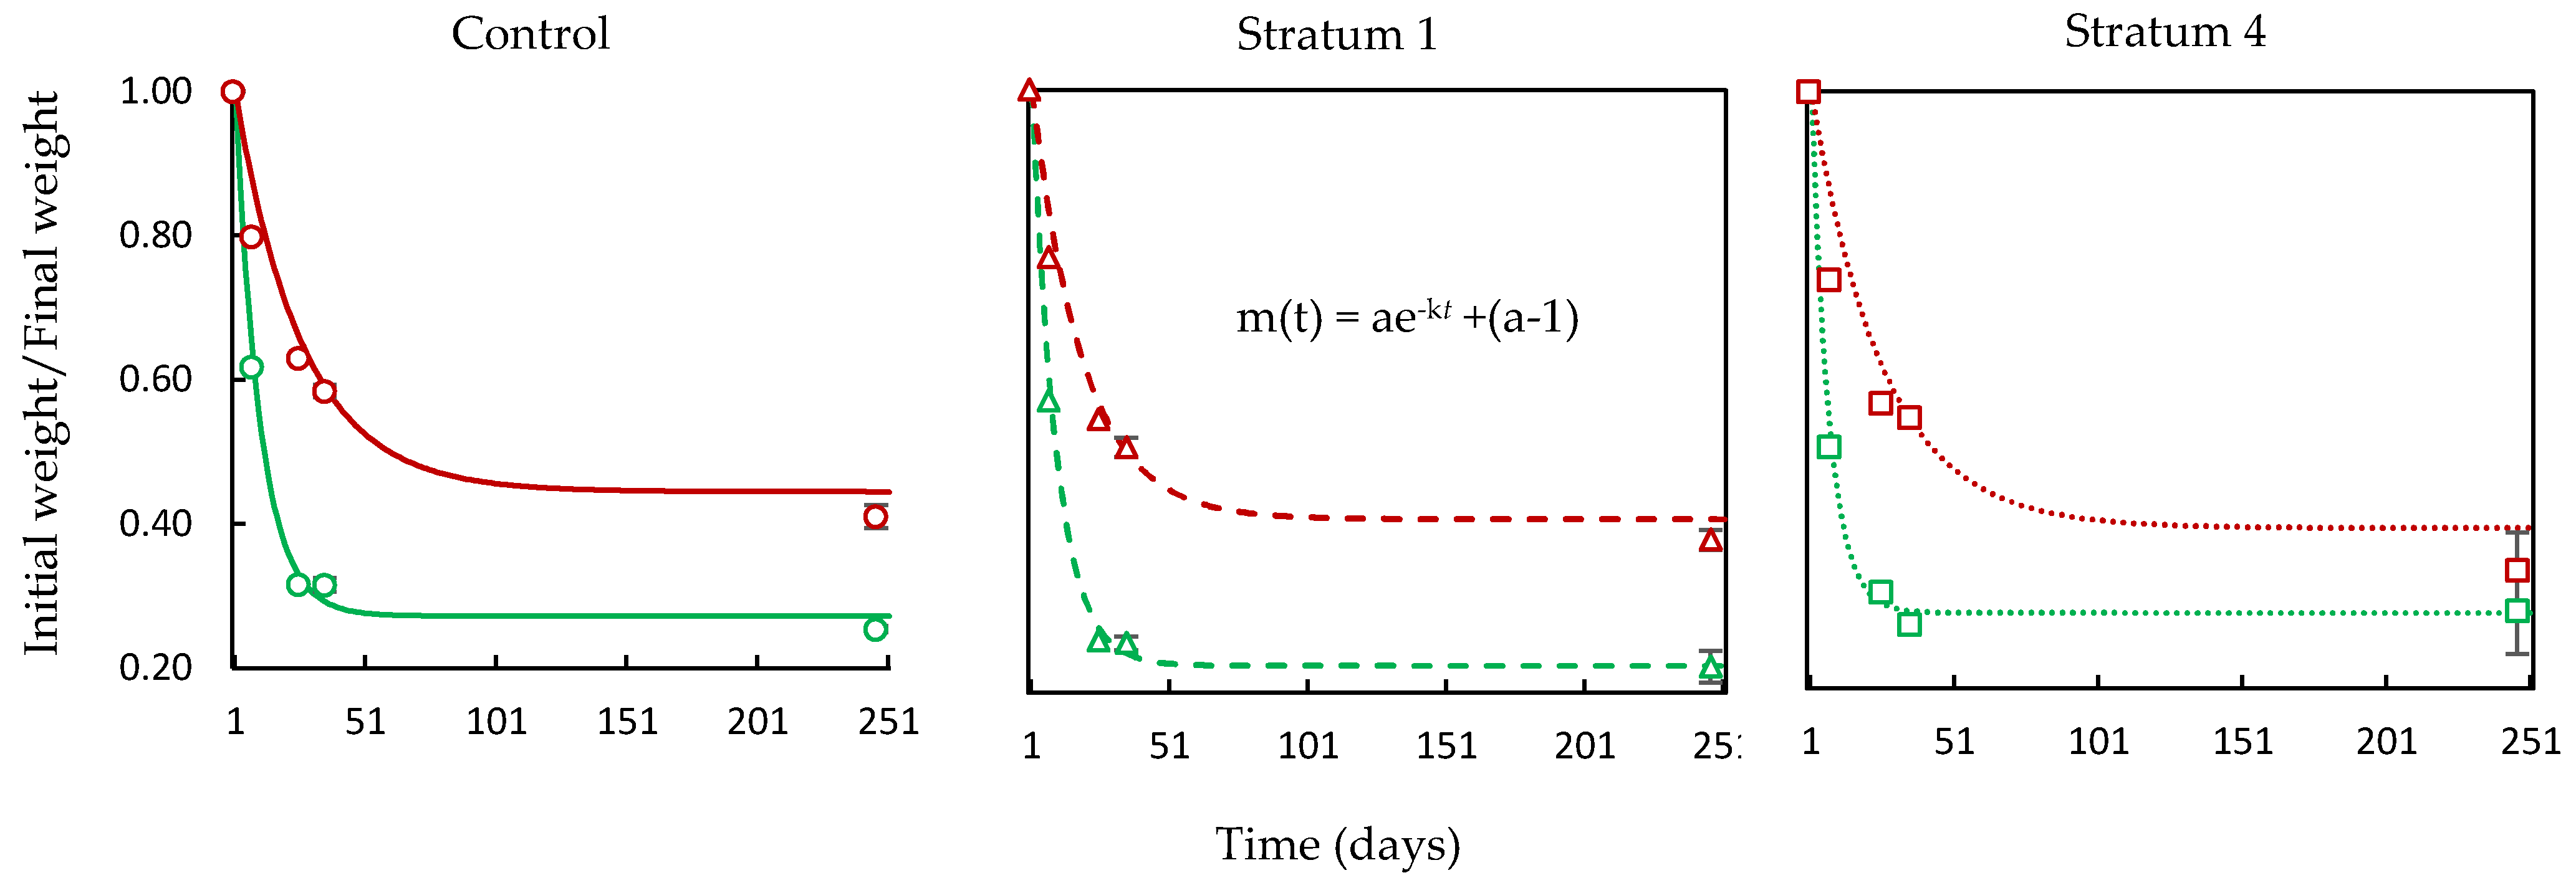
Figure 14.
(a) Comparing the constant decomposition rate (k) values for Control, Stratum 1 and Stratum 4, using Equation (5).
Figure 14.
(a) Comparing the constant decomposition rate (k) values for Control, Stratum 1 and Stratum 4, using Equation (5).
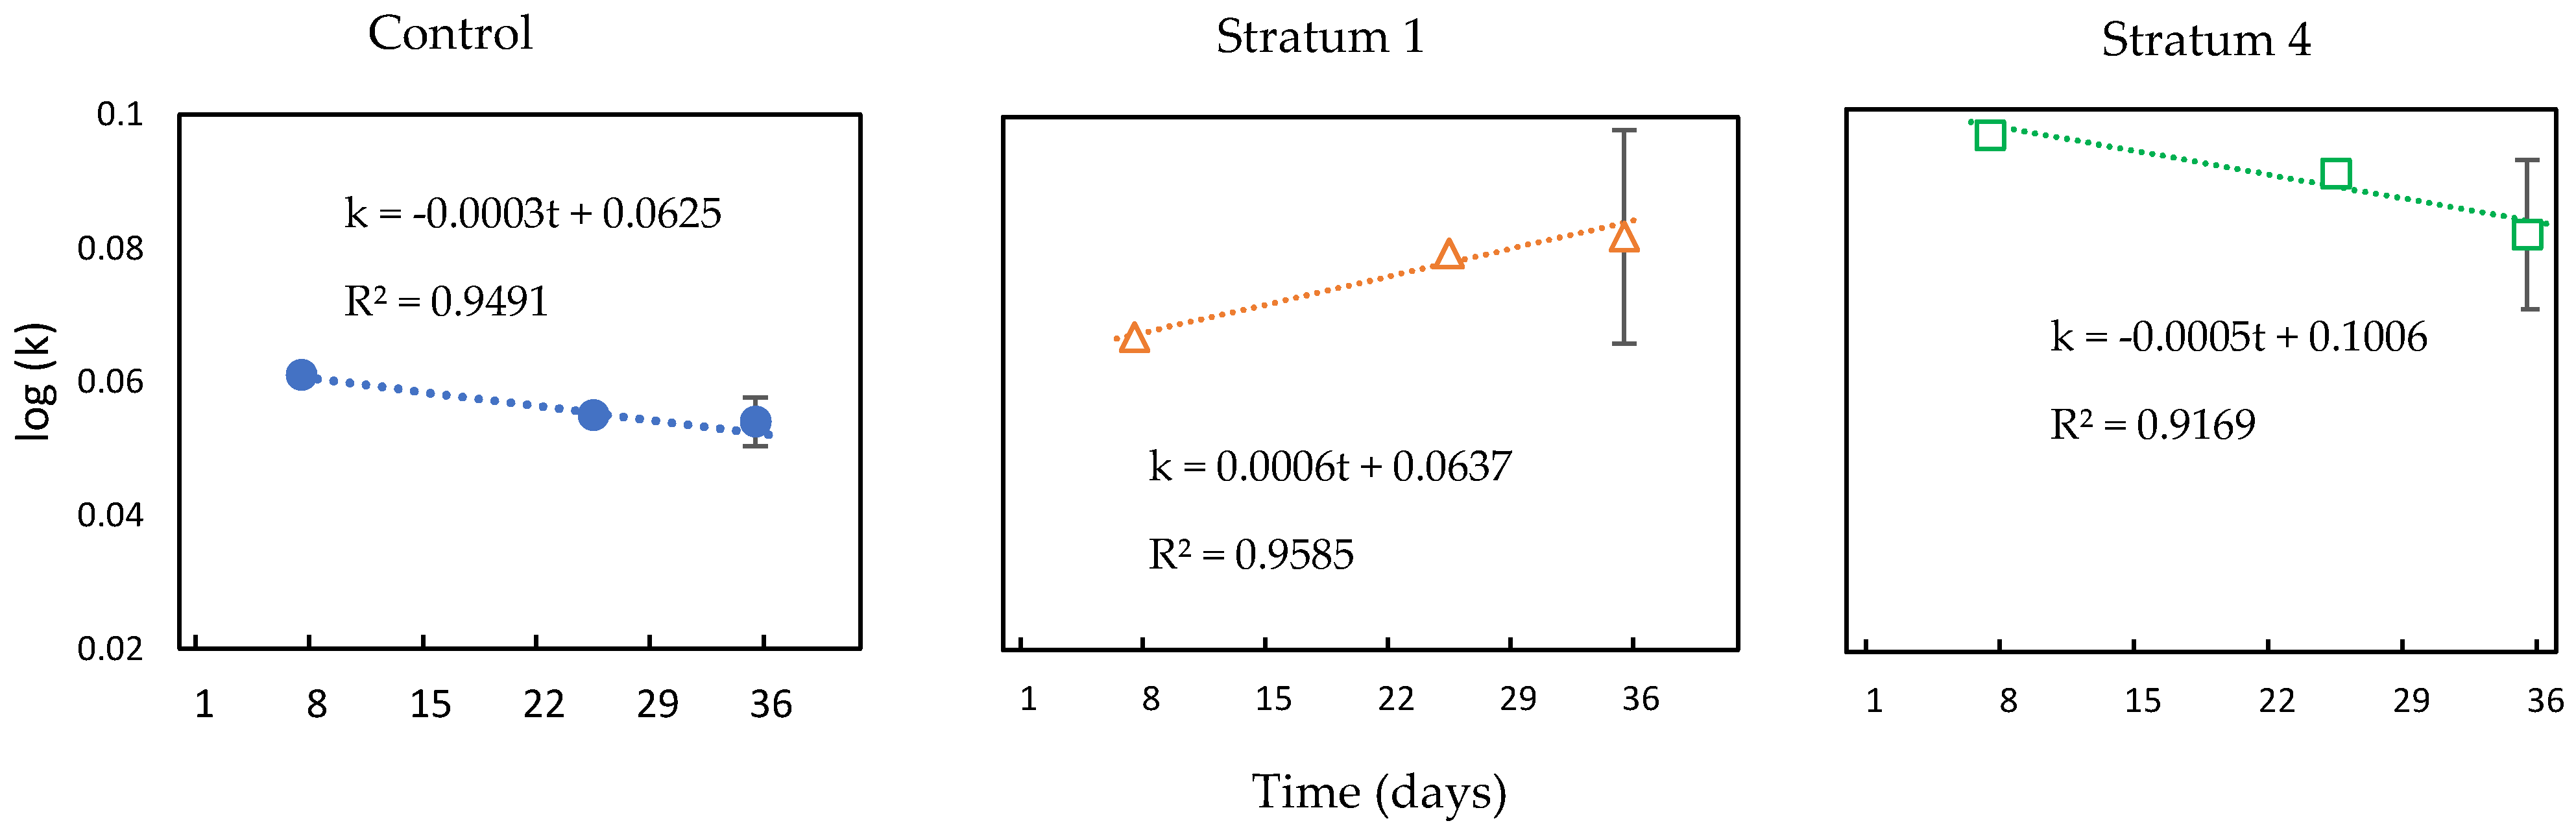
Figure 15.
Comparing the reaction rates or variable decomposition rate (k) between time frames 7, 25, 35 and 246 using Equation (8).
Figure 15.
Comparing the reaction rates or variable decomposition rate (k) between time frames 7, 25, 35 and 246 using Equation (8).
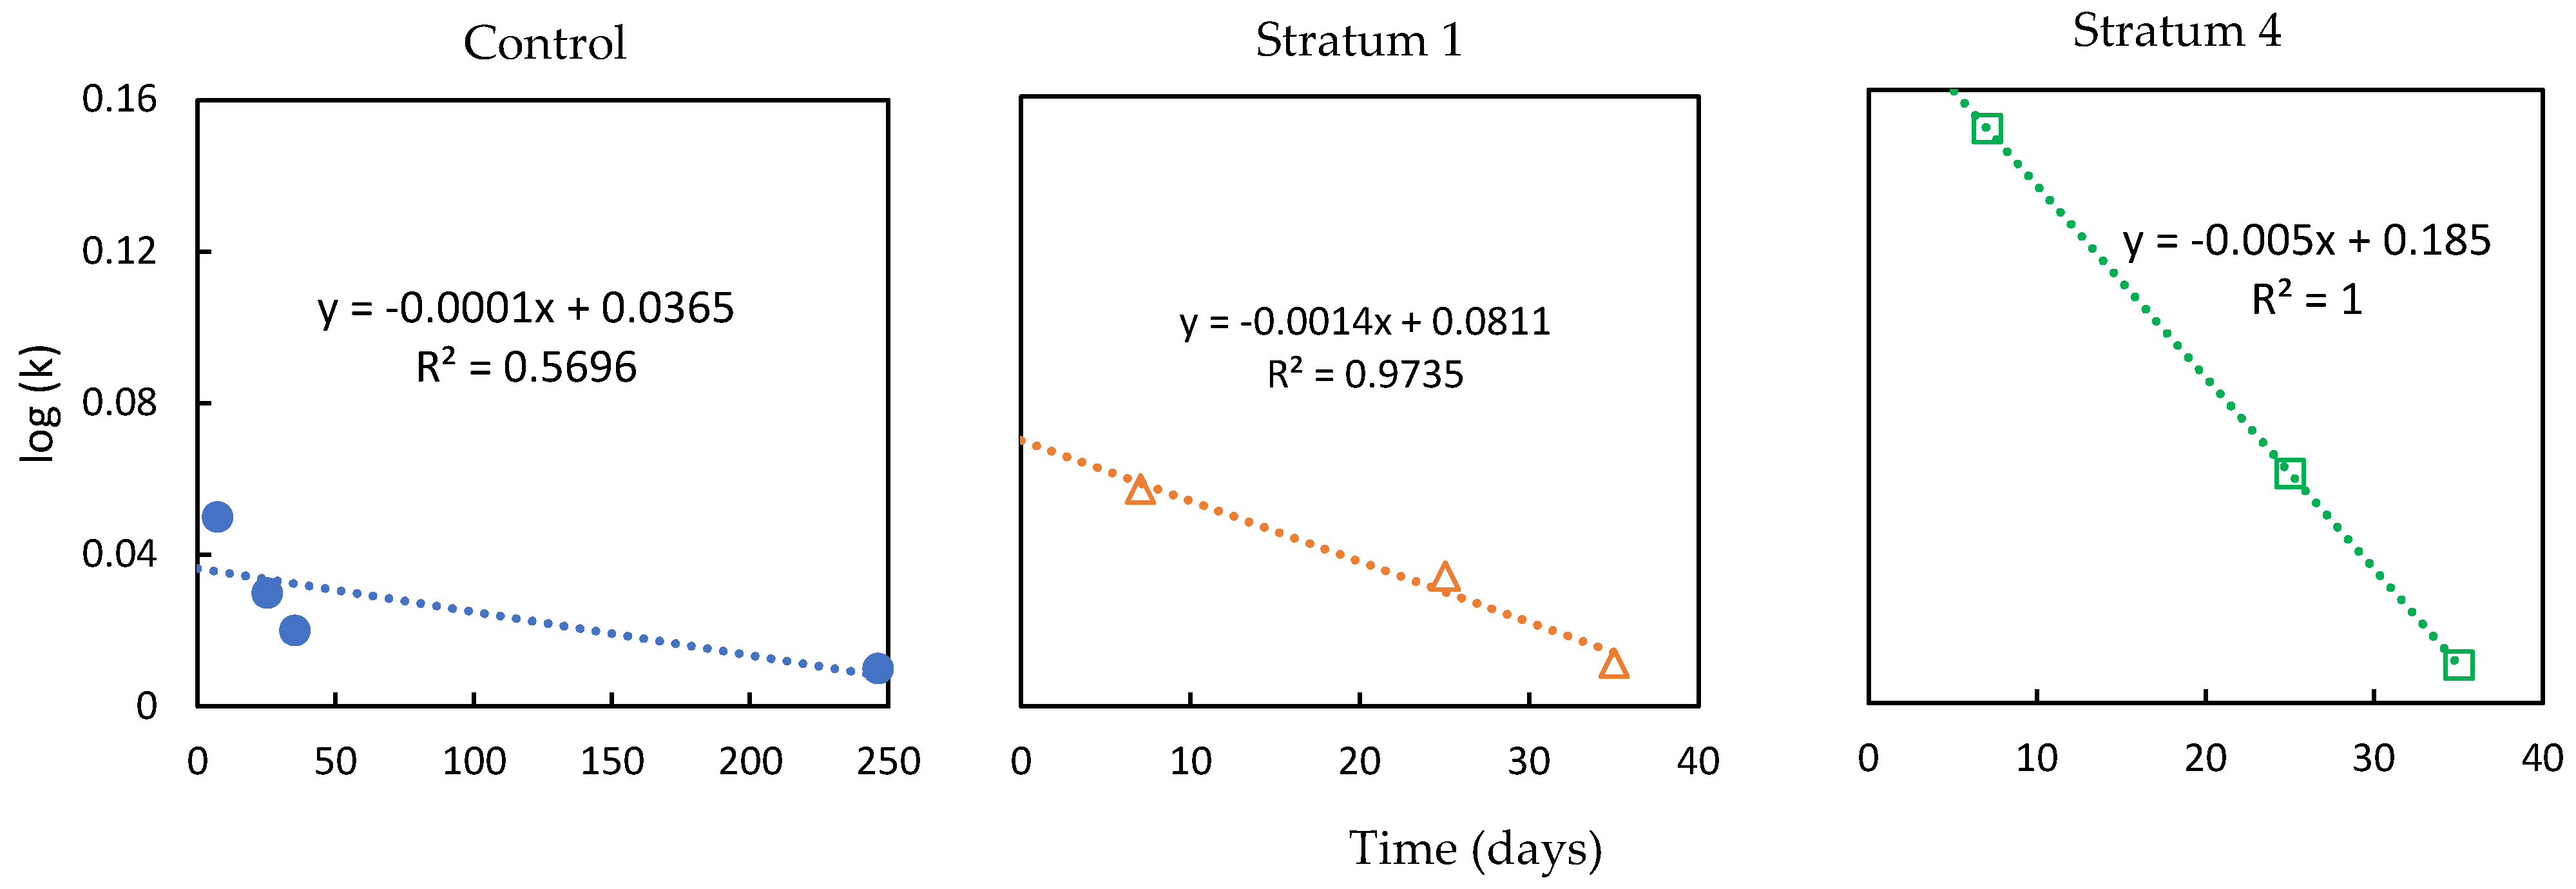
Figure 16.
The experimental data of the stratums are compared with different case studies from the literature. The incubation time (t) was extrapolated to 66 days for all the stratums (C, S1 and S4). Blue asterisks (*) are references of tea bag index (TBI) parameters from different environments as shown by Keuskamp et al. [80], where numbers of labels indicate country and ecosystem (United States–Florida=US-FL; China=CN; Panama =PA, the Netherlands =NL; Austria=AU; Ireland=IE; and Iceland =IS). The t value for all the other environments varied between 66 and 90 days.
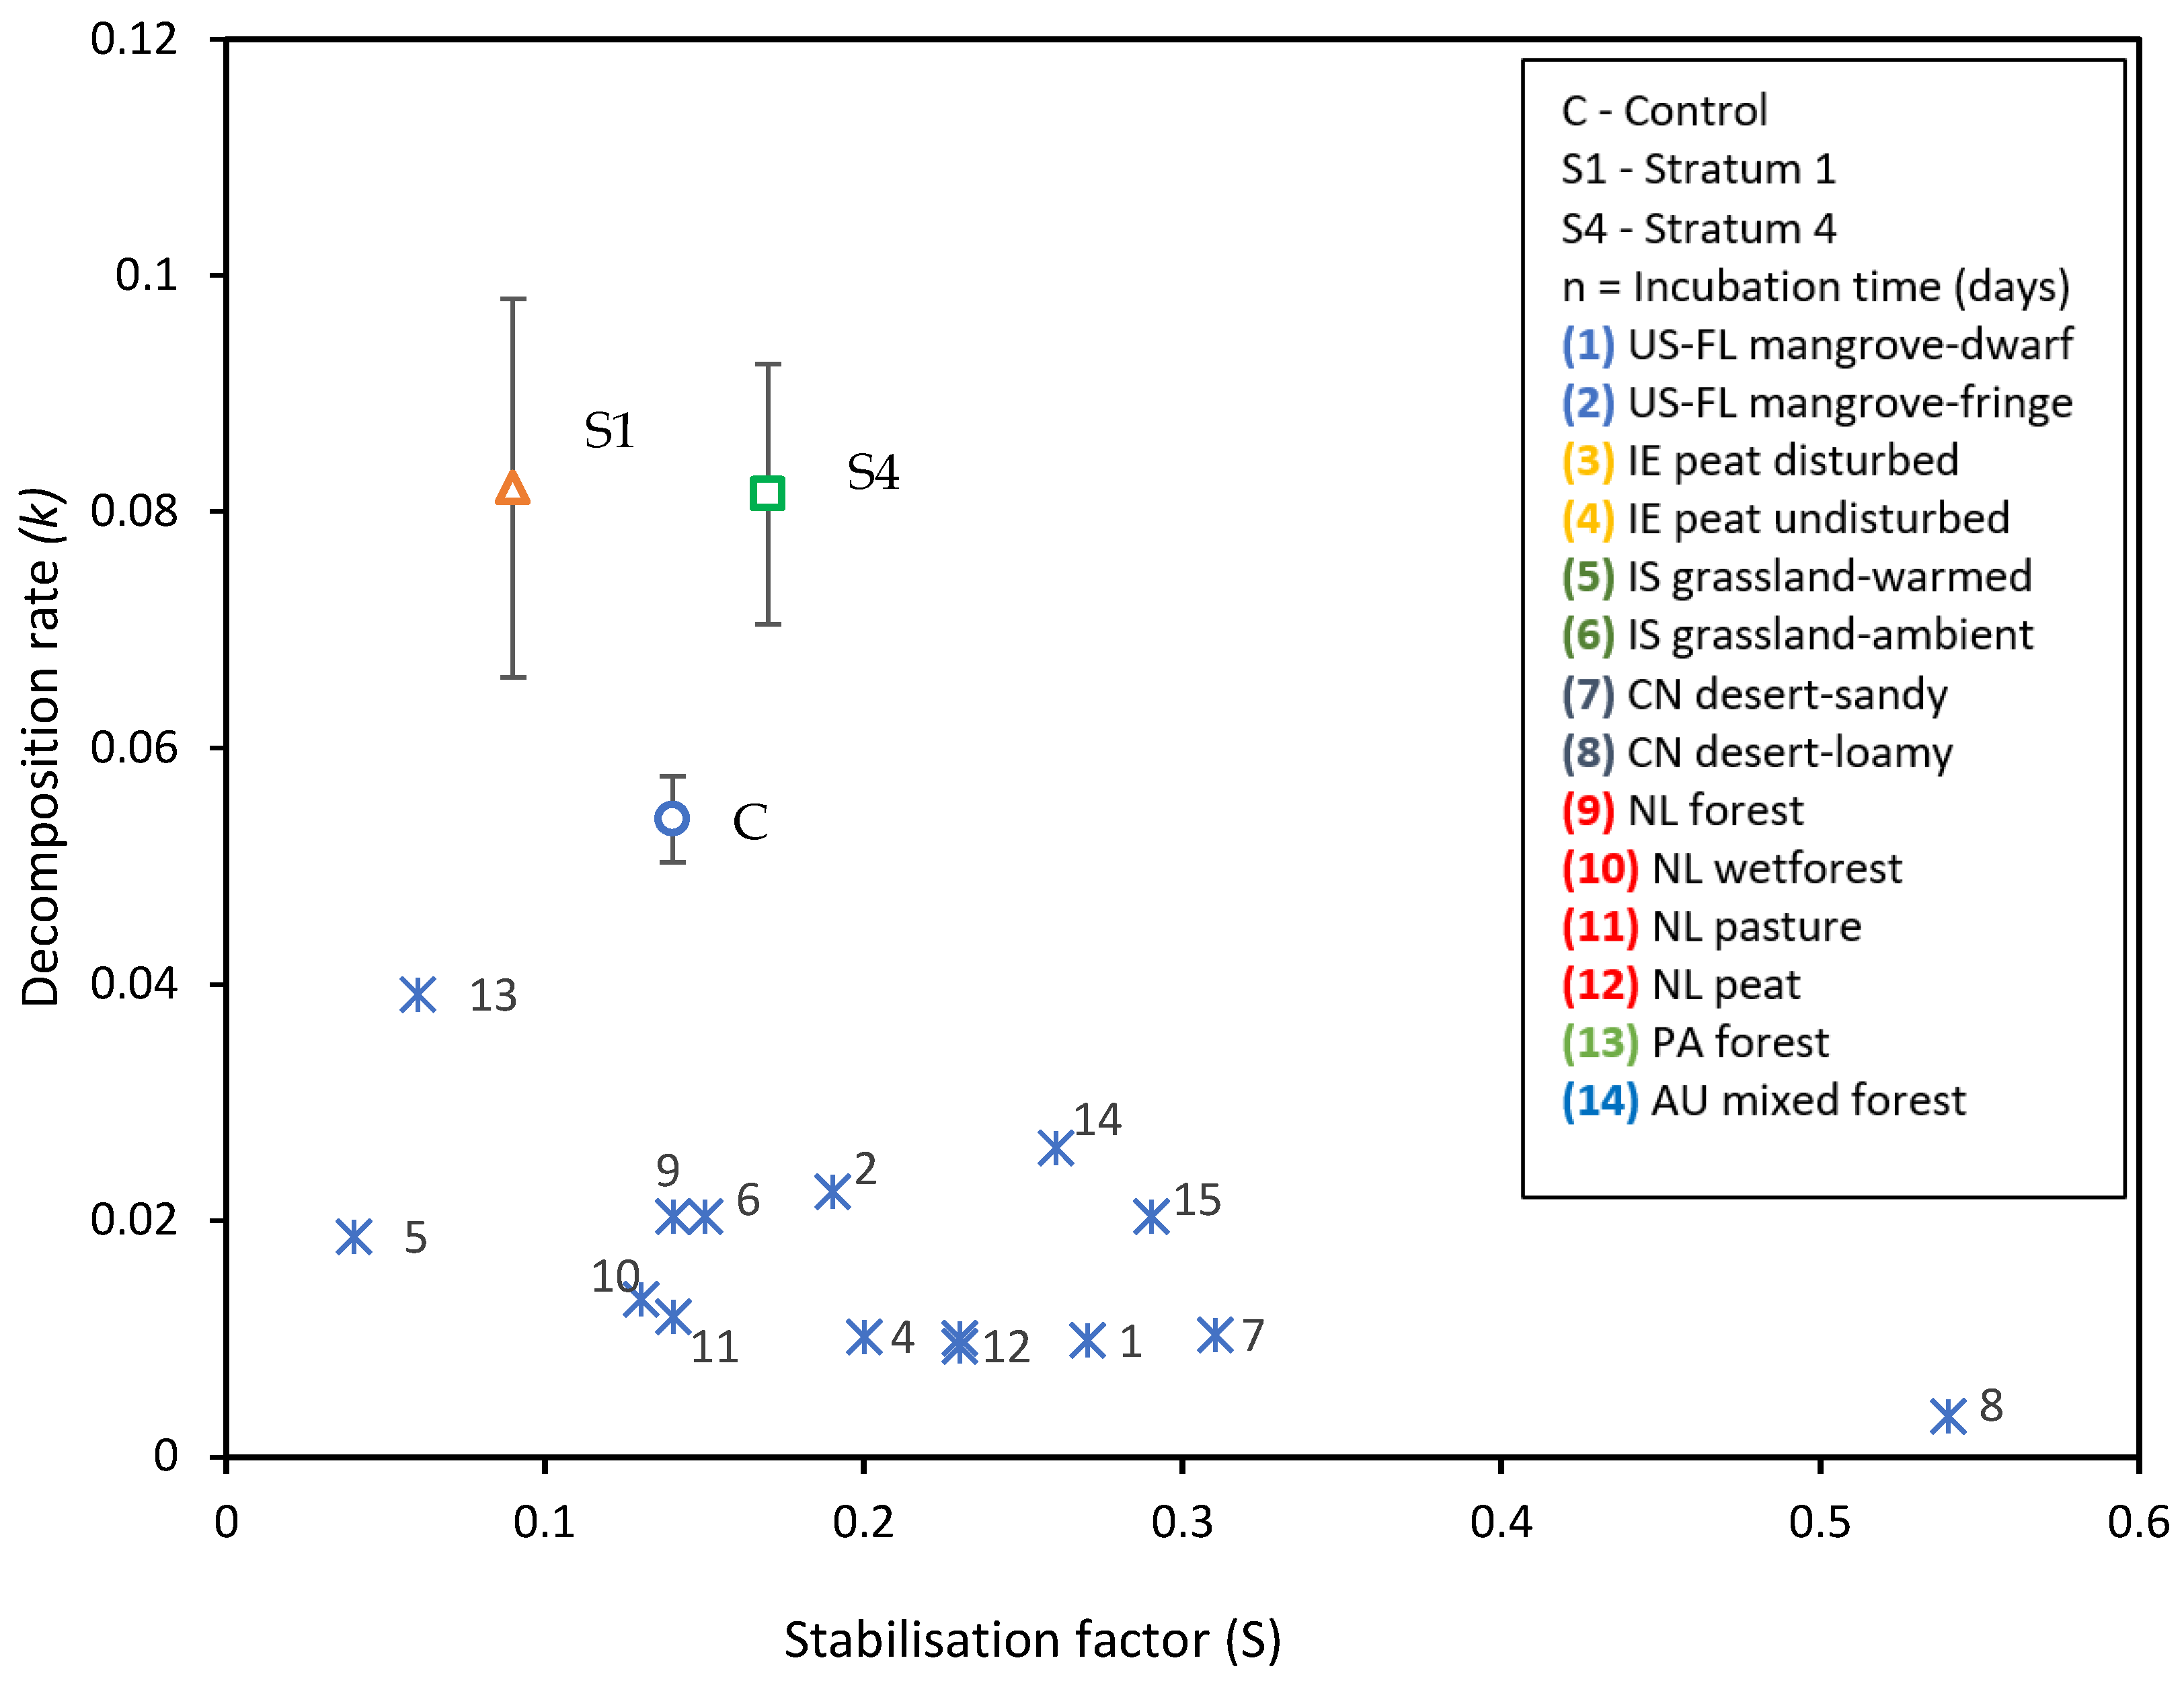
Figure 17.
(a) Comparing the α-diversity of the control (C) and treatment soil samples (S1,S2,S3,S4). (b) Principal Coordinate Analysis (PCA) showing the variance axis of treatment stratums and control.
Figure 17.
(a) Comparing the α-diversity of the control (C) and treatment soil samples (S1,S2,S3,S4). (b) Principal Coordinate Analysis (PCA) showing the variance axis of treatment stratums and control.
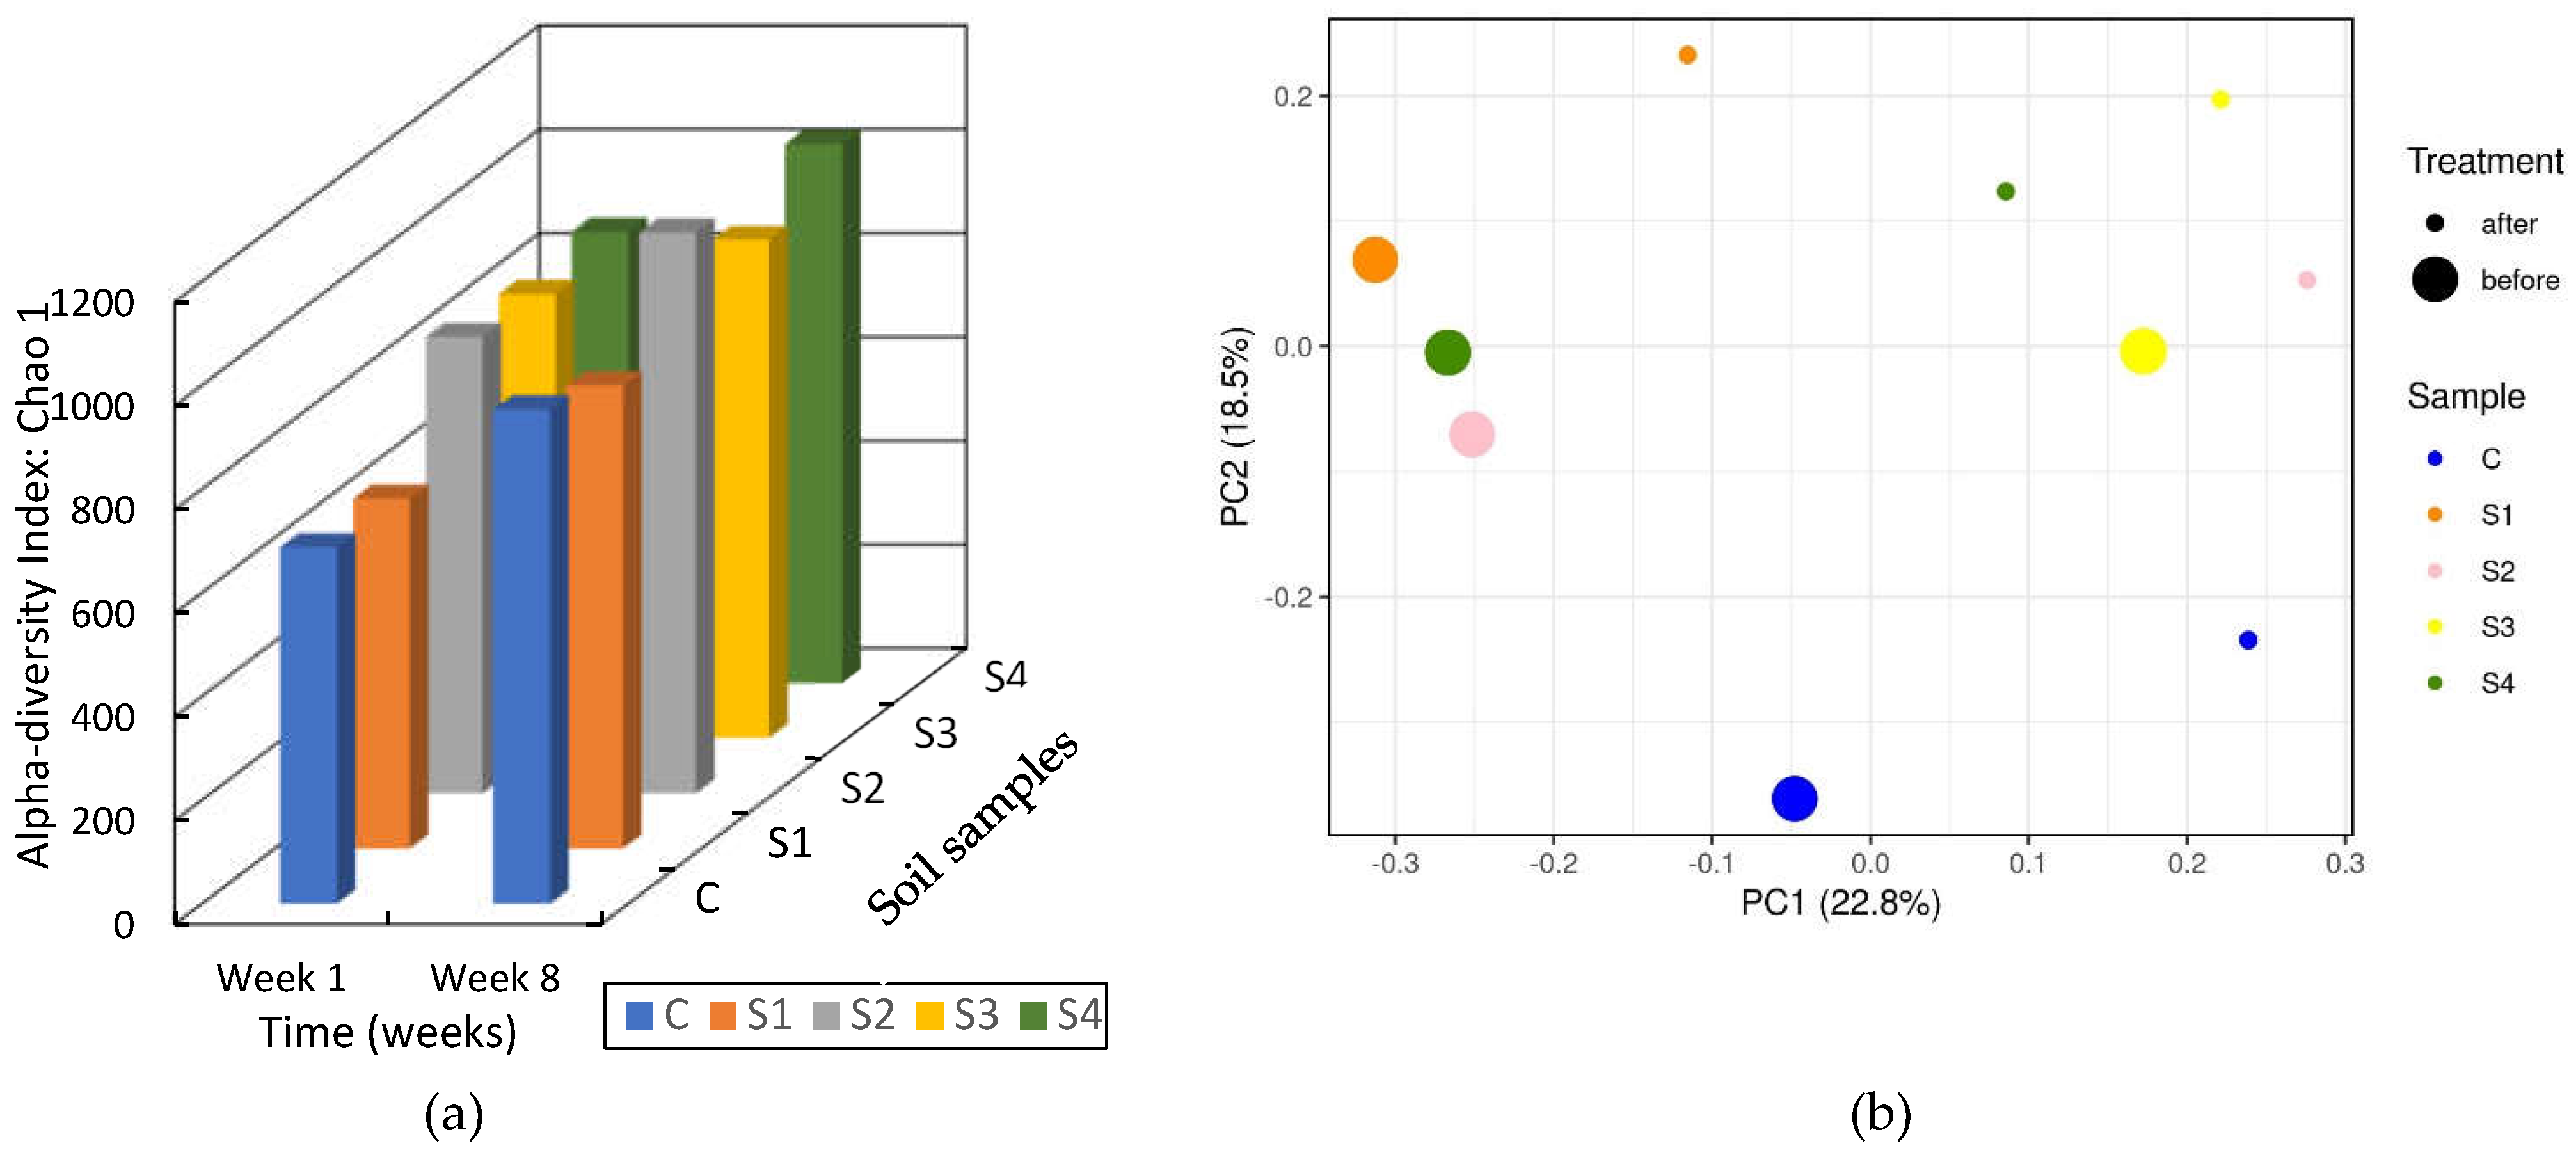
Figure 18.
Comparing t-SNE and UMAP analysis for Control and treatment samples from week 1 (before treatment) to week 8 (after treatment).
Figure 18.
Comparing t-SNE and UMAP analysis for Control and treatment samples from week 1 (before treatment) to week 8 (after treatment).
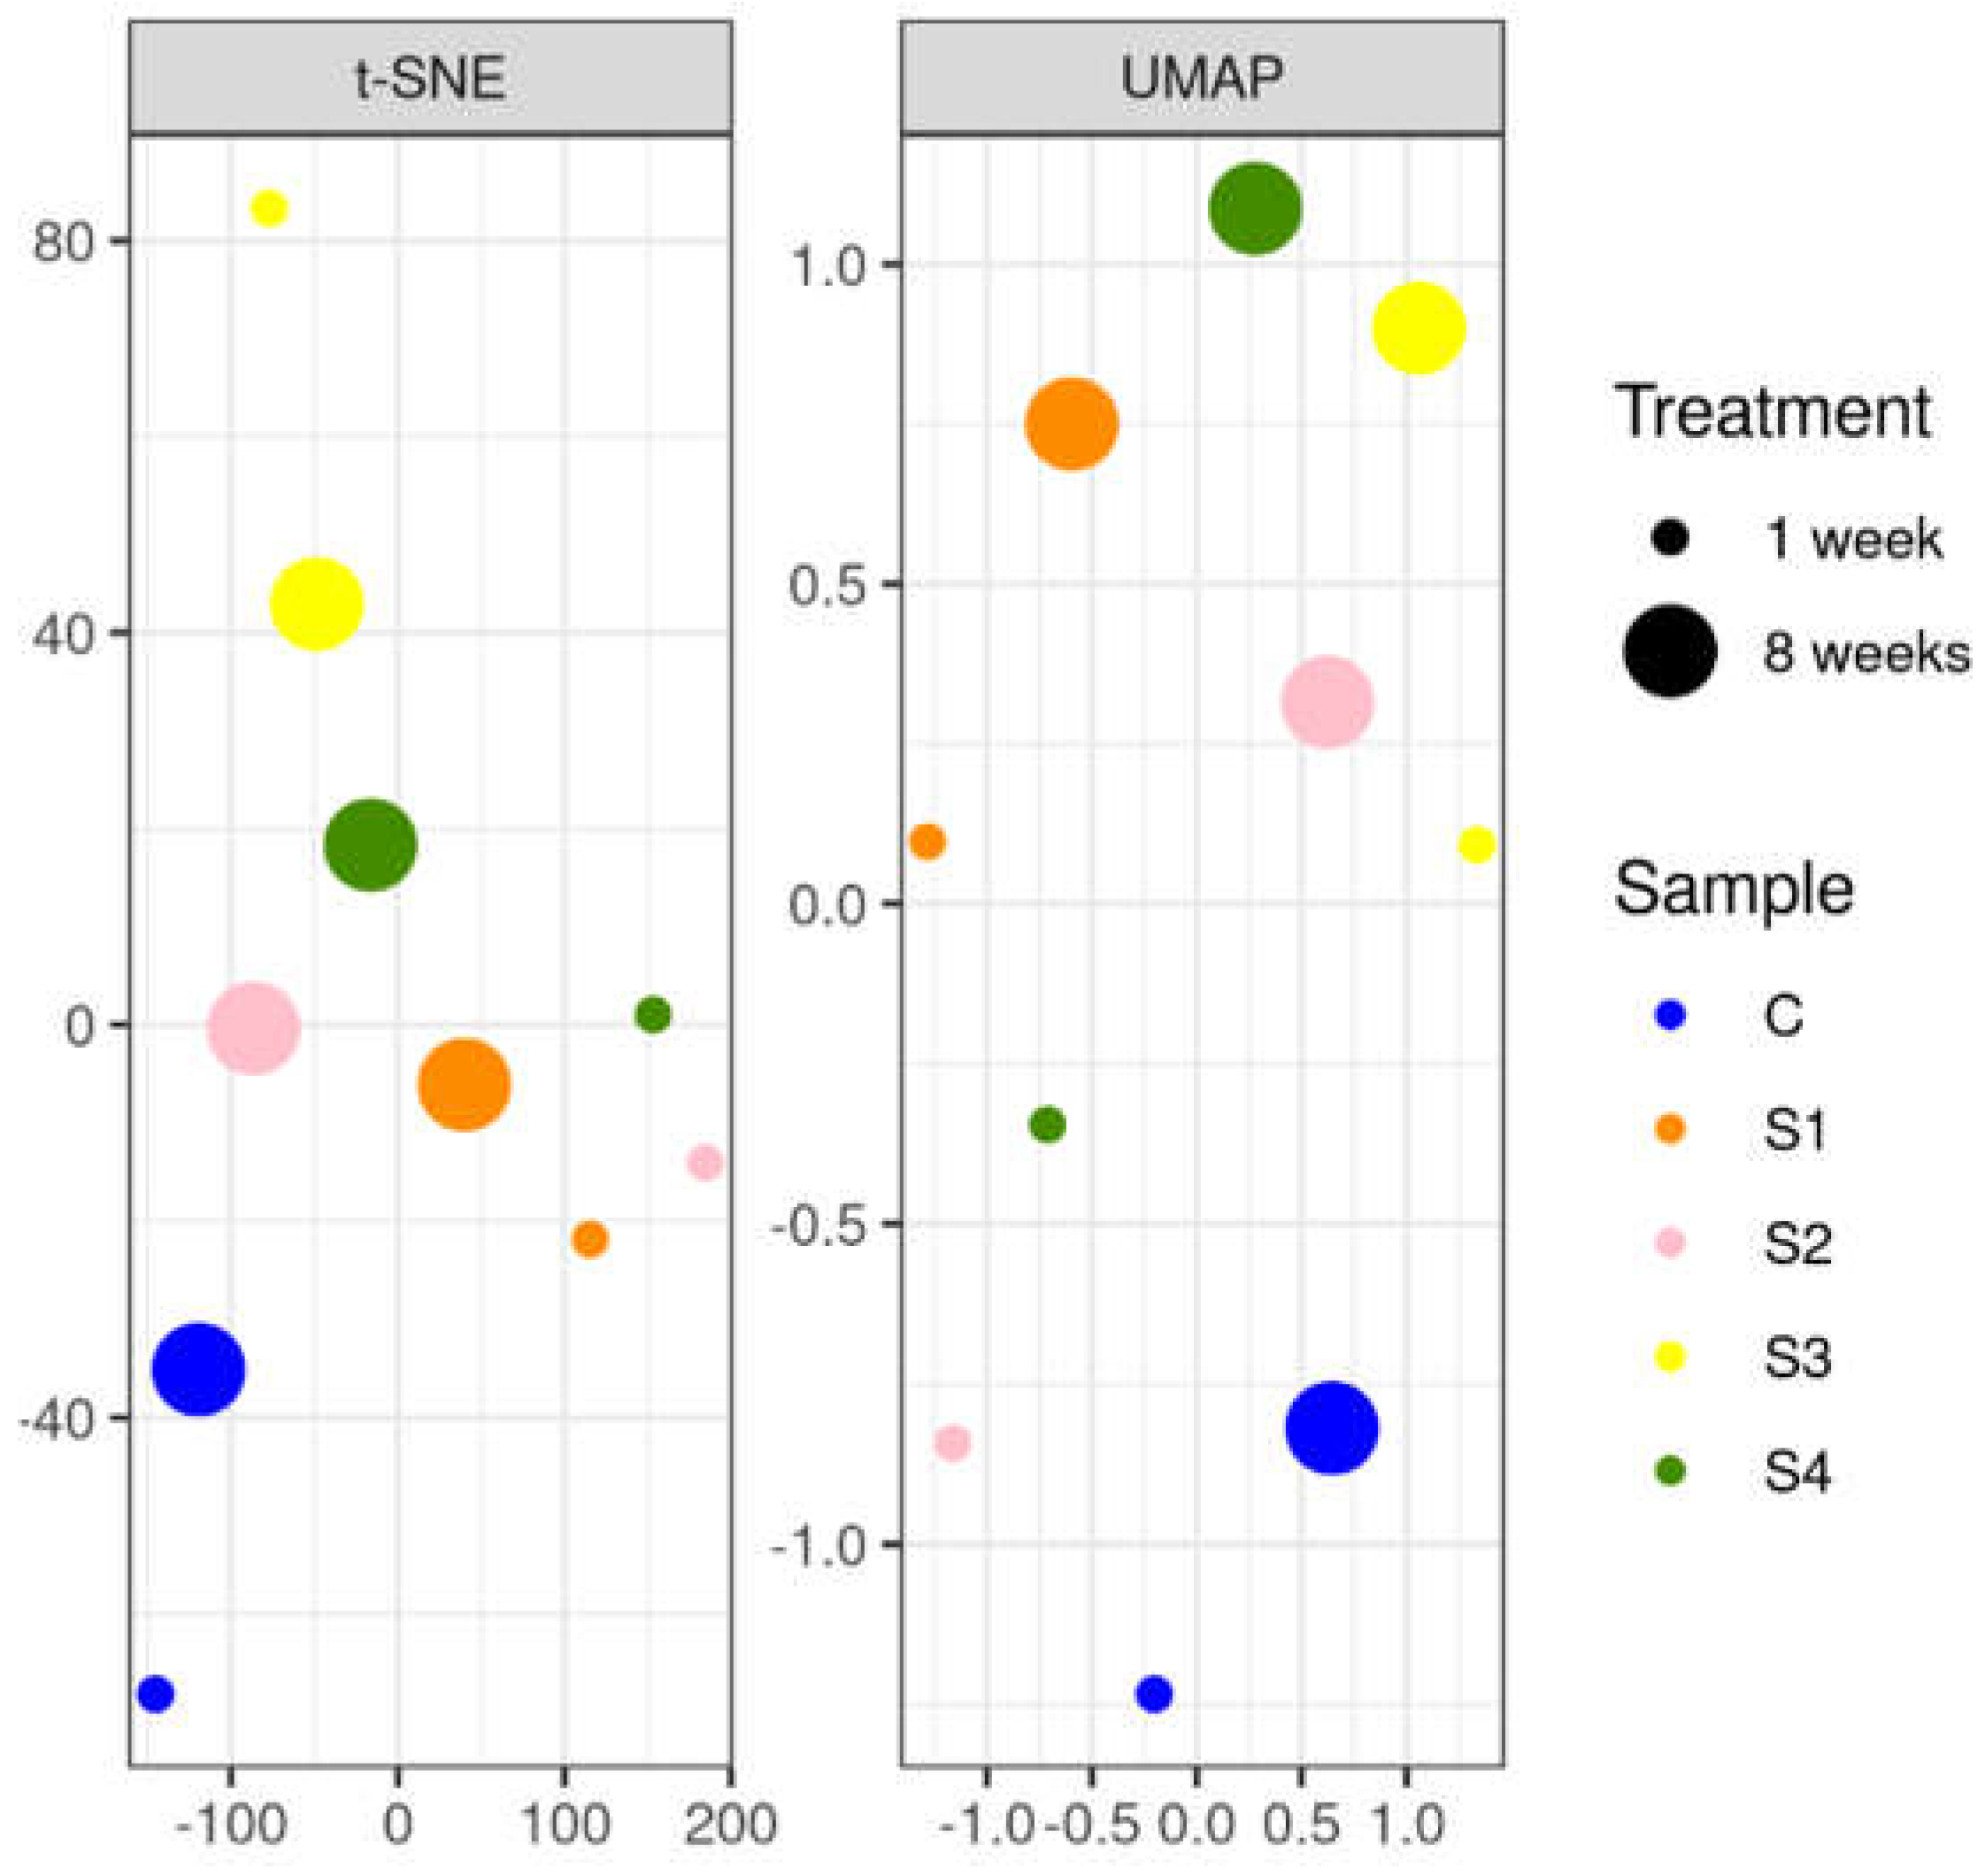
Figure 19.
Phylum taxonomy of the stratums. S refers to the treatment stratum number (S1, S2, S3, S4) and C is the Control soil. S1.1, C.1, S2.1, S3.1and S4.1 are soil samples before the start of the experiment. S1.2, S2.2, S3.2, and S4.2 are soil samples that absorbed the GW for a period of 8 weeks, and C.2 absorbed the tap water for a period of 8 weeks.
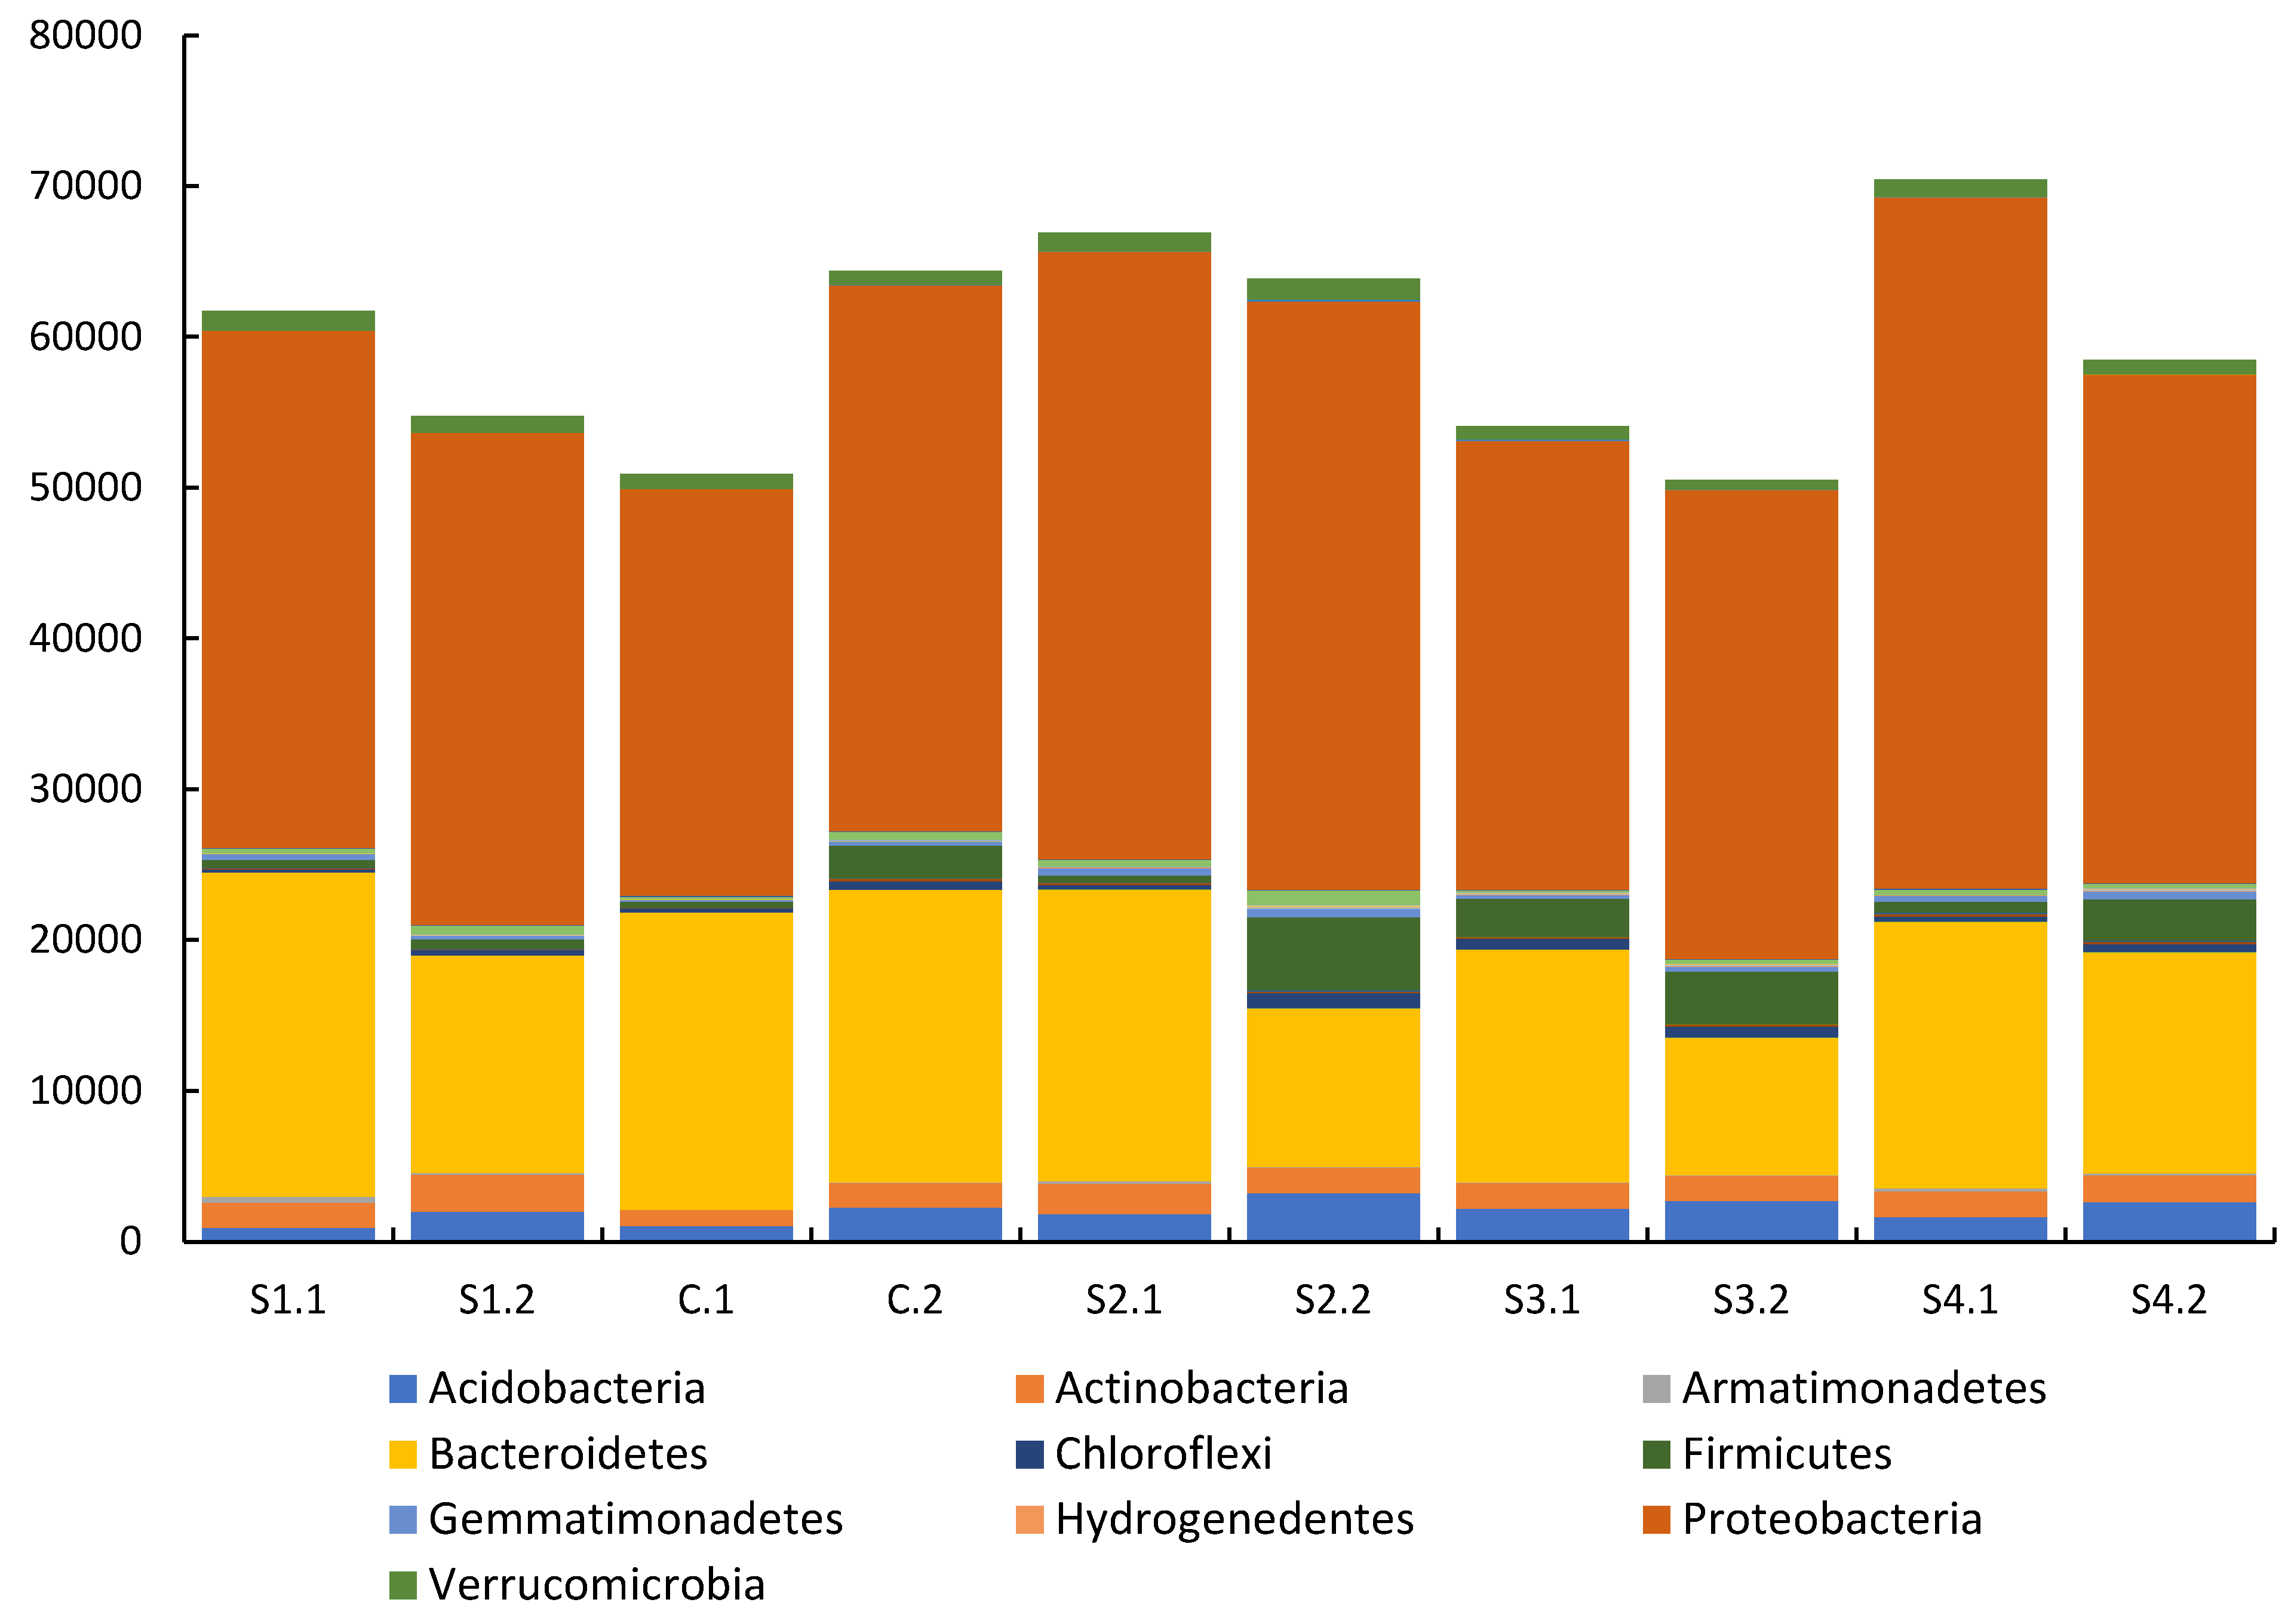
Table 1.
GW classes with ingredients, the standard classifications are Light (L) and Dark (D). Here the LGW and DGW are classified by A, B, and C, D.
Table 1.
GW classes with ingredients, the standard classifications are Light (L) and Dark (D). Here the LGW and DGW are classified by A, B, and C, D.
| GW Class | Origin | Products | Percentage of Total GW |
|---|---|---|---|
| Class A (LGW) | Washbasin | Hand Washing soap, toothpaste, body care products, shaving waste, hair |
50 – 60% [3] |
| Class B (LGW) | Bathroom | Body wash soap, shampoos, body care products, hair, body fats, lint, and traces of urine | |
| Class C (DGW) | Kitchen Sink | Food residues, high amounts of oil and fat, and dishwashing detergents. | 10% [25,26,27,28,29,30,31,32] |
| Class D (DGW) | Laundry & all other washing required spaces | Laundry soap, bleaches, oils, paints, solvents, non-biodegradable fibers from clothing, and microplastics. |
25 – 30% [31,32] |
Table 2.
Physical, chemical, and microbiological parameters of Class A GW (LGW) found in literature and their range. Square brackets “[]” in the first column represent units. The third column represents the acceptable values by standards.
Table 2.
Physical, chemical, and microbiological parameters of Class A GW (LGW) found in literature and their range. Square brackets “[]” in the first column represent units. The third column represents the acceptable values by standards.
| Physical Parameters [Units] | Values | Range |
|---|---|---|
| Turbidity [Nephelometric Turbidity unit, NTU] | 164 [30], 84.3 [33], 35-164 [35] | Irrigation water quality standard < 10 [36] Fairly turbid (15 – 25) Rather turbid (25 – 35) Turbid (35 – 50) Very turbid > 50 |
| Total solids (TS) | 835 [30], 204 [37], 450.3 [33] | |
| Total suspended solids (TSS) [mg/L] | 153-259 [30], 141.2 [33], 25-181 [35] | Irrigation water quality standard (≤ 33) |
| Total dissolved solids (TDS) [ppm] | 473.3 [33] | Ideal drinking (0 – 40) Acceptable (40 – 100) Borderline (100 – 200) Average tap water (200 – 300) Possibly hazardous (300 – 400) Potentially hazardous (400 – 500+) |
| Chemical parameters | ||
| pH | 7–7.3 [30], 7.43 [38],7.96 [39], 7.2 [33],6.72–9.82 [35], 6.7–9.8 [40] | Adequate for irrigation (6 – 8) |
| Biochemical oxygen demand (BOD) [mg/L] | 155–205 [30], 109 [41], 155 [42], 100 [43], 568 [39], 138.5 [33], 33–305 [35], 35–92 [40] | Irrigation water quality standard (≤ 50) |
| Chemical oxygen demand (COD) [mg/L] | 386–587 [30], 263 [41], 587 [42], 110 [43], 58 [37], 1171 [39], 340.5 [33], 47–587 [35], 47–350 [40] | Irrigation water quality standard (≤ 50) |
| Chlorides [mg/L] | 237 [30] | Irrigation water quality standard (≤ 70) |
| Methylene blue active substances (MBAS) [mg/L] | 3.3 [30] | – |
| Oil and grease (O&G) [mg/L] | 135 [30] | – |
| Total organic carbon (TOC) [mg/L] | 99 [42], 63 [43], 155.28 [44], 60.8 [33] | |
| Total Nitrogen (TN) / NH3 [mg/L] | 10.4 [30], 9.6 [41], 10.4 [42], 10.2 [43], 2.22 [44], 0.21 [37], 14.3 [39], 0.6 [33], 2.5–10.4 [35] | Irrigation water quality standard (≤ 5) |
| Total Phosphorous (TP) [mg/L] | 2.58 [41], 0.13 [42], 0.15 [44], 2.25 [39], 1.1 [33], 0.3–2.6 [35] | Irrigation water quality standard (≤ 0.8) |
| N/TOC [mg/mg] | 0.11 [42], 0.16 [43] | – |
| P/NOC [mg/mg] | 0.001 [42], | – |
| Microbiological parameters | ||
| Total coliform (TC) (Most Probable Number, [MPN] | 9.42E4 [30], 0.0–1.7 x 10⁶ [40] | – |
| Fecal coliform (FC) [MPN] | 3.50E4 [30] | – |
| Escherichia coli (E.coli) [MPN] | 10 [30] | <1000 per 100 mL |
| Ground elements & heavy metals | ||
| Boron (B) [mg/L] | 0.44 [30] | Irrigation water quality standard (≤ 0.75) |
| Calcium (Ca) [mg/L] | 51.19 [44], 0 [37], 5.1 [33] | Irrigation water quality standard (≤ 120) |
| Magnesium (Mg) [mg/L] | 7.25 [44], 0 [37], 1.8 [33] | Irrigation water quality standard (≤ 24) |
| Sodium (Na) [mg/L] | 131 [30], 17.11 [37], 19.2 [33] | Irrigation water quality standard (≤ 30) |
| Sulfur (S) [mg/L] | 27.70 [44], 2.12 [33] | |
| Copper (Cu) [mg/L] | 0.005 [44] | Irrigation water quality standard (≤ 0.02) |
| Zinc (Zn) [mg/L] | 0.020 [44], 2.03 [33] | Irrigation water quality standard (≤ 2) |
| Potassium (K) [mg/L] | 1.55 [44], 1.98 [37], 3.6 [33] | Irrigation water quality standard (≤ 20) |
| Iron (Fe) [mg/L] | 2 [44], 0.17 [33] | Irrigation water quality standard (≤ 5) |
Table 3.
Guidelines on the parameters required for GW reuse according to different organizations/institutes.
Table 3.
Guidelines on the parameters required for GW reuse according to different organizations/institutes.
| Required Parameters for Reuse of GW | USEPA Standards [47] |
UK/EU Water Standards [48,49] | NSW Government [46] | USEPA Reclaimed Water Standard for Water Closet Flushing [50] |
|---|---|---|---|---|
| Water quality | ||||
| pH | 6 – 9 | 6 – 9 | 5.5 – 7.5 | 6 – 9 (monitor 1/month) |
| TSS | < 30 mg/L | < 30 mg/L | 30 mg/L | |
| BOD | < 30 mg/L | < 30 mg/L | 20 mg/L | < 10 Monitor 1/week |
| Turbidity | 0.1 NTU |
< 2 NTU continuous monitor | ||
| Pathogen criteria | ||||
| Total coliform | 2.2 cfu/100 mL | 2 cfu/100 mL | 10 cfu/ 100 mL | |
| Fecal coliform | ≤ 200 cfu/100 mL | ≤ 200 cfu/100 mL | No fecal coliforms /100mL |
Table 4.
pH and Electrical conductivity (EC) of different products combined with water.
| Products | pH | EC |
|---|---|---|
| Water + Shampoo | 5.78 | 5.02 |
| Water + Mouthwash | 5.12 | 0.09 |
| Water + Toothpaste | 9.54 | 1.38 |
| Water + Body wash | 4.36 | > 6 |
| Water + Laundry soap | 10.72 | > 6 |
Table 5.
Measuring methods/Standards used for water and soil tests. Testing parameters 1.1,1.2 and 2.2 were done at The University of Sydney's Off-grid tech lab. 1.3, 1.4, 1.5, 1.6, 1.7, and 2.1 were performed by Enviro tech lab services in Chatswood. 2.3 tests were performed at The Metagen lab services in Queensland.
| Testing Parameters | Measuring Method/Standards |
|---|---|
| 1. Water tests | |
| 1.1 pH | Measured by Gro Line Waterproof Portable pH/EC |
| 1.2 Electrical conductivity | Measured by Gro Line Waterproof Portable pH/EC |
| 1.3 Turbidity | Measured nephelometrically using Inorg-022 a turbidimeter, in accordance with APHA latest edition, 2130-B. |
| 1.4 Total suspended solids | Determined gravimetrically by filtration of the sample. The samples are dried at 104+/-5 °C. |
| 1.5 BOD | Analyzed in accordance with Inorg-091 APHA latest edition 5210 D. |
| 1.6 Total coliform | Australian standard 4276.5-2007 |
| 1.7 Fecal coliform | Australian standard 4276.5-2007 |
| 2. Soil tests | |
| 2.1 Physiochemical tests | |
| 2.1.1 pH | Measured using pH meter and electrode in accordance with APHA latest edition, 4500-H+. |
| 2.1.2 Electrical conductivity (EC) | Measured using a conductivity cell at 25 °C in accordance with APHA latest edition 2510 and Rayment & Lyons. |
| 2.1.3 Moisture content | Determined by heating at 105°C (±5) for a minimum of 12 hours |
| 2.1.4 Total organic carbon (TOC) | A titrimetric method that measures the oxidizable organic content of soils. |
| 2.1.5 Total Nitrogen (TN) | Calculated as the sum of TKN (Total Kjeldahl Nitrogen) and oxidized nitrogen. Alternatively analyzed by combustion and chemiluminescence. |
| 2.1.6 Cation Exchange Capacity (CEC) - NH4Cl | Using 1M ammonium chloride exchange and ICP-AES (inductively coupled plasma atomic emission spectroscopy) analytical finish. |
| 2.2 Biomass tests | Tea bag index (TBI) tests |
| 2.3 DNA Extraction | Soil DNA sequencing |
Disclaimer/Publisher’s Note: The statements, opinions and data contained in all publications are solely those of the individual author(s) and contributor(s) and not of MDPI and/or the editor(s). MDPI and/or the editor(s) disclaim responsibility for any injury to people or property resulting from any ideas, methods, instructions or products referred to in the content. |
© 2023 by the authors. Licensee MDPI, Basel, Switzerland. This article is an open access article distributed under the terms and conditions of the Creative Commons Attribution (CC BY) license (http://creativecommons.org/licenses/by/4.0/).
Copyright: This open access article is published under a Creative Commons CC BY 4.0 license, which permit the free download, distribution, and reuse, provided that the author and preprint are cited in any reuse.


