
Submitted:
15 April 2025
Posted:
16 April 2025
You are already at the latest version
Abstract
Soil organisms serve as reliable indicators of soil quality, particularly when linked to key ecological processes. This study investigated the role of glomalin-related soil protein (GRSP) as a key factor in soil aggregation and organic carbon storage in irrigated and rainfed systems, with a focus on pig slurry fertigation. Two GRSP fractions—easily extractable (EE-GRSP) and total (T-GRSP)—were evaluated across three soil depths (0–10 cm, 10–20 cm, and 20–30 cm) in both management systems. Soil physical, chemical, and microbiological properties were analyzed, including enzyme activity and microbial diversity, with microbial community structure characterized via e-DNA sequencing. Results showed that the irrigated system exhibited a 66% higher T-GRSP concentration compared to the rainfed system, contributing 3.1% to total soil carbon, while the rainfed system contributed 1.1%. Significant correlations were observed between GRSP fractions, nutrient availability, microbial enzyme activities, and e-DNA–derived microbial profiles—especially in the topsoil layer. These findings suggest that glomalin, particularly in systems employing organic practices such as pig slurry fertigation, is a robust indicator of soil quality with potential applications in sustainable land management.
Keywords:
soil quality
; glomalin-related soil protein
; enzymatic activity
; e-DNA
; microbial diversity
; irrigated system
; pig slurry
; fertigation
; rainfed system
1. Introduction
Soil quality is a multidimensional concept that reflects the soil’s capacity to function effectively within an ecosystem and support plant growth. Introduced in 1994, this concept emphasizes the importance of evaluating chemical, physical, and biological parameters that underpin both inherent soil processes and plant productivity [1]. Recent comprehensive reviews have stressed the potential of advanced soil quality assessments to guide sustainable management practices [2].
Biological indicators, including microbial community structure and extracellular enzyme activities, have become increasingly critical in assessing soil health. Enzymes such as β-glucosidase, arylsulfatase, and acid phosphatase serve as proxies for microbial activity and nutrient cycling, offering insights into organic matter decomposition and soil carbon dynamics [3,4]. In parallel, recent advances in environmental DNA (e-DNA) sequencing now allow for a comprehensive characterization of soil microbial communities, further informing our understanding of soil functionality [5,6].
A critical component in soil quality assessment is glomalin-related soil protein (GRSP), produced by arbuscular mycorrhizal fungi (AMF). AMF form symbiotic relationships with plants and contribute significantly to carbon sequestration by synthesizing glomalin—a glycoprotein that enhances soil aggregation and stabilizes organic carbon [7-9]. GRSP is typically quantified in two fractions: easily extractable (EE-GRSP) and total (T-GRSP), with T-GRSP being more recalcitrant to decomposition [7]. Research suggests that GRSP may account for about 4% of total soil carbon and plays a fundamental role in maintaining soil structure and function ([9,10] although earlier work has also discussed limitations and new hypotheses regarding its function [11]).
Agricultural practices and land-use changes can significantly influence microbial diversity and GRSP production, often leading to declines in soil quality [12]. Conventional soil quality assessments, despite their utility, are often labor-intensive and expensive. In contrast, integrating GRSP measurements with modern genomic approaches such as e-DNA sequencing offers a promising alternative, enabling simultaneous assessment of soil biochemical properties and microbial community dynamics [3,5,6]. This integrated approach provides a robust indicator of soil quality that can inform sustainable land management practices.
In this study, we evaluate GRSP levels in soils managed under two contrasting systems—irrigated (using pig slurry fertigation) and rainfed—by assessing their physical, chemical, and microbiological properties across different soil depths. Our aim is to elucidate the relationships between GRSP fractions, soil structure, nutrient availability, and microbial community composition, thereby establishing glomalin as a reliable indicator for sustainable soil management.
2. Materials and Methods
This section details the study area, experimental design, sampling procedures, analytical methods, and statistical analyses employed in the research.
The study was conducted at Fazenda Capuaba, located at –13°15’8.47” S, 56°04’52.58” W, at an altitude of 425 meters in Lucas do Rio Verde, Mato Grosso, Brazil (see Figure 1). The farm is situated within the Cerrado biome, one of the largest and most diverse savannas in the world, and the soil is classified as a Dystrophic Red-Yellow Latosol [13], characterized by low natural fertility and high acidity typical of tropical climates.
The experiment compared two agricultural production systems. The first was an irrigated system covering 136 hectares that utilized pig slurry fertigation as an organic fertilizer; the second was a rainfed system managed without supplemental irrigation. Soil samples were collected from both systems at three depths (0–10 cm, 10–20 cm, and 20–30 cm). Additionally, samples were collected from a Permanent Preservation Area (PPA) to serve as a reference for undisturbed soil; however, sampling in the PPA was limited to the 0–10 cm layer to minimize disturbance.
Soil sampling was carried out during the post-harvest phase in June 2022 using a stratified approach. Mini trenches were excavated at 225-meter intervals across each management area, and 15 subsamples per depth were collected for each system, yielding a total of 90 samples. Two types of samples were obtained: undisturbed samples were collected using Kopeck rings for bulk density and soil structure analyses, while disturbed samples were used for granulometry, total carbon and nitrogen determination, enzyme assays, microbial community profiling (via e-DNA extraction and sequencing), and GRSP quantification. All samples were immediately placed in labeled plastic bags, kept in ice-packed containers during transport, and stored at approximately 4°C in the Biotechnology and Microbial Ecology Laboratory at UFMT until further processing.
For microbial community analysis, total DNA was extracted from soil samples using the DNeasy Power Soil Kit (Qiagen) following the manufacturer’s protocol. DNA integrity was confirmed by electrophoresis on a 0.8% agarose gel stained with SYBR Safe. The 16S rRNA gene (for bacteria) and the ITS region (for fungi) were targeted using specific primers. For bacterial profiling, the V3-V4 region was amplified using primers CCTACGGGNGGCWGCAG (forward) and GACTACHVGGGTATCTAATCC (reverse) [14,15]; for fungal profiling, the ITS1 (forward) and ITS2 (reverse) primers were used [16,17]. Sequencing was performed on the Illumina MiSeq platform with a minimum of 30,000 reads per sample and a Q20 quality score above 99%.
GRSP was extracted from field-moist soil using a sodium citrate buffer (Na3C6H5O7) under two pH conditions: pH 7.0 for easily extractable glomalin (EE-GRSP) and pH 8.0 for total glomalin (T-GRSP). Extractions were carried out at 121 °C for 30 minutes following a modified protocol by Reyna and Wall [18], and protein concentrations were determined using the Bradford assay [19] with absorbance measured at 570 nm.
Enzyme assays for β-glucosidase, arylsulfatase, and acid phosphatase were performed colorimetrically following the methodology described by Silveira et al. [20], based on the release of p-nitrophenol with absorbance readings at 410 nm. All enzyme analyses were conducted on soil samples maintained at field moisture levels.
Spore density was determined using a combination of wet sieving and centrifugation. Fifty grams of field-moist soil were processed according to methods by Gerdemann and Nicolson [21] and Jenkins [22], and after centrifugation in a 50% sucrose solution, spores were quantified on Petri dishes using a stereomicroscope.
Physical and chemical properties were assessed by determining particle size distribution through combined chemical and physical methods [23,24]. Soil aggregates were separated using dry sieving and dispersion, and the mean geometric diameter (MGD) was calculated using the equation of Kemper and Rosenau [25]:
where “wi” is the weight of aggregates in a given size class and “xi” is their average diameter.
MGD = (∑ wi × log xi) / (∑ wi)
Phosphorus and potassium were extracted using the Mehlich-1 method, calcium and magnesium were determined using 1N KCl, and soil pH was measured in a CaCl₂ solution. Bulk density was determined by drying undisturbed samples at 105 ºC, and total carbon and nitrogen were measured using a LECO® CHN 628 elemental analyzer via the Dumas combustion method.
A modified Soil Quality Index (SQI) was calculated based on Mendes et al [26] by integrating biological and chemical indicators. It considers three key functions: nutrient cycling (F1), based on enzyme activities (β-glucosidase and Arylsulfatase); nutrient storage (F2), represented by soil organic matter (SOM) and cation exchange capacity (CEC); and nutrient supply (F3), which includes P, K, Ca, Mg, pH, and Al³⁺ saturation.
Statistical analyses were conducted using non-parametric methods (Mann-Whitney and Kruskal-Wallis tests) in SPSS (version 30) and Jamovi software. Because the data did not follow a normal distribution, robust regression using the MM-estimation method was applied to assess relationships between the SQI and key soil properties (including GRSP fractions, bulk density, and MGD), ensuring reliable coefficient estimates.
3. Results
3.1. Principal Component Analysis
The Principal Component Analysis (PCA), applied to chemical, physical, and biological soil attributes, explained 61.1% of the total variability among management systems (Irrigated and Rainfed) and soil depths (0–10, 10–20, and 20–30 cm). PCA clusters distinctly separated these depth layers, offering valuable insights into variations associated with soil depth (Figure 2). Specifically, PC1 explained 45.2% of the variability and primarily represented three critical soil functions contributing to the modified Soil Quality Index (SQI): nutrient cycling (F1, involving enzyme activities such as β-glucosidase and Arylsulfatase), nutrient storage (F2, characterized by soil organic matter and cation exchange capacity), and nutrient supply (F3, comprising available P, K, Ca, Mg, soil pH, and Al³⁺ saturation). High positive coefficients for F2, EE-GRSP, F1, and F3 in PC1 clearly demonstrated their significant role in nutrient dynamics. Consequently, higher PC1 scores indicated soils with greater biological activity, nutrient retention capability, and nutrient availability, reflecting optimal soil fertility.
PC2 accounted for an additional 15.9% of variability, focusing on structural soil characteristics. It positively correlated with the geometric mean diameter (GMD) of soil aggregates and negatively with bulk density (BD). Thus, higher PC2 scores corresponded to soils exhibiting stable aggregates and reduced compaction, whereas lower scores indicated greater vulnerability to compaction. The structural interpretation was further supported by positive associations with GMD and F3 and negative associations with BD and acid phosphatase. Irrigated soils presented lower bulk density (1.13–1.16 g cm⁻³) and higher GMD (1.064 mm), compared to Rainfed soils, which showed higher BD values (up to 1.21 g cm⁻³ at the 10–20 cm depth) and lower GMD (0.686 mm). These differences were confirmed by measurements of mean geometric diameter (GMD), averaging 1.06 ± 0.57 mm in irrigated soils versus 0.69 ± 0.39 mm in rainfed soils (p < 0.005, Figure 3). The boxplot (Figure 3) illustrates the clear differentiation in soil aggregation between the irrigated and rainfed systems, emphasizing the positive influence of irrigation and pig slurry fertigation practices on enhancing soil structure stability.
3.2. Spore Density and Phosphorus Availability
Overall, the PCA effectively distinguished the management systems, revealing superior biological activity, nutrient dynamics, and soil structural quality in irrigated systems, especially at shallower depths. Soil samples from deeper layers (20–30 cm) typically demonstrated reduced nutrient cycling and availability (lower PC1 scores) and decreased structural stability (lower PC2 scores), highlighting the necessity of appropriate soil management practices to sustain soil health across various soil depths.
3.3. Correlation Matrix and Glomalin Fractions
Figure 4 presents heatmaps illustrating the Spearman correlation coefficients among soil parameters in rainfed (4A) and irrigated (B) systems. The analyzed parameters include T-GRSP, EE-GRSP, SQI, enzymatic activity (F1), nutrient storage (F2), and nutrient supply (F3). In the rainfed system (Figure A), SQI shows strong correlations with F1 (0.798), F2 (0.911), and F3 (0.886), indicating that soil quality is primarily influenced by nutrient storage and nutrient supply rather than enzymatic activity under dry conditions. The highest correlation with F2 suggests that soil organic matter and cation exchange capacity are key factors in maintaining soil health in this system. EE-GRSP exhibits a weak correlation with F1 (0.284, not significant), indicating that it does not strongly influence microbial enzymatic activity under limited moisture. Additionally, T-GRSP and EE-GRSP show a weak negative correlation (-0.139), implying that these two fractions function independently in rainfed soils. However, T-GRSP maintains moderate correlations with F2 (0.447) and F3 (0.398), suggesting its role in long-term carbon sequestration and nutrient retention.
In the irrigated system (Figure 4B), SQI remains strongly correlated with F1 (0.872), F2 (0.899), and F3 (0.922), but enzymatic activity (F1) plays a more dominant role in soil quality compared to the rainfed system. EE-GRSP shows a stronger correlation with F1 (0.674), indicating that under higher moisture availability, it contributes more actively to microbial processes. Unlike in the rainfed system, T-GRSP and EE-GRSP exhibit a positive correlation (0.269), suggesting that these two fractions interact more under irrigated conditions. Furthermore, T-GRSP also shows stronger correlations with F2 (0.583) and F3 (0.639), reinforcing its contribution to organic matter stability and nutrient retention in moisture-rich soils.
3.4. Enzymatic Activity
Enzymatic activities of β-glucosidase and acid phosphatase were measured at depths of 0–10, 10–20, and 20–30 cm in both management systems. As illustrated in Figure 5, a Kruskal-Wallis test with Bonferroni adjustment showed no significant differences in β-glucosidase activity between Irrigated and Rainfed soils (p > 0.05). In contrast, acid phosphatase activity was significantly higher (p < 0.05) in the Irrigated soils. In both systems, the activities of both enzymes declined with increasing soil depth.
The data in Figures 6A and 6B and the accompanying table clearly show that spore density is substantially higher in the irrigated system, particularly in the 0–10 cm layer, where the mean spore count is 104 spores per 50 g of soil (minimum 55, maximum 149). Spore density decreases with depth in irrigated soils—averaging 71 spores in the 10–20 cm layer and 33 spores in the 20–30 cm layer. By contrast, in the rainfed system, spore density is both lower and more uniform: the 0–10 cm layer has a mean of 31 spores per 50 g (range 20–50), which drops slightly to 25 (range 12–48) and 24 (range 14–38) in the 10–20 cm and 20–30 cm layers, respectively.
Turning to phosphorus availability measured by the Mehlich-1 extractant (Figures 6C and 6D), we again observe a pronounced difference between irrigated and rainfed soils. In the irrigated system’s topsoil (0–10 cm), P concentrations average 67 mg dm⁻³ (ranging from 39.40 to 109.40). At deeper layers, the mean P drops to 17.20 mg dm⁻³ (range 9.30–35.40) in the 10–20 cm depth, and 4.59 mg dm⁻³ (range 3.00–8.10) in the 20–30 cm depth. By contrast, the rainfed system’s topsoil has a mean P of 42.16 mg dm⁻³ (range 11.58–88.50), decreasing to 10.72 mg dm⁻³ (range 2.40–28.30) in the 10–20 cm layer, and 2.64 mg dm⁻³ (range 1.60–5.10) in the 20–30 cm layer.
3.5. Relationships between GRSP and Soil Quality Index (SQIFERTBio)
Regression analysis identified both total glomalin (T-GRSP) and easily extractable glomalin (EE-GRSP) as significant predictors of soil quality in both management systems (p < 0.001; Table 1). In the Irrigated system, acid phosphatase (p = 0.002) and spore abundance (p = 0.045) also contributed significantly to SQI, whereas in the Rainfed system, neither bulk density nor acid phosphatase showed a statistically significant impact (Table 1). Figure 7 depicts scatterplots for each glomalin fraction against SQI, while Figure 8 compares SQI values predicted by regression with those observed in the field. The Irrigated system demonstrated higher predictive accuracy (R² = 0.75) than the Rainfed system (R² = 0.46).
For the Irrigated system, T-GRSP (β = 0.239, t = 3.906, p < 0.001), EE-GRSP (β = 0.177, t = 3.409, p = 0.002), and acid phosphatase (β = 0.000, t = 3.331, p = 0.002) had significant positive effects on SQI (Table 1). Spore abundance was also statistically significant (β = 0.001, t = 2.076, p = 0.044), albeit with a smaller effect size. In contrast, bulk density (β = 0.039, t = 0.169, p = 0.867) and geometric mean diameter (β = 0.013, t = 0.169, p = 0.867) were not significant (Table 1). In the Rainfed system, T-GRSP (β = 0.162, t = 5.550, p < 0.001) and EE-GRSP (β = 0.501, t = 5.046, p < 0.001) significantly influenced SQI. Although bulk density showed a negative but nonsignificant trend (β = -0.370, t = -1.830, p = 0.075), acid phosphatase (t = 1.778, p = 0.085), spore abundance (t = 1.334, p = 0.191), and GMD (β = 0.013, t = 0.281, p = 0.780) also remained nonsignificant (Table 1), underscoring that glomalin-related proteins were the main drivers of soil quality in this system.
To further assess how glomalin fractions contribute to SQI, separate linear regressions were performed (Figures 7A and 7B). In the Irrigated system, T-GRSP alone accounted for 50.1% of SQI variability (R² = 0.501, p < 0.001), whereas EE-GRSP explained 49.5% (R² = 0.495, p < 0.001). In the Rainfed system, T-GRSP showed a comparatively lower explanatory power (R² = 0.287, p < 0.001), while EE-GRSP was higher at 42.4% (R² = 0.424, p < 0.001). This outcome indicates that EE-GRSP may serve as a particularly sensitive early indicator of soil quality changes under varying moisture conditions.
Finally, predicted SQI values were validated against observed SQI measurements (Figure 8). In the Irrigated system, a robust correlation (R² = 0.75, p < 0.001) between predicted and observed values pointed to high model reliability, likely linked to greater soil stability. In contrast, the Rainfed system showed a more moderate correlation (R² = 0.46, p < 0.001), suggesting that additional factors—such as climate variability and uneven soil properties—may influence soil quality in non-irrigated environments.
3.6. Soil Protein Related to Glomalin and Its Contribution to Total Soil Carbon
As summarized in Table 2, In the irrigated system, total glomalin (T-GRSP) reached its highest level in the 0–10 cm layer (2.07 mg g⁻¹) and was lower (1.64 mg g⁻¹) in the 10–20 and 20–30 cm layers. Overall, mean T-GRSP was greater under irrigation than under rainfed conditions, where T-GRSP values fell from 1.60 mg g⁻¹ at 0–10 cm to 0.44 mg g⁻¹ at 20–30 cm. The carbon fraction in total glomalin (C_T-GRSP) followed a similar pattern, with higher values in the irrigated system, and its percentage in total soil carbon (C_T-GRSP/CS) increased with depth under irrigation, while under rainfed conditions it was highest at 10–20 cm and lowest at 20–30 cm. Easily extractable glomalin (EE-GRSP) showed comparable concentrations in both systems at 0–10 cm, with a downward trend in deeper layers. Its carbon fraction (C_EE-GRSP) did not differ significantly between irrigated and rainfed systems, though the proportion of EE-GRSP carbon in total soil carbon (C_EE-GRSP/CS) was higher on average under rainfed conditions.
3.7. Microbial Diversity and Community Composition
Since GRSP production is largely mediated by soil microbial activity, understanding the composition and diversity of bacterial and fungal communities under different land-use systems is crucial for evaluating their role in soil carbon stabilization and nutrient cycling.
Microbial diversity metrics provide critical insights into the structural and functional stability of soil microbial communities under different land-use systems. The irrigated system exhibited the highest bacterial diversity, with a Simpson’s index (1-D) of 0.9455 and Shannon index (H) of 3.44, indicating a more evenly distributed bacterial community compared to the Protected Area and Rainfed systems (Table 3). Conversely, the Protected Area had the highest fungal diversity, with 277 fungal taxa recorded, followed by 317 taxa in the Irrigated system and a significant reduction to 201 taxa in the Rainfed system.
The higher bacterial richness (Taxa S = 61) in the Irrigated soil suggests that long-term fertigation with swine manure has enhanced bacterial diversity, likely due to increased organic matter availability and nutrient input. However, bacterial abundance was lowest in the Irrigated soil (3,841 individuals), indicating a possible shift in microbial functional dynamics, where a more diverse but less dominant bacterial community coexists in a nutrient-enriched environment. These findings align with previous research indicating that intensive organic fertilization can increase bacterial diversity while reducing dominance by specific taxa (Dasgupta et al., 2023).
In contrast, the fungal community exhibited the highest dominance (D = 0.397) and lowest diversity (H’ = 2.11) in the Protected Area, suggesting that a few fungal taxa dominate under less disturbed conditions. The Irrigated soil showed a significant increase in fungal diversity (H’ = 2.80) and the lowest dominance (D = 0.2208), indicating a more functionally diverse fungal community. The Rainfed soil exhibited intermediate fungal diversity (H’ = 2.46) but reduced fungal richness (Taxa S = 201), reinforcing the negative impact of moisture limitation on fungal community complexity.
The evenness index (e^H/S) further highlights the structural differences in microbial communities across land-use types. The bacterial community in the Irrigated system had the highest evenness (0.5113), while the fungal community in the Protected Area had the lowest evenness (0.02971), indicating a highly imbalanced fungal composition in undisturbed soils. This pattern suggests that land management influences not only microbial richness but also community equilibrium, with irrigation promoting a more even distribution of bacterial taxa while also facilitating a more diverse fungal community.
3.8. Influence of Land Use on Soil Microbial Community Structure
3.8.1. Bacterial Community Structure
Figure 9 displays the relative abundance of bacterial species exceeding 1% across the three land-use types. In the Protected Area, bacterial diversity was the highest, with a balanced representation of taxa. Dominant species such as Faecalibacterium prausnitzii, Romboutsia sedimentorum, and Bacteroides massiliensis were particularly prevalent.
In contrast, the Rainfed system supported a distinct bacterial community that was dominated by Bacteroides uniformis and Romboutsia sedimentorum, indicating adaptation to lower moisture availability and potential nutrient limitations. Furthermore, the Irrigated system exhibited the highest bacterial evenness, indicating that despite a lower total bacterial abundance compared to the Rainfed soils, the community structure was more balanced.
3.8.2. Fungal Community Structure and the Absence of AMF
Figure 10 presents the relative abundance of fungal species exceeding 1% across the land-use types. The Protected Area exhibited the highest fungal diversity, while the Irrigated system showed intermediate diversity, and the Rainfed system had the lowest fungal richness and evenness. In the Irrigated soils, there was a marked increase in the relative abundance of phytopathogenic fungi, notably Fusarium oxysporum and Fusarium equiseti. Additionally, Trichoderma species were more abundant in these soils, suggesting a compensatory response to high organic matter inputs. Despite these differences, no sequences corresponding to arbuscular mycorrhizal fungi (AMF; phylum Glomeromycota) were detected in any of the soils. This finding is particularly striking given that high levels of glomalin-related soil protein (GRSP) were measured in the Irrigated system, indicating a discrepancy between biochemical markers and DNA-based detection methods.
4. Discussion
A comparison between the two systems highlights key differences in the factors influencing soil quality. In the rainfed system, SQI is more strongly associated with nutrient storage (F2) and nutrient supply (F3), while enzymatic activity (F1) plays a lesser role. This suggests that, under drier conditions, soil organic matter (SOM) and nutrient retention capacity are more critical for maintaining soil health than microbial activity, supporting findings from previous studies on soil functionality in rainfed systems. In contrast, in the irrigated system, microbial processes become more relevant, as evidenced by the stronger correlation between EE-GRSP (easily extractable glomalin-related soil protein) and enzymatic activity (F1), reinforcing the idea that soil microbial communities respond positively to increased moisture availability [28].
Another key distinction is the relationship between T-GRSP (total glomalin-related soil protein) and EE-GRSP. In the rainfed system, these fractions show a weak negative correlation (–0.139), suggesting that they operate independently under drier conditions—possibly due to differences in stability and turnover rates of glomalin fractions under moisture-limited conditions [29]. Although long turnover times of total glomalin have been reported [30], the concentration of easily extractable glomalin appears quite vulnerable to environmental changes and agricultural management practices [9]. However, in the irrigated system, they exhibit a positive correlation (0.269), implying a more interconnected role, potentially due to increased microbial activity influencing glomalin production and stabilization, as observed in previous research on fungal dynamics in humid environments [31]. These findings suggest that moisture availability plays a crucial role in determining how these glomalin-related fractions contribute to soil structure and nutrient cycling [32]
Our findings highlight the critical roles of water availability, organic amendments, and minimal soil disturbance in enhancing soil structure, nutrient cycling, and microbial function. In the irrigated system, sustained water supply and long-term pig slurry fertigation maintained stable bulk density and promoted the formation of larger, biogenic aggregates, as evidenced by higher geometric mean diameter (GMD) and mean geometric diameter (MGD) values [33,34]. Although larger aggregates generally confer improved water stability, the observed negative correlation between MGD and total glomalin (T-GRSP) (r = –0.349, p < 0.001) suggests that glomalin accumulation may not directly scale with aggregate size [35].
The enzyme assays further emphasize the influence of organic inputs and moisture. The similar β-glucosidase activities between irrigated and rainfed soils indicate that substrate availability might be more critical than moisture regime for cellulose degradation [36]. In contrast, the significantly higher acid phosphatase activity in irrigated soils likely reflects increased organic phosphorus inputs from pig slurry and a larger microbial biomass [37]. These enzyme activities declined with depth, consistent with previous findings showing that organic matter and microbial populations are more concentrated in the topsoil [38].
Our results also indicate that the higher spore density in irrigated soils favors fungal reproduction under stable moisture conditions [39]. However, high phosphorus availability in these soils may suppress AMF colonization [40], which could explain the absence of detectable AMF sequences despite the presence of elevated glomalin levels. This discrepancy can be attributed to legacy effects, wherein glomalin-related soil proteins (GRSP) persist in the soil long after active AMF colonization has declined [41]. In addition, standard ITS-based metabarcoding methods may exhibit biases against AMF detection due to primer mismatches and the typically low relative abundance of AMF DNA, thus further contributing to the underrepresentation of these fungi in molecular surveys [42,43].
Furthermore, competitive interactions within the soil microbial community may exacerbate the suppression of AMF. Saprophytic and pathogenic fungi such as those from the Fusarium and Trichoderma genera can outcompete AMF in high-phosphorus environments. Their rapid growth and efficient resource utilization can lead to a scenario where these fungi dominate, further limiting AMF colonization [44,45].
The combination of these factors—high phosphorus input, legacy effects of GRSP, methodological constraints, and competitive exclusion—provides a multifaceted explanation for the apparent discrepancy between GRSP levels and AMF DNA detection. Previous studies have also noted that GRSP can serve as a long-lasting indicator of past AMF activity, remaining stable in soil aggregates even when active colonization is low [11,46].
Finally, glomalin-related soil proteins (both T-GRSP and easily extractable EE-GRSP) emerged as robust predictors of soil quality, as evidenced by their strong correlations with the Soil Quality Index (SQI) in both management systems [47,48]. In irrigated soils, the combination of glomalin fractions with acid phosphatase activity and spore abundance explained a significant portion of SQI variability. In contrast, in rainfed soils, the GRSP fractions were the primary drivers of soil quality, suggesting that EE-GRSP may serve as an early-warning indicator of soil degradation under water-limited conditions.
Furthermore, microbial diversity analyses reveal that irrigation and organic amendments promote a more balanced bacterial community and enhance fungal diversity compared to rainfed soils, even though the latter exhibit adaptations characteristic of drought conditions [5,6]. The integration of enzyme assays with e-DNA–based microbial profiling provides a comprehensive view of soil health, offering insights into the complex interactions between soil biochemical properties and microbial community dynamics.
The results reveal marked differences in microbial community structure among the three land-use types, with significant implications for soil functioning and nutrient cycling. The Protected Area, with its high bacterial and fungal diversity, reflects the stability of undisturbed soils. In contrast, the Rainfed system shows a community dominated by taxa adapted to drier conditions, while the Irrigated system exhibits a more even bacterial community likely driven by consistent moisture and regular organic amendments.
A particularly intriguing observation is the absence of detectable AMF sequences across all sites despite the presence of high GRSP levels in the Irrigated soils. One plausible explanation is that high phosphorus availability—which is typical in soils receiving pig slurry fertigation—may suppress AMF colonization by reducing the plant’s reliance on mycorrhizal symbiosis [49]. In such environments, the legacy effect may allow GRSP to persist long after active AMF populations decline [41]. Methodological limitations also likely contribute; standard ITS primers often underrepresent AMF due to primer bias, incomplete reference databases, and the naturally lower abundance of AMF DNA in complex soil communities [42,43].
Overall, our study demonstrates that combining glomalin measurements with enzyme activity and genomic approaches yields a robust framework for evaluating soil quality. Future research should focus on targeted AMF detection techniques, optimizing manure application rates to prevent phosphorus oversupply, and further exploring the long-term persistence of glomalin in relation to soil structure. Such integrated approaches will be crucial for advancing sustainable land management practices and improving carbon sequestration strategies in agricultural systems.
5. Future Perspectives
Although the present study has already been completed, future investigations could integrate Glomeromycota-specific primers and trap cultures to obtain a more comprehensive evaluation of AMF presence, diversity, and functionality in managed soils. Such approaches—potentially combined with morphological spore identification—may reveal ecological roles and symbiotic dynamics of AMF that standard ITS-based protocols often overlook, particularly in environments with high phosphorus or complex microbial interactions. By refining AMF detection in this way, researchers can gain clearer insights into soil aggregation, nutrient cycling, and long-term carbon sequestration. Indeed, Seeliger et al. [50] recently demonstrated the effectiveness of specialized primers in enhancing AMF detection in agricultural soils.
6. Conclusion
Our findings confirm that glomalin-related soil proteins (T-GRSP and EE-GRSP) serve as reliable indicators of soil quality under both irrigated and rainfed systems. In irrigated soils receiving pig slurry fertigation, T-GRSP concentrations were 66% higher than in rainfed soils, accounting for up to 3.1% of total soil carbon and promoting improved aggregate formation. While rainfed soils showed lower overall microbial activity due to limited water availability, significant correlations between glomalin fractions and soil quality still emerged, underscoring EE-GRSP as a potential early-warning indicator in moisture-stressed conditions. The absence of detectable AMF sequences—despite high glomalin levels—suggests a legacy effect of prior mycorrhizal activity, methodological constraints, or competitive exclusion by saprophytic and pathogenic fungi. Overall, the integration of organic amendments, appropriate irrigation strategies, and diversified crop rotations is fundamental for sustaining soil structure and microbial function. Moreover, incorporating glomalin quantification into routine soil assessments offers a promising pathway for enhancing carbon sequestration and ensuring long-term soil resilience in sustainable agroecosystems.
Author Contributions
Conceptualization, Josiquele Gomes de Miranda and Eduardo Guimarães Couto.; methodology, Marcos Antônio Soares.; software, Josiquele Gomes de Miranda.; validation, Oscarlina Lúcia dos Santos Weber and Ricardo Takao Tanaka.; formal analysis, Eduardo Guimarães.; investigation, James Moraes de Moura.; resources, Marcos Antônio Soares.; data curation, Eduardo Guimarães.; writing—original draft preparation, Josiquele Gomes de Miranda.; writing—review and editing, Eduardo Guimarães Couto, Josiquele Gomes de Miranda and Oscarlina Lúcia dos Santos Weber.; visualization, Josiquele Gomes de Miranda.; supervision, Eduardo Guimarães Couto.; project administration, Gilmar Nunes Torres.; funding acquisition, Eduardo Guimarães Couto and Oscarlina Lúcia dos Santos Weber. All authors have read and agreed to the published version of the manuscript.
Funding
This research was funded by Mato Grosso State Research Support Foundation, grant number 004/2021 and “The APC was funded by Mato Grosso State Research Support Foundation”. The funders had no role in study design, data collection and analysis, decision to publish, or preparation of the manuscript.
Data Availability Statement
All datasets are included in the manuscript, and additional datasets are available upon reasonable request.
Acknowledgments
We thank James Moraes de Moura for formating the English text of this manuscript.
Conflicts of Interest
The authors declare that they have no known competing financial interests or personal relationships that could have appeared to influence the research reported in this paper.
References
- Doran, J.W.; Parkin, T.B. Defining and assessing soil quality. Defining soil quality for a sustainable environment. Proc. symposium, Minneapolis, MN, 1992 1994, 3-21.
- Karlen, D.L.; Veum, K.S.; Sudduth, K.A.; Obrycki, J.F.; Nunes, M.R. Soil Health Assessment: Past Accomplishments, Current Activities, and Future Opportunities. Soil Tillage Res. 2019, 195, 104365. [Google Scholar] [CrossRef]
- Bardgett, R.D.; Freeman, C.; Ostle, N.J. Microbial contributions to climate change through carbon cycle feedbacks. The ISME Journal 2008, 2, 805–814. [Google Scholar] [CrossRef] [PubMed]
- Curtright, A.J.; Tiemann, L.K. Meta-analysis dataset of soil extracellular enzyme activities in intercropping systems. Data Brief 2021, 38, 107284. [Google Scholar] [CrossRef]
- Nkongolo, K.K.; Narendrula-Kotha, R. Advances in monitoring soil microbial community dynamic and function. Journal of Applied Genetics 2020, 61, 249–263. [Google Scholar] [CrossRef]
- Pawlowski, J.; Apothéloz-Perret-Gentil, L.; Altermatt, F. Environmental DNA: What's behind the term? Clarifying the terminology and recommendations for its future use in biomonitoring. Mol. Ecol. 2020, 29, 4258–4264. [Google Scholar] [CrossRef]
- Wright, S.F.; Upadhyaya, A. EXTRACTION OF AN ABUNDANT AND UNUSUAL PROTEIN FROM SOIL AND COMPARISON WITH HYPHAL PROTEIN OF ARBUSCULAR MYCORRHIZAL FUNGI. Soil Science 1996, 161. [Google Scholar] [CrossRef]
- Zhu, R.; Zheng, Z.; Li, T.; He, S.; Zhang, X.; Wang, Y.; Liu, T. Effect of tea plantation age on the distribution of glomalin-related soil protein in soil water-stable aggregates in southwestern China. Environmental Science and Pollution Research 2019, 26, 1973–1982. [Google Scholar] [CrossRef]
- Wang, W.; Zhong, Z.; Wang, Q.; Wang, H.; Fu, Y.; He, X. Glomalin contributed more to carbon, nutrients in deeper soils, and differently associated with climates and soil properties in vertical profiles. Scientific Reports 2017, 7, 13003. [Google Scholar] [CrossRef]
- Singh, A.K.; Chen, C.; Zhu, X.; Yang, B.; Khan, M.N.; Zakari, S.; Jiang, X.J.; del Mar Alguacil, M.; Liu, W. Unraveling the impact of global change on glomalin and implications for soil carbon storage in terrestrial ecosystems. Resources, Environment and Sustainability 2024, 18, 100174. [Google Scholar] [CrossRef]
- Purin, S.; Rillig, M.C. The arbuscular mycorrhizal fungal protein glomalin: Limitations, progress, and a new hypothesis for its function. Pedobiologia 2007, 51, 123–130. [Google Scholar] [CrossRef]
- Fokom, R.; Teugwa Mofor, C.; Nana Wakam, L.; Ngonkeu Megapche, E.L.; Tchameni, S.; Nwaga, D.; Rillig, C.M.; Amvam Zollo, P.H. Glomalin, carbon, nitrogen and soil aggregate stability as affected by land use changes in the humid forest zone in South Cameroon. Applied Ecology and Environmental Research 2013, 11, 581–592. [Google Scholar] [CrossRef]
- Santos, H.G.; Jacomine, P.K.T.; Dos Anjos, L.H.C.; De Oliveira, V.A.; Lumbreras, J.F.; Coelho, M.R.; De Almeida, J.A.; de Araujo Filho, J.C.; De Oliveira, J.B.; Cunha, T.J.F. Sistema brasileiro de classificação de solos; Embrapa: Brasília, DF, 2018. [Google Scholar]
- Caporaso, J.G.; Lauber, C.L.; Walters, W.A.; Berg-Lyons, D.; Huntley, J.; Fierer, N.; Owens, S.M.; Betley, J.; Fraser, L.; Bauer, M.; et al. Ultra-high-throughput microbial community analysis on the Illumina HiSeq and MiSeq platforms. The ISME Journal 2012, 6, 1621–1624. [Google Scholar] [CrossRef] [PubMed]
- Parada, A.E.; Needham, D.M.; Fuhrman, J.A. Every base matters: assessing small subunit rRNA primers for marine microbiomes with mock communities, time series and global field samples. Environmental Microbiology 2016, 18, 1403–1414. [Google Scholar] [CrossRef]
- Gardes, M.; Bruns, T.D. ITS primers with enhanced specificity for basidiomycetes - application to the identification of mycorrhizae and rusts. Mol. Ecol. 1993, 2, 113–118. [Google Scholar] [CrossRef]
- Smith, D.P.; Peay, K.G. Sequence Depth, Not PCR Replication, Improves Ecological Inference from Next Generation DNA Sequencing. PLOS ONE 2014, 9, e90234. [Google Scholar] [CrossRef]
- Reyna, D.L.; Wall, L.G. Revision of two colorimetric methods to quantify glomalin-related compounds in soils subjected to different managements. Biology and Fertility of Soils 2014, 50, 395–400. [Google Scholar] [CrossRef]
- Bradford, M.M. A rapid and sensitive method for the quantitation of microgram quantities of protein utilizing the principle of protein-dye binding. Analytical Biochemistry 1976, 72, 248–254. [Google Scholar] [CrossRef]
- Silveira, A.P.D.; Abreu, M.F.; Cantarella, H.; Zambrosi, F.C.B. Determinação da atividade de enzimas em solos Available online: Disponível em . Acessado em: 7 julh de 2022 (accessed on.
- Gerdemann, J.; Nicolson, T. Spores of mycorrhizal Endogone species extracted from soil by wet sieving & decanting. Transactions of the British Mycological Society 1963, 46, 235–244. [Google Scholar] [CrossRef]
- Jenkins, W. A rapid centrifugal-flotation technique for separating nematodes from soil. Plant Disease Reporter 1964, 48, 692. [Google Scholar]
- Salton, J.C.; Mielniczuk, J.; Bayer, C.; Boeni, M.; Conceição, P.C.; Fabrício, A.C.; Macedo, M.C.M.; Broch, D.L. Agregação e estabilidade de agregados do solo em sistemas agropecuários em Mato Grosso do Sul. Revista Brasileira de Ciência do Solo 2008, 32. [Google Scholar] [CrossRef]
- Salton, J.C.; Silva, W.M.; Tomazi, M.; Hernani, L.C. Determinação da agregação do solo-metodologia em uso na Embrapa Agropecuária Oeste. 2012.
- Kemper, W.D.; Rosenau, R.C. Aggregate Stability and Size Dlstributlon. Methods 339 soil Anal. Part 1 Phys. Mineral. Methods 1986, 340. [Google Scholar]
- Mendes, I.C.; Martinhão Gomes Sousa, D.; Dario Dantas, O.; Alves Castro Lopes, A.; Bueno Reis Junior, F.; Ines Oliveira, M.; Montandon Chaer, G. Soil quality and grain yield: A win–win combination in clayey tropical oxisols. Geoderma 2021, 388, 114880. [Google Scholar] [CrossRef]
- Rillig, M.C.; Ramsey, P.W.; Morris, S.; Paul, E.A. Glomalin, an arbuscular-mycorrhizal fungal soil protein, responds to land-use change. Plant and Soil 2003, 253, 293–299. [Google Scholar] [CrossRef]
- Li, X.; Feng, G.; Tewolde, H.; Adeli, A.; Jenkins, J.N. Critical soil organic carbon for improving available water content of silt loam soils. Soil Use and Management 2024, 40. [Google Scholar] [CrossRef]
- Singh, A.K.; Zhu, X.; Chen, C.; Wu, J.; Yang, B.; Zakari, S.; Jiang, X.J.; Singh, N.; Liu, W. The role of glomalin in mitigation of multiple soil degradation problems. Critical Reviews in Environmental Science and Technology 2022, 52, 1604–1638. [Google Scholar] [CrossRef]
- Rillig, M.C.; Ramsey, P.W.; Morris, S.; Paul, E.A. Glomalin, an arbuscular-mycorrhizal fungal soil protein, responds to land-use change. Plant and Soil 2003, 253, 293–299. [Google Scholar] [CrossRef]
- Akter, S.; Mahmud, U.; Shoumik, B.A.A.; Khan, M.Z. Although invisible, fungi are recognized as the engines of a microbial powerhouse that drives soil ecosystem services. Archives of Microbiology 2025, 207, 79. [Google Scholar] [CrossRef]
- Rillig, M.C.; Wright, S.F.; Eviner, V.T. The role of arbuscular mycorrhizal fungi and glomalin in soil aggregation: comparing effects of five plant species. Plant and Soil 2002, 238, 325–333. [Google Scholar] [CrossRef]
- Silva Neto, E.C.; Pereira, M.G.; Fernandes, J.C.F.; Neto, T.d.A.C. Aggregate formation and soil organic matter under different vegetation types in Atlantic Forest from Southeastern Brazil. Semina: Ciências Agrárias 2016, 37, 3927–3939. [Google Scholar]
- Pereira, M.G.; Loss, A.; Batista, I.; Melo, T.R.d.; Silva Neto, E.C.d.; Pinto, L.A.d.S.R. Biogenic and physicogenic aggregates: formation pathways, assessment techniques, and influence on soil properties. Revista Brasileira de Ciência do Solo 2021, 45. [Google Scholar] [CrossRef]
- Loss, A.; Ventura, B.S.; Müller, V.; Gonzatto, R.; Zin Battisti, L.F.; Gonçalves Lintemani, M.; Eduarda da Costa Erthal, M.; Fagan Vidal, R.; Scopel, G.; Lourenzi, C.R.; et al. Carbon, nitrogen, and aggregation index in Ultisol with 11 years of application of animal manures and mineral fertilizer. Journal of Soil and Water Conservation 2021, 76, 547–557. [Google Scholar] [CrossRef]
- Adetunji, A.T.; Lewu, F.B.; Mulidzi, R.; Ncube, B. The biological activities of β-glucosidase, phosphatase and urease as soil quality indicators: a review. Journal of soil science and plant nutrition 2017, 17, 794–807. [Google Scholar] [CrossRef]
- Nannipieri, P.; Trasar-Cepeda, C.; Dick, R.P. Soil enzyme activity: a brief history and biochemistry as a basis for appropriate interpretations and meta-analysis. Biology and Fertility of Soils 2017, 54, 11–19. [Google Scholar] [CrossRef]
- Wang, C.; Ning, P.; Li, J.; Wei, X.; Ge, T.; Cui, Y.; Deng, X.; Jiang, Y.; Shen, W. Responses of soil microbial community composition and enzyme activities to long-term organic amendments in a continuous tobacco cropping system. Applied Soil Ecology 2022, 169, 104210. [Google Scholar] [CrossRef]
- Martinez, T.N.; Johnson, N.C. Agricultural management influences propagule densities and functioning of arbuscular mycorrhizas in low- and high-input agroecosystems in arid environments. Applied Soil Ecology 2010, 46, 300–306. [Google Scholar] [CrossRef]
- Xu, J.; Liu, S.; Song, S.; Guo, H.; Tang, J.; Yong, J.W.H.; Ma, Y.; Chen, X. Arbuscular mycorrhizal fungi influence decomposition and the associated soil microbial community under different soil phosphorus availability. Soil Biology and Biochemistry 2018, 120, 181–190. [Google Scholar] [CrossRef]
- Aliasgharzad, N.; Malekzadeh, E. Glomalin and Carbon Sequestration in Terrestrial Ecosystems. In Arbuscular Mycorrhizal Fungi and Higher Plants: Fundamentals and Applications, Ahammed, G.J., Hajiboland, R., Eds.; Springer Nature Singapore: Singapore, 2024; pp. 239–258. [Google Scholar]
- Kryukov, A.A.; Gorbunova, A.O.; Machs, E.M.; Mikhaylova, Y.V.; Rodionov, A.V.; Zhurbenko, P.M.; Yurkov, A.P. Perspectives of using Illumina MiSeq for identification of arbuscular mycorrhizal fungi. Vavilovskii Zhurnal Genetiki i Selektsii 2020, 24, 158–167. [Google Scholar] [CrossRef]
- Bahram, M.; Hildebrand, F.; Forslund, S.K.; Anderson, J.L.; Soudzilovskaia, N.A.; Bodegom, P.M.; Bengtsson-Palme, J.; Anslan, S.; Coelho, L.P.; Harend, H.; et al. Structure and function of the global topsoil microbiome. Nature 2018, 560, 233–237. [Google Scholar] [CrossRef]
- Sosa, L.L.d.; Moreno, B.; Herrera, R.A.; Panettieri, M.; Madejón, E.; Benítez, E. Organic Amendments and Sampling Date Influences on Soil Bacterial Community Composition and Their Predictive Functional Profiles in an Olive Grove Ecosystem. Agriculture 2021, 11. [Google Scholar] [CrossRef]
- Hamaoui, G.S.; Rodrigues, J.L.M.; Bohannan, B.J.M.; Tiedje, J.M.; Nüsslein, K. Land-use change drives abundance and community structure alterations of thaumarchaeal ammonia oxidizers in tropical rainforest soils in Rondônia, Brazil. Applied Soil Ecology 2016, 107, 48–56. [Google Scholar] [CrossRef]
- Leite, M.F.A.; van den Broek, S.; Kuramae, E.E. Current Challenges and Pitfalls in Soil Metagenomics. Microorganisms 2022, 10. [Google Scholar] [CrossRef] [PubMed]
- Vasconcellos, R.L.F.; Bonfim, J.A.; Baretta, D.; Cardoso, E.J.B.N. Arbuscular Mycorrhizal Fungi and Glomalin-Related Soil Protein as Potential Indicators of Soil Quality in a Recuperation Gradient of the Atlantic Forest in Brazil. Land Degradation and Development 2016, 27, 325–334. [Google Scholar] [CrossRef]
- Gałązka, A.; Niedźwiecki, J.; Grządziel, J.; Gawryjołek, K. Evaluation of changes in Glomalin-Related Soil Proteins (GRSP) content, microbial diversity and physical properties depending on the type of soil as the important biotic determinants of soil quality. Agronomy 2020, 10. [Google Scholar] [CrossRef]
- Zheng, C.; Zhang, J.; Li, X. Phosphorus supply level affects the regulation of phosphorus uptake by different arbuscular mycorrhizal fungal species in a highly P-efficient backcross maize line. Crop and Pasture Science 2013, 64, 881–891. [Google Scholar] [CrossRef]
- Seeliger, M.; Hilton, S.; Muscatt, G.; Walker, C.; Bass, D.; Albornoz, F.; Standish, R.J.; Gray, N.D.; Mercy, L.; Rempelos, L.; et al. New fungal primers reveal the diversity of Mucoromycotinian arbuscular mycorrhizal fungi and their response to nitrogen application. Environ Microbiome 2024, 19, 71. [Google Scholar] [CrossRef]
Figure 1.
Geographic location of the experimental areas (Permanent Preservation Area, Rainfed Irrigated).
Figure 1.
Geographic location of the experimental areas (Permanent Preservation Area, Rainfed Irrigated).
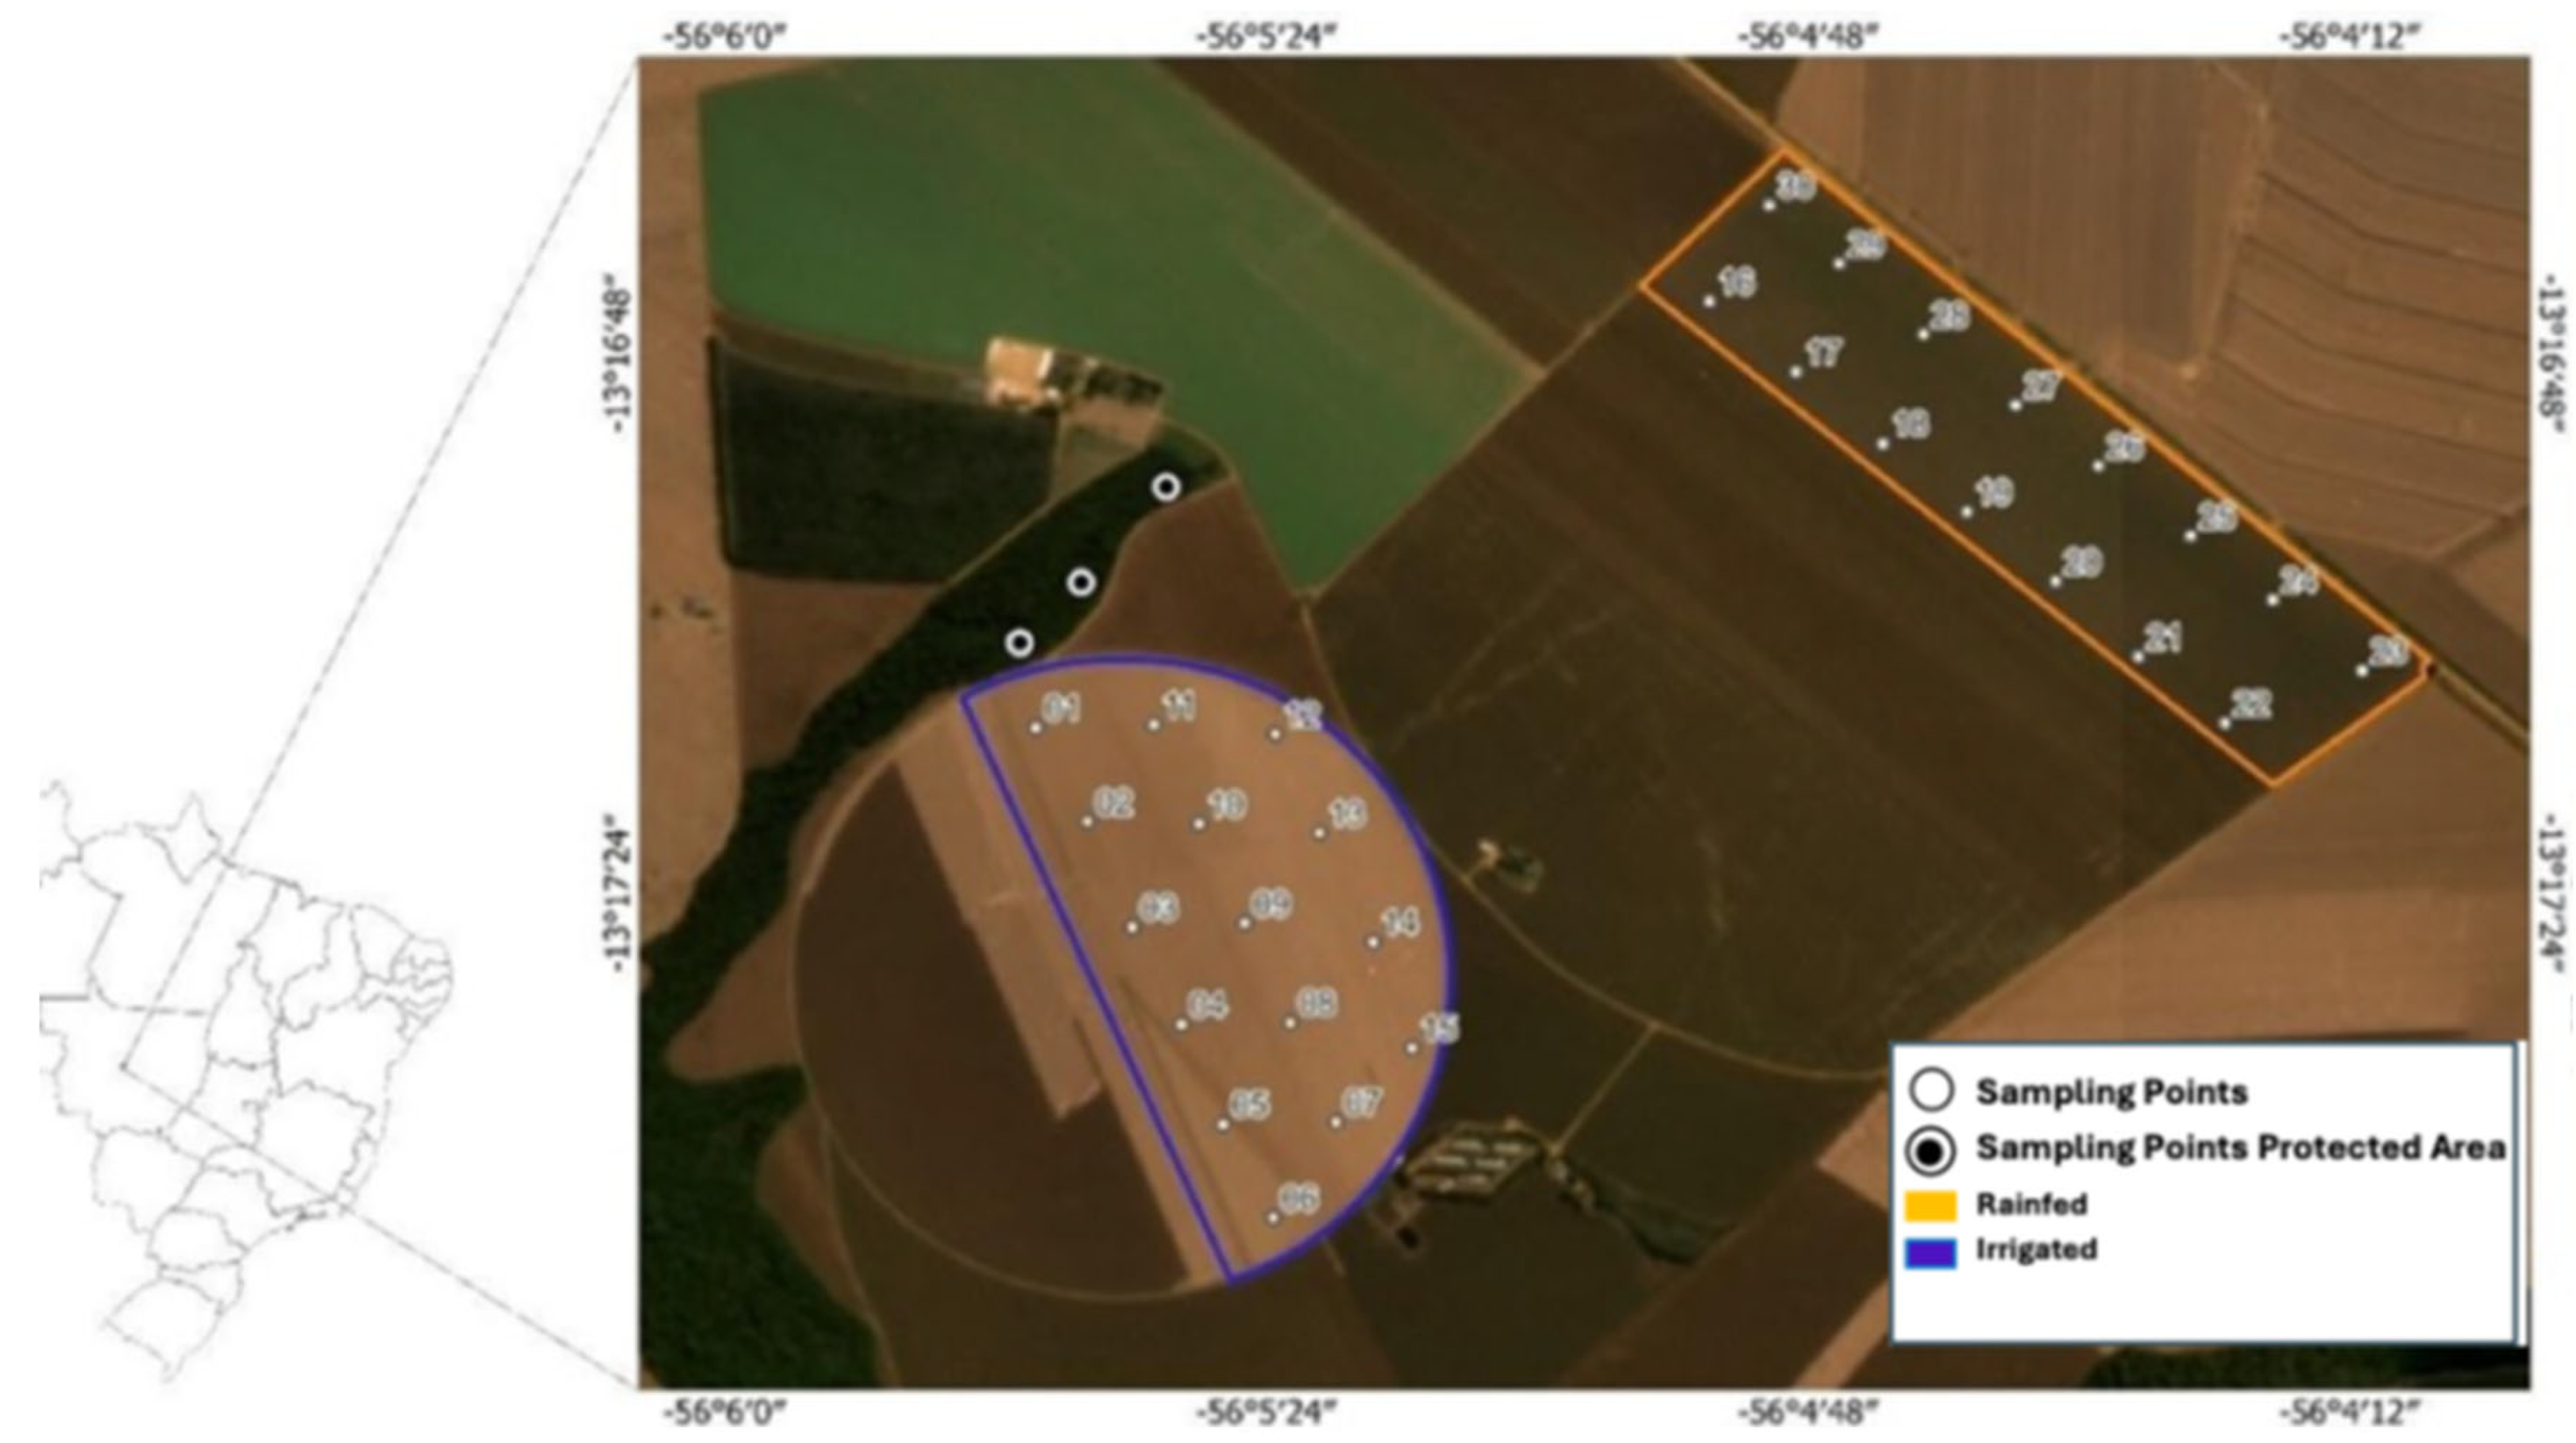
Figure 2.
Biplot PCA graph representing variables in two principal components for chemical, physical, and biological attributes measured at three depths (0–10 cm, 10–20 cm, and 20–30 cm) under two management systems (Irrigated and Rainfed). GMD: Geometric Mean Diameter of the aggregates; BD: Bulk density; acid phosphatase; Spores: spore density; EE-GRSP: easily extractable glomalin; T-GRSP: total glomalin; F1: Nutrient Cycling; F2: Nutrient Storage and F3: Nutrient Supply.
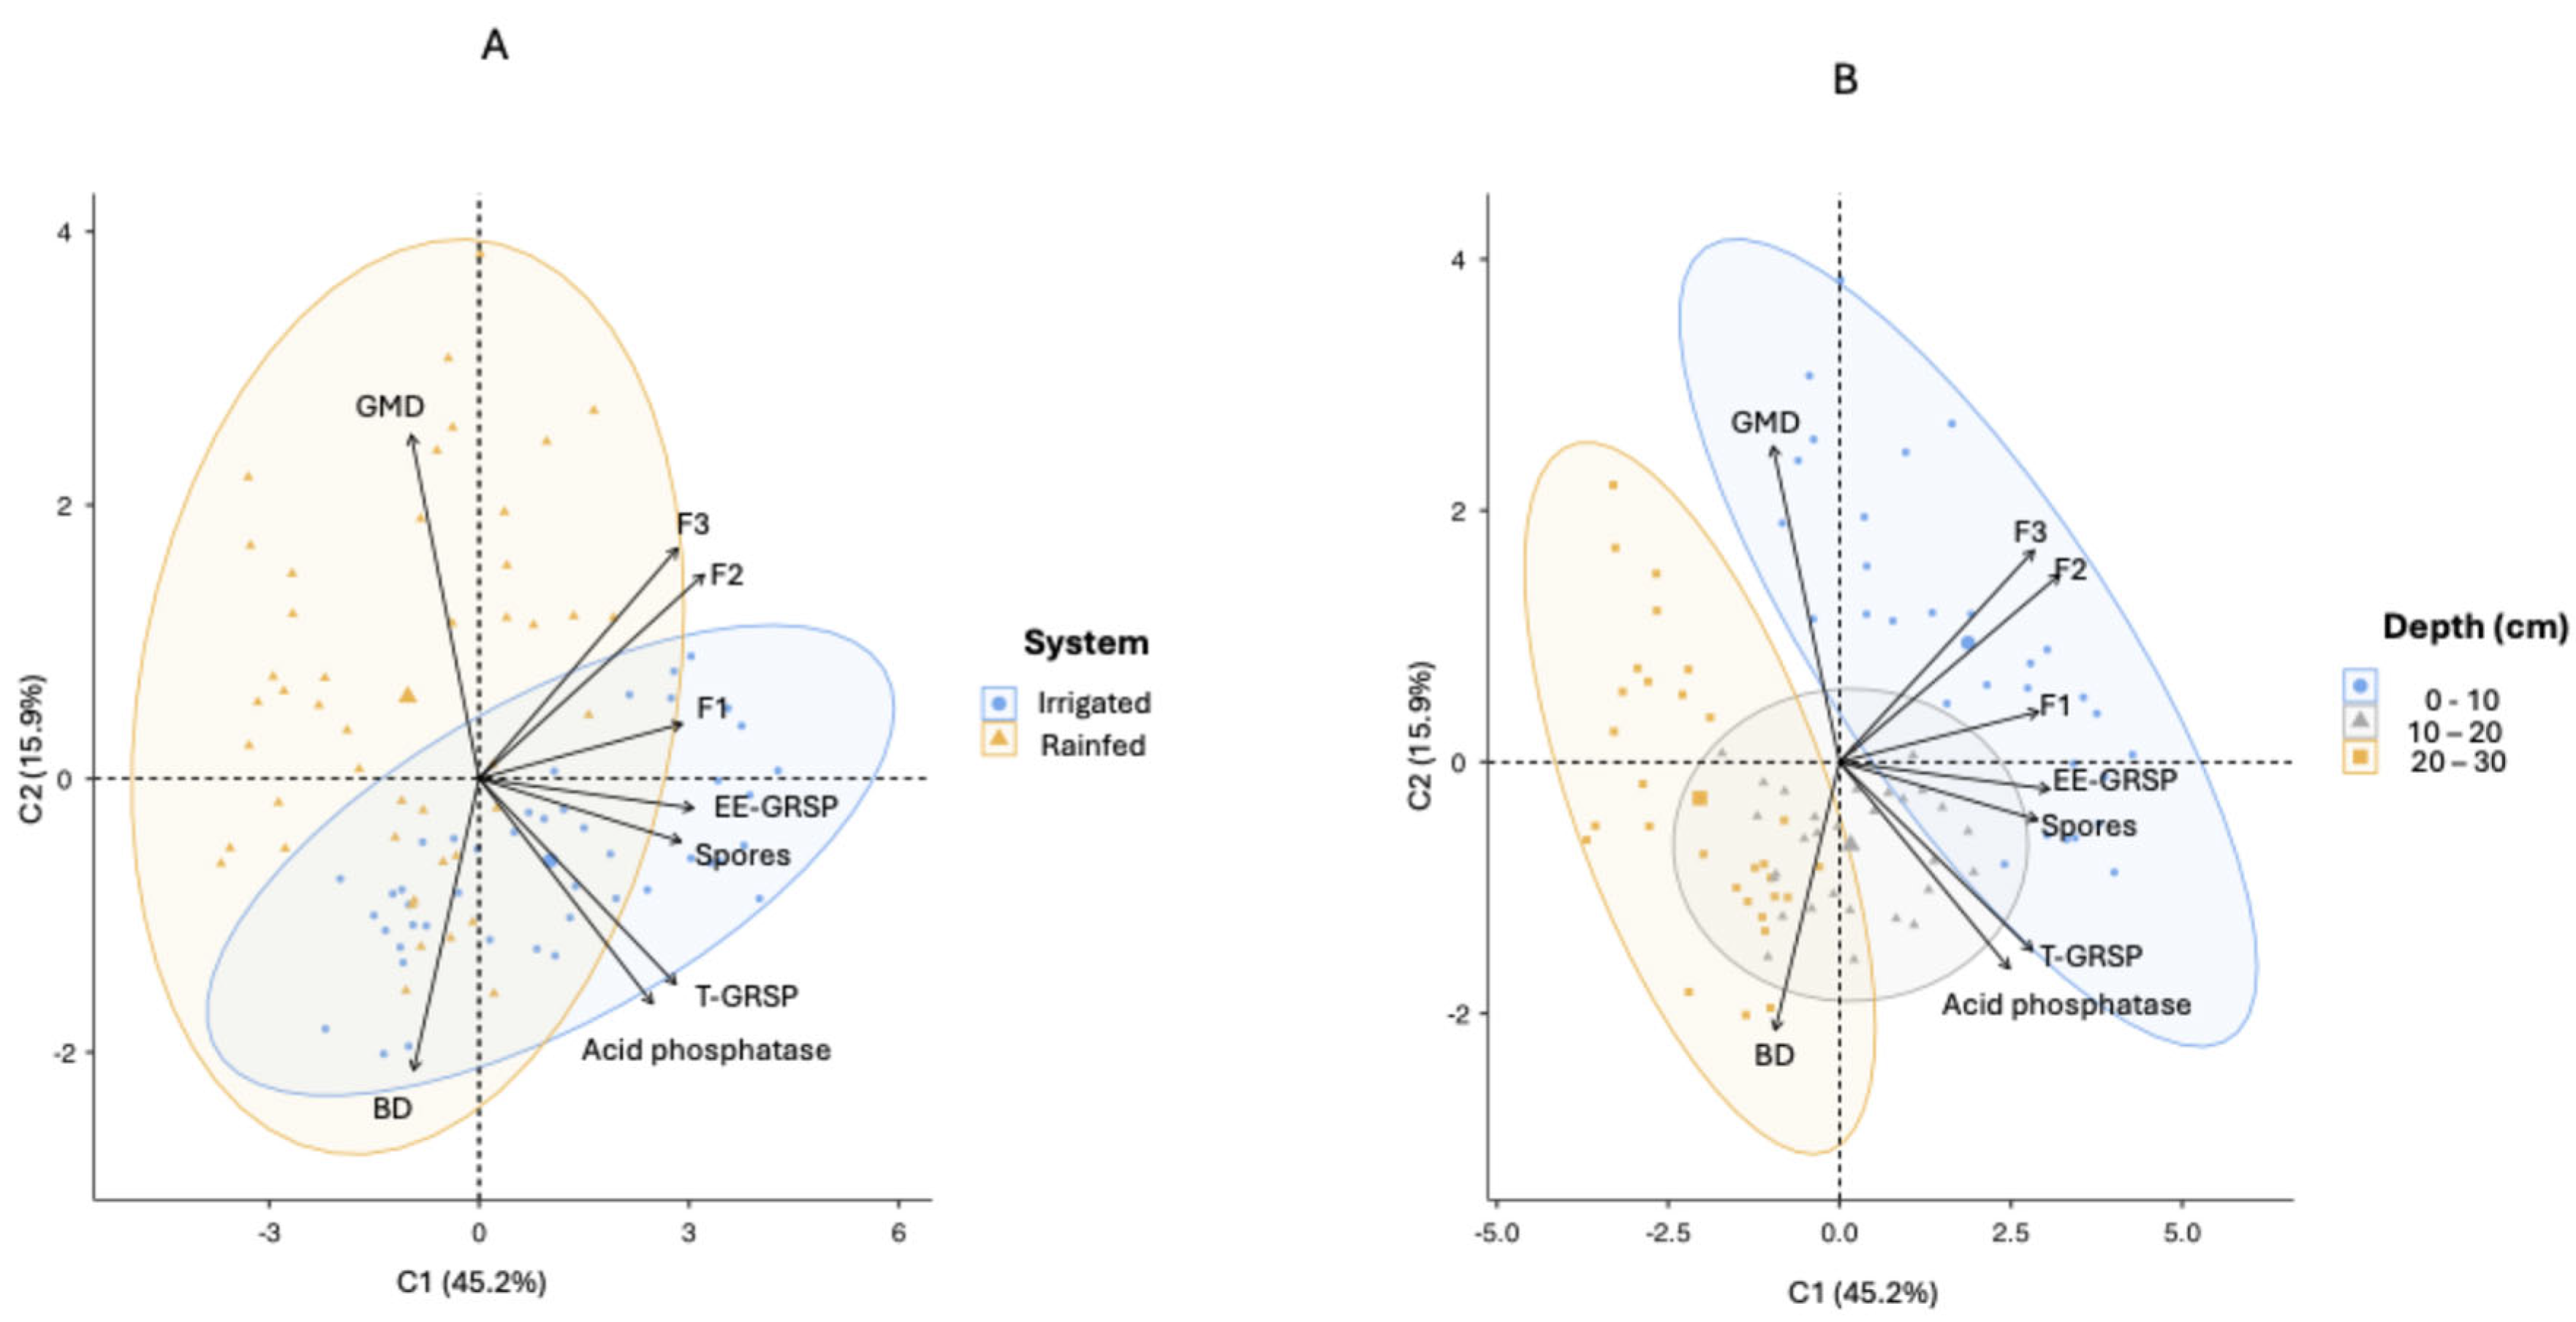
Figure 3.
Values of the Mean Geometric Diameter of aggregates for the two systems studied. Different lowercase letters indicate a statistically significant difference between the systems (p < 0.005).
Figure 3.
Values of the Mean Geometric Diameter of aggregates for the two systems studied. Different lowercase letters indicate a statistically significant difference between the systems (p < 0.005).
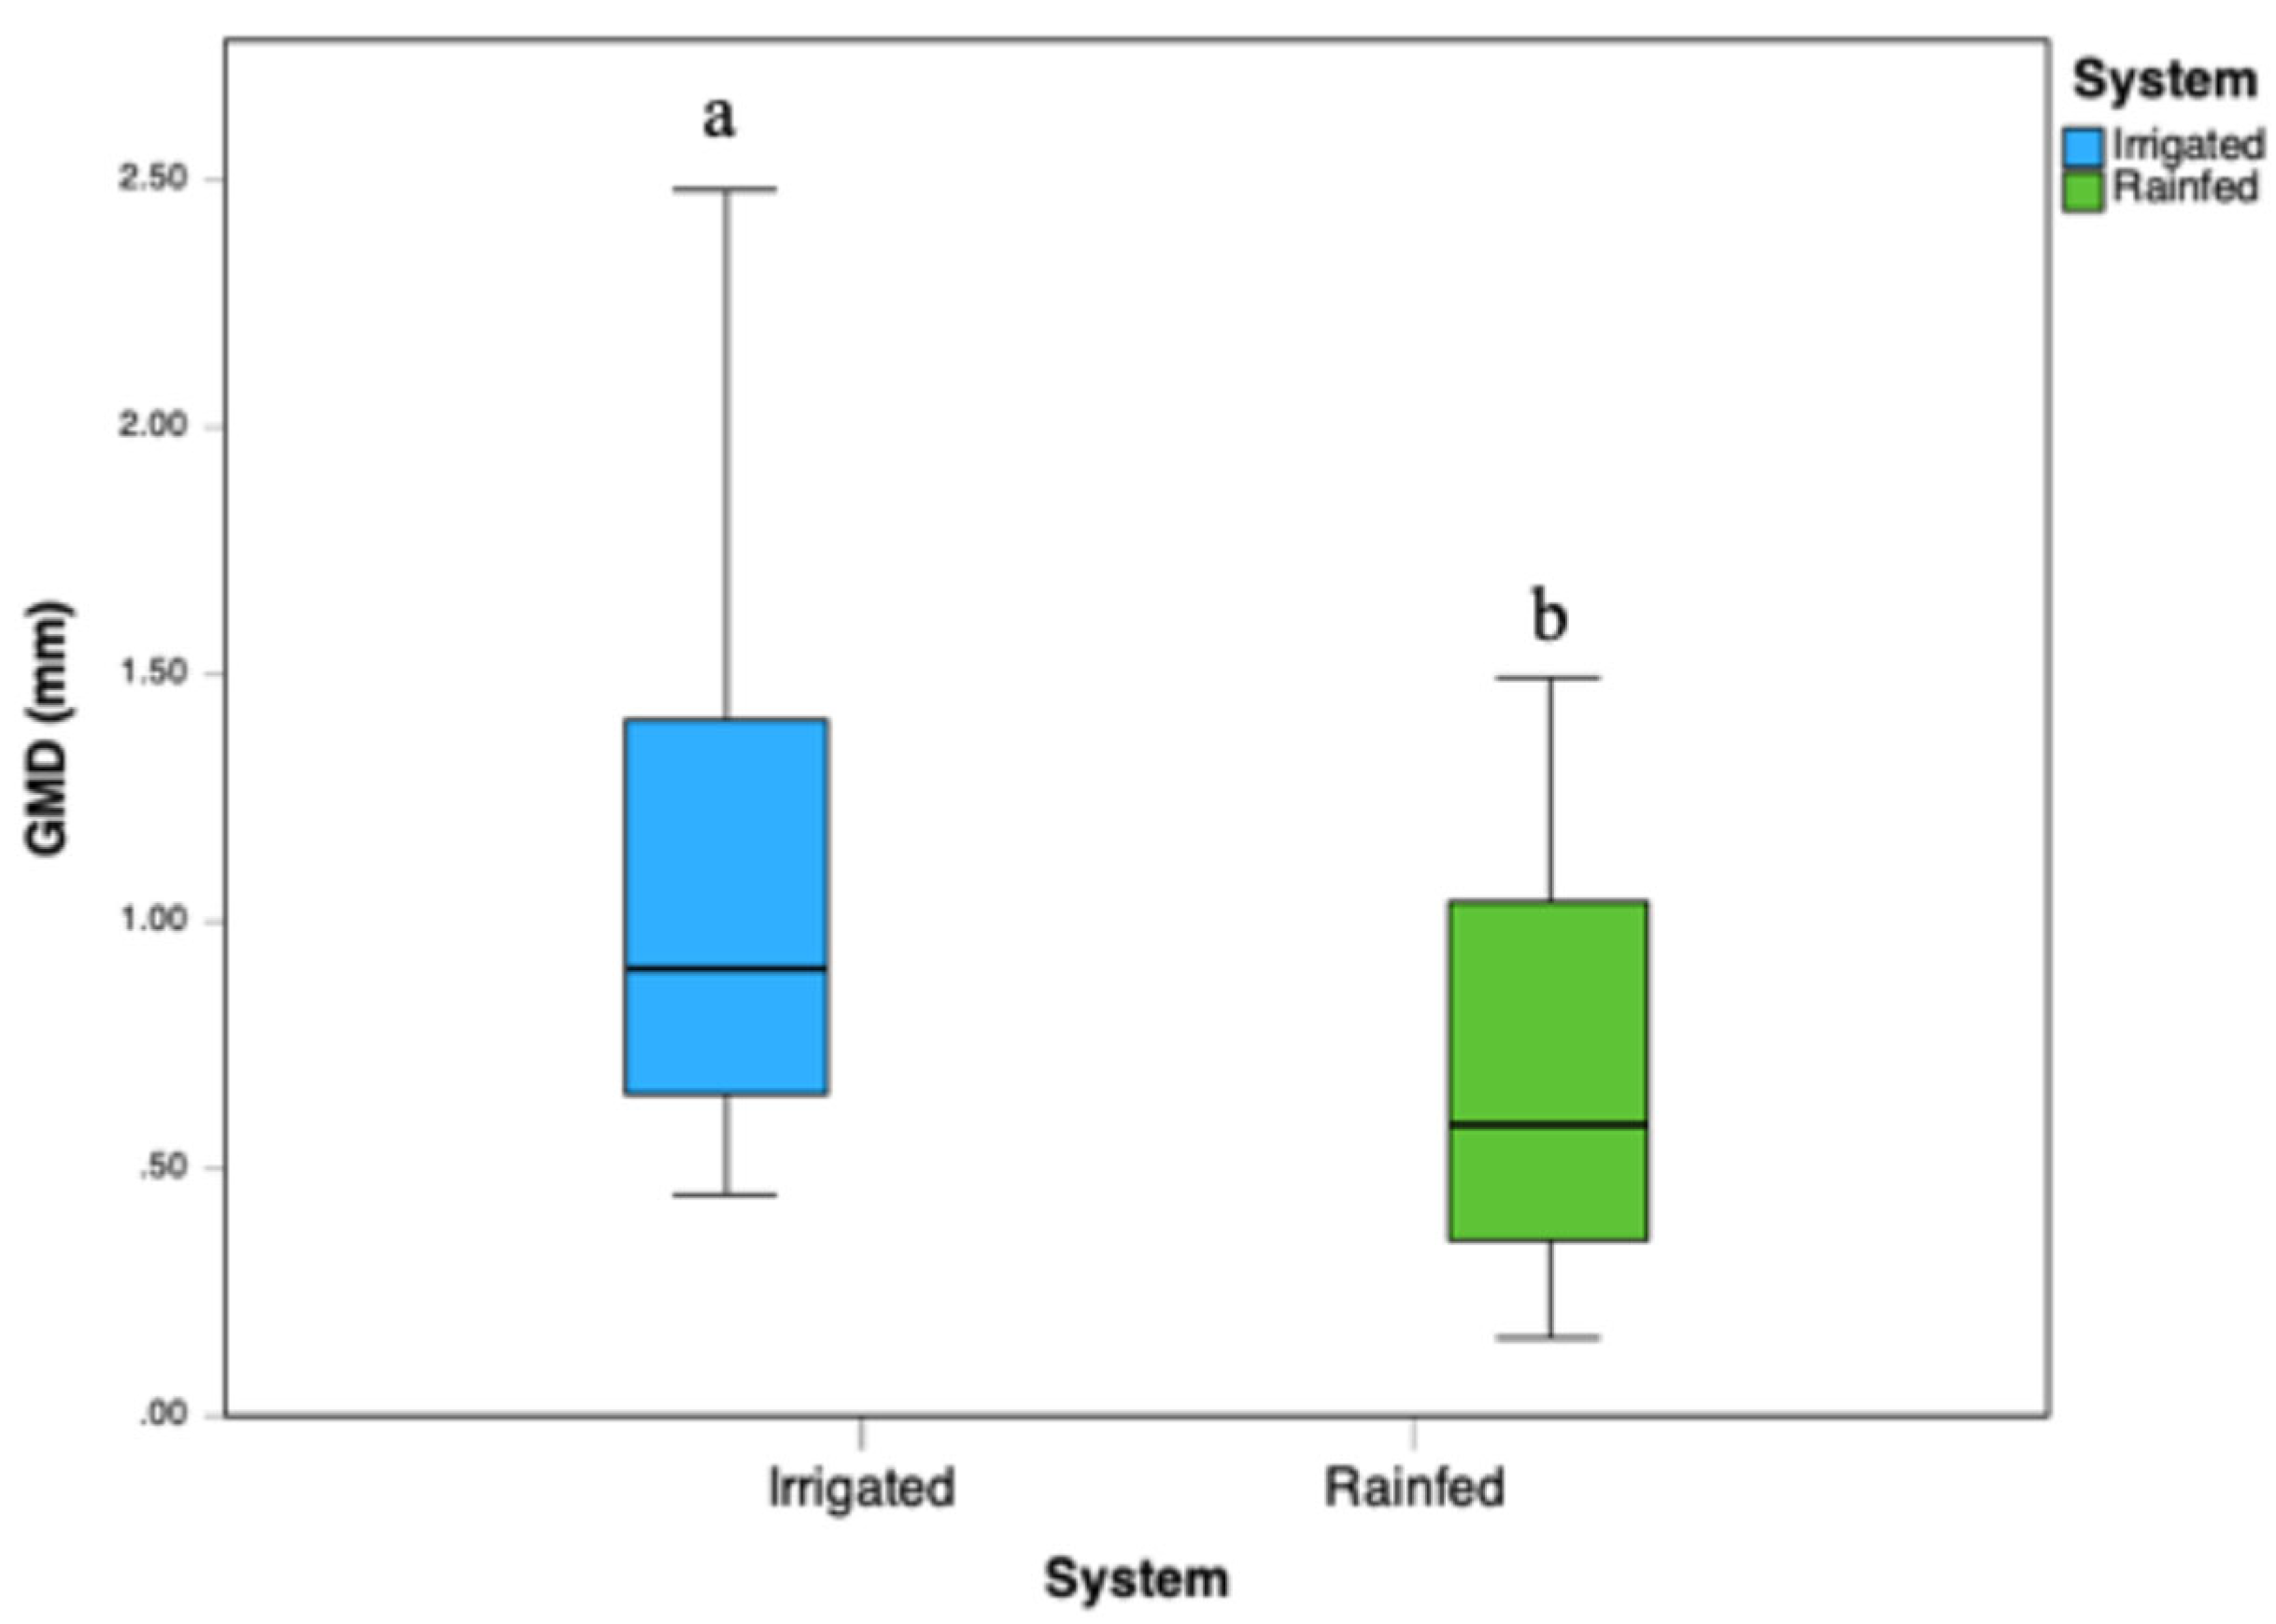
Figure 4.
Heatmaps of Spearman Correlations Between Soil Parameters for Rainfed (A) and Irrigated (B) Systems. EE-GRSP: easily extractable glomalin; T-GRSP: total glomalin; F1= Nutrient Cycling; F2= Nutrient Storage; F3= Nutrient Supply and SQI= Soil Quality Index.
Figure 4.
Heatmaps of Spearman Correlations Between Soil Parameters for Rainfed (A) and Irrigated (B) Systems. EE-GRSP: easily extractable glomalin; T-GRSP: total glomalin; F1= Nutrient Cycling; F2= Nutrient Storage; F3= Nutrient Supply and SQI= Soil Quality Index.
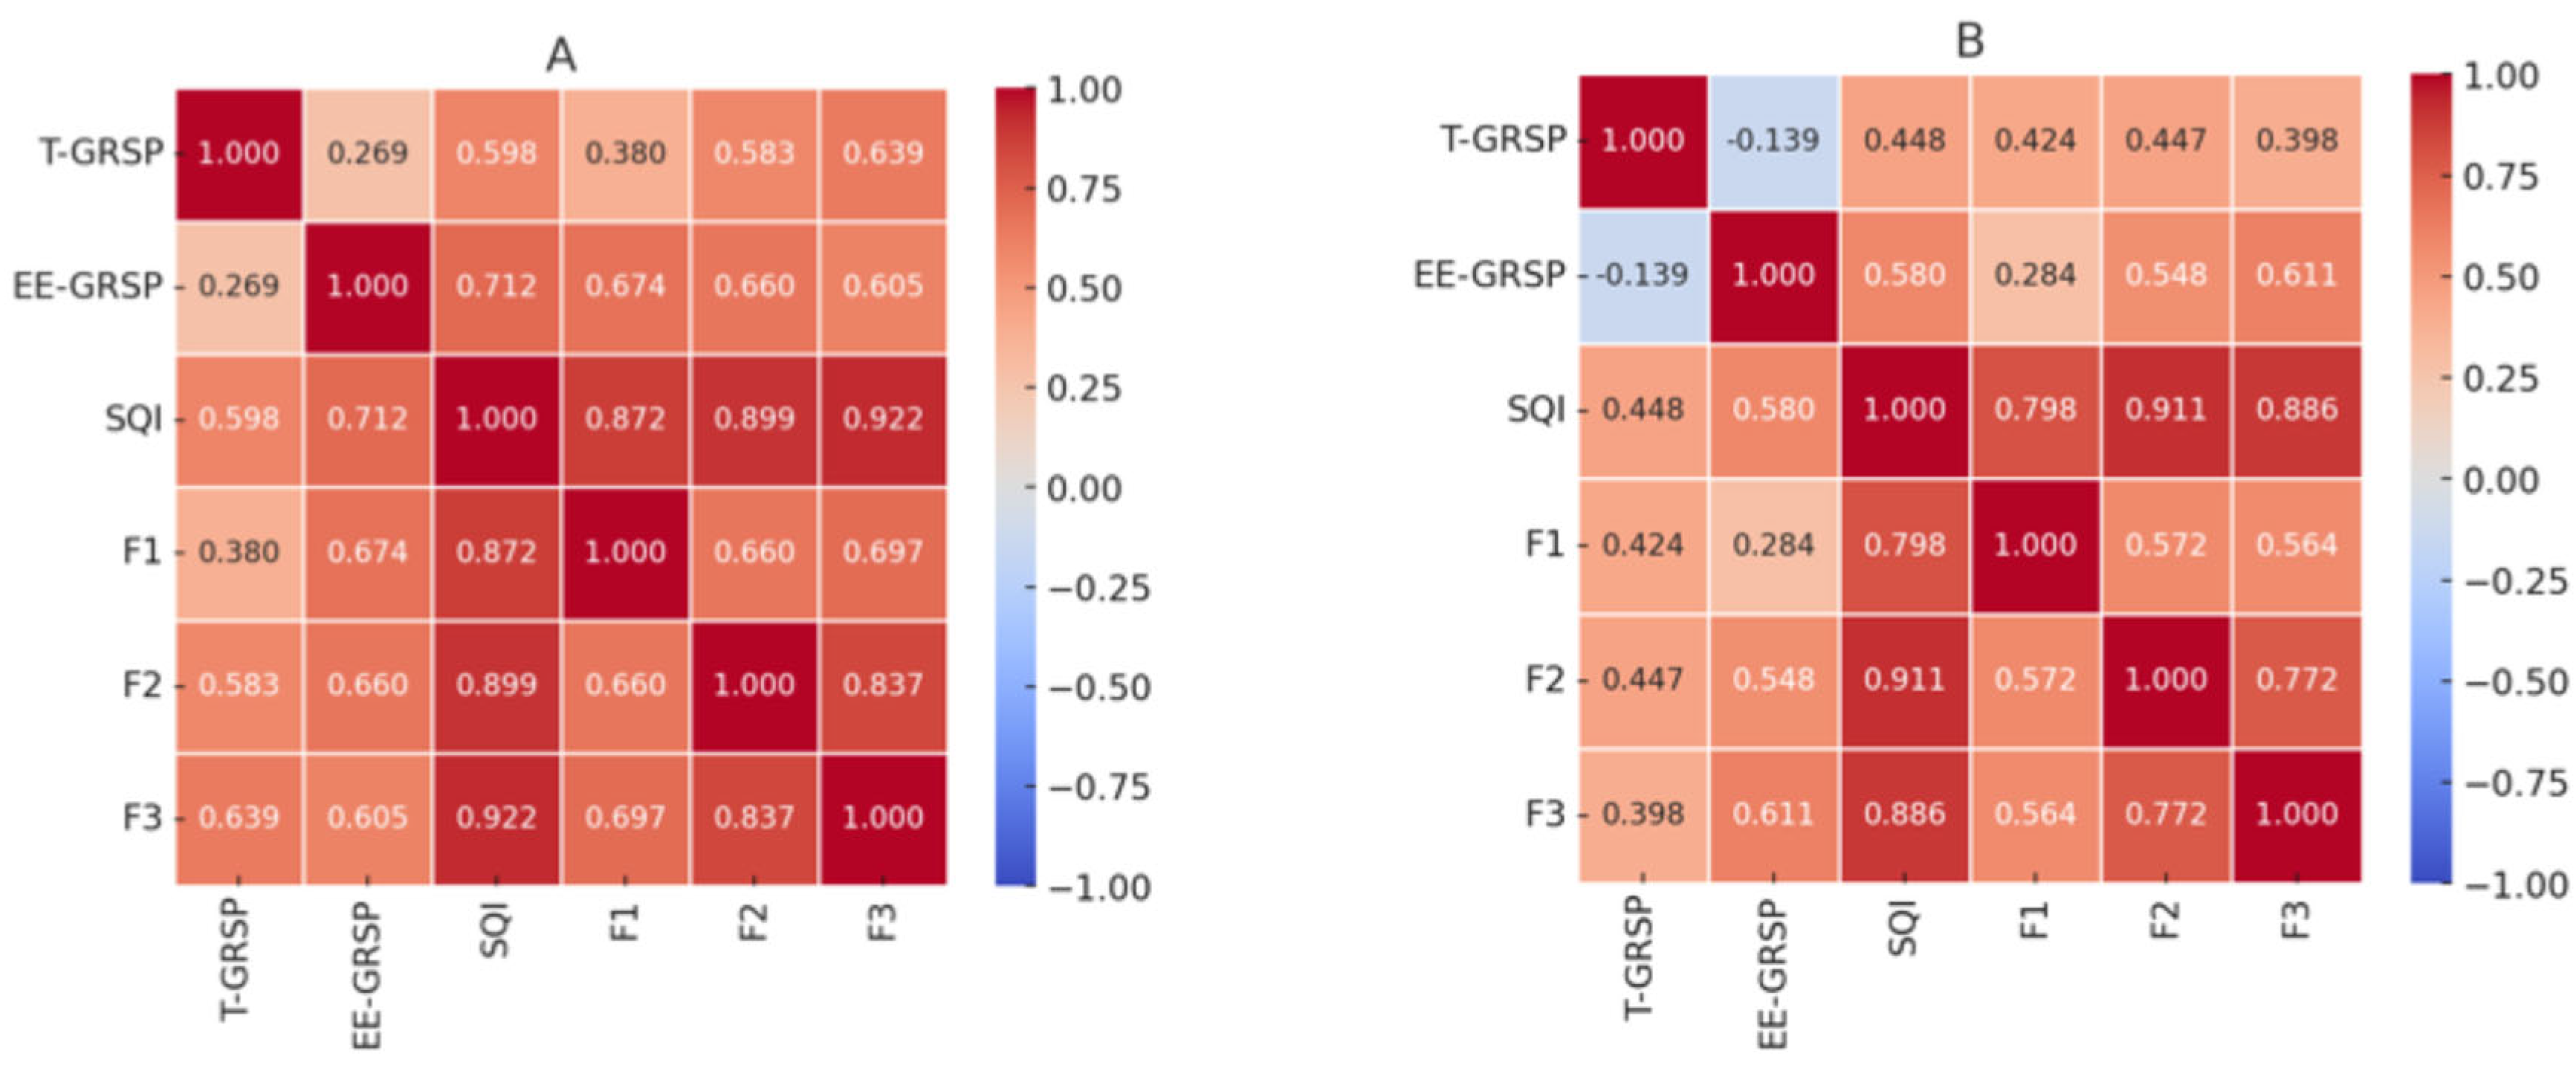
Figure 5.
Values of β-glucosidase (A, B) and acid phosphatase (C, D) activities under different management systems (Irrigated and Rainfed) and soil depths (0–10 cm, 10–20 cm, and 20–30 cm). Statistical analyses were performed using the non-parametric Kruskal-Wallis test, followed by pairwise comparisons with Bonferroni adjustment. Groups denoted by different letters represent statistically significant differences (p < 0.05).
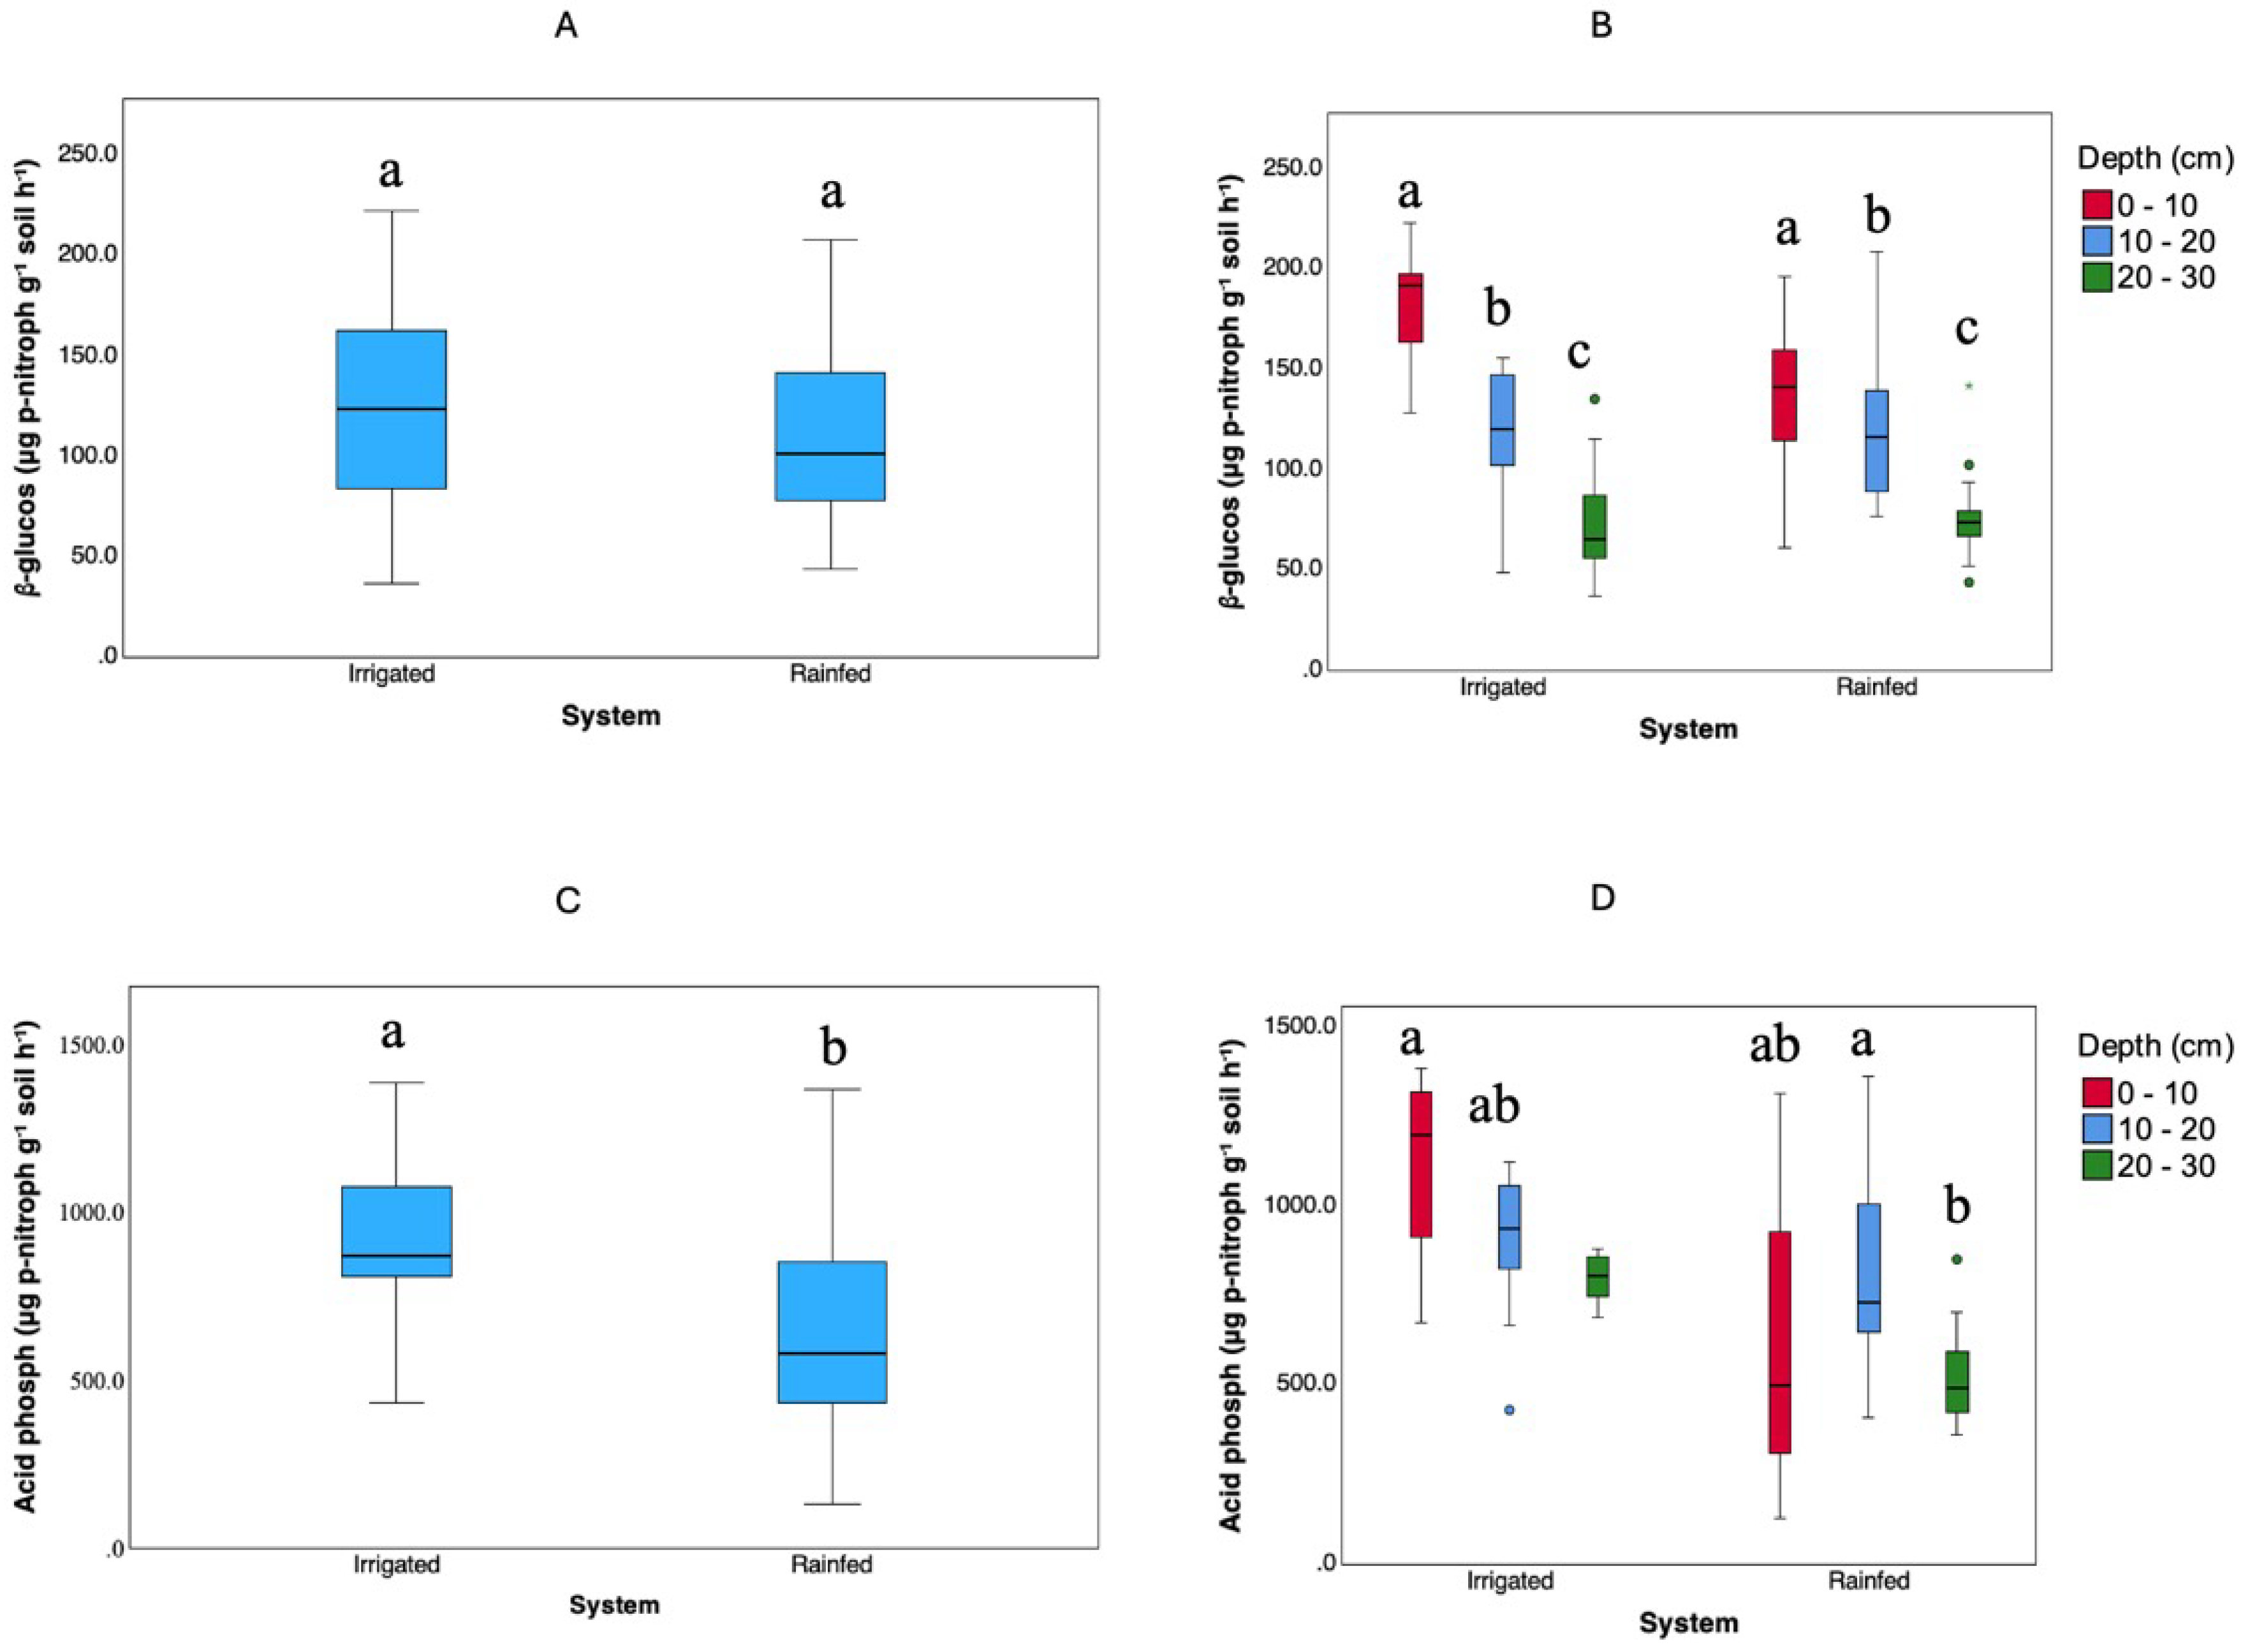
Figure 6.
Spore density (A, B) and available phosphorus (C, D) across different management systems (Irrigated and Rainfed) and soil depths (0–10 cm, 10–20 cm, 20–30 cm). The Irrigated system received fertigation with swine manure for 20 years and supports three cropping cycles per year. Statistical analyses were performed using the Kruskal-Wallis test with Bonferroni adjustment. Different letters indicate statistically significant differences (p < 0.05) between systems (A, C) and among depths within each system (B, D).
Figure 7.
Relationships between EE-GRSP, T-GRSP, and soil quality indices (SQI-A, SQI-B) in Irrigated and Rainfed systems. Scatterplots show pairwise comparisons.
Figure 7.
Relationships between EE-GRSP, T-GRSP, and soil quality indices (SQI-A, SQI-B) in Irrigated and Rainfed systems. Scatterplots show pairwise comparisons.
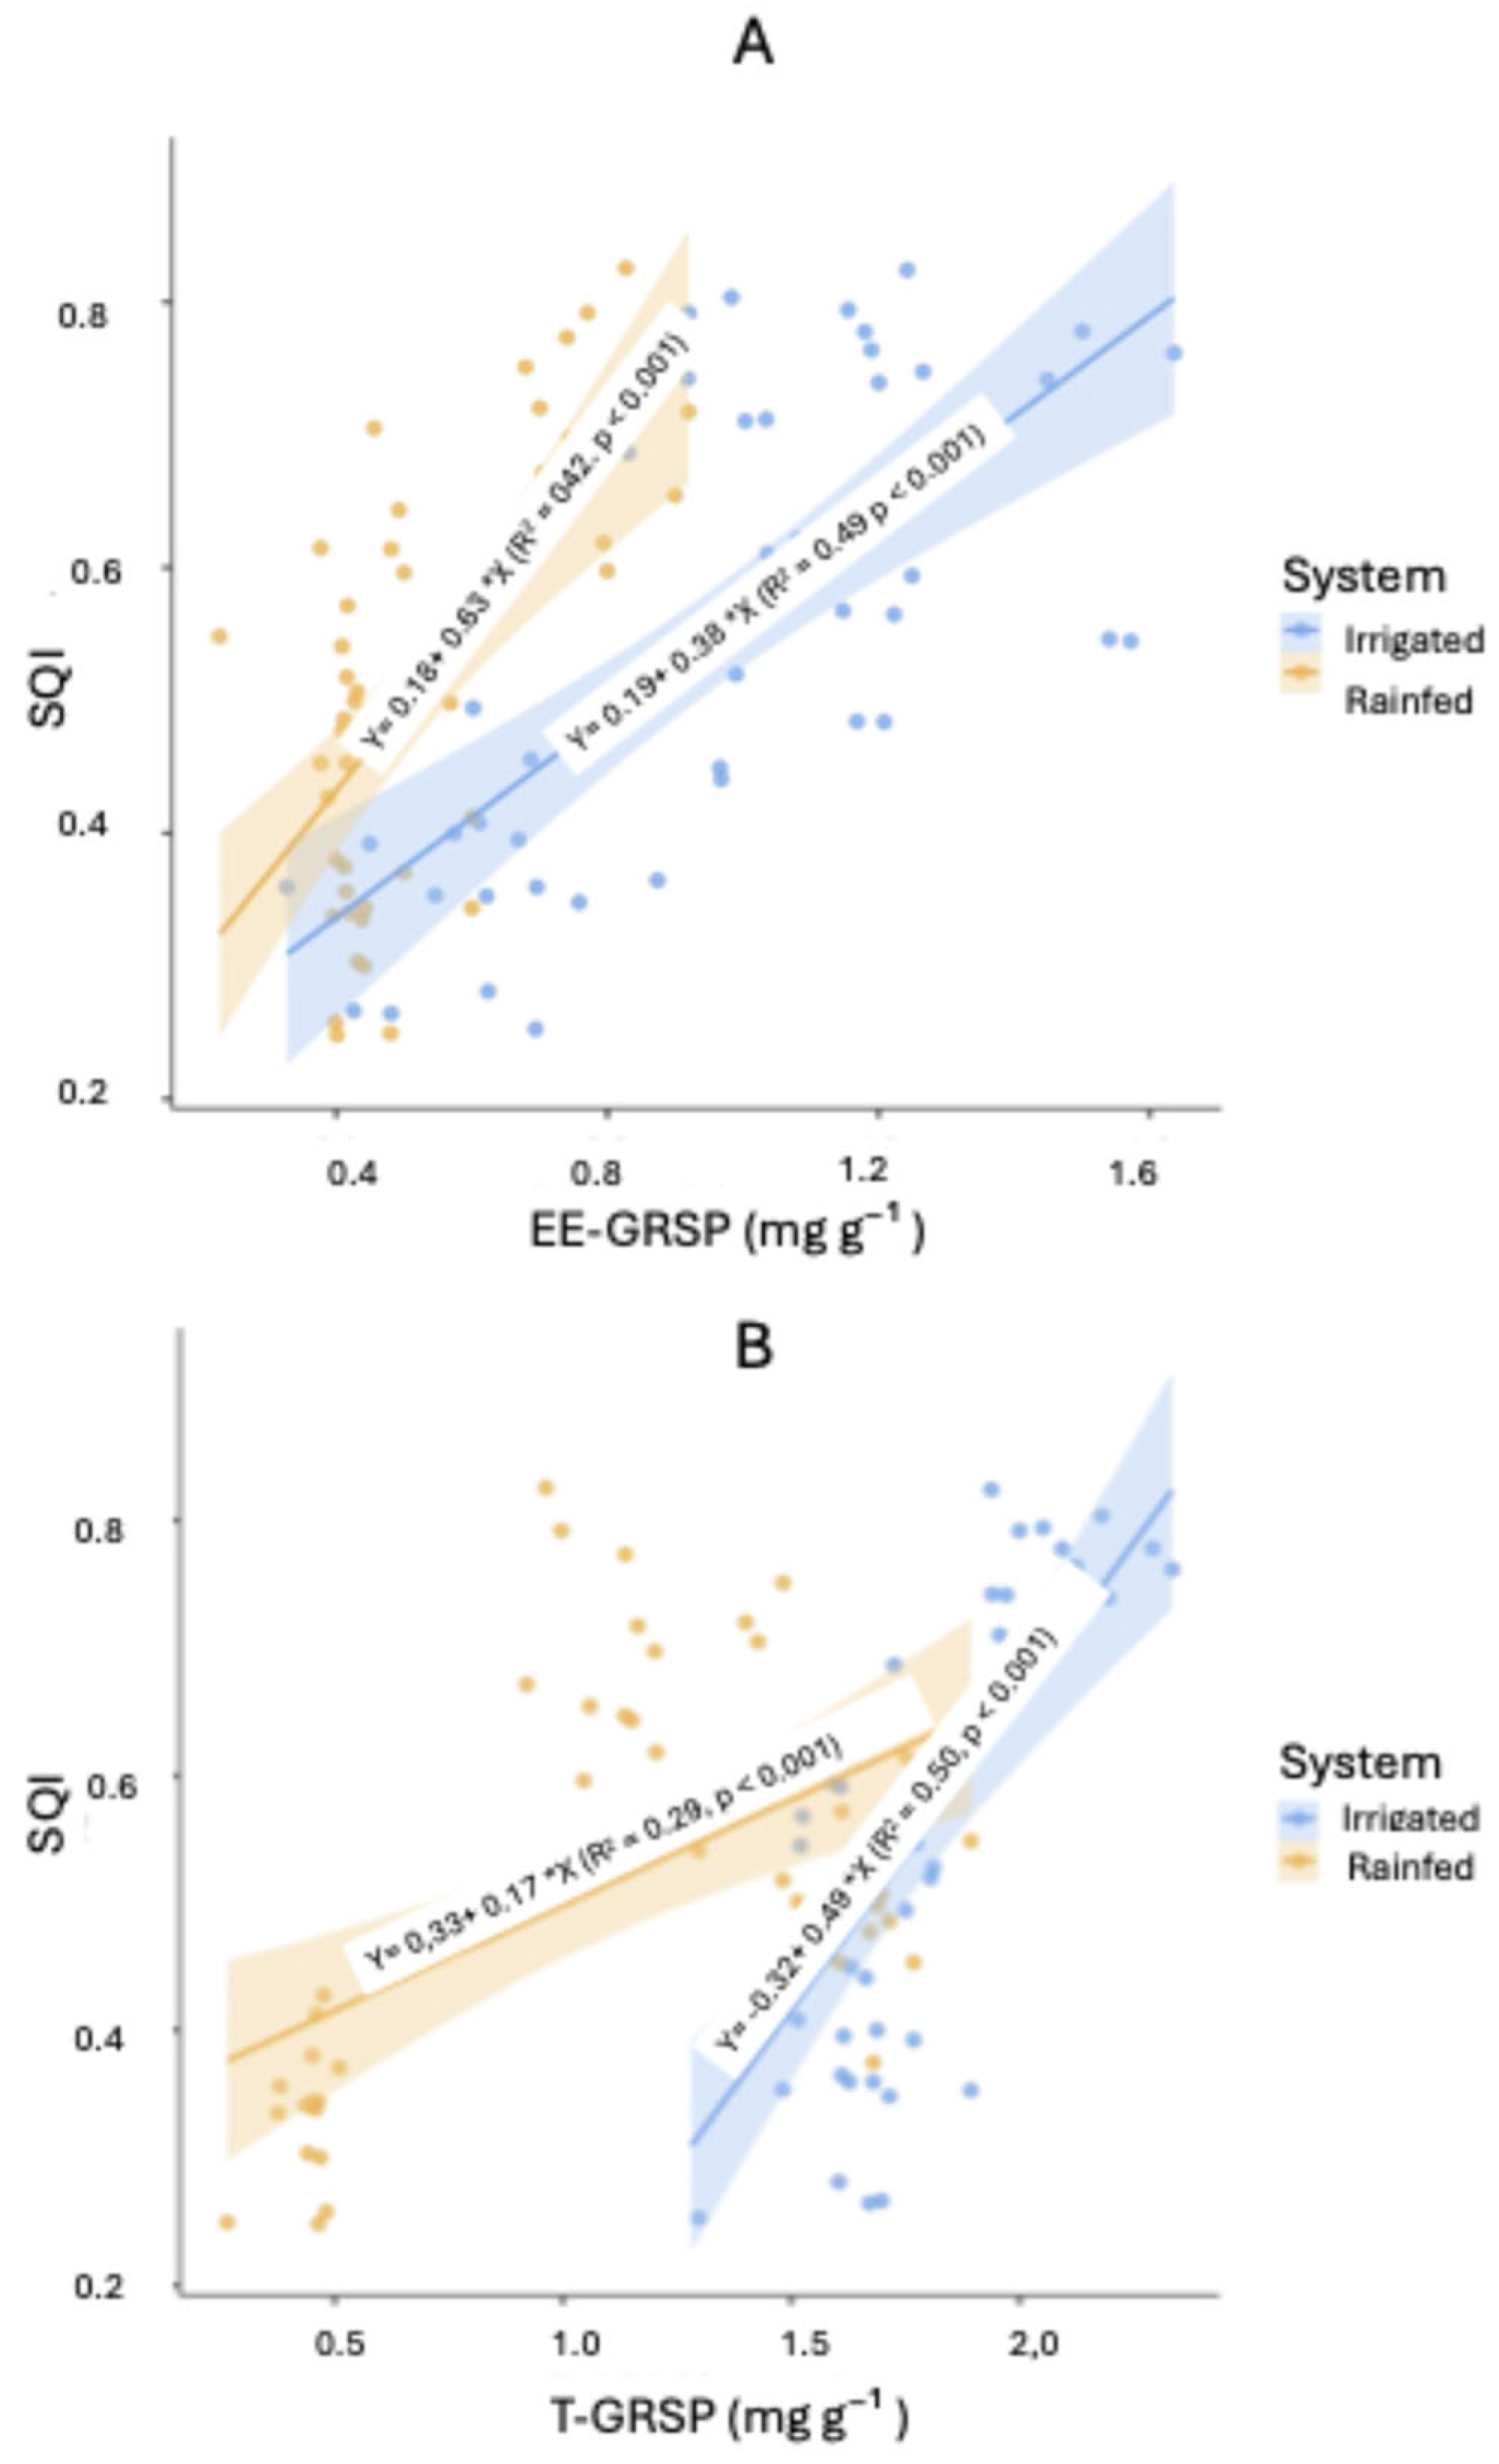
Figure 8.
Comparison of robust regression–predicted SQI values with observed SQI values in both Irrigated and Rainfed systems.
Figure 8.
Comparison of robust regression–predicted SQI values with observed SQI values in both Irrigated and Rainfed systems.
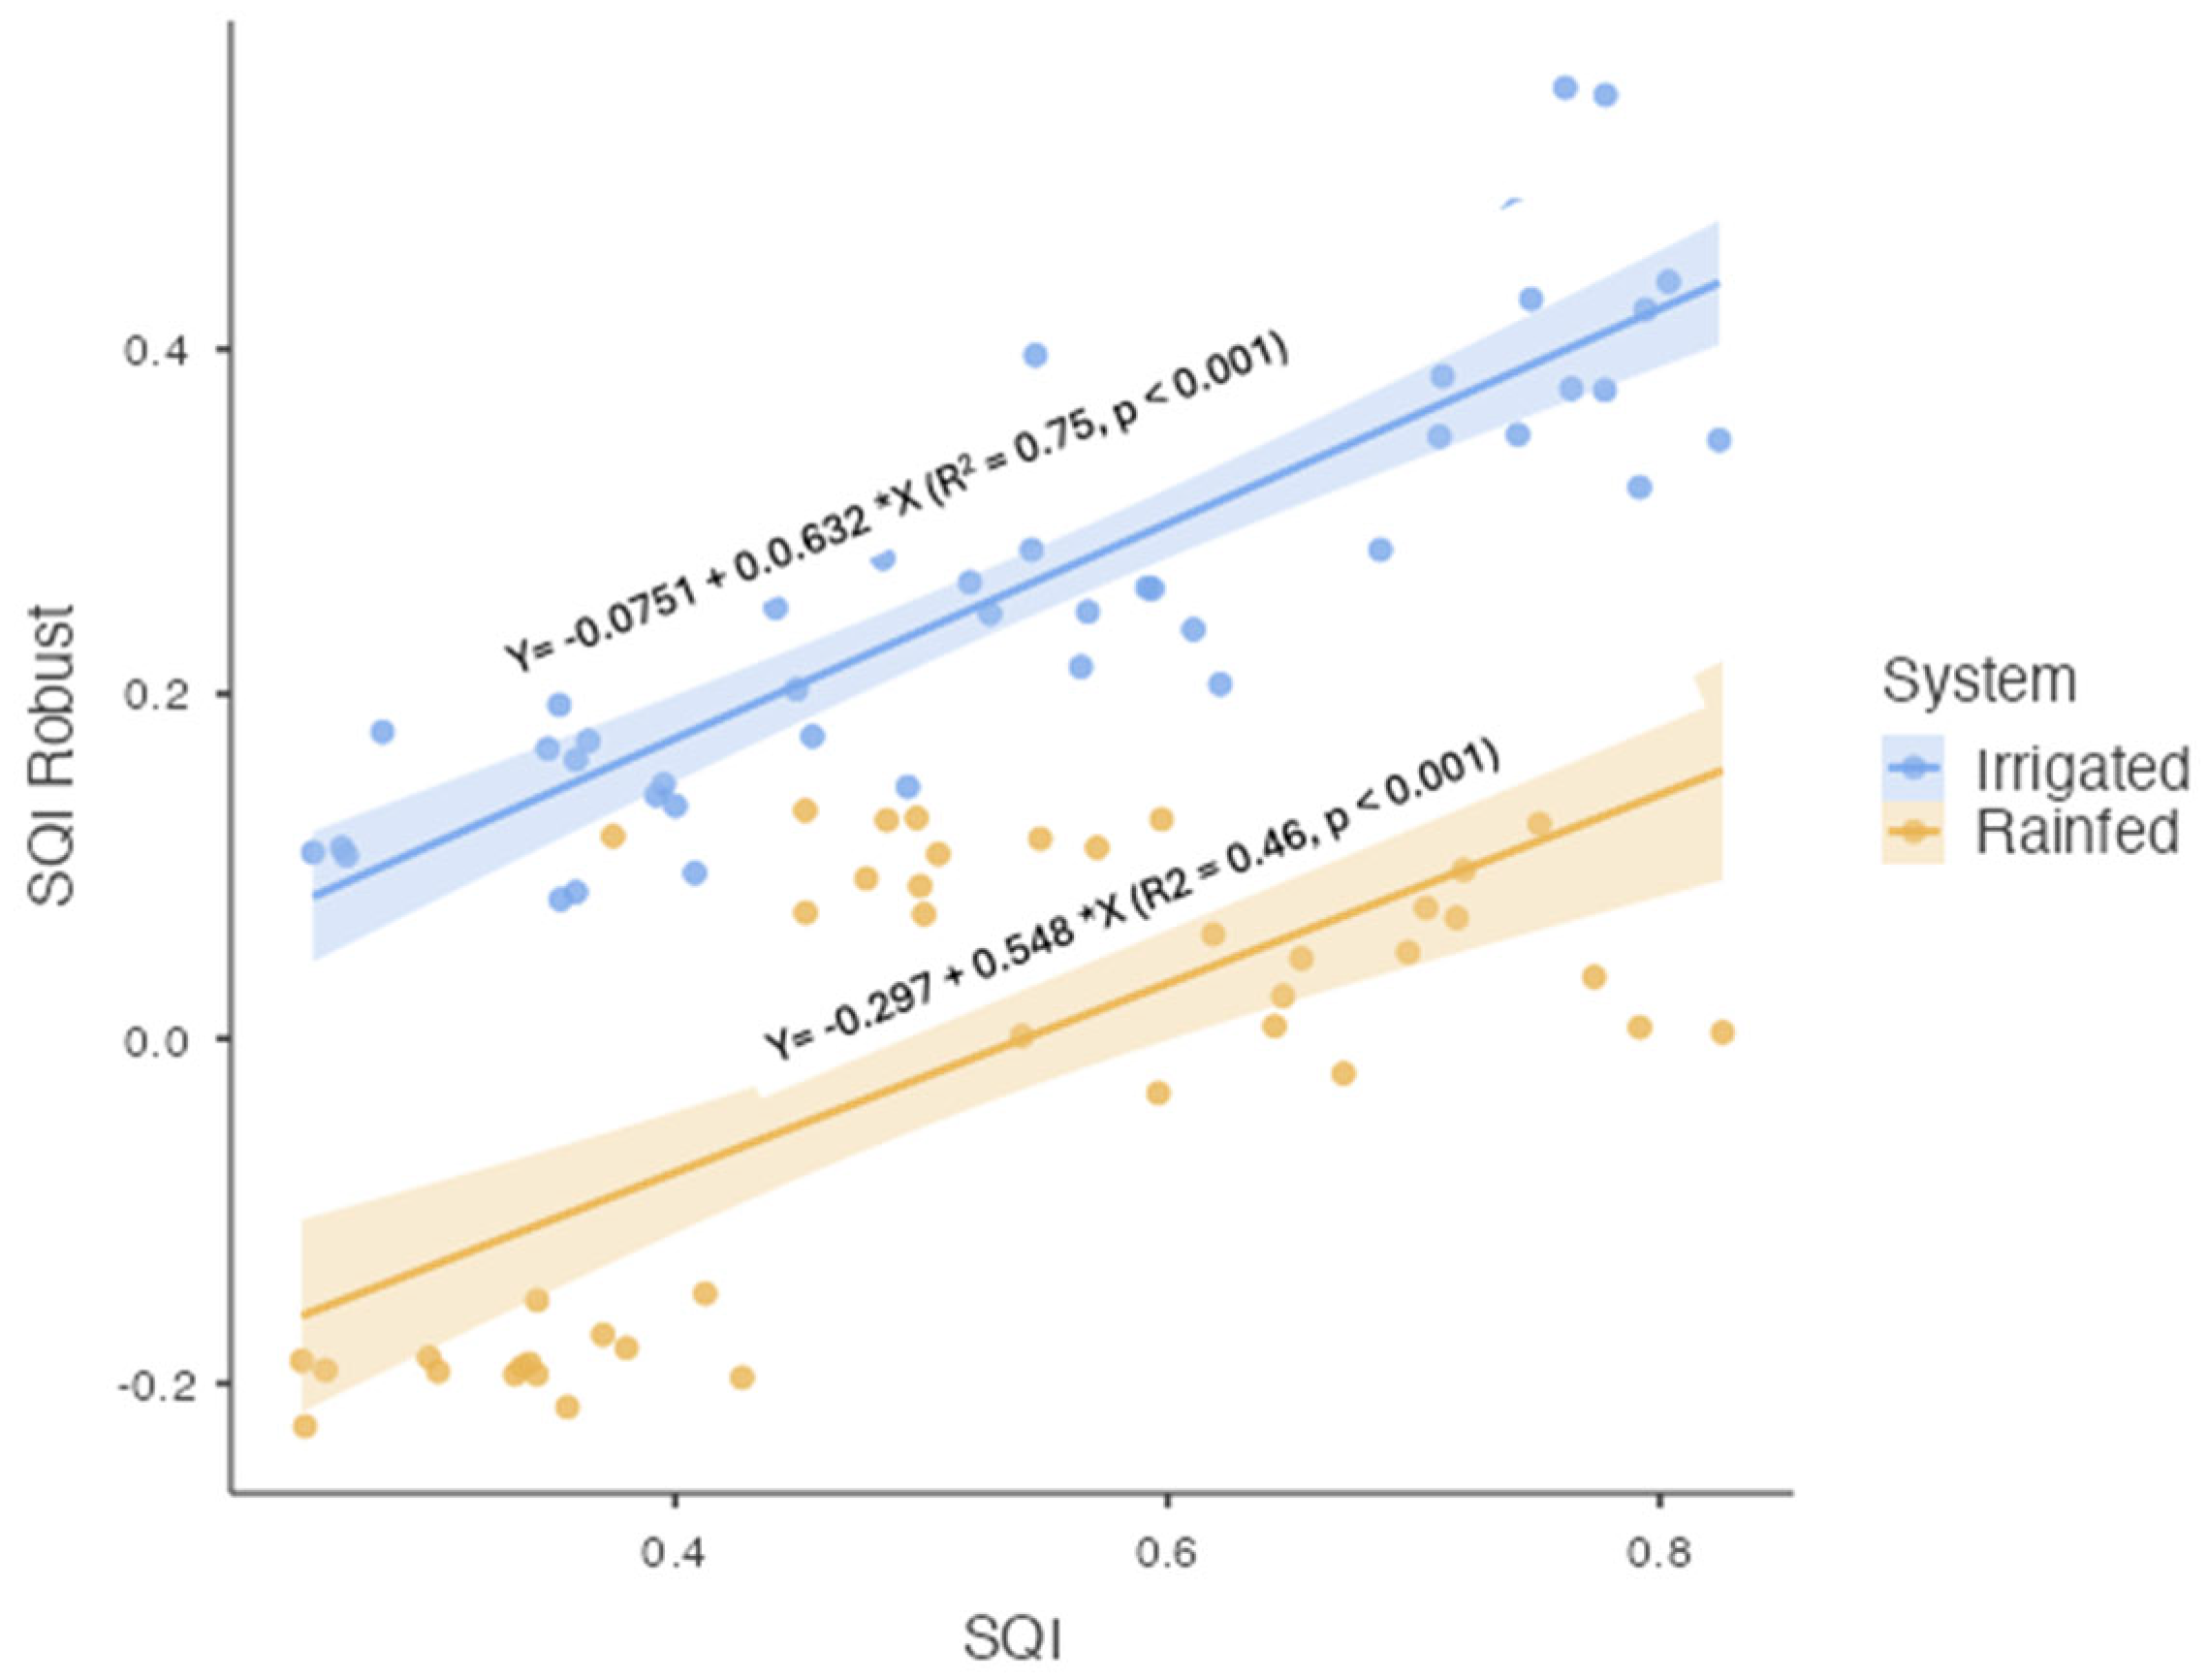
Figure 9.
Relative abundance of bacterial species exceeding 1% across land-use types (Irrigated, Protected Area, and Rainfed).
Figure 9.
Relative abundance of bacterial species exceeding 1% across land-use types (Irrigated, Protected Area, and Rainfed).
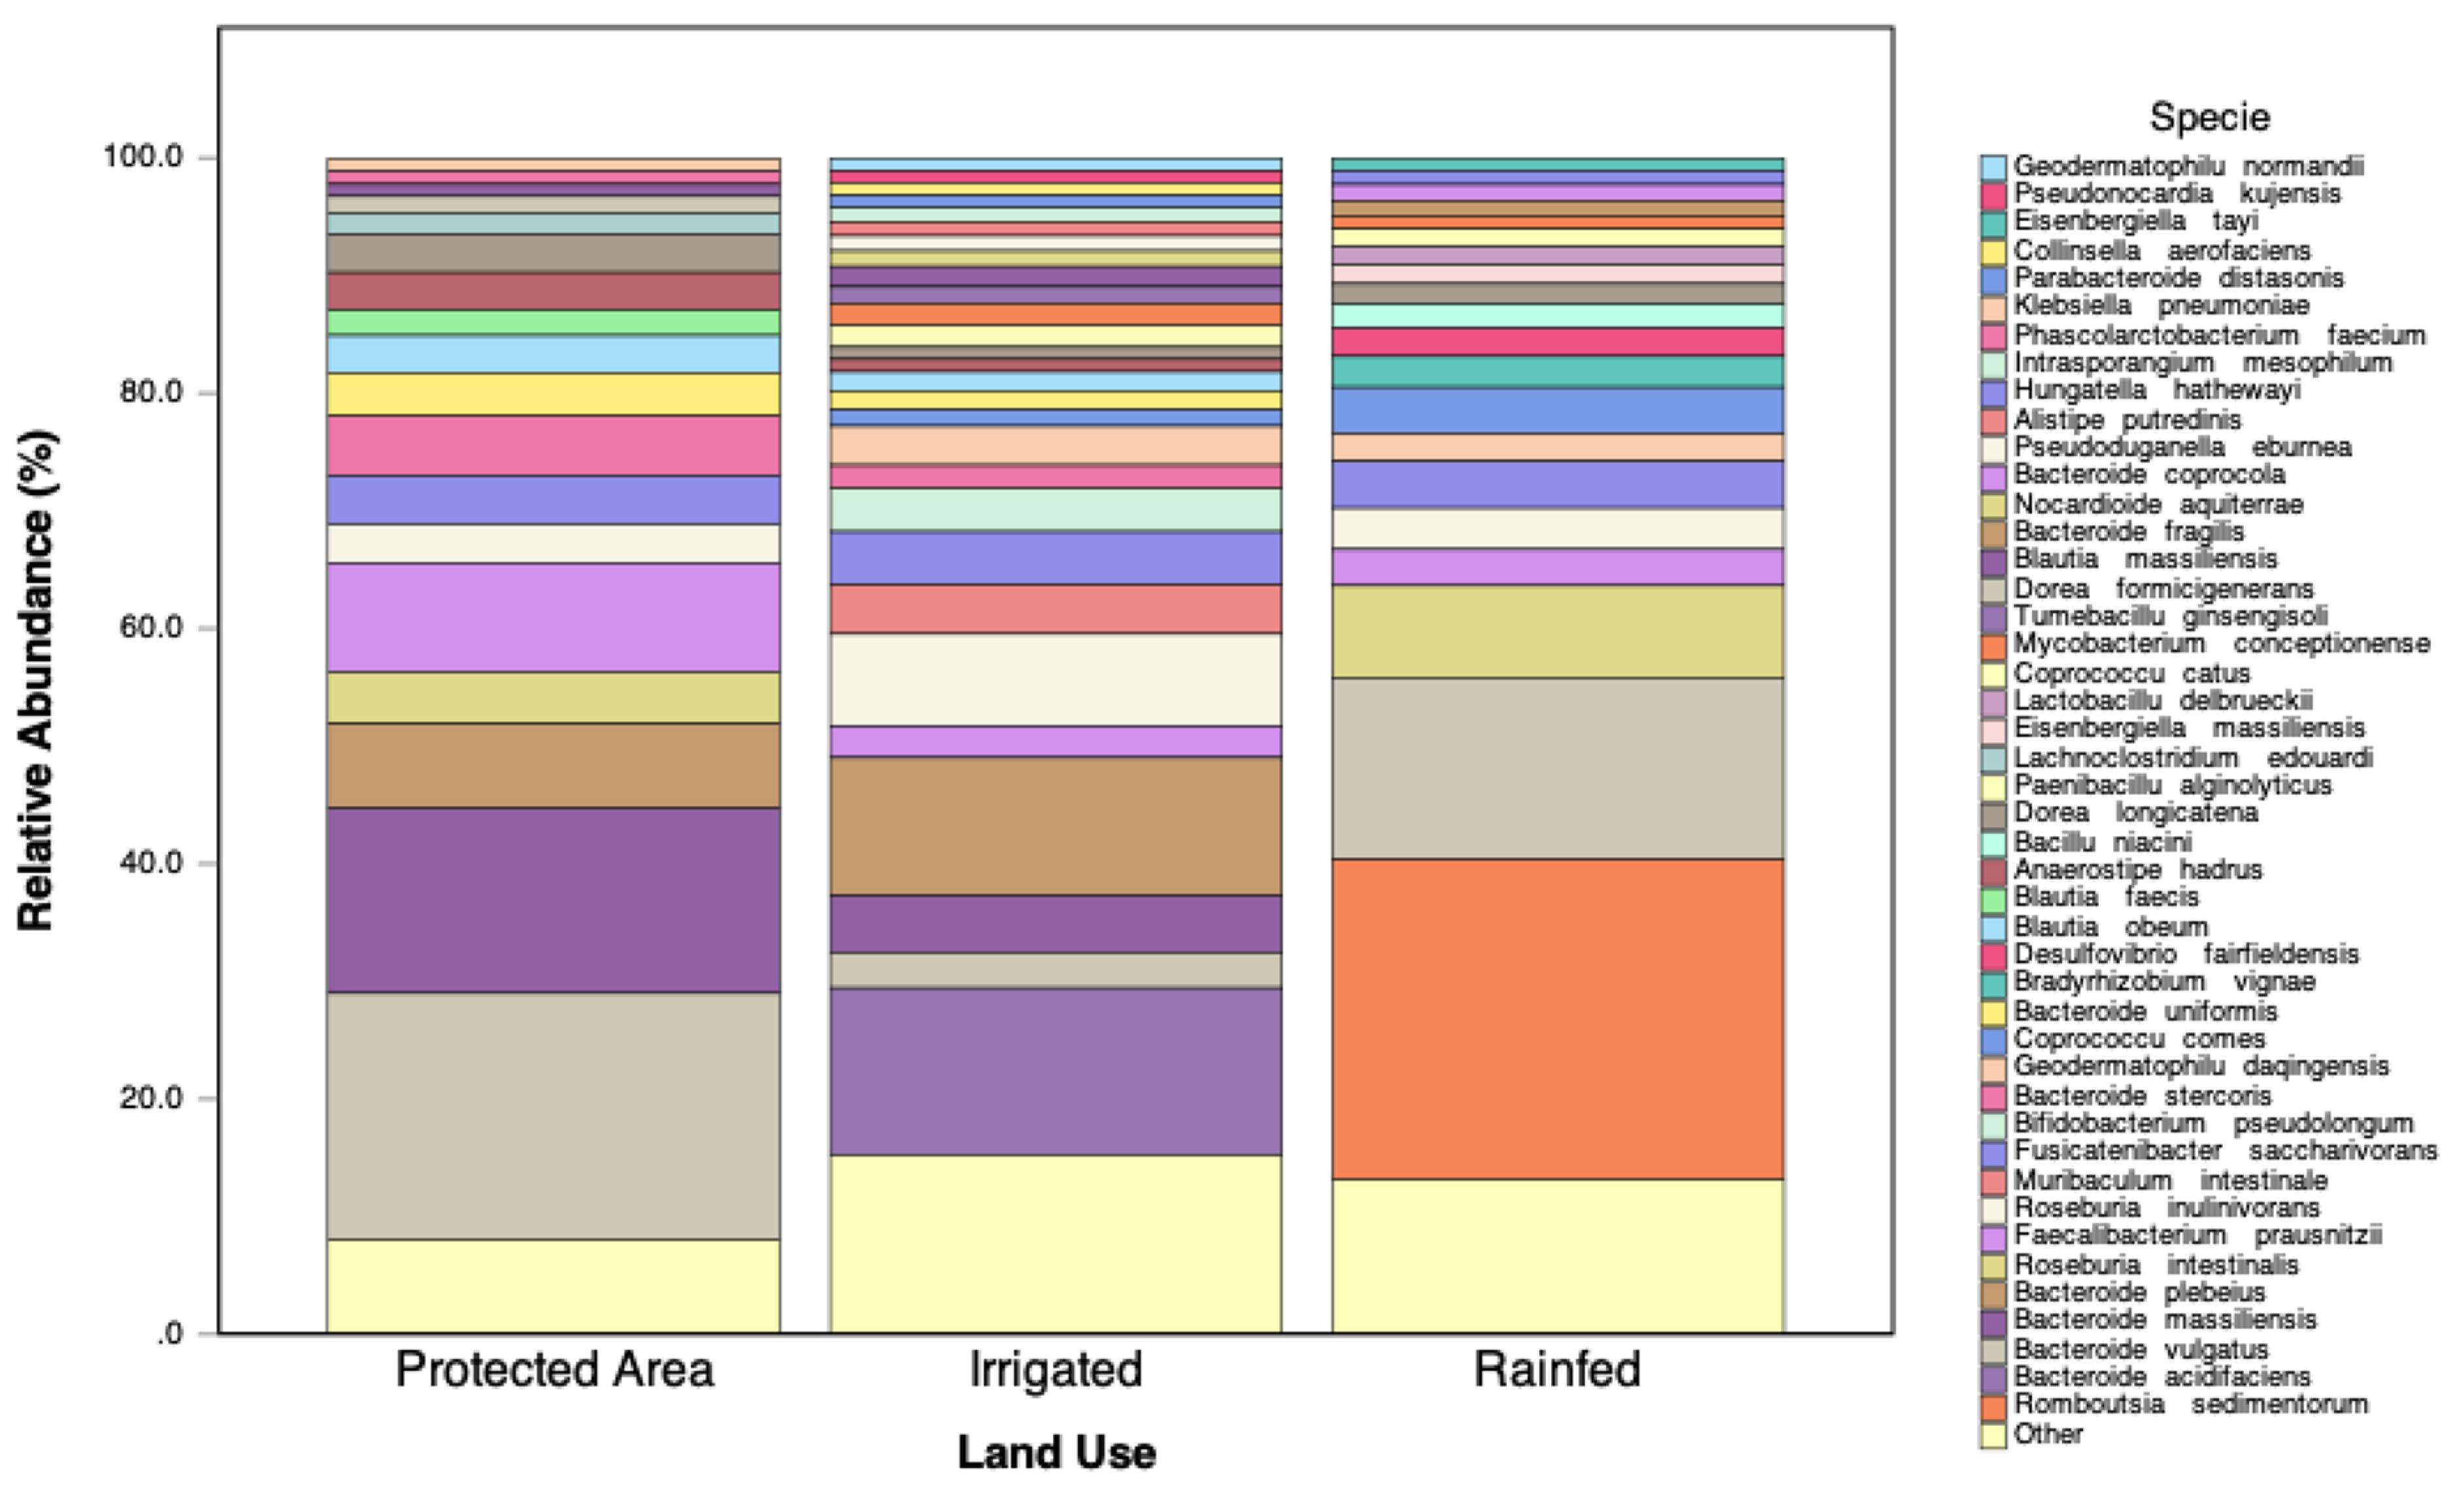
Figure 10.
Relative abundance of fungal species exceeding 1% across land-use types (Irrigated, Protected Area, and Rainfed).
Figure 10.
Relative abundance of fungal species exceeding 1% across land-use types (Irrigated, Protected Area, and Rainfed).
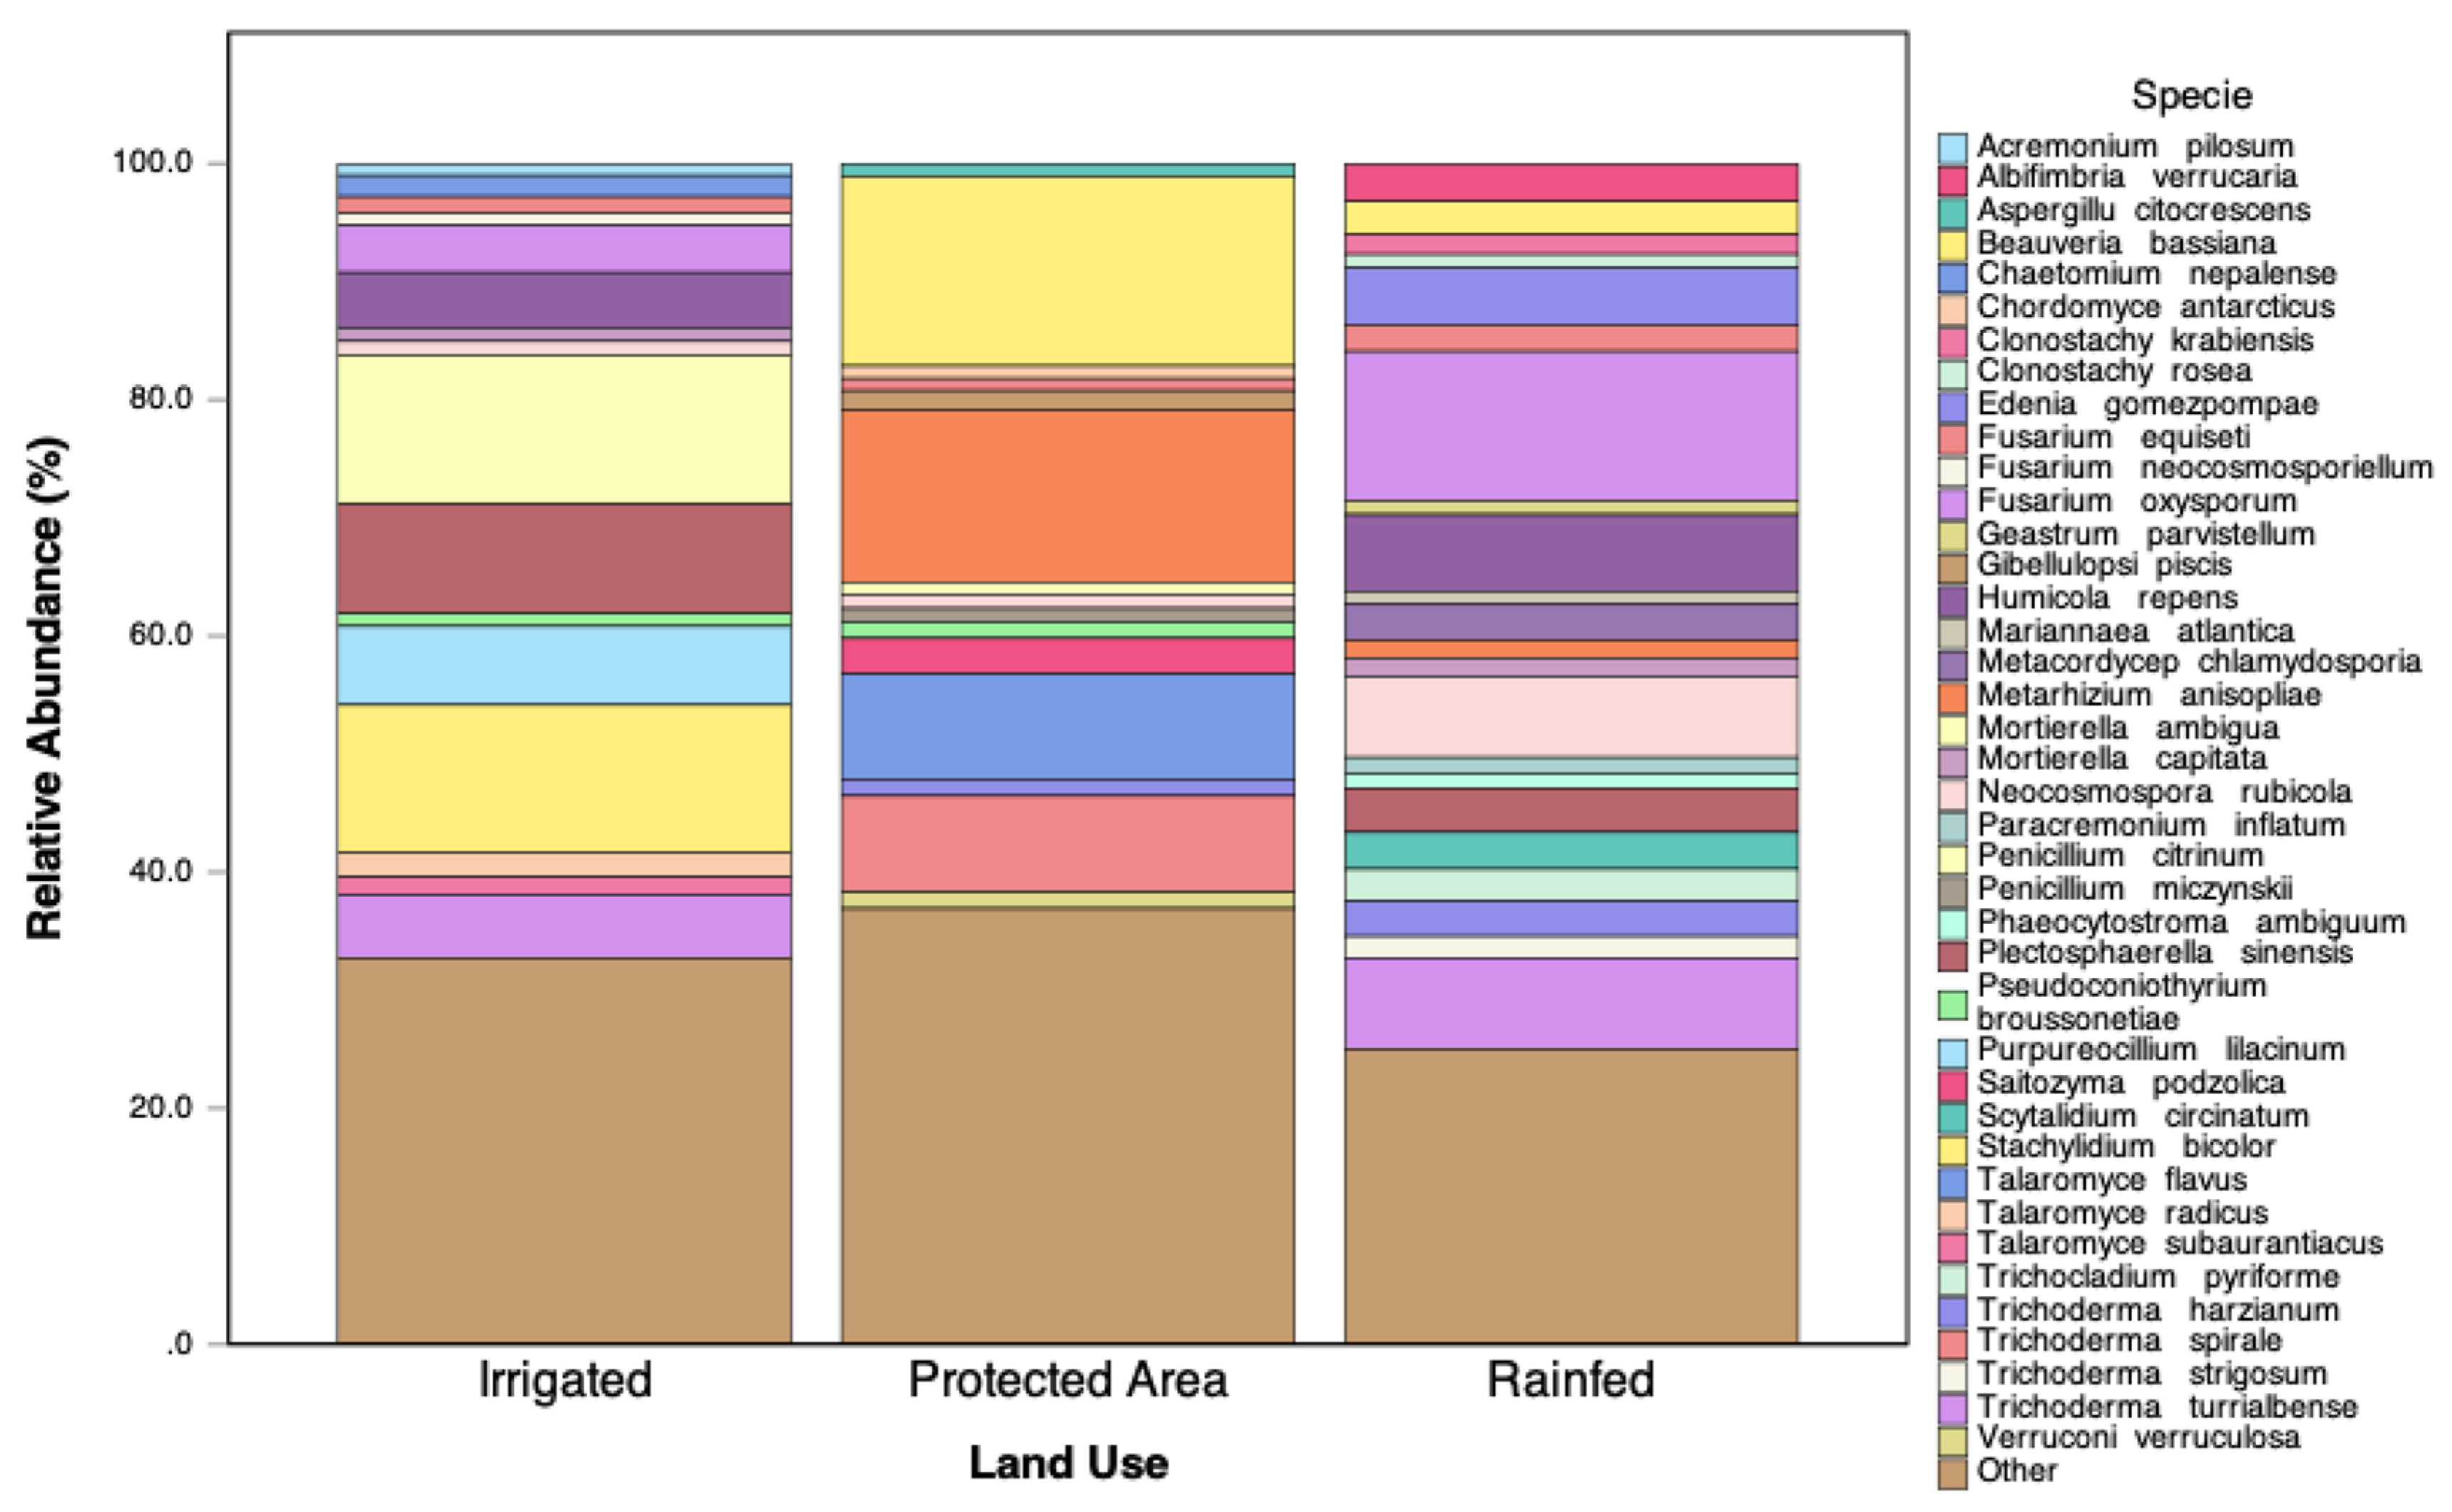

Table 1.
Results of robust regression for the Soil Quality Index (IQS).
| Variable | Irrigated β | Irrigated t | Irrigated p | Rainfed β | Rainfed t | Rainfed p |
|---|---|---|---|---|---|---|
| Acid phosphatase | .000 | 3.331 | .002 | .000 | 1.334 | .190 |
| BS | .039 | .169 | .867 | -.370 | -1.830 | .075 |
| EEGRSP | .177 | 3.409 | .002 | .501 | 5.046 | .000 |
| GMD | .013 | .169 | .867 | .013 | .281 | .780 |
| Intercept | -.396 | -1.407 | .168 | .369 | 1.315 | .196 |
| Spore | .001 | 2.076 | .045 | .002 | 1.778 | .083 |
| TGRSP | .239 | 3.906 | .000 | .162 | 5.550 | .000 |
Table 2.
Effect of soil management practices on the total GRSP concentration and its contribution to soil carbon. a. Calculated based on glomalin containing 43.1% [27].
Table 2.
Effect of soil management practices on the total GRSP concentration and its contribution to soil carbon. a. Calculated based on glomalin containing 43.1% [27].
| Variables | Management Practices | Depths (cm) | Means |
|---|---|---|---|
| T-GRSP (mg g-1) | Irrigated |
0 – 10 | 2,07 ± 0,16a |
| 10 – 20 | 1,64 ± 0,14b | ||
| 20 – 30 | 1,64 ± 0,14b | ||
| Mean* | 1,78 ± 0,25A | ||
| Rainfed |
0 – 10 | 1,60 ± 0,13a | |
| 10 – 20 | 1,18 ± 0,18b | ||
| 20 – 30 | 0,44 ± 0,06c | ||
| Mean | 1,07 ± 0,50B | ||
| C_T-GRSP (mg g-1) | Irrigated |
0 – 10 | 0,89 ± 0,07 a |
| 10 – 20 | 0,71 ± 0,06b | ||
| 20 – 30 | 0,71 ± 0,06b | ||
| Mean | 0,77 ± 0,11A | ||
| Rainfed |
0 – 10 | 0,69 ± 0,06a | |
| 10 – 20 | 0,51 ± 0,08b | ||
| 20 – 30 | 0,19 ± 0,03c | ||
| Mean | 0,46 ± 0,22B | ||
| C_T-GRSP/CS (%) | Irrigated |
0 – 10 | 2,56 ± 0,32c |
| 10 – 20 | 3,19 ± 0,25b | ||
| 20 – 30 | 3,82 ± 0,39a | ||
| Mean | 3,19 ± 0,61A | ||
| Rainfed |
0 – 10 | 2,27 ± 0,40b | |
| 10 – 20 | 2,46 ± 0,44a | ||
| 20 – 30 | 1,12 ± 0,17c | ||
| Mean | 1,95 ± 0,69B | ||
| EE-GRSP (mg g-1) | Irrigated |
0 – 10 | 1,17 ± 0,23a |
| 10 – 20 | 0,60 ± 0,14b | ||
| 20 – 30 | 0,42 ± 0,07c | ||
| Mean | 0,73 ± 0,36A | ||
| Rainfed |
0 – 10 | 1,12 ± 0,23a | |
| 10 – 20 | 0,72 ± 0,14b | ||
| 20 – 30 | 0,45 ± 0,07c | ||
| Mean | 0,76 ± 0,32A | ||
| C_EE-GRSP (mg g-1) | Irrigated |
0 – 10 | 0,50 ± 0,10a |
| 10 – 20 | 0,26 ± 0,06b | ||
| 20 – 30 | 0,18 ± 0,03c | ||
| Mean | 0,31 ± 0,15A | ||
| Rainfed |
0 – 10 | 0,48 ± 0,10a | |
| 10 – 20 | 0,31 ± 0,06a | ||
| 20 – 30 | 0,19 ± 0,03b | ||
| Mean | 0,33 ± 0,14A | ||
| C_EE-GRSP/CS (%) | Irrigated |
0 – 10 | 1,44 ± 0,31a |
| 10 – 20 | 1,17 ± 0,30ab | ||
| 20 – 30 | 0,97 ± 0,18 b | ||
| Mean | 1,19 ± 0,33B | ||
| Rainfed |
0 – 10 | 1,59 ± 0,40a | |
| 10 – 20 | 1,50 ± 0,36a | ||
| 20 – 30 | 1,15 ± 0,15b | ||
| Mean | 1,41 ± 0,37A |
*Means followed by the same uppercase letters do not differ significantly at the 5% level between management practices. Means followed by the same lowercase letters do not differ significantly for depths within the same management practice.
Table 3.
Microbial Diversity Metrics Across Land Use Systems.
| Bacterial Community | Fungal Community | |||||
| Protected Area | Rainfed | Irrigated | Protected Area | Rainfed | Irrigated | |
| Taxa_S | 51 | 45 | 61 | 277 | 201 | 317 |
| Individuals | 10208 | 5060 | 3841 | 72800 | 68119 | 102151 |
| Dominance_D | 0.09573 | 0.1142 | 0.05446 | 0.397 | 0.2955 | 0.2208 |
| Simpson_1-D | 0.9043 | 0.8858 | 0.9455 | 0.603 | 0.7045 | 0.7792 |
| Shannon_H’ | 2.84 | 2.89 | 3.44 | 2.11 | 2.46 | 2.80 |
| Evenness_e^H/S | 0.3357 | 0.3984 | 0.5113 | 0.02971 | 0.05842 | 0.0518 |
Disclaimer/Publisher’s Note: The statements, opinions and data contained in all publications are solely those of the individual author(s) and contributor(s) and not of MDPI and/or the editor(s). MDPI and/or the editor(s) disclaim responsibility for any injury to people or property resulting from any ideas, methods, instructions or products referred to in the content. |
© 2025 by the authors. Licensee MDPI, Basel, Switzerland. This article is an open access article distributed under the terms and conditions of the Creative Commons Attribution (CC BY) license (http://creativecommons.org/licenses/by/4.0/).
Copyright: This open access article is published under a Creative Commons CC BY 4.0 license, which permit the free download, distribution, and reuse, provided that the author and preprint are cited in any reuse.


