
Submitted:
30 January 2023
Posted:
01 February 2023
You are already at the latest version
Abstract
The flexitarian diet, which emphasizes a reduction in meat consumption, has been identified as a crucial factor in transitioning to sustainable food systems that can help combat climate change and improve food and nutritional security, particularly in areas where food choices are abundant. Despite Brazil being a major meat producer, meat consumption among Brazilians has been decreasing in recent years, with a growing portion of the population adopting meat-free and meat-reduced dietary models. In this study, we conducted the first non-industry funded scientific investigation of Brazilian flexitarians, with the goal of characterizing their socio-economic and demographic characteristics, motivations for adopting flexitarianism, frequency of animal-based meat consumption, and main substitutes consumed. Data was collected from 1029 self-identified flexitarians in Brazil. Our findings indicate that the flexitarian food model is primarily adopted by women and is motivated by concerns about the environmental impact of meat consumption, personal health, and animal welfare. Flexitarians were found to have a consumption profile that can be divided into three groups: low (consuming meat 36 times a week), medium (consuming meat 7 times a week), and high (consuming meat 4 times a week). The flexitarian meals pattern is characterized by lower consumption of beef (less than 2 times per week) and higher consumption of chicken (3 times per week) and is supplemented by plant-based protein sources and eggs as the main meat substitutes.
Keywords:
Meat consumption
; Flexitarianism
; Sustainable Development
; Protein transition
; Brazil
1. Introduction
In recent years, there has been ongoing discussion about the need to shift population food patterns in order to create sustainable systems that respect planetary limits and enhance food and nutritional security [1,2,3]. The increasing threat of environmental crises [4] and global food insecurity [5] has made it clear that it is necessary to reduce the consumption of animal-based foods [2,5], particularly in situations where food choices are abundant.
Flexitarianism may be a potential path towards transitioning to sustainable food systems. This term is based on the concept of "flexible vegetarianism," in which practitioners occasionally consume meat [6]. Flexitarianism is a dietary model that involves significantly reducing meat consumption, either in terms of the amount consumed (kg) or the number of meals per week [7,8], and increasing the consumption of seasonal plant-based foods [5], gaining increasing attention in recent years around the world. The interest on this topic, for instance, can be seen in the search metrics for the term on Google Trends [9] since 2019 and by the growing number of studies being conducted on the topic literature [8,10,11,12].
The flexitarian diet has the potential to increase the effectiveness of nutritional interventions that focus on reducing meat consumption [13] and for mitigating climate change [14] especially in high-income countries [5]. While it may seem difficult to envision a dietary pattern with reduced meat consumption in countries like Brazil, which has intensive livestock farming and high meat consumption [15], flexitarianism may present itself as a possibility for constructing healthy and sustainable food practices [16]. However, studies of this nature have focused on food systems in the global North [12], demonstrating the need for research on the socio-environmental issues related to animal-based food systems in the Global South [17], where meat plays a complex role [18]. In response to the call for prioritizing research to overcome these problems in the Global South [19], we focus our analysis on identifying socio-economic factors related to adherence to flexitarianism in Brazil. To date, this is the first non-industry funded scientific study 1 that conducted a population-based survey on flexitarianism and its characteristics in Brazil. Our research aims to answer four questions: (i) What are the main socio-economic and demographic characteristics of Brazilian flexitarians? (ii) What motivations lead these individuals to adopt flexitarianism? (iii) What is the frequency of consumption of animal-based meats? (iv) What are the main substitutes consumed by the flexitarian population?
2. Materials and Methods
2.1. Sampling and inclusion criteria
The target population of our study are people who identify as flexitarians and live in Brazil. We established the following inclusion criteria for participants in the characterization of Brazilian flexitarians in this cross-sectional study: [i] people with a minimum age of 18 years; [ii] residents in the country; [iii] who intentionally exclude meat from at least one meal during the week; and [iv] who are not vegetarian or vegan. We included this last criterion so that only the target audience (i.e., flexitarians) would participate in the study, thus avoiding the risk of characterizing them inaccurately.
To calculate the sample size, we established the minimum number of 576 valid responses, considering a confidence level of 5% (d), design effect (EDFF) equal to 1, and hypothetical frequency of 50% (p) in an infinite population (N), using the formula presented by Kasiulevičius et al. [20], calculated with the help of the OpenEpi® program.
We considered 50% as the expected frequency for two reasons: (i) there are no previous primary data studies that can estimate the flexitarian population in Brazil; and (2) the larger the variability of a frequency, the larger the number of samples required. The proportion of 50% indicates the maximum variability in a population and is frequently used to estimate outcomes with unknown frequencies, as it determines a sample size that may be larger than if the true variability of the population attribute were used. Finally, we increased n (n=384) by 50% – reaching the final n of 576 to ensure bias control and high non-response rates.
2.2. Data Collection
2.2.1. Participant recruitment strategies
We conducted a pilot study (n=58) to identify any inconsistencies in our questionnaire and assess the reach of our outreach strategy. This allowed us to identify ways to reduce biases caused by gaps in reach by seeking new partners for outreach and volunteers to cover regions where we had low response rates. We also included social media platforms that were not initially included in our work plan, which included the use of only two social networks (Instagram and Facebook). This step took place between March 19th and 25th, 2022. From March 26th to June 30th, 2022, we conducted our data collection with the support of various groups, educational and research institutions, professional boards, and digital influencers. We had at least one volunteer in each Brazilian state to help promote our collection instrument in both the pre-collection and collection stages. Through this strategy, we were able to cover all regions and states of the country, achieving a total of 1048 responses, of which 1029 were considered valid for meeting the research participation criteria. Based on the established criteria, this convenience sample reached almost double the estimated sample size in our design. The strategies used for recruiting participants were conducted online through the promotion of the research questionnaire on social media (Instagram, Facebook, Twitter, Telegram, and WhatsApp), websites, and institutional emails, as well as through paid research advertisements on Instagram. All strategies were assisted by volunteers.
2.2.2. Instrument for data collection
We used an online form (Google Forms) with two modules of questions: a module with socio-economic and demographic questions and a second module with the Food Frequency Questionnaire (FFQ) focused on the frequency of consumption of meats, processed foods, and potential substitutes for these foods. In the first module, we collected self-reported information on "ethnicity" (white, Asian, multiethnic, black, indigenous, and preferred not to answer), "education" (elementary, high school, undergraduate, master's degree, doctorate), "area of residence" (with the options: rural, urban), "income" (USD), "political orientation" (left, neutral, right), "gender" (cisgender woman, transgender woman, cisgender man, transgender man, non-binary, and preferred not to answer), "sexual orientation" (heterosexual, LGBT, preferred not to answer), "federal unit" (UFs), and "age" (years). We grouped the UFs based on the geographical regions of the country, creating the variable "region" (central, northeast, north, southeast, and south) and converted the income to Brazilian reais (R$) to US dollars (USD), using the exchange rate of 29/12/2022, where 1 dollar is equivalent to the value of 5.28 Brazilian reais [21].
In a second module we used a portion of the "Adult Food Frequency Questionnaire" by Fisberg et al. [22], maintaining the formatting and text of the original questions, and selecting only the food items of interest for this research. The instrument was previously evaluated for reproducibility [23]. However, as it did not contain some essential food item specifications for the research, we opted to add the descriptions of these foods as they are used in the collection instrument of the Brazilian Institute of Geography and Statistics - IBGE, expressing the national standard; in some cases, we also grouped items that express our analytical categories also extracted from the IBGE without any prejudice to the pre-existing information in the FFQ.
In this dietary survey, we only collected data once from each participant. We presented four time measures (day, week, month, and year) and frequencies of consumption ranging from "Never" to "10 times" to gather information on food consumption (Box Supplementary 1). Each participant chose the time measure that best corresponded to their consumption. In order to standardize the time measures, those were converted to "week". For example, responses for the "day" measure were multiplied by 7 (number of days in a week) and grouped in a new database; the "month" measure was divided by 4 (number of weeks in a month); and the "year" measure was divided by 52 (number of weeks in a year). We classified flexitarians into three groups (i.e., low, medium, and high) based on their weekly meat consumption average. The high-flex consumption profile corresponds to the average of the first tertile, the medium-flex profile corresponds to the average of the second tertile, and the low-flex profile corresponds to the average of the last tertile. We used this classification as the dependent variable (i.e., "frequency of meat consumption per meal per week") and "gender," "income," and "education" as independent variables.
2.3. Data Analysis
For categorical variables, we used Kruskal-Wallis tests followed by Dunn's post-hoc tests and considered p < 0.001 as significant. For the numerical variable "income," we conducted a Spearman correlation test with 99% confidence. We checked the normality of our data using the Kolmogorov-Smirnov test and conducted all analyses using R in the RStudio interface (version R 4.1.0). We analyzed the presence of outliers and found that the variability present in our results is not the result of systematic errors, but rather natural variability in food consumption, so we decided not to exclude them.
3. Results
3.1. Socioeconomic and demographic characteristics of flexitarians
Flexitarians self-identified as white at a rate of 60%. They primarily lived in urban areas and were concentrated in the Northeast (44%) and Southeast (28%) regions. This population was predominantly female (76%), with sexual orientation divided between heterosexual (72%) and LGBT (24%). They also aligned with the political left (68%), as shown in Table 1.
In summary, the majority of the population that considers itself flexitarian investigated in our research was composed of people who self-identified as white, lived in urban areas in the Northeast and Southeast regions, and had a high level of formal education, with 52% being undergraduate and 21% having a master's degree. Educational level varied by gender: 52% of female flexitarians were undergraduate, 20% had a master's degree, and 15% had a doctorate; while 50% of male flexitarians were undergraduate, 26% had a master's degree, and 12% had a doctorate. The average family/total income of these people was USD 1723.44, equivalent to seven and a half minimum wages in 2022. Per capita income ranged from USD 236.74 to USD 8207.07.
3.2. Factors that motivate adherence to flexitarianism
The decision to adhere to a flexitarian diet was motivated by different factors among this population: 35% of participants cited environmental concerns related to the production and consumption of meat as their motivation; 33% were motivated by personal health concerns; and 21% were motivated by ethical considerations for animal welfare. Other factors such as religion, beliefs, and spirituality (4%), and aversions, allergies, or intolerances to meat intake (5%) were also cited as motivations.
3.3. Meat consumption frequency: consumption profile among different groups
Based on the different consumption trends presented by the flexitarian population investigated in this research, we divided flexitarians into three groups: (i) low flexitarians: those who consume meat thirty-six times during the week; (ii) medium flexitarians: those who consume meat seven times during the week; and (iii) high flexitarians: those who consume meat four times during the week. Each of these groups exhibits variations in the type and frequency of meat consumed, as shown in Figure 1.
Low consume more chicken (5x) beef (3x) and processed meat (2x); medium consume more chicken (2x), highlighting a lower consumption of processed meat (less than once a week); and high flex maintains the trend of greater consumption of chicken (1x) and fish (1x), with less than once a week consumption of the other groups, except for processed meats that were never consumed.
Despite the difference in average frequency of consumption between these groups, they have a homogenous consumption profile in terms of the types of meat consumed. This trend is also similar when comparing the reduction profile among the different groups of the flexitarian population, especially in relation to the gender of the participants (Figure 2).
Our results suggest that although there is a predominantly female population in the characterization of flexitarianism in our research, there is no significant relationship between gender (p>0.001) and meat consumption frequency. Men and women have similar consumption profiles, mainly for beef and fish with an average of less than two meals per week. When compared to men, women tend to consume less (p<0.001) pork, goat, and hunted animal meat. Among all types of meat, chicken is the most consumed by flexitarians, with an average of more than three meals per week. In this population, higher levels of formal education may influence the consumption of certain types of meat. Our results suggest that, similar to the analysis of flexitarianism trends based on gender, the consumption profile in different levels of education is homogeneous among the groups. As shown in Figure 2, pork is consumed more by those with elementary education; chicken is consumed more by those with high school and undergraduate; beef is consumed more by those with a master's degree; and fish is consumed more by those with a PhD. Our results showed that fish consumption, which is more common among flexitarians with a higher level of education, has significant differences (p<0.001) only between those with middle education and those with a PhD. Additionally, when we analyzed the relationship between meat consumption frequency and the per capita income of flexitarians, we did not find a correlation between meat reduction behavior and the income of these individuals (Supplementary Table 2).
3.3. Main meat substitutes
There is a similarity in the frequency of meat consumption between men and women, and this trend is also observed in the consumption trends of eggs and plant proteins among these gender groups, as shown in Figure 3.
Women consume an average of five meals with eggs per week, which is above the general population average, while men consume eggs four times a week and have a higher consumption of beans (5x). Plant-based protein sources such as legumes and soy-based veggie burgers are consumed in approximately one meal per week. The main reported substitutes in open-ended questions include legumes, grains, and vegetables.
The analysis of meat substitutes based on the per capita income of our participants showed significant results (p<0.001) concerning the consumption of beans and other vegetable protein sources such as mushrooms and tofu (Table Supplementary 2). Our results indicate the existence of a negative correlation between bean consumption and lower-income strata among flexitarians. That is, the lower the income of our participants, the greater the frequency of consumption of beans. On the other hand, the frequency of consumption of mushrooms, non-conventional food plants, and tofu is higher among flexitarians who have the highest income.
Animal-based substitutes were also widely cited as an alternative to beef, with a focus on eggs and cheeses. In addition, 60% of our participants state that flexitarianism is or can be a transitional path to a plant-based diet, such as vegan or vegetarian diets.
4. Discussion
In general, our results show that: (i) the flexitarian dietary model is characterized by high rates of adoption among highly educated women living in urban areas; (ii) these individuals are primarily motivated by concerns related to the environmental impact of meat consumption; (iii) flexitarians have different meat consumption profiles and their frequency varies depending on the adherence profile that we characterize in three groups: low flex (those who consume meat 36 times per week), medium flex (those who consume meat 7 times per week), and high flex (those who consume meat 4 times per week), and (iv) eggs and plant-based protein sources (beans and other legumes) are the main substitutes for meat in this population. These factors provide important insights into who these people are, what they consume, and the reasons behind this behavior.
Our findings on the socioeconomic profile identified in our survey align with a number of studies that present a relatively homogeneous profile characteristic of meat reduction [11,24,25,26,27]. In summary, these studies show that this population is made up of individuals with a high level of formal education, relatively high income, and mostly women. The relatively high income of flexitarians in our study (U$D 740.67), when compared to the average income of the Brazilian population overall (U$D 256.25) [28], as well as in the overall literature, may suggest that purchasing power is not an issue for this population. Furthermore, social factors such as self-reported left-wing political spectrum and LGBT orientation as distinct characteristics of flexitarian identity may indicate that this dietary flexibility may also be linked to cognitive and psychological issues, as discussed by Rosenfeld, Rothgerber, and Tomiyama [29].
Our findings show that Brazilian flexitarians have motivations that align with global literature on the subject. The main reasons for adopting a low-meat diet among Brazilian flexitarians are related to the ethical implications of meat consumption, encompassing environmental concerns and animal welfare. These two factors together correspond to 56% of all the motivations that guided our participants' choices, followed by individual health concerns (33%). Similar findings have been found by Duckett, Lorenzo-Arribas, Horgan, and Conniff [30] and Kemper & White [26], who analyzed the motivations associated with adherence to flexitarianism and identified that they include (i) awareness of the environmental impacts of meat consumption; (ii) individual health concerns; and (iii) animal welfare concerns. Other studies [29,31,32,33,34] also confirm these factors. In summary, these studies identify that reduced meat consumption trends have two main sets of factors: (i) ethical and moral motivations related to the environment and animal welfare concerns, and (ii) individual issues including health concerns, a dislike for the taste of meat, and religious restrictions.
The meat consumption frequency of Brazilian flexitarians is similar to the worldwide trend reported in some studies [7,12,33,35]. These studies, as well as Kemper and White [26], show a greater reduction in beef consumption among flexitarians - with beef being consumed twice a week. The beef consumption trend of our participants also aligns with the guidance provided by the FAO [5], which suggests consuming red meat only once a week, as well as the 28% of the Brazilian population that consumes red meat one or two days per week [36]. Our results showed a higher consumption of white meats, particularly fish, among individuals with higher levels of education – a fact that may be linked to income – and align with the results of the Brazilian National Health Survey, which showed that people with higher levels of income and education have a higher consumption of fish [36]. This suggests the possibility of a wide relationship between socio-economic factors, motivations (e.g., concern for health) and food selection (higher consumption of fish vs. lower consumption of beef). Additionally, despite different levels of reduction in flexitarianism, the trend of higher consumption of white meats and lower consumption of red meats is a homogeneous pattern.
Our findings show that the main plant-based meat substitutes among this population are plant proteins such as legumes, which are consumed between one and five meals per week, as well as soy derivatives. These frequencies of consumption of legumes used as a substitute for meat by flexitarians are not significantly higher than the general population or than national dietary recommendations [36]. The results for the main substitutes for beef also align with the trends presented in studies such as those conducted by Vainio, Niva, Jallinoja, and Latvala [37], whose main sources of protein are legumes, beans, and soy derivatives. The consumption trend of meat substitutes also aligns with the dietary pattern of plant-based diets such as vegetarianism and veganism in different countries [38,39]. This dietary pattern suggests that flexitarianism may be a step towards transitioning to more sustainable food systems, particularly considering that a significant percentage of flexitarians claim that this model is a stepping stone towards vegan and vegetarian diets. Also, the consumption of biodiverse foods or underutilized foods (e.g., unconventional food plants and mushrooms) [40] as meat substitutes may be a good indicator of the dietary quality [41].
Our study provides important insights into the adoption of flexitarianism and the main characteristics of this population in Brazil. However, we have the main limitation of using a non-probability sampling based on a convenience sample with access to smartphones and the internet. Although we have outlined strategies to reduce biases in participant reach by widely promoting the research in all regions of Brazil and in different spaces, we suggest caution in interpreting some results – such as the concentration of participants in the Northeast and Southeast regions – which may reflect the reach of the research and not necessarily the characterization of the target audience. Furthermore, it is important to consider the potential impact of memory bias when using food frequency questionnaires (FFQs) as a method of assessing dietary intake. FFQs are retrospective in nature, meaning that they rely on an individual's memory of their dietary intake over a specific period of time. This reliance on memory can introduce bias into the data collected through FFQs.
5. Conclusions
Our results showed that despite Brazil's deeply rooted culture of meat consumption, flexitarianism can play a crucial role in transitioning to a more sustainable food system. We provided evidence demonstrating that the profile of individuals who consider themselves flexitarians in Brazil is marked by the predominance of white women, a high level of education, and relatively high income. This profile converges with the pattern of flexitarians in the Global North and diverges significantly from the socio-economic pattern of the Brazilian population. Therefore, we suggest caution for educators and decision-makers when using the conclusions of this study to promote flexitarianism among people who rely on meat as an important resource for ensuring a proper diet. We recommend that future research on flexitarianism in the Global South should focus on self-reported adherence to the dietary model rather than the amount of meat consumed. It is important for researchers to consider the potential confounding factor of income when using meat consumption as a measure, and to clearly indicate how they are distinguishing flexitarians from people who may be eating less meat just because they cannot afford it. Our study also found that followers of this eating model have plant protein sources such as legumes as one of the main meat substitutes, which opens the door for research on the development of recipes and alternative meat products that use the richness of Brazilian food biodiversity not only in terms of wild food plants, but also fungi and algae.
Supplementary Materials
The following supporting information can be downloaded at: Preprints.org, Box S1: Food Frequency Questionnaire (FFQ) used in our research; Table S1: Correlation between meat reduction behavior and the income of flexitarians (per capita income quintile). Table S2: Relationship between the frequency of consumption of substitutes for meat and per capita income in the flexitarian population.
Author Contributions
Conceptualization and methodology, Michelle Jacob, Sávio Gomes, Carla Teixeira; Methodology: all authors; formal analysis, Carla Teixeira, Sávio Gomes; writing—original draft preparation, Carla Teixeira.; writing—review and editing, Dirce Marchioni, Michelle Jacob, Savio Gomes, Viviany Moura, Virginia Motta.; project administration, Michelle Jacob.; funding acquisition, Michelle Jacob. Supervision: Michelle Jacob. All authors have read and agreed to the published version of the manuscript.
Funding
This study was funded by the National Council for Scientific and Technological Development through a research grant to MCMJ (402334/2021-3), research productivity scholarship granted also to MCMJ (306755/2021-1), and by the Coordination of Superior Level Staff Improvement through a scholarship of social demand granted to CDT (88887.703245/2022-00). Funders had no role in the study design, data collection and analysis, or the decision to publish or prepare the manuscript.
Institutional Review Board Statement
Our research followed all regulations governing research involving human subjects in Brazil outlined in National Health Council Resolution No. 466/2012. All research protocols were submitted to the Ethics Committee of the Onofre Lopes University Hospital (CEP/HUOL) at the Federal University of Rio Grande do Norte (UFRN) and were approved under the protocol number CAAE 5.348.343.
Informed Consent Statement
Informed consent was obtained from all subjects involved in the study.
Data Availability Statement
The data presented in this study are available on request from the corresponding author.
Acknowledgments
We would like to thank all volunteer researchers who helped publicize the data collection instrument.
Conflicts of Interest
The authors declare no conflict of interest.
1. Recently, The Good Food Institute Brasil carried out a survey focusing on the potential of the plant-based market in the country, which was financed by multinational companies in this sector, such as ADM, GPA, Ingredion, Kerry, NotCo, N.ovo, Plant Plus, R&Amp; S Blumos, Incrível!, Unilever, and Vida Veg. You can find more information at: https://forbes.com.br/forbesagro/2022/12/28-dos-brasileiros-dizem-ser-flexitarianos/. |
References
- Godfray, H. C. J.; Aveyard, P.; Garnett, T.; Hall, J. W.; Key, T. J.; Lorimer, J.; Pierrehumbert, R. T.; Scarborough, P.; Springmann, M.; Jebb, S. A. Meat Consumption, Health, and the Environment. Science 2018, 361, eaam5324. [Google Scholar] [CrossRef]
- Willett, W.; Rockström, J.; Loken, B.; Springmann, M.; Lang, T.; Vermeulen, S.; Garnett, T.; Tilman, D.; DeClerck, F.; Wood, A.; Jonell, M.; Clark, M.; Gordon, L. J.; Fanzo, J.; Hawkes, C.; Zurayk, R.; Rivera, J. A.; De Vries, W.; Majele Sibanda, L.; Afshin, A.; Chaudhary, A.; Herrero, M.; Agustina, R.; Branca, F.; Lartey, A.; Fan, S.; Crona, B.; Fox, E.; Bignet, V.; Troell, M.; Lindahl, T.; Singh, S.; Cornell, S. E.; Srinath Reddy, K.; Narain, S.; Nishtar, S.; Murray, C. J. L. Food in the Anthropocene: The EAT–Lancet Commission on Healthy Diets from Sustainable Food Systems. The Lancet 2019, 393, 447–492. [Google Scholar] [CrossRef]
- Springmann, M.; Spajic, L.; Clark, M. A.; Poore, J.; Herforth, A.; Webb, P.; Rayner, M.; Scarborough, P. The Healthiness and Sustainability of National and Global Food Based Dietary Guidelines: Modelling Study. BMJ 2020, m2322. [Google Scholar] [CrossRef]
- Intergovernmental Panel on Climate Change. Climate Change and Land: IPCC Special Report on Climate Change, Desertification, Land Degradation, Sustainable Land Management, Food Security, and Greenhouse Gas Fluxes in Terrestrial Ecosystems, 1st ed.; Cambridge University Press, 2022. [CrossRef]
- FAO. The State of Food Security and Nutrition in the World 2021; FAO, IFAD, UNICEF, WFP and WHO, 2021. 2021. [CrossRef]
- Blatner, D. J. (2009) The Flexitarian Diet: The Mostly Vegetarian Way to lose weight, be healthier, prevent disease, and add years to your life (1th ed). McGraw-Hill eBooks.
- Dagevos, H. Flexibility in the Frequency of Meat Consumption - Empirical Evidence from The Netherlands. EuroChoices 2014, 13, 40–45. [Google Scholar] [CrossRef]
- Derbyshire, E. J. Flexitarian Diets and Health: A Review of the Evidence-Based Literature. Front. Nutr. 2017, 3. [Google Scholar] [CrossRef]
- Flexitarianism. Retrieved from https://trends.google.com/trends/explore?date=today%205-y&q=flexitarianism. (Accessed November 5, 2022). November.
- Forestell, C. A. Flexitarian Diet and Weight Control: Healthy or Risky Eating Behavior? Front. Nutr. 2018, 5, 59. [Google Scholar] [CrossRef]
- Wozniak, H.; Larpin, C.; de Mestral, C.; Guessous, I.; Reny, J.-L.; Stringhini, S. Vegetarian, Pescatarian and Flexitarian Diets: Sociodemographic Determinants and Association with Cardiovascular Risk Factors in a Swiss Urban Population. Br J Nutr 2020, 124, 844–852. [Google Scholar] [CrossRef]
- Verain, M. C. D.; Dagevos, H.; Jaspers, P. Flexitarianism in the Netherlands in the 2010 Decade: Shifts, Consumer Segments and Motives. Food Quality and Preference 2022, 96, 104445. [Google Scholar] [CrossRef]
- Randers, L.; Thøgersen, J. Meat, Myself, and I: The Role of Multiple Identities in Meat Consumption. Appetite 2023, 180, 106319. [Google Scholar] [CrossRef]
- Raphaely, T.; Marinova, D. Flexitarianism: Decarbonising through Flexible Vegetarianism. Renewable Energy 2014, 67, 90–96. [Google Scholar] [CrossRef]
- Hötzel, M. J.; Vandresen, B. (2022). Brazilians' attitudes to meat consumption and production: Present and future challenges to the sustainability of the meat industry. Meat Science, 192, 108893. ISSN 0309-1740. [CrossRef]
- Ruby, M. B., et al. (2016). Attitudes toward beef and vegetarians in Argentina, Brazil, France, and the USA. Appetite, 96, 546-554. [CrossRef]
- Morris, C.; Kaljonen, M.; Aavik, K.; Balázs, B.; Cole, M.; Coles, B.; Efstathiou, S.; Fallon, T.; Foden, M.; Giraud, E. H.; Goodman, M.; Kershaw, E. H.; Helliwell, R.; Hobson-West, P.; Häyry, M.; Jallinoja, P.; Jones, M.; Kaarlenkaski, T.; Laihonen, M.; Lähteenmäki-Uutela, A.; Kupsala, S.; Lonkila, A.; Martens, L.; McGlacken, R.; Mylan, J.; Niva, M.; Roe, E.; Twine, R.; Vinnari, M.; White, R. Priorities for Social Science and Humanities Research on the Challenges of Moving beyond Animal-Based Food Systems. Humanit Soc Sci Commun 2021, 8, 38. [Google Scholar] [CrossRef]
- Mensah, D. O.; Mintah, F. O.; Oteng, S. A.; Lillywhite, R.; Oyebode, O. ‘We’re Meat, so We Need to Eat Meat to Be Who We Are’: Understanding Motivations That Increase or Reduce Meat Consumption among Emerging Adults in the University of Ghana Food Environment. Meat Science 2022, 193, 108927. [Google Scholar] [CrossRef]
- IPES-Food. The politics of protein: examining claims about livestock, fish, ‘alternative proteins’ and Sustainability. 2022. https://www.ipes-food.org/_img/upload/files/PoliticsOfProtein.pdf.
- Kasiulevičius, V.; Šapoka, V.; Filipavičiūtė, R. Sample size calculation in epidemiological studies. Gerontologija, 2006; 7, 225–231. [Google Scholar]
- Infomoney. Câmbio. Retrieved from https://www.infomoney.com.br/ferramentas/cambio/. 2022. (Accessed December 30, 2022).
- Fisberg, R. M.; Colucci, A. C. A.; Morimoto, J. M.; Marchioni, D. M. L. Questionário de Freqüência Alimentar Para Adultos Com Base Em Estudo Populacional. Rev. Saúde Pública 2008, 42, 550–554. [Google Scholar] [CrossRef]
- Selem, S. S. de C.; Carvalho, A. M. de; Verly-Junior, E.; Carlos, J. V.; Teixeira, J. A.; Marchioni, D. M. L.; Fisberg, R. M. Validity and Reproducibility of a Food Frequency Questionnaire for Adults of São Paulo, Brazil. Rev. bras. epidemiol. 2014, 17 (4), 852–859. [CrossRef]
- Beardsworth, A.; Bryman, A.; Keil, T.; Goode, J.; Haslam, C.; Lancashire, E. Women, Men and Food: The Significance of Gender for Nutritional Attitudes and Choices. British Food Journal 2002, 104, 470–491. [Google Scholar] [CrossRef]
- Latvala, T.; Niva, M.; Mäkelä, J.; Pouta, E.; Heikkilä, J.; Kotro, J.; Forsman-Hugg, S. Diversifying Meat Consumption Patterns: Consumers’ Self-Reported Past Behaviour and Intentions for Change. Meat Science 2012, 92, 71–77. [Google Scholar] [CrossRef]
- Kemper, J. A.; White, S. K. Young Adults’ Experiences with Flexitarianism: The 4Cs. Appetite 2021, 160, 105073. [Google Scholar] [CrossRef]
- Mullee, A.; Vermeire, L.; Vanaelst, B.; Mullie, P.; Deriemaeker, P.; Leenaert, T.; De Henauw, S.; Dunne, A.; Gunter, M. J.; Clarys, P.; Huybrechts, I. Vegetarianism and Meat Consumption: A Comparison of Attitudes and Beliefs between Vegetarian, Semi-Vegetarian, and Omnivorous Subjects in Belgium. Appetite 2017, 114, 299–305. [Google Scholar] [CrossRef]
- IBGE, Agência. PNAD Contínua: Em 2021, rendimento domiciliar per capita cai ao menor nível desde 2012. Estatísticas Sociais. 2022. Retrieved from https://agenciadenoticias.ibge.gov.br/agencia-noticias/2012-agencia-de-noticias/noticias/34052-em-2021-rendimento-domiciliar-per-capita-cai-ao-menor-nivel-desde-2012. (Accessed 10 December, 2022).
- Rosenfeld, D. L.; Rothgerber, H.; Tomiyama, A. J. Mostly Vegetarian, But Flexible About It: Investigating How Meat-Reducers Express Social Identity Around Their Diets. Social Psychological and Personality Science 2020, 11, 406–415. [Google Scholar] [CrossRef]
- Duckett, D. G.; Lorenzo-Arribas, A.; Horgan, G.; Conniff, A. Amplification without the Event: The Rise of the Flexitarian. Journal of Risk Research 2021, 24, 1049–1071. [Google Scholar] [CrossRef]
- Rosenfeld, D. L. The Psychology of Vegetarianism: Recent Advances and Future Directions. Appetite 2018, 131, 125–138. [Google Scholar] [CrossRef]
- De Backer, C. J. S.; Hudders, L. Meat Morals: Relationship between Meat Consumption Consumer Attitudes towards Human and Animal Welfare and Moral Behavior. Meat Science 2015, 99, 68–74. [Google Scholar] [CrossRef]
- Malek, L.; Umberger, W. J. How Flexible Are Flexitarians? Examining Diversity in Dietary Patterns, Motivations and Future Intentions. Cleaner and Responsible Consumption 2021, 3, 100038. [Google Scholar] [CrossRef]
- Hanras, E.; Mathieu, S.; Chevrier, B.; Boujut, E.; Dorard, G. Vegans, Strict Vegetarians, Partial Vegetarians, Omnivores: Do They Differ in Food Choice Motives, Coping, and Quality of Life? La Presse Médicale Open 2022, 3, 100033. [Google Scholar] [CrossRef]
- Dakin, B. C.; Ching, A. E.; Teperman, E.; Klebl, C.; Moshel, M.; Bastian, B. Prescribing Vegetarian or Flexitarian Diets Leads to Sustained Reduction in Meat Intake. Appetite 2021, 164, 105285. [Google Scholar] [CrossRef]
- Santin, F.; Gabe, K. T.; Levy, R. B.; Jaime, P. C. Food Consumption Markers and Associated Factors in Brazil: Distribution and Evolution, Brazilian National Health Survey, 2013 and 2019. Cad. Saúde Pública 2022, 38 (suppl 1), e00118821. [Google Scholar] [CrossRef]
- Vainio, A.; Niva, M.; Jallinoja, P.; Latvala, T. From Beef to Beans: Eating Motives and the Replacement of Animal Proteins with Plant Proteins among Finnish Consumers. Appetite 2016, 106, 92–100. [Google Scholar] [CrossRef]
- Weinrich, R. Cross-Cultural Comparison between German, French and Dutch Consumer Preferences for Meat Substitutes. Sustainability 2018, 10, 1819. [Google Scholar] [CrossRef]
- Groufh-Jacobsen, S.; Bahr Bugge, A.; Morseth, M. S.; Pedersen, J. T.; Henjum, S. Dietary Habits and Self-Reported Health Measures Among Norwegian Adults Adhering to Plant-Based Diets. Front. Nutr. 2022, 9, 813482. [Google Scholar] [CrossRef]
- FAO. Guidelines on assessing biodiverse foods in dietary intake surveys. ISBN 978-92-5-109598-0. Rome: FAO. 2017.
- Lachat, C.; Raneri, J. E.; Smith, K. W.; Kolsteren, P.; Van Damme, P.; Verzelen, K.; Penafiel, D.; Vanhove, W.; Kennedy, G.; Hunter, D.; Odhiambo, F. O.; Ntandou-Bouzitou, G.; De Baets, B.; Ratnasekera, D.; Ky, H. T.; Remans, R.; Termote, C. Dietary Species Richness as a Measure of Food Biodiversity and Nutritional Quality of Diets. Proc. Natl. Acad. Sci. U.S.A. 2018, 115, 127–132. [Google Scholar] [CrossRef]
Figure 1.
Average frequency of consumption of meat (i.e., chicken, beef, fish, pork, goat, and wild meat) and processed meat, in meals per week, considering the three profiles found in our sample (low, medium, high), in Brazil in 2022.
Figure 1.
Average frequency of consumption of meat (i.e., chicken, beef, fish, pork, goat, and wild meat) and processed meat, in meals per week, considering the three profiles found in our sample (low, medium, high), in Brazil in 2022.
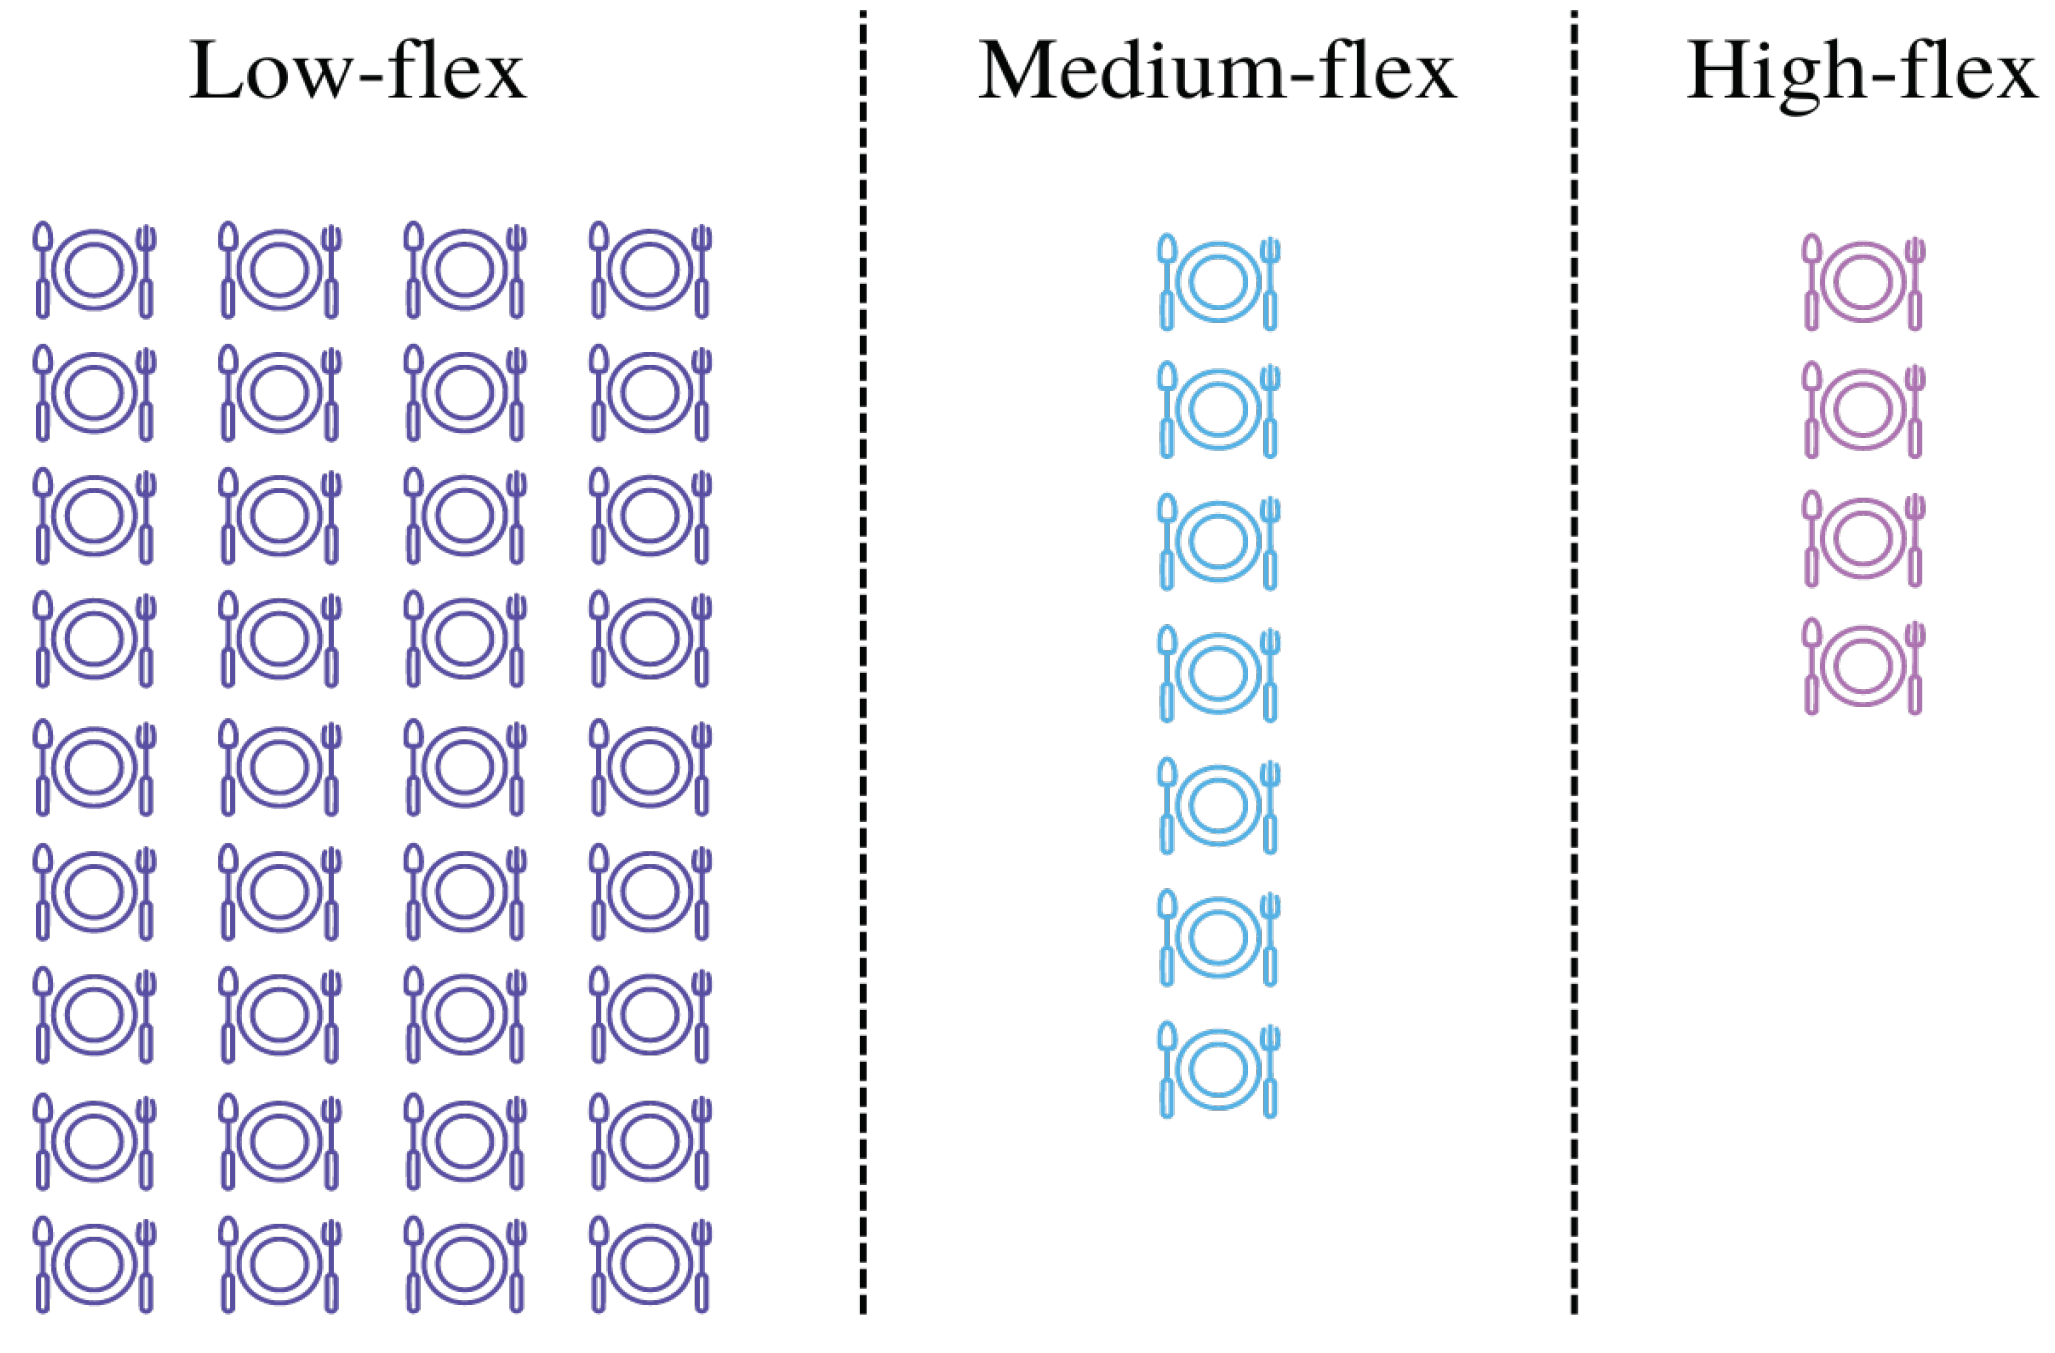
Figure 2.
(A) Average frequency of consumption of meat (i.e., chicken, beef, fish, pork, goat, and wild meat) and processed meat, in meals per week, among Brazilian flexitarians, considering gender differences, in Brazil in 2022.There is no significant difference in the types of meat consumed between males and females among flexitarians. (B) Average frequency of consumption of meat and processed meat, in meals per week, among the Brazilian flexitarian population, based on level of education. Although chicken is the most commonly consumed meat, in general, there is no significant difference in the types of meat consumed among flexitarians of different education levels, except for fish, which shows significant differences between those with high school and doctorate degrees.
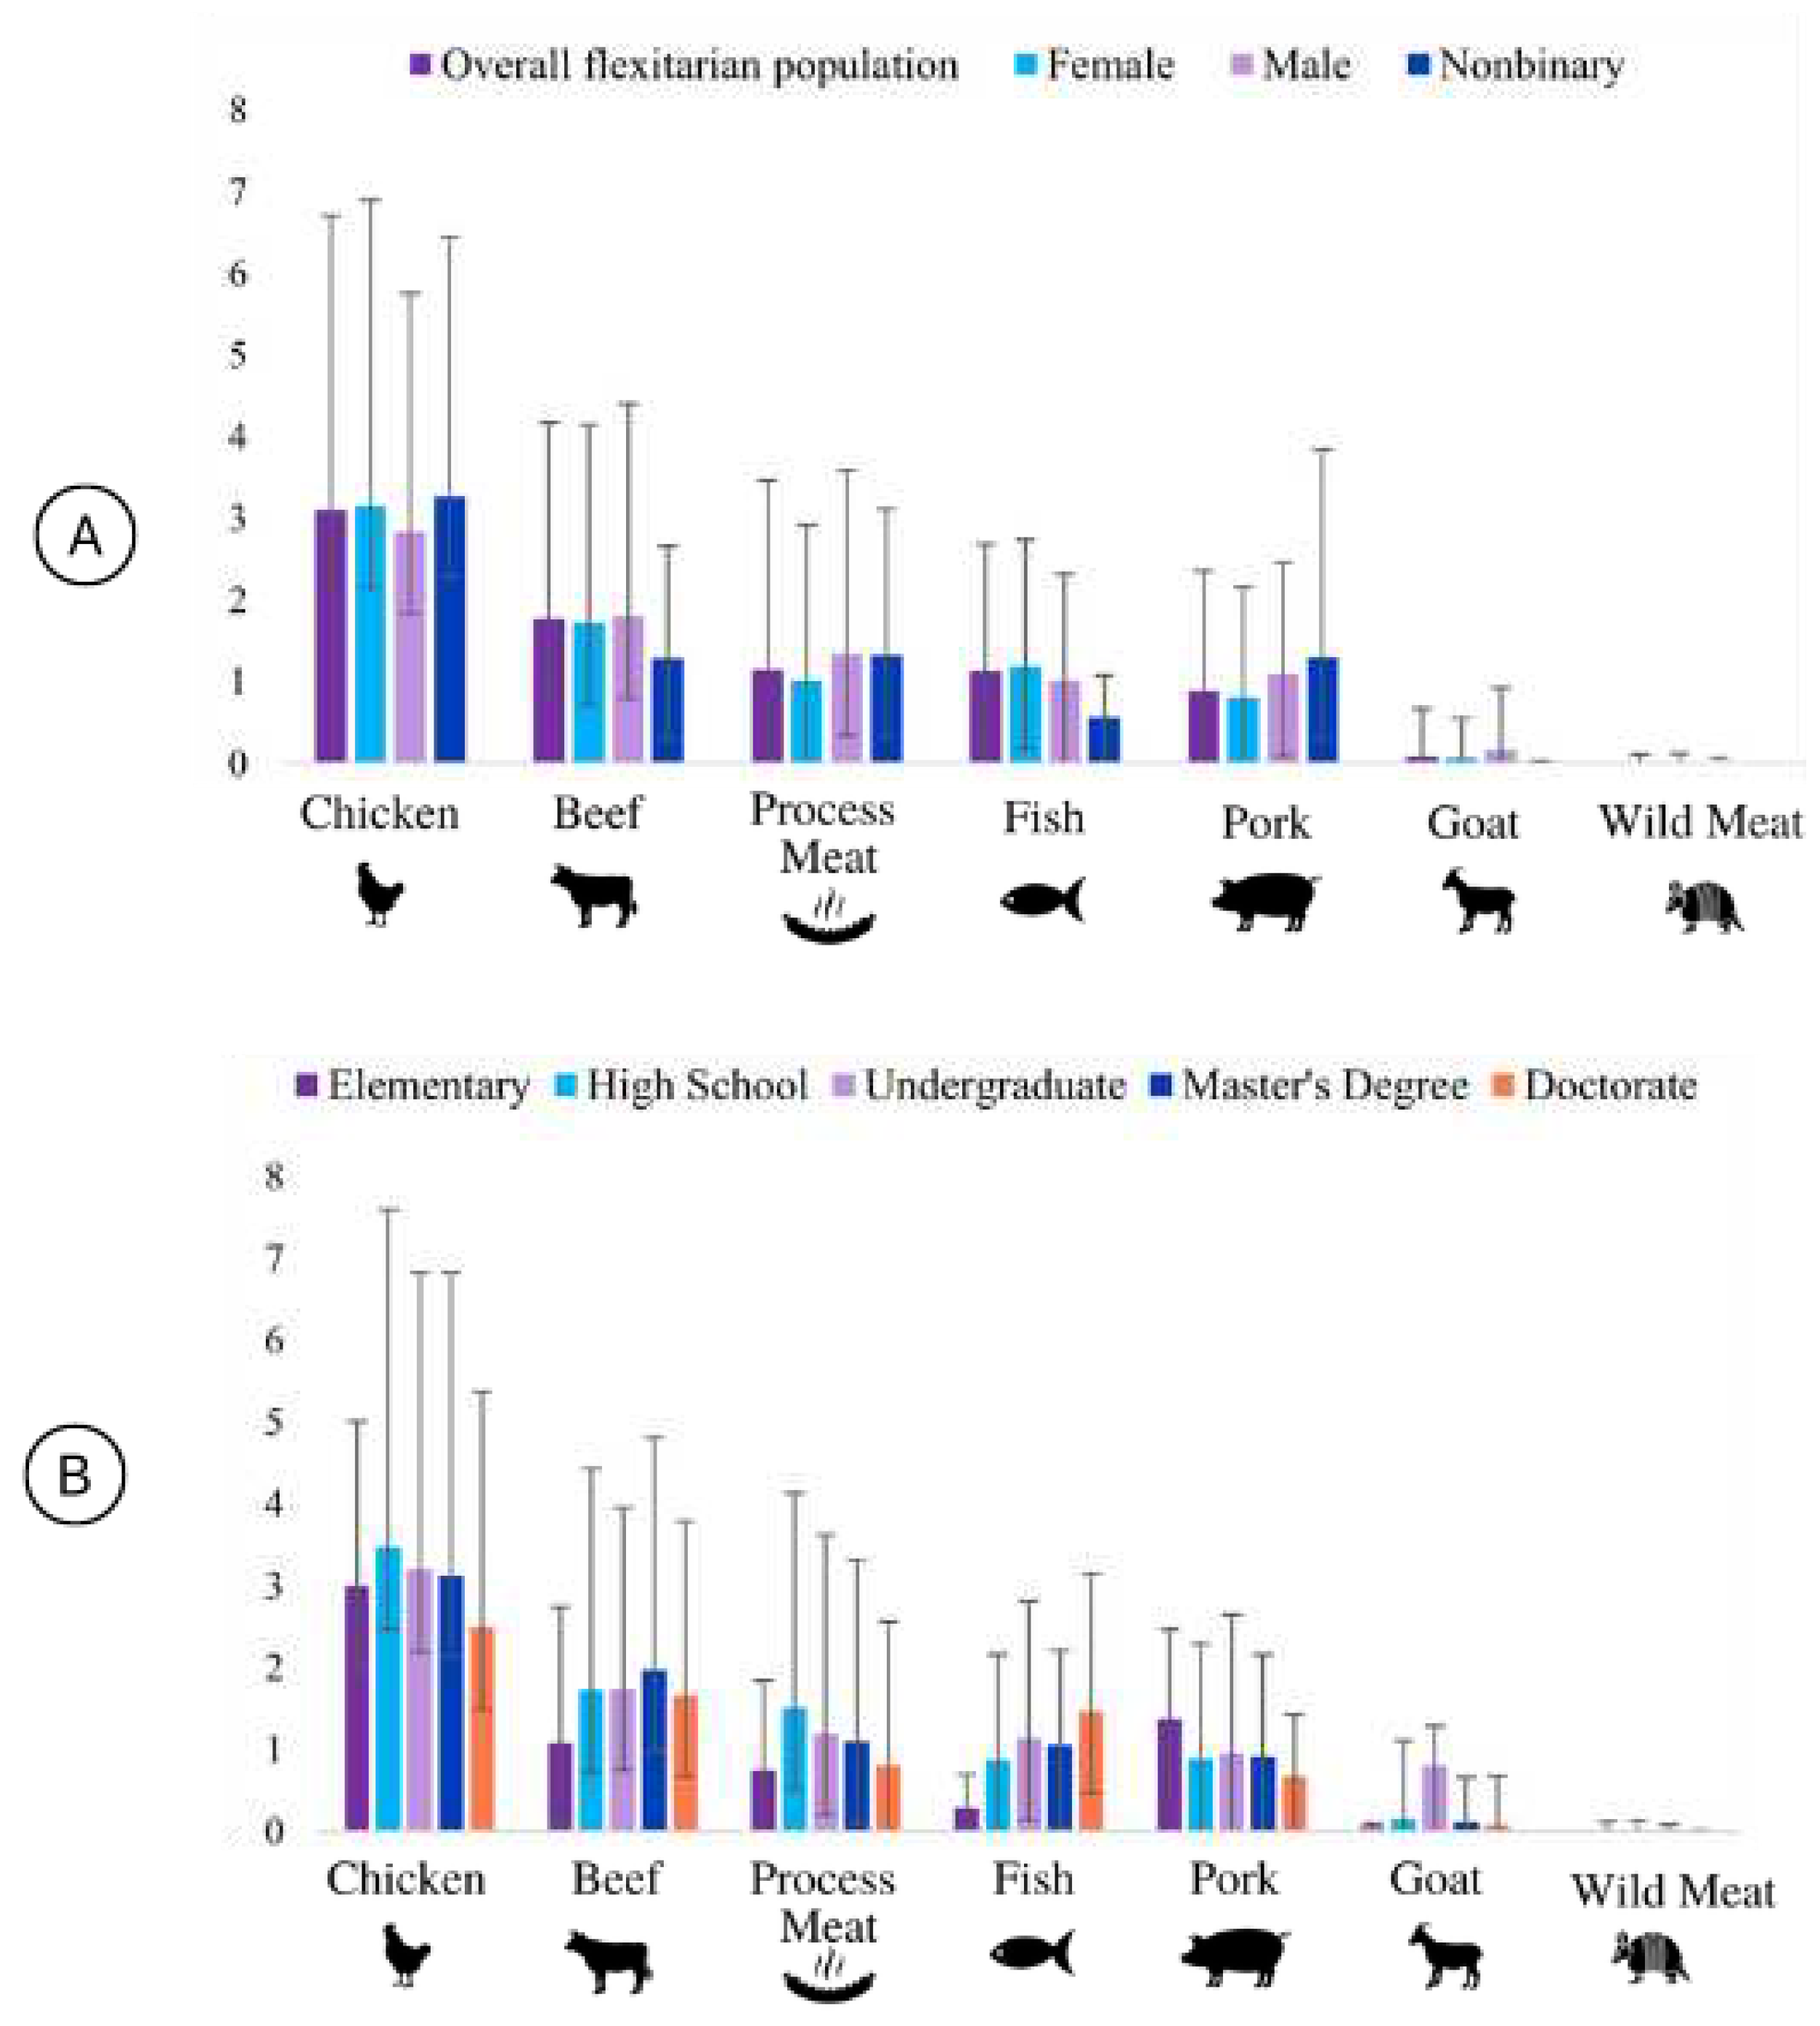
Figure 3.
Average frequency of consumption, in meals per week, of eggs, beans and other legumes, plant-based proteins (i.e., beef, tofu), mushrooms, and unconventional food plants, among the Brazilian flexitarian population, considering gender differences, in Brazil in 2022. Egg and beans were reported as the main substitute of meat. Beans are the substitute most consumed by men.
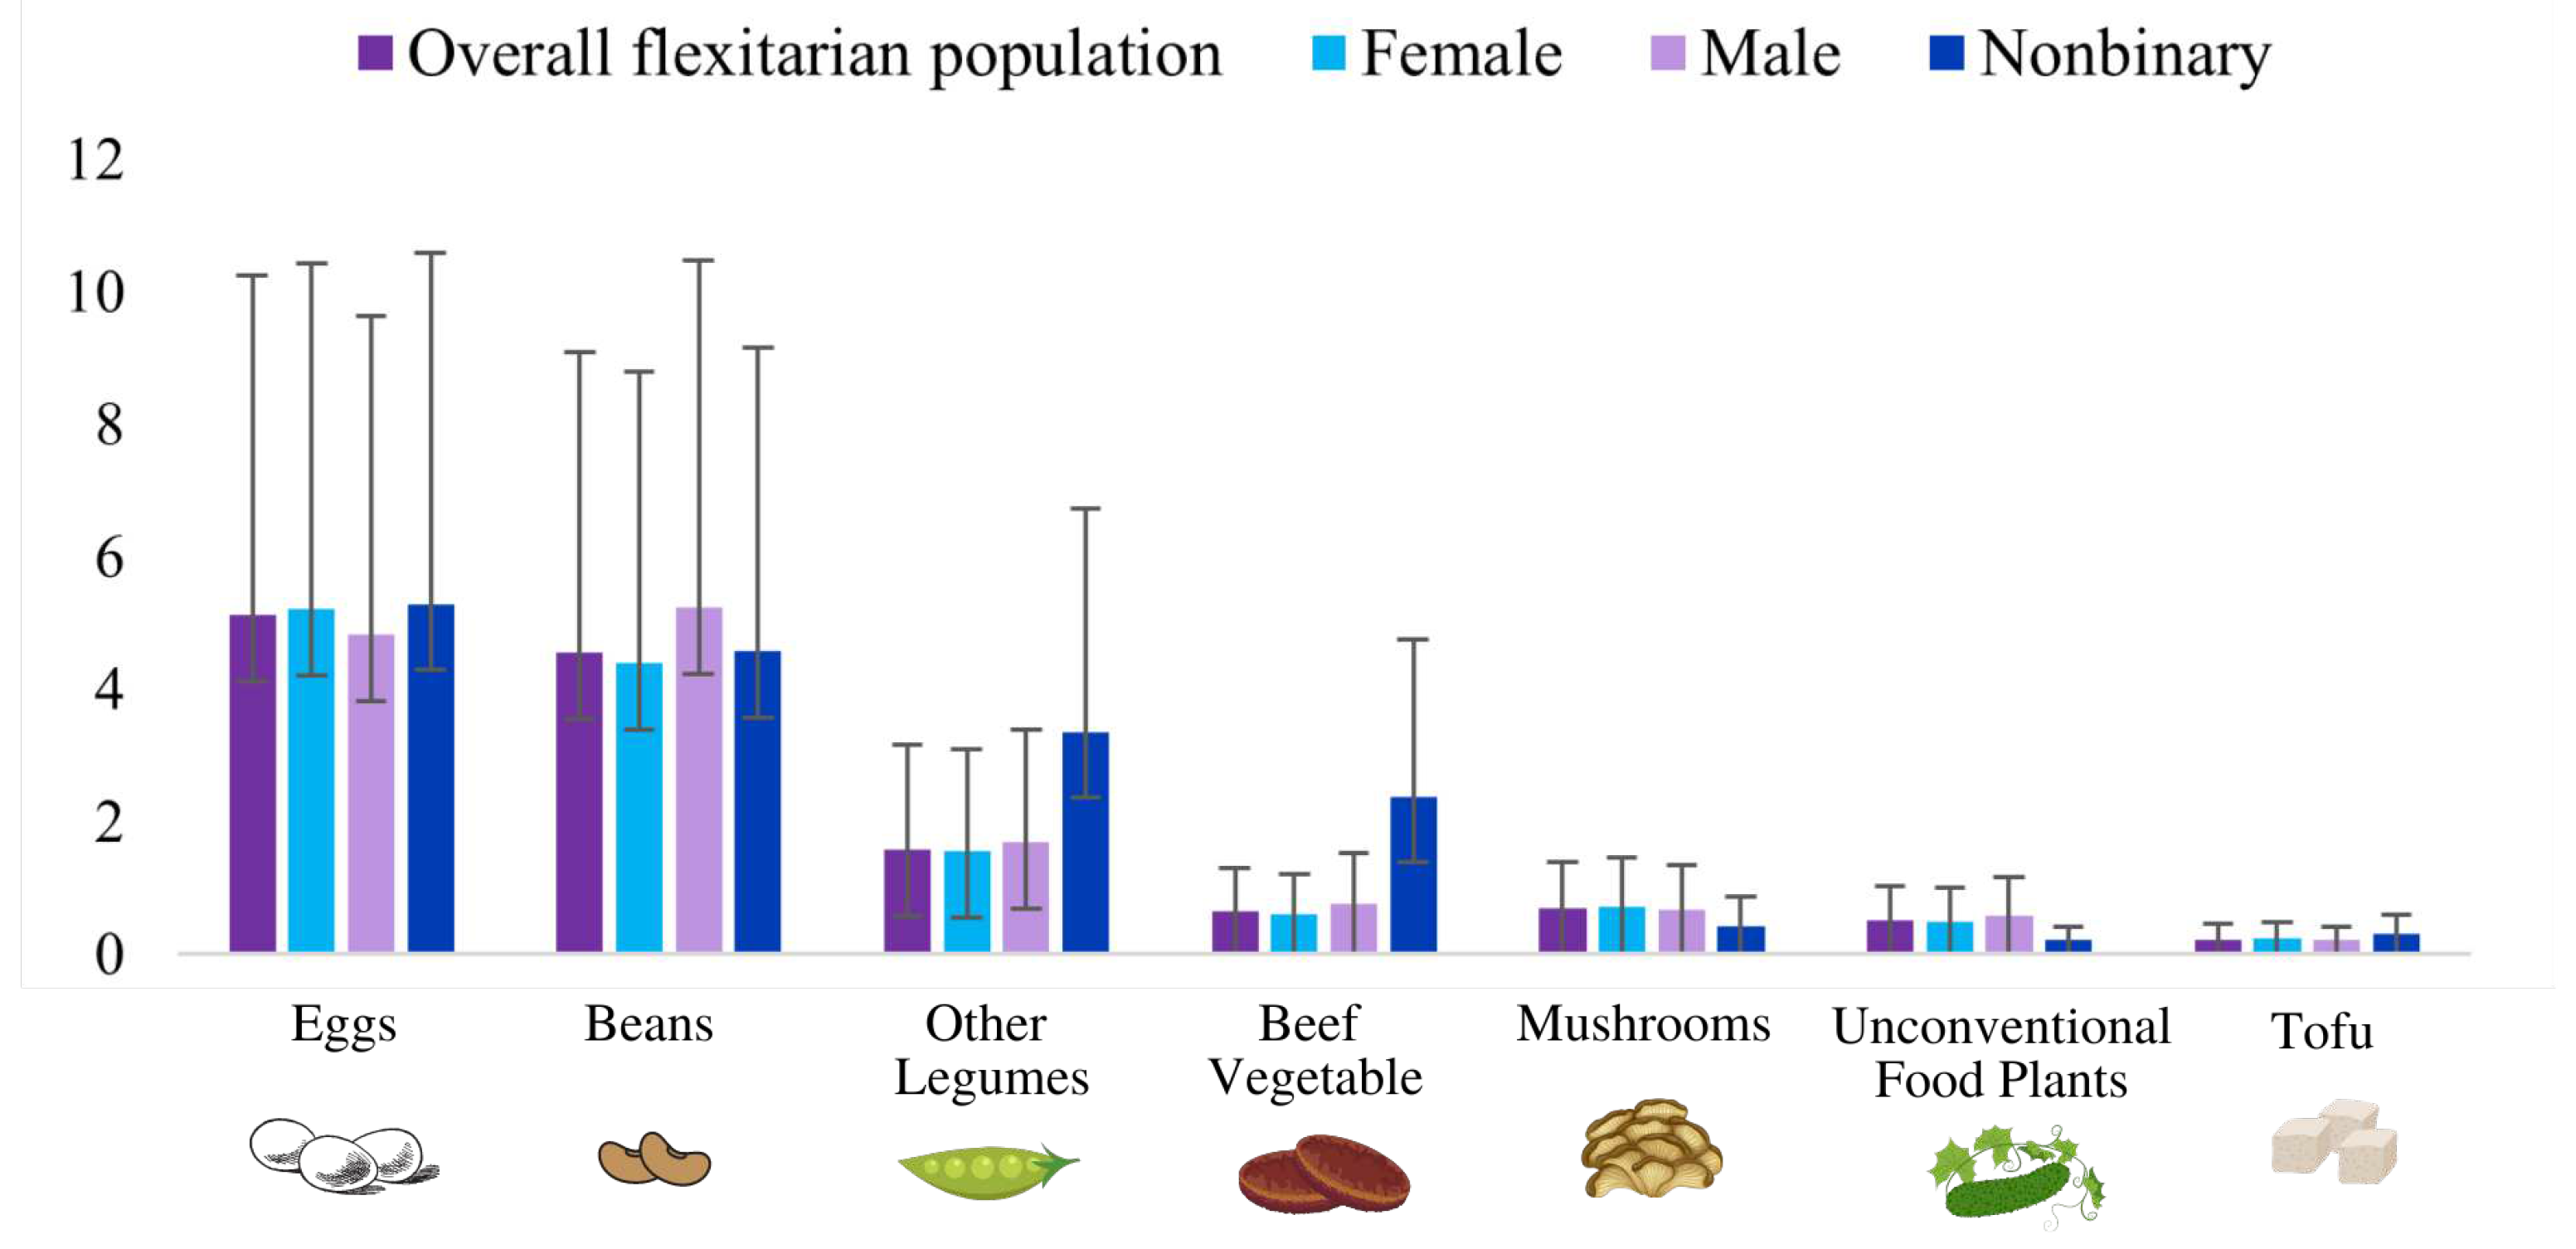

Table 1.
Socioeconomic and demographic characteristics of flexitarians, Brazil, 2022.
| Ethnicity | n | % | 99% CI |
|---|---|---|---|
| White | 624 | 60.64 | 56.61 – 64.53 |
| Asian | 25 | 0.24 | 0.14 – 0.40 |
| Multiethnic | 280 | 27.21 | 23.74 – 30.97 |
| Black | 71 | 0.68 | 0.50 – 0.92 |
| Indigenous | 12 | 0.11 | 0.05 – 0.24 |
| Preferred not to answer | 17 | 0.16 | 0.08 – 0.30 |
| Region | n | % | 99% CI |
| Central | 86 | 8.35 | 6.35 – 10.90 |
| Northeast | 453 | 44.02 | 40.04 – 48.08 |
| North | 61 | 5.92 | 4.25 – 8.17 |
| Southeast | 292 | 28.37 | 24.85 – 32.17 |
| South | 137 | 13.31 | 10.77 – 16.33 |
| Housing area | n | % | 99% CI |
| Urban | 967 | 93.97 | 91.71 – 95.65 |
| Rural | 62 | 0.60 | 0.43 – 0.83 |
| Gender | N | % | 99% CI |
| Female | 786 | 76.38 | 72.76 - 79.66 |
| Male | 203 | 19.72 | 16.68 - 23.16 |
| Nonbinary | 07 | 0.06 | 0.02 - 0.17 |
| Preferred not to answer | 33 | 0.32 | 0.20 - 0.50 |
| Sexual Orientation | n | % | 99%CI |
| Heterosexuals | 745 | 72.40 | 68.62 – 75.88 |
| LGBT | 253 | 24.58 | 21.25 – 28.25 |
| Preferred not to answer | 31 | 0.30 | 0.18 – 0.47 |
| Political Orientation | n | % | 99%CI |
| Left | 707 | 68.70 | 64.82 – 72.34 |
| Neutral | 279 | 27.11 | 23.65 – 30.87 |
| Right | 43 | 0.41 | 0.28 – 0.61 |
| Education | n | % | 99%CI |
| Elementary | 03 | 0.02% | 0.005 – 0.12 |
| High School | 109 | 10.59% | 0.83 – 13.37 |
| Undergraduate | 545 | 52.96% | 48.90 – 56.98 |
| Master's Degree | 220 | 21.37% | 18.23 – 24.90 |
| Doctorate | 152 | 14.77% | 12.10 – 17.89 |
| Per capita income | (Mean ± SD) | ||
| R$ | 3910.76 ± 3876.01 | → U$D 740.67 | |
| Age | (Mean ± SD) | ||
| Years old | 37.92 ± 12.98 |
Disclaimer/Publisher’s Note: The statements, opinions and data contained in all publications are solely those of the individual author(s) and contributor(s) and not of MDPI and/or the editor(s). MDPI and/or the editor(s) disclaim responsibility for any injury to people or property resulting from any ideas, methods, instructions or products referred to in the content. |
© 2023 by the authors. Licensee MDPI, Basel, Switzerland. This article is an open access article distributed under the terms and conditions of the Creative Commons Attribution (CC BY) license (http://creativecommons.org/licenses/by/4.0/).
Copyright: This open access article is published under a Creative Commons CC BY 4.0 license, which permit the free download, distribution, and reuse, provided that the author and preprint are cited in any reuse.


