
Submitted:
29 January 2023
Posted:
30 January 2023
You are already at the latest version
Abstract
Microplastics (MPs) and nanoplastics (NPs) are distributed and transferred among the four major environmental compartments (air, water, soil, and biota) and have been already found in humans, making crucial to develop remediation technologies to tackle this kind pollution. Photocatalysis can be used to eliminate MPs present in contaminated wastewater effluents before their discharge into waterbodies. In this work, several green TiO2-based semiconductors were prepared using the extrapallial fluid (EPF) of Mytilus edulis sea water mussels as doping precursor. The semiconductors were then used as films or powders to photocatalytically degrade polystyrene (PS) NPs and MPs and polyethylene (PE) MPs. It was found that the obtention of green TiO2-based semiconductors with good characteristics for photocatalytic purposes (anatase crystalline phase, presence of porosity, activity in visible light and high surface area) seems not enough to achieve high degradation efficiency. The operational conditions of the reaction system should be also taken into account. For instance, the convenience of using semiconductors in the form of films can be overcome by their limited exposed surface area or the null adsorption of the semiconductor in the MPs particles. Additionally, crystallinity of the semiconductor can be a more determinant factor to take into account when performing photocatalysis of MPs.
Keywords:
microplastics
; nanoplastics
; TiO2
; crystallinity
; film
; photocatalysis
; degradation
; mitigation
; microplastic pollution.
1. Introduction
By 2013, 268,950 tonnes of plastic were found on the surface of the ocean [1]. Gall et al. (2015) report, in a study of 340 articles, that they found 693 organisms and marine species have had contact with marine trash, 92% of the contact reported was with plastic debris [2]. One of the fundamental issues with plastics in marine ecosystems is their ingestion and entanglement [3]. In recent years, microplastics (MPs) and nanoplastics (NP) have gained the scientific community's attention. MPs are defined as plastic with sizes between 1 µm and 5 mm long, nanoplastics are defined as plastics smaller than 1 µm [4]. Recent studies have reported that MPs and NPs have been found in biota [5,6], table salt [7], drinking water [8], milk [9], seafood [10], human bloodstream [11], human placenta [12], and human stool [13], among others. Additionally, MPs can transport persistent organic pollutants (POPs). Due to their intrinsic properties, such as specific surface area, crystallinity, hydrophobicity and polarity and the POPs' hydrophobicity and dissociative forms, these organic pollutants tend to adsorb in MPs [14]. Additionally, MPs can sorb heavy metals [15]. Thus, MPs work as a vector for POPs and heavy metal transporting into organisms. For instance, Liao et al. (2019) reported Cr bioaccessibility in the human digestive system through MPs [16,17].
Water bodies have become contaminated with microplastics from domestic sources, pharmaceutical products, ships, research facilities, and maritime and wastewater treatment facilities. Wastewater treatment plants (WWTPs) are a source of MPs to aquatic systems due to unfitted systems for MPs removal and terrestrial systems because of MPs capture in the sludge that is afterwards used for fertilization [18]. Thus, a feasible approach for effectively eliminating the MPs before their incorporation into water bodies would be pollutant elimination in WWTPs. Different technologies have been studied for addressing MPs remediation in aquatic systems, namely, membrane technology, coagulation and flocculation, nanomaterials, bacterial biodegradation, electrocoagulation and advanced oxidation processes (AOPs) [19]. AOPs are an attractive solution to MPs remediation owing to the possibility of MPs mineralization [20].
AOPs include photochemical oxidation [21], ozonation [22], electrochemical oxidation [23], catalytic oxidation [24] and photocatalytic oxidation [25]. Photocatalytic degradation is a viable solution for MPs degradation, as it can be adapted as a tertiary treatment in a WWTP, as well as allowing the mineralization of microplastics to CO2 and H2O. Additionally, the method aligns with the 6th, 7th, and 9th principles of Green Chemistry if carried out under visible or solar light, and the photocatalyst is made using renewable feedstocks.
Due to the advantages of photocatalysis in MPs degradation, researchers have made advances in addressing this issue through various photocatalytic materials. Zinc oxide nanorods degraded low-density polyethene (LDPE) microplastic in visible light [26]. Likewise, the degradation of LDPE film in water was studied in visible-light-induced plasmonic photocatalysts comprising platinum nanoparticles deposited on zinc oxide nanorods (ZnO-Pt) [27]. Furthermore, hydroxy-rich ultrathin BiOCl (BiOCl-1) synthesized with mannitol was used to degrade high-density polyethene microspheres (PE-S) [28]. Also, M-2/Z0.6C0.4S photocatalyst was fabricated for H2 production and simultaneously degrading polyethene terephthalate (PET) [29].
Although several materials have been investigated for the photocatalytic degradation of microplastics, the TiO2 semiconductor has been the most extensively studied. This semiconductor has been widely studied in the scientific community with other applications due to its safety, low cost, chemical stability, efficient photoactivity and safety. Likewise, it has presented favourable results in the degradation of MPs. Ag/TiO2 has been studied for MPs and E. coli disinfection achieving 81% MPs degradation after 4 h in UV light [30]. Also, an optofluidic microreactor of TiO2 was tested for water purification, showing that polystyrene (PS) could be degraded with this system [31]. Photocatalytic polyacrylamide grafted TiO2 (PAM-g-TiO2) with LDPE nanocomposite film was irradiated for 520 h under UV light resulting in 39.85% of weight reduction and 94.60% average molecular weight (Mw) reduction [32]. Polyethene (PE) MPs reached a 76% mass degradation under UV irradiation for four h using a composite of TiO2 with Ag and reduced Graphene oxide [33].
Titania's photocatalytic activity depends on the semiconductor's surface and structural characteristics, including its surface area, crystal composition, particle size distribution, band gap, and other factors. Therefore, the semiconductor characteristics are essential in MPs degradation. In this work, several green TiO2-based semiconductors were prepared using the extrapallial fluid (EPF) of Mytilus edulis sea water mussels as doping precursor. The semiconductors were characterized to determine their potential ability for photocatalytic purposes and then used as films or powders to photocatalytically degrade polystyrene (PS) NPs and MPs and polyethylene (PE) MPs.
2. Materials and Methods
2.1. Doping Precursors Preparation and SDS-PAGE Profiling of Mytilus edulis Extrapallial Fluid
The proteins contained in the extrapallial fluid (EPF) of a population of fresh blue mussels (Mytilus edulis) collected from Ensenada, Mexico (31.8667°N, 116.5964°W) were used as green doping precursors (i.e., a green source of carbon and nitrogen) of TiO2. The EPF was collected using the methodology previously reported by Zeng et al. [39]. The EPF was extracted gently from the mussels using a syringe and combined to produce a composite sample. The composite sample was clarified by centrifugation at 13,000 rpm for 10 min using an Eppendorf 5415D centrifuge (Eppendorf AG, Hamburg, Germany). The total protein content of the composite sample was quantified by the Bradford Method [40] using a Cary 50 UV-Vis spectrophotometer from Agilent Technologies. After protein quantification, the as-extracted EPF was labelled as C10 doping precursor. The as-extracted EPF was also submitted to a 10% sodium dodecyl sulfate-polyacrylamide gel electrophoresis (SDS-PAGE) to determine its proteins´ profile (MiniProtean II, BioRad Laboratories, Inc.; Hercules, CA, United States) using a 6,500-200,000 Da protein molecular weight ladder as reference (SigmaMarker wide range; Merck KGaA; Darmstadt, Germany). Two lots were analysed. The C10 sample was used as the doping precursor with the lowest protein content. Additionally, two aqueous solutions with higher protein content were prepared through freezing (-20 ºC for 12 h) and lyophilization of the as-extracted EPF. These concentrated precursor solutions with protein concentrations of 600 and 1200 ppm were labelled as C600 and C1200, respectively.
2.2. Synthesis and Characterization of the C-N-TiO2 Semiconductors
Several C,N-TiO2 semiconductors were prepared using either a hydrothermal synthesis or an hydrothermal synthesis plus calcination. These two different procedures were performed to verify if semiconductors with a higher crystallization degree derived from calcination lead to an increased photocatalytic removal of nano and microplastics from aqueous dispersions. First, the hydrothermal synthesis using titanium (IV) butoxide (97%, Sigma Aldrich) as TiO2 precursor and the three doping precursors obtained in Section 2.1 was carried out using the same methodology reported by Zeng et al. [39]. Samples were labelled as M10, M600 and M1200 for the materials obtained with the C10, C600 and C1200 precursor solutions, respectively. After characterization and photocatalytic tests, sample M10 was selected to further investigation. Then, M10 semiconductor was calcined in air atmosphere at 400 ºC, 600 ºC and 800 ºC for 3 h. These samples were identified as M10-400, M10-600 and M10-800. For the photocatalytic experiments, the M10, M600 and M1200 semiconductors were used as films deposited on clean glass substrates (using a 10 wt./v % aqueous dispersion of C,N-TiO2 and a CGV USB Dip-coater with an immersion and emersion rate of 100 mm/min), while the M10, M10-400, M10-600 and M10-800 semiconductors were used as powders dispersed in an aqueous reaction medium.
Characterization of all semiconductors was performed using several analytical techniques. Crystalline phases were analysed by X-ray diffraction (XRD) in a Siemens D5000 diffractometer with Cu K𝛼1 radiation. Carbon and nitrogen doping was determined by elemental analysis by a CHNS/O Analyzer 2400 Perkin Elmer Series II instrument, at a combustion temperature of 975 ºC, using a reducing column with helium at 88 ºC. The bandgap (Eg) was calculated from the diffuse reflectance spectra (DRS) of all semiconductors using the Kubelka-Munk model F(R) = (1-R)2/2R, where F(R) is the reflectance transformed according to Kubelka-Munk theory and R is the reflectance. The Eg value was obtained by extrapolating the linear portion of a plot of [F(R)hv]1/2 vs E in eV to [F(R)hv]1/2 = 0. The reflectance spectra were collected in the 300-800 nm range on a Jasco V-670 UV-Vis/NIR spectrophotometer equipped with an ILN-725 integration sphere. The surface area was estimated by nitrogen adsorption using a Micromeritics TriStar II Plus 3.01 surface area analyser (analysis bath temperature of 77.3 K, equilibration interval of 5 s, and degasification at 110 °C). Microstructural observation was carried out by Field Emission Gun Scanning Electron Microscopy (FEG-SEM), using a FEI Nova NanoSEM 450 Field Emission SEM.
2.3. MPs and NPs Obtainment and Characterization
Primary PS MPs and NPs were prepared by the surfactant-free emulsion polymerization synthesis reported by Telford et al. [41]. The reaction was conducted for 10 min or 20 h to obtain PS NPs or MPs, respectively. Primary PE MPs were obtained from a commercial facial scrub using the extraction methodology proposed by Napper et al. [42]. Polymer type was confirmed by ATR-FTIR. The particle size and morphology of all MPs and NPs was evaluated by optical microscopy (OM) using a Leica DME microscope with a Leica ICC50 W camera or by SEM, using a Thermo-Fisher Scientific FEI Quanta 200 E-SEM (environmental SEM). Microchemical analysis was also conducted by energy dispersive X-ray spectroscopy (EDS) using an Oxford INCA-350 system coupled to the SEM microscope. Before the analysis, the samples were coated with a gold layer of 10 nm.
2.4. Photocatalytic Experiments
2.4.1. Photocatalysis of Primary PS NPs and MPs
50 mL of a 2 wt./vol % aqueous dispersion of the PS NPs or 50 mL of a 0.01 wt./vol % aqueous dispersion of the PS MPs were placed in a batch-type glass reactor of 100 mL capacity. The M10, M600 or M1200 films were then immersed in the dispersion, ensuring that the dispersion covered all surface of the semiconductor’s film. The reactor was then transferred inside a photocatalytic reaction chamber equipped with a constant temperature bath (± 2 ºC) and an ARTlite Slim LED IP65 50W (ARE-006 model) visible LED lamp (400 – 800 nm) placed at 25 cm from the sample (57.2 ± 0.3 W/m2). Agitation was set at 300 rpm. Adsorption of PS on the semiconductors’ surface was conducted in the darkness for 1 h. After adsorption process, the lamp was turned on and photocatalysis was conducted for 5 h at Troom. Photolysis tests were also carried out at the same conditions, but using a C,N-TiO2-free glass substrate. PS degradation was followed by turbidimetry, using a Lovibond TB 250 WL turbidimeter and a calibration curve that related NTU units with PS NPs or MPs concentration [25,43]. Two replicates were performed for all the photocatalytic experiments, and the mean ± S.D. values are reported.
2.4.2. Photocatalysis of Primary PE MPs
The photocatalytic experiments' reaction conditions were carried out according to our previous work, which demonstrated the photocatalytic degradation of HDPE MPs using a C,N-TiO2 material [34]. Therefore, photocatalysis was conducted in a Batch-type glass reactor, using 50 mL of a 0.4 wt./vol % PE MPs dispersion (pH 3) and a semiconductor load of 200 mg. The reactor was placed in the photocatalytic reaction chamber with the temperature set at 0 ± 2 ºC. PE MPs were dispersed in the experiments by continuous stirring at 350 rpm. Adsorption of the powdered semiconductors on the PE’s surface was conducted in the darkness for 2 h. Afterwards, photocatalysis was carried out for 50 h. After photocatalysis, the residual (degraded) PE MPs were separated from the reaction system and washed twice with distilled water to remove potential C,N-TiO2 traces that could remain attached. Two replicates were performed for all the photocatalytic experiments, and for the mean ± S.D. values are reported. PE MPs degradation was followed by gravimetry, FTIR and microscopy. Gravimetry was used to follow degradation because it represents a simple and direct way to quantify the polymers' degradation [44]. Mass measurements were performed in an ACZET CY224C analytical balance.
3. Results and Discussion
3.1. Protein Quantification of M. edulis EPF
The protein content in the clarified composite EPF of M. edulis (as-extracted EPF) was reported as 9.93 ± 0.05 ppm.
3.2. Semiconductors Characterization
Figure 1a displays the XRD patterns of all the semiconductors prepared here, showing that they are all composed of anatase TiO2 (JCPDS file No. 00-021-1272), except M10 sample, which also presents two small peaks at 36 and 44º that are characteristic of rutile TiO2 (JCPDS file No. 01-076-0317). Interestingly, it was found that when protein concentration was increase from 9.93 ± 0.05 ppm (M10 sample) to 600 ppm or 1200 ppm, rutile peaks disappear and only anatase was present in the XRD patterns of the M600 and M1200 semiconductors. This result is in in well agreement with that reported by Zeng et al. [39], whom first proposed using the same hydrothermal procedure but with the EPF of Cristaria plicata fresh water mussels to synthetize hierarchically porous N-TiO2. In their investigation, authors found that the EPF proteins controls the crystalline phase of the semiconductor, and significantly prevents the formation of other TiO2 polymorphs [39]. Thermal stability of anatase phase in semiconductors designed for photocatalytic purposes is a key factor for their performance. This is because anatase is often preferred to rutile and brookite TiO2 polymorphs due to its higher photocatalytic efficiency [45]. Anatase to rutile transformation usually occurs at 500 – 700 ºC [46]. Here, the blue, purple and orange XRD patterns of Figure 1a shows that even if the M10 sample was thermally treated at the temperature interval that promotes rutile formation (400 – 800 ºC), the presence of the EPF from sea water mussels avoid formation of such TiO2 polymorph, increasing the thermal stability of anatase phase in the prepared semiconductors. As expected, Figure 1a also shows that calcination after hydrothermal treatment led to more crystalline semiconductors compared to those prepared using only hydrothermal synthesis, being the M10-800 sample the most crystalline one.
Figure 1b presents the [F(R)hv]1/2 vs E plots calculated from the diffuse reflectance spectra of the different semiconductors. For an easy reading of the obtained Eg values, these are also enlisted in Table 1. It was found that the presence of the doping precursors derived from the M. edulis EPF promote a reduction of the bandgap of TiO2 from its standard value of 3.20 [47] eV to 2.93, 2.87 and 2.95 eV for the M10, m600 and M1200 semiconductors, respectively, allowing them the absorption of visible light as shown in Table 1. Moreover, it was found that after calcination, the M10 sample’s ability of absorbing visible light is not lost. As shown in Figure 1b and Table 1, the M10 calcined samples present Eg values lower than 3.1 eV, which is the lowest threshold for a semiconductor to present activity in the visible portion of the electromagnetic spectrum. The doping elements responsible of these low Eg values were determined by elemental analysis. Table 1 shows that all the semiconductors prepared here contain nitrogen and carbon in different amounts. In a previous report, it was demonstrated that no one of these elements was found for an undoped TiO2 prepared by the same hydrothermal procedure but using distilled water instead the EPF [34], demonstrating that carbon and nitrogen dopants are derived from the proteins of the EPF of the M. edulis mussels. Indeed, when analysed on SDS-PAGE, the EPF exhibited mixed molecular weight proteins, ranging from around 10 up to 200 kDa (Figure 2). This wide variety of proteins can be regarded as a mixture of different sized macromolecules that could interact differently with TiO2 during the synthesis of the semiconductor through both C- or N- terminal moieties. When the material is subjected to heat treatment (hydrothermal synthesis or calcination), the proteins tend to degrade by thermal decomposition. However, some carbon and nitrogen seem to remain on the TiO2 network, promoting a modification of the Eg value and photocatalytic activity in visible light.
As shown in Table 1, increasing the protein concentration from 9.93 ± 0.05 ppm (M10 sample) to 600 ppm or 1200 ppm (M600 and M1200 samples) decreases both carbon and nitrogen content in the TiO2 semiconductors. This result was not expected, as it was thought that increasing the protein concentration should raise the availability of C- or N- terminal moieties for interaction with TiO2. Then, it seems likely that some components of the as-extracted EPF that were present in the composite liquid (additional to proteins) were not removed in the clarification process and act as additional sources of carbon and nitrogen during the synthesis process. The absence of those components in the 600 ppm and 1200 ppm protein aqueous solutions can explain their lower carbon and nitrogen content. This hypothesis will be the object of a future investigation.
Furthermore, Table 1 shows that calcination of M10 samples did not negatively influence the doping content of the semiconductor samples. In the case of nitrogen doping, a slight drop in its concentration was observed. On the other hand, carbon content raised when increasing calcination temperature. This can be related to the carbonization of organic residues from the synthesis (butoxide residues or EPF components) during calcination at higher temperatures.
Figure 3 displays the FEG-SEM micrographs at different magnifications of the C,N-TiO2 semiconductors prepared at different protein concentrations. For all three samples, at low magnification values (10,000x and 40,000x), the micrographs show that the semiconductors are composed of particles of 1-10 μm of diameter. At high magnification (400,000X), it can be observed that these large particles are in turn formed by small particles of approximately 10 nm of diameter (Figure 3c,f,i). In all samples, some degree of porosity derived from the agglomeration of particles is observed (Figure 3b,e,g). In sample M1200, a partial sinterization of the particles can be observed (Figure 3h). This particular microstructure was related to both the high protein content of the aqueous solution used to prepare this semiconductor (1200 ppm) and the characteristics of the EPF. The presence of a prominent protein at 35 kDa in the SDS-PAGE profiling of Figure 2 could be related to the fact that, despite having a wide variety of proteins, the EPF produces relatively homogeneous pore sizes along the surface of the mesoporous semiconductor CN-TiO2 after heat treatment.
The characteristic morphology of samples M10, M600 and M1200 shown in Figure 3 lead to a high surface area. As shown in Table 1, surface areas are between 223 and 192 m2/g. These values are 3.86-4.46 times bigger than the surface area of commercial TiO2 (Aeroxide® P25, 50 m2/g [48]) and 1.53-1.77 times higher than the best photocatalysis obtained by Zeng et al. using the same procedure but with the EPF derived from C. plicata mussels. Table 1 also shows that calcination leads to a decrease of the surface area of M10 sample, which is more drastic at the highest calcination temperature (800 ºC). This result was expected, as calcination usually led to sinterization and densification of the samples. These phenomena usually promote closing of porosity and growing of the particles, both process that induce a reduction of the surface area of the semiconductors. The changes in the microstructure of the calcined samples are presented in the Figure 4, which displays the FEG-SEM micrographs of the M10 semiconductor calcined at 400, 600 and 800 ºC. Growing of the particles can be easily observed at low magnification (10,000x) while densification at higher magnifications (100,000x and 200,000x). The drastic loss of surface area in sample M10-800 was also related to the formation of 10 μm dense particles (Figure 4g).
3.3. PS NPs and MPs Characterization
Figure 5 shows the SEM micrographs of the prepared PS NPs and MPs, respectively. PS MPs present sizes of 1.04 ± 0.03 μm while PS NPs have sizes of 278.6 ± 9.1 nm. The inset in Figure 5a shows that both materials are composed of PS, as its characteristic absorption bands are present in both FTIR spectra. These results confirmed that the PS particles synthetized can be considered primary PS NPs and MPs and be further used for conducting the photocatalytic experiments.
3.4. Photocatalysis of Primary PS NPs and MPs Using C,N-TiO2 Films
The photocatalytic removal of PS NPs and MPs from aqueous dispersions was conducted for 5 hours of visible light irradiation. This reaction time was selected because increases in the reaction time did not promote further reductions in the concentration of PS, demonstrating that high degradation efficiencies for the photocatalytic removal of PS NPs and MPs are hard to achieve [25,43]. Adsorption experiments did not promote changes in PS concentration, indicating that the polymer was not adsorbed on the films. The null adsorption of PS on the surface of the films was attributed to the high pH value of the PS dispersions (11-12 due to the NaOH residues from the synthesis procedure [41]) that weaken the electrostatic interactions between the oxide surface and the PS [25,43]. As displayed in Figure 6, for both sizes, photolysis resulted in a limited reduction of the concentration of PS polymer. Degradation of PS plastics in visible light has been previously reported [25,49]. On the other hand, the presence of the different C,N-TiO2 films in the reaction media promoted a greater removal of PS NPs and MPs. This reduction was attributed to the formation of several chemical species (h+, e- and reactive oxygen species (ROS)) in the surface of the semiconductors and their interaction with the PS particles, as previously demonstrated [50]. Comparing the three prepared samples, it was found that the M10 sample present the best performance (although only slight differences in the efficiency removal between the samples were detected).
The limited removal efficiency (maximum 12.45%) of PS was related to the intrinsic disadvantages associated to the use of the semiconductors in the form of films for MPs photocatalysis purposes. In one hand, for these experiments, the semiconductors were used as films because this they avoid problems with the reuse of the semiconductor, as powders are usually difficult to separe from the reaction medium after photocatalysis. Using semiconductor as films and not as powders can be a great advantage if this technology is intended to be applied as tertiary treatment in WWTPs. However, when using films, part of the high surface area of the synthetized powders is lost when depositing them over the glass substrates. Additionally, adsorption of the semiconductor in the PS particles (either NPs or MPs) is not allowed, limiting the interaction between the pollutant and the chemical species generated at the surface of the semiconductor. As stated in our previous report, the interaction of MPs and semiconductors in the form of powders can help to increase degradation efficiency [34].
Due to the previous motivations, photocatalysis of MPs using the semiconductor in the form of powders was also tested. As separation of PS after reaction is difficult due to the small size of the NPs and MPs, bigger PE microplastics were used to conduct the experiments. Also, as M10 sample presented the best characteristics for photocatalytic purposes (section 3.2) and its synthesis requires less effort and energetic cost compared to the synthesis of the M600 and M1200 samples, the M10 C,N-TiO2 semiconductor was selected to conduct the photocatalysis of PE MPs. Finally, comparisons between the original M10 sample and the same sample calcined at different temperatures was perform to determine if higher crystallization degree has an influence on the degradation efficiency.
3.5. PE MPs Characterization
Figure 7a displays the FTIR analysis carried out on the microbeads extracted from the facial scrub. The characteristic vibrational bands of high-density polyethylene at 2911 and 2846 cm-1 that correspond to the asymmetric and symmetric stretching vibrations of the CH2 group and the bands at 1463 and 719 cm-1 that correspond to the scissoring and rocking bending vibrations of the same group were identified [51]. Figure 7b displays an optical micrograph (8x) of the same microbeads. It was found that they have an average size of 725 ± 108 μm. The surface of the microbeads was further investigated by SEM (Figure 7c,d). SEM micrographs revealed that the surface of the microbeads exhibited a homogeneous roughness, which may be related to their application as abrasive in facial scrubs. These results confirmed that the blue microbeads extracted from the commercial facial scrub can be considered primary MPs of PE and be further used for conducting photocatalytic experiments.
3.6. Photocatalysis of Primary PE MPs Using C,N-TiO2 Powders
Figure 8 shows that photolysis of PE MPs did not promote changes in the MPs concentration, indicating that the experimental conditions do not promote degradation. As previously reported, the photocatalysis of PE MPs using the powdered M10 C,N-TiO2 at low temperature (0 ºC) and pH value (3) reached a mass loss of 71.77 ± 1.88% [34]. Cold temperature promotes the fragmentation of the original PE MPs into smaller particles. This size reduction allowed a better interaction between the plastic and the C,N-TiO2 powders. On the other side, pH increases the concentration of H+ ions in the reaction media, favouring the photodegradation mechanism generally proposed for PE plastic [34]. As observed in Figure 8, calcination has an influence in the degradation of PE MPs, and this influence depends on the temperature. At relatively low temperatures (400 ºC and 600 ºC), mass loss after photocatalysis decreases, even if such semiconductors have characteristics that makes them good candidates for photocatalytic purposes such as anatase crystalline phase, activity in visible light and high surface area (see Figure 1 and Table 1). Therefore, the decrease in the degradation efficiency when performing photocatalysis with those samples was related to their densification and decrease of surface area. However, the results displayed in Figure 8 show that the higher crystallinity of M800 (calcined at 800 ºC) sample can be key factor for increasing degradation efficiency. This result is interesting because on M400 and M600 samples densification of the C,N-TiO2 particles was not as pronounced as in the M10-800 sample, and this latter still shown the best performance. It has been reported that for improving the photocatalytic performance of anatase TiO2, it is necessary to simultaneously increase its crystallinity and surface area [52]. However, this affirmation should be analyzed in relation to the characteristics of the model pollutant to degrade, because frequently, it is a chemical specie that can easily adsorb on the surface of the anatase semiconductor. Since the “big” MPs PE used here can have a particle size that are up to 72 times bigger than the size of the semiconductor’s particle, it has to be considered that MPs cannot be adsorbed on its surface, and then surface area of the semiconductor, although important, may have a minor role in influencing the photocatalytic degradation efficiency of MPs. The results shown in Figure 8 suggest that crystallinity can be a more determinant factor to take into account when performing photocatalysis of MPs.
4. Conclusions
MPs and NPs are complex aquatic pollutants that can be degraded by photocatalysis. In this work, it was found that the properties of the photocatalyst should be carefully designed in order to achieve degradation efficiency that allow the application of this technology to reduce marine MPs pollution. The obtention of green TiO2-based semiconductors with characteristics that makes them good candidates for photocatalytic purposes (such as anatase crystalline phase, presence of porosity, activity in visible light and high surface area) seems not enough to achieve high degradation efficiency. The operational conditions of the reaction system should be also taken into account. For instance, the convenience of using semiconductors in the form of films for photocatalytic degradation of MPs can be overcome by their limited surface area or the null adsorption of the semiconductor in the MPs particles. Additionally, when it was found that that crystallinity of the semiconductor can be a more determinant factor to take into account when performing photocatalysis of MPs using powdered semiconductors.
Author Contributions
Conceptualization, E.I.C.G.; Funding acquisition, E.I.C.G.; Investigation, A.D.V.G., M.C.A.T. I.S. and C.A.R.G.; Methodology, E.I.C.G., A.D.V.G., C.A.R.G., I.S. and M.C.A.T.; Supervision, E.I.C.G., J.F.V.C.; Project administration, E.I.C.G.; Resources, E.I.C.G. and J.F.V.C.; Writing—original draft preparation, A.D.V.G. and E.I.C.G.; Writing—review and editing, E.I.C.G., M.C.A.T. and J.F.V.C. All authors have read and agreed to the published version of the manuscript. All authors have read and agreed to the published version of the manuscript.
Funding
This research was funded by Consejo Nacional de Ciencia y Tecnología (Mexico), grant number APN-2017/5167 and by Secretaría de Educación Pública (Mexico), Grant number 511-6/18-8928.
Institutional Review Board Statement
“Not applicable”.
Data Availability Statement
The data that supports the findings of this study are available from the corresponding author, [E.I.C.G.], upon reasonable request.
Conflicts of Interest
The authors declare no conflict of interest.
References
- Ritchie, H.; Roser, M. Plastic Pollution. Our World in Data 2018. [Google Scholar]
- Gall, S.C.; Thompson, R.C. The Impact of Debris on Marine Life. Marine Pollution Bulletin 2015, 92, 170–179. [Google Scholar] [CrossRef] [PubMed]
- Law, K.L. Plastics in the Marine Environment. Annual Review of Marine Science 2017, 9, 205–229. [Google Scholar] [CrossRef] [PubMed]
- Committee for Risk Assessment (RAC); Committee for Socio-economic Analysis (SEAC) Background Document to the Opinion on the Annex XV Report Proposing Restrictions on Intentionally Added Microplastics; European Chemicals Agency (ECHA): Helsinki, Finland, 2000.
- Pizzurro, F.; Recchi, S.; Nerone, E.; Salini, R.; Barile, N.B. Accumulation Evaluation of Potential Microplastic Particles in Mytilus Galloprovincialis from the Goro Sacca (Adriatic Sea, Italy). Microplastics 2022, 1, 303–318. [Google Scholar] [CrossRef]
- Prata, J.C.; Silva, A.L.P.; da Costa, J.P.; Dias-Pereira, P.; Carvalho, A.; Fernandes, A.J.S.; da Costa, F.M.; Duarte, A.C.; Rocha-Santos, T. Microplastics in Internal Tissues of Companion Animals from Urban Environments. Animals 2022, 12, 1979. [Google Scholar] [CrossRef] [PubMed]
- Yang, D.; Shi, H.; Li, L.; Li, J.; Jabeen, K.; Kolandhasamy, P. Microplastic Pollution in Table Salts from China. Environ. Sci. Technol. 2015, 49, 13622–13627. [Google Scholar] [CrossRef]
- Schymanski, D.; Goldbeck, C.; Humpf, H.-U.; Fürst, P. Analysis of Microplastics in Water by Micro-Raman Spectroscopy: Release of Plastic Particles from Different Packaging into Mineral Water. Water Research 2018, 129, 154–162. [Google Scholar] [CrossRef]
- Kutralam-Muniasamy, G.; Pérez-Guevara, F.; Elizalde-Martínez, I.; Shruti, V.C. Branded Milks – Are They Immune from Microplastics Contamination? Science of The Total Environment 2020, 714, 136823. [Google Scholar] [CrossRef]
- Rochman, C.M.; Tahir, A.; Williams, S.L.; Baxa, D.V.; Lam, R.; Miller, J.T.; Teh, F.-C.; Werorilangi, S.; Teh, S.J. Anthropogenic Debris in Seafood: Plastic Debris and Fibers from Textiles in Fish and Bivalves Sold for Human Consumption. Sci Rep 2015, 5, 14340. [Google Scholar] [CrossRef]
- Leslie, H.A.; van Velzen, M.J.M.; Brandsma, S.H.; Vethaak, A.D.; Garcia-Vallejo, J.J.; Lamoree, M.H. Discovery and Quantification of Plastic Particle Pollution in Human Blood. Environment International 2022, 163, 107199. [Google Scholar] [CrossRef]
- Ragusa, A.; Svelato, A.; Santacroce, C.; Catalano, P.; Notarstefano, V.; Carnevali, O.; Papa, F.; Rongioletti, M.C.A.; Baiocco, F.; Draghi, S.; et al. Plasticenta: First Evidence of Microplastics in Human Placenta. Environment International 2021, 146, 106274. [Google Scholar] [CrossRef]
- Schwabl, P.; Köppel, S.; Königshofer, P.; Bucsics, T.; Trauner, M.; Reiberger, T.; Liebmann, B. Detection of Various Microplastics in Human Stool: A Prospective Case Series. Annals of Internal Medicine 2019, 171, 453–457. [Google Scholar] [CrossRef] [PubMed]
- Rodrigues, J.P.; Duarte, A.C.; Santos-Echeandía, J.; Rocha-Santos, T. Significance of Interactions between Microplastics and POPs in the Marine Environment: A Critical Overview. TrAC Trends in Analytical Chemistry 2019, 111, 252–260. [Google Scholar] [CrossRef]
- Barus, B.S.; Chen, K.; Cai, M.; Li, R.; Chen, H.; Li, C.; Wang, J.; Cheng, S.-Y. Heavy Metal Adsorption and Release on Polystyrene Particles at Various Salinities. Frontiers in Marine Science 2021, 8. [Google Scholar] [CrossRef]
- Liao, Y.; Yang, J. Microplastic Serves as a Potential Vector for Cr in an In-Vitro Human Digestive Model. Science of The Total Environment 2020, 703, 134805. [Google Scholar] [CrossRef]
- López-Vázquez, J.; Rodil, R.; Trujillo-Rodríguez, M.J.; Quintana, J.B.; Cela, R.; Miró, M. Mimicking Human Ingestion of Microplastics: Oral Bioaccessibility Tests of Bisphenol A and Phthalate Esters under Fed and Fasted States. Science of The Total Environment 2022, 826, 154027. [Google Scholar] [CrossRef] [PubMed]
- Hamidian, A.H.; Ozumchelouei, E.J.; Feizi, F.; Wu, C.; Zhang, Y.; Yang, M. A Review on the Characteristics of Microplastics in Wastewater Treatment Plants: A Source for Toxic Chemicals. Journal of Cleaner Production 2021, 295, 126480. [Google Scholar] [CrossRef]
- Ahmed, R.; Hamid, A.K.; Krebsbach, S.A.; He, J.; Wang, D. Critical Review of Microplastics Removal from the Environment. Chemosphere 2022, 293, 133557. [Google Scholar] [CrossRef] [PubMed]
- Ricardo, I.A.; Alberto, E.A.; Silva Júnior, A.H.; Macuvele, D.L.P.; Padoin, N.; Soares, C.; Gracher Riella, H.; Starling, M.C.V.M.; Trovó, A.G. A Critical Review on Microplastics, Interaction with Organic and Inorganic Pollutants, Impacts and Effectiveness of Advanced Oxidation Processes Applied for Their Removal from Aqueous Matrices. Chemical Engineering Journal 2021, 424, 130282. [Google Scholar] [CrossRef]
- Lin, J.; Yan, D.; Fu, J.; Chen, Y.; Ou, H. Ultraviolet-C and Vacuum Ultraviolet Inducing Surface Degradation of Microplastics. Water Research 2020, 186, 116360. [Google Scholar] [CrossRef]
- Zafar, R.; Park, S.Y.; Kim, C.G. Surface Modification of Polyethylene Microplastic Particles during the Aqueous-Phase Ozonation Process. Environmental Engineering Research 2021, 26. [Google Scholar] [CrossRef]
- Miao, F.; Liu, Y.; Gao, M.; Yu, X.; Xiao, P.; Wang, M.; Wang, S.; Wang, X. Degradation of Polyvinyl Chloride Microplastics via an Electro-Fenton-like System with a TiO2/Graphite Cathode. Journal of Hazardous Materials 2020, 399, 123023. [Google Scholar] [CrossRef] [PubMed]
- Kang, J.; Zhou, L.; Duan, X.; Sun, H.; Ao, Z.; Wang, S. Degradation of Cosmetic Microplastics via Functionalized Carbon Nanosprings. Matter 2019, 1, 745–758. [Google Scholar] [CrossRef]
- Acuña-Bedoya, J.D.; Luévano-Hipólito, E.; Cedillo-González, E.I.; Domínguez-Jaimes, L.P.; Hurtado, A.M.; Hernández-López, J.M. Boosting Visible-Light Photocatalytic Degradation of Polystyrene Nanoplastics with Immobilized CuxO Obtained by Anodization. Journal of Environmental Chemical Engineering 2021, 9, 106208. [Google Scholar] [CrossRef]
- Tofa, T.S.; Kunjali, K.L.; Paul, S.; Dutta, J. Visible Light Photocatalytic Degradation of Microplastic Residues with Zinc Oxide Nanorods. Environ Chem Lett 2019, 17, 1341–1346. [Google Scholar] [CrossRef]
- Tofa, T.S.; Ye, F.; Kunjali, K.L.; Dutta, J. Enhanced Visible Light Photodegradation of Microplastic Fragments with Plasmonic Platinum/Zinc Oxide Nanorod Photocatalysts. Catalysts 2019, 9, 819. [Google Scholar] [CrossRef]
- Jiang, R.; Lu, G.; Yan, Z.; Liu, J.; Wu, D.; Wang, Y. Microplastic Degradation by Hydroxy-Rich Bismuth Oxychloride. Journal of Hazardous Materials 2021, 405, 124247. [Google Scholar] [CrossRef]
- Cao, B.; Wan, S.; Wang, Y.; Guo, H.; Ou, M.; Zhong, Q. Highly-Efficient Visible-Light-Driven Photocatalytic H2 Evolution Integrated with Microplastic Degradation over MXene/ZnxCd1-XS Photocatalyst. Journal of Colloid and Interface Science 2022, 605, 311–319. [Google Scholar] [CrossRef]
- Haris, M.F.; Didit, A.M.; Ibadurrohman, M.; Setiadi, S.; Slamet, S. Doped TiO2 Photocatalyst for Disinfection of E. Coli and Microplastic Pollutant Degradation in Water. Asian Journal of Chemistry 2021, 33, 2038–2042. [Google Scholar] [CrossRef]
- Kim, H.; Kwon, H.; Song, R.; Shin, S.; Ham, S.-Y.; Park, H.-D.; Lee, J.; Fischer, P.; Bodenschatz, E. Hierarchical Optofluidic Microreactor for Water Purification Using an Array of TiO2 Nanostructures. npj Clean Water 2022, 5, 1–10. [Google Scholar] [CrossRef]
- Liang, W.; Luo, Y.; Song, S.; Dong, X.; Yu, X. High Photocatalytic Degradation Activity of Polyethylene Containing Polyacrylamide Grafted TiO2. Polymer Degradation and Stability 2013, 98, 1754–1761. [Google Scholar] [CrossRef]
- Fadli, M.H.; Ibadurrohman, M.; Slamet, S. Microplastic Pollutant Degradation in Water Using Modified TiO2 Photocatalyst Under UV-Irradiation. IOP Conf. Ser.: Mater. Sci. Eng. 2021, 1011, 012055. [Google Scholar] [CrossRef]
- Ariza-Tarazona, M.C.; Villarreal-Chiu, J.F.; Hernández-López, J.M.; Rivera De la Rosa, J.; Barbieri, V.; Siligardi, C.; Cedillo-González, E.I. Microplastic Pollution Reduction by a Carbon and Nitrogen-Doped TiO2: Effect of PH and Temperature in the Photocatalytic Degradation Process. Journal of Hazardous Materials 2020, 395, 122632. [Google Scholar] [CrossRef] [PubMed]
- Llorente-García, B.E.; Hernández-López, J.M.; Zaldívar-Cadena, A.A.; Siligardi, C.; Cedillo-González, E.I. First Insights into Photocatalytic Degradation of HDPE and LDPE Microplastics by a Mesoporous N–TiO2 Coating: Effect of Size and Shape of Microplastics. Coatings 2020, 10, 658. [Google Scholar] [CrossRef]
- Zhou, D.; Wang, L.; Zhang, F.; Wu, J.; Wang, H.; Yang, J. Feasible Degradation of Polyethylene Terephthalate Fiber-Based Microplastics in Alkaline Media with Bi2O3@N-TiO2 Z-Scheme Photocatalytic System. Advanced Sustainable Systems 2022, 6, 2100516. [Google Scholar] [CrossRef]
- Yuwendi, Y.; Ibadurrohman, M.; Setiadi, S.; Slamet, S. Photocatalytic Degradation of Polyethylene Microplastics and Disinfection of E. Coli in Water over Fe- and Ag-Modified TiO2 Nanotubes. Bulletin of Chemical Reaction Engineering & Catalysis 2022, 17, 263–277. [Google Scholar] [CrossRef]
- Zhou, D.; Luo, H.; Zhang, F.; Wu, J.; Yang, J.; Wang, H. Efficient Photocatalytic Degradation of the Persistent PET Fiber-Based Microplastics over Pt Nanoparticles Decorated N-Doped TiO2 Nanoflowers. Adv. Fiber Mater. 2022, 4, 1094–1107. [Google Scholar] [CrossRef]
- Zeng, H.; Xie, J.; Xie, H.; Su, B.-L.; Wang, M.; Ping, H.; Wang, W.; Wang, H.; Fu, Z. Bioprocess-Inspired Synthesis of Hierarchically Porous Nitrogen-Doped TiO2 with High Visible-Light Photocatalytic Activity. J. Mater. Chem. A 2015, 3, 19588–19596. [Google Scholar] [CrossRef]
- Bradford, M.M. A Rapid and Sensitive Method for the Quantitation of Microgram Quantities of Protein Utilizing the Principle of Protein-Dye Binding. Analytical Biochemistry 1976, 72, 248–254. [Google Scholar] [CrossRef]
- Telford, A.M.; Pham, B.T.T.; Neto, C.; Hawkett, B.S. Micron-Sized Polystyrene Particles by Surfactant-Free Emulsion Polymerization in Air: Synthesis and Mechanism. Journal of Polymer Science Part A: Polymer Chemistry 2013, 51, 3997–4002. [Google Scholar] [CrossRef]
- Napper, I.E.; Bakir, A.; Rowland, S.J.; Thompson, R.C. Characterisation, Quantity and Sorptive Properties of Microplastics Extracted from Cosmetics. Marine Pollution Bulletin 2015, 99, 178–185. [Google Scholar] [CrossRef] [PubMed]
- Domínguez-Jaimes, L.P.; Cedillo-González, E.I.; Luévano-Hipólito, E.; Acuña-Bedoya, J.D.; Hernández-López, J.M. Degradation of Primary Nanoplastics by Photocatalysis Using Different Anodized TiO2 Structures. Journal of Hazardous Materials 2021, 413, 125452. [Google Scholar] [CrossRef] [PubMed]
- Chamas, A.; Moon, H.; Zheng, J.; Qiu, Y.; Tabassum, T.; Jang, J.H.; Abu-Omar, M.; Scott, S.L.; Suh, S. Degradation Rates of Plastics in the Environment. ACS Sustainable Chem. Eng. 2020, 8, 3494–3511. [Google Scholar] [CrossRef]
- Zhang, J.; Zhou, P.; Liu, J.; Yu, J. New Understanding of the Difference of Photocatalytic Activity among Anatase, Rutile and Brookite TiO2. Phys. Chem. Chem. Phys. 2014, 16, 20382–20386. [Google Scholar] [CrossRef] [PubMed]
- Ye, J.; Liu, W.; Cai, J.; Chen, S.; Zhao, X.; Zhou, H.; Qi, L. Nanoporous Anatase TiO2 Mesocrystals: Additive-Free Synthesis, Remarkable Crystalline-Phase Stability, and Improved Lithium Insertion Behavior. J. Am. Chem. Soc. 2011, 133, 933–940. [Google Scholar] [CrossRef] [PubMed]
- Fujishima, A.; Zhang, X.; Tryk, D.A. TiO2 Photocatalysis and Related Surface Phenomena. Surface Science Reports 2008, 63, 515–582. [Google Scholar] [CrossRef]
- Rodríguez, E.M.; Márquez, G.; Tena, M.; Álvarez, P.M.; Beltrán, F.J. Determination of Main Species Involved in the First Steps of TiO2 Photocatalytic Degradation of Organics with the Use of Scavengers: The Case of Ofloxacin. Applied Catalysis B: Environmental 2015, 178, 44–53. [Google Scholar] [CrossRef]
- Kik, K.; Bukowska, B.; Sicińska, P. Polystyrene Nanoparticles: Sources, Occurrence in the Environment, Distribution in Tissues, Accumulation and Toxicity to Various Organisms. Environmental Pollution 2020, 262, 114297. [Google Scholar] [CrossRef]
- Vital-Grappin, A.D.; Ariza-Tarazona, M.C.; Luna-Hernández, V.M.; Villarreal-Chiu, J.F.; Hernández-López, J.M.; Siligardi, C.; Cedillo-González, E.I. The Role of the Reactive Species Involved in the Photocatalytic Degradation of HDPE Microplastics Using C,N-TiO2 Powders. Polymers 2021, 13, 999. [Google Scholar] [CrossRef]
- Socrates, G. Infrared and Raman Characteristic Group Frequencies: Tables and Charts; 3rd.; John Wiley & Sons: Hoboken, NJ, USA, 2004; ISBN 978-0-470-09307-8. [Google Scholar]
- Park, C.H.; Lee, C.M.; Choi, J.W.; Park, G.C.; Joo, J. Enhanced Photocatalytic Activity of Porous Single Crystal TiO2/CNT Composites by Annealing Process. Ceramics International 2018, 44, 1641–1645. [Google Scholar] [CrossRef]
Figure 1.
(a) XRD patterns and (b) [F(R)hv]1/2 vs E plots.
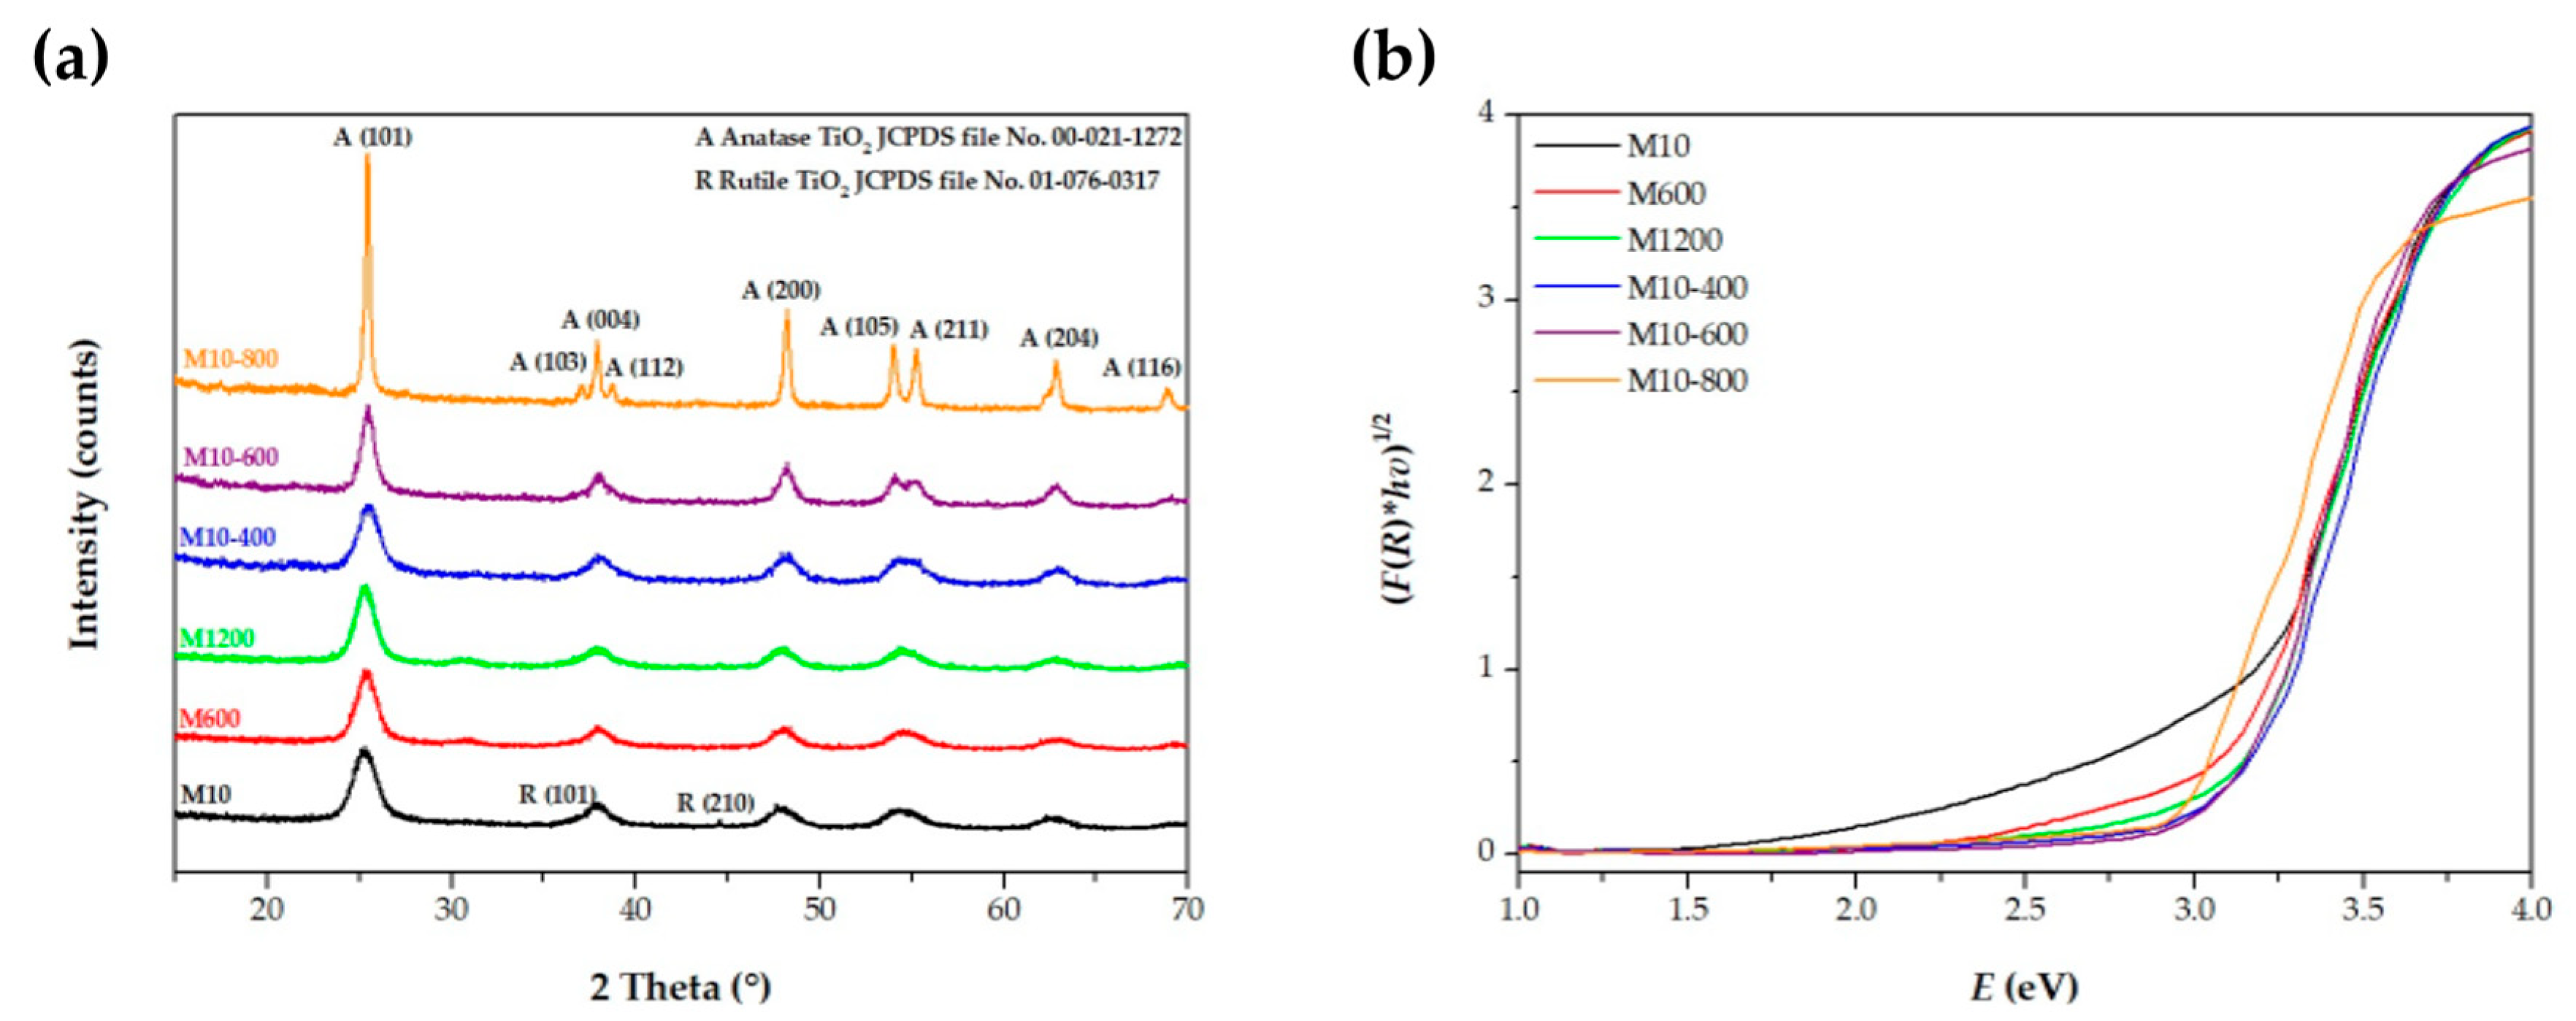
Figure 2.
SDS-PAGE profiling of Mytilus edulis extrapallial fluid.
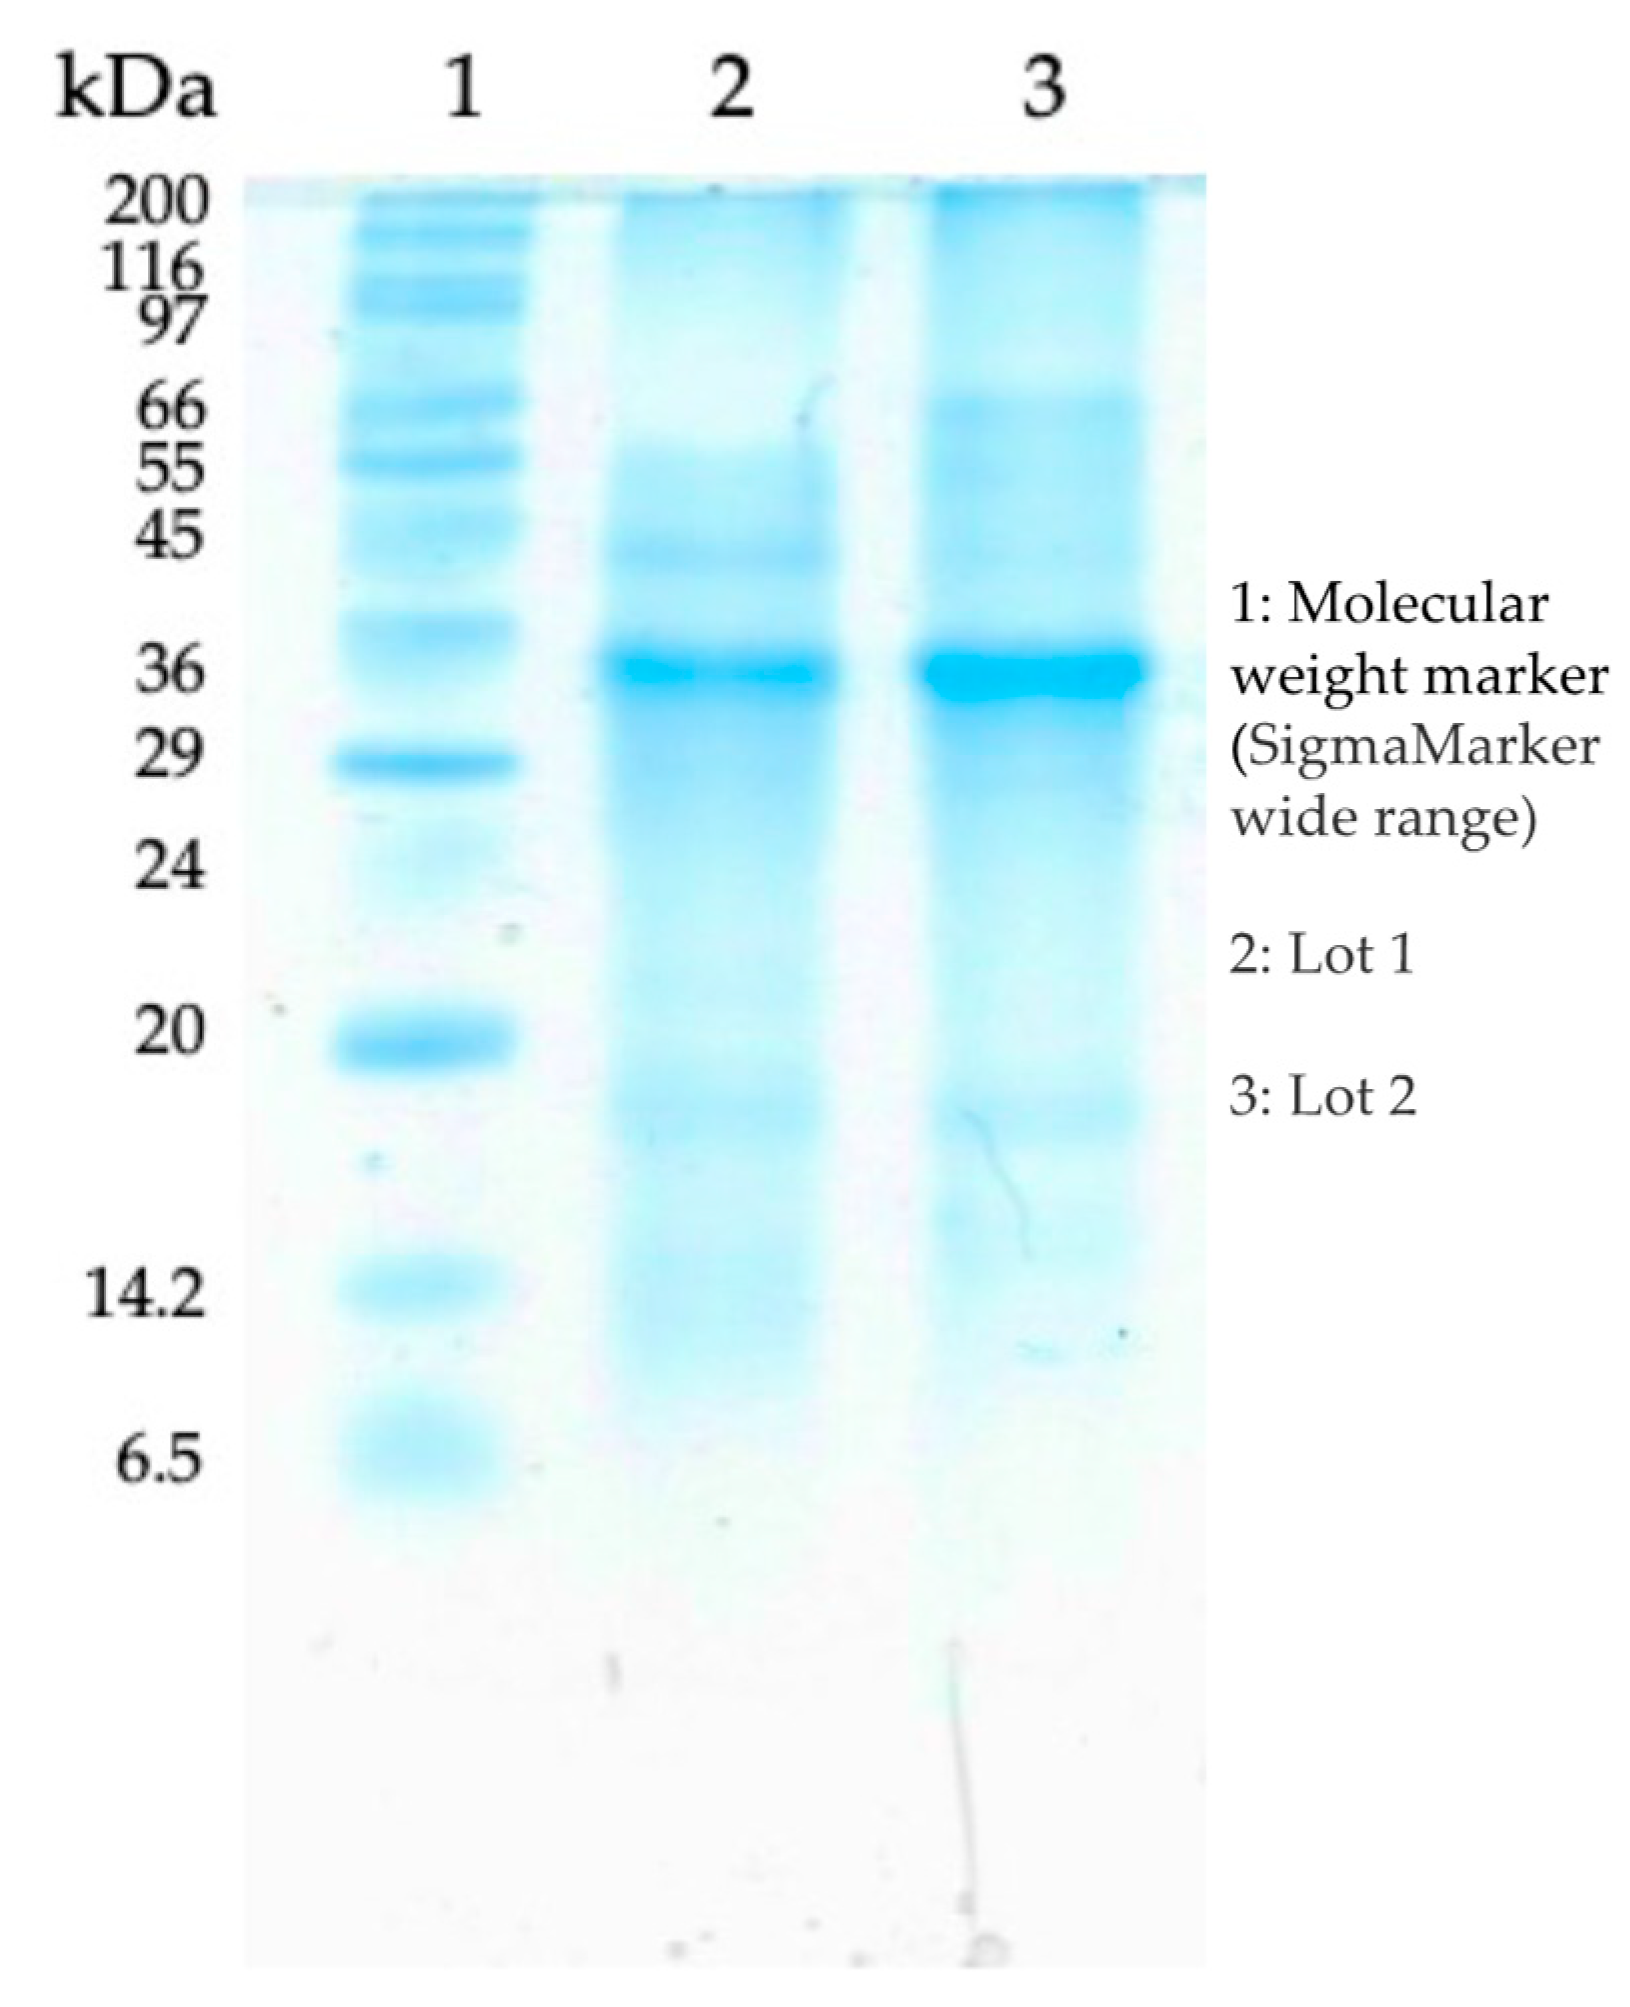
Figure 3.
FEG-SEM micrographs of the C,N-TiO2 semiconductors prepared at different protein concentrations. (a) M10 10,000x; (b) M10 40,000x; (c) M10 400,000x; (d) M600 10,000x; (e) M600 40,000x; (f) M600 400,000x; (g) M1200 10,000x; (h) M1200 40,000x and (i) M1200 400,000x.
Figure 3.
FEG-SEM micrographs of the C,N-TiO2 semiconductors prepared at different protein concentrations. (a) M10 10,000x; (b) M10 40,000x; (c) M10 400,000x; (d) M600 10,000x; (e) M600 40,000x; (f) M600 400,000x; (g) M1200 10,000x; (h) M1200 40,000x and (i) M1200 400,000x.
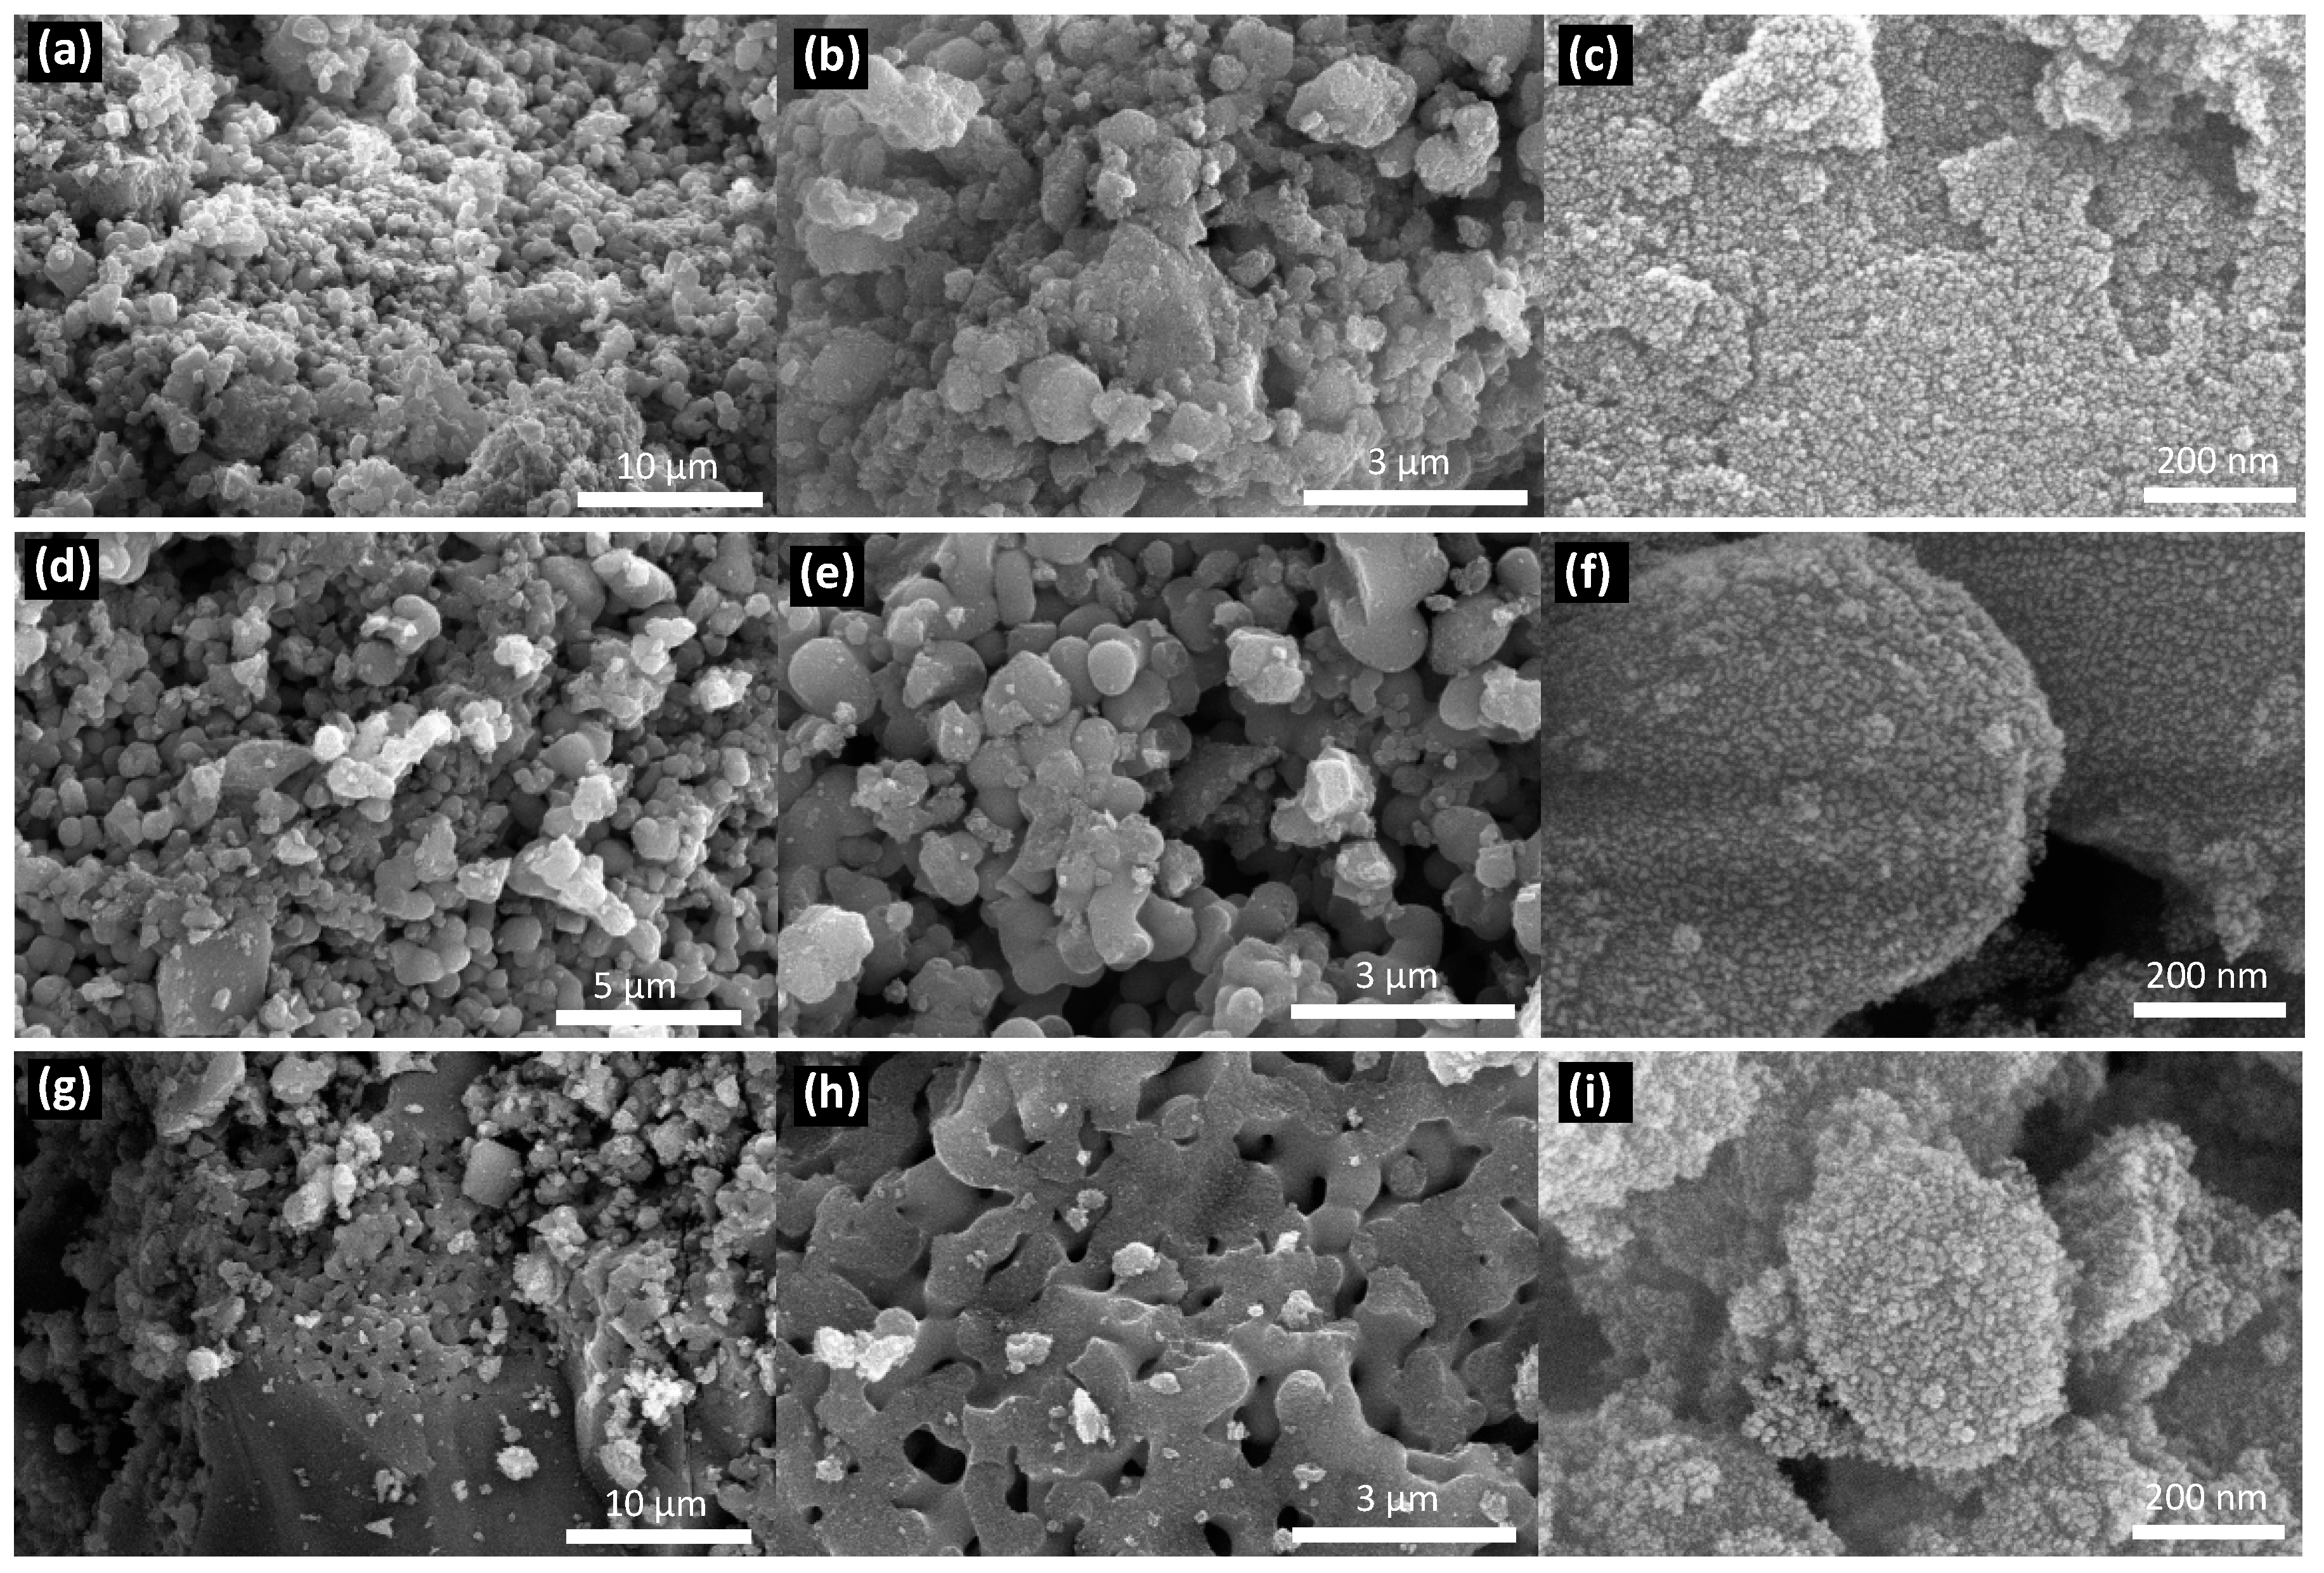
Figure 4.
FEG-SEM micrographs of the M10 C,N-TiO2 calcined at 400, 600 and 800 ºC. (a) M10-400 10,000x; (b) M10-400 100,000x; (c) M10-400 200,000x; (d) M10-600 10,000x; (e) M10-600 100,000x; (f) M10-600 200,000x; (g) M10-800 10,000x; (h) M10-800 100,000x and (i) M10-800 200,000x.
Figure 4.
FEG-SEM micrographs of the M10 C,N-TiO2 calcined at 400, 600 and 800 ºC. (a) M10-400 10,000x; (b) M10-400 100,000x; (c) M10-400 200,000x; (d) M10-600 10,000x; (e) M10-600 100,000x; (f) M10-600 200,000x; (g) M10-800 10,000x; (h) M10-800 100,000x and (i) M10-800 200,000x.
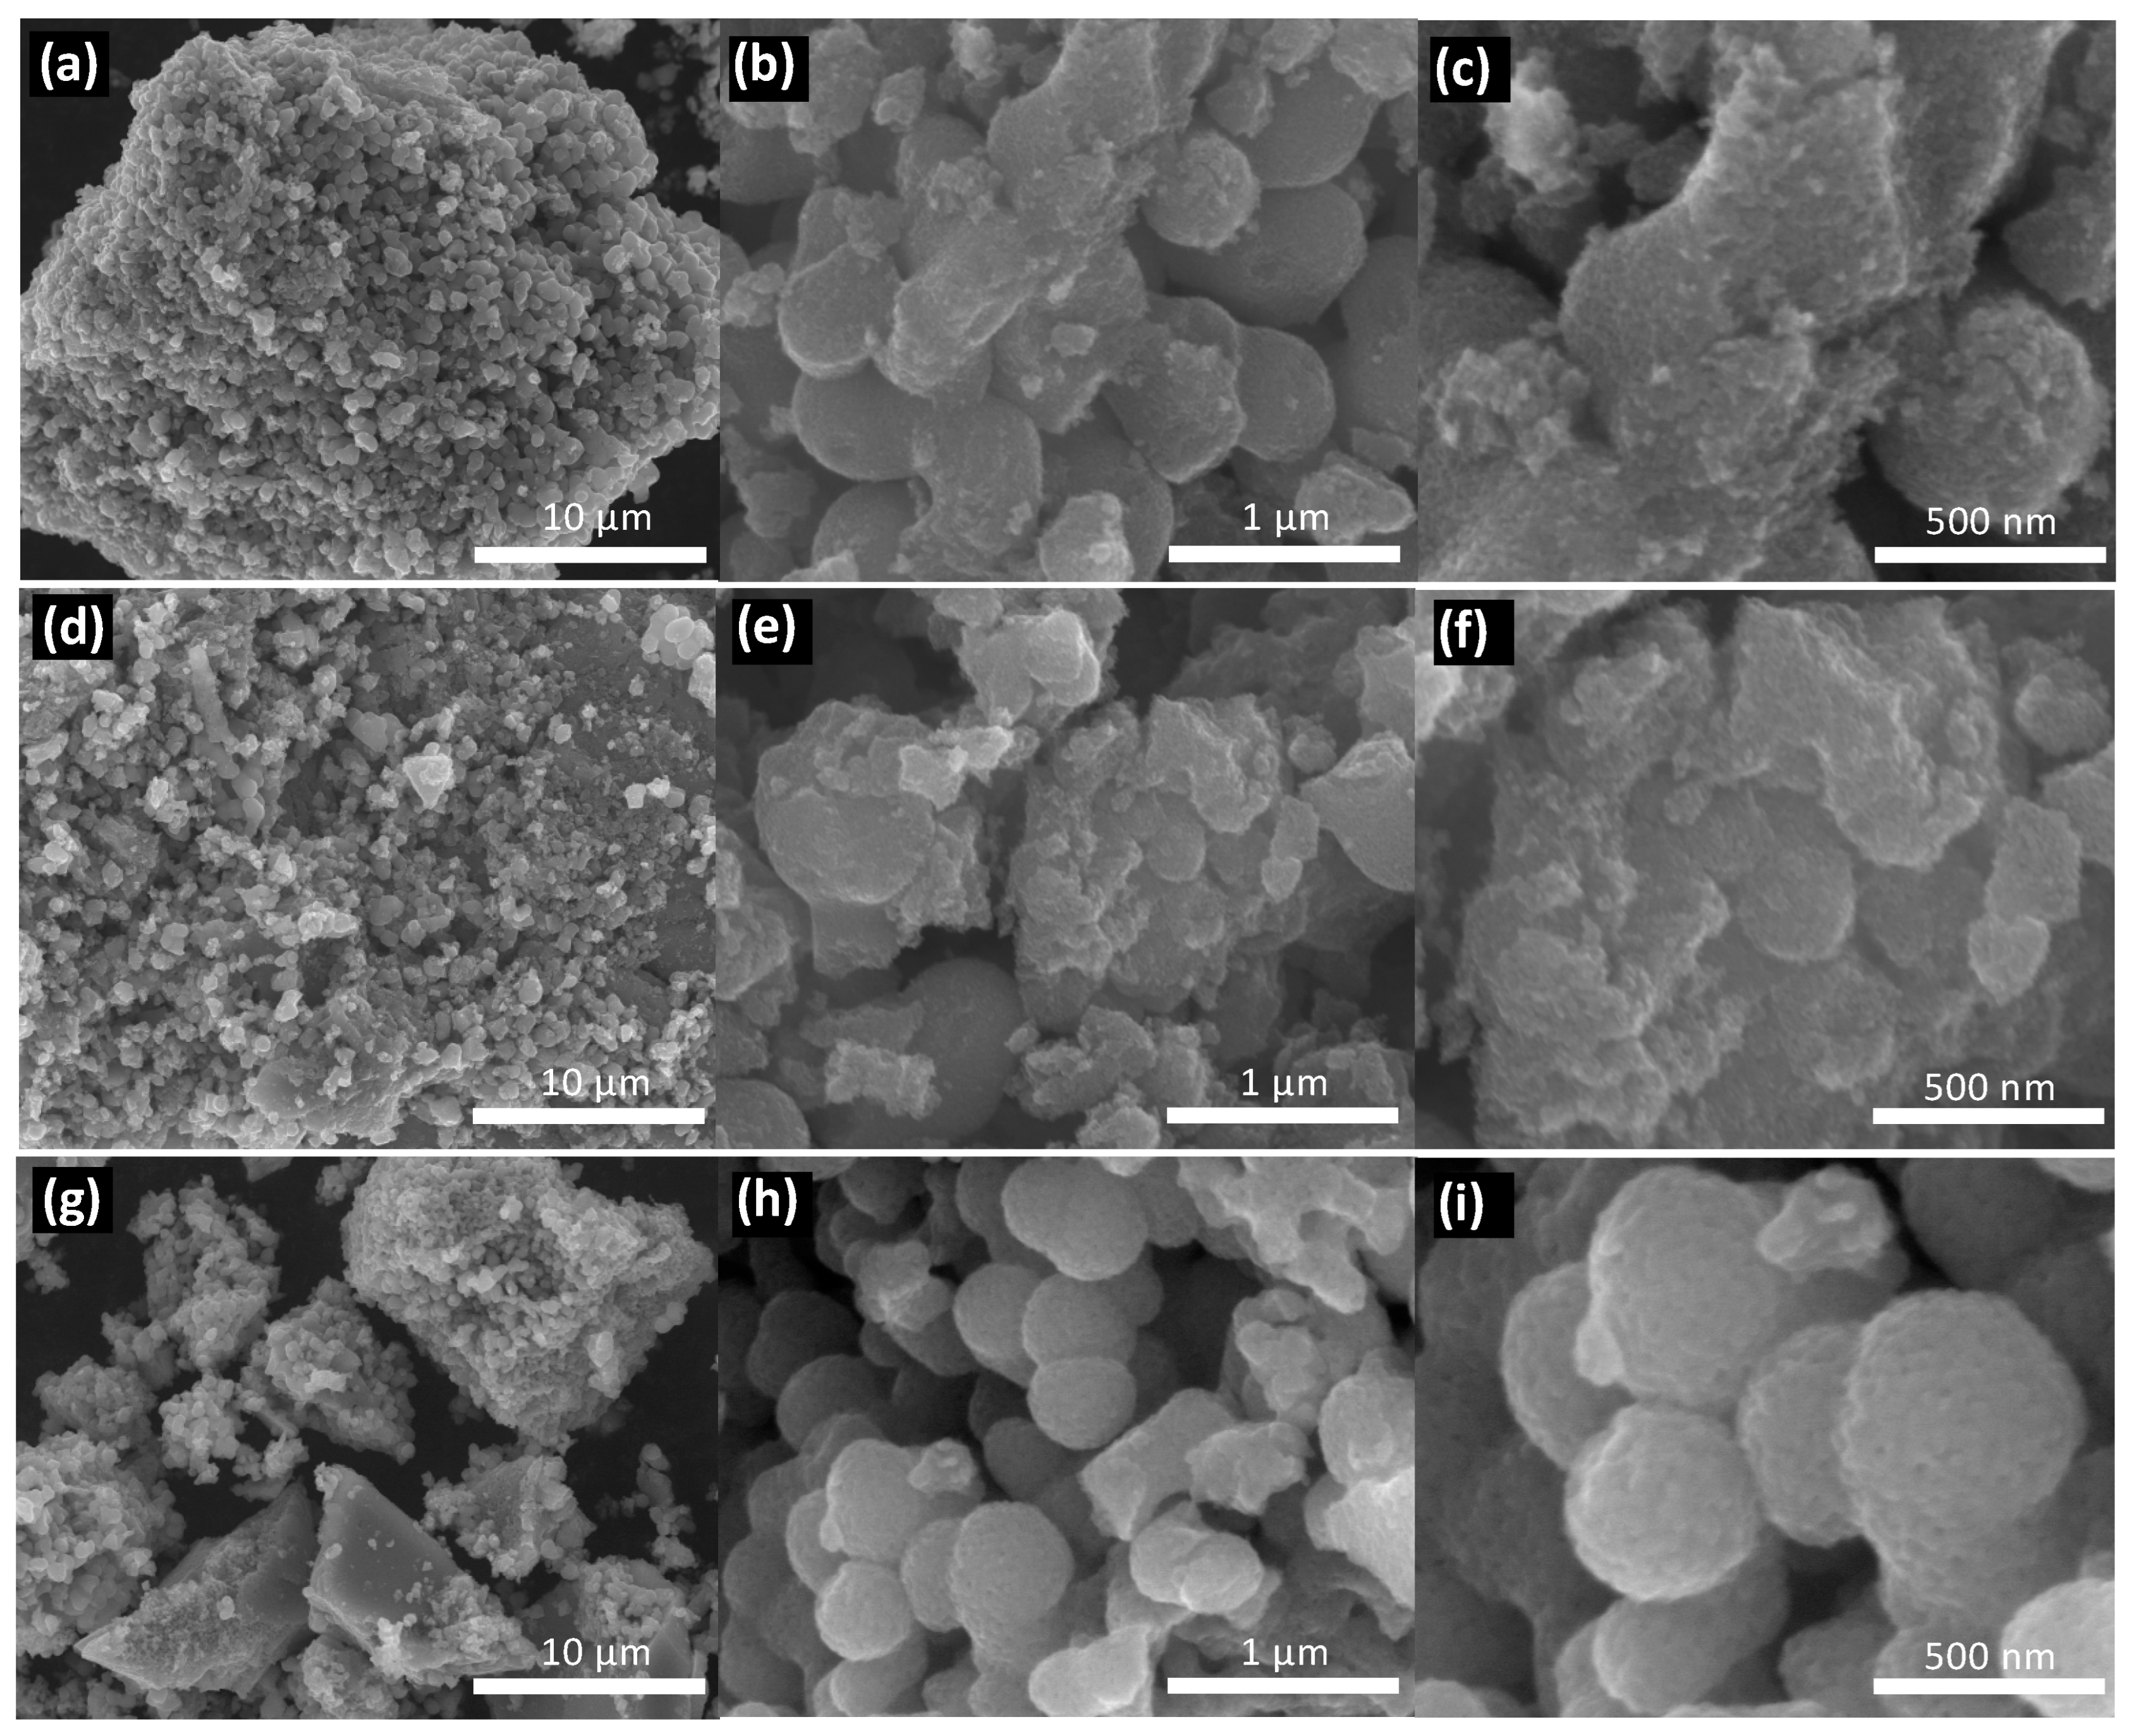
Figure 5.
SEM micrographs of the PS (a) NPs (20,000x) and (b) MPs (5,000x). Inset in (a): FTIR spectra of the PS NPs and MPs.
Figure 5.
SEM micrographs of the PS (a) NPs (20,000x) and (b) MPs (5,000x). Inset in (a): FTIR spectra of the PS NPs and MPs.
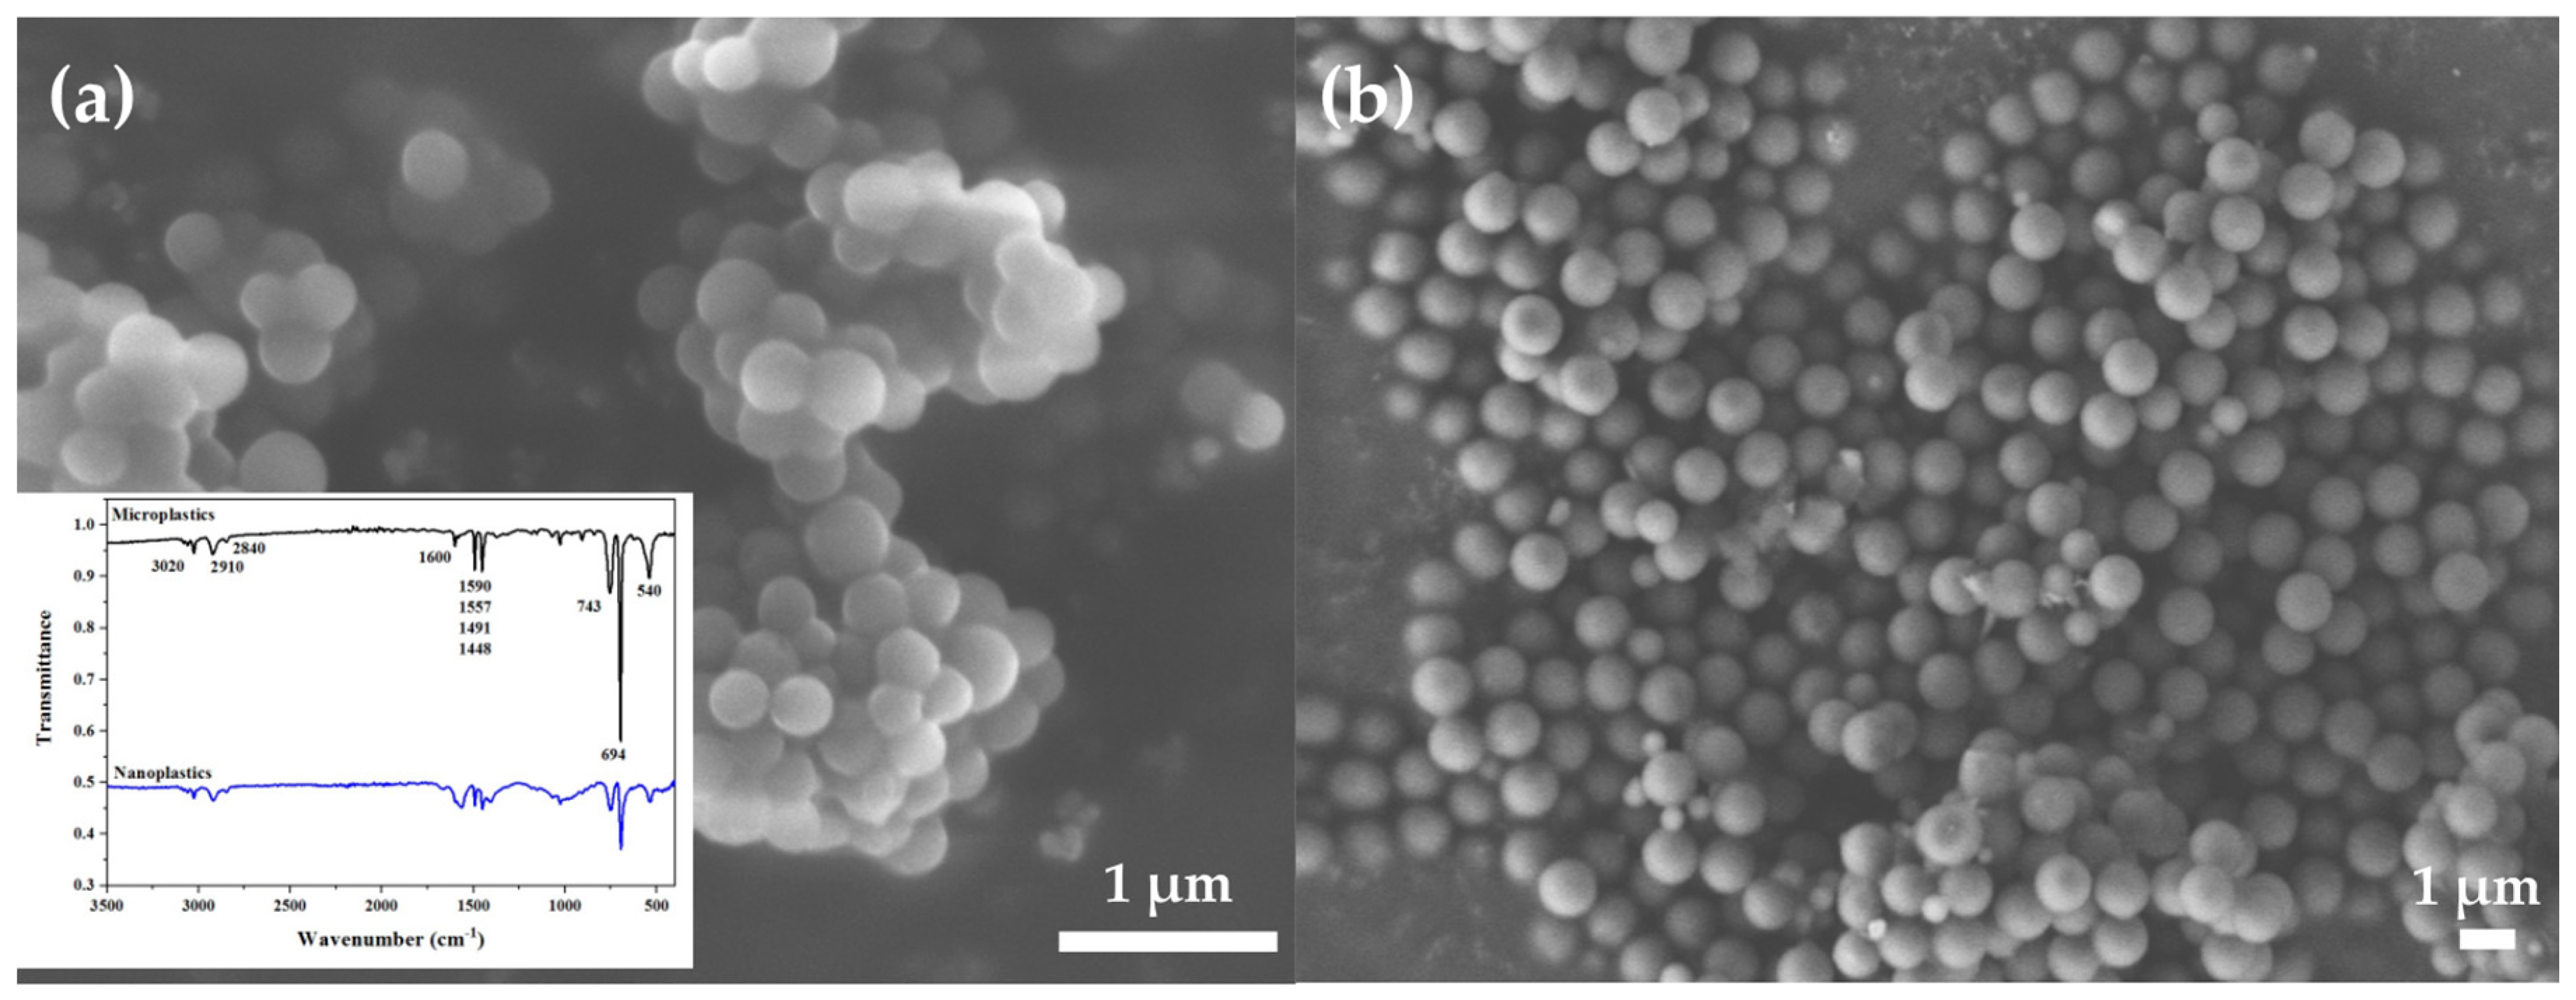
Figure 6.
Photocatalysis of PS (a) NPs and (b) MPs using the M10, M600 and M1200 semiconductors in the form of films. Photolysis is also shown.
Figure 6.
Photocatalysis of PS (a) NPs and (b) MPs using the M10, M600 and M1200 semiconductors in the form of films. Photolysis is also shown.
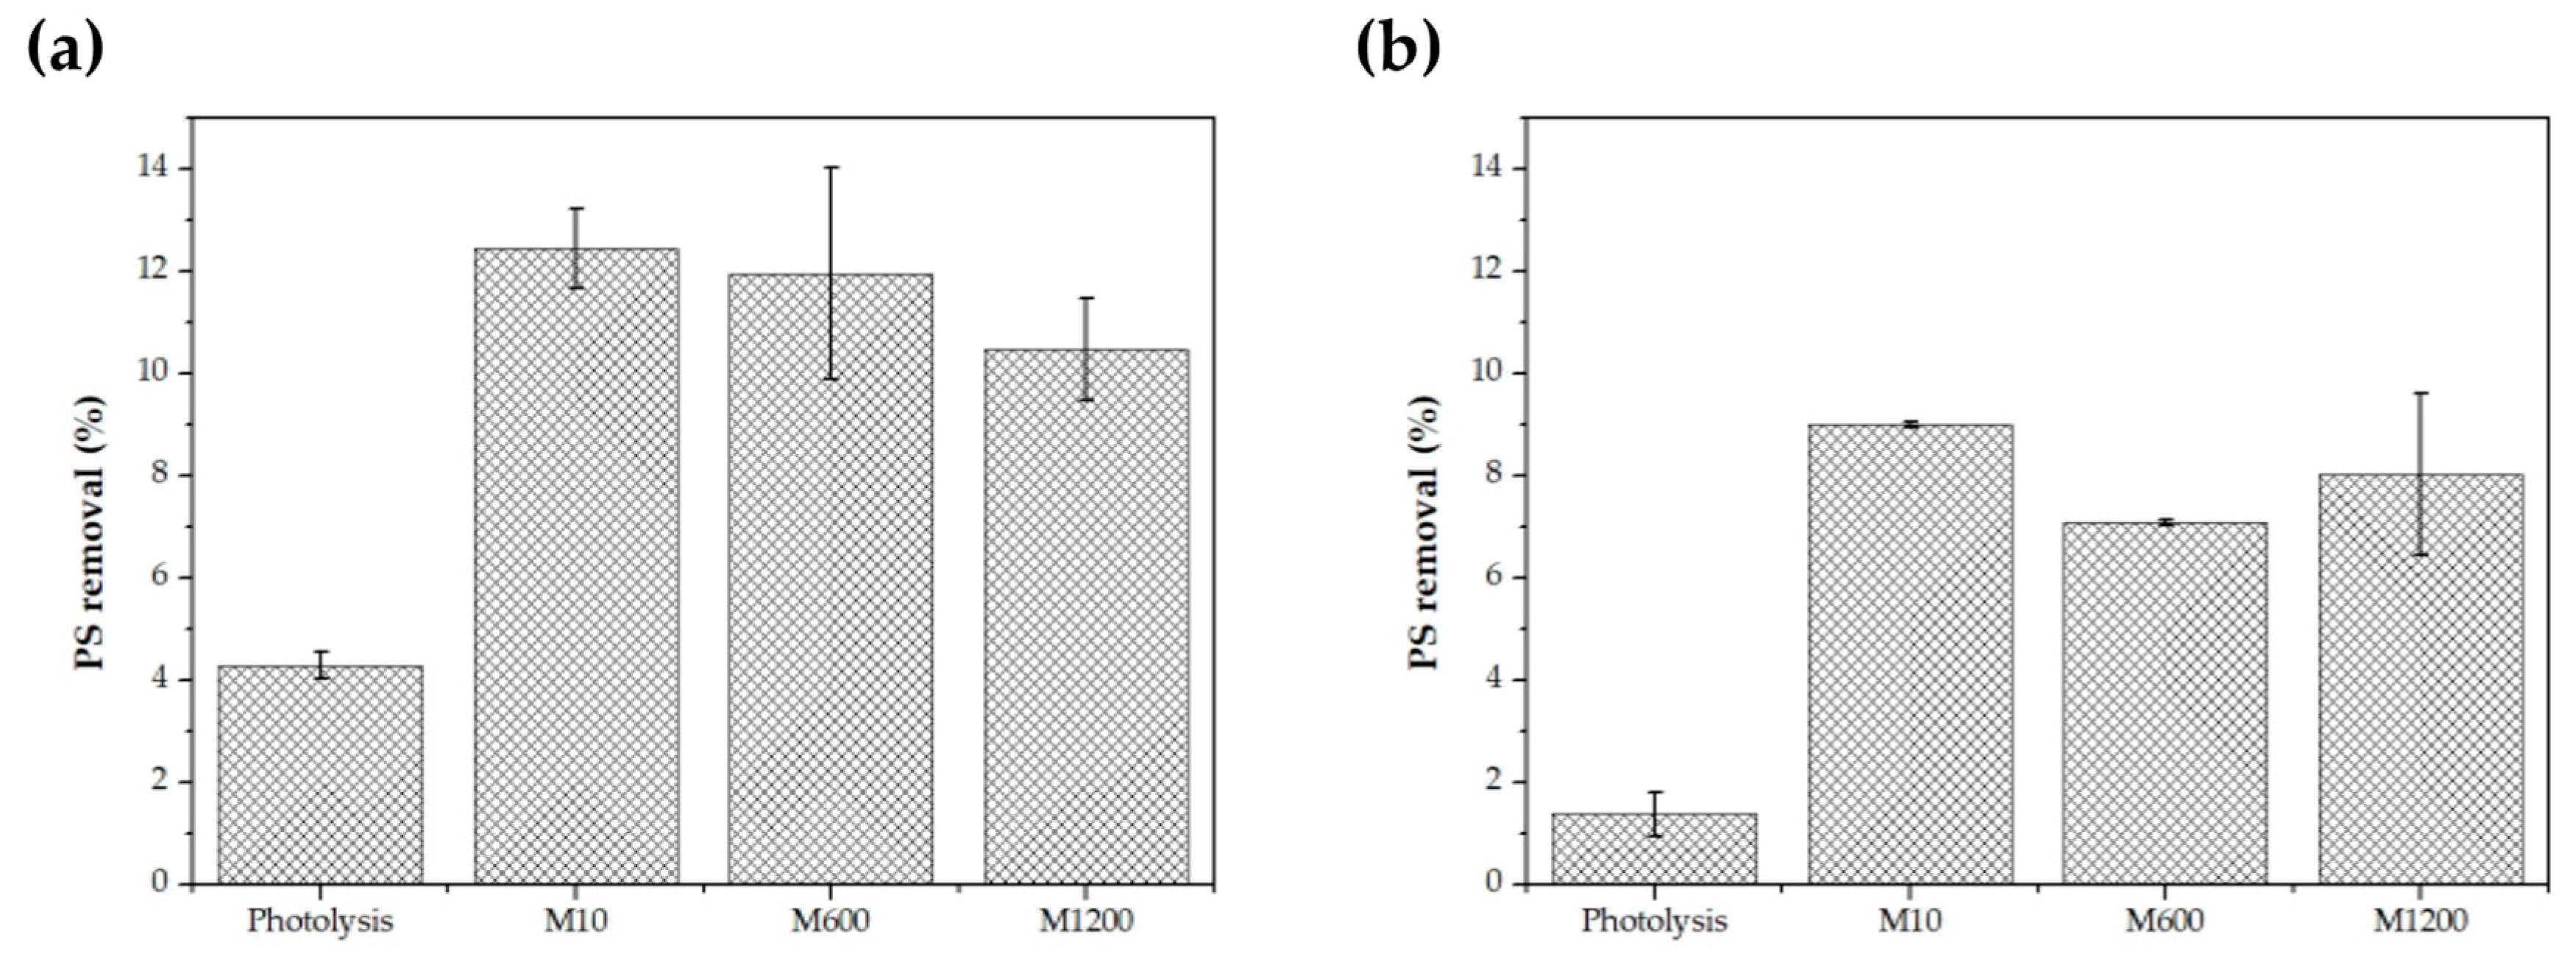
Figure 7.
(a) FTIR spectrum; (b) Optical micrograph (8x) and (c,d) SEM micrographs (400x and 2000X, respectively) of the PE MPs.
Figure 7.
(a) FTIR spectrum; (b) Optical micrograph (8x) and (c,d) SEM micrographs (400x and 2000X, respectively) of the PE MPs.
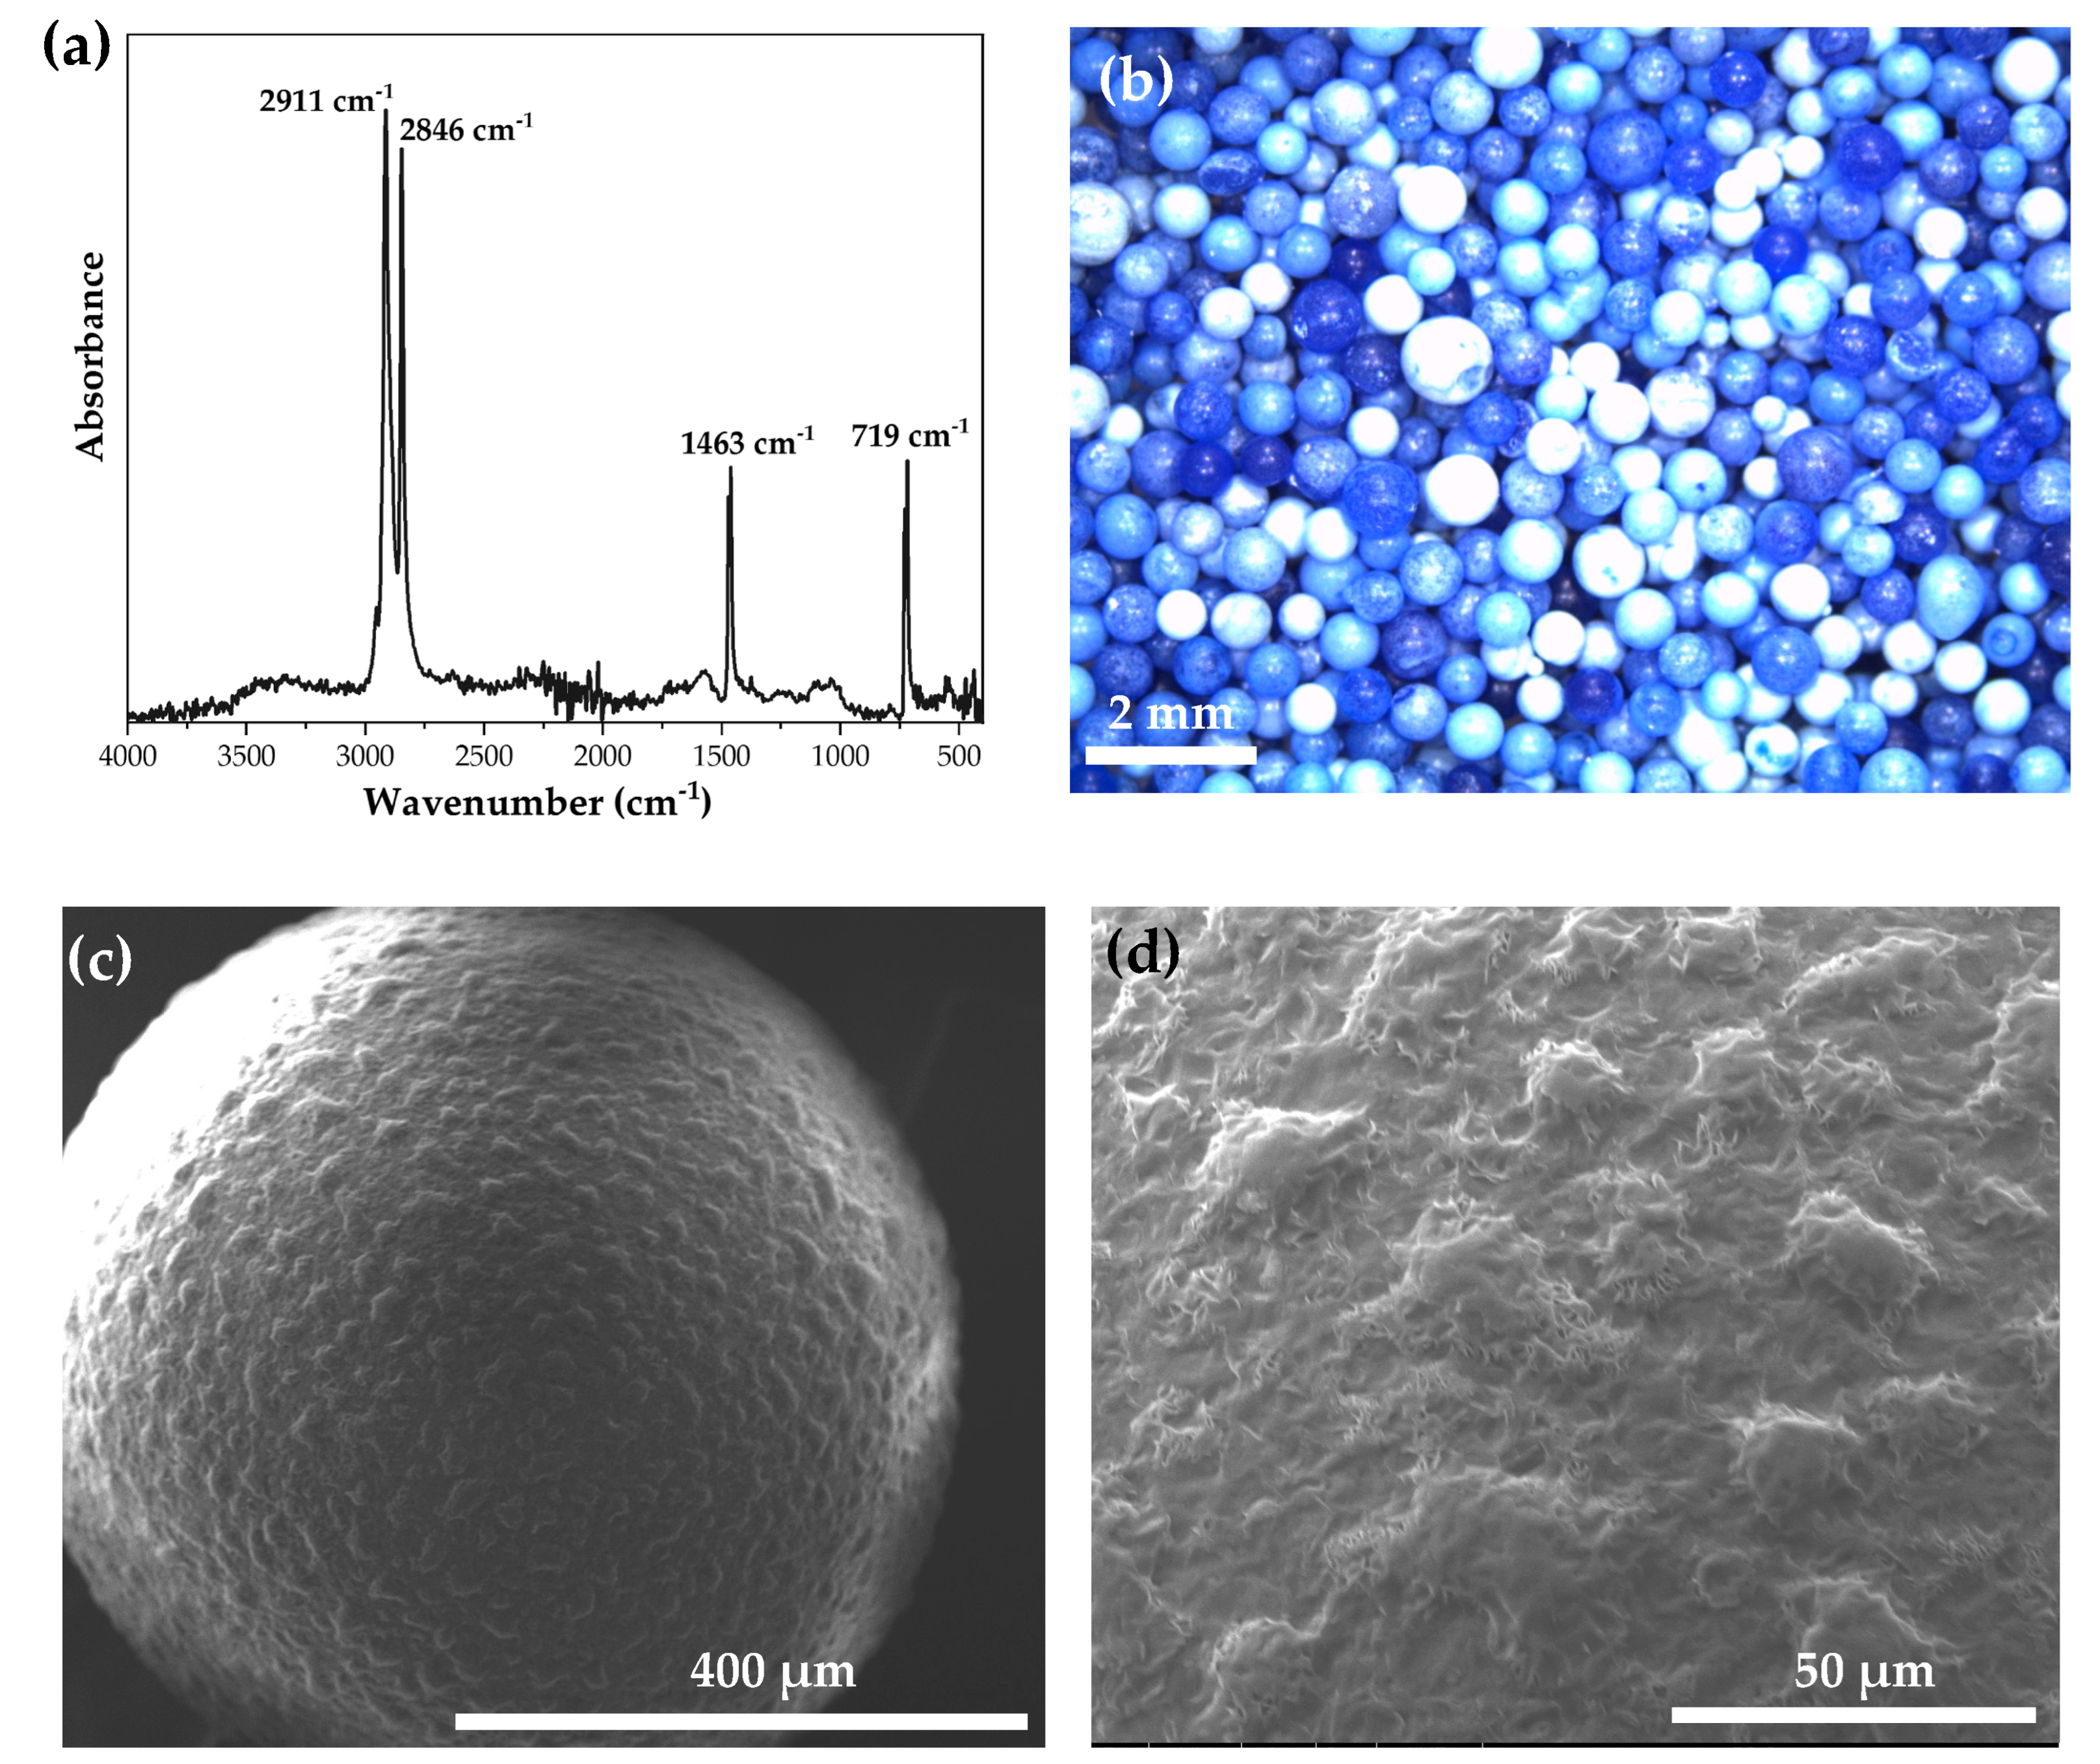
Figure 8.
Photocatalysis of PE MPs using the M10, M10-400, M10-600 and M10-800 semiconductors (as powders). Photolysis is also shown.
Figure 8.
Photocatalysis of PE MPs using the M10, M10-400, M10-600 and M10-800 semiconductors (as powders). Photolysis is also shown.
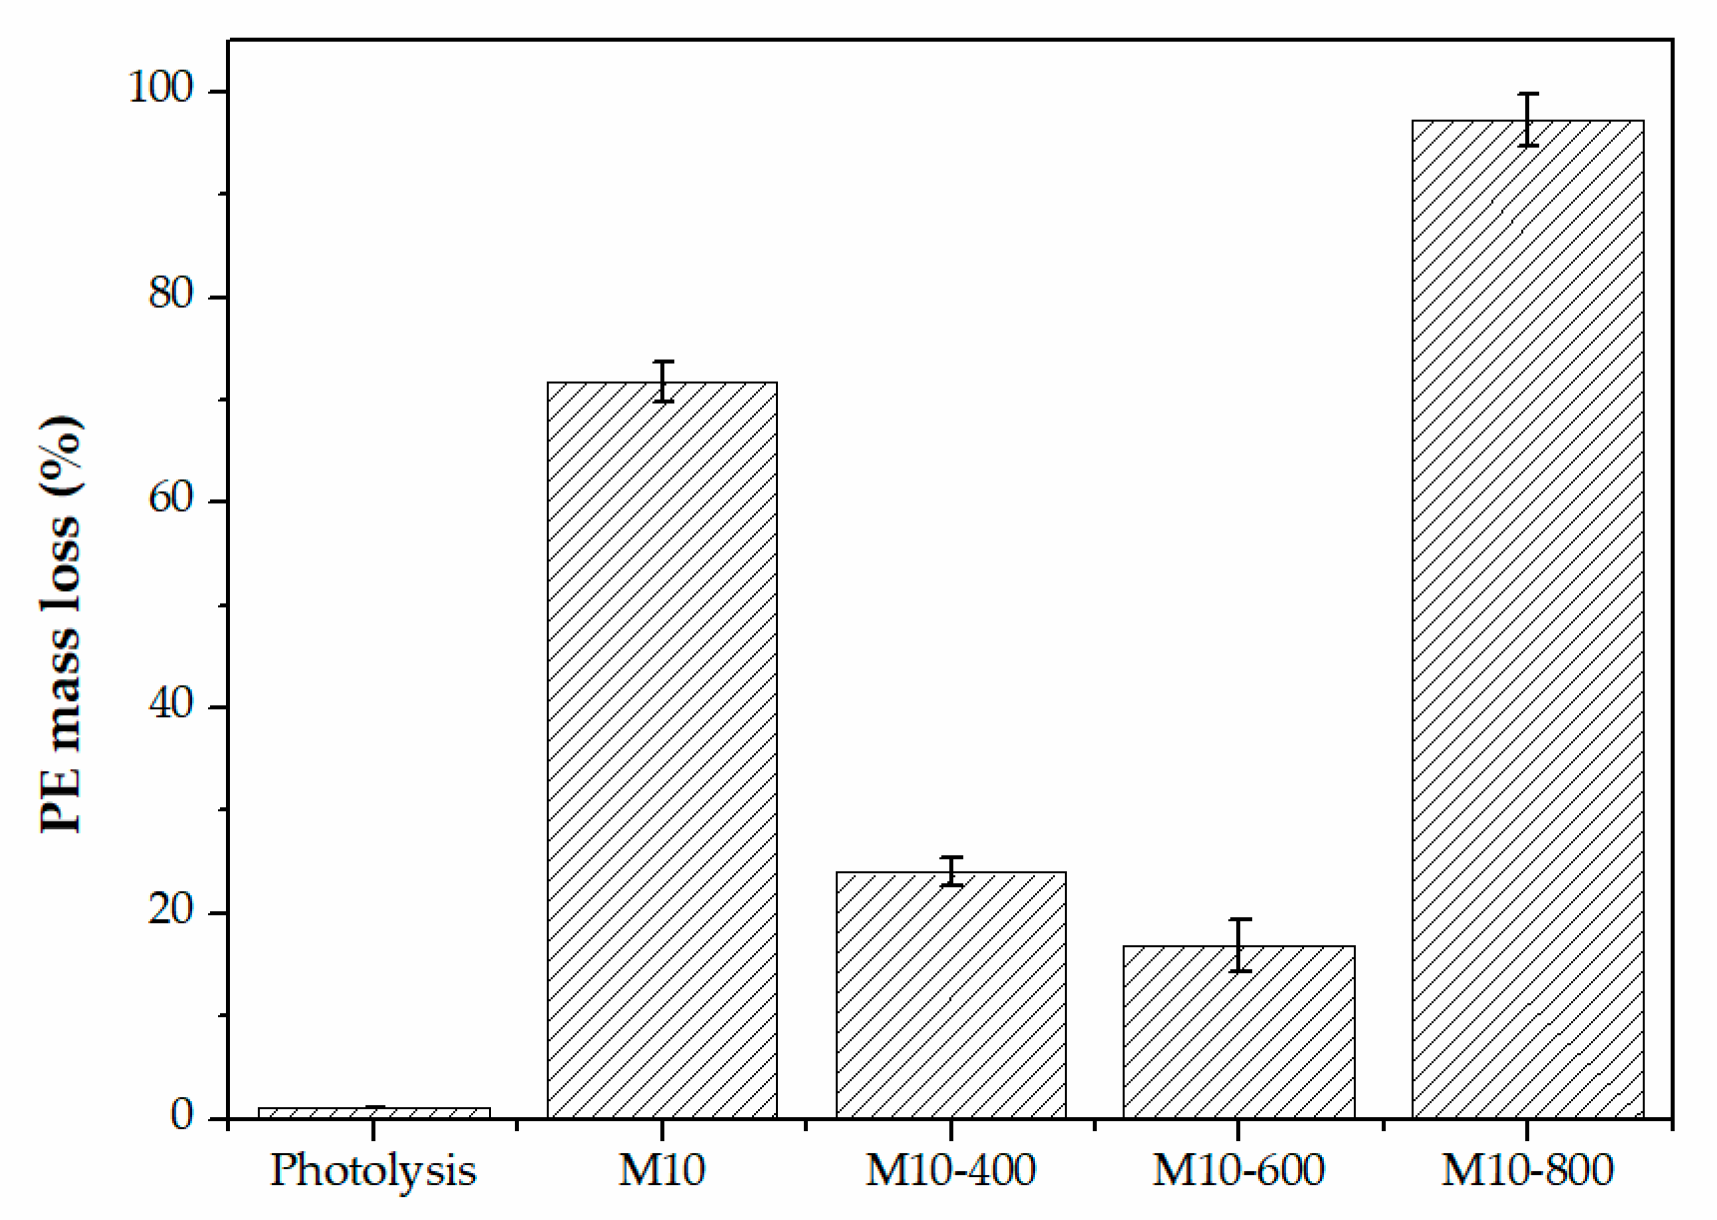

Table 1.
Properties of the semiconductors.
| Semiconductor | Eg (eV) | Wavelength of Light Absorption (nm) | Carbon (wt.%) | Nitrogen (wt.%) |
SBET (m2/g) |
|---|---|---|---|---|---|
| M10 | 2.93 | 423 | 1.37 | 0.41 | 223.2 |
| M1600 | 2.87 | 432 | 0.29 | 0.16 | 171.15 |
| M1200 | 2.95 | 421 | 0.28 | 0.20 | 192.8 |
| M10-400 | 2.88 | 431 | 4.44 | 0.42 | 166.48 |
| M10-600 | 3.02 | 411 | 4.58 | 0.32 | 76.73 |
| M10-800 | 2.99 | 415 | 10.37 | 0.34 | 6.04 |
Disclaimer/Publisher’s Note: The statements, opinions and data contained in all publications are solely those of the individual author(s) and contributor(s) and not of MDPI and/or the editor(s). MDPI and/or the editor(s) disclaim responsibility for any injury to people or property resulting from any ideas, methods, instructions or products referred to in the content. |
© 2023 by the authors. Licensee MDPI, Basel, Switzerland. This article is an open access article distributed under the terms and conditions of the Creative Commons Attribution (CC BY) license (http://creativecommons.org/licenses/by/4.0/).
Copyright: This open access article is published under a Creative Commons CC BY 4.0 license, which permit the free download, distribution, and reuse, provided that the author and preprint are cited in any reuse.


