

Submitted:
19 January 2023
Posted:
19 January 2023
You are already at the latest version
Abstract
Traceability is the ability to determine the path of a product from purchase to consumption to determine when and where it originated. This paper aimed to determine the factors that influence fishers’ decision-making to participate in tuna traceability program, it also explores the determinants of fish catch for small-scale fishers and the feasibility of implementing tuna traceability in the Davao Gulf, Philippines. The result of the interview showed that the significant factors that highly affected the decision-making of fishers in implementating tuna traceability program: boat capacity, fishing hours and communication of fishers (P≤0.05). Household size, years in community, fishing hours, volume of fish sold, and the fishers' communication in the fishing ground (P≤0.05) were other factors that determined the daily catch of the fishers. The results of this study showed that fishers from the Davao Gulf were willing to be part of traceability program that would sustain and increase the value of their fish catch. Moreover, communication was shown to be critically needed in such programs adjusting it for the fish catch to remain fresh or of good quality. Our study will help in deterring and mitigating illegal, unregulated and unreported fishing (IUU) through fish catch traceability.
Keywords:
Davao Gulf
; fisheries management
; small-scale fisheries
; tuna fisheries
; traceability
1. Introduction
In recent years, quality assurance has evolved into a critical component of food safety regulations in the food business (1). Traceability is becoming more popular as a way to support "the right to know" movement where and how seafood product is produced, processed, and traded due to the lack of openness in global seafood value chains (2-3). Wary consumers now clamor for information regarding how their food was harvested, looking for a way to contribute to environmental sustainability. In particular, fish have been promoted as a sustainability strategy, that could provide healthy meat alternative to resource intensive livestock and poultry, and a concern, given the decline of many global fish stocks (4). The council of the European Union (2000) states that the majority of their nations implemented a traceability approach through their policy on food safety system for every commodity.
In 2018, the Seafood Import Monitoring Program (SIMP) was introduced in the United States, requiring importers to disclose important data on 13 IUU susceptible species from the moment of harvest to the point of entry (5). For instance, in Indonesia mandated by Hazard Analysis Critical Control Point (HACCP) and followed by the Ministry of Fisheries and Marine Affairs regulations to keep a record of every stage in the tuna supply chain. IT-Based traceability system has been created to address backward and forward tracking of tuna fish as well as variation and movement throughout a chain including several entities from fishing vessels to retailers ((Kresna & Seminar, 2017). In the Philippines, the private sector together with the WWF have been working to improve the catch documentation and traceability system on handline tuna fishers in the province of Occidental Mindoro and in Lagonoy Gulf in the Bicol Region by using electronic catch documentation and traceability (eCDT) technologies. Downstream actors found beneficial the use of traceability in terms of elimination of widespread food-borne illness (Mai, 2010); increased sales of high-value products (8); enhanced food safety (9); point of origin documentation (10); and helps prevent market fraud and false product labeling. The European Commission (2008) mandated that all fish products imported into their market should be accompanied by a catch certificate attesting to the fish’s legal, reported, and regulated status of fishing.
This paper focuses exclusively on the small-scale fishers around the Davao Gulf for alternative approaches to recording their tuna catches. Most of the tuna catch is derived from small-scale fishing using hook and lines and multiple hook and lines in conjunction with the use of a fish aggregation device (payao) (11). Tuna persists as the top export commodity with a collective volume of 120,000 MT for fresh/chilled/frozen, smoked/dried, and canned tuna products valued at U$ 478 million (12) with examples in General Santos City as one of the tuna export capital of the country (13). In addition, tuna from General Santos City and Davao City Philippines are distributed to markets in other parts of the country, particularly in Metro Manila, and a large portion to Hong Kong, Taiwan, and Japan (14).
However, according to Doddema et al. (15) it is possible to determine how, where, and why social practices are accepted, rejected, or modified by examining how they are carried out and connected to other practices, whereas Bush et al. (2) states that due to multiple constraints the adoption and implementation of management programs are more difficult for near-shore actors. This study therefore aimed to determine the factors that influence fishers’ decision-making to participate in the implementation of a tuna traceability system in Davao Gulf, Philippines with a particular view towards sustainable fisheries management. The feasibility of implementing a tuna traceability system in Davao Gulf has not yet been evaluated in any published studies. In addition, this study also explored the determinants of fish catch for small-scale fishers in Davao Gulf. This study will be useful for the implementation of any traceability system in Davao Gulf, particularly with small-scale fishers.
Materials and Methods
2.1. Tuna Traceability Framework
Small-scale tuna fishing is a common practice in all the study sites in Davao Gulf. The proposed framework for this study illustrates the flow of the tuna traceability system scheme in the Davao Gulf Philippines from the point of catch down to local traders. The framework for tuna traceability includes several actors, including fishing vessels (fishers), enumerators, local traders, and financers. Every actor in the chain has access to the product and the flow of information. The tuna traceability framework was shown in (Figure 1). The framework used in this study was based on the previous studies of World Wide Fund for Nature (WWF), Philippines (17) and Grantham et al. (16). Fishing vessels or fishers are considered here as the first actors who will utilize the mobile app or catch logbook for their catch input data set (date of catch, weight, time, and species caught), with emphasis on vessel licensing and registration. Enumerators have a part in unloading tuna from the fishing boat, identifying the fish catch, and issuing fish catch report verification before being forwarded to the landing site. Fish catch report verification is required to verify the catch and monitor the fishing operations to prove that the fishing activity is under a legal regime. The quality checking for fish caught was usually done at the landing site, to sort the goods and reject fish catch, and issued the catch certificate to the fishers the actor must work closely with the government, particularly when it comes to approval and certification (6) for legitimacy. Access to the main public market was constrained by the catch certification rules, which demand confirmation that seafood is permitted, recorded, and governed (15) and to obtain and maintain certification (18). After receiving the catch certificate, fishers were able to sell their fish catch to local traders and the local traders will now ensure the quality of the fish that they purchase because of the catch certificate that the fishers have. Local traders encourage purchasing in one place to obtain a tuna traceability system. Some fishers sell their fish catch directly to their financers (who will finance their expenses during the fishing operation) but before that, fishers are still required for checking their fish catch by the enumerators to acquire fish catch report verification that will be sent to the landing site for quality checking and get the catch certificate before selling it to their financers to obtain traceability in the certain area.
2.2. Description of the Study Sites
This study was conducted in Davao Gulf which is one of the nation’s richest fish production in the Davao Region, which is situated in the southeastern portion of Mindanao Island Philippines. It has a 3,087 km2 of water surface area (19). There were seven study sites: a) Mati which is the capital city of the province of Davao Oriental and has a population of 147,547 people with a total of 5,834 registered fishers most of the local people rely on agriculture, and agro-industries and are known for its small hook and line fishers; b) Lupon which is a first-class municipality with a total land area of 886.39 km2 and a population of 66,979 people with 1,225 registered fishers, well-known for its hook and line fishing; c) Governor Generoso a coastal municipality has a land area of 365.75 km2 with a total population of 59,891 people with 2,300 registered fishers. It is well known for its commercial fishing and with four ringnet fishing companies; d) Santa Maria has a population of 57,526 people with 2,795 registered fishers known for small-scale and commercial fishers; e) Malita, the capital of the municipality of the province of Davao Occidental and has a population of 118,197 people with 2,450 registered fishers most of which are using hook and line fishing gear; f) Santa Cruz has a population of 101,125 people with 5,166 total registered fisher folks. The last study site was Samal (IGACOS) with a population of 116,771 with a total of 4,135 fishers and widely known for its tourism activities in the Davao region (Figure 2).
2.3. Data Collection
Field sampling began in August to September 2022 with respondents coming from seven coastal fishing communities along the Davao Gulf, with a minimum target of 60 fishers per municipality: Mati (n=56), Lupon (n = 56), Governor Generoso (n=27), Santa Cruz (n=16), Samal (n=28), Malita (n=47), and Santa Maria (n=34) with a total of N=264 out of 382 respondents interviewed after qualifying small-scale fishers see (Table 1). A pilot test of the interview was first conducted before the actual interview with only 15 respondents to identify the feasibility of implementing tuna traceability in the study area. A semi-structured questionnaire was used for the survey of small-scale fishers that usually used hook and line as their primary fishing gear. Letters of permission were given to the Municipal Agriculture Office (MAO) as well as to the office of each barangay captain in the area of the study to ask permission to conduct interviews. Respondents were randomly selected in each municipality for one-on-one interview in the fishers’ homes and landing sites about the feasibility of implementing tuna traceability. The survey collected data on the socio-demographic profile of respondents, especially their (age, years in the community, position of respondents in the boat, household size number, monthly income), fishing characteristics like (years of fishing, number of fishing hours, number of fishing days, fishing gears) and catch characteristics (catch per trip, normal, minimum and maximum catches). They were also asked with regards to their communication between fishers, problems, and benefits of accepting a traceability system as well as their perception of the possible implementation of the tuna traceability system. Most respondents have not heard about a traceability system or any fisheries or local government survey that has been conducted on them. Respondents were also asked about market access (where they usually land their fish catch and to whom they sell their fish catch) and what was the volume of fish catch left for the family or fish sold. The questionnaire was translated into the local language (Cebuano) during the face-to-face interview.
Respondents were mainly boat owners, and boat operators, and others are passengers and crew. They are small-scale fishers’ mainly using hook and line as their fishing gear and fishing within Davao Gulf. The owner and operator were aware of the season of catching tuna, catch characteristics of the fish, and many aspects related to fishing (Table 1).
2.4. Data Analysis
The data were encoded in Microsoft Excel Software. Some of the variables in the questionnaire were categorized and analyzed through descriptive design and percentages. Sociodemographic data such as age, household size, years in the community, years fishing, catch per trip, number of fishing hours, boat capacity, and a monthly income as well as the policy implementation such as their communication with other fishers in the fishing ground, agree on tuna traceability implementation, their foresee benefit, market benefit and foresee problem to compare the result in different study sites. The average reported catch per trip (kg) and the number of hours spent fishing (hr.) were used to calculate the CPUE. Furthermore, to determine the influence of various factors related to fishers response regarding the implementation of tuna traceability, a logistic regression was used. Additional data analysis using multiple linear regression was then applied to determine factors that influences fishers daily catch.
3. Results
3.1. Fishing Characteristics of the Fishers
In the seven study areas, fishers from Mati and Santa Maria were younger than most (42 years) compared to fishers from Sta. Cruz (53), while Governor Generoso had the oldest fishers at 88 years old followed by Mati at 82 years old. The mean household size was 5 and ranged from 1 to 18 members in the family, mainly from Mati (18 members) and Lupon (15 members). On the average number of years of stay in the community, Santa Cruz and Samal have the highest average years of stay at 44 while fishers from Mati had a maximum of 82 years (this means they are not migrating or moving). However, fishers from Santa Cruz had the highest average recorded in terms of number of fishing experience (30 yrs), with highest recorded fishing experience of 67 years from Mati. Average boat capacity was 200 kg while the average catch per trip was 14 kg. In terms of their number of fishing hours per trip, small-scale fishers mostly had an average of 12 hours per trip but could go up to 24 hours from the time of arrival in the fishing ground up to their last catch and trip back to the port (see Table 2).
3.2. Factors Affecting Daily Fish Catch of Fishers
To determine the determinants of fish catch, which are factors that could influence the daily catch of fishers. We selected these factors based on our previous researches in Davao Gulf (19-21) which includes age, household size (HHS), income and years in community, fishing experience etc. with the inclusion of membership to fishing organizations and communication with other fishers which were categorical variables. The results suggest that there were highly significant associated factors to catch (df=6, MS=1.175, F=12.02, P=0.001) that includes the following, household size (df=1, MS=0.593, F=6.06, P=0.014), years in community (df=1, MS=0.586, F=5.99, P=0.015), and number of hours per fishing trip (df=1, MS=0.586, F=5.99, P=0.015) as well as the volume of fish sold (df=1, MS= 3.868, F=39.56, P=0.001 by the fisher and the fishers’ communication (df=1, MS=0.692, F=7.08, P=0.008) in the fishing ground. These variables represent social factors (e.g. household size), and local knowledge of the fishing ground (years in community), fisheries factors (number of hours fishing), economics (volume of fish sold), and communication. These factors determined the daily fish catch of fishers examined in this study (see Table 3).
3.3. Factors Influencing Full Implementation of Tuna Traceability
In order to determine the relationship between the yes or no responses of the respondents regarding the full implementation of the tuna traceability program, we used a binary logistic regression. In this case, we used the same factors as we did with the catch determinants but we added market benefits of traceability aside from the general benefits seen by fishers regarding traceability. The objective was to determine which of the factors influences the decision of fishers to implement tuna traceability. We therefore selected the same factors based on previous researches which includes age, HHS, Income and years in community, fishing experience etc. with the inclusion of membership to fishing organizations and communication with other fishers, benefits of tuna trace, which include the market benefits which are categorical variables. The results suggest that there were only few highly significant associated factors (df=5, MS=0.702, F=6.52, P=0.001 which include fishing trip (df=1, MS=0.882, F=8.19, P=0.005, boat capacity (df=1, MS=0.885, F=8.23, P=0.004) and communication of fishers in the fishing ground (df=1, MS= 0.699, F=6.50, P=0.011). These variables represent mainly fisheries factors (fishing trip and boat capacity), and communication that occurs between fishers in the fishing ground. These factors highly influenced the decision of fishers to choose for full implementation of tuna traceability (see Table 4).
Fishers’ Communication in the Fishing Ground
In all the study sites, 92% of respondents were communicating with other fishers in the fishing ground through verbal, hand signals and the use of mobile phones. In contrast, about 8% stated that they did not communicate with other fishers before seeing each in the fishing ground (Figure 3A).
Tuna Traceability Implementation
About 94% of the respondents favor the implementation of tuna traceability for the following reasons that that the government will be the one to start the new policy (12%), dole outs from the government especially when the government will know that there is a decrease in their fish catch they will give assistance to them or alternative livelihood (49%), if there is a beneficial effect to the fishers and also for the consumers just like increase of catch price, catch origin, catch monitoring, and for the safety of the consumers (11%), and if the fishers will be trained that would help them to have an idea and knowledge for the new system (13%). Other fishers see that implementing catch traceability will give disturbance their work, and hassle in scanning and recording their fish catch (14%), and for that reason, they are not willing to be part of the project (Figure 3B).
Possible Benefits of Full Implementation
Most of the respondents perceived benefits in the implementation of tuna traceability. The benefits that they foresee were the following: now that their fish catch is traceable, they can inform their financiers and the local traders about the origin of their fish catch and fishers also monitored their fish catch and which helps them to know their actual catch before selling it to the local traders and financers (28%). Dole-outs from the government are highly desired by fishers especially when they notice a decrease in their catch through their records (12%). Fishers perceived that if their fish catch will be recorded and the data will be sent to the government and figure out their declining catch, there will be assistance from them and perhaps an alternative income for their survival. Four percent of them are looking forward to learning new knowledge in terms of fishing under the introduction of the new system because according to the respondents, they also need a change in terms of their fishing activities for the betterment of their livelihood, and 40% of the fishers do not have any idea of what benefits they will get for the implementation of tuna traceability unless they will undergo the new system (Figure 3C).
Market Benefit
Respondents in the certain areas had no idea if there were benefits in the market through the introduction of tuna traceability (25%) because they were not able to experience the new system. Thirty four percent (34%) foresee that if their catch were traceable, it will help them to sell their fish catch easily with an increase of price value (4%) and if there were problems that the fishers encountered in terms of selling in the market they will get dole outs from the government (6%). Some of the respondents also think about the safety of the consumers that consumed their fish product (21%) but eleven percent (11%) did not see any change with the implementation of tuna traceability because for them, they will still sell their fish catch without the presence of the new policy (Figure 3D).
Foresee Problems
In the implementation of tuna catch traceability, there were problems being foreseen by fishers such as it might cause hassle and disturbance for their work, for the reason that they are just small-scale fishers and it will affect their focus and time of fishing (73%). The other problem that they foresee is the decrease in their fish, instead of being given their full focus on how to get more fish they will now include the scanning and recording of their catch in every tuna that they will get, and in that way, it will affect their fish catch (16%) and also, difficulty in using gadgets like a cellphone to scan their fish catch (7%). Most of the respondents are old enough to utilize gadgets and it is very hard for them to scan and record their data using that gadget. Twenty percent of the fishers had no problem with the implementation of the tuna traceability system, if it is being implemented in their area, they are willing to be part of the new system, and 24% of the respondents do not have any idea if there is a problem caused by the implementation unless they will experience the new system might be implemented (Figure 3E).
Favor Having a Traceability App
Respondents in the Davao Gulf, Philippines agreed on having traceability app. In terms of preferred traceability platforms, prefer to use a catch logbook to record their fish catch because for them it is much easier to use than the mobile application. Fishers anticipated that when there is an existence of traceability app will help them to make their catch traceable and know the origin of their fish catch (44%) and if there is a presence of the catch record it will serve as a guide for the traders to make sure the quality of the fish they purchase, they will also know the exact amount or how many kilos their fish catch through this app and make their catch be recorded (32%) for easiest transactions between the fishers and the local traders or financers. When there is a traceability app and scan of all their fish catch, small-scale fishers longing for assistance from the government like they want to have formal training about the usage of the app and also, they are looking forward to the dole outs from them when the government notices the decreasing number of fish caught thru the recorded data from the application of the new system (12%). Some respondents stated that having a traceability app is a burden for their work, hard to use gadgets like cellphones, they don’t have enough time to scan their catch and it is a work disturbance (12%) because their focus is on how to catch more fish rather than scanning and recording them. Most of the fishers don’t have mobile phones and those fishers preferred to use logbooks (Figure 3F).
4. Discussion
4.2. Factors Affecting Fish Catch
The primary source of seafood for coastal and rural community in developing countries is small-scale fishing (22). The factors affecting the daily fish catch of the fishers in the respondents in the Davao Gulf, Philippines were the following: their household size, years in the community, number of hours per fishing trip, and the volume of fish sold. Fishers choose to spend more time in the fishing ground instead of doing back and forth to catch more fish and save money for the expenses. The more they stay longer in the fishing ground, the more chances of getting more fish to be sell in the market to sustain their daily needs especially if they had a big family. Live longer in the coastal area had a significant for them because they are much familiar when and where did the fish is more abundant because fishermen distinguish an environmental clues that can tell whether they can go fishing or not (23). This characteristic of a fishermen will help to create appropriate management techniques to assure sustainability because groups of people living along the area have dependent on marine resources (24). Traceability helps the small-scale fishers livelihood if the buyers and consumers will know the origin of the fish product and it is essential because they are able to know where and how seafood is processed and (2-3). Communication between fishers is essential to inform other on what area does the fish is abundant and it also help them to had a companion in the fishing ground especially when they go farther. Fishers frequently believed that fishing grounds farther away would produce a better amount of fish catch (25-27).
4.2. Factors Affecting the Implementation of Traceability
Food is the primary need of individuals and it is important to know the quality of the food and if it is safe to consume, and traceability is a method to provide safer products from the origin, producers to consumers (28) to avoid the production of the poor quality of the products that the consumers consume (29). The majority of the respondents in Davao Gulf, Philippines are willing to be part of the implementation of tuna traceability. Fishers that take longer in the fishing ground, with high boat capacity and communicated with other fishers are the factors that highly influenced the decision of fishers to choose for full implementation of traceability includes the fishing trip, boat capacity and communication of fishers in the fishing ground. There is a lack of information that accurately describes the operations of small-scale tuna fishing (30) and because there is a lack of information with the fishers, the IUU fishing controversy has produced concerns about these small-scale fisher’s unreliability and criminality are more common (30-31). The importance of the traceability is to reveal what is legal, reported and regulated from fishing to downstream consumers in order to improve their livelihood (2). Traceability is really important to determine the illegal fishing activities that could affect the livelihood of other fishers and to avoid the production of unsafe food in the market. Also, traceability is very essential tool in all the actors in food value chain in terms of gaining consumers confidence with the products, ensure the quality of the products, avoid illegal production, competence development, market growth and sustainability (32).
4.2.1. Factors Affecting Fisher’s Communication
The most valuable fishers’ influences include the use of resources, particularly in activities that are significant in fishing coastal ecosystems (33). Most of the fishers in Davao Gulf, Philippines stated that they communicated with other fishers in the fishing ground before they go for fishing to gather information on where areas the fish is abundant, and these connections will not only help them to provide access to fishing grounds but they also had a positive impact on how various communities interacted together (34). On the other hand, communication between fishers about their fishing grounds caused the other fishers to migrate to that certain area and it affects the local fishers living in that area (35). Small-scale fisheries are now facing difficulties, including changes and development in marine coastal management and human involvement activities (36). The movement of fishers in the different fishing grounds through communicating with other fishers is one of the problems in tracing the fish catch because those fishers do fish activities in a different area as long as there is a lot of fish as a way of living and with that matter, their fish catch can no longer traceable and it is very essential to know the origin of the fish product to avoid the risks associated with unsafe foods (37). In this case, traceability is important in determining the registered fishers in a certain area by providing the origin of their fish catch through their records using the traceability app.
4.3. Importance of Communication in Social Network in Fisheries
A social network is one of the components used to improve the management of fisheries governance and established fishing rules (38). Even for the efficient implementation and observance of environmental policy, it has been indicated that social networks could be more significant than the presence of formal organizations (39). One of the essential characteristics of social networks is that instead of being divided separately into the separate group they should have unity to work together because communication is important in the social network as it serves as the main channel in the flow of information and resources to promote human action (40). Hence, the actors would cooperate better if they agreed on common rules and procedures, they work together to achieve a common goal, handled conflicts, shared information, and developed common knowledge (41) and if these actors collaborated there is a good effect on their beliefs that makes them work together and develop trust in the government and other stakeholders related to fisheries (34). The study of King (42) also showed that actual development in the decision-making processes occurred only when local fishermen were able to include outside organizations that were not even directly involved in managing natural resources. Therefore, it would seem that for bridging ties to be truly effective, they sometimes need to link together several different levels of authority. However, for the social network to provide information over time, actors select voluntarily their connections based on their personal preference for there to be a long-lasting flow of information (43).
5. Conclusions
The study proposes the approach to implement tuna traceability in Davao Gulf, Philippines and the focus of the study are the small-scale fishers. Despite the problems that they perceived in the implementation of tuna traceability in Davao Gulf, Philippines like it caused hassle to their works, ninety four percent of the interviewed fishers are willing to participate in the implementation. The household size, years in the community, number of hours spent in fishing, fish sold, and communication are the factors that affect the fishermen’s daily catch. Additionally, the fishing trip, boat capacity, fishers communication are factors that could affect the fishermen’s decision to fully implement tuna traceability. Communication has a significant impact on the fishing industry because it facilitates the exchange of information among fishermen in the fishing grounds. If there is no conflict, there is a high probability that they will band together to achieve their common goal, which helps to improve fisheries management.
Fishers also revealed that their fish catch are affected by the illegal fishers, and for them having a traceability system is a big help to determine the illegal fishing activities through their records coming from the system and also with the help of the government. To avoid illegal, unreported, and unregulated fishing activities, traceability is being incorporated into public governance structures to track and share the flow of information among value chain participants. As a result, all fish products entering the market must be accompanied by catch certificates that confirm the fish’s legal, reported, and regulated status (44) and for certified items, a full chain of custody from harvest to retail is required under the private governance arrangements (45). The introduction of tuna traceability in the Davao Gulf, Philippines won’t actually guarantee that IUU fishers won’t be there, but it will bring improvements to avoid more illegal activities in the fishing area through tracing.
Author Contributions
“Conceptualization, E.D.M. and M.M.C.; methodology, E.D.M., M.M.C., I.M.N., C.C.P.; software, E.D.M.; validation, E.D.M., I.M.N., C.C.P.; formal analysis, E.D.M., M.M.C.; investigation, E.D.M., M.M.C., I.M.N., C.C.P.; resources, M.M.C., data curation, E.D.M.; writing—original draft preparation, E.D.M., I.M.N., C.C.P.; writing—review and editing, E.D.M., M.M.C.; visualization, E.D.M., I.M.N.; supervision, E.D.M., M.M.C.; project administration, M.M.C.; funding acquisition, M.M.C.;. All authors have read and agreed to the published version of the manuscript.” Please turn to the CRediT taxonomy for the term explanation. Authorship must be limited to those who have contributed substantially to the work reported.
Funding
This research was made possible through the funding of PCAARRD (Philippine Council for Agriculture, Aquatic and Natural Resources Research and Development) for the project: Developing a Point of Catch to Plate Traceability System for Tuna in Davao Region.
Informed Consent Statement
Informed consent was obtained from all the subjects involved in the study.
Data Availability Statement
Data is available upon request from the authors.
Acknowledgments
We want to acknowledge the help of the fishers who took the time to participate during the interview and the Municipal Agriculture Office who assisted us during the interviews. .
thank Mike Bersaldo for the map he made for this study. We are also thankful for the assistance of Rojen Calumba, Rhea Madelle Francisco, Faizal John Untal for helping us to gather data, and Mike Bersaldo for the map he made for the study.
Conflicts of Interest
The authors declare no conflict of interest.
References
- Beulens, A. J. M., Folstar, P., & Hofstede, G. J. (2005). Food safety and transparency in food chains and networks Relationships and challenges. Food Control, 16, 481–486. [CrossRef]
- Bush, S. R., Bailey, M., Zwieten, P. Van, Kochen, M., Wiryawan, B., Doddema, A., & Mangunsong, S. C. (2017). Private provision of public information in tuna fisheries. Marine Policy, 77(June 2016), 130–135. [CrossRef]
- Lewis, S. G., & Boyle, M. (2017). The Expanding Role of Traceability in Seafood : Tools and Key Initiatives. 82. [CrossRef]
- Seto, K., & Fiorella, K. J. (2017). From Sea to Plate: The Role of Fish in a Sustainable Diet. Frontiers in Marine Science, 4(74). [CrossRef]
- Willette, D. A., & Cheng, S. H. (2018). Delivering on seafood traceability under the new U . S . import monitoring program. Ambio, 47(1), 25–30. [CrossRef]
- Kresna, B. A., & Seminar, K. B. (2017). Developing a Traceability System for Tuna Supply Chains. 6(October), 52–62.
- Mai, N. (2010). Benefits of traceability in fish supply chains – case studies. British Food Journal, 112, 976–1002. [CrossRef]
- Golan, E., Krissoff, B., Kuchler, F., Calvin, L., Nelson, K., & Price, G. (2004). Traceability in the U . S . Food Supply : Economic Theory and Industry Studies Library Cataloging Record : 830.
- Pouliot, Sebastien & Sumner, D. A. (2008). T , l , i f s q. 90(February), 15–27. [CrossRef]
- Smith, G. C., Tatum, J. D., Belk, K. E., Scanga, J. A., Grandin, T., & Sofos, J. N. (2005). MEAT Traceability from a US perspective. 71, 174–193. [CrossRef]
- Macusi, E. D., Rafon, J. K. A., & Macusi, E. S. (2021). Impact of COVID-19 and closed fishing season on commercial fishers of Davao Gulf, Mindanao, Philippines. Ocean & Coastal Management, 217(C), 105997. [CrossRef]
- BFAR. (2020). Philippine Fisheries Profile 2019. Retrieved from Quezon City, Philippines.
- Macusi, E. D., Abreo, N. A. S., & Babaran, R. P. (2017). Local Ecological Knowledge ( LEK ) on Fish Behavior Around Anchored FADs : the Case of Tuna Purse Seine and Ringnet Fishers from Southern. 4(June), 1–13. [CrossRef]
- Tolentino-Zondervan, F., Berentsen, P., Bush, S. R., Digal, L., & Lansink, A. O. (2016). Fisher-level decision making to participate in Fisheries Improvement Projects (FIPs) for yellowfin tuna in the Philippines. PLoS ONE, 11(10), 1–22. [CrossRef]
- Doddema, M., Spaargaren, G., Wiryawan, B., Bush, S. R., Doddema, M., Spaargaren, G., Wiryawan, B., & Bush, S. R. (2020). Fisher and Trader Responses to Traceability Interventions in Indonesia Fisher and Trader Responses to Traceability Interventions. Society & Natural Resources, 33(10), 1232–1251. [CrossRef]
- Grantham, A., Pandan, M. R., Roxas, S., & Hitchcock, B. (2022). Overcoming Catch Data Collection Challenges and Traceability Implementation Barriers in a Sustainable , Small-Scale Fishery. 1–16.
- World Wide Fund for Nature (WWF) Philippines. (2020). Applying electronic catch documentation and traceability technologies to small-scale tuna handline fisheries: A case study from Mindoro and Bicol, Philippines. Jun.
- Auld, G., Renckens, S., & Cashore, B. (2015). Transnational private governance between the logics of empowerment and control. Regulation and Governance, 9(2), 108–124. [CrossRef]
- Macusi, E. D., Kay, A., Liguez, O., Macusi, E. S., & Digal, L. N. (2021). Factors influencing catch and support for the implementation of the closed fishing season in Davao Gulf , Philippines. Marine Policy, 130(May), 104578. [CrossRef]
- Macusi, E. D., Morales, I. D. G., Macusi, E. S., Pancho, A., & Digal, L. N. (2022). Impact of closed fishing season on supply, catch, price and the fisheries market chain. Marine Policy, 138, 105008. [CrossRef]
- Sarmiento, J. M. P., Mendez, Q. L. T., Estaña, L. M. B., Giray, E. S., Nañola Jr., C. L., & Alviola IV, P. A. (2021). The role of motorized boats in fishers’ productivity in marine protected versus non-protected areas in Davao Gulf, Philippines. Environment, Development and Sustainability 23, 16786–16802.
- Pauly, D. (2006). Major trends in small·scale marine fisheries, with emphasis on develop-. Maritime Studies, 4(2), 7–22.
- Close, C. H., & Hall, G. B. (2006). A GIS-based protocol for the collection and use of local knowledge in fisheries management planning. Journal of Environmental Management, 78(4), 341–352. [CrossRef]
- Lepofsky, D., & Caldwell, M. (2013). Indigenous marine resource management on the northwest coast of North America. Ecological Processes, 2(1), 1–12. [CrossRef]
- Caddy, J. F., & Carocci, F. (1999). The spatial allocation of fishing intensity by port-based inshore fleets: A GIS application. ICES Journal of Marine Science, 56(3), 388–403. [CrossRef]
- Daw, T. M. (2008). Spatial distribution of effort by artisanal fishers: Exploring economic factors affecting the lobster fisheries of the Corn Islands, Nicaragua. Fisheries Research, 90(1–3), 17–25. [CrossRef]
Figure 1.
A modified tuna traceability framework used for the study in the Davao Gulf, Philippines based on Grantham et al.[16].
Figure 1.
A modified tuna traceability framework used for the study in the Davao Gulf, Philippines based on Grantham et al.[16].
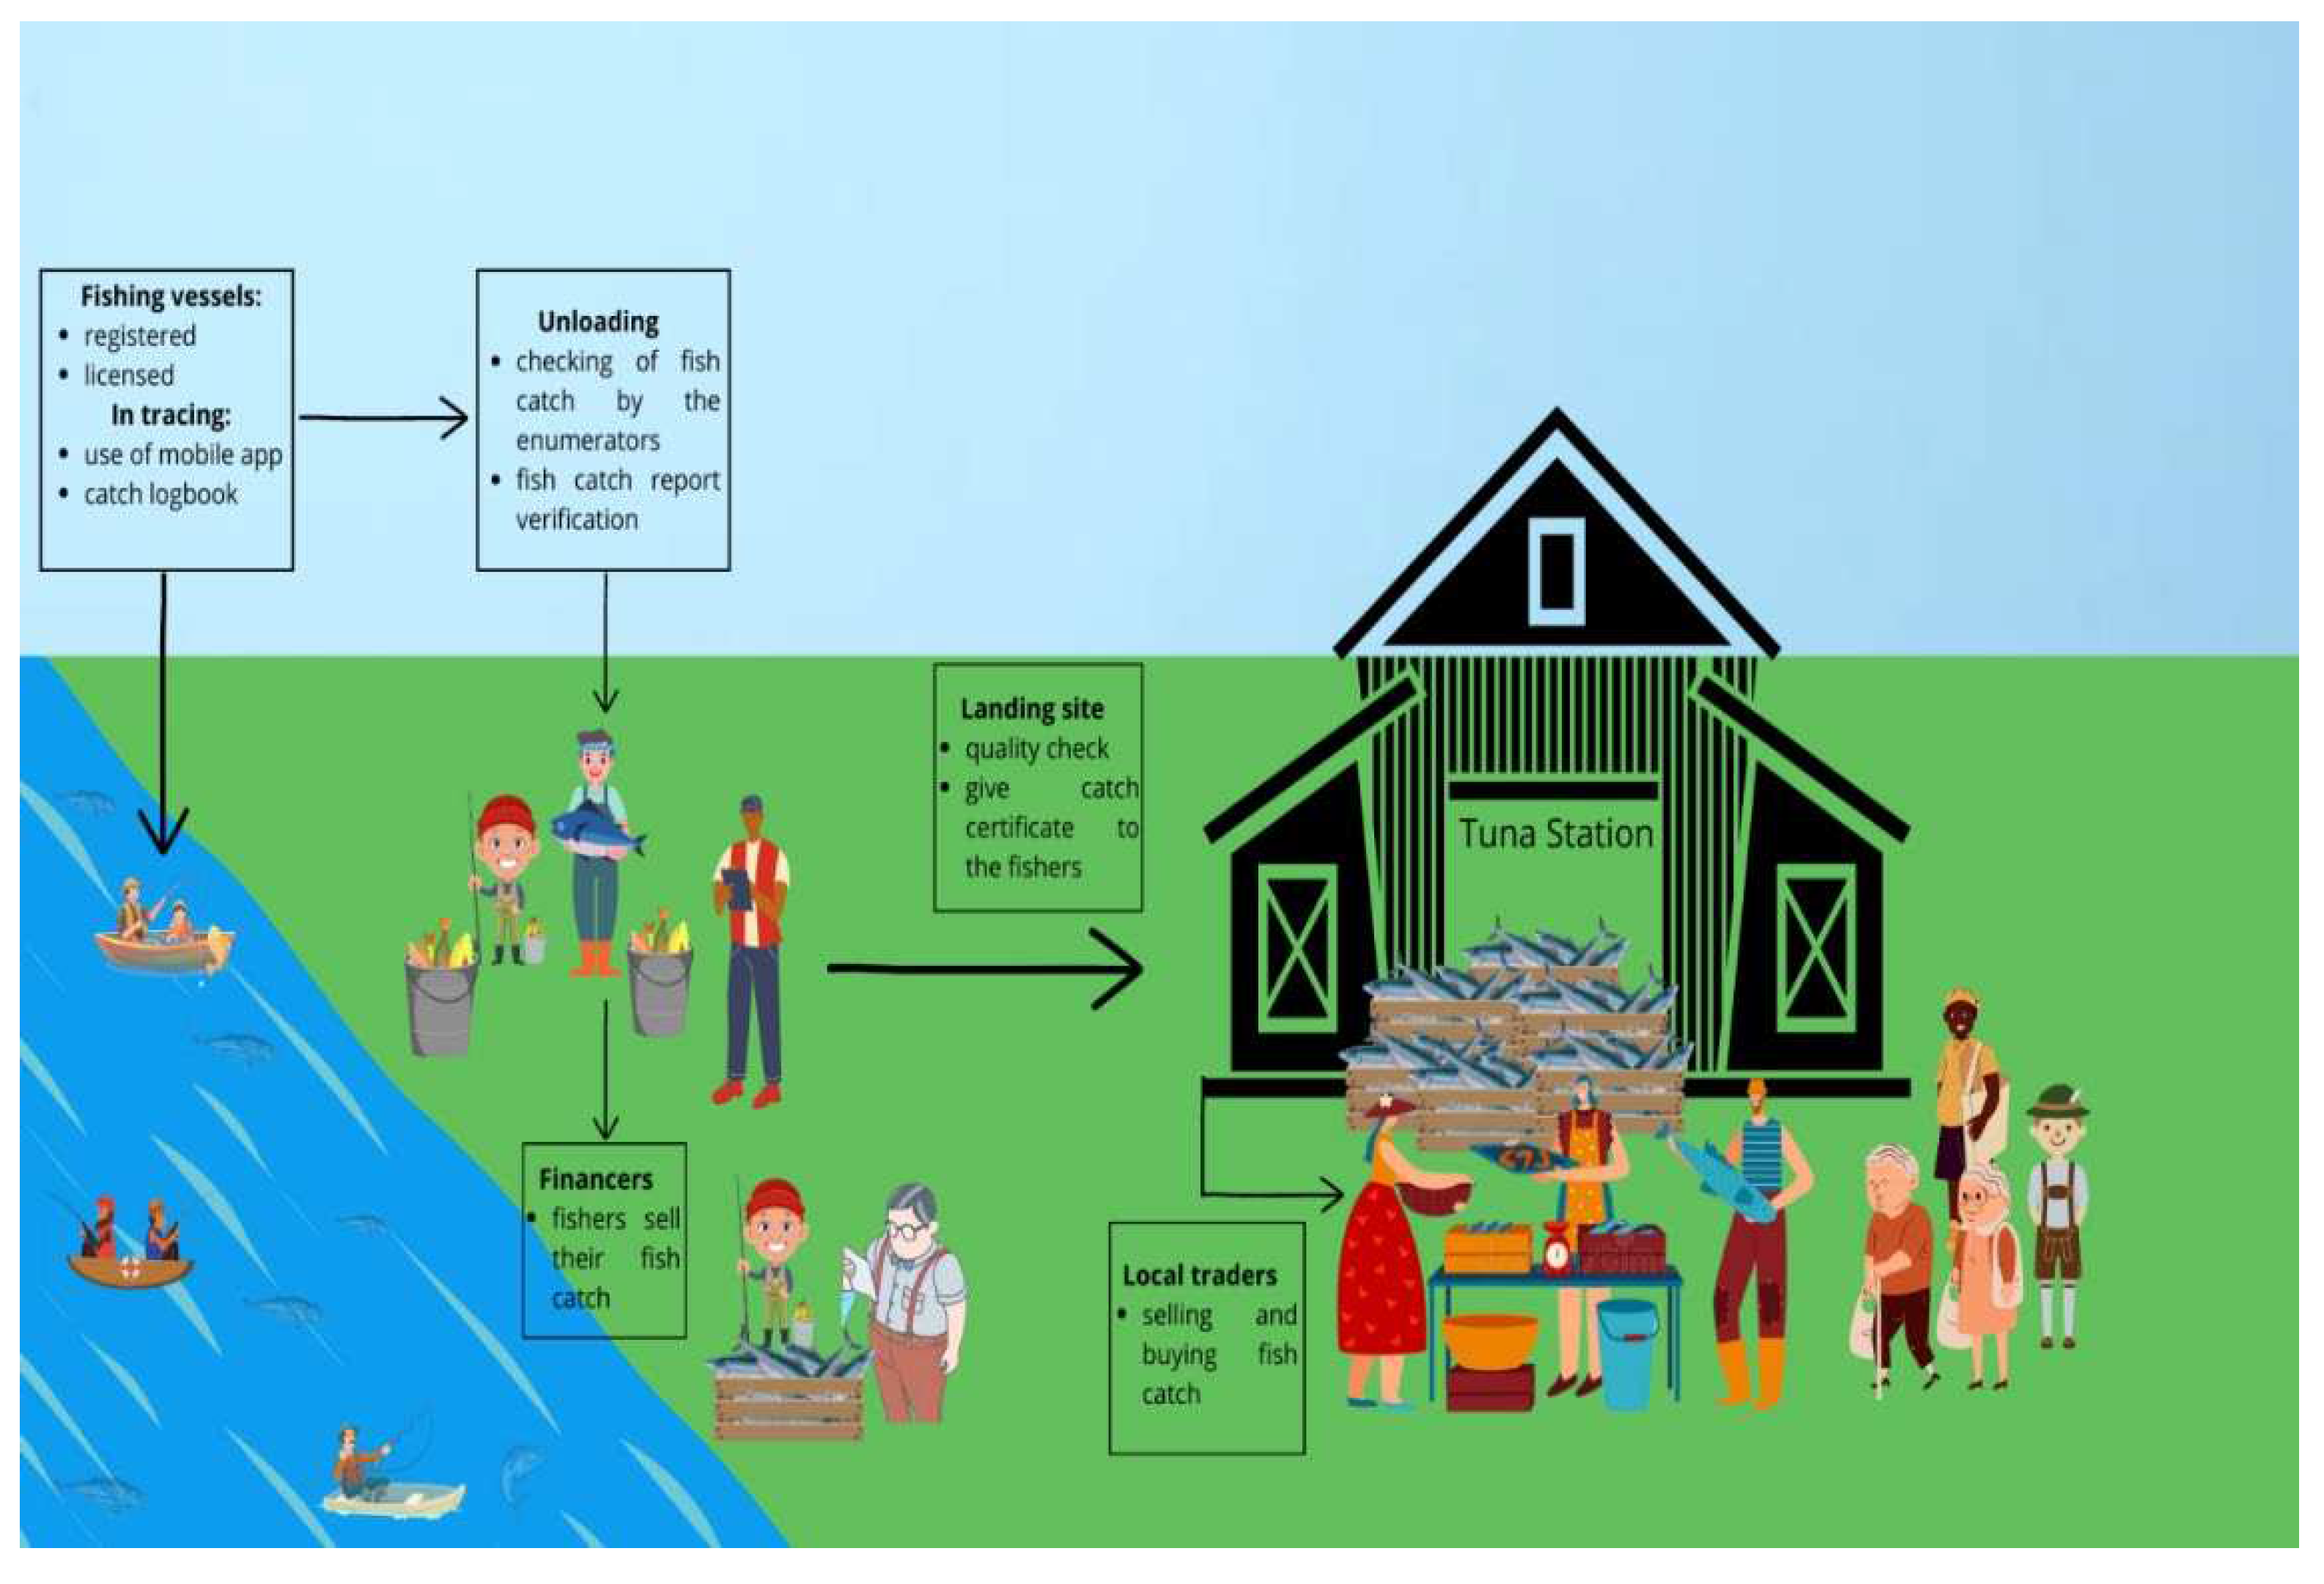
Figure 2.
Map showing the different study sites in Davao Gulf, Philippines
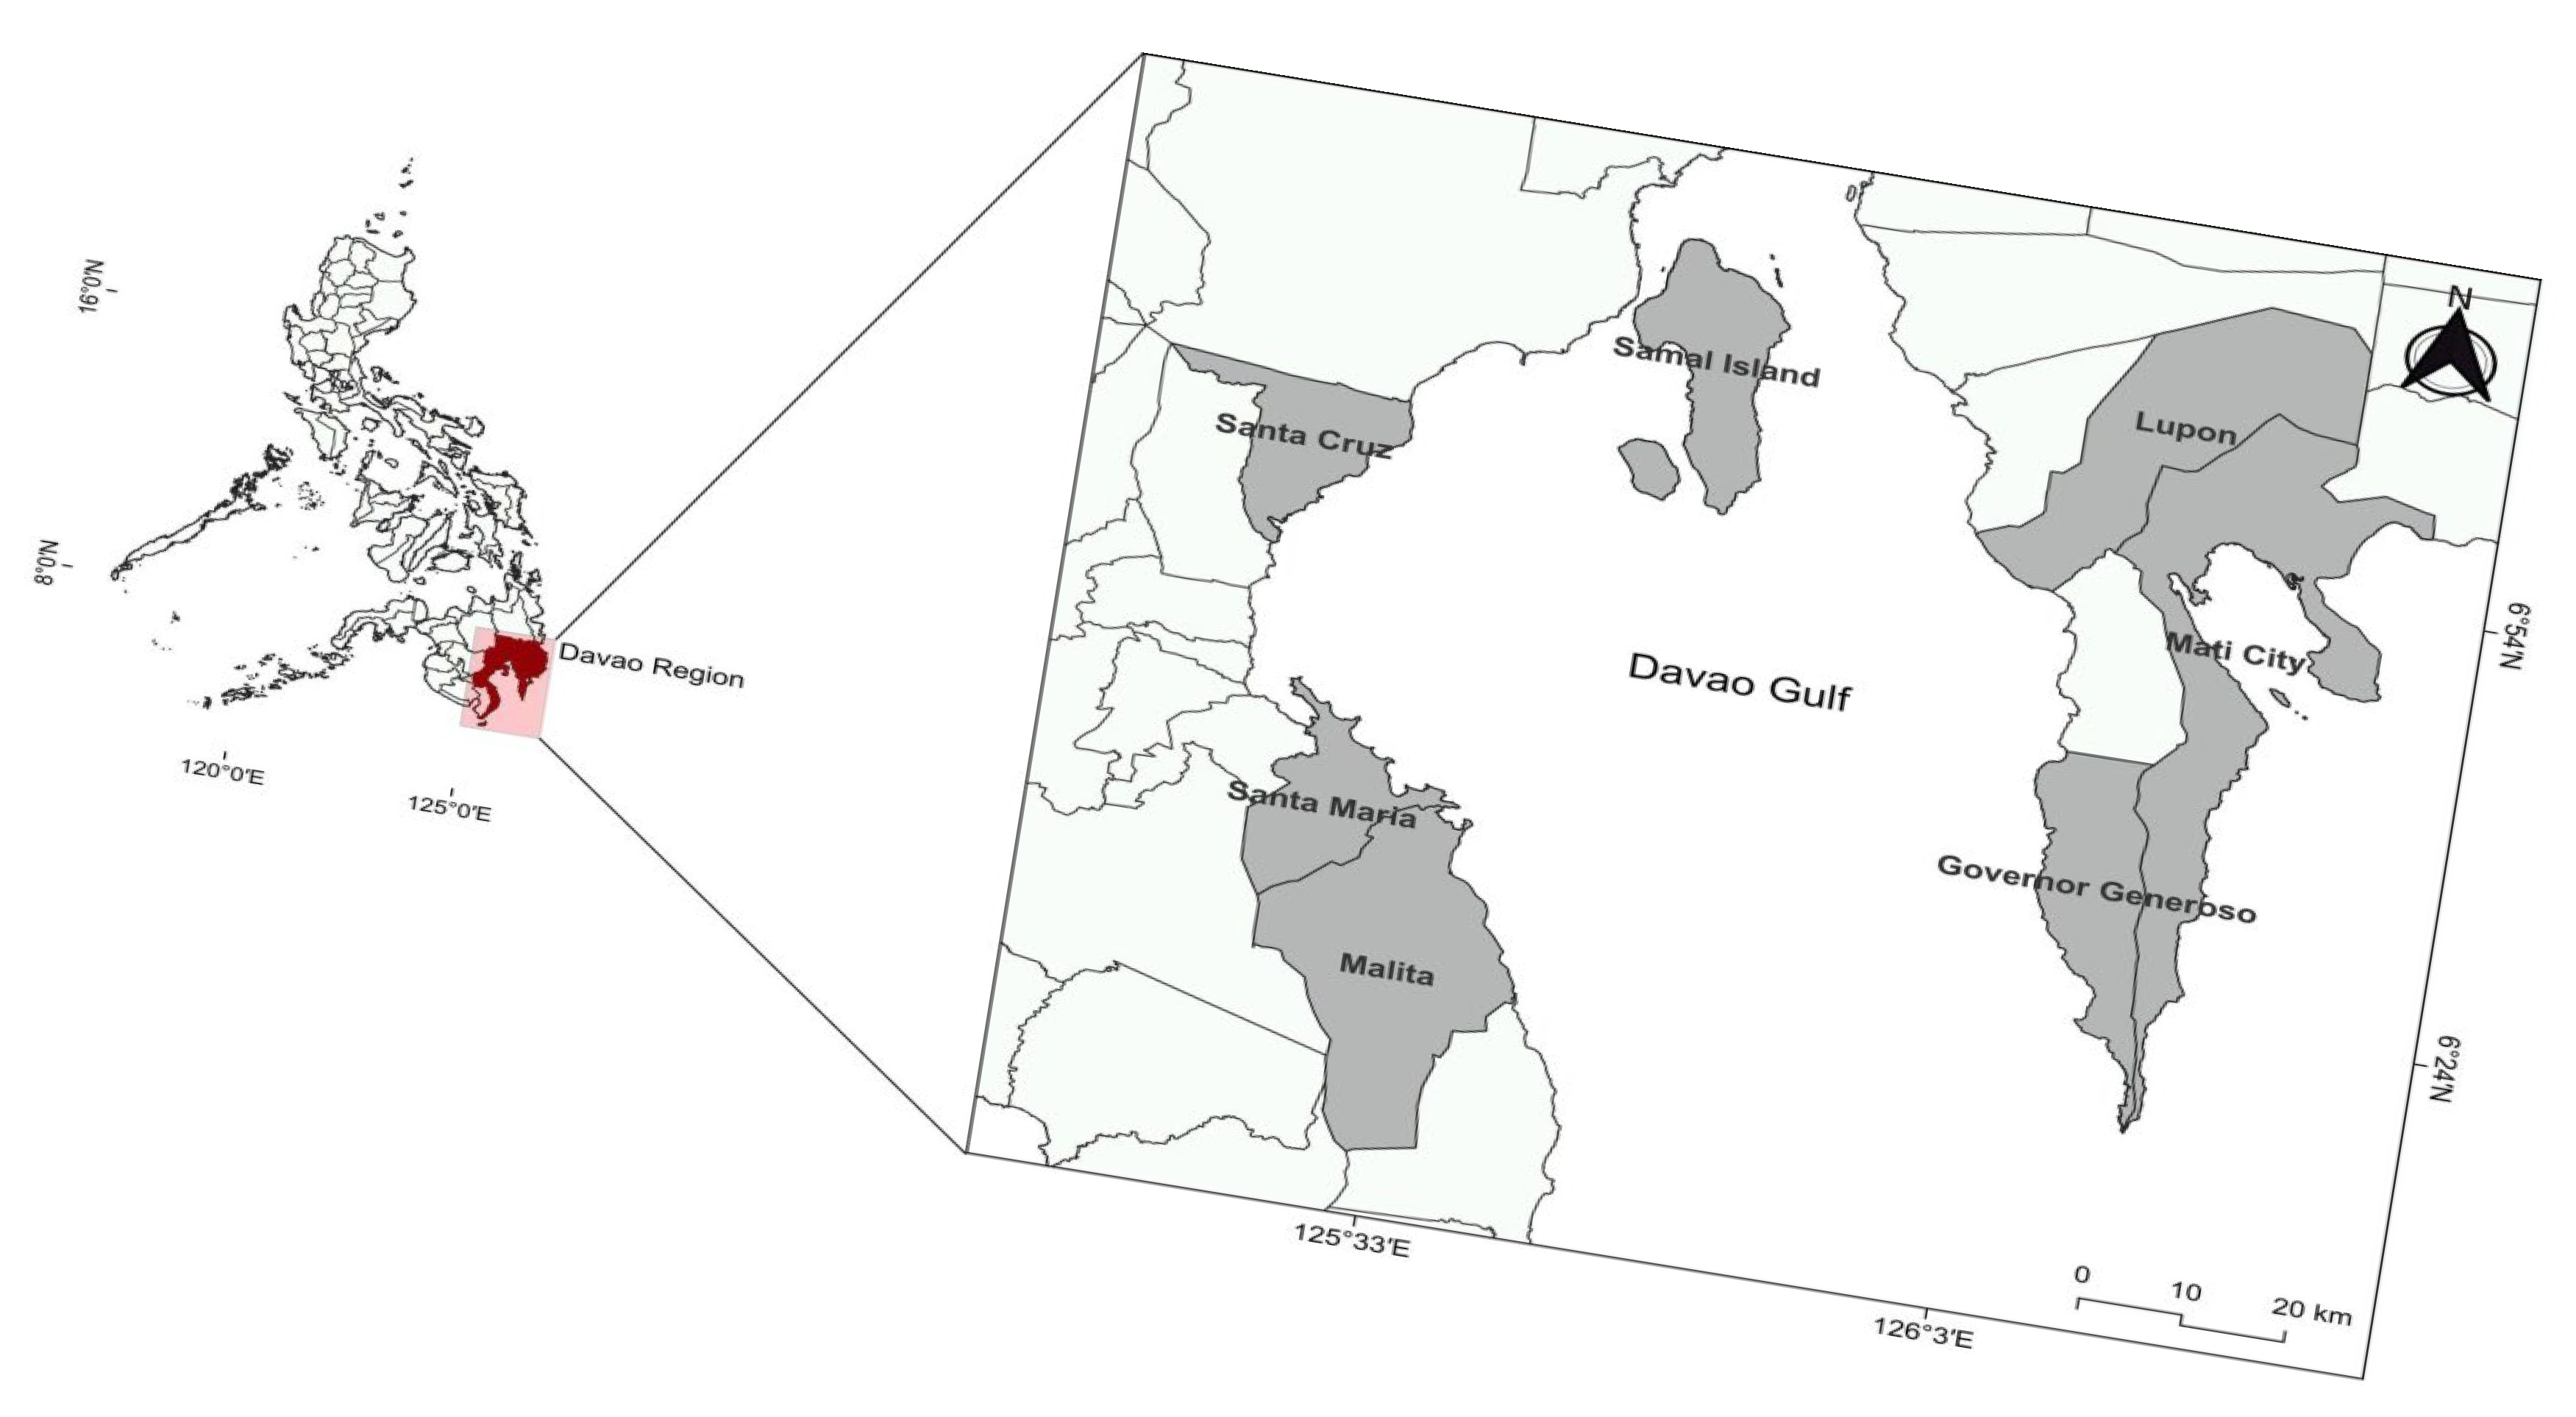
Figure 3.
Respondents respond in feasibility and policy implementation selected variables communication with other fishers (A), tuna traceability implementation (B), foresee benefit (C), market benefit (D), problems (E), and traceability app (F).
Figure 3.
Respondents respond in feasibility and policy implementation selected variables communication with other fishers (A), tuna traceability implementation (B), foresee benefit (C), market benefit (D), problems (E), and traceability app (F).
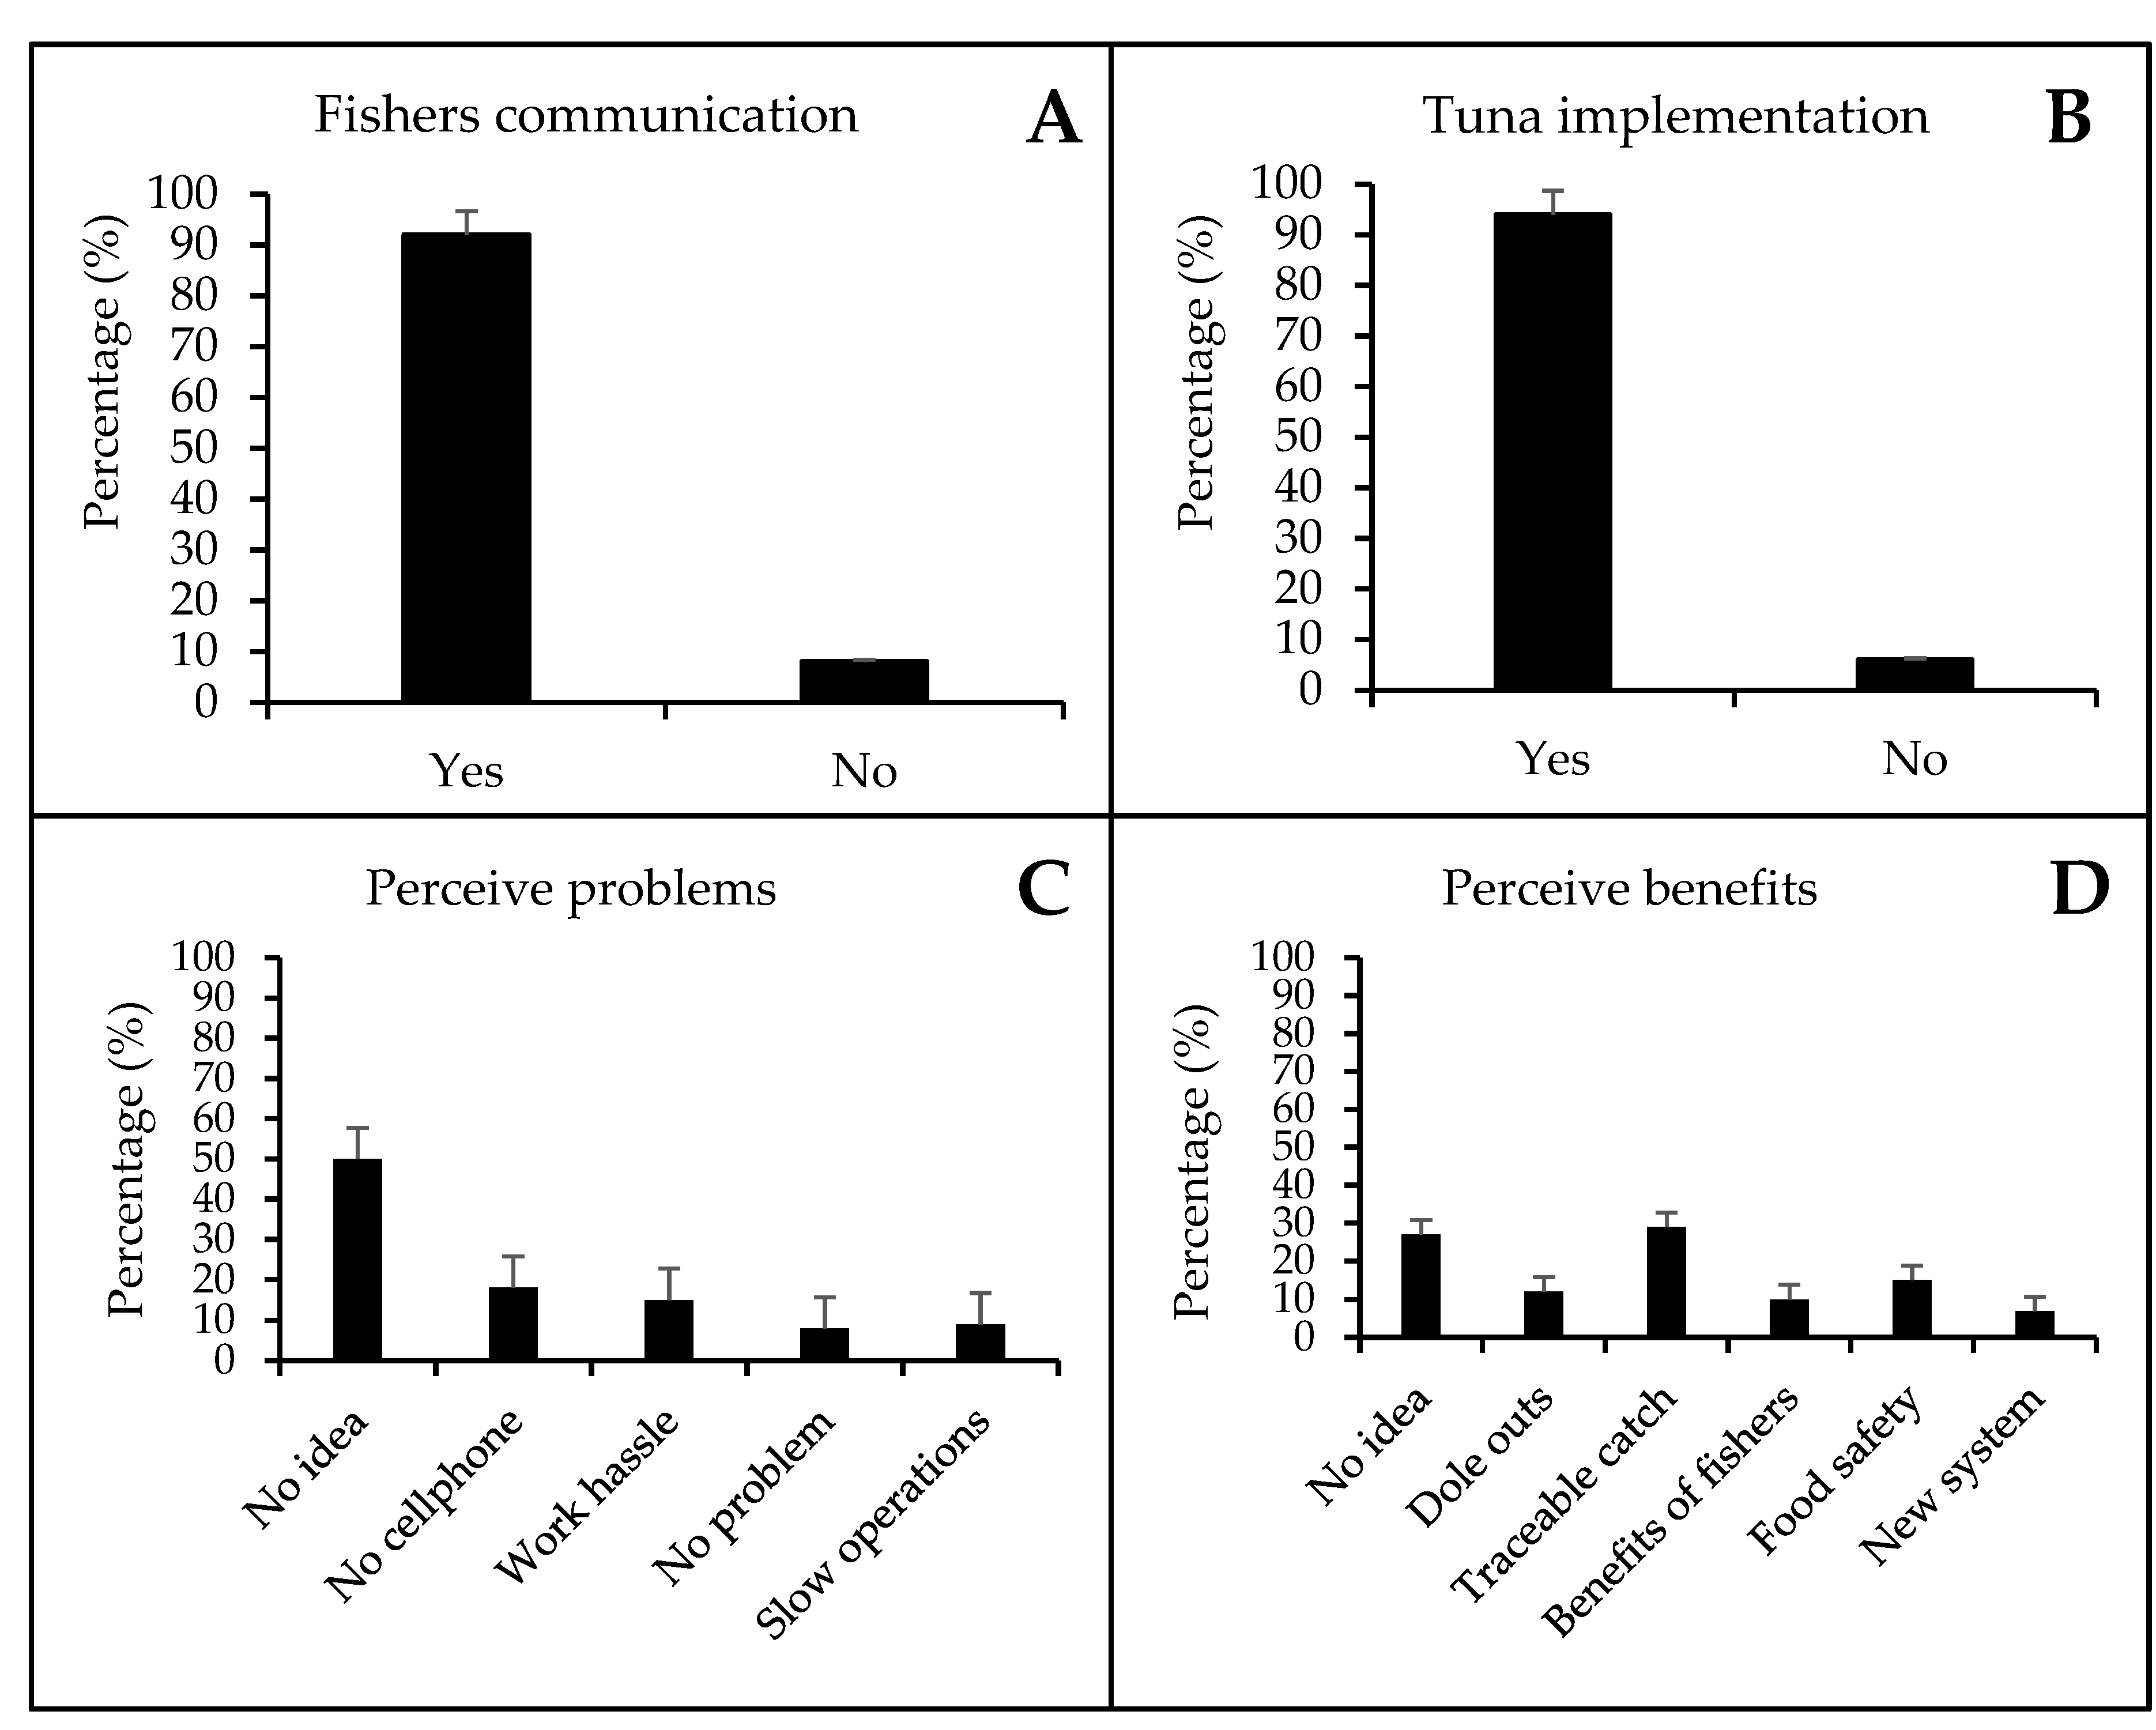
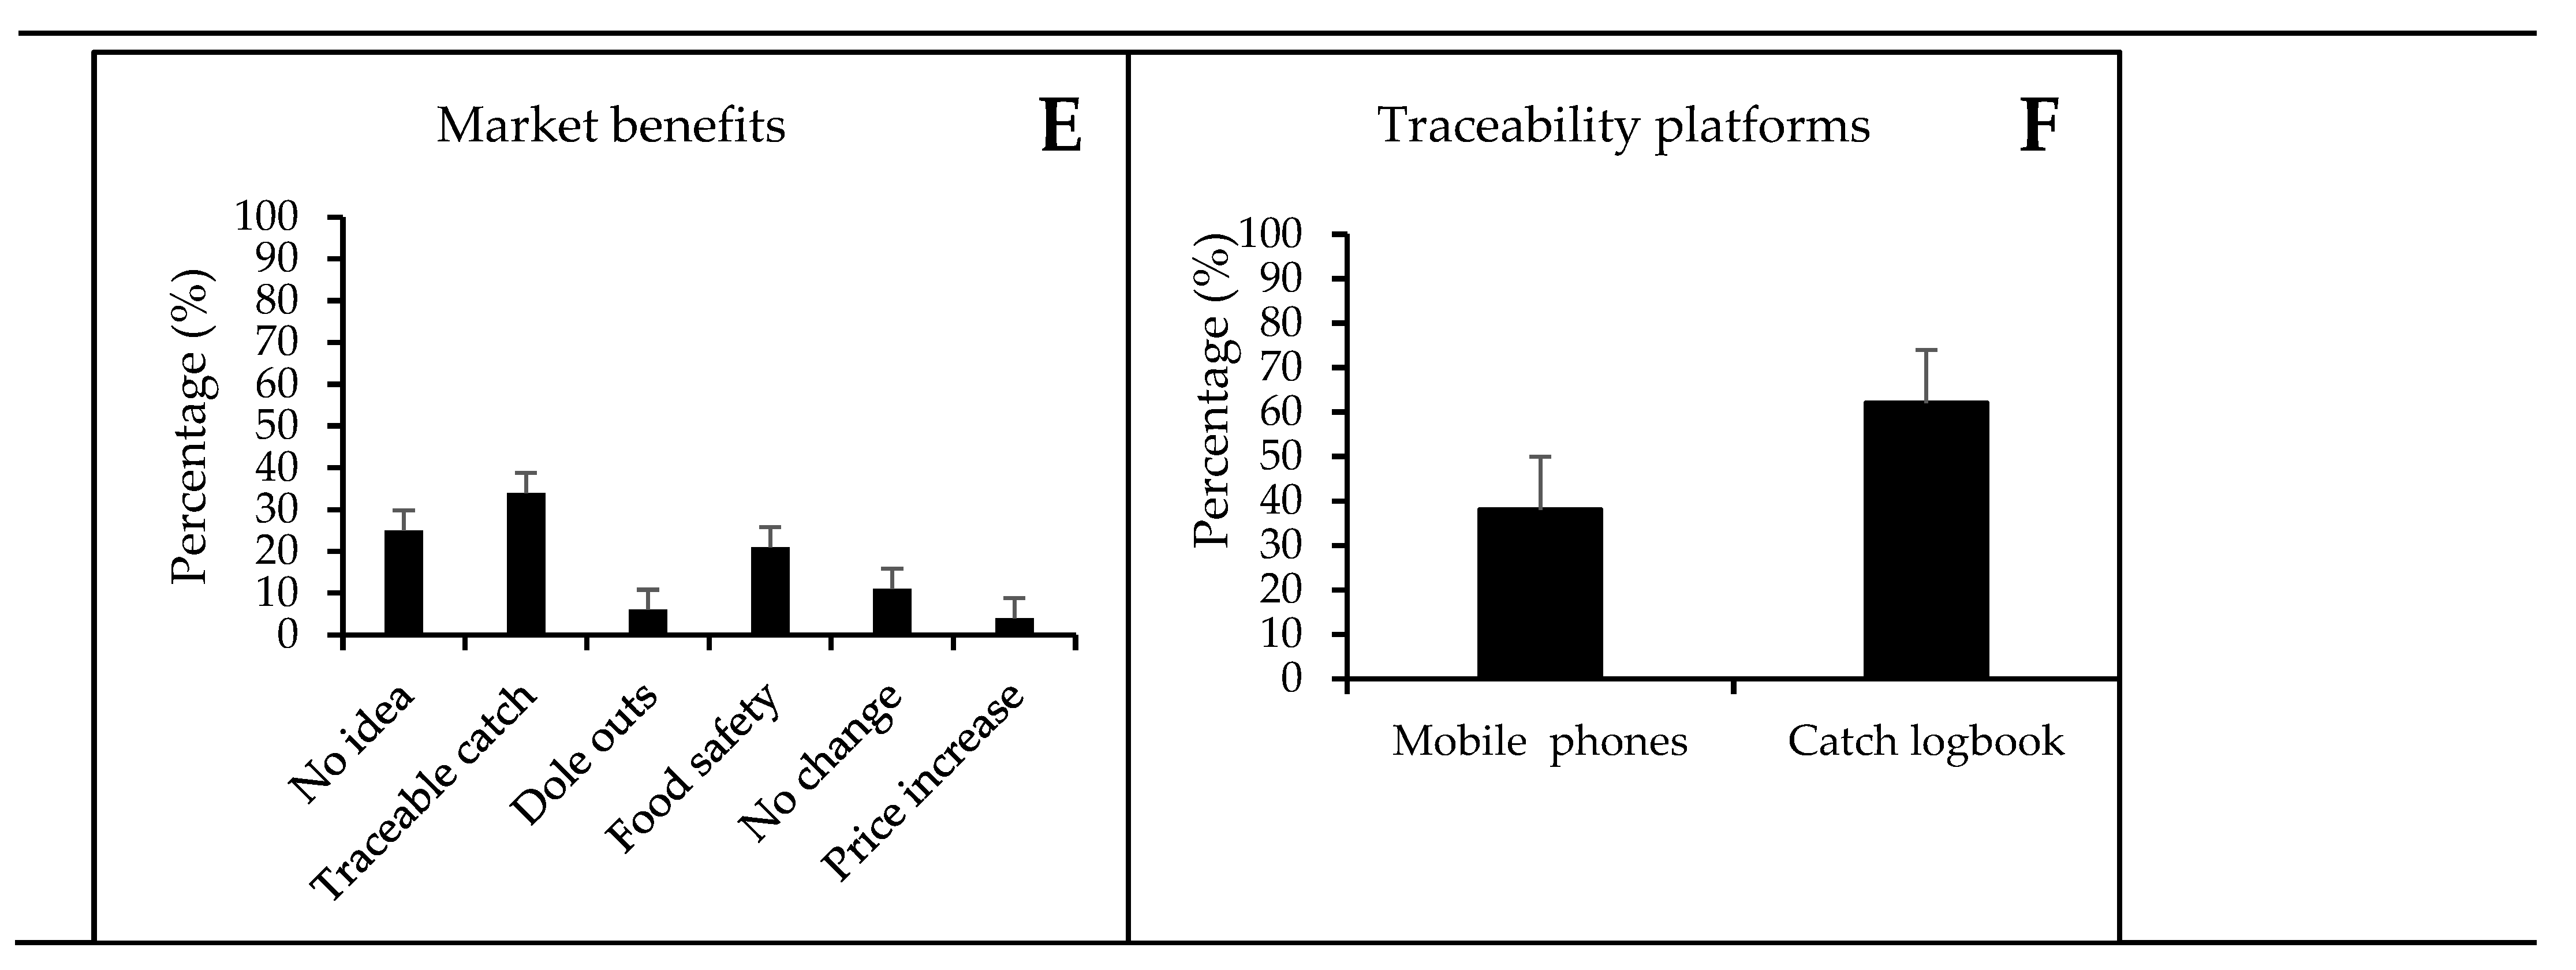

Table 1.
Total respondents and their position in the boat per site.
| Study Site | Total Respondents | Owner | Operator | Passenger | Crew |
|---|---|---|---|---|---|
| Mati | 56 | 42 | 11 | 3 | |
| Lupon | 56 | 54 | 2 | ||
| Governor Generoso | 27 | 20 | 6 | 1 | |
| Santa Cruz | 16 | 10 | 2 | 4 | |
| Samal | 28 | 21 | 6 | 1 | |
| Malita | 47 | 28 | 14 | 5 | |
| Santa Maria | 34 | 28 | 4 | 2 | |
| Total | 264 | 203 | 45 | 12 | 4 |
Table 2.
Fishing characteristics and socio-demographic profile of respondents in different study sites around Davao Gulf (mean, min, max).
Table 2.
Fishing characteristics and socio-demographic profile of respondents in different study sites around Davao Gulf (mean, min, max).
| Variables | Definition | Mati | Lupon | GovGen | Sta. Cruz | Samal | Malita | Sta. Maria |
|---|---|---|---|---|---|---|---|---|
| Age (Yr) | Age of individual fishers | 42 (18, 82) | 48 (27, 78) | 46 (22, 88) | 53 (36, 65) | 48 (25, 73) | 46 (29, 74) | 42 (18, 71) |
| Household size (HHS) | Numbers of individual members of the family | 5 (1, 18) | 5 (1, 15) | 5 (1, 9) | 5 (1, 11) | 4 (2, 8) | 5 (1, 10) | 4 (1, 9) |
| Years community (Yr) | Number of years resident of the fishing community | 34 (1, 82) | 40 (6, 68) | 36 (6, 60) | 44 (2, 61) | 44 (15, 73) | 35 (10, 72) | 36 (13, 70) |
| Years fishing (Yr) | Number of years of fishing experience | 22 (1, 67) | 29 (2, 60) | 23 (2, 62) | 30 (12, 48) | 28 (5, 50) | 25 (3, 60) | 23 (5, 50) |
| Catch per trip (kg/trip) | The volume of number of fish caught per fishing trip | 9 (2, 50) | 9 (2, 30) | 9 (2, 45) | 15 (3, 40) | 16 (5, 40) | 21 (1, 50) | 21 (3, 50) |
| Number of fishing hours (hr) | Number of fishing hours from the time of arrival in the fishing ground up to the last catch catch | 10 (2, 24) | 14 (3, 24) | 11 (2, 24) | 13 (7, 24) | 9 (3, 16) | 16 (2, 24) | 10 (5, 24) |
| Boat capacity !!!!!(kg) | Boat capacity of each respondent | 198 (100, 200) | 79 (20, 200) | 122 (10, 300) | 549 (30, 5000) | 266 (70, 1000) | 273 (20, 1000) | 167 (40, 500) |
| Catch per unit effort (CPUE: kg/hr) | Catch per unit effort is based on the normal of fish catch (kg) per trip divided by the number of fishing hours | 1.2 (0.21, 7.5) | 0.8 (0.08, 2.5) | 1.2 (0.21, 6.67) | 1.3 (0.17, 4.3) | 1.9 (0.42, 6.3) | 1.7 (0.04, 5) | 2.2 (0.3, 6) |
| Monthly income (Php) | Monthly income of fishers in fishing | 6473 (500, 15000) | 7161 (1000, 15000) | 3741 (2000, 10000) | 7672 (2250, 17500) | 7366 (3000, 15000) | 6420 (2000, 13500) | 7462 (5000, 15000) |
Table 3.
Factors affecting daily fish catch of fishers.
| Variables | df | MS | F-Value | P-Value |
|---|---|---|---|---|
| Household size (HHS) | 1 | 0.593 | 6.06 | 0.014 |
| Monthly income | 1 | 0.285 | 2.91 | 0.089 |
| Years in community | 1 | 0.586 | 5.99 | 0.015 |
| Number of fishing trip (hrs) | 1 | 0.695 | 7.11 | 0.008 |
| Fish sold | 1 | 3.869 | 39.56 | 0.001 |
| Fishers’ communication | 1 | 0.693 | 7.08 | 0.008 |
Table 4.
Factors influencing full implementation of tuna traceability.
| Variables | df | MS | F-Value | P-Value |
|---|---|---|---|---|
| Household size (HHS) | 1 | 0.291 | 2.71 | 0.101 |
| Number of fishing trip (hrs) | 1 | 0.882 | 8.19 | 0.005 |
| Boat capacity | 1 | 0.885 | 8.23 | 0.004 |
| Fishers’ communication | 1 | 0.699 | 6.50 | 0.011 |
| Benefits in traceability | 1 | 0.249 | 2.31 | 0.130 |
Disclaimer/Publisher’s Note: The statements, opinions and data contained in all publications are solely those of the individual author(s) and contributor(s) and not of MDPI and/or the editor(s). MDPI and/or the editor(s) disclaim responsibility for any injury to people or property resulting from any ideas, methods, instructions or products referred to in the content. |
© 2023 by the authors. Licensee MDPI, Basel, Switzerland. This article is an open access article distributed under the terms and conditions of the Creative Commons Attribution (CC BY) license (http://creativecommons.org/licenses/by/4.0/).
Copyright: This open access article is published under a Creative Commons CC BY 4.0 license, which permit the free download, distribution, and reuse, provided that the author and preprint are cited in any reuse.


