Submitted:
29 May 2026
Posted:
02 June 2026
You are already at the latest version
Abstract
Surface-enhanced Raman spectroscopy (SERS) has emerged as a highly promising analytical technique for disease diagnostics due to its exceptional sensitivity, molecular specificity, and ability to detect a broad range of biomarkers in complex biological matrices. This review provides a comprehensive overview of gold- and silver-nanoparticle-based SERS platforms for plasma disease diagnostics, covering advances in plasmonic nanostructures, biological sample analysis, biomarker detection, and AI-driven spectral data processing. Particular emphasis is placed on the application of SERS to clinically relevant biofluids, especially plasma, where the technique has demonstrated considerable potential for detecting diseases such as cancer, inflammatory disorders, and neurological conditions.
The review also critically examines the major challenges currently limiting the clinical translation of SERS technologies. These include variability associated with substrate fabrication, matrix-induced signal fluctuations, limited interlaboratory reproducibility, and the lack of standardized protocols for spectral preprocessing and data analysis. Strategies proposed to address these issues are discussed, including comprehensive post-synthesis substrate characterization, optimization of biological sample preparation, advanced spectral preprocessing workflows, and the integration of machine learning and artificial intelligence algorithms to improve diagnostic robustness and reproducibility.
Collectively, the advances summarized in this review indicate that SERS-based diagnostic technologies are rapidly progressing beyond proof-of-concept studies toward clinically applicable systems. Continued interdisciplinary collaboration and standardization efforts will be essential to bridge the remaining gap between experimental SERS methodologies and routine clinical implementation.
Keywords:
surface-enhanced raman spectroscopy (SERS)
; blood plasma
; machine learning
; artificial intelligence
; gold nanoparticles
; silver nanoparticles
; clinical translation
1. Introduction
Clinical laboratory diagnostics is a key pillar of the global healthcare management system. To be both efficient and effective, new techniques, equipment and devices that complement, improve, or substitute available laboratory diagnostic systems are necessary. Speed, sensitivity, selectivity, scalability, minimally invasive sampling, and point-of-care (POC) capability are among the desirable characteristics for any product developed and intended for modern diagnostics [1]. Contemporary diagnostic gold standards based on spectroscopy, chromatography, immunochemistry, and molecular biology are both effective and efficient, however, they do not meet all the criteria of ideal medical diagnostic systems [2].
Surface-enhanced Raman spectroscopy (SERS) is an established vibrational spectroscopic technique based on the inelastic scattering of monochromatic light by matter. It has potential utility in developing methods for highly sensitive and selective detection that can be adapted for rapid, accurate and less invasive clinical diagnostics [3,4]. SERS, via the plasmonic metallic nanoparticles present, amplifies weak Raman signals by several orders of magnitude that enable molecular fingerprinting and molecule detection of target analytes present in very low concentration, even in complex matrices such as biofluids [5,6,7].
Unlike tests based on variants of enzyme-linked immunosorbent assay (ELISA), polymerase chain reaction (PCR), mass spectrometry and many other conventional techniques, SERS requires minimal sample preparation, less controlled environment, comparatively lower sample volume, alongside a superior multiplexing capability and analytical speed [8,9]. SERS has been applied in biomedical research on neoplasms [10,11,12], infectious diseases [13,14,15,16], neurodegenerative and cerebrovascular disorders [17,18,19], drug monitoring [20,21,22] and toxicological assessments [23,24] in biofluids and other biological matrices, with many literature reporting the multiplexing potentials of SERS [25,26,27,28].
Blood plasma as an important repository of valuable information about biological processes, features prominently in clinical research and validation. It is replete with proteins, nucleic acids, lipids, metabolites, and associated biomarker components relevant for clinical diagnostic and therapeutic purposes [5,29]. The complexity of plasma, however, compounds many analytical techniques, necessitating extensive sample preparation steps. SERS stands out as a versatile and viable technique for probing plasma to extract relevant clinical information because its substrates can be adapted for all types of biomarker evaluation, a distinction from PCR that is limited to nucleotides, or ELISA that is more specific to protein-based biomarkers. SERS-based immunoassays formatted according to ELISA or lateral flow assays (LFA) methods show comparative sensitivity, as has been observed also with PCR formats [30,31,32,33,34].
There are several reviews available on SERS-based diagnostics, however, none focuses specifically on plasma as the biological matrix. In this review, important developments in SERS-based disease diagnostic where gold nanoparticles (AuNP) and silver nanoparticles (AgNP) are the plasmonic substrates, and plasma is the biological matrix are introduced. The mechanism of SERS, alongside labelled and label-free SERS detection strategies are also summarised. Likewise highlighted are biosensing platforms reporting individual/combined arrays of single and multiplexed modes for disease detection. Spectral data interpretation methods that enable disease identification are similarly introduced. Finally, a brief look at identified challenges, pathways explored to address bottlenecks, and present/future opportunities in the SERS bioanalyses research landscape are also presented.
2. Surface-Enhanced Raman Spectroscopy (SERS)
SERS is reputed to exhibit extreme signal enhancements responsible for the high sensitivity and specificity of vibrational fingerprinting. This section highlights the underpinning mechanisms of SERS enhancements, and the measurement approaches using either a label-free SERS or a labelled/tagged SERS format.
2.1. Principles of SERS
When light is scattered due to electron cloud distortion on interacting with the molecules of a material, an intense elastic scattering (Raleigh scattering) mostly occurs without any associated energy transfer. A rare and less intense inelastic scattering (Raman effect) also results with an associated photon energy gain (anti-Stokes) or loss (Stokes) [6,35]. This difference in scattered photon energy termed the Raman shift provides a fingerprint unique to the respective molecules interacting with the incident photon, enabling accurate chemical identification. This interplay of scattered light, molecular vibration and energy transfer is the basis of Raman spectroscopy, which is an established vibrational spectroscopic technique with excellent molecular specificity for the determination of molecular conformation, adsorption orientation, and surface bonding in materials [36]. However, the low intensity of Raman signals due to the low probability of Raman scattering events (1 in 106—109 photons in comparison with Raleigh scattering), alongside fluorescent interference, hinders the optimal application of Raman spectroscopy in analyses involving complex matrices as is common with clinical laboratory diagnostics [35,37]. The discovery of Surface Enhanced Raman Spectroscopy (SERS) based on Raman signals amplification by about 106–1014, greatly extended the sensitivity and applicability of Raman spectroscopy [38,39].
SERS achieves this high signal amplification by means of nanoparticle (NP) substrates derived from silver, gold, copper and other plasmonic metals as depicted in Figure 1. The delocalised electrons at these NP surfaces undergo localised surface plasmon resonance (LSPR) in response to photonic excitation at certain frequencies. A dominant LSPR-dependent electromagnetic enhancement mechanism (EM) simultaneously occurring with a charge-transfer or chemical enhancement mechanism (CT), are the widely accepted mechanisms contributing to the observed Raman signal enhancement in SERS [40]. In EM, the more prominent of the two mechanisms, LSPR is key, influenced by the nanoparticle’s geometry, dielectric function, and the permittivity of the surrounding medium [35]. Under photon excitation, when the oscillating frequency of the NPs electron cloud are in resonance with the frequency of the incident photons, a significant increase in the near-field amplitude at the NP surface occur. Consequently, the incident electromagnetic field is enhanced by resonance-driven dipole field emitted by the NPs. The closer the LSPR frequency is to that from the incident photon, the greater the field enhancement. In effect, analyte molecules either adsorbed on the NP surface, or located very near (≤ 10 nm) the NP surface, become intensely polarised by the excited surface plasmon, resulting in EM Raman signal enhancement reaching 108– 1011 [6,35,41]. Additionally, EM enhancement is further intensified at the[38,39] points of contact, and at the interparticle gaps between NP pairs and clusters in a distance-dependent manner (< 10 nm) forming active sites or hotspots [9]. Because the LSPR frequency, linewidth, and near-field spatial distribution are a function of nanoparticle geometry; nanoparticles with anisotropic geometries contain higher hotspot density than regular geometries; with an increase in hotspot density achieved by manipulating NP aggregation, anisotropic geometries and the incident photon (Figure 2A) [9].These hotspots can generate a strong electric field with resultant enhancement factors (EF) approaching 1014, allowing for sensitivity leading up to single-molecule detection (Figure 2B) [6,9].
In contrast, the CT enhancement mechanism involves electron transfer between the analyte molecules and the plasmonic NPs due to chemical bonding and the formation of new electronic states. An increase in molecular polarizability occurs, depending on the on the alignment and interaction between the molecule’s highest occupied molecular orbital (HOMO)/energy level with electrons, its lowest unoccupied molecular orbital (LUMO)/lowest empty energy level, and the metal’s Fermi level (EF) (Figure 2C). Instead of plasmons, there is a two-way charge transfer between analyte molecule and NPs, like anti-Stokes Raman scattering. A first layer effect arises in consequence of CT chemisorption dependence, resulting in SERS enhancement only at the first layer of molecules that are directly in contact with the NP substrate. Notwithstanding, the enhancement from resonance scattering; the enhancement from plasmon resonance; increased molecular polarizability resulting from adsorption; and the charge transfer resonance of metal and molecule complex, all contribute co-dependently to the chemical enhancement, adding an extra 102–103 to the overall enhancement [35,40].
2.2. Direct/Label-Free SERS
To exploit the excellent signal enhancement of SERS, two alternative approaches can be employed for qualitative and quantitative SERS detection of biomarkers in plasma and other biological matrices. The indirect or labelled/tagged SERS approach (Figure 2E,F) measures the specific signals of chromogenic compounds called Raman reporters attached to the plasmonic metal, while the direct or label-free SERS approach identify intrinsic spectral bands generated by the analyte molecules in direct response to laser-excited NP field effect (Figure 2C) [5,6,45]. When no bioreceptor is involved as a capture agent in the direct SERS format, the different functional groups of molecules present in the analyte sample contribute collectively to the resulting SERS spectra, providing a complex molecular signature specific to the sample, from which an identification/classification is deduced for a target biomarker, or a particular pathologic condition. It is the simplest and fastest configuration of SERS approaches, requiring no NP derivatisation with reporter molecules, and can be performed with or without a specific biomarker target. Different analytes ranging from small molecules to cells and tissue samples interact with the plasmonic fields by direct adsorption onto bare NP surfaces [45] or through capture by a bioreceptor immobilised on the NP. What is striking in the label-free approach for disease diagnostics is that discrimination between the vibrational spectra of samples from a representative healthy control group can be compared to those from the target disease group, with a reliance on advanced chemometrics to create profiles for both states, especially when large datasets are involved [41]. Alongside these complex computational approach, small datasets can be manually interpreted from simple calibration models [6].
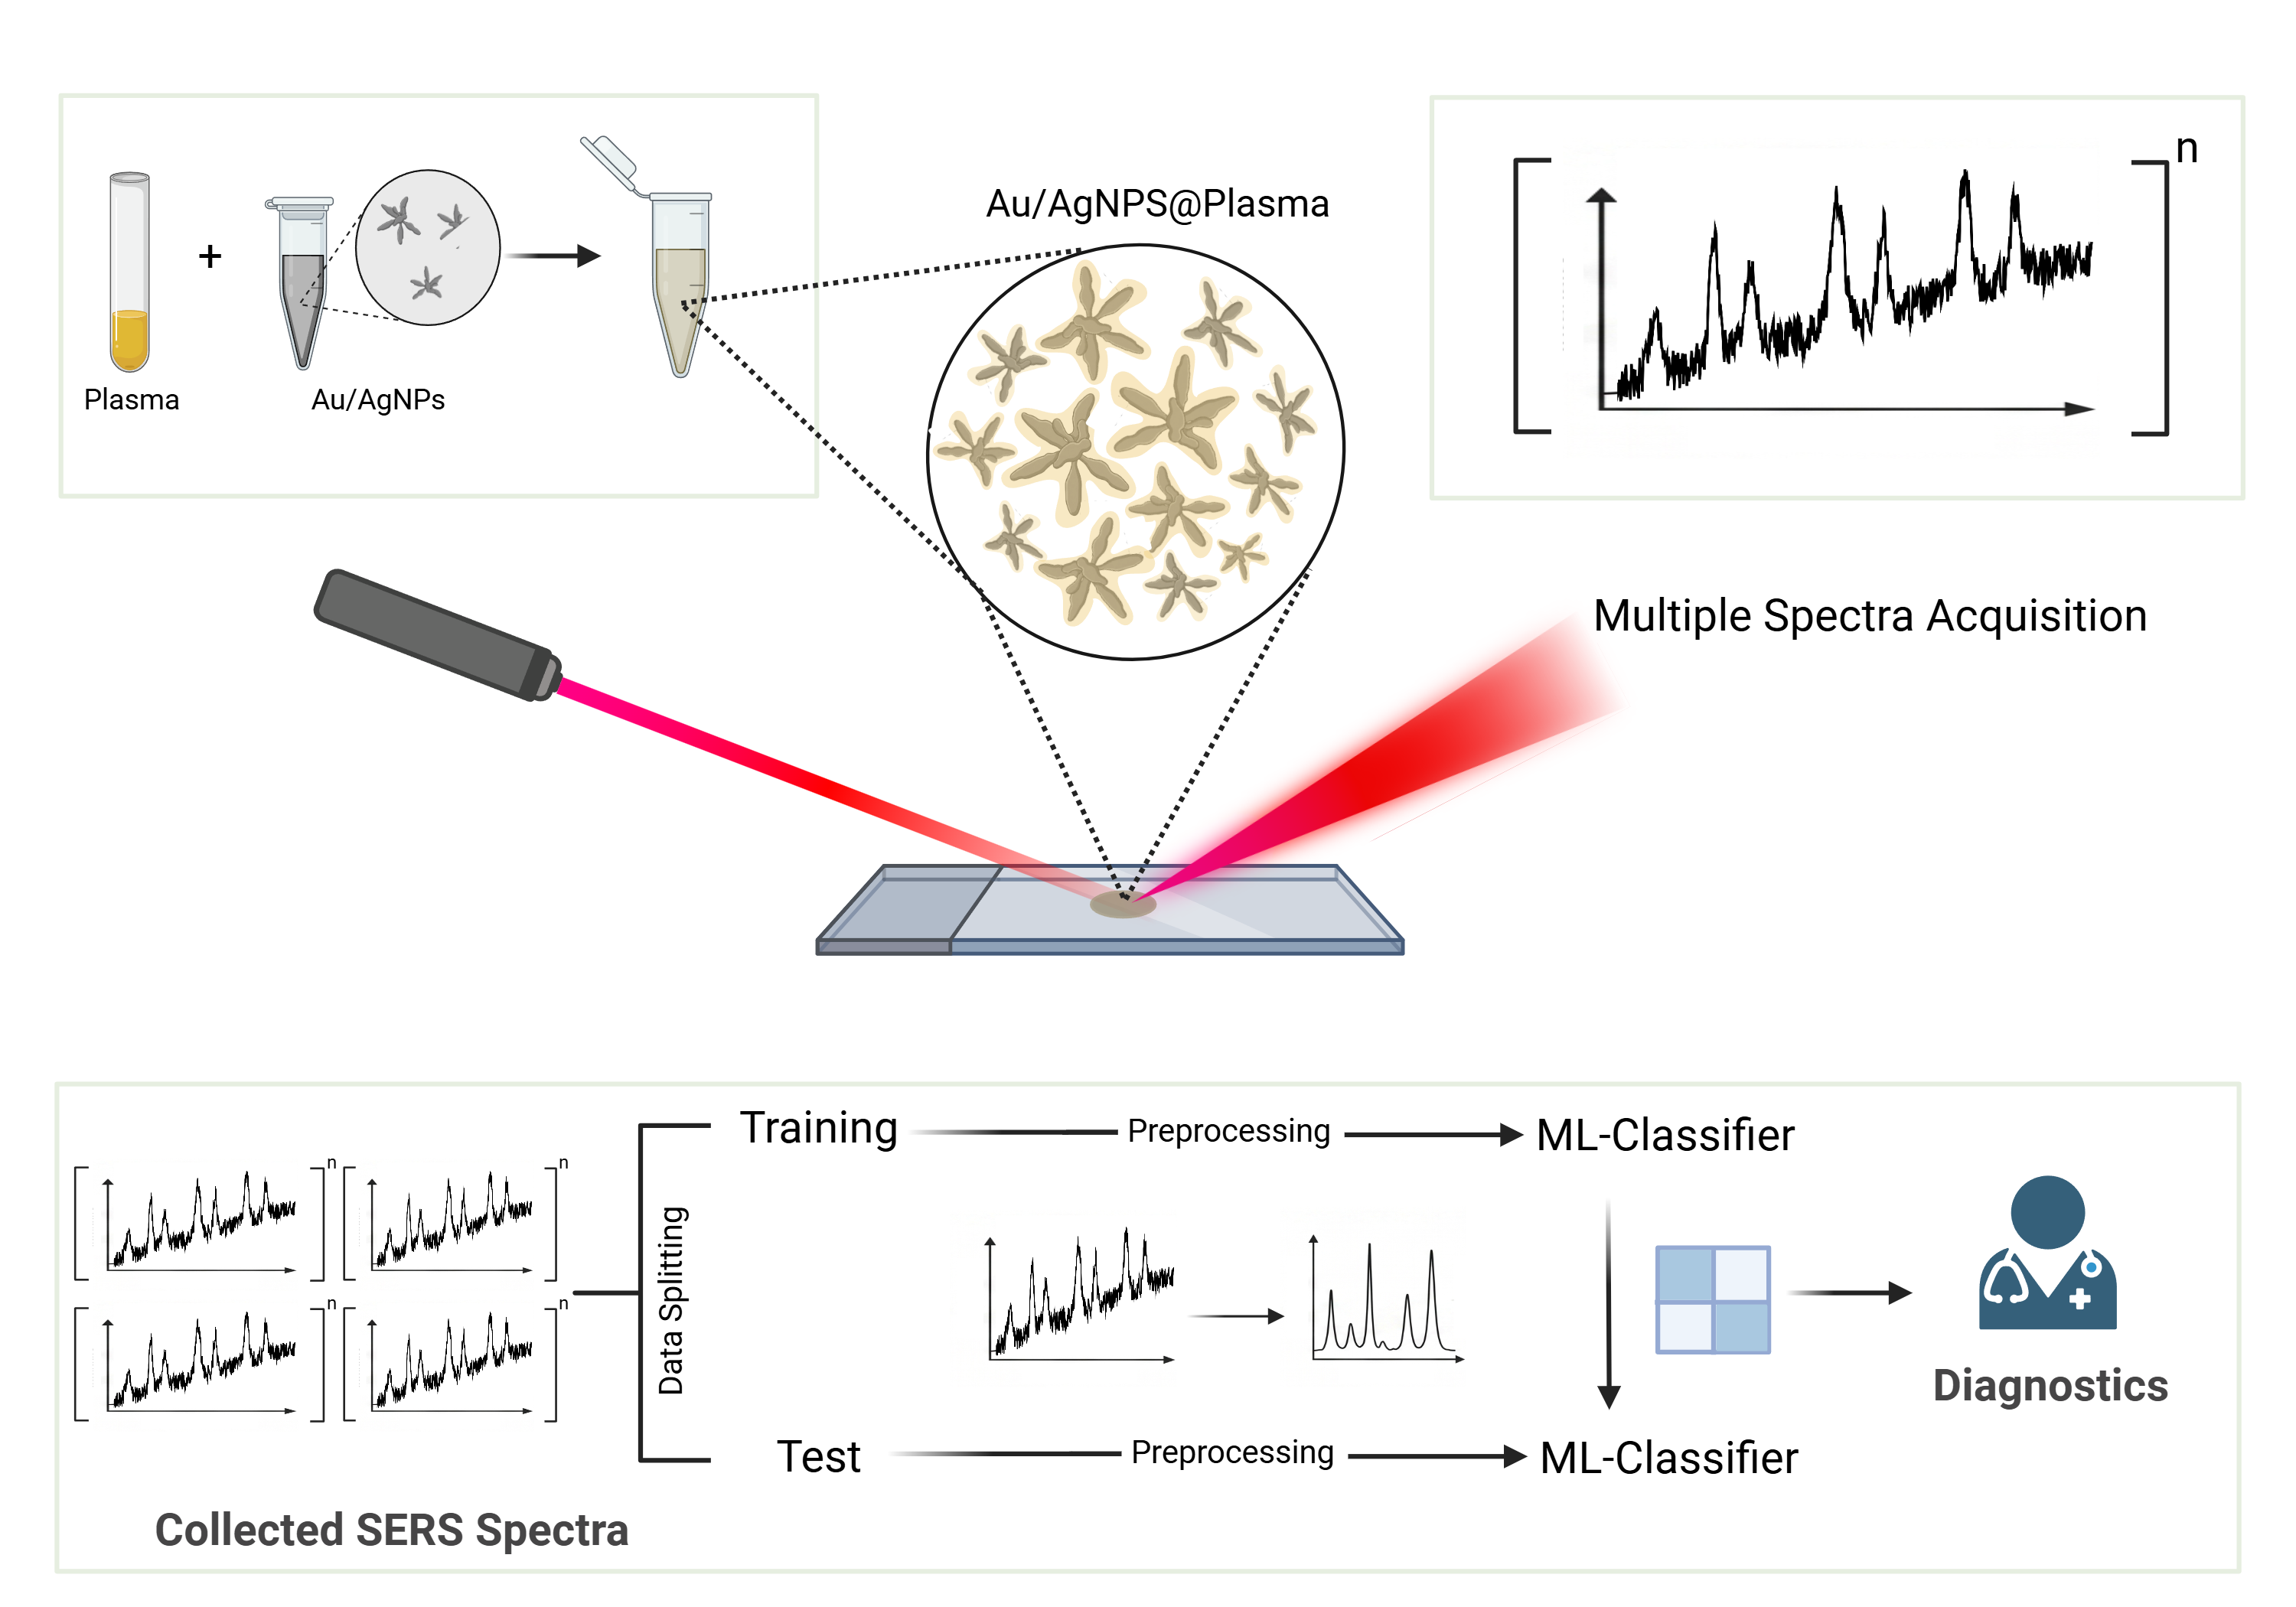
A typical example of SERS measurements and spectra in label-free approach is depicted in Figure 3 (Top), where chemometrics compare SERS spectra from physiologic and pathologic samples to predict health conditions, using significant bands for calibration and classification, Figure 3 (Bottom), a) and b). After simple pretreatment (filtration) of serum with a 50 kDA filter, the classification accuracy of 97%, with 97% specificity, 98% sensitivity, and an area under the receiver operating characteristic curve (AUC) of 0.74 was achieved by principal component analyses (PCA) combined with partial least squares discriminant analysis (PLS-DA) for discriminating healthy serum samples from pathologic tuberculosis serum samples using unlabelled spherical AgNP colloids [15]. Following the same pattern, Gao Siqi and team utilised AgNP colloids in a simple SERS assay to detect liver and prostate cancers in serum, focussing on the coffee ring formed [46]. The successful discrimination between healthy and Typhoid fever infected serum samples was also achieved using colloidal AuNPs in a label-free SERS assay by Ditta and colleagues [47]. Using aggregation agents to increase hotspot density in spherical AuNP suspensions, Turzhitsky et al., detected relevant opioids in urine at picogram concentration [48]. Diverging from colloidal suspensions as SERS substrate, Chen Sheng et al., deposited colloidal AgNPs (nanospheres) on a cellulose triacetate porous membrane to form a 3D structured SERS substrate that enabled the label-free detection of kidney cancer in blood plasma [49]. Similarly, by fabricating a SERS substrate with silicon nanowire and AgNPs (SiNW@Ag) to increase hotspot density, an EF of 4.0 x 10⁸ was achieved that enabled the label-free detection of dopamine in blood plasma samples of depressive patients, with a 4.37 x 10⁻¹² M limit of detection (LOD) [50].
Conversely, rather than use spherical NPs, increased hotspot density from anisotropic geometries was explored to fabricate a SERS substrate from star-shaped AgNPs (nanostars) on a filter paper support matrix. This was utilised to assess interspecies and intraspecies discrimination of Acinetobacter baumannii and Klebsiella pneumoniae strains, where principal component analysis (PCA) and partial least-squares discriminant analysis (PLSDA) allowed interspecies differentiation with specificity in the range of 0.93—1.0, and 0.75—1.0 sensitivity. Intraspecies classification for K. pneumoniae strains was in the range of 0.73—1.0 [14]. While the simplicity of label-free SERS approach is challenged by interference from high molecular weight constituents in biological matrices, impacting on its sensitivity and selectivity, it remains a preferred method for analysing samples that have no existing biomarker, or whose biomarkers are non-specific, making it relevant for biopsies [46,51,52] and other clinical detection such as drug monitoring, organ injury, and neurodegenerative disorders [20,53,54].
2.3. Indirect/Tagged SERS
Some chromogenic compounds called Raman reporters produce SERS signals that are distinct, intense, and stable when adsorbed on AgNP/AuNP and other NPs. During indirect SERS, the signal is extrinsic to the target analyte, i.e., rather than measure the signals from the sample molecules, it is the perturbed Raman signals from the chromophores present that gets detected and analysed to provide information about the sample of interest [3,5]. The coupling of these Raman reporters, mostly organic dyes, to the NP surface with additional targeting ligand functionalisation, creates labelled/tagged SERS substrates (if on a solid support) or SERS nanotags/nanoprobes (colloids) with high selectivity and sensitivity, superior to the direct approach. Generally, NPs form the core of the nanotags responsible for amplifying signals; reporter molecules ease spectral identification due to their distinct signatures; a protective polymer/inorganic/bio-molecule shell coating improves stability and biocompatibility; and a biorecognition element enhances specificity [55]. The advantage of SERS nanotags over existing fluorescence/colorimetric labels is they have high photostability over longer measurement time, a single laser wavelength excitation for different SERS nanotags, and reduced autofluorescence in biological matrices [6]. Also, the Raman scattering cross-section of individual reporter molecules and the number adsorbed per NP determines the brightness of the SERS nanotags [6]. In disease diagnostic applications, the non-overlapping narrow bandwidth of the different reporters means highly customisable SERS nanotags can be designed for single or multiplex detection of a variety of biomarkers. This is significant for SERS optimisation processes aimed at addressing some of the identified challenges pertaining to poor reproducibility; biological matrix effect; and other issues affecting SERS-based diagnostics [56,57].
A very important analytical tool for biochemical studies and clinical diagnosis is the immunoassay with different formats [56,58]. In singleplex or multiplexing, supported by a narrow full width at half-maximum (FWHM) of vibrational Raman bands of easily customisable substrates, sandwich immunoassay formats can be followed such as ELISA, with the difference being that the capture probe is an antibody (Ab) coated on an NP, and the label probe consist of AuNP/AgNP conjugated to a Raman reporter and an antigen-specific layer of antibodies [57]. A demonstration of this labelled SERS immunoassay detected neutrophil gelatinase-associated lipocalin (NGAL) and cystatin C (Cys C), two acute kidney injury biomarkers, at nanogram concentration using a custom DNA-Aptamer AuNP probe [59]. In combining 4-mercaptobenzonitrile (4MBN) and 4-mercaptophenylboronic acid (4-MPBA) as Raman reporters in a SERS tag and SERS substrate sandwich format, Lu Dechan and team fabricated a labelled SERS platform with high sensitivity and specificity for carcinoembryonic antigen (CEA) [12]. A device utilising custom nanotags from different Raman reporters and antibodies was developed for high throughput multiplex detection of septicaemia-causing pathogens in large clinical sample volumes, achieving detection limits of single colony forming unit (CFU) [60].
As shown in Figure 4a–d, fabricating a detection probe (AuNPs@DTNB@anti-IL8) from AuNP colloids, 5,5′-dithiobis(2nitrobenzoic acid) (DTNB) Raman reporter, and anti-interleukin 8 (anti-IL8); together with a capture probe of immobilised anti-IL8 antibodies on amino-modified diatom frustules substrate, a SERS sandwich immunoassay was used to detect the inflammatory cytokine–interleukin 8 in blood plasma, utilising two different substrate support matrices. Sequential SERS measurements at key steps of the substrate fabrication and the immunoassay phases for data acquisition, quality control and result validation, enabled proper data interpretation using chemometrics (Figure 4, Bottom). When comparing detection efficiency of substrate supports made from diatom biosilica those from glass, an LOD of 6.2 pg.mL-1 for the diatomite, and 2.5 ng.mL-1 was achieved [61].
SERS-based immunoassays have become widespread [6,57], allowing for novel applications such as multimode sensing where the specificity and enzymatic activity common in immunochemical detection can be combined with the advantages of SERS-based lateral flow assays (SERS-LFAs) [62]. This multimode SERS strategy was demonstrated by Liang Penghui et al., adapting a colourimetry-SERS configuration to detect SARS-CoV-2 antigens at picomolar levels using an LFA containing antibody functionalised 4-MBA on an Ag core and Au shell [63]. From the foregoing, the choice to follow either the labelled or unlabelled SERS approach for diagnostic purpose is influenced by the sample type and the characteristics of the target analyte, with some experimental parameters better suited for either strategy [37].
3. SERS-Active Nanoparticles
Following the brief introduction on SERS principles and enhancement mechanism, this section introduces AuNPs and AgNPs as the top SERS-active nanomaterials, with mention of the properties of these metallic nanoparticles that makes them viable for onward utility in SERS-based sensing. Also introduced are the concept of categorising the different labelled/direct SERS measurements under two class of single modal singleplex/multiplex detection mode, and multimodal singleplex/multiplex detection.
3.1. Properties of SERS-Active Nanoparticles
The most critical components in SERS are the plasmonic metals with ideal properties integral to the associated signal enhancement [64]. These properties include tuneable LSPR, high electrical conductivity, fluorescence quenching or enhancement, and light scattering capability [65]. Gold (AuNP) and silver (AgNP) nanoparticles have suitable plasmonic properties, hence are the most common materials used for bioanalytical SERS [7,9,64]. Notably, they can be excited at wavelengths ranging from the near visible to the near infrared region significant for both in vivo and in vitro studies [9,35,37].
In terms of morphology, and this cuts across AuNPs, AgNPs and hybrid nanostructures, the stable structure, simple synthesis, and ease of modification results in spherical AuNPs and AgNPs forming the core of most SERS substrates/tags [66]. However, anisometric nanoparticles possess intrinsic properties that makes their use advantageous in many SERS applications. Nanorods exhibit a strong longitudinal plasmonic band at NIR and a weak transverse band near the visible region with length-to-width tunability, making it an extensively investigated one-dimensional anisotropic NP [66,67]. The tip-selective growth of nanorods can be used as template for the synthesis of nanowires, another class of anisotropic shapes. Another shape, nanobipyramids due to having multiple sharp points, display stronger EF and SERS signal than nanorods, making them suitable for imaging and other diagnostic purposes. Nanocages possess porous walls with a hollow interior, suitable for colourimetry. Nanoplates with triangular shape are characterised by sharp corners, large surface area, and high electromagnetic field enhancement. They also exhibit broad electrical and optical properties, with plasmon bands in the visible and NIR region, with readily functionalised surfaces especially from molecules with thiol functional groups. Their high yield synthesis and ease of functionalisation make them suitable for in vivo imaging and other diagnostic applications [66,67]. What is obvious is there are myriad regular and novel NP geometries, each exhibiting a range of properties suitable for specific assays.
3.2. Gold Nanoparticles
In addition to the plasmonic properties already mentioned, gold nanoparticles (AuNPs) are anti-photobleaching, non-toxic, with relative chemical stability in complex matrices, which further promote their use in biomedical applications [65,68]. While AuNPs are noted for lower SERS enhancement intensity compared to AgNPs, they are considered ideal for diverse biological sensing platforms, given the associated enhancement in the red spectral region [9,35]. Notably, the spherical and anisotropic AuNPs are readily synthesised via several top-down/bottom-up techniques enabling the tuning of LSPR to desired wavelengths [67,69], with anisotropic geometries such as Au nanostars, by having multiple thin branches on a small core, produce not only plasmonic absorption in the near infrared (NIR) range favourable for tissue optical applications, but also surface plasmons several orders of magnitude stronger than their spherical counterparts [70]. Additionally, AuNPs possess surfaces that are readily functionalised with diverse chemical moieties which makes them suitable for labelled SERS assays [65,71]. All these properties give insights as to why AuNPs are a recurring component of many SERS-based sensing. In terms of size, a study examined the impact of NP size on SERS signal intensity for bioanalysis by comparing spherical AuNPs of 150 nm and 40 nm diameter in a label-free SERS assay using MCF-7 breast cancer cells. The result favoured the use of larger NPs for optimal SERS signal at the NIR and IR region [71].
3.3. Silver Nanoparticles
Silver nanoparticles (AgNPs) are the second of the two most featured plasmonic substrates used in diverse SERS analyses. They exhibit all the associated properties of optimal SERS substrates, in addition to possessing a significantly higher extinction coefficients and intrinsic SERS EF than AuNPs [44]. This high EF at excitation wavelengths ranging from the 400 nm region and above, promotes its use in numerous biosensing assays [9]. The fact that AgNPs are less stable than AuNPs, prone to oxidation, and cytotoxic, does not limit their usage in SERS and other analytical techniques. Rather, optimisation and synthesis strategies have mitigated these effects, maintaining their continuous use for different applications [14,72,73,74,75].
3.4. Hybrid Nanostructures
The need to enhance the advantages of either or both gold/silver NPs by combination with each other, or with other metallic nanomaterials informs the fabrication of hybrid nanostructures. In hybrid nanostructures derived from only Au and Ag, the core is most often Au, providing chemical stability and a scaffold for thiol-based bioconjugation, with an Ag shell for maximum SERS enhancement [5,55,76]. These architectures are engineered to leverage the complementary attributes of disparate materials, notably the chemical resilience of gold (Au) alongside the superior enhancement capabilities of silver (Ag). Prevalent hybrid configurations include core–shell architectures made with Au and Ag only combined as either Au@Ag, or Ag@Au benefiting from the associated Au stability and the high EF of Ag. Other heterogenous and multicomponent configurations combines either one of Au and Ag, or both with other select metals or compounds. Studies find that hybrid Core-shell nanostructures exhibit strong LSPR, with the core radius and shell thickness determining the SERS enhancement [67]. Hence hybrid nanostructures are relevant in plasma-based diagnostics, where the importance of stability, reproducibility, and high sensitivity is emphasised. Hybrid nanostructures through custom engineering can regulate the adsorption of biomolecules, mitigate non-specific interactions, and enhance the consistency of spectral data across diverse samples [5,55,76]. The fabrication of hybrid Ag-Au bimetallic plasmonic substrate with 107 SERS EF, subsequently labelled with select Raman reporter molecules enabled the multiplex detection of three different interleukins at pg·ml−1 levels in blood plasma using a microfluidic device [77].
3.5. Anisotropic Nanoparticles Tag/Substrate
SERS substrates, whether in solid or colloidal form, are expected to possess ideal large surface to volume ratio, high batch reproducibility, and most importantly have high EF, key determinants of the sensitivity and associated limit of detection (LOD) achievable by specific substrates [64,78]. As physical properties of the NPs impact on the degree of signal enhancement, only select NPs will facilitate significant enhancement effect from the visible to the near infrared (NIR) or infrared (IR) excitation wavelengths usual in SERS bioassays [71]. It then becomes necessary to optimise NP geometry and composition for maximum effect, therefore addressing the need for nanostructures with concentrated hotspot densities, in acknowledgement of single nanospheres generally being poor signal enhancers [9]. The feasibility of custom substrate fabrication for specific tasks is made possible by advances in synthesis and substrate fabrication methods, thereby expanding the utility of SERS-based assays [55].
As already stated, the synthesis route for all types of NPs follow the top-down or bottom-up approach, in line with mechanisms that may be physical, chemical or biological [67,75]. For high yield spherical NPs, the bottom-up chemical reduction synthesis route is the most ubiquitous, where the Au or Ag salts are reduced in a one-pot synthesis to form monodispersed AuNP spheres [59,79], AgNP spheres [80,81], or spherical Au-Ag hybrid [12,82]. Non-spherical shaped NPs, known to possess much higher EF than their spherical counterpart, can also be synthesised through a similar one-pot chemical reduction synthesis. However, for better control over NP morphology, the seed-mediated chemical synthesis route is preferred [67,70].
What stands out is that branched NPs that possess multiple bran[67,75]ches such as nanostars are an important type of nanostructure, exhibiting high, tuneable LSPR and SERS enhancement generated at the core and most especially at the tips. Although they are not as monodispersed as other shapes, their high EF even in single particle measurements makes them viable as SERS substrate for disease diagnosis [66,67]. While nanospheres most often require induced aggregation from an extrinsic agent, or from components in the reaction medium/matrix to generate hotspots, individual nanostars are replete with sharp tips acting as hotspot nodes, hence require no aggregation to generate intense enhancement fields. As an example, Freitas et al., utilised a one-pot chemical reduction process to synthesis AgNP nanostars with average 99 nm arm length and 186 nm tip-to-tip length (Figure 5). By exploiting incubation time, the mitigation of a protein corona formation was achieved (seen as a low contrast film in Figure 5B,C), noted for confounding SERS measurements. Enabling the use of a simple aluminium foil support, a label-free SERS Assay for stroke detection [17].
Conversely, the seed-mediated synthesis of AuNP nanostars was used in fabricating a SERS immunoassay detection system with pg.mL-1 LOD. The tag made from AuNP (nanostars), Raman reporters (4-mercaptobenzoic acid, MBA, and 5,5-dithio-bis-(2-nitrobenzoic acid), DTNB) with antibody (AuNP@MBA@anti-Ab, and AuNP@DTNB@anti-Ab), used in combination with an antibody-functionalised 43.5 µm regenerated cellulose-based hydrogel (RCH) microfluidic capture platform, achieved differentiation between horseradish peroxidase (HRP) Plasmodium falciparum His-Rich Protein 2 (PfHRP2). Through optimising the ligand coupling process, the reagent concentration, the molar ratio of AuNP and Antibody, the reaction time, and the pH, a 5-fold increase in antibody biological activity of the nanostar SERS tag was achieved [58]. The citrate reduction, and hydroxylamine reduction methods was used to synthesise respective AgNP nanospheres and nanostars, subsequently deposited on both a filter paper and a regular office paper designed with wax-printed wells to form a novel paper SERS substrate. By SERS performance of paper substrate support (office paper vs Filter paper) and AgNP geometries (nanospheres vs nanostars), office paper had superior uniformity per deposited AgNP density, requiring one-third the volume of AuNPs to detect targeted analyte. An EF of 8.4 × 10⁶ (office paper) and 2.1 × 10⁶ (Whatman no. 1 paper) was obtained for spherical AgNPs, while the EF for AgNP nanostars was 3.0 × 10⁷ (office paper) with the same AgNP density. This further highlights the excellent enhancement from anisotropic NPS compared to spheres, in addition to showing how the choice of substrate support can impact SERS measurements. [83].
Either route have also been utilised to synthesise several other anisotropic morphologies [84,85,86]. A specific example is the synthesis of AuNP (nanorods) via seed-mediation, used for fabricating an AuNP@SiO2@MGITC@Ab tag, subsequently utilised to detect interleukin 5 (IL-5) in sputum [87]. Similarly synthesising anisotropic AuNP (pyramids) encoded with three Raman reporters, 4-ATP, 4-nitrothiophenol (NTP), and 4-methoxybenzyl mercaptan (MATT), and DNA-framed aptamers for prostate specific antigen (PSA), thrombin, and mucin-1 to form a controllable multiplex SERS substrate; the aptamer-encoded AUNP tag was used for the simultaneous detection of the mentioned biomarkers in serum at attomolar LOD [88]. Additionally, physical methods such as photolithography and electron-beam evaporation also feature as fabricating routes for anisotropic NPs such as nanowires [18] and Nanorods [89] .
3.6. Sensing Modalities
The combination of SERS protocols with the diverse configurations of AuNP and AgNP substrates have provided a viable platform for various plasma-based biomarkers that can be profiled for disease diagnostics. Notwithstanding the complexity of the biological matrices, different detection mode and configurations of SERS-based nanodiagnostics are available including, but not limited to:
- Single-mode, single or multiplex analyte detection, where plasma itself or any number of biomarkers contained therein is the target analyte, utilising SERS alone.
- Multi-mode, single or multiplex analyte detection, combining one or more biosensing transduction platforms together with SERS to detect a any number of target analyte in plasma.
This is an alternate classification based on signal transduction mechanism and the number of target analytes, in which the single-mode strategies exploit the fact that a single SERS excitation wavelength dependent on the AuNP/AgNP substrate geometry, composition and dielectric modulation, could generate optimal signals from one or more target analytes in blood plasma. Another key SERS attribute exploited is the very narrow width of Raman spectra obtained compared to fluorescence technology, with minimal spectral overlap even when multiple labels are utilised [57]. These strictly SERS-based detection modalities optimise spectral signatures from a single molecule in a plasma sample, or a collection of Raman bands with varying intensities from several plasma molecules for disease diagnoses [40]. Combining SERS with other signal transduction modalities in multi-mode detection strategies leverage the advantages of the different techniques, resulting in superior performance and result validation [29,68,90]. This detection approaches are discussed further in Section 5.
4. Biological Matrices and Disease Diagnostics
SERS has emerged as a viable clinical diagnostic technique for probing biological matrices with high sensitivity, specificity and multiplexing capability comparable or superior to conventional laboratory methods. This section briefly introduces the different types of biological matrices that can be analysed with SERS. Also introduced are the constituent biomarkers within respective biological matrices targeted in SERS for disease detection.
4.1. Biological Matrices
Biological matrices are the source of biomarkers targeted in diagnostic SERS analyses, ranging from complex, protein-rich biofluids such as blood plasma and cerebrospinal fluid (CSF), through cellular and tissue specimens, to structurally heterogeneous solid matrices including bone, tooth enamel, and keratinous appendages such as hair and fingernails [5,91]. As repositories of vital anatomical, physiologic, and pathologic information, their applicability extends beyond disease diagnostics to include forensic and toxicological investigations for medical or legal purposes [5,92]. Given the complexity of biological matrices, together with the variation in biomarker quality and quantity, an understanding of biological matrix properties and composition informs their suitability as samples for different analytical procedures [93].
4.1.1. Solid/Semi-Solid Biological Matrices
Solid specimens like bones, teeth, fingernails, and hair, widely known to endure environmental degradation, are mostly exploited in forensic SERS assays for crime investigations [92,94]. Although they also can be used in disease diagnostics, for example in detecting alopecia [85], their applicability in SERS-based disease diagnoses is presently limited. Tissues are better suited to histologic and in situ SERS imaging for investigating neoplasms and metabolic changes [66,95,96], with SERS probes having potentials theranostics [97]. Human faeces, a complex and semi-solid biological matrix with a broad biochemical composition of metabolic biomarkers derived from the host, the gastrointestinal microbiome, foreign bodies and xenobiotics are better suited to diagnostic SERS assays for enteric infections and diseases of the digestive system [79]. Hence, SERS-based faecal metabolomics using colloidal AuNP spheres have been demonstrated for coeliac patients on gluten-free diet, with potential as a complement to 16S rRNA sequencing [79]. Colloidal AgNP have also found utility in the fabrication of an easily disposable paper SERS substrate for detecting viral enteric infection in faecal samples [98].
4.1.2. Non-Blood Biofluids
Because of their extensive and clinically significant biomarker contents, biofluids are the most ubiquitous samples investigated across all analytical platforms for disease diagnostics, biomarker discovery and therapeutic drug monitoring [99,100]. Among biofluids of non-blood origin, sweat, which is derived from plasma and interstitial fluid, is produced within the sweat glands located all over the skin. It is a painlessly collected and non-invasive body fluid rich in metabolites and small molecules (glucose, uric acid, creatinine, cortisol etc.) in flux [93]. Health status from normal/abnormal levels of these sweat-based biomarkers can be inferred via regular SERS assays [101,102], or novel wearable SERS sensors [103,104].
Human tears, produced by the lachrymal gland are another biofluid rich in biomarkers (including lysozymes and hundreds of other identified proteins), from which major ocular infections/diseases and other systemic abnormalities can be diagnosed [105]. As such, it has served as clinical samples for SERS based detection of Alzheimer’s using a label-free format of colloidal Au nanospheres [106], in SERS assay for detecting diabetes using a composite fluorescence-quenching substrate made from colloidal gold, MXene, and Titanium aluminium carbide [107] among other diseases.
SERS assays in different formats have also been developed for detecting clinically relevant biomarkers in sputum and saliva, another class of non-invasive biofluids closely associated with the respiratory and digestive system, from which valuable information on oral, inflammatory, and related systemic health condition can be extracted. With studies using different labelled and unlabelled substrates and configurations in diagnostic SERS for pathogenic infections [108]; inflammatory agents [87]; periodontal diseases [109]; systemic autoimmune diseases [19,110].
Urine, the human excretion waste product comes second after serum/plasma as the most used biofluid in disease diagnostics. It is a major resource of biomarkers (creatinine, uric acid, glucose, proteins and nucleic acids) for systemic diseases/organ damage, particularly the kidney and other excretory systems, with the advantages that includes large collection volumes, non-invasive sampling, and a relatively lower protein content than plasma. Urine thus serves as a suitable biological matrix for evaluating kidney function through the variation in detected biomarker content levels [111,112,113].
The Cerebrospinal fluid (CSF), mostly generated in the choroid plexus, is important for the maintenance of the brain and central nervous system (CNS), with its biomarker composition kept simple and at low levels by the blood brain barrier (BBB) [114]. Thus, a change in the levels of CSF components is indicative of brain-diseases and a compromised CNS. SERS has therefore been used to detect pathogenic infection of the CNS [114,115], neoplasms [116] and other disorders of the CNS using a variety of AuNP/AgNP substrates.
4.1.3. Blood-Based Biofluids
From the foregoing, it is obvious that the different biological matrices contain biomarkers often relevant to the organ systems they are associated with. Of all the biological matrices, blood-based samples (whole blood, plasma, serum) are the most used across all disease diagnostics [99,100,117]. Whole blood is a connective tissue comprising of blood cells (erythrocytes, leucocytes, and thrombocytes) suspended in plasma and contains biomarkers from almost all the body organs [118](39,90). Serum is whole blood completely separated from blood cells. Clinical plasma is the liquid blood portion devoid of red and white blood cells, while retaining the coagulating factors, hence has higher protein content than serum [100,119]. While serum is less rich in proteins, hence have a reduced matrix effect on metabolite adsorption, plasma contains the full complement of blood protein. There is no consensus on which is better as a clinical biological matrix [37,119]. Taken together, they contain the most comprehensive biomarker components relevant to an endless list of diseases for diagnostics, biomarker discovery and therapeutic drug monitoring [118,120]. SERS investigation using whole blood samples [121,122,123], serum [124,125,126], and plasma [84,127,128] dominates past and contemporary research landscape.
4.2. Target Analytes in Biological Matrices
The target analytes in biological matrices, basically the biomarkers, includes proteins, nucleic acids, metabolites/small molecules, and extracellular vesicles [6]. Any change in the respective biomarker levels, structural aspects, functional behaviour, or pharmacological actions can be correlated with initiation, progression, and regressive aspects of disorders, and the body’s response to these events. Which makes biomarkers vital in detecting, assessing, diagnosing, prognostic, and monitoring various diseases/disorder [129]. The diversity of the different biomarker class and their concentration range in respective biological matrices influences the choice of SERS strategies for their detection.
4.2.1. Proteins
In the human body, there are more than 20,000 proteins coded for by genes, with many thousands of these found in blood (whole, plasma and serum) either through direct secretion or cell leakage [130,131]. They regulate biological processes, therefore can be harnessed for diagnosis and other health related purpose based on their concentration, extent of expression, defects, and distribution [131,132,133]. A non-exhaustive list of proteins targeted in SERS assays includes peptides, enzymes, and antibodies, albumins, globulins, fibrinogen, hormones, cytokines, chemokines, adipokines and growth factors. Twenty-two proteins (Serum albumin, globulins, fibrinogen and other high molecular weight fractions account) for 99% of total plasma/serum proteins, while low molecular weight fractions make up the remaining [100,118]. Valuable clinical information from this rich variety of proteins can be extracted. However, many of these disease-associated protein biomarkers are typically present in low concentration and coexist with other high-abundance biomolecules, making their detection extremely challenging, especially from the protein corona formation associated with complex biological matrices [134,135,136,137]. In SERS measurements, different protein detection strategies are available that targets a single protein biomarker or collate a panel of multiple proteins when no known biomarker is available. This is in addition to readily fabricated nanotags functionalised with different biorecognition elements for multiplex protein detection. Hence, SERS is a viable technique for detecting different types of protein-based biomarkers using single or multiplex formats [38,39,131,138].
4.2.2. Nucleic Acids
Nucleic acid biomarkers e.g., DNA, RNA, and their variants are relevant in biomedical analyses, given that changes such as the abnormal expression levels of some miRNAs, point mutations in DNA sequences, and altered levels of DNA methylation are significant evidence of a disorder [139]. For example, tumour-related biomolecules (circulating tumour DNA, ctDNA; circulating free DNA, cfDNA mutated fragments) enter the bloodstream during cancer apoptosis generating a broad set of cell-free biomarkers valuable for early-stage detection, prognosis and neoplasm monitoring [132]. Because nucleic acids of interest (miRNA, ctDNA etc.) are normally in very low concentration, PCR and other amplification assays are often preferred, however the region of interest must be known for these assays to be designed appropriately [140]. This supports the need for nucleic acid detection by SERS, alone or in combination with amplification techniques such as PCR, with multiple approaches and modalities developed [132,141]. SERS sensitivity can detect nucleotides at very low concentration, with substrate engineering enabling reproducible spectra [45]. The multiplexing capability of SERS means it can simultaneously detect multiple nucleic acid biomarkers, which is important for point-of-care (POC) detection, high throughput screening, and many other biomedical research [70]. Among the SERS-based nucleic acid approaches, assays with base-pairing configuration is common, whereby a probe sequence complementary to the target DNA sequence of interest is labelled with a fluorescent dye allowing detection of a specific target sequence [39]. Another approach is to functionalise NPs with DNA sequences specific to the target biomarker [39]. With several studies fabricating SERS substrates for detecting DNA [52,142,143] and RNA [144,145,146] in biological matrices.
4.2.3. Metabolites/Small Molecules
There are more than 100,000 metabolites at varying concentrations in blood-based samples [100]. They are expressed regularly during metabolic processes, hence a deviation in expected concentration (increase/decrease), location, and physicochemical properties can be as a result of health disorder, useful in clinical diagnosis [55]. At reduced matrix interference, the metabolome with Raman cross-sections is directly accessible to SERS substrates, with diverse Au/Ag substrates fabricated for the detection of clinically relevant metabolites, for example, Chu Yuhan et al., utilised a two-step enhancement strategy with synthesised AgNP colloids in a SERS-based toxicological screening of three special drugs with potential high dosage toxicity namely clozapine, isoniazid, and carbamazepine in blood, urine and breast milk [147]. SERS have been used in related assays for the detection of several other metabolites such as glucose [102,107,148], urea/uric acid [149,150], creatinine [101], and drugs [22,151,152] in biological matrices.
4.2.4. Extracellular Vesicles (EVs)
Extracellular vehicles (EVs) are important biological messengers involved in cell-to-cell communication. They carry packages of select nucleic acids, protein and lipids from their parent cells, hence have diagnostic importance across various diseases [55,153]. For example, exosomes produced in the endosomal compartment and secreted into body fluids contain both membrane and cytosolic information about the originating parent cells and their microenvironment, which makes EVs a viable biomarker [132,153]. In addition to techniques for detecting EVs, such as flow cytometry, Western blot, and direct fluorescence imaging, SERS is being adapted in detecting EVs, where the detection exploits either the intrinsic molecular fingerprint of the vesicle membrane by direct SERS, or antibody-mediated capture of specific surface proteins by SERS nanotag immunoassay [116,154,155,156].
5. SERS, Plasma and AuNP/AgNP Nanostructures Utility in Disease Diagnostics
An overview of detection strategies that are SERS-based alone, or in multimode combination with other signal transduction mechanisms for single or multiple analyte detection in plasma samples is the focus of this section. The examples highlight practical application of SERS in disease diagnostics using plasma samples with viable analytical performance.
As previously mentioned, human blood plasma and serum are the most studied bodily fluids for disease diagnosis, biomarker discovery and therapeutic drug monitoring [100,130,131]. As a connective tissue circulating all over the human body, plasma composition is continuously equilibrated with the extracellular fluid of virtually every tissue compartment, providing information about cell turnover, inflammation, and antioxidant capacity [119]. In short, when these processes are perturbed in virtually any disease, plasma reflects the complete physiologic and pathologic state of the human body system, making blood test using plasma a routine in clinical diagnosis [119,157]. While blood plasma composition is predominantly water (≥ 90%), with over 114,000 known metabolites at varying concentration level (< 1 nmol/L to mmol/L), minerals, organic substances and gas [100,130,131]. Its molecular components is dominated by proteins of different molecular weight fractions (albumin, globulins, fibrinogen and a thousand others) [130,131], together with constituents like carbohydrates, lipids and amino acids. It is obvious that all the biomarkers earlier mentioned in the preceding section are present in plasma. And their fingerprint can be derived from SERS measurements, given their Raman spectrum are in the range of 400—2000 cm -1 wavenumbers, where bond vibrations at 470–1200 cm-1 are associated with carbohydrates; 980, 1080 and 1240 cm-1 are associated with some metabolites and nucleic acid phosphate groups; 1500–1700 cm-1 are associated with proteins; and higher wave numbers (2700 3500 cm-1) are attributed to CH, NH, and OH stretching in protein and lipids [37].
5.1. Single-Mode Single/Multiplex Analyte Detection
It is difficult to fabricate simple SERS substrates with consistent binding affinity for all the biomarkers in biological matrices [99]. This makes label-free SERS vital as a detection strategy, whereby readily synthesised pristine AgNPs in colloidal solution, or deposited on suitable support platforms provide the necessary SERS signal enhancement. More also, instead of targeting a single biomarker component, multiple constituents in the plasma sample and other biological matrices produce a comprehensive spectral fingerprint from which diagnostic interpretations can be deduced using chemometrics [99].
To avoid excess derivatisation, colloidal suspensions of AgNP (spheres) was used as substrate in the direct discrimination of blood plasma samples from colorectal cancer (CRC) patients, patients with adenomatous polyps (AP), and healthy controls (HC) in a label-free SERS assay for cancer detection. As-synthesised AgNP colloids incubated (1:1) with the respective blood plasma samples formed the experimental mixture. The Raman band at 1652 cm -1 was used in calibration, with multivariate statistical analysis based on partial least squares (PLS) and linear discriminant analysis (LDA) with a Leave-one-out cross validation (LOOCV) utilised for spectral classification. There were 10 common peaks among the three groups, with four bands (725, 892, 1004 and 1368 cm-1) being more intense for the CRC group, while 632, 1130 and 1659 cm-1 bands were stronger in normal and AP samples. A shift in CRC band at 892 (902 cm-1) and at 1368 (1349 cm-1) was observed, absent in the HC and AP spectra. Eight significant bands were at 632, 725, 902, 1004, 1128, 1275, 1350 and 1664 cm -1 where CRC showed increasing or decreasing band intensity compared to AP and HC samples. Bands at 632 cm -1 for AP and 725 cm -1 for CRC were also identified for other neoplasms. The use of select latent variables for discriminate analysis avoided overfitting when PLS-LDA was used in calculations. The diagnostic sensitivity and specificity for discriminating AP samples from CRC samples were 71.4% and 95.6%, respectively. While for differentiating AP samples from normal samples were 91.3% and 80%, respectively. The areas under the ROC curve (AUC) were 0.938, 0.869 and 0.945 for the three data sets combination, together with a combined diagnostic sensitivity of 86.4% and specificities of 80.0%. This is relevant given that contemporary screening tests such as the faecal occult blood test (FOBT) and faecal immunochemical test (FITS) have specificity ≥ 95%, but their sensitivity ranged from 65.8% to 81.8% for CRC, and 27.1% to 41.3% for advanced adenomas respectively [81]
The same research group in another exploratory study utilised label-free spherical AgNP colloids as SERS substrate, with two statistical data analyses–an empirical algorithm, and multivariate statistics (PCA, LDA) to generate a cervical cancer SERS profile of plasma samples from 60 cervical cancer (CC) patients and 50 healthy controls (HC). A noticeable difference between the measured Raman spectra and SERS spectra indicated sufficient enhancements from the AgNPs. They also noticed SERS peak intensities at 632 cm -1 decreased alongside an increase in SERS signal at 725 cm -1, with the band at 1655 cm -1 being stronger in the CC spectra. From the empirical diagnostic algorithm based on the integration area of the SERS wavenumbers at 1310–1430 and 1560–1700 cm -1, a classification between CC and HC samples gave a discrimination with 83% sensitivity and 78% specificity with a 0.849 AUC. In contrast, a significant improvement (15%) in the diagnostic sensitivity (96.7%) and specificity (92%) was calculated using on PCA and LDA with a 0.994 AUC, supporting the significance of multivariate analysis in SERS spectra interpretation. [158]
Also using multivariate (PCA-LDA) statistics for spectral data analyses, but with AuNP colloidal suspension as the label-free SERS substrate mixed with equal volumes of respective plasma samples, Lin Duo et al., [117] was able to discriminate tumour stages (T1–T4) of nasopharyngeal cancer (NPC) patients from health controls (HC), with a diagnostic accuracy of 83.5% (T1) and 93.3% (T2–T4) from HC, with a 63% diagnostic accuracy between T1 stage cancer and T2–T4 stage cancer. Both HC and NPC samples (T1, T2–T4) showed similar band patterns at 13 wavenumbers, with bands at 492, 725, 1003, 1131 and 1208 cm -1 significant for differentiating HC from both T1 and T2—T4 groups. Also, bands at 1068, 1402, and 1655 cm -1 enabled inter-group classification. Of note was that most of the identified spectral bands could not be used to discriminate between T1 and T2—T4 groups. The calculated AUC was 0.641 (T1 vs T2—T4), 0.955 (T1—HC), and 0.981 (T2—T4 vs HC), supporting a strong potential for differentiating HC from NPC blood samples, but had limitations in categorising between tumour stages [117].
It can be observed that chemometrics is necessary for interpreting SERS spectral profiles, especially from label-free assays. Hence, a different data analysis method integrating PCA with Classification and Regression Trees (CART) algorithm was used in interpreting spectral data from a label-free SERS assay to distinguish different groups (M3, M5, oAML) of acute myeloid leukaemia (AML) patients and healthy control (HC) plasma samples. The general procedure of mixing equal volumes of colloidal AgNP suspensions with respective plasma samples was followed, however, incubation time was shorter (at 4 0C and 15 minutes). Utilising both the band intensity data and whole spectra data in the classification, PCA and CART algorithm returned a classification accuracy of 89.8% for differentiating between all AML samples and HC. The combination of four significant band ratios (533/1002 cm -1, 1070/1653 cm -1, 725/1653 cm -1, and 1616/1653 cm -1), enabled an AUC of 0.955 (HC vs AML), 0.968 (M3 vs M5), 0.934 (M3 vs oAML), and 0.707 (M5 vs oAML) to be calculated [10]. While further validation of the results is expected, a fast incubation time of 15 minutes, and the total test population of 222 plasma samples (including HC) used in this study is an encouraging improvement in speed and population depth.
Utilising spherical AgNP colloidal suspension and another type of statistics (Gaussian kernel support vector machine (SVM) algorithm) for classification, a study provided detailed vibrational spectroscopic differentiation between ovarian cancer (OvC) and benign gynaecological conditions (as control, HC) using both Raman and SERS measurements. Bands at 1657, 1418, 1301, 1242, and 916 cm -1 for Raman measurements, and 1655, 1429, 1302, 1257, 919 cm -1 for SERS were identified as significant. Surprisingly, after spectra processing and SVM classification between OvC and HC samples, Raman spectroscopy achieved a 94% sensitivity and 96% specificity in contrast to the 87% sensitivity and 89% selectivity from SERS. The trend was validated when accounting for age difference of the sample population and following further screening to exclude possible impact of plasma CA-125 levels (an upregulated cancer biomarker), with higher sensitivity and specificity achieved by Raman in comparison to SERS. The determination via electrochemiluminescence (ECL) of the CA-125 levels in all the samples prior to usage in the SERS experiment provided a valid parameter to compare results, hence excluded CA-125 as a confounding factor [11]. Generally, SERS is acknowledged as being more sensitive than Raman spectroscopy in complex matrices, however this report provides interesting possibilities for further investigation. While the presence of the anticoagulant (EDTA) in the plasma samples are a plausible reason for the reduced accuracy from SERS measurements, it is possible that the protein corona from HMWF proteins impacted the results [135,137]. It also is possible that changes in the experimental and data interpretation methods can improve results from Raman.
It is apparent from reported literature that colloidal Au and Ag nanospheres are the most ubiquitous substrates used in label-free SERS assays, generating strong enhancements driven by NP aggregation on contact with the biological matrix constituents. However, SERS substrates with anisotropic geometries e.g., nanostars, exhibit higher hotspot density per isolated particle due to the “lightning rod effect” from sharp tips in multiple branched arms on a tiny core, that produce SERS enhancement two or more orders of magnitude stronger than non-aggregated nanospheres [70]. This shape-induced SERS enhancement was explored by Freitas and colleagues in their use of NP nanostars for stroke detection in plasma, aimed at rapid pre-hospital diagnoses and faster treatment intervention. By exploiting the superior EF from Ag and the high hotspot densities from anisotropic geometries, citrate-capped colloidal AgNPs (stars) detected levels of glial fibrillary acidic protein (GFAP), an associated haemorrhagic stroke biomarker in plasma at clinically relevant concentration. The predictive accuracy of 83% was derived using machine learning (ML) algorithms, showing good potential to differentiate between stroke types [17]. This study demonstrated that anisotropic SERS assays integrated with ML algorithm is a promising method to differentiate between the different stroke types.
Matrix interference from the constituents of plasma and other complex biological matrices is an important factor that hinders optimal application of SERS-based assays in disease diagnoses. Necessitating several sample pretreatment strategies to mitigate it. From the varieties of sample preparation methods ranging from the simple to the sophisticated, a simple blood plasma preparation technique for enhancing diagnostic performance of a label-free SERS approach was proposed by Lu dechan and colleagues [80] to differentiate lung cancer (LC) samples from healthy control (HC) samples. Spherical AgNP colloids were reacted with the respective plasma samples after a 10-fold dilution of all plasma samples, followed by adjustment of the sample pH to 5. Droplets of the reaction AgNP@plasma mix were covered with liquid paraffin to prevent evaporation, and SERS measurements taken in the wet state. A comparison of wet and dry SERS measurements gave an RSD of 14.04% (with paraffin) and 22.3% (without paraffin) using the Raman band at 638 cm-1 in spectra calibration. While there was the absence of coffee rings in the samples shielded in liquid paraffin, a decrease in the band intensity for those samples was observed. Notably, both LC and HC samples shared 10 characteristic Raman bands at wavenumbers 494, 638, 730, 813, 893, 930, 1018, 1136, 1213, and 1456 cm-1, with the 638 and 730 cm-1 bands showing significant difference (Figure 6A,C,E). PCA and LDA returned 93.3% diagnostic sensitivity and 90% specificity, with an AUC of 0.975 for LC and HC samples at pH 5. After comparing results with untreated samples and samples at pH 5 and pH 7, the appreciable improvement in results makes this simple dilution and pH adjustment pretreatment method promising as a means of improving SERS reproducibility.
There are some agreements among researchers that sample pretreatment (filtration) to remove HMWF from plasma/serum does not cause significant loss of information when compared with data from untreated blood samples [38,99]. Hence this premise has been investigated in several studies removing these fractions from samples before measurement. An interesting approach combined electrophoresis and SERS, wherein electrophoresis separates the protein fractions into identifiable bands, and all the respective bands are processed for SERS measurement. Lin Juqiang et al., [157] explored this route by performing blood plasma pretreatment and purification before SERS measurements for the detection of gastric cancer (GC) in blood samples. Membrane electrophoresis was performed to obtain isolated and purified HMWF plasma proteins (albumin, α1-globulin, α2-globulin, β1globulin, and γ1-globulin) from the membrane, with the respective protein fractions dissolved in acetic acid. The addition of colloidal AgNP (spheres) into each tubes completed the setup, with supernatant portions from each fraction used in SERS measurements. This electrophoresis-assisted protein purification and isolation process was repeated for the respective healthy control (HC) and GC samples. The albumin and all the globulin fractions shared spectra bands at 757, 850, 880–890, 1003, 1030, 1210, and 1604/1618 cm-1. The GC and HC plasma samples had relatively different spectral bands at 825, 850, 890, 932, 1003, 1174, 1210, 1257, 1336, 1445, and 1680 cm-1 for their purified albumin fractions, while the globulin fractions differed at the bands at 757, 825, 850, 880, 932, 1003, 1174, 1210, 1257, 1323, 1445, and 1680 cm-1. The electrophoresis step enabled a 100% discrimination accuracy, sensitivity, and specificity between gastric cancer and non-cancer samples was validated via PCA [157].
As a part of mitigating matrix interference in SERS measurements, but without sample pretreatment, an interesting demonstration of the versatility of SERS-Colourimetry was conducted wherein different opioids (Fentanyl and codeine) could be detected in whole blood, blood plasma, and saliva using an LFA dip stick strip. The presence of one or two colours at the test and control lines containing antibody-functionalised AuNP provided a visual negative or positive confirmation. Attendant SERS measurements then identify the respective drugs from their distinct fingerprints. An element of filtration occurred when samples flowed through the strip, with the respective metabolites detected and quantified in varying concentrations using untreated biofluid samples [121].
Diverging from sample pretreatment as an option to generate consistent and reproducible SERS spectra, tangential flow filtration (TFF) was explored to purify and concentrate synthesised AgNP (spheres) colloids, reducing polydispersity and eliminating chemical residues from the synthesis process. A 16% size reduction in FWHM seen in the UV-Vis spectra (Figure 7, Left) was obtained, with NP diameter reduced from 100 nm to 84 nm. SERS substrate formed by depositing the processed AgNP on a CaF2 glass ensured consistent SERS measurements, enabling the label-free discrimination of 29 breast cancer (BC) samples from 35 healthy controls (HC).
Similarity in SERS spectra bands in both HC and BC samples with differences from the superposed spectra highlighted in blue colour (Figure 7, Right), necessitated multivariate data analysis. In addition to achieving high inter-batch reproducibility and around 3 x 10³ EF, spectra analysis via PCA-LDA discriminated BC from HC with 90% sensitivity, 89% specificity and 89% accuracy. Which shows promise when compared to mammography performance (70% sensitivity and 75% specificity). Moreover, the results support colloidal substrate processing to enhance monodispersity as a means of mitigating substrate-derived variation in SERS measurements [159].
When colloidal SERS substrates are used in SERS measurements, the spontaneous and random aggregations of plasmonic nanoparticles adds to the variability of generated SERS spectra SERS substrates on solid support are fabricated to allow optimal enhancements without inducing aggregation. To minimize random aggregation, the combination of Langmuir–Blodgett (LB) deposition and the self-assembly techniques was used in a SERS assay by the Das team [160] to detect blood glucose levels directly in healthy, pre-diabetic, and diabetic blood plasma. The fabrication of 4-cyano-4’-pentylbiphenyl (5-CB) liquid crystal Langmuir-Reverse Schaefer (L-RSh) films by automated deposition, followed by the self-assembly embedding of colloidal AuNP (spheres) on the film surface via submerging in AuNP colloidal solution, formed the SERS substrate. Sample deposition was by spin-coating plasma over the substrate to get a uniform spread, and 4-Mercaptopyridine (4-Mpy) was used as the calibration standard. Potential fingerprint Raman bands from the SERS spectra were at 630, 725, 953, 1143, and 1145 1003 cm -1 that became intense with increasing glucose content; and branched chain amino acid (BCAA) bands at 910, 1259, and 1296 cm -1. An intense band at 1361 cm -1 (in pre-diabetic) shifted slightly to 1365 cm -1 (in diabetic samples) was attributed to glucose molecules, corroborated by glucose spiking. The analytical performance via PCA and LDA multivariate data analyses returned 100% accuracy for cross-validated grouping, and a 75.8% combined group accuracy, with an AUC of 1 (healthy/pre-diabetic); 0.983 (healthy and diabetic); and 0.868 (pre-diabetic/diabetic) sample groups. Indicating a potential use in blood glucose monitoring capable of discriminating normal, high (pre-diabetic), and extreme (diabetic) blood glucose levels in plasma [160]. A remarkable aspect here is the introduction of computer assisted film deposition provides a surface that enhances self-assembly monolayer formation with optimal hotspot densities, alongside dense AuNP clusters that reduce the elastic distortions by coalescing. Spin coating samples create a uniform spread of blood plasma on the surface, minimises both the coffee ring effect of colloidal methods and protein corona masking, given that more plasma components can interact with the enhanced field of the substrate.
Also utilising a solid support platform, a porous cellulose triacetate film with AgNP deposits formed the 3D SERS substrate used to differentiate bladder cancer (BC) and kidney cancer (KC) in blood plasma [49]. The cancer groups followed a similar pattern (increase or decrease of prominent bands) in their spectra, with 15 significant band at wavenumber 496, 524, 591, 640, 725, 813, 887, 1009, 1129, 1207, 1289, 1392, and 1447 cm-1 for the BC and KC samples. Bands attributed to increased free amino acids were L-arginine (496 cm 1), amido-VI (591 cm 1), L-tyrosine (640 cm 1), and L-serine (813 cm 1) in the cancer group. There was a relatively higher intensity at 722 cm-1 and 1129 cm-1 in the cancer groups compared to the healthy control (C) group, with KC being the most intense at that wavenumber. PCA-LDA multivariate analyses provided a discriminating accuracy of 81.8% for the combined KC, BC, and control groups, together with 80.9% sensitivity and 84.2% accuracy [49].
When handling infectious biofluids, it is necessary that the target microbial cells are unaffected by sample preparation methods, thus ensuring the SERS signals originates from the target cells rather than artefacts [9]. Present advances in fabrication technologies have resulted in more precise SERS substrate design and fabrication that enable custom SERS platforms to be developed for direct pathogenic microorganism detection. This was demonstrated using a proprietary polymer spinning technique in producing a two-layer polymer mat with predetermined nanoscale pores, and physical vapour deposition (VPD) to coat the mat with Au:Ag alloy NPs to form SERS substrates for the detection of Staphylococcus aureus (S. aureus), Pseudomonas aeruginosa (P. aeruginosa), and Salmonella Typhimurium (S. Typhimurium) in blood plasma [161]. Notably, the Au:Ag@polymer simultaneously served as a SERS substrate and a high throughput filter that can entrap microbial cells contained in biofluids, thereby bypassing the need for filters in sample pretreatment. SERS measurements in the three pathogenic plasma samples showed shared bands at 730, 782, 1034, 1100, 1330 and 1452 cm-1. Compared to the others, P. aeruginosa had very weak bands at 726 and 1330 cm-1 compared to the others, together with distinct low intensity bands at 850, 885, 1205 and 1306 cm-1 and a highly intense band at 675 cm-1. For S. Typhimurium, characteristic bands were at 650, 958, 1273 and 1376 cm-1. The intense band at 730 cm-1 was significant for S. aureus, with other distinct bands at 956, 1244, and 1403 cm-1. The reproducibility of the SERS signals using the reusable Au:Ag@polymer substrate gave a relative standard deviation (RSD) of 8% when calibrated to the intense band at 730 cm-1, and 12% for the weak band at 958 cm-1. There was a sharp distinction in the spectra profiles from pristine plasma and respective pathogen-containing plasma that enabled visual identification of respective pathogens without the need for advanced chemometrics. Also, the tuneability of the polymer mat pore dimensions hold promise in fabricating custom SERS substrates with both filtering and reproducible signal enhancement capacity [161].
For indirect/labelled single analyte SERS configurations, the sandwich immunoassay is among the most prevalent format, employing biorecognition elements to form nanotags with enhanced SERS signals, improved analyte selectivity and multiplex capability [57]. A practical demonstration of SERS immunoassay tested for vascular endothelial growth factor (VEGF) and its receptors as shown in Figure 8, which are important protein biomarkers upregulated in tumour-associated angiogenesis for several types of cancers [162]. Using malachite green isothiocyanate (MGITC) as Raman reporter, AuNP (nanostars) as substrate core, and a silica (SiO2) shell, an AuNP @MGITC@SiO2 SERS substrate was synthesised and subsequently functionalised with VEGF165 biotinylated polyclonal antibody to form the liquid AuNP@MGITC@SiO2 colloidal SERS detection probe (Figure 8a). Nanolithography was used in fabricating a separate gold triangle nanoarray chip functionalised with VEGF monoclonal antibody to form the SERS capture chip, thus completing the SERS immunosensor (Figure 8b). During detection, the capture chip is incubated with blood plasma to bind available VEGF protein (contains two binding sites), and after rinsing, is immersed into the colloidal detection probe. An antigen-antibody binding event triggered by VEGF in human plasma samples binding to both the capture and detection antibodies connects the two parts of the SERS sensor together in a sandwich form (Figure 8c). The multiple hotspots and field enhancement resulting from linking the star tips (for stars) and triangular geometries of the Au components of the capture and detection probes generated a three-dimensional (3D) plasmonic field under light excitation. This led to SERS signal amplification by the embedded Raman reporter in the detection probe, enabling the detection of VEGF in clinical plasma samples (breast cancer). The fitted SERS band at 1578 cm-1 allowed quantitation within pg/mL range. The sensitivity of this detection strategy was comparable to tests from standard ELISA, but with shorter detection time [162].
Also following the SERS immunoassay approach, a sandwich immunosensor comprised of a 4-sulfanylbenzonitrile (4MBN) Raman reporter layer on an AuNP core, with CEA functionalised AgNP shell (Au@4MBN@Ag NP-Ab) as detection probe, and 4-mercaptophenylboronic acid (4-MPBA)-labelled two-dimensional (2D) substrate as capture probe was developed for the detection of carcinoembryonic antigen (CEA), a 200 kDa glycoprotein upregulated in cancers. The Raman band at 999 cm-1 for 4-MPBA was used in signal calibration, with a noticeable higher intensity at the 2226 cm-1 band relative to increasing CEA concentration. A linear range of 10-9–10-11 M in plasma was obtained, and a stable and intense reporter signal was maintained for CEA even when five other proteins were introduced, supporting high specificity [12].
A different format of SERS immunoassay was followed to account for other metabolite biomarkers in addition to amyloid β (1–42) peptides, implicated in the progression of Alzheimer’s disease (AD) [18]. For a comprehensive diagnostic evaluation, five intricately designed and fabricated group of SERS substrates using four layers of 3D gold nanowires (AuNW), solvent-assisted nanotransfer printing and ligand coupling to form one SERS substrate conjugated to 6E10 monoclonal antibody, and four separate self-assembled monolayers (SAMs) substrates with distinct functional groups (PMMA, methyl group, carboxylic acid group, and amine group) for the detection of amyloid β (1–42) peptide and other blood metabolites relevant to Alzheimer’s disease (AD). For detection, the respective 6E10 substrate were immersed in healthy and AD blood plasma samples, and SERS measurements taken afterwards. Metabolites extracted from healthy and AD plasma samples using a methanolic solvent mixture were drop casted on the other functionalised substrates with SERS measurements also taken. Significant metabolite Raman bands at 1157 cm-1 (attributed to N-acetylneuraminic acid (NeuAc)) in the carboxylic acid and amine group surfaces, and 1607 cm-1 (uric acid/tryptophan) for the amine functionalised substrate, indicated upregulation of metabolites with those wavenumbers in AD. Spectra data analyses were optimised using Deep learning (fully connected neural network) and integrated gradients (IG) method, which is an explainable AI technique that shows the respective contribution of each input feature in the final classification result. Classification accuracy was lowest (72.5%) for the methyl group substrate, and highest (99.5%) for the amine group substrate. While the 6E10 substrate had 87.5% accuracy for discriminating between healthy and AD blood samples [18].
A sandwich immunoassay SERS utilising a microfluidic system was demonstrated for the multiplex detection of three interleukins (IL-6, IL-8, and IL-18) using custom SERS probes (Figure 9, Top). Two design configurations of the microfluidic device; one designed with three separate compartments containing Ag-Au respectively functionalised with anti-IL6, anti-IL8, and anti-IL18 antibodies formed the Ag@Au@Ab capture probe (Figure 9, Top C). And the other designed with a single compartment containing Ag-Au capture probe functionalised with the three anti-interleukin antibodies (Ag@Au@3Ab) together (Figure 9, Top D), enabled either a parallel, or a simultaneous target biomarkers detection. Colloidal AuNP spheres labelled with different Raman reporter molecules: 5,5′-dithio-bis(2-nitro-benzoic acid) (DTNB), fuchsin (FC), and p-mercatpobenzoic acid (p-MBA) and with specific antibodies formed the respective detection probes: AuNP@DTNB@Anti-IL18, AuNP@FC@IL6, and AuNP@pMBA@IL8. The sequential introduction (at different injection rates) of buffer, plasma samples, and detection probe into the microfluidic device was followed by SERS measurements, detailed in Figure 9 (Middle, Bottom A). PCA spectra analyses and calibration for DTNB at 1326 cm−1, p-MBA at 1078 cm−1, and FC at 1176 cm−1 quantified the detection of interleukins IL-6, IL-8, and IL-18 at an estimated LOD of 2.3 pg·ml−1, 6.5 pg·ml−1, and 4.12 pg·ml−1 respectively for the parallel configuration, and 3.8 pg·ml−1 (IL-6), 7.5 pg·ml−1 (IL-8), and 5.2 pg·ml−1 (IL-18) for the simultaneous format [77].
In addition to optimising experimental workflow, the use of internal standards can increase the accuracy of chemometrics applied to SERS data processing for enhanced analytical and clinical performance. This was demonstrated when a 4-mercaptophenol (4-MP) Raman reporter and AgNPs (spheres) deposited on a bacteria cellulose membrane (BC) to form the BC@4-MP@Ag NPs SERS substrate was fabricated alongside a separate AgNP on BC support (BC@AgNP) substrate for SERS detection of colorectal cancer (CRC) in healthy and CRC blood plasma samples, within an hour sample incubation time [163]. Four machine learning (ML) algorithms: Decision Trees (DT), Random Forests (RF), k-Nearest Neighbours (KNN), and Support Vector Machines (SVM) were utilised for statistical model training to evaluate generated Raman and SERS spectra. The introduction of 4-mercaptopyridine (4-MP) as an internal standard for spectral calibration enhanced classification accuracy of the ML algorithms. The SERS performance of the BC@AgNPs substrate and BC@4MP@AgNPs substrate were evaluated, with calibration correlated with the 1079 cm-1 band of the internal standard. This was in addition to assessment for batch-to-batch reproducibility and storage stability. The BC@AgNPs substrate identified seven relevant bands (478, 560, 633, 720, 783, 838, and 1520 cm-1) which varied with the calibrated spectra of the BC@4MP@AgNPs substrate, where band shifts (630 to 633 cm-1), enhanced resolution of lipid-associated vibrations (1126, 1208, and 1626 cm-1), and a band from the internal standard at 1079 cm-1. The ML accuracy of the BC@AgNPs substrate was DT (83.75%), KNN (95%), RF (100%), The ML accuracy of the BC@AgNPs substrate was DT (83.75%), KNN (95%), RF (100%), and SVM (98.75%). With the ML algorithm discrimination accuracy increased for the BC@4-MP@AgNPs substrate after spectral calibration for DT (86.25%), KNN (97.5%), RF (98.75%), and 100% for SVM. Similarly, the predictive accuracies showed a change in AUC values after calibration for: DT (0.84), RF (1.00), KNN (0.99), and SVM (0.99) to higher AUC values of 0.93 (DT), 1.00 (RF), 1.00 (KNN), and 1.00 (SVM) [163]. Interestingly, the bands at 633 cm-1 (attributed to tyrosine), 720 cm-1 (attributed to hypoxanthine/adenine; 725 cm-1 (Coenzyme A), 1003 cm-1 (phenylalanine aromatic ring stretching), and 1126 cm-1 (attributed to lipid C—C skeletal vibrations/ D-Mannose) were also identified in the blood plasma SERS spectra of colorectal and adenomatous polyps patients using only colloidal AgNP [81]. Although there was an observed shift at 892 (902 cm-1) and at 1368 (1349 cm-1) for CRC samples [81]. The insights on the impact of internal standards on SERS measurements and data interpretation are valuable, requiring further validation using a larger test sample population.
5.2. Multi-Mode Single/Multiplex Analyte Detection
Integrating SERS with other optical, electrical, or magnetic signal transduction platforms in a dual-mode, triple-, or multi-mode configuration minimises the inherent limitations of the respective individual methods [29]. Cross-validation of the results becomes possible, together with the reduction in the rates of false-negative and false-positive interpretations, which are significant barriers affecting single mode detection strategies [68]. The exploration of these multimodal strategies in disease diagnostics has seen dual-mode formats such as SERS-Electrochemical sensors [164,165]; SERS-LSPR [166]; SERS-QCM [167]; SERS-Colourimetry [168,169], SERS-Fluorescence [170,171,172], and many other multimodal variations [173,174,175].
To elaborate, the photothermal (thermoplasmonic) biosensing principle relies on LSPR, whereby localised heat is induced when laser photons interact with anisotropic NPs, resulting in optical detection or conversion into a visual readout that quantitatively correlates with the target metric [176]. Hence, Campu et al., proposed a microfluidic plasmonic sensing for real-time detection of an acute myocardial infarction (AMI) biomarker–cardiac troponin I (cTnI) in plasma exploiting LSPR, SERS, and thermoplasmonic effects [84]. Specifically, a plasmonic nanoplatform based on immobilized gold nanobipyramids was fabricated, exhibiting optical and thermoplasmonic properties that promote, based on a sandwich-like immunoassay, multimodal detection of cTnI via LSPR, SERS and thermoplasmonic effects under simulated conditions. Colloidal AuNP (bipyramid) deposited on glass slides formed the AuNP substrate, which was then bonded to a microfluidic frame, and afterwards functionalised with p-ATP Raman reporter molecules and anti-cTnI on its surface to complete the sensor assembly. The plasma samples with cTnI levels already verified via an immunoassay was injected into the microfluidic platform and the associated antibody-antigen event detected (25 nm redshift) by LSPR monitoring. Furthermore, a second detection using SERS of anti-cTnI–cTnI interaction via changing band intensities at 1004 and 1030 cm-1 was used to verify LSPR measurements. Finally, the change in heat profiles (after laser exposure) during the immunological reaction was extracted from thermographic images. There was no correlation between the simulated performance and the clinical performance for plasma samples with high cTnI levels for the thermoplasmonic technique, although the combined performance was reported to be 75% sensitivity and 25% specificity [84].
The detection of different Alzheimer’s (AD) biomarkers (free Aβ peptides, free tau proteins, and associated exosomes etc.) can be optimised through their isolation and purification in blood plasma to prevent interference from other plasma constituents. The Hao Nanjing team demonstrated multimodal detection (electrochemistry and SERS) coupled to acoustics and microfluidics for the isolation and detection of AD biomarkers in blood plasma [89]. The two-part platform used an Au electrode platform fabricated via photolithography and e-beam evaporation, with a sequential two-step zinc oxide (ZnO) nanoarray patterning on the working electrode, followed by in-situ deposition of AgNP on the ZnO nanorod arrays to form a SERS-active platform. Surface acoustic waves (SAW) enabled size-dependent sample separation in different modules (upstream and downstream) of the separation chip, with cut-off sizes adjusted by modulating the applied voltage of the interdigital transducers (IDT). For SERS measurements, plasma samples from the healthy (HC), or AD groups were separately delivered into the microchamber with a short incubation time (< 20 min), followed by SERS measurement before and after separation, and attendant spectral interpretation using PCA-LDA statistical methods. Significant Raman bands at 417, 999, 1150, 1250, and 1290 cm-1 attributed to metabolites implicated in neurodegenerative pathologies was different between HC and AD SERS spectra, with difference in the 600–700 cm-1 region suggesting possibly reduced levels of Aβ in the AD group. For electrochemical detection, biotinylated antibodies specific to AD biomarkers (anti-Aβ42 and anti-tau) were immobilised on pristine ZnO nanorod arrays via ligand coupling. Cyclic voltammetry (CV) and differential pulse voltammetry (DPV) techniques were used to monitor the peak current change in the presence of [Fe(CN)6 ]3-/4- when purified plasma samples (HC and AD) were introduced. The concentration of Aβ42 in HC samples was about 3.2 times higher than in AD samples, while the concentration of tau protein in HC plasma samples was 2.4 times lower than those in AD samples. The electrochemical sensing achieved a 90.0% sensitivity and 85.7% specificity for Aβ42, and a 71.4% sensitivity and 70.0% specificity for tau biomarkers, with an AUC of 0.97 and 0.84 respectively [89].
Also adopting multimodal colorimetry-SERS immunoassay, a paper-based lateral flow strip (PLFS) was developed to detect neuron-specific enolase (NSE), an important biomarker for traumatic brain injury (TBI). A detection probe solution comprising of an AuNP (nanostar) core, a Raman reporter molecule, and 2 nm silica shell, functionalised with detection antibodies (AuNP@Reporter@SiO2@Ab) was synthesised and adsorbed on the conjugate pad of the PLFS. Also, adsorbed capture and secondary antibodies formed respective test and control lines on the nitrocellulose membrane (NC membrane) of the PLFS, with the pads (sample, conjugate, and absorbent) and NC membrane finally assembled in a cassette to complete the PLFS test kit. Droplets of plasma samples (containing 20% PBS) introduced at the sample pad flows by capillary action to the conjugate pad where the adsorbed probe forms a complex with NSE in the plasma. The detection antibody—NSE complex forms a sandwich with the capture antibody first at the test line, and excess Detection—NSE-Capture Ab complex flows onward to react with the secondary antibody at the control line, forming two distinct bands at both line for a positive detection. The presence of two grey lines at both the test and control bands provides positive colorimetric confirmation of NSE in the test sample. SERS measurements of the test line region with spectral bands at 1076 cm-1 was used in calibration to calculate a detection range of 1.0–75.0 ng mL-1 and a LOD of 0.86 ng mL-1 for NSE levels. Comparable with results from ELISA for same samples [177].
The SERS Assay configurations herein highlighted, in addition to others included in Table 1, exemplify the different approaches researchers are exploring to reduce the confounding effects from variability in substrates, biological matrices and data interpretation. Several methods in Table 1 demonstrated the use of spherical NPs with/without support matrix for small molecules detection [20,30]; anisotropic NPs [17,84]; and a variety of support matrices, Raman reporters and sample size for direct and indirect SERS assays. Each process presents interesting insights, performance, and possible directions where optimisation is required, and where further investigation could be impactful in improving method reliability and result reproducibility.
6. Data Analysis Strategies on SERS
Data analysis represents a critical step in SERS-based diagnostics, as it enables the extraction of meaningful and biochemically relevant information from complex spectral datasets [180]. In the context of plasma analysis, this task becomes particularly challenging due to the intrinsic variability of plasma composition, coupled with the heterogeneity and limited reproducibility of SERS signals [163,181]. The consequence of these factors is the generation of high-dimensional and noisy datasets, in which subtle disease-related spectral differences may become obscured [163].
Consequently, robust and well-structured computational pipelines—encompassing spectral preprocessing, feature extraction, and advanced statistical or machine learning methods—are essential not only to ensure reliable interpretation, but also to enhance class separation and enable accurate and clinically meaningful classification of SERS data [182,183,184,185,186]. In Figure 10, an AI-driven data analysis methodology is represented, the various steps of the data analysis pipeline being illustrated. Collected input data is split into training and test data, to enable the training of the model with a subset of the available data. The validation and evaluation of the methodology is done using a subset of test data. The first step is the identification of key features that describe the input data. A pre-processing pipeline is then defined to improve the data quality, as described in Section 6.1. Due to the large complexity of input data, a reduction of dimensionality is then applied, as described in Section 6.2. Finally, a machine learning classifier is used to as described in Section 6.3. The selection of adequate features, specific processing pipelines, dimensionality reduction mechanisms and machine learning classifiers, is a highly complex data science research task, existing a very large number of options and possible combinations that must be validated. The state of SERS spectral interpretation is described in the following sections.
6.1. Spectral Preprocessing: Ensuring Data Quality for Downstream Analysis
Spectral preprocessing is a critical step in SERS data analysis, as it aims to remove artefacts, reduce noise, and standardise spectral intensity, enabling reliable comparison between samples and improving the performance of downstream analytical models [180,187,188]. Generally, SERS spectra interpretation using advance chemometrics (AI, ML, DL, and other related algorithms) follow the sequence captured in Figure 10, progressing from data preprocessing, through processing and result output. At the preprocessing stage, typical preprocessing pipelines include cosmic ray removal, smoothing or noise reduction, baseline correction to eliminate fluorescence background, and spectral normalisation to account for intensity variability [55,189]. However, the effectiveness of these steps is highly dependent on both the characteristics of the dataset and the choice of analytical method. While appropriate preprocessing can enhance signal quality and facilitate pattern recognition, excessive or poorly selected processing may lead to information loss or the introduction of artefacts, resulting in a lower diagnosis accuracy [190]. Furthermore, certain deep learning approaches have demonstrated increased robustness to noise and baseline variability, allowing them to operate effectively on minimally processed spectra [190,191,192]. Consequently, preprocessing strategies should be carefully optimised and validated rather than applied as a fixed protocol [187].
6.1.1. Typical Pre-processing Pipelines
Cosmic ray removal, smoothing, baseline correction, and spectral normalisation constitute the typical preprocessing pipeline applied to SERS data [189,193,194]. These steps are generally performed in a sequential manner, although smoothing and baseline correction may be interchanged depending on the noise level and characteristics of the spectra [55,187,195]. Cosmic ray removal, also referred to as spike removal, is typically implemented as the first preprocessing step following data acquisition [183,194]. This is due to the distinctive nature of cosmic ray artefacts, which appear as sharp, narrow peaks with abnormally high intensity and can distort spectral profiles, interfere with peak assignment, and bias multivariate statistical analyses [55,196,197]. Their well-defined spectral signature facilitates reliable detection and removal prior to the application of other preprocessing methods, which might otherwise alter their morphology and hinder accurate identification [196].
Following cosmic ray removal, smoothing and baseline correction are typically applied to further improve spectral quality [189,193,194]. The order of these steps may vary depending on the noise characteristics of the data. In cases of high noise levels, smoothing is often applied prior to baseline correction to stabilise baseline estimation and reduce the influence of high-frequency noise [55,194]. Common smoothing approaches include Savitsky–Golay filtering, which preserves peak shape while reducing noise, Whitaker smoothing, which provides robust penalised least squares-based denoising, and wavelet transform-based denoising, where spectral signals are decomposed, and noise is suppressed through coefficient thresholding [17,193,198].
In opposition, when the signal-to-noise ratio is relatively higher or when robust baseline algorithms are employed, baseline correction may be performed before smoothing [163]. Widely used baseline correction methods include polynomial fitting approaches, such as detrending and modified polynomial fitting, as well as more advanced techniques like asymmetric least squares (AsLS) and adaptive iteratively reweighted penalised least squares (airPLS), which incorporate regularisation strategies to effectively remove background contributions while preserving relevant spectral features [182,193,199]. Improper selection of these methods may lead to distortion of spectral features, directly impacting downstream multivariate analysis [187]. Consequently, the choice and sequence of these preprocessing steps should be adapted to the specific characteristics of the dataset, and their suitability should be determined through systematic evaluation and validation of their impact on downstream analysis.
Normalisation is a critical preprocessing step in spectral analysis, aimed at reducing intensity variability and enabling consistent comparability between spectra acquired under different experimental conditions or instrumentation [186,187]. It primarily addresses unwanted variations arising from factors such as laser power fluctuations, focus instability, and differences in sample concentration, while also improving the numerical stability of downstream data analysis [186]. This is particularly important in SERS applications, where signal variability can be exacerbated by factors such as heterogeneous enhancement and limitations in autofocus during spectral mapping.
6.1.2. Spectral Normalisation Strategies
A range of normalisation strategies has been developed to account for different sources of variability. Simple approaches such as min–max and maximum intensity normalisation rescale spectral intensities to a fixed range or relative scale, facilitating comparison across samples, although they remain sensitive to outlier peaks [182]. Unit vector (L2) normalisation projects each spectrum onto a unit hypersphere, ensuring uniform vector magnitude and emphasising spectral shape over absolute intensity [186]. Standard normal variate (SNV) normalisation further standardises spectra by centring and scaling each individual spectrum, effectively correcting for multiplicative scatter effects, with robust normal variate (RNV) providing an outlier-resistant alternative based on median statistics [187,193,200]. Area normalisation, which equalises the total spectral intensity, is particularly suitable for compensating variations in laser power or sample quantity [190]. In contrast, internal standard calibration—using a known reference molecule such as 4-mercaptopyridine (4-MP)—offers a more direct correction of SERS-specific variability by accounting for hotspot heterogeneity through a stable reference signal [163].
In the context of SERS-based diagnostics, the selection of an appropriate normalisation strategy should be guided by the dominant source of variability within the dataset. For instance, SNV or RNV are well suited for correcting scatter-related effects, area normalisation is effective in addressing power fluctuations, and internal standards provide robust correction for substrate-induced variability.
6.2. Dimensionality Reduction and Feature Extraction
Following spectral preprocessing, the resulting SERS spectra provide a more reliable representation of the underlying biochemical information. Nevertheless, even well-pre-processed spectra remain inherently high-dimensional, often comprising hundreds to thousands of correlated wavenumber variables, many of which may be redundant or of limited discriminative relevance [189,201]. Dimensionality reduction and feature extraction techniques are therefore applied not to compensate for poor data quality, but to systematically distil the most informative spectral features and construct compact representations suitable for downstream machine learning models [186,190,202].
Without such strategies, machine learning models trained on full spectral data face two compounding challenges: an excess of variables relative to available samples, which promotes overfitting, and the strong correlation between neighbouring wavenumbers, which introduces substantial redundancy into the feature space [17,55,198]. The following subsections address the principal methods employed to overcome these challenges, progressing from dimensionality reduction through feature extraction to model interpretability.
Linear and Nonlinear Dimensionality Reduction
Dimensionality reduction methods transform high-dimensional spectral data into a lower-dimensional representation while preserving the most analytically relevant structure within the dataset. In SERS-based diagnostics, these methods can be broadly categorised according to whether they operate independently of class labels (unsupervised methods) or incorporate label information to guide the reduction process (supervised methods [184,191,200]. [17]
Principal Component Analysis (PCA) is the most widely used unsupervised method for dimensionality reduction in spectroscopic analysis [189,203]. It transforms high-dimensional spectral data into a set of orthogonal principal components (PCs), ordered by the variance they explain, thereby reducing dimensionality while retaining the dominant sources of variation [202]. It is commonly employed as a feature extraction step prior to supervised classification methods such as Linear Discriminant Analysis (LDA) and Support Vector Machines (SVM) [180,185,204]. However, PCA is limited by its linear nature, which may hinder the identification of nonlinear spectral relationships, and by its sensitivity to irrelevant spectral regions, which can introduce non-informative variance into the reduced representation [163,205].
In addition to linear approaches, unsupervised nonlinear dimensionality reduction techniques such as t-distributed stochastic neighbour embedding (t-SNE) are increasingly used in SERS data analysis [181,206,207]. t-SNE is primarily employed as a visualisation and data quality assessment tool rather than as a feature extraction method for predictive modelling [186,206]. By projecting high-dimensional spectral data into a two- or three-dimensional embedding, it enables visual inspection of cluster structure and facilitates the identification of residual outliers not removed during preprocessing, effectively serving as a secondary validation step prior to model development [208]. However, t-SNE prioritises the preservation of local neighbourhood relationships and does not reliably maintain global inter-cluster distances, limiting its utility beyond exploratory analysis [209]. In terms of feature extraction and selection strategies, two approaches are available; the algorithm-driven feature selection such as PCA loadings and PLS latent variable; and the deep learning-driven extraction that includes CNN and autoencoders. Also, model interpretability and spectral attribution include VIP (Variable Importance in Projection), SHAP (Shapley Additive Explanations) and Grad-CAM (Gradient-weighted Class Activation Mapping)–this last one is usually related to CNNs.
6.3. Machine Learning for Diagnostic Classification
The methodological integration of SERS with Machine Learning (ML) have been discussed in early reviews. Ralbovsky and Lednev [210] highlighted the potential of combining Raman spectroscopy with machine learning for medical diagnostics across a broad range of diseases, establishing its feasibility as a general diagnostic framework. In parallel, Lussier et al. [180] demonstrated that classical linear approaches are often insufficient for capturing the complexity of SERS datasets, while nonlinear machine learning models, including neural networks and deep learning architectures, provide improved capacity for spectral feature extraction and classification. While these foundational studies established the feasibility of machine learning-assisted Raman and SERS diagnostics, more recent work has focused on improving model performance and addressing persistent challenges related to data complexity variability, and reproducibility [180,182].
This section focuses on machine learning approaches for SERS-based diagnostic classification, with emphasis on recent studies reported in the last few years. While foundational reviews established the feasibility of AI-driven spectroscopy up to 2020, advances in computational architectures and learning strategies have significantly expanded the field. Accordingly, this review considers exclusively high-impact literature published since 2023 to capture the current state of the art, focusing on emerging trends in SERS classification models, including deep learning architectures, resampling strategies for imbalanced datasets, and explainable AI methods, alongside persistent challenges related to dataset limitations and clinical translation.
6.3.1. Classical Supervised Classifiers and Statistical Discriminants
Traditional supervised machine learning algorithms and statistical discriminants form a foundational benchmark across the reviewed cohort due to their efficiency when applied to tabularized spectral features. Within this framework, models are primarily used to establish robust, hyper-dimensional decision boundaries for binary and multi-class clinical diagnostic partitions.
Support Vector Machines
Support Vector Machines (SVMs) are supervised learning algorithms that construct optimal separating hyperplanes by maximising the margin between classes defined by support vectors [211]. In SERS-based diagnostic classification, nonlinear separability is commonly addressed through kernel functions, particularly Gaussian or radial basis function (RBF) kernels, which enable classification in higher-dimensional feature spaces [212,213,214]. The suitability of SVMs for SERS analysis is largely associated with their strong generalisation performance in high-dimensional datasets and robustness under limited sample sizes [212,213,214]. Across the recent literature cohort, SVMs remain among the most widely applied classifiers for SERS-based diagnostics. Recent studies have employed SVM models for sepsis stage stratification [215], rapid detection of drugs in blood under complex circulatory backgrounds [216], detecting large-scale pan-cancer panels using massive validation cohorts [217], and differentiating chronic autoimmune disorders from healthy matrices [49,218].
Linear and Quadratic Discriminant Analysis (LDA/QDA)
Linear Discriminant Analysis (LDA) and Quadratic Discriminant Analysis (QDA) are supervised classification methods that construct decision boundaries to separate classes in multivariate datasets. LDA maximizes the ratio of between-class variance to within-class variance under the assumption that all classes share the same covariance matrix, resulting in linear decision boundaries [219]. QDA relaxes this assumption by allowing class-specific covariance structures, producing quadratic decision boundaries that can better model heterogeneous class distributions [220]. Because spectral datasets typically contain substantially more variables than samples, LDA and QDA are commonly combined with dimensionality reduction techniques such as PCA, yielding workflows such as PCA-LDA and PCA-QDA [210].
In SERS-based diagnostics, LDA/QDA approaches remain widely used due to their interpretability, computational efficiency, and suitability for moderate-sized spectral datasets, including classification of allograft kidney transplant rejection [221], identification of urinary disease biomarkers [222], profiling of circulating plasma cell malignancies [223], characterisation of plasma extracellular vesicles [224], and serum fingerprint analysis for disease discrimination [49,225]. Although LDA-based models remain effective baseline classifiers in SERS diagnostics, their performance may become limited in highly heterogeneous datasets or under complex nonlinear class distributions, where more flexible machine learning approaches can provide improved discrimination performance [210].
Partial Least Squares Discriminant Analysis (PLS-DA)
Partial Least Squares Discriminant Analysis (PLS-DA) is a supervised multivariate classification method that combines partial least squares regression with discriminant analysis to separate predefined sample classes based on high-dimensional feature sets [226,227]. In PLS-DA, latent variables are extracted to maximize both the variance explained in the predictor matrix and the covariance between predictor variables and class membership labels [21]. Due to its ability to handle highly collinear and high-dimensional datasets, PLS-DA is widely applied in spectroscopic and chemometric analysis of SERS data [226,228].
In SERS-based diagnostics, PLS-DA is particularly suitable for analysing complex spectral profiles containing large numbers of correlated variables, where conventional linear classifiers may become unstable [226,228]. The method also provides biochemical interpretability through latent-variable loadings and variable importance metrics, enabling identification of spectral regions contributing to class discrimination [227,229]. Because SERS datasets frequently contain substantial spectral variability and multicollinearity, PLS-DA and related variants are commonly used following spectral preprocessing and dimensionality reduction workflows [228].
More recent studies have continued to apply PLS-DA-based approaches for classification of complex SERS diagnostic datasets. PLS-DA and PC-PLS-DA variants have been employed for tracking multiplexed exosome populations [230] and identifying respiratory disease markers from SERS spectral profiles. These studies further support the utility of PLS-DA as a robust regression-discriminant framework for classification of multi-component SERS spectra with inherent collinearity. Despite its effectiveness, PLS-DA remains susceptible to overfitting in high-dimensional datasets with limited sample sizes, requiring rigorous validation strategies and careful handling of nested spectral structures during model development [226,228].
6.3.2. Tree-Based Ensemble Frameworks and Automated ML (AutoML)
Tree-based ensemble methods constitute an important class of supervised machine learning approaches in SERS-based diagnostics due to their ability to model nonlinear relationships in high-dimensional spectral datasets [210,231]. These methods combine multiple decision trees to improve predictive robustness, reduce overfitting through ensemble averaging, and provide variable importance measures that facilitate interpretation of diagnostically relevant spectral regions [26]. Among the most commonly used frameworks are Random Forests (RF), gradient boosting architectures, and more recent Automated Machine Learning (AutoML) systems.
Random Forests (RF) are ensemble models constructed from multiple decision trees generated using bootstrap sampling and randomized feature selection during node splitting [26]. Their ability to handle high-dimensional spectral variables without extensive feature engineering has made them suitable for SERS analysis [26]. Recent studies have applied RF-based approaches for identification of colon malignancies [232] and optimization of complex internal calibration models for SERS quantification workflows [233]. Gradient boosting methods iteratively construct ensembles of weak learners, where each subsequent tree minimizes the errors of preceding models [26]. Among these approaches, eXtreme Gradient Boosting (XGBoost) has gained prominence due to its computational efficiency and strong predictive performance [234,235]. Recent applications in SERS diagnostics have employed XGBoost architectures to develop highly accurate classification frameworks across broad concentration ranges in targeted immunoassays [236].
More recently, Automated Machine Learning (AutoML) frameworks have emerged as a strategy to automate model selection, hyperparameter optimization, and ensemble construction within SERS diagnostic pipelines [15]. AutoML systems such as AutoGluon integrate multiple machine learning architectures, including Random Forests, boosting frameworks, and regularized regression models, into stacked ensemble structures optimized automatically for a given dataset. Recent studies have applied AutoGluon-based frameworks for automated clinical staging and cancer subtype classification from SERS spectra [237], illustrating the growing transition from manually optimized pipelines toward fully automated ensemble-learning strategies in SERS-based diagnostics.
6.3.3. Deep Neural Networks and Advanced Convolutional Topologies
Deep neural networks (DNNs) are computational architectures composed of multiple interconnected layers capable of learning hierarchical feature representations directly from raw input data [238,239]. In SERS-based diagnostics, deep learning approaches have gained prominence due to their ability to automatically extract discriminative spectral features without extensive manual feature engineering [238,240]. Among these methods, Convolutional Neural Networks (CNNs) represent the most widely adopted architectures for spectral classification tasks. CNNs employ convolutional kernels to identify local spectral patterns through sequential convolutional, pooling, and fully connected layers [239,240]. More advanced convolutional topologies, including Residual Networks (ResNet), Fully Convolutional Networks (FCN), and multiscale convolutional architectures, have further extended the capacity of deep learning models to analyse complex spectral datasets [238]
One-dimensional convolutional neural networks (1D-CNNs) remain central to recent SERS classification workflows, operating directly on spectral vectors to capture local vibrational features. Recent studies have implemented custom 1D-CNN architectures composed of sequential convolutional blocks incorporating Batch Normalization, ReLU or LeakyReLU activation layers, max-pooling operations, and fully connected layers with Dropout regularization to improve classification robustness [241]. More recently, two-dimensional convolutional strategies have emerged through structural conversion of spectral vectors into 2D matrix representations prior to CNN processing. These 2D-CNN pipelines employ multi-filter convolutional architectures and SoftMax-based classification layers for clinical discrimination tasks. Such approaches extend earlier demonstrations that matrix restructuring of spectral data can improve CNN classification performance by enabling extraction of spatially correlated spectral features [33].
Advanced residual and pre-trained neural architectures have also become increasingly prominent in SERS diagnostics. Residual Networks (ResNet and ResNet18), originally developed to mitigate vanishing-gradient effects in deep architectures through skip connections [242], have recently been adapted for tracing exosome signatures and thyroid cancer staging from SERS spectra [243,244]. In parallel, pre-trained visual recognition backbones including AlexNet, VGGNet, GoogLeNet, SqueezeNet, and DenseNet, together with recurrent neural networks (RNNs) and temporal convolutional networks (TCNs), have been integrated into custom multiscale fusion convolutional neural networks (MCNNs) to capture localized vibrational variations in spectral data [182]. Beyond convolutional approaches, recent studies have also implemented deep multilayer perceptron (MLP) architectures for ultrasensitive blood-based target tracking from SERS measurements [245]. These frameworks employ optimization strategies such as Rectified Adam (RAdam) and weighted cross-entropy loss functions to stabilize gradient updates during training.
Compared with traditional machine learning methods, deep learning frameworks offer end-to-end learning capabilities, scalability to increasingly large spectral datasets, and improved performance in complex multi-class classification settings [238,239,240,242]. However, these architectures generally require substantially larger annotated datasets and careful validation to ensure generalization across heterogeneous SERS platforms and clinical cohorts [240].
6.3.4. Resampling Architectures and Data Augmentation
A major challenge in translating Surface-Enhanced Raman Spectroscopy (SERS) into clinically robust diagnostic systems is the intrinsic imbalance and limited size of biomedical spectral datasets, where large healthy cohorts are frequently contrasted against comparatively sparse pathological populations [219,246]. These asymmetries can substantially bias machine learning classifiers, particularly in high-dimensional spectral settings, motivating the development of dedicated resampling architectures, synthetic sample generation strategies, and hybrid augmentation frameworks [247].
Synthetic oversampling methods are among the most widely adopted approaches for mitigating class imbalance in spectroscopic datasets. The Synthetic Minority Oversampling Technique (SMOTE) generates artificial minority-class samples through interpolation between neighbouring minority observations, thereby balancing the class distribution without direct duplication [248]. Variants such as ADASYN (Adaptive Synthetic Sampling) further refine this concept by adaptively generating more synthetic samples in regions where minority examples are harder to learn, effectively shifting the decision boundary toward difficult cases [248]. More recent biomedical SERS studies also report the use of BorderlineSMOTE to preferentially generate synthetic samples near class boundaries, where diagnostic ambiguity is greatest.
To address the introduction of noisy or overlapping synthetic samples, hybrid resampling-cleaning strategies have become increasingly important. Methods such as SMOTEENN combine SMOTE with Edited Nearest Neighbours (ENN), removing samples whose neighbourhood structure suggests class inconsistency, whereas SMOTETomek integrates SMOTE with Tomek link removal to eliminate overlapping majority-minority sample pairs [249,250]. Recent studies have further integrated these hybrid resampling architectures with outlier-detection frameworks such as PCA-DBSCAN to improve algorithmic fairness and reduce minority-class omission during large-scale pan-cancer screening workflows [251]. Beyond classical oversampling, data augmentation techniques specifically designed for Raman and SERS spectra have become increasingly relevant for deep learning applications. Di Frischia et al., [252] proposed a hierarchical augmentation pipeline incorporating additive Gaussian noise, baseline correction variants, smoothing filters, clustering-based balancing, spectral shifting, and Generative Adversarial Networks (GANs) for synthetic Raman spectrum generation. CNN classifiers trained on GAN-augmented datasets achieved improved classification performance relative to non-augmented training schemes [252]. Similarly, Weng et al. [238] demonstrated that reshaping one-dimensional SERS spectra into two-dimensional matrices substantially improved CNN performance for both classification and quantitative prediction tasks, while simple spectral intensity perturbations also enhanced model robustness [238].
These augmentation and resampling approaches are particularly important in SERS-based medical diagnostics, where spectral heterogeneity, hotspot variability, and limited patient availability can compromise generalization performance. Contemporary studies therefore increasingly rely on integrated resampling pipelines combining synthetic generation, boundary cleaning, and deep learning-oriented augmentation to stabilize classification models and improve minority-class sensitivity in clinically imbalanced datasets.
6.3.5. Evaluation Metrics, Cross-Validation, and Generalisability
The performance of Surface-Enhanced Raman Spectroscopy (SERS)-based diagnostic models must be rigorously evaluated to ensure reproducibility, robustness, and clinical applicability. In SERS studies, classification performance is commonly assessed through confusion-matrix-derived metrics, including accuracy, sensitivity, specificity, precision, and F1-score [253]. Sensitivity measures the ability of a model to correctly identify diseased samples, whereas specificity quantifies the correct identification of healthy samples [253]. Because SERS datasets are frequently imbalanced, balanced accuracy is often preferred over overall accuracy, as it equally weights performance across classes [254]. Precision and F1-score further evaluate the trade-off between false positives and false negatives, particularly in uneven class distributions [253].
Receiver Operating Characteristic (ROC) curves and the corresponding Area Under the Curve (AUC) are also widely employed to evaluate discriminative capability across multiple classification thresholds [210,254]. These metrics are particularly important in diagnostic applications because they quantify the trade-off between sensitivity and specificity and allow comparison between different classification models [253]. Recent SERS studies continue to employ standardized metrological evaluation schemes. Contemporary diagnostic models are commonly assessed using Overall Accuracy, Balanced Accuracy, Sensitivity (Recall), Specificity, Precision, F1-Score, and Classification Success Rate (CSR) in both targeted assays and broad screening applications [255,256]. In addition, ROC curves and AUC calculations are consistently reported to quantify true-positive versus false-positive trade-offs across varying decision thresholds.
Robust validation strategies are essential to prevent overfitting and to ensure that SERS classification models generalize to unseen data [228,257]. Common approaches include k-fold cross-validation, Leave-One-Out Cross-Validation (LOOCV), and Repeated Double Cross-Validation (RDCV) [254,258]. In k-fold cross-validation, the dataset is partitioned into k subsets, with iterative training and testing performed across folds [54]. RDCV extends this concept through nested validation loops that separate model optimization from performance assessment, thereby reducing the risk of information leakage and overestimation [254]. Guo et al., [257] highlighted critical methodological pitfalls in spectroscopic model validation. First, splitting datasets at the spectrum level rather than at the biological replicate or patient level can produce artificially inflated accuracies because spectra from the same sample are not independent. Second, dimensionality reduction methods such as PCA or PLS must be performed inside the cross-validation loop to avoid leakage of information from validation data into the model [257]. These recommendations are particularly relevant for SERS datasets, which often contain hierarchical replicate structures and high-dimensional spectral variables [23] .
Recent studies increasingly avoid simple train/test splits and instead implement more rigorous validation protocols to ensure generalisability. Current approaches predominantly employ 5-fold cross-validation schemes or independent geographically isolated clinical verification cohorts for external validation. Such strategies improve the reliability of reported diagnostic performance and better reflect real-world deployment conditions. Additional validation procedures such as permutation testing are also used to assess whether classification performance exceeds chance expectations [54]. By repeatedly randomizing class labels and rebuilding models, permutation testing generates null distributions for performance metrics, allowing statistical significance to be quantified [54]. Because SERS spectra are highly sensitive to substrate variability, hotspot distribution, environmental conditions, and preprocessing choices [23], rigorous validation and transparent reporting remain fundamental requirements for clinically reliable SERS-based diagnostic systems.
6.3.6. Explainable AI (XAI) and Model Interpretability Modalities
Deep learning models applied to Surface-Enhanced Raman Spectroscopy (SERS) achieve strong diagnostic performance but are often described as “black-box” systems, where the internal reasoning behind predictions is not directly interpretable [180]. Explainable AI (XAI) addresses this limitation by providing methods that reveal how models reach their decisions, improving transparency, trust, and clinical reliability. In SERS-based diagnosis, these methods are particularly important because they allow model outputs to be linked back to physically meaningful spectral signatures.
Gradient-Based Visualization Methods
Contemporary SERS diagnostic frameworks routinely incorporate gradient-based interpretability techniques, including Class Activation Mapping (CAM), Grad-CAM (Gradient-weighted Class Activation Mapping), and Integrated Gradients (IG). These approaches generate contribution maps that identify which input regions or spectral features are most influential for a given prediction [251,259].
From a foundational perspective, CAM produces class-specific activation maps by using feature representations from the final convolutional layers of a CNN [260]. However, CAM heatmaps are often low-resolution due to the coarse spatial structure of deep feature maps. Grad-CAM extends this idea by using gradients of the target class with respect to feature maps, enabling class-discriminative localization without modifying the network architecture [261]. Integrated Gradients provides a complementary attribution mechanism by computing the integral of gradients along a path from a baseline input to the actual sample, ensuring theoretically grounded feature attribution [262].
In SERS applications, these gradient-based methods are used to generate heatmaps over spectral inputs, allowing identification of specific wavenumbers that drive diagnostic decisions. This enables direct mapping between model behaviour and molecular vibrational information [180,238].
Game-Theoretic Feature Attribution (SHAP)
In addition to gradient-based approaches, modern SERS diagnostic pipelines employ game-theoretic interpretability methods, particularly SHAP (SHapley Additive exPlanations). SHAP assigns additive feature contributions based on Shapley values from cooperative game theory, distributing the model prediction among input features according to their marginal contribution [263,264]. In ensemble and tree-based frameworks, SHAP provides a principled decomposition of predictions into feature-level contributions, enabling clinicians to verify which spectral variables most strongly influence diagnostic outcomes [237]. This makes SHAP particularly valuable for interpreting SERS data, where each feature corresponds to specific wavenumber regions potentially associated with biochemical signatures.
Interpretability in SERS-Based Diagnostics
SERS combined with machine learning has become a powerful diagnostic platform due to its ability to generate molecular fingerprint spectra with high sensitivity for disease detection [180,238]. However, the high dimensionality and complexity of spectral data require interpretable machine learning techniques to ensure that predictions are clinically meaningful.
Recent SERS studies show that interpretability methods are increasingly integrated into diagnostic pipelines to ensure that model decisions reflect genuine spectral biomarkers rather than spurious correlations [251,259]). Gradient-based attribution methods highlight discriminative spectral regions, while SHAP-based explanations quantify feature contributions in a model-agnostic and clinically interpretable manner [237]. Together, these methods provide complementary insights: gradient-based methods offer local sensitivity maps over spectral inputs, whereas SHAP provides global and local feature importance grounded in additive attribution theory.
To provide a comprehensive and structured overview of how these diverse computational approaches map onto the current state-of-the-art landscape, Table 2 categorises the reviewed contemporary literature (2023–present). This matrix groups studies according to their principal algorithmic families, highlighting the corresponding model architectures, evaluation methodologies, and the range of performance outcomes reported across a variety of clinical diagnostic applications.
6.4. Data Landscape in Spectroscopic AI
The performance, reproducibility, and generalisability of machine learning and deep learning models in SERS-based diagnostics are fundamentally constrained by the volume, structure, and validation strategy of the underlying datasets. To systematise the heterogeneous 2023–present literature, reviewed studies are summarised according to three key dimensions: (i) data composition and biological matrix, (ii) cohort scale and sampling strategy, and (iii) validation and data-splitting protocols. This structured mapping highlights how differences in experimental design directly influence reported model performance and generalisation claims.
Across these categories, a consistent pattern emerges: early-stage SERS studies tend to rely on small exploratory cohorts combined with aggressive spectral inflation strategies, whereas more recent studies increasingly adopt larger multi-cohort datasets and stricter validation protocols such as k-fold cross-validation and external cohort testing. This shift reflects a broader transition in the field from proof-of-concept spectral classification toward clinically deployable diagnostic systems, where generalisability across instruments, populations, and acquisition conditions becomes a central requirement. Importantly, the distinction between patient-level data and spectrum-level data remains a critical confounding factor. Many studies inflate limited patient cohorts into large spectral datasets, which can artificially improve reported performance unless validation is performed at the correct hierarchical level. As summarised in Table 3, only studies employing external or allopatric validation strategies provide strong evidence of true cross-population robustness.
6.5. Computational Challenges and Methodological Bottlenecks
Despite the high performance reported in recent SERS-based machine learning studies, clinical translation remains limited by several computational and methodological constraints. These challenges are primarily driven by the high-dimensional nature of spectral data, inconsistencies in sampling design, and the lack of standardised validation and interpretability frameworks.
6.5.1. Dimensionality and Complexity Constraints
SERS datasets are inherently high-dimensional, containing thousands of wavenumber variables per spectrum. While these features encode rich biochemical information, disease-relevant variations are often subtle and not directly observable, requiring complex feature extraction pipelines [217]. Dimensionality reduction methods such as PCA are widely used for computational efficiency; however, excessive reliance on linear projections may oversimplify non-linear spectral relationships and reduce classification performance in heterogeneous clinical data [274]. This introduces a fundamental trade-off between efficiency, interpretability, and information preservation.
6.5.2. Overfitting and Pseudoreplication
A major limitation in current studies is the mismatch between the number of spectra and the number of independent patients. Multiple spectra acquired from the same subject are often treated as independent samples, leading to pseudoreplication. As a result, models may learn patient-specific or acquisition-related artefacts rather than disease-relevant signals [218,241], inflating reported performance and limiting generalisability.
6.5.3. Spectral Instability and Concentration Effects
SERS signals are highly sensitive to sample preparation conditions, particularly dilution and concentration. Insufficient or excessive dilution can respectively introduce substrate heterogeneity or reduce analyte availability, leading to unstable spectral inputs [274]. At high concentrations, signal saturation further limits quantitative reliability due to nonlinear intensity responses [216]. These effects collectively reduce reproducibility across experimental and clinical settings.
6.5.4. Biomolecular Heterogeneity and Class Overlap
Systemic biofluids exhibit strong biological variability, including inflammation, comorbidities, and inter-individual differences, which contribute to overlapping spectral signatures [38,274]. This is particularly problematic for early-stage disease detection, where weak biomarker signals are easily masked by physiological noise. Consequently, while binary classification tasks involving advanced disease often achieve high accuracy, performance typically degrades in multi-class or early diagnostic scenarios [217,273].
6.5.5. Explainability and the Clinical Adoption Barrier
Although deep learning models such as CNNs and ensemble architectures achieve strong predictive performance, their “black-box” nature remains a major barrier to clinical adoption [237]. Clinical decision-making requires transparent justification of predictions, which motivates the integration of explainable AI methods such as SHAP, Grad-CAM, and Integrated Gradients. However, these approaches introduce additional computational overhead and lack unified clinical validation standards, limiting their current regulatory acceptance [251,259,272].
7. Future Perspectives
This final section highlights the hurdles preventing the translation of SERS from the research laboratory to clinical application. Challenges are categorised according to substrate, biological matrix, data interpretation, and experimental/equipment setting protocols. A summary of opportunities within the SERS landscape is also presented, with a few recommendations.
7.1. Challenges
There are exhaustive reports detailing key challenges that must be addressed before SERS can become accepted as a clinical diagnostic technique [275]. Research papers reporting extremely low limits of detection (LOD), with high clinical sensitivity and selectivity for different disease biomarkers support the utility of SERS in clinical diagnosis. However, there is also a widely acknowledged limitation regarding poor method reliability and result reproducibility [275,276]. Among the underpinning causes is that SERS is dependent on surface chemistry and adsorption dynamics whose mechanisms are yet to be fully elucidated. So, while there are optimistic reports on figures of merit, there is sparse information detailing exact experimental conditions that makes most of the outstanding results possible. Neither are in-depth scientific explanations available that increase our understanding of analyte-substrate interactions, its control mechanisms, and means of consistent reproduction [276,277]. Based on the general workflow of SERS-based assays, several factors contribute to variability and reproducibility challenges, including substrate fabrication and properties, sample matrix complexity, data processing methods, experimental protocols, and spectrometer calibration. Together, these factors underlie the intra- and inter-laboratory variations commonly observed in SERS analyses [9,278].
7.1.1. Substrate-Base Challenges
In terms of substrates for quantitative measurements, the diversity of substrate fabrication methods available, with their respective advantages and disadvantages means there is no set standard in choice of substrate or fabrication methods. This diversity in fabrication methods results in substrates with diverse physicochemical surface characteristics, leading to differences in SERS efficiency, stability, and repeatability [99]. The EF from analyte molecules within hotspots and outside hotspots vary by many orders of magnitude. Similarly, slight variations in substrate geometry results in variation in field enhancement [9]. Although advance fabrication methods such as lithography produces highly reproducible substrate arrays, hotspots disparity per substrate and batch persists [35,55]. Also, for colloidal substrates, an additional complexity arises whereby the storage conditions and age of colloids prepared by similar methods can show different surface affinities for a given identical species, causing fluctuation in measurements [276]. Notably, surface rearrangement events at transient and longer timescales occur due to inducement from light, thermal, or plasmonic electron transfer events which creates fluctuations in single molecule and high-speed acquisition experiments. Additionally, during measurements, temperature change due to the interaction with lasers might result in deformation and rearrangement of the original NP substrate surface. It could also cause thinning or clustering of the adsorbed target analyte molecules on the substrate surface impacting on the measurements and spectra generated [276]. All these impacts on inter batch variation, and consequently on the reproducibility and reliability of SERS measurements. A key strategy proposed to reduce variability arising from substrate fabrication is comprehensive post-synthesis characterization, including assessment of substrate sensitivity, uniformity, reproducibility, and long-term stability. Achieving robust standard operating procedures (SOPs) for these parameters will likely require coordinated interlaboratory collaboration [275].
7.1.2. Biological Matrix Challenges
Another source of variation in SERS measurement reproducibility is the biological matrix. For example, plasma is a complex matrix with thousands of proteins, nucleic acid, metabolites and other compounds. On average, the proportion of plasma (and other biofluids) constituents is normally stable, but plasma heterogeneity arises during some pathologic conditions unique to each individual [178]. Moreover, plasma is dominated by high molecular weight protein fractions (HMWF) in high abundance with several distinct domains whose interaction with NP surfaces results in poor reproducibility [55]. In addition to this, the aggregation observed in label-free SERS when suspensions of SERS substrates are used, is attributed to the high electrolyte content in plasma which shield the stabilising surface charge on the NP substrate leading to aggregation. HMWF readily adsorb on the NP surface forming a “protein corona”, with protein-NP binding equilibria influencing spectral profiles [9,99,279]. Also, variation in the quality (degradation) of the biological matrix impacts on the measured spectra, in addition to constituents such as uric acid, hypoxanthine and carotenoids with higher affinity for NP surfaces outcompeting target analytes for hotspots, thus generating intense signals that dominate and possibly confound the SERS spectra [99,280,281,282]. Notably, the flux present when molecules within the plasma sample diffuse in and out of the hot spot also adds to signal variation [9]. Undoubtedly, SERS can generate outstanding qualitative and quantitative information about target analytes present in complex matrices such as blood plasma, yet the impact of pre-analytical bias arising from sample size, genetic variation, race, sex, and other factors have not been evaluated comprehensively, hence the difficulty in generalising many reported clinical metrics [131]. This is why many papers emphasise further validation using a larger sample size.
7.1.3. Data Analysis Challenge
SERS spectra generated from plasma and other biological matrices are affected by high dimensionality, baseline fluorescence, cosmic ray spikes, and matrix-induced noise, which requires cleaning up to remove artefacts that might confound and invalidate results from the final data processing [100]. Traditional and advanced statistical analytical methods are mandatory to convert complex SERS spectra data into clinically relevant information [283]. Notably, unsupervised learning algorithms (e.g., Principal Component Analysis, PCA; Hierarchical Cluster Analysis, HCA) enable exploratory pattern recognition without prior class labels. Supervised learning methods (e.g., Partial Least Squares Discriminant analysis, PLS-DA and Support Vector Machines, SVM), by contrast, exploit known class information for predictive modelling. Artificial intelligence (AI) algorithms (Convolutional Neural Networks, CNN; Machine Learning, ML and Deep Learning, DL) extend these capabilities through end-to-end learning. The most relevant of these statistical strategies have been detailed in Section 6.
However, as with substrate fabrication, the wide variety of available propriety data analysis software; in-house and publicly accessible statistical platforms; and several simple and advance algorithm models employed in SERS spectral preprocessing, processing and post-processing all contribute to reproducibility challenges in SERS analyses. From preprocessing comprising of spike removal, baseline correction, smoothing and related data pretreatment, the choice of data analysis method is arbitrary and subjective, as no statistical protocol exists that is generally accepted as standard [55,100]. This unavailability of a central data processing standard is evident from the variety of chemometric methods utilised in several studies highlighted in Section 5 and discussed in Section 6.
7.1.4. Experimental and Equipment Challenges
The general experimental protocols/parameters and spectrometer settings used also contribute to the reliability and reproducibility challenge. As with substrate fabrication or data analysis, there is no standard experimental protocol available, therefore there is limited information that details how the SERS spectra is affected by sample variability and pretreatment methods; the selected experimental parameters with respect to equipment and substrate; and the optimal biological matrix for a particular SERS assay [99]. The diversity of manufactured spectroscopic equipment also introduces a level of variation to SERS measurements due to component and parameter settings. Several inter-laboratory studies from different research groups to evaluate and standardise experimental and measurement parameters acknowledge the difficulty in overcoming extant issues regarding reliability and reproducibility [275,284,285,286]. A typical example is that compared to conventional techniques like ELISA with validated reproducibility ≥ 15% [57], the most successful parameters tested for select substrates and laser excitation wavelengths in interlaboratory studies produced an average square error of prediction (SEP) that reached 12%, which although was low, yet did not meet the criteria for a quantitative measurement (1/SEP > 15) [275]. Among identified causes, were differences in the Raman equipment brands and manufacturer-specific setups [284].
7.1.5. Opportunities
Whilst there are identifiable challenges that hinders the translation of SERS from research into being an established technique, supporting clinical diagnostics, researchers are ardently working to find solutions. Hence several approaches are now routinely incorporated in SERS assays to improve reproducibility at substrate, biological matrix, data interpretation, and experimental parameters and measuring equipment settings [55]. For the substrate, irrespective of fabrication method chosen, a detailed post-synthesis characterisation is imperative to evaluate substrate sensitivity, uniformity, reproducibility, as well as longevity; with interlaboratory collaboration encouraged as a means of developing an optimal standard operating procedure (SOP) [275]. Current advances in substrate design and fabrication have helped reduce issues with batch-to-batch reproducibility [57]. There are now technological tools that can fabricate NPs with precise geometries, interparticle gaps, together with preparing colloidal/solid substrates and nanotags with high fidelity, primed for single and multiplex detection. While advance technology has not completely solved the reproducibility issues, it has supported the drive towards standardisation [55,57].
For variations arising from the biological matrix, adhering to good laboratory practices (GLP) could mitigate aspects of pre-analytical variations during sample collection and storage. Sample pretreatment, namely filtration, serum fractionation and protease inhibitors treatment, is encouraged to reduce the impact of protein corona and band masking, whilst avoiding degradation of important proteins, such as biomarkers. Reports suggest plasma/serum protein filtration does not result in loss of SERS spectral information [38,99,100]. It is evident that most SERS-based studies on disease diagnostics have progressed to analysing limited clinical samples, with high predictive accuracy identifying healthy and unhealthy samples. However, clinical testing on a larger sample population is required to validate reported experimental results, an important step toward approval for general diagnostics [57].
Apart from the challenges pertaining to measurement variability, the development of affordable, compact and portable Raman spectrometers adaptable to different healthcare environment, is necessary if SERS is to be adopted as a viable diagnostic system [55]. The significant improvement in component power, quality, and equipment performance, accompanied by lower price and compact size improves the feasibility of SERS for general and POC deployment [57]. Inasmuch as SERS is effective as a standalone technique, developing multimodal Raman spectrometers integrated with efficient sample handling techniques can enhance automation and protocol standardisation [132]. Beyond hardware improvements, advanced software and computational approaches can help overcome challenges associated with complex SERS data analysis and improve diagnostic accuracy. In particular, integrating data-driven and knowledge-based algorithms may enhance both the interpretability and reproducibility of SERS results [55,100].
On a positive note, the different cohort studies point at unrelenting efforts being made towards the standardisation of SERS experimental protocols and measurement parameters [284,285,286]; with appreciable progress achieved in the drive towards improving consistency in measurements and reliability in SERS assays. The recommendation that unfettered access to complete technical information on spectrometer brands by their respective manufacturers; likewise, researchers provide complete research data, whether processed or raw; alongside extensive inter-laboratory collaboration streamlined towards resolving key challenges in SERS should be re-emphasised [275]. The access to detailed information from the research community and equipment manufacturers is vital to proper assessment of completed research, extant challenges, and resolution of identified loopholes.
8. Conclusion
An overview of SERS-based disease diagnostics using gold and silver nanoparticles has been presented in this review, with focus on blood plasma as the test sample medium. Highlighted are the mechanisms underpinning SERS, gold and silver nanoparticles, the biological matrices used as clinical samples, the biomarkers that provide information on diseases/ disorders, and the data analysis methods for SERS spectral interpretation. Also presented were some research demonstrating SERS disease diagnosis, with some focused on resolving the challenges derived from substrates, biological matrices, the data analysis methods, and even the experimental protocols.
SERS as a technique is yet to be translated into routine clinical disease diagnoses due to issues in reproducibility and reliability, its detection capability however, has been demonstrated repeatedly across a broad range of diseases and in all the biological matrices, with the diagnostic accuracy, sensitivity and specificity of SERS being comparable to, and sometimes surpassing results from many conventional techniques. Specifically, SERS assays have achieved highly remarkable performance in blood plasma, notwithstanding its complexity. The different strategies such as anisotropic nanoparticle fabrication, pH adjustment, filtration and related sample/substrate pretreatment methods employed to mitigate or resolve challenges associated with the protein corona, matrix-induced destabilisation of colloidal substrates, and matrix-derived spectral background, showcases the versatility of SERS and its adaptability. In addition to the advances in substrate synthesis/fabrication technologies and matrix pretreatment methods, the integration of SERS with advanced chemometrics like Machine Learning and related Artificial Intelligence algorithms for spectra interpretation creates a robust analytical combination capable of bridging the gap between SERS performance and translatable clinical application.
What is encouraging is that the progress of SERS from academia to actual application have gone past the preliminary stages, with some developed assays and devices already at prototype, and large-scale validation/testing stage. It is only a matter of time before all the concerted efforts by the SERS research community towards improving reproducibility, boosted by advances in technology, results in viable SERS assays and devices becoming one of the clinical laboratory and POC tools.
Funding
“This research was funded by FCT—Fundação para a Ciência e Tecnologia, I.P., in the scope of the project UID/04378/2025 (DOI identifier 10.54499/UID/04378/2025), and UID/PRR/04378/2025 (DOI identifier 10.54499/UID/PRR/04378/2025), of the Research Unit on Applied Molecular Biosciences—UCIBIO and the project LA/P/0140/2020 (DOI identifier 10.54499/LA/P/0140/2020) of the Associate Laboratory Institute for Health and Bioeconomy—i4HB.”.
Institutional Review Board Statement
Not applicable.
Informed Consent Statement
Not applicable.
Data Availability Statement
Not applicable.
Acknowledgments
We thank our colleagues for their help in the discussion. During the preparation of this manuscript, the author(s) used Google Gemini 3 Flash Image for the generation of the SERS platform illustration (gold nanoparticle substrate and adsorbed molecules) and the detector graphic displayed in Figure 1, and used Anthropic Claude Sonnet 4.6 for the design and generation of the simulated Raman spectra (excitation laser spectrum, raw Raman spectrum, and notch-filtered acquired spectrum) also displayed in Figure 1. The Graphical Abstract was created in BioRender. Franco, R. (2026) https://BioRender.com/4pvi86c. The authors have reviewed and edited the output and take full responsibility for the content of this publication.”.
Conflicts of Interest
The authors declare no conflicts of interest.
References
- Otoo, J. A.; Schlappi, T. S. REASSURED Multiplex Diagnostics: A Critical Review and Forecast. Biosensors 2022, 12, 124. [Google Scholar] [CrossRef]
- Castillo-León, J.; Trebbien, R.; Castillo, J. J.; Svendsen, W. E. Commercially available rapid diagnostic tests for the detection of high priority pathogens: status and challenges. The Analyst 2021, 146, 3750–3776. [Google Scholar] [CrossRef]
- Smith, W. E. Practical understanding and use of surface enhanced Raman scattering/surface enhanced resonance Raman scattering in chemical and biological analysis. Chem. Soc. Rev. 2008, 37, 955. [Google Scholar] [CrossRef]
- Yaffe, N. R.; Blanch, E. W. Effects and anomalies that can occur in SERS spectra of biological molecules when using a wide range of aggregating agents for hydroxylamine-reduced and citrate-reduced silver colloids. Vib. Spectrosc. 2008, 48, 196–201. [Google Scholar] [CrossRef]
- Bonifacio; Cervo, S.; Sergo, V. Label-free surface-enhanced Raman spectroscopy of biofluids: fundamental aspects and diagnostic applications. Anal. Bioanal. Chem. 2015, 407, 8265–8277. [Google Scholar] [CrossRef]
- Langer, J. Present and Future of Surface-Enhanced Raman Scattering. ACS Nano 2020, 14, 28–117. [Google Scholar] [CrossRef]
- Schlücker, S. Surface-Enhanced Raman Spectroscopy: Concepts and Chemical Applications. Angew. Chem. Int. Ed. 2014, 53, 4756–4795. [Google Scholar] [CrossRef]
- Wiercigroch, E.; Swit, P.; Brzozka, A.; Pięta, Ł.; Malek, K. Dual-enhancement and dual-tag design for SERS-based sandwich immunoassays: evaluation of a metal–metal effect in 3D architecture. Microchim. Acta 2022, 189, 32. [Google Scholar] [CrossRef]
- Zong, C. Surface-Enhanced Raman Spectroscopy for Bioanalysis: Reliability and Challenges. Chem. Rev. 2018, 118, 4946–4980. [Google Scholar] [CrossRef] [PubMed]
- Ye, M. Subtype discrimination of acute myeloid leukemia based on plasma SERS technique. Spectrochim. Acta. A. Mol. Biomol. Spectrosc. 2022, 271, 120865. [Google Scholar] [CrossRef] [PubMed]
- Paraskevaidi, M. Raman spectroscopic techniques to detect ovarian cancer biomarkers in blood plasma. Talanta 2018, 189, 281–288. [Google Scholar] [CrossRef] [PubMed]
- Lu, D.; Chen, C.; Xu, P.; You, R.; Lu, Z.; Lu, Y. Two-dimensional substrate assisted SERS immunosensor for accurate detection of carcinoembryonic antigen. Spectrochim. Acta. A. Mol. Biomol. Spectrosc. 2023, 302, 123142. [Google Scholar] [CrossRef]
- Oliveira, M. J. A simple polystyrene microfluidic device for sensitive and accurate SERS-based detection of infection by malaria parasites. The Analyst 2023, 148, 4053–4063. [Google Scholar] [CrossRef]
- De Almeida, M. P. Silver Nanostar-Based SERS for the Discrimination of Clinically Relevant Acinetobacter baumannii and Klebsiella pneumoniae Species and Clones. Biosensors 2023, 13, 149. [Google Scholar] [CrossRef]
- Kamran. Surface-enhanced Raman spectroscopy for characterization of filtrates of blood serum samples from patients with tuberculosis obtained by 50 kDa filtration devices. RSC Adv. 2024, 14, 8548–8555. [Google Scholar] [CrossRef]
- Yadav, S. SERS Based Lateral Flow Immunoassay for Point-of-Care Detection of SARS-CoV-2 in Clinical Samples. ACS Appl. Bio Mater. 2021, 4, 2974–2995. [Google Scholar] [CrossRef]
- Freitas, C. Towards Rapid and Low-Cost Stroke Detection Using SERS and Machine Learning. Biosensors 2025, 15, 136. [Google Scholar] [CrossRef] [PubMed]
- Kim, M. Surface-functionalized SERS platform for deep learning-assisted diagnosis of Alzheimer’s disease. Biosens. Bioelectron. 2024, 251, 116128. [Google Scholar] [CrossRef]
- Stefancu. SERS-based liquid biopsy of saliva and serum from patients with Sjögren’s syndrome. Anal. Bioanal. Chem. 2019, 411, 5877–5883. [Google Scholar] [CrossRef]
- Butler, M. R.; Jacot, T. A.; Dutta, S. M.; Doncel, G. F.; Cooper, J. B. Quantification of Antiretroviral Drug Emtricitabine in Human Plasma by Surface Enhanced Raman Spectroscopy. ACS Omega 2025, 10, 4315–4325. [Google Scholar] [CrossRef] [PubMed]
- Guselnikova. Enantioselective SERS sensing of pseudoephedrine in blood plasma biomatrix by hierarchical mesoporous Au films coated with a homochiral MOF. Biosens. Bioelectron. 2021, 180, 113109. [Google Scholar] [CrossRef]
- Demishkevich, E. A. Sers-based methodology for nanomolar methotrexate concentration detection for clinics. Spectrochim. Acta. A. Mol. Biomol. Spectrosc. 2025, 331, 125801. [Google Scholar] [CrossRef] [PubMed]
- Long, Q. Preparation of Ag-MOF based high-performance SERS substrate for the rapid detection of paraquat in plasma. Spectrochim. Acta. A. Mol. Biomol. Spectrosc. 2026, 353, 127579. [Google Scholar] [CrossRef] [PubMed]
- Masterson, N. Enhancing Nonfouling and Sensitivity of Surface-Enhanced Raman Scattering Substrates for Potent Drug Analysis in Blood Plasma via Fabrication of a Flexible Plasmonic Patch. Anal. Chem. 2021, 93, 2578–2588. [Google Scholar] [CrossRef]
- Zhang, T. Ultrasensitive Hierarchical AuNRs@SiO(2)@Ag SERS Probes for Enrichment and Detection of Insulin and C-Peptide in Serum. Int. J. Nanomed. 2024, 19, 6281–6293. [Google Scholar] [CrossRef]
- Eremina, E. Molecular Immobilization and Resonant Raman Amplification by Complex-Loaded Enhancers (MIRRACLE) on copper (II)-chitosan-modified SERS-active metallic nanostructured substrates for multiplex determination of dopamine, norepinephrine, and epinephrine. Mikrochim. Acta 2022, 189, 211. [Google Scholar] [CrossRef]
- Wang; Wang, C.; Li, J.; Tu, Z.; Gu, B.; Wang, S. Ultrasensitive and multiplex detection of four pathogenic bacteria on a bi-channel lateral flow immunoassay strip with three-dimensional membrane-like SERS nanostickers. Biosens. Bioelectron. 2022, 214, 114525. [Google Scholar] [CrossRef]
- Li, X. Surface Enhanced Raman Spectroscopy (SERS) for the Multiplex Detection of Braf, Kras, and Pik3ca Mutations in Plasma of Colorectal Cancer Patients. Theranostics 2018, 8, 1678–1689. [Google Scholar] [CrossRef]
- Hu, C.; Guan, M.; Mi, F.; Zhang, S.; Geng, P. Multimodal SERS Biosensing Platforms: Emerging Opportunities for Ultrasensitive Biomarker Detection and Intelligent Diagnostics. ACS Sens. 2026, 11, 1794–1830. [Google Scholar] [CrossRef]
- Cao, X. LoC-SERS platform for rapid and sensitive detection of colorectal cancer protein biomarkers. Talanta 2024, 270, 125563. [Google Scholar] [CrossRef]
- Fan, M. Plasmonic internal standard-decorated nitrocellulose membranes for duplex detection of circulating tumor biomarkers. Sens. Actuators B Chem. 2023, 395, 134508. [Google Scholar] [CrossRef]
- Gao, X. A “hot Spot”-Enhanced paper lateral flow assay for ultrasensitive detection of traumatic brain injury biomarker S-100β in blood plasma. Biosens. Bioelectron. 2021, 177, 112967. [Google Scholar] [CrossRef]
- Lyu, N. Multiplex detection of ctDNA mutations in plasma of colorectal cancer patients by PCR/SERS assay. Nanotheranostics 2020, 4, 224–232. [Google Scholar] [CrossRef]
- Wang, W.; Ma, P.; Song, D. Applications of surface-enhanced Raman spectroscopy based on portable Raman spectrometers: A review of recent developments. Luminescence 2022, 37, 1822–1835. [Google Scholar] [CrossRef]
- Jones, R. R.; Hooper, D. C.; Zhang, L.; Wolverson, D.; Valev, V. K. Raman Techniques: Fundamentals and Frontiers. Nanoscale Res. Lett. 2019, 14, 231. [Google Scholar] [CrossRef]
- Yi, J. Surface-enhanced Raman spectroscopy: a half-century historical perspective. Chem. Soc. Rev. 2025, 54, 1453–1551. [Google Scholar] [CrossRef]
- Butler, H. J. Using Raman spectroscopy to characterize biological materials. Nat. Protoc. 2016, 11, 664–687. [Google Scholar] [CrossRef]
- Premasiri, W. R.; Lee, J. C.; Ziegler, L. D. Surface-enhanced Raman scattering of whole human blood, blood plasma, and red blood cells: cellular processes and bioanalytical sensing. J. Phys. Chem. B 2012, 116, 9376–9386. [Google Scholar] [CrossRef]
- Laing, S.; Gracie, K.; Faulds, K. Multiplex in vitro detection using SERS. Chem. Soc. Rev. 2016, 45, 1901–1918. [Google Scholar] [CrossRef]
- Lane, L. A.; Qian, X.; Nie, S. SERS Nanoparticles in Medicine: From Label-Free Detection to Spectroscopic Tagging. Chem. Rev. 2015, 115, 10489–10529. [Google Scholar] [CrossRef]
- Aitekenov, S. Raman, Infrared and Brillouin Spectroscopies of Biofluids for Medical Diagnostics and for Detection of Biomarkers. Crit. Rev. Anal. Chem. 2023, 53, 1561–1590. [Google Scholar] [CrossRef]
- Le Ru, E. C. Principles of surface-enhanced Raman spectroscopy: and related plasmonic effects, 1st ed.; Elsevier: Amsterdam Boston, 2009. [Google Scholar]
- Smith, E.; Dent, G. Modern raman spectroscopy: a practical approach, Reprinted; Wiley: Chichester, 2008. [Google Scholar]
- Pilot, R.; Signorini, R.; Durante, C.; Orian, L.; Bhamidipati, M.; Fabris, L. A Review on Surface-Enhanced Raman Scattering. Biosensors 2019, 9, 57. [Google Scholar] [CrossRef]
- Han, X. X.; Ozaki, Y.; Zhao, B. Label-free detection in biological applications of surface-enhanced Raman scattering. TrAC Trends Anal. Chem. 2012, 38, 67–78. [Google Scholar] [CrossRef]
- Gao, S. Label-free surface enhanced Raman spectroscopy analysis of blood serum via coffee ring effect for accurate diagnosis of cancers. Spectrochim. Acta. A. Mol. Biomol. Spectrosc. 2022, 267, 120605. [Google Scholar] [CrossRef]
- Ditta. An exploratory clinical study of the diagnosis and staging of typhoid fever using label-free surface-enhanced Raman spectroscopy liquid biopsy. Spectrochim. Acta. A. Mol. Biomol. Spectrosc. 2025, 333, 125864. [Google Scholar] [CrossRef]
- Turzhitsky, V. Picoanalysis of Drugs in Biofluids with Quantitative Label-Free Surface-Enhanced Raman Spectroscopy. Small Weinh. Bergstr. Ger. 2018, 14, e1802392. [Google Scholar] [CrossRef]
- Chen, S. A highly sensitive SERS substrate of porous membrane-Ag NPs for kidney cancer detection. Anal. Chim. Acta 2024, 1315, 342770. [Google Scholar] [CrossRef]
- Gwon, Y.; Kim, J.-H.; Lee, S.-W. Quantification of Plasma Dopamine in Depressed Patients Using Silver-Enriched Silicon Nanowires as SERS-Active Substrates. ACS Sens. 2024, 9, 870–882. [Google Scholar] [CrossRef]
- Cui, X. Label-free detection of multiple genitourinary cancers from urine by surface-enhanced Raman spectroscopy. Spectrochim. Acta. A. Mol. Biomol. Spectrosc. 2020, 240, 118543. [Google Scholar] [CrossRef]
- Zhang, Y. J. Label-free rapid identification of tumor cells and blood cells with silver film SERS substrate. Opt. Express 2018, 26, 33044–33056. [Google Scholar] [CrossRef]
- Chen, X. Novel non-invasive method for urine mapping: Deep-learning-enabled SERS spectroscopy for the rapid differential detection of kidney allograft injury. Spectrochim. Acta. A. Mol. Biomol. Spectrosc. 2024, 315, 124255. [Google Scholar] [CrossRef]
- Eravuchira, P.; Banchelli, M.; D’Andrea, C.; De Angelis, M.; Matteini, P.; Gannot, I. Hollow core photonic crystal fiber-assisted Raman spectroscopy as a tool for the detection of Alzheimer’s disease biomarkers. J. Biomed. Opt. 2020, 25, 1–10. [Google Scholar] [CrossRef]
- Lin, L. L. Surface-Enhanced Raman Spectroscopy for Biomedical Applications: Recent Advances and Future Challenges. ACS Appl. Mater. Interfaces 2025, 17, 16287–16379. [Google Scholar] [CrossRef]
- Oliveira, M. J. Design and Simple Assembly of Gold Nanostar Bioconjugates for Surface-Enhanced Raman Spectroscopy Immunoassays. Nanomaterials 2019, 9, 1561. [Google Scholar] [CrossRef]
- Granger, J. H.; Schlotter, N. E.; Crawford, A. C.; Porter, M. D. Prospects for point-of-care pathogen diagnostics using surface-enhanced Raman scattering (SERS). Chem. Soc. Rev. 2016, 45, 3865–3882. [Google Scholar] [CrossRef]
- Oliveira, M. J. Reusable and highly sensitive SERS immunoassay utilizing gold nanostars and a cellulose hydrogel-based platform. J. Mater. Chem. B 2021, 9, 7516–7529. [Google Scholar] [CrossRef]
- Li, D. SERS based Y-shaped aptasensor for early diagnosis of acute kidney injury. RSC Adv. 2022, 12, 15910–15917. [Google Scholar] [CrossRef]
- Pazos-Perez, N. Ultrasensitive multiplex optical quantification of bacteria in large samples of biofluids. Sci. Rep. 2016, 6, 29014. [Google Scholar] [CrossRef]
- Kamińska; Sprynskyy, M.; Winkler, K.; Szymborski, T. Ultrasensitive SERS immunoassay based on diatom biosilica for detection of interleukins in blood plasma. Anal. Bioanal. Chem. 2017, 409, 6337–6347. [Google Scholar] [CrossRef] [PubMed]
- Choi, N.; Schlücker, S. Convergence of Surface-Enhanced Raman Scattering with Molecular Diagnostics: A Perspective on Future Directions. ACS Nano 2024, 18, 5998–6007. [Google Scholar] [CrossRef] [PubMed]
- Liang, P. Ag Nanoparticles with Ultrathin Au Shell-Based Lateral Flow Immunoassay for Colorimetric and SERS Dual-Mode Detection of SARS-CoV-2 IgG. Anal. Chem. 2022, 94, 8466–8473. [Google Scholar] [CrossRef] [PubMed]
- Brown, R. J. C.; Milton, M. J. T. Nanostructures and nanostructured substrates for surface—enhanced Raman scattering (SERS). J. Raman Spectrosc. 2008, 39, 1313–1326. [Google Scholar] [CrossRef]
- De Almeida, M. Peixoto. Gold Nanoparticles as (Bio)Chemical Sensors. In Comprehensive Analytical Chemistry; Elsevier, 2014; vol. 66, pp. 529–567. [Google Scholar] [CrossRef]
- Li, Q. Design and Synthesis of SERS Materials for In Vivo Molecular Imaging and Biosensing. Adv. Sci. 2023, 10, 2202051. [Google Scholar] [CrossRef]
- Li, N.; Zhao, P.; Astruc, D. Anisotropic Gold Nanoparticles: Synthesis, Properties, Applications, and Toxicity. Angew. Chem. Int. Ed. 2014, 53, 1756–1789. [Google Scholar] [CrossRef]
- Li, T.; Zhang, J.; Bu, P.; Wu, H.; Guo, J.; Guo, J. Multi-modal nanoprobe-enabled biosensing platforms: a critical review. Nanoscale 2024, 16, 3784–3816. [Google Scholar] [CrossRef]
- Jana, N. R.; Gearheart, L.; Murphy, C. J. Evidence for Seed-Mediated Nucleation in the Chemical Reduction of Gold Salts to Gold Nanoparticles. Chem. Mater. 2001, 13, 2313–2322. [Google Scholar] [CrossRef]
- Vo-Dinh, T. SERS Nanosensors and Nanoreporters: Golden Opportunities in Biomedical Applications. WIREs Nanomed. Nanobiotechnology 2015, 7, 17–33. [Google Scholar] [CrossRef] [PubMed]
- Butler, H. J.; Fogarty, S. W.; Kerns, J. G.; Martin-Hirsch, P. L.; Fullwood, N. J.; Martin, F. L. Gold nanoparticles as a substrate in bio-analytical near-infrared surface-enhanced Raman spectroscopy. The Analyst 2015, 140, 3090–3097. [Google Scholar] [CrossRef]
- Garcia-Leis; Garcia-Ramos, J. V.; Sanchez-Cortes, S. Silver Nanostars with High SERS Performance. J. Phys. Chem. C 2013, 117, 7791–7795. [Google Scholar] [CrossRef]
- Hossain, Md. K.; Cho, H.-Y.; Kim, K.-J.; Choi, J.-W. Silver Nanostar Patterned Substrate for Label-Free Characterization of Breast Cancer Cells based on Surface-Enhanced Raman Spectroscopy. Sci. Adv. Mater. 2014, 6, 2491–2495. [Google Scholar] [CrossRef]
- Leopold, N.; Lendl, B. A New Method for Fast Preparation of Highly Surface-Enhanced Raman Scattering (SERS) Active Silver Colloids at Room Temperature by Reduction of Silver Nitrate with Hydroxylamine Hydrochloride. J. Phys. Chem. B 2003, 107, 5723–5727. [Google Scholar] [CrossRef]
- Zhang, X.-F.; Liu, Z.-G.; Shen, W.; Gurunathan, S. Silver Nanoparticles: Synthesis, Characterization, Properties, Applications, and Therapeutic Approaches. Int. J. Mol. Sci. 2016, 17, 1534. [Google Scholar] [CrossRef]
- Quaresma, P. Star-shaped magnetite@gold nanoparticles for protein magnetic separation and SERS detection. RSC Adv. 2014, 4, 3690–3698. [Google Scholar] [CrossRef]
- Kamińska. SERS-based Immunoassay in a Microfluidic System for the Multiplexed Recognition of Interleukins from Blood Plasma: Towards Picogram Detection. Sci. Rep. 2017, 7, 10656. [Google Scholar] [CrossRef]
- Pilot, R.; Bozio, R. Validation of SERS enhancement factor measurements. J. Raman Spectrosc. 2018, 49, 462–471. [Google Scholar] [CrossRef]
- Fornasaro, S. Spectroscopic investigation of faeces with surface-enhanced Raman scattering: a case study with coeliac patients on gluten-free diet. Anal. Bioanal. Chem. 2022, 414, 3517–3527. [Google Scholar] [CrossRef]
- Lu, D.; Huang, Z.; Chen, J.; Lu, Y. pH-Adjusted Liquid SERS Approach: Toward a Reliable Plasma-Based Early Stage Lung Cancer Detection. Anal. Chem. 2025, 97, 508–515. [Google Scholar] [CrossRef] [PubMed]
- Feng, S.; Wang, W.; Tai, I. T.; Chen, G.; Chen, R.; Zeng, H. Label-free surface-enhanced Raman spectroscopy for detection of colorectal cancer and precursor lesions using blood plasma. Biomed. Opt. Express 2015, 6, 3494. [Google Scholar] [CrossRef]
- Li. Digital SERS immunoassay of Interleukin-6 based on Au@Ag-Au nanotags. Biosens. Bioelectron. 2025, 270, 116973. [Google Scholar] [CrossRef]
- Oliveira, M. J. Office paper decorated with silver nanostars—an alternative cost effective platform for trace analyte detection by SERS. Sci. Rep. 2017, 7, 2480. [Google Scholar] [CrossRef] [PubMed]
- Campu. Portable microfluidic plasmonic chip for fast real-time cardiac troponin I biomarker thermoplasmonic detection. J. Mater. Chem. B 2024, 12, 962–972. [Google Scholar] [CrossRef]
- Yuan, Y.; Chen, C.; Huang, Q.; Gong, M.; Ye, Z. The determination of SERS activity of Au@Ag polyhedral nanostructures and the detection of hair loss types based on transformer. J. Photochem. Photobiol. Chem. 2026, 470, 116657. [Google Scholar] [CrossRef]
- Liu, Y.; Lyu, N.; Rajendran, V. K.; Piper, J.; Rodger, A.; Wang, Y. Sensitive and Direct DNA Mutation Detection by Surface-Enhanced Raman Spectroscopy Using Rational Designed and Tunable Plasmonic Nanostructures. Anal. Chem. 2020, 92, 5708–5716. [Google Scholar] [CrossRef]
- Yang; Zheng, W.; Chen, X.; Wang, J.; Zhou, S.; Gao, H. Au nanorod assembly for sensitive SERS detection of airway inflammatory factors in sputum. Front. Bioeng. Biotechnol. 2023, 11, 1256340. [Google Scholar] [CrossRef]
- Xu, L. Biosensors: SERS Encoded Silver Pyramids for Attomolar Detection of Multiplexed Disease Biomarkers (Adv. Mater. 10/2015). Adv. Mater. 2015, 27, 1799–1799. [Google Scholar] [CrossRef]
- Hao, N. Acoustofluidic multimodal diagnostic system for Alzheimer’s disease. Biosens. Bioelectron. 2022, 196, 113730. [Google Scholar] [CrossRef]
- Tang, X. Advancements and challenges on SERS-based multimodal biosensors for biotoxin detection. Trends Food Sci. Technol. 2024, 152, 104672. [Google Scholar] [CrossRef]
- Hackshaw, K. V.; Miller, J. S.; Aykas, D. P.; Rodriguez-Saona, L. Vibrational Spectroscopy for Identification of Metabolites in Biologic Samples. Molecules 2020, 25, 4725. [Google Scholar] [CrossRef]
- Holman, P.; Peterson, M.; Linhart, E.; Kurouski, D. Using surface-enhanced Raman spectroscopy to probe artificial dye degradation on hair buried in multiple soils for up to eight weeks. Sci. Rep. 2024, 14, 6469. [Google Scholar] [CrossRef]
- Al-Assi, G. Non-invasive biological matrices on biosensor design. Clin. Chim. Acta 2026, 582, 120785. [Google Scholar] [CrossRef]
- Murali, K. Forensic Detection: A Comprehensive Review of SERS Mechanisms and Applications. ACS Appl. Opt. Mater. 2026, 4, 695–722. [Google Scholar] [CrossRef]
- Andreou, C. Imaging of Liver Tumors Using Surface-Enhanced Raman Scattering Nanoparticles. ACS Nano 2016, 10, 5015–5026. [Google Scholar] [CrossRef]
- Harmsen, S. Detection of Premalignant Gastrointestinal Lesions Using Surface-Enhanced Resonance Raman Scattering–Nanoparticle Endoscopy. ACS Nano 2019, acsnano.8b06808. [Google Scholar] [CrossRef]
- Liu, Y.; Chang, Z.; Yuan, H.; Fales, A. M.; Vo-Dinh, T. Quintuple-modality (SERS-MRI-CT-TPL-PTT) plasmonic nanoprobe for theranostics. Nanoscale 2013, 5, 12126. [Google Scholar] [CrossRef]
- Biswas, S. Detection and analysis of rotavirus in clinical stool samples using silver nanoparticle functionalized paper as SERS substrate. Spectrochim. Acta. A. Mol. Biomol. Spectrosc. 2023, 295, 122610. [Google Scholar] [CrossRef]
- Bonifacio. Surface-enhanced Raman spectroscopy of blood plasma and serum using Ag and Au nanoparticles: a systematic study. Anal. Bioanal. Chem. 2014, 406, 2355–2365. [Google Scholar] [CrossRef]
- Parachalil, D. R.; McIntyre, J.; Byrne, H. J. Potential of Raman spectroscopy for the analysis of plasma/serum in the liquid state: recent advances. Anal. Bioanal. Chem. 2020, 412, 1993–2007. [Google Scholar] [CrossRef]
- Kim, H. S. Hand-Held Raman Spectrometer-Based Dual Detection of Creatinine and Cortisol in Human Sweat Using Silver Nanoflakes. Anal. Chem. 2021, 93, 14996–15004. [Google Scholar] [CrossRef]
- Han, L. Development of Fe3O4/DEX/PDA@Au(Raman reporters)@Au-MPBA nanocomposites based multi-hotspot SERS probe for ultrasensitive, reliable, and quantitative detection of glucose in sweat. Spectrochim. Acta. A. Mol. Biomol. Spectrosc. 2025, 326, 125192. [Google Scholar] [CrossRef]
- Wang, W. Flexible SERS wearable sensor based on nanocomposite hydrogel for detection of metabolites and pH in sweat. Chem. Eng. J. 2023, 474, 145953. [Google Scholar] [CrossRef]
- Hu, M. Wearable microfluidic SERS patch based on silk fibroin for the non-invasive monitoring of sweat cortisol and pH. Sens. Actuators B Chem. 2025, 427, 137152. [Google Scholar] [CrossRef]
- Hu, P. Drop-coating deposition and surface-enhanced Raman spectroscopies (DCDRS and SERS) provide complementary information of whole human tears. J. Raman Spectrosc. 2014, 45, 565–573. [Google Scholar] [CrossRef]
- Cennamo, G. Surface-enhanced Raman spectroscopy of tears: toward a diagnostic tool for neurodegenerative disease identification. J. Biomed. Opt. 2020, 25, 1. [Google Scholar] [CrossRef]
- Cui, X. Detection of glucose in diabetic tears by using gold nanoparticles and MXene composite surface-enhanced Raman scattering substrates. Spectrochim. Acta. A. Mol. Biomol. Spectrosc. 2022, 266, 120432. [Google Scholar] [CrossRef]
- Wu, X.; Chen, J.; Li, X.; Zhao, Y.; Zughaier, S. M. Culture-free diagnostics of Pseudomonas aeruginosa infection by silver nanorod array based SERS from clinical sputum samples. Nanomed. Nanotechnol. Biol. Med. 2014, 10, 1863–1870. [Google Scholar] [CrossRef]
- Bai, L.; Fang, G.; Li, J.; Hasi, W.; Han, S. SERS spectrum of saliva combined with machine learning algorithm for early diagnosis and monitoring of periodontal disease. Spectrochim. Acta. A. Mol. Biomol. Spectrosc. 2026, 346, 126768. [Google Scholar] [CrossRef]
- Moisoiu, V. Combining surface-enhanced Raman scattering (SERS) of saliva and two-dimensional shear wave elastography (2D-SWE) of the parotid glands in the diagnosis of Sjögren’s syndrome. Spectrochim. Acta. A. Mol. Biomol. Spectrosc. 2020, 235, 118267. [Google Scholar] [CrossRef]
- Markina, N. E.; Markin, A. V. Determination of multiple analytes in urine using label-free SERS coupled with simple sample pretreatments. Anal. Chim. Acta 2024, 1332, 343383. [Google Scholar] [CrossRef]
- Wang, J. Molecule-Responsive SERS Sensors for Urine Diagnosis of Kidney Diseases Enhanced by Neural Networks. Anal. Chem. 2025, 97, 13414–13421. [Google Scholar] [CrossRef]
- Wang, J.; Meng, F.; Ma, Z.; Chen, M.; Wang, W.; Xu, S. Surface-enhanced Raman spectroscopy (SERS)-based urine biopsy for kidney transplant patients. Spectrochim. Acta. A. Mol. Biomol. Spectrosc. 2025, 332, 125822. [Google Scholar] [CrossRef]
- Song, Y. Cerebrospinal fluid-induced stable and reproducible SERS sensing for various meningitis discrimination assisted with machine learning. Biosens. Bioelectron. 2025, 267, 116753. [Google Scholar] [CrossRef] [PubMed]
- Liu, J. A Biomimetic Plasmonic Nanoreactor for Reliable Metabolite Detection. Adv. Sci. Weinh. Baden.-Wurtt. Ger. 2020, 7, 1903730. [Google Scholar] [CrossRef]
- Shao, G.; Chen, R.; Li, M.; Liu, Y.; Zhang, K.; Zhan, Q. Direct SERS profiling of small extracellular vesicles in cerebrospinal fluid for pediatric medulloblastoma detection and treatment monitoring. Anal. Bioanal. Chem. 2025, 417, 6769–6779. [Google Scholar] [CrossRef]
- Lin, D. Label-free blood plasma test based on surface-enhanced Raman scattering for tumor stages detection in nasopharyngeal cancer. Sci. Rep. 2014, 4, 4751. [Google Scholar] [CrossRef]
- Issaq, H. J.; Xiao, Z.; Veenstra, T. D. Serum and Plasma Proteomics. Chem. Rev. 2007, 107, 3601–3620. [Google Scholar] [CrossRef]
- Moisoiu, V. SERS liquid biopsy: An emerging tool for medical diagnosis. Colloids Surf. B Biointerfaces 2021, 208, 112064. [Google Scholar] [CrossRef] [PubMed]
- Tripathi, S.; Varun Kumar, Y. V. B.; Prabhakar, A.; Joshi, S. S.; Agrawal, A. Passive blood plasma separation at the microscale: a review of design principles and microdevices. J. Micromechanics Microengineering 2015, 25, 083001. [Google Scholar] [CrossRef]
- Shende, C.; Brouillette, C.; Farquharson, S. Detection of codeine and fentanyl in saliva, blood plasma and whole blood in 5-minutes using a SERS flow-separation strip. The Analyst 2019, 144, 5449–5454. [Google Scholar] [CrossRef] [PubMed]
- Zhao, P. A SERS nano-tag-based magnetic-separation strategy for highly sensitive immunoassay in unprocessed whole blood. Talanta 2019, 198, 527–533. [Google Scholar] [CrossRef]
- Jiang, J. Surface-enhanced Raman spectroscopy for propofol detection in postoperative patient whole blood samples. Sens. Actuators B Chem. 2026, 447, 138877. [Google Scholar] [CrossRef]
- Ahmad, S. Characterization and prediction of viral loads of Hepatitis B serum samples by using surface-enhanced Raman spectroscopy (SERS). Photodiagnosis Photodyn. Ther. 2021, 35, 102386. [Google Scholar] [CrossRef] [PubMed]
- Liu, X.; Su, X.; Chen, M.; Xie, Y.; Li, M. Self-calibrating surface-enhanced Raman scattering-lateral flow immunoassay for determination of amyloid-β biomarker of Alzheimer’s disease. Biosens. Bioelectron. 2024, 245, 115840. [Google Scholar] [CrossRef] [PubMed]
- Shoukat, Z. SERS profiling of blood serum filtrate components from patients with type II diabetes using 100 kDa filtration devices. RSC Adv. 2025, 15, 2287–2297. [Google Scholar] [CrossRef] [PubMed]
- Elashnikov, R.; Khrystonko, O.; Trelin, A.; Kuchař, M.; Švorčík, V.; Lyutakov, O. Label-free SERS-ML detection of cocaine trace in human blood plasma. J. Hazard. Mater. 2024, 472, 134525. [Google Scholar] [CrossRef]
- Kowalska, A.; Nowicka, A. B.; Szymborski, T.; Cywiński, P.; Kamińska, A. Determination of L-selectin in blood plasma using DNA aptamer-based surface-enhanced Raman spectroscopy assay. Anal. Bioanal. Chem. 2024, 416, 1189–1197. [Google Scholar] [CrossRef]
- Ahmad; Imran, M.; Ahsan, H. Biomarkers as Biomedical Bioindicators: Approaches and Techniques for the Detection, Analysis, and Validation of Novel Biomarkers of Diseases. Pharmaceutics 2023, 15, 1630. [Google Scholar] [CrossRef]
- Ezkurdia. Multiple evidence strands suggest that there may be as few as 19 000 human protein-coding genes. Hum. Mol. Genet. 2014, 23, 5866–5878. [Google Scholar] [CrossRef]
- Williams, S. A. Plasma protein patterns as comprehensive indicators of health. Nat. Med. 2019, 25, 1851–1857. [Google Scholar] [CrossRef]
- Guerrini, L.; Alvarez-Puebla, R. A. Surface-Enhanced Raman Spectroscopy in Cancer Diagnosis, Prognosis and Monitoring. Cancers 2019, 11, 748. [Google Scholar] [CrossRef]
- Feliu, N.; Hassan, M.; Garcia Rico, E.; Cui, D.; Parak, W.; Alvarez-Puebla, R. SERS Quantification and Characterization of Proteins and Other Biomolecules. Langmuir 2017, 33, 9711–9730. [Google Scholar] [CrossRef]
- Gorshkov, V.; Bubis, J. A.; Solovyeva, E. M.; Gorshkov, M. V.; Kjeldsen, F. Protein corona formed on silver nanoparticles in blood plasma is highly selective and resistant to physicochemical changes of the solution. Environ. Sci. Nano 2019, 6, 1089–1098. [Google Scholar] [CrossRef]
- Mi, S. Unveiling the Correlation between Protein, Protein Corona, and Target Signal Loss in SERS Detection. Anal. Chem. 2024, 96, 19768–19777. [Google Scholar] [CrossRef]
- Lu, X.; Xu, P.; Ding, H.-M.; Yu, Y.-S.; Huo, D.; Ma, Y.-Q. Tailoring the component of protein corona via simple chemistry. Nat. Commun. 2019, 10, 4520. [Google Scholar] [CrossRef]
- Gebauer, S. Impact of the Nanoparticle–Protein Corona on Colloidal Stability and Protein Structure. Langmuir 2012, 28, 9673–9679. [Google Scholar] [CrossRef]
- Wang, Y.; Tang, L.-J.; Jiang, J.-H. Surface-enhanced Raman spectroscopy-based, homogeneous, multiplexed immunoassay with antibody-fragments-decorated gold nanoparticles. Anal. Chem. 2013, 85, 9213–9220. [Google Scholar] [CrossRef] [PubMed]
- Issatayeva. SERS-based methods for the detection of genomic biomarkers of cancer. Talanta 2024, 267, 125198. [Google Scholar] [CrossRef]
- Perakis, S.; Speicher, M. R. Emerging concepts in liquid biopsies. BMC Med. 2017, 15, 75. [Google Scholar] [CrossRef] [PubMed]
- Li, X. Polymerase chain reaction—surface-enhanced Raman spectroscopy (PCR-SERS) method for gene methylation level detection in plasma. Theranostics 2020, 10, 898–909. [Google Scholar] [CrossRef]
- Wang, H.-N.; Crawford, B. M.; Fales, A. M.; Bowie, M. L.; Seewaldt, V. L.; Vo-Dinh, T. Multiplexed Detection of MicroRNA Biomarkers Using SERS-Based Inverse Molecular Sentinel (iMS) Nanoprobes. J. Phys. Chem. C 2016, 120, 21047–21055. [Google Scholar] [CrossRef]
- Zhang. Ultrasensitive SERS detection of nucleic acids via simultaneous amplification of target-triggered enzyme-free recycling and multiple-reporter. Biosens. Bioelectron. 2019, 141, 111402. [Google Scholar] [CrossRef] [PubMed]
- Chen. Highly sensitive detection of cervical cancer biomarker miR-21 using surface-enhanced Raman scattering (SERS). Spectrochim. Acta. A. Mol. Biomol. Spectrosc. 2026, 344, 126725. [Google Scholar] [CrossRef]
- Lee, J. U.; Kim, W. H.; Lee, H. S.; Park, K. H.; Sim, S. J. Quantitative and Specific Detection of Exosomal miRNAs for Accurate Diagnosis of Breast Cancer Using a Surface-Enhanced Raman Scattering Sensor Based on Plasmonic Head-Flocked Gold Nanopillars. Small Weinh. Bergstr. Ger. 2019, 15, e1804968. [Google Scholar] [CrossRef] [PubMed]
- Masterson, N.; Liyanage, T.; Berman, C.; Kaimakliotis, H.; Johnson, M.; Sardar, R. A novel liquid biopsy-based approach for highly specific cancer diagnostics: mitigating false responses in assaying patient plasma-derived circulating microRNAs through combined SERS and plasmon-enhanced fluorescence analyses. The Analyst 2020, 145, 4173–4180. [Google Scholar] [CrossRef]
- Chu, Y. AI-assisted two-step enhanced SERS platform for rapid and ultra-sensitive detection of toxic molecules in biofluids. Biosens. Bioelectron. 2025, 289, 117868. [Google Scholar] [CrossRef]
- Chen, Q. Highly sensitive detection of glucose: A quantitative approach employing nanorods assembled plasmonic substrate. Talanta 2017, 165, 516–521. [Google Scholar] [CrossRef]
- Song, Z. Floating Ag-NPs@Cu-NW bundles fabricated on copper mesh for highly sensitive SERS detection of uric acid in pretreatment-free urine. The Analyst 2022, 147, 5670–5679. [Google Scholar] [CrossRef] [PubMed]
- Zhao; Blackburn, J.; Brosseau, C. L. Quantitative detection of uric acid by electrochemical-surface enhanced Raman spectroscopy using a multilayered Au/Ag substrate. Anal. Chem. 2015, 87, 441–447. [Google Scholar] [CrossRef]
- Durucan; Wu, K.; Viehrig, M.; Rindzevicius, T.; Boisen, A. Nanopillar-Assisted SERS Chromatography. ACS Sens. 2018, 3, 2492–2498. [Google Scholar] [CrossRef]
- Sivashanmugan, K.; Zhao, Y.; Wang, A. X. Tetrahydrocannabinol Sensing in Complex Biofluid with Portable Raman Spectrometer Using Diatomaceous SERS Substrates. Biosensors 2019, vol. 9(no. 4). [Google Scholar] [CrossRef] [PubMed]
- Shin, H.; Seo, D.; Choi, Y. Extracellular Vesicle Identification Using Label-Free Surface-Enhanced Raman Spectroscopy: Detection and Signal Analysis Strategies. Mol. Basel Switz. 2020, vol. 25(no. 21). [Google Scholar] [CrossRef] [PubMed]
- Feng, X.; Zhang, W.; Chang-Hao Tsao, S.; Shen, C.; Hu, L.; Wang, Y. Integrated Chemical Array and SERS Profiling of Plasma Small Extracellular Vesicles for Breast Cancer Diagnosis. Nano Lett. 2025, 25, 15331–15339. [Google Scholar] [CrossRef]
- Hou. A sandwich-type surface-enhanced Raman scattering sensor using dual aptamers and gold nanoparticles for the detection of tumor extracellular vesicles. The Analyst 2020, 145, 6232–6236. [Google Scholar] [CrossRef] [PubMed]
- Rojalin, T. Hybrid Nanoplasmonic Porous Biomaterial Scaffold for Liquid Biopsy Diagnostics Using Extracellular Vesicles. ACS Sens. 2020, 5, 2820–2833. [Google Scholar] [CrossRef]
- Lin, J. A novel blood plasma analysis technique combining membrane electrophoresis with silver nanoparticle-based SERS spectroscopy for potential applications in noninvasive cancer detection. Nanomed. Nanotechnol. Biol. Med. 2011, 7, 655–663. [Google Scholar] [CrossRef]
- Feng, S. Blood plasma surface-enhanced Raman spectroscopy for non-invasive optical detection of cervical cancer. The Analyst 2013, 138, 3967–3974. [Google Scholar] [CrossRef]
- Știufiuc, G. F. Solid Plasmonic Substrates for Breast Cancer Detection by Means of SERS Analysis of Blood Plasma. Nanomaterials 2020, 10, 1212. [Google Scholar] [CrossRef] [PubMed]
- Das, S. K.; Bhattacharya, T. S.; Ghosh, M.; Chowdhury, J. Probing blood plasma samples for the detection of diabetes using SERS aided by PCA and LDA multivariate data analyses. New J. Chem. 2021, 45, 2670–2682. [Google Scholar] [CrossRef]
- Witkowska, E.; Szymborski, T.; Kamińska, A.; Waluk, J. Polymer mat prepared via ForcespinningTM as a SERS platform for immobilization and detection of bacteria from blood plasma. Mater. Sci. Eng. C Mater. Biol. Appl. 2017, 71, 345–350. [Google Scholar] [CrossRef]
- Li. Three-Dimensional Hierarchical Plasmonic Nano-Architecture Enhanced Surface-Enhanced Raman Scattering Immunosensor for Cancer Biomarker Detection in Blood Plasma. ACS Nano 2013, 7, 4967–4976. [Google Scholar] [CrossRef]
- Chen, J. Integration of machine learning and SERS technology for precise classification and diagnosis of colon cancer from plasma samples. Spectrochim. Acta. A. Mol. Biomol. Spectrosc. 2026, 346, 126930. [Google Scholar] [CrossRef]
- Gu, X.; Wang, K.; Tian, S.; Shao, X.; Li, J.; Deng, A. A SERS/electrochemical dual-signal readout immunosensor using highly-ordered Au/Ag bimetallic cavity array as the substrate for simultaneous detection of three β-adrenergic agonists. Talanta 2023, 254, 124159. [Google Scholar] [CrossRef]
- Zhai, J. SERS/electrochemical dual-mode biosensor based on multi-functionalized molybdenum disulfide nanosheet probes and SERS-active Ag nanorods array electrodes for reliable detection of cancer-related miRNA. Sens. Actuators B Chem. 2022, 368, 132245. [Google Scholar] [CrossRef]
- Focsan, M. Flexible and Tunable 3D Gold Nanocups Platform as Plasmonic Biosensor for Specific Dual LSPR-SERS Immuno-Detection. Sci. Rep. 2017, 7, 14240. [Google Scholar] [CrossRef]
- Bartolini. Combining QCM and SERS on a Nanophotonic Chip: A Dual-Functional Sensor for Biomolecular Interaction Analysis and Protein Fingerprinting. Nanomaterials 2025, 15, 1230. [Google Scholar] [CrossRef]
- Zhuang, X.; Hu, Y.; Wang, J.; Hu, J.; Wang, Q.; Yu, X. A colorimetric and SERS dual-readout sensor for sensitive detection of tyrosinase activity based on 4-mercaptophenyl boronic acid modified AuNPs. Anal. Chim. Acta 2021, 1188, 339172. [Google Scholar] [CrossRef]
- Sun, K.; Liu, C.; Cao, Y.; Zhu, J.; Li, J.; Huang, Q. Colorimetric and SERS dual-mode detection of GSH in human serum based on AuNPs@Cu-porphyrin MOF nanozyme. Anal. Chim. Acta 2024, 1304, 342552. [Google Scholar] [CrossRef]
- Cha, M. G. High-throughput multiplex analysis method based on Fluorescence–SERS quantum Dot-Embedded silver bumpy nanoprobes. Appl. Surf. Sci. 2021, 558, 149787. [Google Scholar] [CrossRef]
- Yang, Z. SERS and fluorescence dual-mode sensing strategy based on competitive host-guest interaction for cholesterol and amantadine detection. Chin. J. Anal. Chem. 2025, 53, 100480. [Google Scholar] [CrossRef]
- Yu, W.; Lin, X.; Duan, N.; Wang, Z.; Wu, S. A fluorescence and surface-enhanced Raman scattering dual-mode aptasensor for sensitive detection of deoxynivalenol based on gold nanoclusters and silver nanoparticles modified metal-polydopamine framework. Anal. Chim. Acta 2023, 1244, 340846. [Google Scholar] [CrossRef]
- Chen, Y. Rooting in the synergistic collaboration of EDTA etching ZGGO:Cr,Pr phosphors and AgNPs@PVP nanozyme for phosphorescence/SERS/colorimetric trimodal assay of acetylcholinesterase activity. Sens. Actuators B Chem. 2025, 444, 138517. [Google Scholar] [CrossRef]
- Wang, W.-B. Internally coupled concave nanobox@quantum dots nanoassemblies for SERS/fluorescence/colorimetric trimodal detection of prognostic biomarker in acute ischemic stroke. Chem. Eng. J. 2025, 523, 168317. [Google Scholar] [CrossRef]
- Chai, X. Colorimetric/Fluorescent/SERS/Gas Pressure Four-Modal Sensing and Killing of Bacteria via Enzyme-Responsive Aggregation of Nanoparticles. Anal. Chem. 2025, 97, 23108–23119. [Google Scholar] [CrossRef]
- Qiu, G. Thermoplasmonic Regulation and In Situ Detection of Biomolecules with a Photothermal-Enhanced Plasmonic Biosensing System. ACS Nano 2025, 19, 16706–16717. [Google Scholar] [CrossRef]
- Gao, X. Paper-Based Surface-Enhanced Raman Scattering Lateral Flow Strip for Detection of Neuron-Specific Enolase in Blood Plasma. Anal. Chem. 2017, 89, 10104–10110. [Google Scholar] [CrossRef]
- Feng, S. Nasopharyngeal cancer detection based on blood plasma surface-enhanced Raman spectroscopy and multivariate analysis. Biosens. Bioelectron. 2010, 25, 2414–2419. [Google Scholar] [CrossRef]
- Feng, S. Gastric cancer detection based on blood plasma surface-enhanced Raman spectroscopy excited by polarized laser light. Biosens. Bioelectron. 2011, 26, 3167–3174. [Google Scholar] [CrossRef]
- Lussier, F.; Thibault, V.; Charron, B.; Wallace, G. Q.; Masson, J.-F. Deep learning and artificial intelligence methods for Raman and surface-enhanced Raman scattering. TrAC Trends Anal. Chem. 2020, 124, 115796. [Google Scholar] [CrossRef]
- Chen, B.; Sun, H.; Gao, J.; Chen, Z.; Qiu, X. Machine learning-enhanced SERS diagnostics: Accelerating the AI-powered transition from laboratory discoveries to clinical practice. Comput. Biol. Med. 2025, 194, 110490. [Google Scholar] [CrossRef]
- Yang, J. Application of serum SERS technology combined with deep learning algorithm in the rapid diagnosis of immune diseases and chronic kidney disease. Sci. Rep. 2023, 13, 15719. [Google Scholar] [CrossRef]
- Eiamchai. Determination of latent tuberculosis infection from plasma samples via label-free SERS sensors and machine learning. Biosens. Bioelectron. 2024, 250, 116063. [Google Scholar] [CrossRef]
- Kim, M. Surface-functionalized SERS platform for deep learning-assisted diagnosis of Alzheimer’s disease. Biosens. Bioelectron. 2024, 251, 116128. [Google Scholar] [CrossRef]
- Bai, X. Label-free detection of bladder cancer and kidney cancer plasma based on SERS and multivariate statistical algorithm. Spectrochim. Acta. A. Mol. Biomol. Spectrosc. 2022, 279, 121336. [Google Scholar] [CrossRef] [PubMed]
- Bertazioli; Piazza, M.; Carlomagno, C.; Gualerzi, A.; Bedoni, M.; Messina, E. An integrated computational pipeline for machine learning-driven diagnosis based on Raman spectra of saliva samples. Comput. Biol. Med. 2024, 171, 108028. [Google Scholar] [CrossRef] [PubMed]
- Engel, J. Breaking with trends in pre-processing? TrAC Trends Anal. Chem. 2013, 50, 96–106. [Google Scholar] [CrossRef]
- Chaudhry; Hu, G.; Ye, H.; Jensen, L. Toward Modeling the Complexity of the Chemical Mechanism in SERS. ACS Nano 2024, 18, 20835–20850. [Google Scholar] [CrossRef]
- Kumar, P. P.; Saxena, S.; Joshi, R. Advancements in SERS: Revolutionizing Biomedical Analysis and Applications. Nanotheranostics 2025, 9, 252–261. [Google Scholar] [CrossRef]
- Ge, H.; Gao, X.; Lin, J.; Zhao, X.; Wu, X.; Zhang, H. Label-free SERS detection of prostate cancer based on multi-layer perceptron surrogate model method. Spectrochim. Acta. A. Mol. Biomol. Spectrosc. 2024, 304, 123407. [Google Scholar] [CrossRef]
- Wang, Y. Multimodal convolutional neural networks based on the Raman spectra of serum and clinical features for the early diagnosis of prostate cancer. Spectrochim. Acta. A. Mol. Biomol. Spectrosc. 2023, 293, 122426. [Google Scholar] [CrossRef]
- Huda, N. ul; Bari, R. Z. A.; Javed, M. A.; Kiani, M. N.; Jin, Y. SERS Meets Artificial Intelligence: A New Frontier in Cancer Diagnosis and Prognosis. Anal. Chem. 2026, 98, 8757–8780. [Google Scholar] [CrossRef]
- Bratchenko, L. A. SERS-based technique for accessible and rapid diagnosis of multiple myeloma in blood serum analysis. Light Adv. Manuf. 2025, 6, 284–294. [Google Scholar] [CrossRef]
- Liu; Osadchy, M.; Ashton, L.; Foster, M.; Solomon, C. J.; Gibson, S. J. Deep convolutional neural networks for Raman spectrum recognition: a unified solution. Analyst 2017, 142, 4067–4074. [Google Scholar] [CrossRef]
- ‘Azo-Enhanced Raman Scattering for Enhancing the Sensitivity and Tuning the Frequency of Molecular Vibrations | ACS Central Science’. Available online: https://pubs.acs.org/doi/10.1021/acscentsci.1c00117?ref=pdf (accessed on Apr. 16 2026).
- Barton, S. J.; Hennelly, B. M. An Algorithm for the Removal of Cosmic Ray Artifacts in Spectral Data Sets. Appl. Spectrosc. 2019, 73, 893–901. [Google Scholar] [CrossRef]
- Pavelka, V.; Hemzal, D.; Hrbáč, J. Complex evaluation of Raman spectra using morphological filtering: Algorithms, software implementation, and experimental verification of baseline correction, peak recognition, and cosmic ray removal in SERS spectra of designer drugs. J. Raman Spectrosc. 2022, 53, 2100–2109. [Google Scholar] [CrossRef]
- Li, Q.; Dukes, P. V.; Lee, W.; Sarkis, M.; Vo-Dinh, T. Machine learning using convolutional neural networks for SERS analysis of biomarkers in medical diagnostics. J. Raman Spectrosc. 2022, 53, 2044–2057. [Google Scholar] [CrossRef] [PubMed]
- Cui, J.; Chen, X.; Zhao, Y. Beyond Traditional airPLS: Improved Baseline Removal in SERS with Parameter-Focused Optimization and Prediction. Anal. Chem. 2025, 97, 16211–16218. [Google Scholar] [CrossRef] [PubMed]
- Huang, X. SERS spectroscopy with machine learning to analyze human plasma derived sEVs for coronary artery disease diagnosis and prognosis. Bioeng. Transl. Med. 2023, 8, e10420. [Google Scholar] [CrossRef]
- Houhou; Bocklitz, T. Trends in artificial intelligence, machine learning, and chemometrics applied to chemical data. Anal. Sci. Adv. 2021, 2, 128–141. [Google Scholar] [CrossRef]
- Jolliffe, T.; Cadima, J. Principal component analysis: a review and recent developments. Philos. Trans. R. Soc. Math. Phys. Eng. Sci. 2016, 374, 20150202. [Google Scholar] [CrossRef]
- dos Santos, P.; Sena, M. M.; Almeida, M. R.; Mazali, I. O.; Olivieri, A. C.; Villa, J. E. L. Unraveling surface-enhanced Raman spectroscopy results through chemometrics and machine learning: principles, progress, and trends. Anal. Bioanal. Chem. 2023, 1–22. [Google Scholar] [CrossRef]
- Diao, X.; Li, X.; Hou, S.; Li, H.; Qi, G.; Jin, Y. Machine Learning-Based Label-Free SERS Profiling of Exosomes for Accurate Fuzzy Diagnosis of Cancer and Dynamic Monitoring of Drug Therapeutic Processes. Anal. Chem. 2023, 95, 7552–7559. [Google Scholar] [CrossRef]
- Nguyen, T. M. 3D Superclusters with Hybrid Bioinks for Early Detection in Breast Cancer. ACS Sens. 2024, 9, 699–707. [Google Scholar] [CrossRef]
- Farnesi. Point-of-care SERS-based ML diagnosis of head and neck cancer via cerumen analysis. npj Biosensing 2025, 2, 14. [Google Scholar] [CrossRef]
- Iancu, D. SERS-based detection of DNA methylation for cancer diagnosis: Cation-mediated adsorption to silver nanoparticles. PLoS ONE 2025, 20, e0325539. [Google Scholar] [CrossRef] [PubMed]
- van der Maaten; Hinton, G.; Rachmad, Y. Viualizing data using t-SNE. J. Mach. Learn. Res. 2008, 9, 2579–2605. [Google Scholar]
- Zhou, Y.; Sharpee, T. O. Using Global t-SNE to Preserve Intercluster Data Structure. Neural Comput. 2022, 34, 1637–1651. [Google Scholar] [CrossRef]
- Ralbovsky, M.; Lednev, I. K. Towards development of a novel universal medical diagnostic method: Raman spectroscopy and machine learning. Chem. Soc. Rev. 2020, 49, 7428–7453. [Google Scholar] [CrossRef]
- Cortes, C.; Vapnik, V. Support-vector networks. Mach. Learn. 1995, 20, 273–297. [Google Scholar] [CrossRef]
- Li, S.-X. Study of support vector machine and serum surface-enhanced Raman spectroscopy for noninvasive esophageal cancer detection. J. Biomed. Opt. 2013, 18, 27008. [Google Scholar] [CrossRef] [PubMed]
- Li, X. Study on spectral parameters and the support vector machine in surface enhanced Raman spectroscopy of serum for the detection of colon cancer. Laser Phys. Lett. 2015, 12, 115603. [Google Scholar] [CrossRef]
- Yu, Y. Label-free detection of nasopharyngeal and liver cancer using surface-enhanced Raman spectroscopy and partial lease squares combined with support vector machine. Biomed. Opt. Express 2018, 9, 6053–6066. [Google Scholar] [CrossRef]
- Kim, W. H. Rapid and Differential Diagnosis of Sepsis Stages Using an Advanced 3D Plasmonic Bimetallic Alloy Nanoarchitecture-Based SERS Biosensor Combined with Machine Learning for Multiple Analyte Identification. Adv. Sci. 2025, 12, 2414688. [Google Scholar] [CrossRef] [PubMed]
- Wei, Q. Rapid detection of drugs in blood using “molecular hook” surface-enhanced Raman spectroscopy and artificial intelligence technology for clinical applications. Biosens. Bioelectron. 2025, 267, 116855. [Google Scholar] [CrossRef]
- Dong. Early cancer detection by serum biomolecular fingerprinting spectroscopy with machine learning. eLight 2023, vol. 3(no. 1). [Google Scholar] [CrossRef]
- Han. Coupling annealed silver nanoparticles with a porous silicon Bragg mirror SERS substrate and machine learning for rapid non-invasive disease diagnosis. Anal. Chim. Acta 2023, 1254, 341116. [Google Scholar] [CrossRef]
- ‘Surface-enhanced Raman spectroscopy | Springer Nature Experiments’. Available online: https://experiments.springernature.com/nature/primers/10.1038/s43586-021-00083-6 (accessed on 16 May 2026).
- Tang; Xia, L.; Wei, D.; Yan, S.; Du, C.; Cui, H.-L. Distinguishing Different Cancerous Human Cells by Raman Spectroscopy Based on Discriminant Analysis Methods. Appl. Sci. 2017, 7, 900. [Google Scholar] [CrossRef]
- Lee, S.; Kim, J.-M.; Lee, K.; Cho, H.; Shin, S.; Kim, J. K. Diagnosis and classification of kidney transplant rejection using machine learning-assisted surface-enhanced Raman spectroscopy using a single drop of serum. Biosens. Bioelectron. 2024, 261, 116523. [Google Scholar] [CrossRef]
- Buhas, B. A. Label-Free SERS of Urine Components: A Powerful Tool for Discriminating Renal Cell Carcinoma through Multivariate Analysis and Machine Learning Techniques. Int. J. Mol. Sci. 2024, 25, 3891. [Google Scholar] [CrossRef]
- Zhang, D. Ultrasensitive Detection of Circulating Plasma Cells Using Surface-Enhanced Raman Spectroscopy and Machine Learning for Multiple Myeloma Monitoring. Anal. Chem. 2025, 97, 4101–4110. [Google Scholar] [CrossRef]
- Yuan, L. Plasma extracellular vesicle phenotyping for the differentiation of early-stage lung cancer and benign lung diseases. Nanoscale Horiz. 2023, 8, 746–758. [Google Scholar] [CrossRef] [PubMed]
- Li. Label-Free SERS Analysis of Serum Using Ag NPs/Cellulose Nanocrystal/Graphene Oxide Nanocomposite Film Substrate in Screening Colon Cancer. Nanomaterials 2023, 13, 334. [Google Scholar] [CrossRef]
- Brereton, R. G.; Lloyd, G. R. Partial least squares discriminant analysis: taking the magic away. J. Chemom. 2014, 28, 213–225. [Google Scholar] [CrossRef]
- Bratchenko, A. Comparative study of multivariative analysis methods of blood Raman spectra classification. J. Raman Spectrosc. 2020, 51, 279–292. [Google Scholar] [CrossRef]
- Data analysis in SERS diagnostics. In SERS for Point-of-care and Clinical Applications; Elsevier, 2022; pp. 1–51. [CrossRef]
- Liu; Jin, S.; Song, Z.; Jiang, L.; Ma, L.; Zhang, Z. Label-free surface-enhanced Raman spectroscopy of serum based on multivariate statistical analysis for the diagnosis and staging of lung adenocarcinoma. Vib. Spectrosc. 2019, 100, 177–184. [Google Scholar] [CrossRef]
- Lu, D.; Zhang, B.; Shangguan, Z.; Lu, Y.; Chen, J.; Huang, Z. Machine learning-based exosome profiling of multi-receptor SERS sensors for differentiating adenocarcinoma in situ from early-stage invasive adenocarcinoma. Colloids Surf. B Biointerfaces 2024, 236, 113824. [Google Scholar] [CrossRef]
- Seifert, S. Application of random forest based approaches to surface-enhanced Raman scattering data. Sci. Rep. 2020, 10, 5436. [Google Scholar] [CrossRef]
- Peng, S. Machine learning-assisted internal standard calibration label-free SERS strategy for colon cancer detection. Anal. Bioanal. Chem. 2023, 415, 1699–1707. [Google Scholar] [CrossRef]
- Dixon, K. Using Machine Learning and Silver Nanoparticle-Based Surface-Enhanced Raman Spectroscopy for Classification of Cardiovascular Disease Biomarkers. ACS Appl. Nano Mater. 2023, 6, 15385–15396. [Google Scholar] [CrossRef]
- Singh; Gupta, S.; Gupta, V. Multi-objective hyperparameter optimization on gradient-boosting for breast cancer detection. Int. J. Syst. Assur. Eng. Manag. 2024, 15, 1676–1686. [Google Scholar] [CrossRef]
- Brain tumor classifications by gradient and XG boosting machine learning models. In Predictive Modeling in Biomedical Data Mining and Analysis; Academic Press, 2022; pp. 123–136. [CrossRef]
- Lin, S. Machine Learning-assisted Ultrasensitive SERS Immunoassays Across Wide Concentration Ranges Toward Clinical Ovarian Cancer Diagnosis. Adv. Funct. Mater. 2025, 35, e09813. [Google Scholar] [CrossRef]
- Liu, Y. Interpretable Machine Learning-Aided Optical Deciphering of Serum Exosomes for Early Detection, Staging, and Subtyping of Lung Cancer. Anal. Chem. 2024, 96, 16227–16235. [Google Scholar] [CrossRef]
- Weng, S. Deep learning networks for the recognition and quantitation of surface-enhanced Raman spectroscopy. Analyst 2020, 145, 4827–4835. [Google Scholar] [CrossRef]
- Lin, X. High Throughput Blood Analysis Based on Deep Learning Algorithm and Self-Positioning Super-Hydrophobic SERS Platform for Non-Invasive Multi-Disease Screening. Adv. Funct. Mater. 2021, 31, 2103382. [Google Scholar] [CrossRef]
- Debus, B.; Parastar, H.; Harrington, P.; Kirsanov, D. Deep learning in analytical chemistry. TrAC Trends Anal. Chem. 2021, 145, 116459. [Google Scholar] [CrossRef]
- Xiong, C.-C. Rapid and precise detection of cancers via label-free SERS and deep learning. Anal. Bioanal. Chem. 2023, 415, 3449–3462. [Google Scholar] [CrossRef]
- Liu, J.; Osadchy, M.; Ashton, L.; Foster, M.; Solomon, C. J.; Gibson, S. J. Deep convolutional neural networks for Raman spectrum recognition: a unified solution. Analyst 2017, 142, 4067–4074. [Google Scholar] [CrossRef]
- Sun, X. Accurate diagnosis of thyroid cancer using a combination of surface-enhanced Raman spectroscopy of exosome on MXene-coated gold@silver core@shell nanoparticle substrate and deep learning. Chem. Eng. J. 2024, 488, 150835. [Google Scholar] [CrossRef]
- Wang. New label-free serum exosomes detection method based on hierarchical SERS substrate for diagnosis of pancreatic cancer using AI. Sens. Actuators B Chem. 2025, 433, 137588. [Google Scholar] [CrossRef]
- Resmi, N. Ultrasensitive Detection of Blood-Based Alzheimer’s Disease Biomarkers: A Comprehensive SERS-Immunoassay Platform Enhanced by Machine Learning. ACS Chem. Neurosci. 2024, 15, 4390–4401. [Google Scholar] [CrossRef]
- Tahir, A.; Dina, N. E.; Cheng, H.; Valev, V. K.; Zhang, L. Surface-enhanced Raman spectroscopy for bioanalysis and diagnosis. Nanoscale 2021, 13, 11593–11634. [Google Scholar] [CrossRef]
- Tang, J.; Henderson, A.; Gardner, P. Exploring AdaBoost and Random Forests machine learning approaches for infrared pathology on unbalanced data sets. Analyst 2021, 146, 5880–5891. [Google Scholar] [CrossRef]
- He, Y. Bai; Garcia, E. A.; Li, S. ADASYN: Adaptive synthetic sampling approach for imbalanced learning. 2008 IEEE International Joint Conference on Neural Networks (IEEE World Congress on Computational Intelligence), Jun. 2008; pp. 1322–1328. [Google Scholar] [CrossRef]
- Sun; Wang, Z.; Jia, L.; Xu, Z. SMOTE-kTLNN: A hybrid re-sampling method based on SMOTE and a two-layer nearest neighbor classifier. Expert Syst. Appl. 2024, 238, 121848. [Google Scholar] [CrossRef]
- Zeng; Zou, B.; Wei, F.; Liu, X.; Wang, L. Effective prediction of three common diseases by combining SMOTE with Tomek links technique for imbalanced medical data. 2016 IEEE International Conference of Online Analysis and Computing Science (ICOACS), May 2016; pp. 225–228. [Google Scholar] [CrossRef]
- Lin, Y. Multi-cancer early detection based on serum surface-enhanced Raman spectroscopy with deep learning: a large-scale case–control study. BMC Med. 2025, 23, 97. [Google Scholar] [CrossRef]
- Frischia, S. D.; Giammatteo, P.; Angelini, F.; Spizzichino, V.; Santis, E. D.; Pomante, L. Enhanced Data Augmentation using GANs for Raman Spectra Classification. presented at the 2020 IEEE International Conference on Big Data (Big Data), Dec. 2020; IEEE Computer Society; pp. 2891–2898. [Google Scholar] [CrossRef]
- Mandrekar, N. Simple statistical measures for diagnostic accuracy assessment. J. Thorac. Oncol. Off. Publ. Int. Assoc. Study Lung Cancer 2010, 5, 763–764. [Google Scholar] [CrossRef]
- Gurian, E. Repeated double cross-validation applied to the PCA-LDA classification of SERS spectra: a case study with serum samples from hepatocellular carcinoma patients. Anal. Bioanal. Chem. 2021, 413, 1303–1312. [Google Scholar] [CrossRef]
- Mi, Y. Diagnosis of neuropsychiatric systemic lupus erythematosus by label-free serum microsphere-coupled SERS fingerprints with machine learning. Biosens. Bioelectron. 2024, 260, 116414. [Google Scholar] [CrossRef]
- Shu, W. An Alloy Platform of Dual-Fingerprints for High-Performance Stroke Screening. Adv. Funct. Mater. 2023, 33, 2210267. [Google Scholar] [CrossRef]
- Guo, S.; Bocklitz, T.; Neugebauer, U.; Popp, J. Common mistakes in cross-validating classification models. Anal. Methods 2017, 9, 4410–4417. [Google Scholar] [CrossRef]
- Lloyd, G. R.; Hutchings, J.; Almond, L. M.; Barr, H.; Kendall, C.; Stone, N. Assessing the performance of spectroscopic models for cancer diagnostics using cross-validation and permutation testing. In Biomedical Vibrational Spectroscopy V: Advances in Research and Industry; SPIE, Feb 2012; pp. 65–70. [Google Scholar] [CrossRef]
- Kim, M. Surface-functionalized SERS platform for deep learning-assisted diagnosis of Alzheimer’s disease. Biosens. Bioelectron. 2024, 251, 116128. [Google Scholar] [CrossRef]
- Preechakul; Sriswasdi, S.; Kijsirikul, B.; Chuangsuwanich, E. Improved image classification explainability with high-accuracy heatmaps. iScience 2022, 25, 103933. [Google Scholar] [CrossRef]
- Mishra; Malhotra, M. A Dual Approach with Grad-CAM and Layer-Wise Relevance Propagation for CNN Models Explainability. In Innovation and Emerging Trends in Computing and Information Technologies; Malhotra, M., Ed.; Springer Nature Switzerland: Cham, 2025; pp. 116–129. [Google Scholar] [CrossRef]
- Sattarzadeh, S.; Sudhakar, M.; Plataniotis, K. N.; Jang, J.; Jeong, Y.; Kim, H. Integrated Grad-Cam: Sensitivity-Aware Visual Explanation of Deep Convolutional Networks Via Integrated Gradient-Based Scoring. in ICASSP 2021—2021 IEEE International Conference on Acoustics, Speech and Signal Processing (ICASSP), Jun. 2021; pp. 1775–1779. [Google Scholar] [CrossRef]
- ‘Enhancing trust and interpretability of complex machine learning models using local interpretable model agnostic shap explanations | springerprofessional.de’. Available online: https://link.springer.com/article/10.1007/s41060-023-00458-w (accessed on 16 May 2026).
- Nohara, Y.; Matsumoto, K.; Soejima, H.; Nakashima, N. Explanation of Machine Learning Models Using Improved Shapley Additive Explanation. In in Proceedings of the 10th ACM International Conference on Bioinformatics, Computational Biology and Health Informatics, in BCB ’19, New York, NY, USA, Sep. 2019; Association for Computing Machinery; p. 546. [Google Scholar] [CrossRef]
- Yuan. Plasma extracellular vesicle phenotyping for the differentiation of early-stage lung cancer and benign lung diseases. Nanoscale Horiz. 2023, 8, 746–758. [Google Scholar] [CrossRef]
- Li, J. Label-Free SERS Analysis of Serum Using Ag NPs/Cellulose Nanocrystal/Graphene Oxide Nanocomposite Film Substrate in Screening Colon Cancer. Nanomaterials 2023, 13, 334. [Google Scholar] [CrossRef]
- Buhas, B. A. Label-Free SERS of Urine Components: A Powerful Tool for Discriminating Renal Cell Carcinoma through Multivariate Analysis and Machine Learning Techniques. Int. J. Mol. Sci. 2024, 25, 3891. [Google Scholar] [CrossRef] [PubMed]
- Bratchenko, A. SERS-based technique for accessible and rapid diagnosis of multiple myeloma in blood serum analysis. Light Adv. Manuf. 2025, 6, 284–294. [Google Scholar] [CrossRef]
- Wei. Rapid detection of drugs in blood using “molecular hook” surface-enhanced Raman spectroscopy and artificial intelligence technology for clinical applications. Biosens. Bioelectron. 2025, 267, 116855. [Google Scholar] [CrossRef]
- Lee, J.-M.; Kim; Lee, K.; Cho, H.; Shin, S.; Kim, J. K. Diagnosis and classification of kidney transplant rejection using machine learning-assisted surface-enhanced Raman spectroscopy using a single drop of serum. Biosens. Bioelectron. 2024, 261, 116523. [Google Scholar] [CrossRef]
- Zhang, D. Ultrasensitive Detection of Circulating Plasma Cells Using Surface-Enhanced Raman Spectroscopy and Machine Learning for Multiple Myeloma Monitoring. Anal. Chem. 2025, 97, 4101–4110. [Google Scholar] [CrossRef]
- Chen. Label-Free Multiplex Profiling of Exosomal Proteins with a Deep Learning-Driven 3D Surround-Enhancing SERS Platform for Early Cancer Diagnosis. Anal. Chem. 2024, 96, 6794–6801. [Google Scholar] [CrossRef]
- Yang, Y. Rapid enrichment and SERS differentiation of various bacteria in skin interstitial fluid by 4-MPBA-AuNPs-functionalized hydrogel microneedles. J. Pharm. Anal. 2025, 15, 101152. [Google Scholar] [CrossRef]
- Nguyen, M. Microcapillary-Derived Plasmonic-Enhanced Cluster through the Self-Assembly Process for Breast Cancer Diagnosis. ACS Sens. 2025, 10, 2589–2597. [Google Scholar] [CrossRef]
- Sloan-Dennison; Wallace, G. Q.; Hassanain, W. A.; Laing, S.; Faulds, K.; Graham, D. Advancing SERS as a quantitative technique: challenges, considerations, and correlative approaches to aid validation. Nano Converg. 2024, 11, 33. [Google Scholar] [CrossRef] [PubMed]
- Deriu, C.; Fabris, L. A surface chemistry perspective on SERS: revisiting the basics to push the field forward. Chem. Soc. Rev. 2025, 54, 5224–5247. [Google Scholar] [CrossRef]
- Deriu, C.; Thakur, S.; Tammaro, O.; Fabris, L. Challenges and opportunities for SERS in the infrared: materials and methods. Nanoscale Adv. 2023, 5, 2132–2166. [Google Scholar] [CrossRef] [PubMed]
- Jamieson, L. E.; Asiala, S. M.; Gracie, K.; Faulds, K.; Graham, D. Bioanalytical Measurements Enabled by Surface-Enhanced Raman Scattering (SERS) Probes. Annu. Rev. Anal. Chem. 2017, 10, 415–437. [Google Scholar] [CrossRef] [PubMed]
- Li, Y.; Lee, J.-S. Insights into Characterization Methods and Biomedical Applications of Nanoparticle–Protein Corona. Materials 2020, 13, 3093. [Google Scholar] [CrossRef]
- Bell, S. E. J. Towards Reliable and Quantitative Surface-Enhanced Raman Scattering (SERS): From Key Parameters to Good Analytical Practice. Angew. Chem. Int. Ed. 2020, 59, 5454–5462. [Google Scholar] [CrossRef]
- Goodacre, R.; Graham, D.; Faulds, K. Recent developments in quantitative SERS: Moving towards absolute quantification. TrAC Trends Anal. Chem. 2018, 102, 359–368. [Google Scholar] [CrossRef]
- Cialla-May, D. Biomedical SERS–the current state and future trends. Chem. Soc. Rev. 2024, 53, 8957–8979. [Google Scholar] [CrossRef]
- Baranska; Byrne, H. J.; Gardner, P.; Henderson, A.; Stone, N.; Wood, B. The international society for clinical spectroscopy; reflections on the first 10 years. The Analyst 2025, 150, 3237–3246. [Google Scholar] [CrossRef]
- Fornasaro, S. Surface Enhanced Raman Spectroscopy for Quantitative Analysis: Results of a Large-Scale European Multi-Instrument Interlaboratory Study. Anal. Chem. 2020, 92, 4053–4064. [Google Scholar] [CrossRef]
- Guo, S. Comparability of Raman Spectroscopic Configurations: A Large Scale Cross-Laboratory Study. Anal. Chem. 2020, 92, 15745–15756. [Google Scholar] [CrossRef]
- Gobbato, R.; Fornasaro, S.; Sergo, V.; Bonifacio, A. Direct comparison of different protocols to obtain surface enhanced Raman spectra of human serum. Spectrochim. Acta. A. Mol. Biomol. Spectrosc. 2024, 317, 124390. [Google Scholar] [CrossRef]
Figure 1.
Illustration of SERS measurements based on Stokes/anti-Stokes scattering.

Figure 2.
Schematic of SERS mechanisms. (A) incident light interacts with molecules adsorbed on the surface of plasmonic nanoparticles. (B) a depiction of hotspots from interparticle gap. (C) Charge transfer (CT) enhancement mechanism based on energy difference between molecular orbitals. (D) overview of label-free SERS measurement. (E) Labelled SERS substrate. (F) utilising nanotags/probes in SERS measurements.

Figure 3.
(Top) Mean SERS spectra of filtrate portions of healthy and tuberculosis positive blood serum samples with standard deviation. (Bottom). Pair-wise PCA analysis. (a) Scatter plot and (b) loadings between SERS spectral datasets of filtrate portions of healthy and tuberculosis disease samples. [Source: Reprinted from Kamran Ali et al., 2024 [15]. 2024 American Chemical Society. Creative Commons Attribution Non-Commercial 3.0 Unported (CC-BY-NC)].

Figure 4.
(Top). Schematic illustration of the SERS-based immunoassay: (a) glass slide was modified with diatom frustules. (b) shows an SEM image of a portion of the modified slide; (c) antibody capture and immobilization using the SERS immunosensor for interleukin 8 detection (d) shows a close-up illustrating the bonding to the antibody. Bottom (Left) (a). SERS spectrum of DTNB (Raman reporter) adsorbed onto AuNPs. (b). SERS spectrum of DTNB-labelled immune-AuNPs. Bottom (Right). (a) Reproducibility of three separately prepared SERS immunoassays exposed to different concentrations of IL-8 in blood plasma (0.1, 0.5, and 30.0 ng mL−1). SERS spectra recorded at randomly selected spots on the substrate in each SERS assay. (b) Representative two-dimensional SERS spectra recorded in SERS assays of 30.0 ng mL−1 IL-8 performed at different spots on the SERS surface at 632 nm. [Source: Reprinted from Kamińska et al., 2017 [61]. 2017 Springer Nature. Creative Commons Attribution 4.0 (CC-BY-4.0)].

Figure 5.
Scanning electron microscopy (SEM) representative micrographs, illustrating the morphological characteristics of native AgNSs, or plasma–AgNS incubates. (A) AgNSs in their native form. (B) AgNS incubated with plasma for 15 min. (C) AgNS incubated with plasma overnight [Source: From Freitas et al., 2025 [17]. 2025 MDPI Creative Commons License (CC-BY)].

Figure 6.
Mean and difference spectra of early-stage LC and HC for unprocessed plasma (A), plasma at pH 7 (C), and plasma at pH 5 (E). Three-dimensional PCA score plots for unprocessed plasma (B), plasma at pH 7 (D), and plasma at pH 5 (F). [Source: Reprinted with permission from Lu Dechan et al., 2025 [80]. 2025 American Chemical Society].

Figure 7.
Left. Superposition of the normalized UV-VIS absorption spectra of AgHya colloid recorded before (red curve) and after (blue curve) TFF purification. The optical image of the purified colloid together with the statistical analysis of their dimensions are shown in the inset. Right. Overlapping of the mean SER spectra recorded on the blood plasma samples collected from HC (green spectrum) and BC patients (red spectrum) recorded on SSPSs using a 785 nm excitation laser. The spectra were normalized to the 640 cm−1 peak. [Source: Reprinted from Știufiuc, et al., [159] MDPI Creative Commons License (CC-BY)].

Figure 8.
Schematic illustration of conjugation of the (a) SERS probe (sandwich nanoparticle) to the detection antibody and (b) Au triangle nanoarray chip to the capture antibody. (c) Schematic illustration of the operating principle of SERS immunosensor for biomarker detection. [Sourced: Reprinted with permission from Li Ming et al., 2013 [162]. 2013 American Chemical Society].

Figure 9.
Top. Sequential steps for the formation of a SERS-based multiplex immunoassay. (A) The capturing substrate, (B) the mixture of interleukins (IL-6, IL-8, IL-18) in human blood plasma injection, (C) the parallel approach (D) the simultaneous multiplex configuration. Middle (Left). (a,b,c) SERS spectra of FC, p-MBA, and DTNB adsorbed onto AuNPs (Raman reporter-AuNPs), and (a.b.c’) SERS spectra of FC, p-MBA, and DTNB–labelled immune AuNPs (antibody-Raman reporter-AuNPs), respectively. Middle (Right). The concentration–intensity calibration curves obtained for simultaneous multiplexed detection of three IL-6, IL-8, and IL-18 interleukins from blood plasma samples. Each SERS spectrum was averaged from 20 measurements at different places across the SERS surface using the mapping mode. The error bars indicate the standard deviations from twenty measurements at different spots for each concentration. Bottom (A). SERS responses in the DA-1 chamber of microfluidic immunoassay during detection of IL-18 in human blood plasma sample according to the subsequent steps of parallel approach: (a) after the mixture of equal amounts of three kinds of Raman reporter-labeled Au nanoparticles was delivered and incubated (5 min) onto the anti-IL18 modified Ag-Au SERS-active surface; (b–f) after subsequent washing by PBS buffer solution. Bottom (B). Typical SERS responses for increasing concentration of target IL-6, IL-8, and IL-18 interleukins in blood plasma during a simultaneous multiplexed approach. [Source: Reprinted from Kamińska et al., 2017 [77]. 2017 Springer Nature. Creative Commons Attribution 4.0 (CC-BY-4.0)].

Figure 10.
Schematic of the data preprocessing and processing methods used for SERS spectra interpretation.
Figure 10.
Schematic of the data preprocessing and processing methods used for SERS spectra interpretation.


Table 1.
Summary of some direct/label-free and indirect/labelled SERS assays for different pathologic conditions in blood plasma.
Table 1.
Summary of some direct/label-free and indirect/labelled SERS assays for different pathologic conditions in blood plasma.
| Substrate | Target analyte | Pathology | Chemometrics | Total sample | Ref. |
|---|---|---|---|---|---|
| AuNP Sp colloid | Antiretroviral drug: Emtricitabine (FTC) | HIV ART compliance | Qi CDF, PCA | NA | [20] |
| AgNP Sp Colloid | Plasma | Nasopharyngeal cancer | PCA LDA | 76 | [178] |
| Colloidal AgNP Sp | Plasma | Gastric cancer | PCA LDA | 65 | [179] |
| AgNP Sp colloid | Plasma | Cervical cancer | PCA LDA | 110 | [158] |
| AgNP Sp colloid | Plasma | Colorectal cancer | PLS LDA | 69 | [81] |
| AgNP Stars | Plasma | Stroke | PCA Light GBM | NA | [17] |
| AuBP@Ab | Cardiac troponin I (cTnI) | Acute myocardial infarction (AMI) | PV (NPV, PPV) | 80 | [84] |
| AuNP Sp@5-CB | Glucose | Diabetes | PCA LDA | 30 | [160] |
| BC@4-MP@Ag NP | Plasma | Colorectal cancer | PCA, ML (DT, KNN, RF, SVM) | 40 | [163] |
| 3D-AgNP@Polymer | Plasma | Kidney and bladder cancers | PCA LDA | 66 | [49] |
| AuNW, SAM, 6E10 Ab. | Aβ(1–42) & metabolites | Alzheimer’s | DL (ffNN), AI (IG) | 40 | [18] |
| AgNP Sp | Plasma | Acute myeloid leukaemia | CRT, ANOVA | 222 | [10] |
| Au bipyramid@PLFS | S-100β | TBI (Traumatic Brain Injury) | Linear regression analysis | NA | [32] |
| Au_ZnO@Ag@anti-Aβ42/ anti-tau | Aβ peptides, tau proteins | Alzheimer’s disease | LDA | 17 | [89] |
Table 2.
Contemporary cohort review summary.
| Computational Category | Papers | Primary Model Implementations | Common Deep Learning Features | Evaluation Metrics | Observed Accuracy and Performance Range |
|---|---|---|---|---|---|
| Classical Machine Learning & Statistical Discriminants | [215,217,218,230,232,233,256,265,266] [49,267,268,269,270,271] |
|
|
|
84% to 100% (Typically achieving >90% for well-separated clinical conditions) |
| Deep Learning | [241,259,272,273], [245,274] |
|
|
|
95% to 98.5% (Highly stable and effective without requiring manual feature selection) |
| Advanced Pre-trained & Residual Backbones | [182,243], |
|
|
|
86% to 98% (Lower end represents complex sub-disease staging; higher end represents binary diagnostic splits) |
| Data Augmentation, Resampling & AutoML Pipelines |
[236,237,251] |
|
|
|
93% to 100% (Optimized explicitly to handle highly unbalanced or highly asymmetrical clinical datasets) |
| Interpretability & Explainable AI (XAI) Frameworks | [18,237,251] |
|
|
|
94.7% to 100%(Provides transparency by tracing decision weights directly back to biochemical peaks) |
Table 3.
Structured overview of data paradigms in recent SERS-based AI studies.
| Category | Subtype | Description | Representative studies |
|---|---|---|---|
| Biological matrix | Liquid biopsy matrices | Spectra derived from serum, plasma, and urine used as primary diagnostic media | [49,217,222] |
| Subcellular/vesicle-based systems | Isolation of exosomes or circulating vesicles to reduce biochemical background noise | [223,237,244] | |
| Controlled/spiked systems | Synthetic or controlled environments (animal serum or spiked drug solutions) for calibration and mechanistic modelling | [49,233,273] | |
| Cohort scale | Exploratory clinical datasets | Small-scale patient cohorts used for proof-of-concept modelling | [221], [218,259] |
| Expanded spectral representations (“patient-to-spectrum inflation”) | Multiple spectral acquisitions per patient used to augment dataset size for deep learning training | [244] | |
| Large-scale clinical cohorts | Multi-centre or high-sample datasets enabling population-level validation | [217,237,251] | |
| Validation strategy | Static holdout splits | Fixed train/test partitions (e.g., 70:30, 80:20) used for baseline evaluation | [31,38,244] |
| k-fold cross-validation | Iterative resampling (typically 5- or 10-fold) for robustness under limited sample sizes | [221,259] | |
| External / allopatric validation | Independent geographically separated cohorts used for true generalisability testing | [217,237] |
Disclaimer/Publisher’s Note: The statements, opinions and data contained in all publications are solely those of the individual author(s) and contributor(s) and not of MDPI and/or the editor(s). MDPI and/or the editor(s) disclaim responsibility for any injury to people or property resulting from any ideas, methods, instructions or products referred to in the content. |
© 2026 by the authors. Licensee MDPI, Basel, Switzerland. This article is an open access article distributed under the terms and conditions of the Creative Commons Attribution (CC BY) license (http://creativecommons.org/licenses/by/4.0/).
Copyright: This open access article is published under a Creative Commons CC BY 4.0 license, which permit the free download, distribution, and reuse, provided that the author and preprint are cited in any reuse.


