
Preprint
Article

This version is not peer-reviewed.

Understanding the Impact of Different Nucleation Strategies on bis(2-Hydroxyethyl) Terephthalate Crystallization from a Glycolysis Reaction Mixture

Submitted:

05 May 2026

Posted:

05 May 2026

You are already at the latest version

Abstract
The recycling of polyethylene terephthalate (PET) is gaining increasing importance, as it enables the conversion of plastic waste into valuable raw materials and contributes to a circular economy. Recent research has primarily focused on optimizing the depolymerization step of PET glycolysis, while downstream processes often overlooking the at least equally critical downstream steps in recovering the monomer bis(2-hydroxyethyl) terephthalate (BHET). The implementation of a water‑free PET glycolysis process eliminates challenges related to internal solvent and homogeneous catalyst recycling that commonly occur in conventional processes. This study therefore focuses on BHET crystallization and filtration as key downstream unit operations. Two nucleation strategies, gassing and seeding, were investigated and compared with experiments without a nucleation strategy. The aim was to achieve reproducible process control during crystallization and to obtain crystals with good filterability, which is essential for efficient washing and high product purity. Experiments without a nucleation strategy showed poor reproducibility. In contrast, gassing and seeding improved crystallization control, particularly regarding nucleation temperature and relative crystallization yield. However, these strategies also resulted in significantly prolonged filtration times due to differences in filter cake properties. The anisotropic crystals exhibited a broad particle size distribution with a high fraction of fine particles, leading to small and heterogeneous pores in the filter cake. Limited crystal growth was identified as the main cause of the unfavorable filtration behavior.
Keywords: 
;  ;  ;  ;  

1. Introduction

Plastic is a pivotal material in the packaging industry, with global production volumes exhibiting a consistent upward trend. The associated use of fossil raw materials and limited material recycling to date contribute significantly to climate and environmental pollution [1,2]. In 2021, approximately 30 million tons of polyethylene terephthalate PET were produced worldwide and rising demand for utilization in the packaging and textile industries [3]. A considerable proportion of this is not disposed of in an appropriate manner, which poses a significant environmental problem due to its extremely poor biodegradability [4]. The most established recycling strategy is mechanical recycling, but this reaches its limits with highly contaminated PET waste streams and does not allow the production of virgin-like PET [5]. Chemical recycling offers the possibility of depolymerizing PET waste, irrespective of its impurities, into monomeric components, which can then be repolymerized into pure virgin-like PET again [6,7,8].
A wide variety of depolymerizations can be carried out for this purpose, like hydrolysis, methanolysis, or glycolysis, respectively [9,10,11]. In recent years, the focus has been primarily on PET glycolysis, with optimal reaction conditions such as temperature and pressure being examined on the one hand, and different catalysts or co-solvents on the other. Within glycolysis high conversion rates are already achieved using the non-toxic reactant ethylene glycol (EG) and mild process conditions of 190 °C and ambient pressure. Furthermore, the material system, which after the reaction contains only BHET as a monomer and EG as main components, facilitates purification in further downstream processes [11]. Nevertheless, the reaction requires a catalyst to accelerate depolymerization and render the reaction economical [9,12,13,14]. A wide variety of catalysts such as ZnAc2, Mn(OAc)2, and EtONa can be used for glycolysis, exhibiting high conversion rates up to 97 % [9,15]. Zinc acetate (ZnAc2) has been identified as the optimal catalyst, as evidenced by studies that have demonstrated its efficacy in enhancing reaction kinetics and the low costs. [10,16].
While the reaction is an important part of the overall process, it is also essential to consider the downstream process for the isolation of the BHET product [9,10,13,17,18,19,20,21]. The most common method for separating BHET in the downstream is crystallization. In most cases, the process of crystallization is accompanied by the addition of water, with the objective of enhancing the yield of the desired crystalline product. Goh et al. demonstrated that utilizing a 5:1 mass ratio of distilled water to solid BHET product into the solution results in optimal yield and product purity during the crystallization process [22]. This hypothesis was confirmed by Duque-ingunza et al., who attained an yield of 90 % by adding distilled water and utilizing a crystallization end temperature of 0.5 °C [23]. Furthermore, Goh et al. and Huang et al. demonstrated that recrystallization of BHET in water can lead to purification of BHET [22,24]. Lee et al. revealed that the decrease of viscosity by adding distilled water fastened the nucleation rates and favoring needle-like crystal with an average diameter over 180 µm [25]. Another possibility is offered by the process of evaporation crystallization. This was replicated through a two-stage evaporation crystallization process under different temperatures and pressures to study efficiency and product quality, as outlined by Goh et al. [26]. Higher temperatures and lower pressures improved evaporator performance but increased energy demand and reduced BHET recovery [26]. Furthermore, Raheema et al. were also able to demonstrate yields of over 98 % in their simulations of evaporation crystallization [27]. Yuan et al. conducted a study to ascertain the effect of various factors on the final particle size and size distribution. The factors investigated included the stirring rate, the mass of seed crystal, the crystallization time, and the use of Tween-80 and water as emulsifiers. The addition of water and Tween-80 to the solution resulted in the formation of the largest crystals observed, with an average particle diameter of 1300 µm and a size distribution width given as span of 1.72 [28].
However, the strong temperature dependent solubility of BHET in the reaction mixture offers ideal conditions to crystallize BHET without the addition of a third component, solely through cooling crystallization [29,30]. Zangana et al. and Javed et al. conducted cooling crystallizations directly from the reaction mixture, but these were only for the analysis of the solid BHET and not subject to any systematic investigations [9,31]. Grause et al. conducted theoretical kinetic parameter studies in cooling crystallization from the glycolysis reaction mixture utilizing gPROMS for simulations, with the objective of optimizing and comparing the equipment costs of a batch and continuous process [32]. Schlüter et al. investigated a water-free cooling crystallization from the glycolysis reaction mixture [29]. These investigations demonstrated that a water-free downstream process can be implemented. It was demonstrated that the most significant challenge is a growth limitation of BHET crystals. In this study only proof of principle experiments with different stirrer speeds, cooling profiles, and nucleation control strategies were conducted, but no enhancement in crystal growth in the individual experiments was found. Based on these single experiments, it is still necessary to conduct more systematic investigations according to reproducibility of the results and to different nucleation strategies in order to promote crystal growth.
Gassing crystallization was introduced by Wohlgemuth et al. as alternative to seeding to control nucleation [33]. It describes the introduction of gas bubbles into the supersaturated solution, which leads to the creation of additional surface area, thereby causing primary heterogeneous nucleation even at low supersaturations. This is achieved by lowering the free nucleation enthalpy, thus enabling early crystal growth [34,35,36]. Earlier nucleation has been demonstrated to facilitate prolonged growth, with the potential to get larger crystals [37]. Previous studies have shown that the gas volume flow has no influence [36]. However, these studies only referred to low-viscosity material systems, which is why this influencing factor was reconsidered.
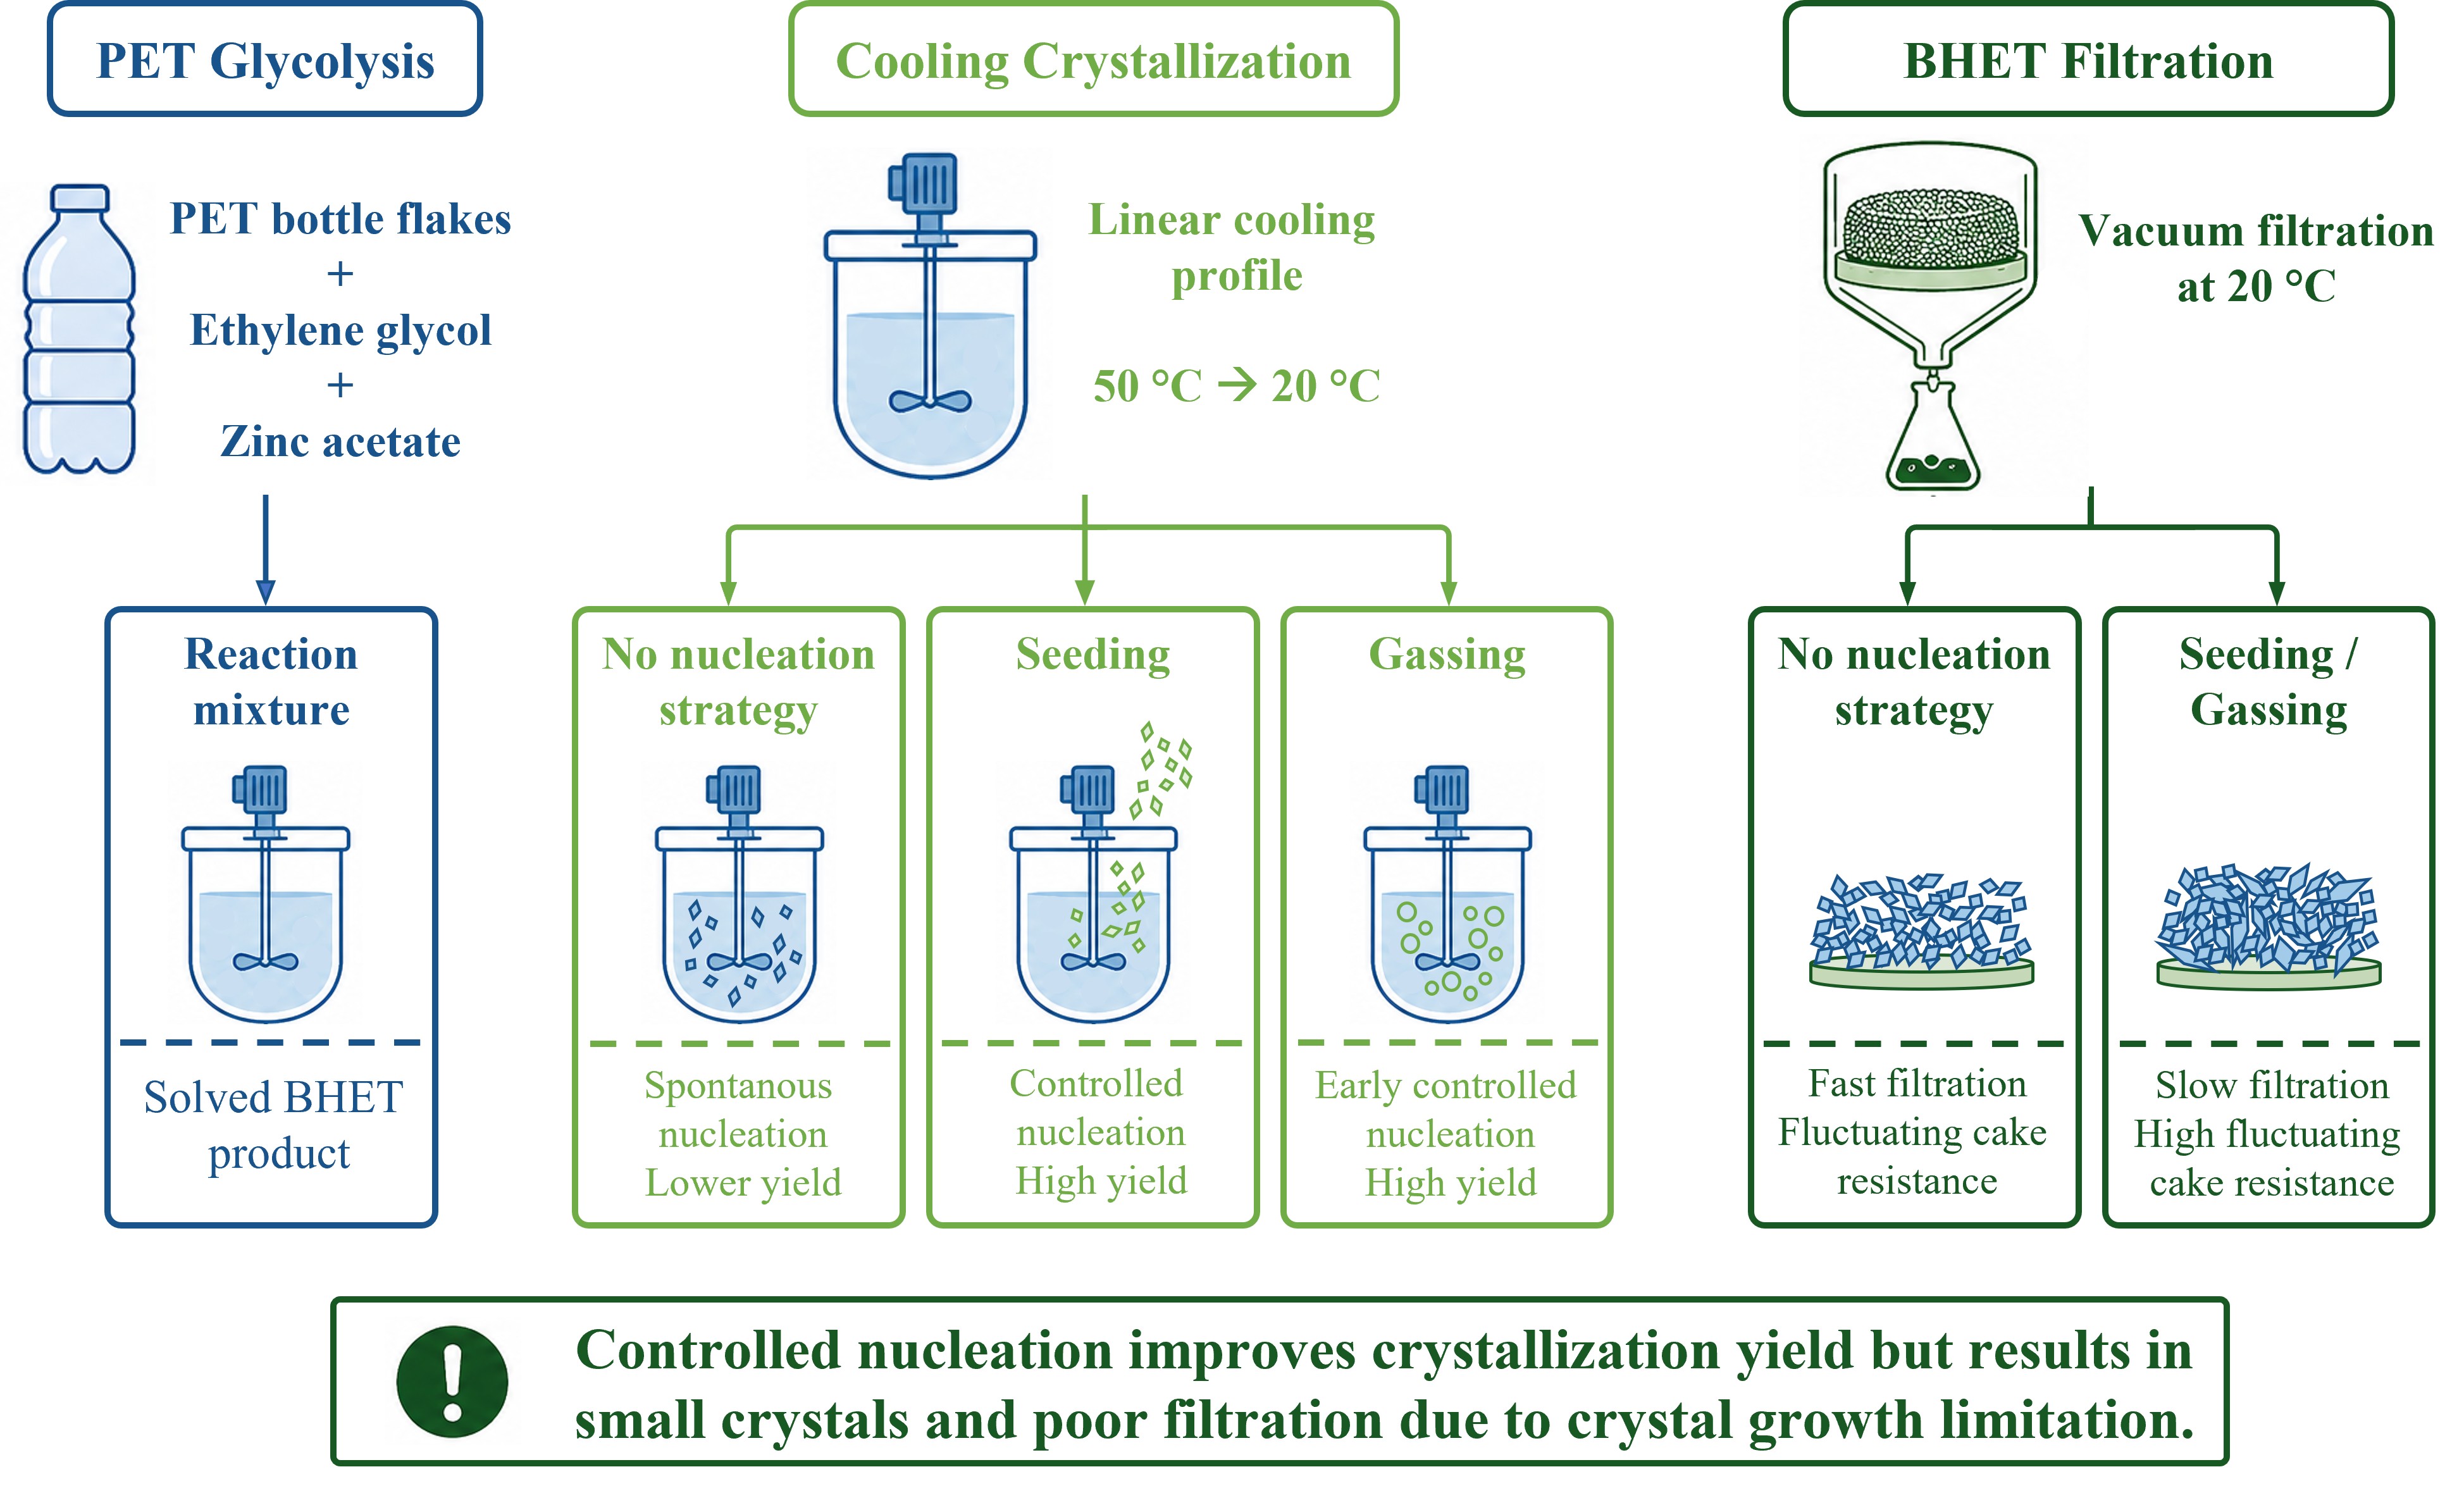
The scope of this work is the development of a robust and controllable crystallization process for separating BHET directly from the reaction solution. Gassing and seeding are regarded as nucleation strategies and are compared with the process without nucleation strategy as a benchmark. Seeding with species-specific crystals has been demonstrated to induce secondary nucleation, thereby enabling a high process control. This is due to the fact that crystallization processes can be controlled and influenced by the seed crystal properties, like crystal size and size distribution, seed mass and at which supersaturation the seed crystals are added [37,38,39]. The target variables for the evaluation and comparison of these nucleation strategies with each other and no nucleation strategy are the nucleation temperature and the relative crystallization yield of the monomer to describe the crystallization process (see Section 2.2.2). Within the scope of this work, only the BHET monomer is considered, although a small proportion of BHET dimer is always present [29]. The relative crystallization yield therefore refers only to the BHET monomer. As the downstream for the PET glycolysis process involves the crystallization, followed by a solid-liquid separation and washing two more target variables are the filtration time, and the specific filter cake resistance (see Section 2.3). These parameters offer a comprehensive description of the filter cake properties, which are based on the crystal properties from crystallization. This is crucial when considering the entire process, as the washing of BHET crystals in the filter cake to eliminate impurities constitutes a pivotal process stage in ensuring the fulfilment of purity requirements for BHET. A purity of ≤ 5 ppm of impurities is targeted. This, which corresponds to the lowest purity requirement of commercially PET for food packaging [40].
We hypothesize that gassing as nucleation strategy result in more controllable and reproducible early nucleation, leading to high relative yields and larger product crystals with a narrower particle size distribution. Furthermore, we expect the same behavior in seeded crystallization, where varying the seed crystal mass and the time of addition also increases the yield and shifts the crystal size distribution toward larger and narrower values. With regard to the filtration properties in the subsequent downstream process, we hypothesize that by controlling nucleation in the crystallization process, the crystal properties can be adjusted in such a way that the filtration properties of the crystal suspension are improved and can be consistently achieved.

2. Materials and Methods

2.1. Material System and Process Overview

The overall batch PET glycolysis process is given in Figure 1. The present study focuses on the crystallization and the BHET filtration. Nevertheless, each experiment starts with the glycolysis of PET. The individual process steps considered here are given in solid boxes and are explained in detail in Section 2.2. Here, a brief overview of the overall process is given. The process begins with the glycolysis reaction of PET with EG to BHET (see Table 1). This takes place at 190 °C and ambient pressure. After the reaction and when the product mixture has cooled controllably to 90 °C under ambient conditions, insoluble impurities are separated from the product mixture by vacuum filtration. The filtrate is transferred to the crystallization step and cooled from 50 °C to 20 °C. The resulting solid phase is separated by filtration in the next step to separate the solid product phase from the liquid phase. The BHET can be washed with EG at 20 °C. The filtrates produced after filtration and washing can be returned to the glycolysis reaction for recycling.

2.2. Experimental Set-Up and Procedures

The overall set-up is shown in Figure 2. The procedure for each step is explained in detail in the following sections. The underlying data generated are available in our data publication [41].

2.2.1. Glycolysis and Impurity Filtration

For each experiment, the reaction mixture was prepared by weighing 16 g PET flakes and EG in a mass ratio of m E G 0 m P E T 0 = 10 using a PBJ-N scale (Kern). The components were transferred into a 250 mL Schott bottle (Duran), along with ZnAc2 as catalyst in a molar ratio of n P E T 0 n Z n A c 2 = 50, and a magnetic stir bar. To simplify dosing, a pre-prepared ZnAc2 in EG catalyst solution with a concentration of 0.022 g g-1 was used for all experiments. The catalyst solution was added to the reaction mixture according to equation (1).
m Z n A c 2 + E G = M Z n A c 2 c Z n A c 2 + E G · m P E T M P E T 50
The Schott bottle was placed in an aluminum heating block on a hot plate magnetic stirrer (C-MAG HS7, IKA®), with the temperature of the reaction mixture set to 190 °C and stirring speed set to level 3 (see Figure 2). The total reaction time was 4.5 hours, including approximately 1.5 hours for heating the mixture to the reaction temperature, based on the findings of Schlüter et al., thereby achieving almost complete turnover, monitored using a thermo couple PT-100 [16]. After 4.5 hours, when the reaction is complete, the setup was passive cooled down to ~90 °C under continuous stirring and ambient conditions. After this, filtration was performed to separate impurities and unreacted PET. A vacuum flask was connected to a vacuum pump (PC2001 VARIO, Vacuubrand), and a microfiber filter paper (693, VWR) with a particle retention of 1.2 μm was placed in the Büchner funnel (see Figure 2). The filtration process began by activating the vacuum pump to reduce pressure to 50 mbar while pouring the reaction mixture onto the filter in the Büchner funnel pressed against the flask. After filtration, the flask was reweighed. The filter paper, which was weighed empty, was dried in a petri dish in an oven at 50 °C until its weight remained constant for approximately three days to measure the amount of unsolved impurities and not converted PET. Very small amounts of BHET, which crystallize out of the remaining mother liquor, cannot be ruled out, but can be disregarded.

2.2.2. Crystallization

Eight crystallization experiments conducted without a nucleation strategy form the basis for classifying and comparing the results of the experiments with a nucleation strategy. For this purpose, a double-walled glass crystallization vessel with a volume of 200 mL was equipped with a glass stirrer with a blade diameter of 34 mm and connected to an HT50DX stirrer (witeg) (see Figure 2). Two PT-100 temperature sensors were integrated, one for temperature control and one for monitoring. The filtrate from the initial filtration was transferred into the crystallizer using a plastic funnel. A thermostat (CC-505, huber), operated with thermal oil (methyl ethyl keton and water volumetric 3:2) and connected to the vessel's double jacket, was set to 50 °C, while the stirrer speed was set to 350 rpm to ensure homogeneous mixing without dead zones or thrombus formation. The process temperature was maintained at 50 °C for 15 min before starting the cooling profile to ensure that the temperature of the mixture remains constant at 50 °C. The temperature was linearly reduced from 50 °C to 20 °C over a period of 180 min, corresponding to a cooling rate of 0.17 K min−1. Temperature data during crystallization were recorded using a PTC Bricklet (Tinkerforge). After holding at the final temperature of 20 °C for 30 min to ensure supersaturation consumption, the suspension was discharged through the bottom outlet into a 250 mL Schott bottle under ambient temperature (20 °C ± 1 K). If solid deposits formed on vessel walls during crystallization, complete discharge could be facilitated using a spatula.
Seeding Crystallization
The process for seed crystal preparation followed the procedure described in Section 2.2.1 and Section 2.2.2. The resulting BHET filter cake was washed with ultrapure water from Milli-Q® IQ 7003 (Merck, 0.055 µS cm-1 at 25 C) to displace residual EG solution. Washing was necessary because EG has a very low vapor pressure [42,43], which inhibits proper drying of seed crystals in an oven at 50 °C and dissolve remaining crystals. For washing, fresh microfiber paper was placed in the Büchner funnel, and approximately 10 g of filter cake were spread onto it using a spatula to avoid overfilling the filter paper. The vacuum pump was activated while 200 mL ultrapure water were gradually poured over the filter cake using a squeeze bottle which ensures that the mother liquor is completely removed. After washing, the solid material was removed from the filter paper with a spatula and transferred into plastic containers for drying at 50 °C in an oven for two weeks. The dried seed crystals were then weighed according to required masses specified in Table 2 and stored individually in 10 mL vials for subsequent seeding experiments. Since only crystal growth is of interest in the initial investigations, particle size and distribution are not determined.
The seeding experiments were structured based on the Design of Experiments (DoE) (see Table 2). The variable parameters selected for this study were the temperature, at which seed crystals were added ϑ s e e d , a d d , and the mass of seed crystals m s e e d introduced. Since the experiments aimed to investigate the influence of seeding on filtration efficiency, the target variables defined within the DoE framework included the filtration time t f i l t and the specific filter cake resistance α H , calculated using Equation (4). Additionally, maximizing the relative crystallization yield of BHET Y r e l , c r y s t was set as another objective (see Equation (2)). The repeatability of results was evaluated through four center point experiments. To establish the experimental plan according to DoE principles, minimum and maximum values for the variable parameters were required. Seed crystal addition was constrained to occur within the supersaturated region; otherwise, dissolution would occur. Furthermore, primary homogeneous nucleation had to be avoided prior to seeding. As a reference point for determining maximum seeding temperature, the solubility curve from Schlüter et al. was used [29]. At a BHET concentration of 0.11 g g-1, corresponding to that in the reaction mixture, this curve intersects at approximately 41 °C. Homogeneous nucleation is expected from ~28 °C onwards based on the experiments carried out from Section 2.2.2. Consequently, maximum and minimum seeding temperatures were defined as 39.7 °C and 29.3 °C, respectively, each offset by 10 % from their extrema. According to heuristic estimates, maximum seed crystal mass corresponds to 5 wt.% and minimum mass corresponds to 0.1 wt.% relative to expected crystal mass [38]. The expected crystal mass is calculated from the concentration difference between the BHET concentration at the start of crystallization and the expected concentration from the solubility line according to Schlüter et al. at the final temperature of crystallization [29]. Thus, maximum seed crystal mass was set at 0.75 g, while minimum mass was defined as 0.015 g.
Seeding   temperature   ϑ s e e d , a d d Seed   crystal   mass   m s e e d The crystallization setup and procedure were carried out analogously to the method described above, with specific adjustments made for the seeding process. To allow sufficient time for seeding, the temperature was held constant at the respective seeding temperature (see Table 2) for 10 min at which the addition and suspension of the seed crystals takes place in approximately 2 min. The temperature profile of a center point experiment in the crystallizer is shown in Figure 3. The holding time of 10 min for seeding results here at 34.5 °C after 90 min. At the start of the holding period, a preheated and with BHET saturated EG solution was added to the respective amount of dried seed crystals into the 10 mL vials (see Table 2). For the highest seed crystal mass 5 mL solution while for the lowest mass 1 mL solution was used. The seed crystal suspension was stirred with a spatula and subsequently introduced into the crystallizer using a 20 mL syringe. Any remaining seed crystals in the vial were resuspended again in an additional 1 mL of saturated solution and added to the crystallizer. After the holding time the cooling profile was proceeded (see Figure 3).
Gassing Crystallization
When gassing crystallization was carried out, a gassing unit was installed in the crystallizer and connected to the L7Q-7 gas flow controller (SHLLJ). Synthetic air (grade 5.0; MESSER) was supplied at an inlet pressure of 4 bar within the designated temperature range for each experiment, with the volume flow rate adjusted accordingly. The crystallization behavior inside the vessel was recorded using a camera, illuminated by an LED panel positioned in the background. The rest of the setup and procedure remained the same as before.
The implementation of the gassing unit introduced additional parameters for process control, whose effects were investigated within the scope of a DoE (see Table 3). The gassing start temperature ϑ g a s , s t a r t was fixed at 42 °C to ensure that no supersaturation was present at the onset of gassing while promoting early nucleation followed by crystal growth compared to the solubility line from Schlüter at al. [29,44]. The gassing end temperature ϑ g a s , e n d , which determines gassing duration, and the volume flow rate were defined as variable parameters in the DoE. The factor levels of the gas volume flow were selected, so that a homogeneous gassing pattern is achieved at the minimum value, which was determined in preliminary experiments optically. The shortest gassing time, respectively the higher final temperature of the gassing, ends immediately after the nucleation shower, as determined in preliminary experiments. Factor levels used in the DoE are provided in Table 3, while corresponding gassing durations Δ t g a s are given in brackets.
The temperature profile of a center point experiment in the crystallizer is shown in Figure 4. The start of gassing at 42 °C is indicated by a small irregularity in the temperature profile, as the synthetic air is not preheated. The time of the nucleation shower can be identified by the energy released during nucleation based on the peak in the temperature profile and can also quantified on this basis (see Section 2.3.2).

2.2.3. BHET Filtration

The suspension discharged from the crystallizer is transferred onto a glass frit (porosity 3, pore size 16–40 μm) using a funnel. The crucible is placed in a holder within a glass container connected via tubing and a valve to a suction flask for filtrate collection, which is further linked to a vacuum pump (PC2001 VARIO, Vacuubrand). The suction flask is positioned on a scale (Tinkerforge) to record the filtrate mass over time (see Figure 2). Before starting, the empty flask and glass frit are weighed (PBJ-N, Kern). Filtration begins by activating the vacuum pump (50 mbar) and opening the valve; the balance is tared beforehand. Filtration ends when the liquid surface reaches the filter cake. The vacuum is then released carefully, and both the flask and glass frit are reweighed. The filter cake height is measured three times using a caliper and averaged. Residual liquid in tubing is collected in a pre-weighed beaker and subsequently reweighed.

2.3. Analytical Methods

2.3.1. BHET Concentration Measurements

The method used is described in detail in a previous work from Schlüter et al. and described here briefly only [29]. To monitor concentration changes during crystallization and to calculate the relative crystallization yield, a high-performance liquid chromatography (HPLC) is used. Samples (~30 mg droplets) were periodically taken just above the stirrer blade using a 1 mL disposable syringe Inject®-F (Braun). If a solid phase was present, a CHROMAFIL® Xtra PTFE-45/25 syringe filter (Macherey-Nagel) was used to isolate the liquid phase. Samples were transferred into pre-weighed 20 mL vials and prepared for HPLC analysis. The droplet mass was first determined using an analytical balance XS205 (Mettler Toledo). Samples collected before crystal formation were diluted with 8 mL γ-valerolactone (GVL, CAS number 108-29-2, Sigma-Aldrich, ≥ 99 % purity), while those taken after supersaturation reduction were diluted with 4 mL GVL, only. The mixture was weighed again and homogenized for five seconds using a VORTEX GENIE 2 (Scientific Industries). Subsequently, 1 mL of the diluted sample was transferred into an HPLC vial and analyzed using an Agilent 1260 Infinity II LC system equipped with a C18 column (Poroshell 120 EC). Separation was performed with a methanol/water mobile phase, and detection occurred via UV at 248 nm. The concentrations of BHET monomer were determined based on peak areas in the chromatogram using a calibration curve (data available in our data publication [41]).

2.3.2. Detection of Nucleation

The nucleation of BHET crystals could be identified by a sudden increase in the recorded temperature profile, which is attributed to the exothermic heat release during crystallization. Another method to determine the nucleation temperature is the naked-eye method, in which the temperature at the timepoint where the operator first visually detect crystals is recorded.
In gassing experiments, determining the nucleation temperature via the naked-eye method is challenging due to gas bubbles hindering the visual detection of nuclei. Moreover, temperature increase due to the crystallization heat is less pronounced due to lower supersaturation and may be overlaid by temperature regulation. The most reliable indicator for nucleation was found to be an abrupt change in the gas volume flow rate at the moment of initial crystal formation. This distinct as a decrease in flow rate, requiring adjustment of gas supply. To support documentation and confirm nucleation, video recordings using a camera were regularly made for subsequent analysis of crystallization behavior [41].

2.3.3. Crystal Shape and Size

The crystals formed during crystallization were analyzed after each experiment using a microscope (DM2700 M, Leica). At the end of crystallization, approximately 0.3 mL of suspension was sampled at 20 °C and transferred into a 20 mL vial containing 1.5 mL of saturated EG solution. This reduced the density of the suspension, allowing the crystals to be seen clearly under the microscope. However, due to compression by the cover slip on the microscope slide, agglomeration behavior could only be evaluated to a limited extent based on the microscopy images. Microscope images without a cover slip do not allow for sharp microscope images.

2.3.4. Relative Crystallization Yield

To quantify the reduction in supersaturation during crystallization, the relative yield of BHET Y r e l , c r y s t is calculated. As described in Equation (2), Y r e l , c r y s t represents the ratio of the actual decrease in BHET monomer concentration in the liquid phase to the maximum possible concentration reduction based on the solubility curve from Schlüter et al. [29]. For seeding crystallization, the saturated solution in which the seed crystals are resuspended is neglected, as its proportion in relation to the crystallization mixture is very small. Moreover, the equation only takes into account the BHET monomer.
Y B H E T , r e l = w B H E T , 0 w B H E T , e n d w B H E T , 0 w B H E T , e n d *
In Equation (2), w B H E T , 0 denotes the initial concentration of BHET monomer in the liquid phase, w B H E T , e n d represents its final concentration, and w B H E T , e n d * corresponds to the solubility of BHET monomer at the crystallization end temperature as determined by Schlüter et al. [29].

2.3.5. Filtration Time and Specific Filter Cake Resistance

The filtration time t f i l t is recorded during the BHET filtration process and represents the duration between the start of filtration and the moment when the liquid is removed from the filter cake surface (dryland). It is assumed that at this stage the pore volume is completely filled with mother liquor, corresponding to 100 % filter cake saturation. Filtration time provides insights into the efficiency of separating the mother liquor from the filter cake and allows conclusions about subsequent washing steps. The filtration process can also be characterized by the height-specific filter cake resistance α H which quantifies the resistance of the filter cake to the flow through it. The determination of α H is based on Equation (3), which relates filtration time t f i l t , filtrate volume V f i l t r a t e , filter cake area A c a k e , viscosity of mother liquor η M L , filter cake mass m c a k e , pressure difference Δ p f i l t , and filter medium resistance β [44].
t f i l t V f i l t r a t e = m c a k e   η M L   α H   2   A c a k e 2   Δ p f i l t   V f i l t r a t e · V f i l t r a t e + η M L   β   A c a k e     Δ p f i l t = a · V f i l t r a t e + b
To calculate α H , the quotient of filtration time to filtrate volume is plotted against filtrate volume, as illustrated in supporting information Figure S 4. Using the slope a from this linear relationship, α H can then be derived using Equation (4) [45,46].
α H = 2   A c a k e 2   Δ p f i l t   V f i l t r a t e h c a k e   η M L   · a
High height-specific filter cake resistance α H results in longer filtration times, while low α H corresponds to faster filtration [46,47].

3. Results and Discussion

3.1. Seeding Crystallization

Figure 5 illustrates the effects of the varied parameters on the relative yield Y r e l , c r y s t (a), filtration time t f i l t (b), and specific filter cake resistance α H (c), along with significance levels of 95 % (indifferent), 99 % (significant), and 99.9 % (highly significant). All underlying data are available in our data publication [41].
It can be observed that the effects of both parameters A (seeding temperature) and parameter B (seed crystal mass) (see Table 2), as well as their interaction AB, are not significant and consequently have no influence on any of the three target variables at the given constant process parameters. Based on the theory discussed in Section 2.2.3, it was anticipated that the seed crystal mass would affect product crystal size and distribution, thereby influencing filtration time and specific filter cake resistance. Smaller seed crystal masses were expected to result in larger crystals with shorter filtration times due to reduced surface area and vice versa. Additionally, we hypothesized that higher seeding temperatures could lead to larger crystals due to extended growth periods. The relative crystallization yield was observed to be close to 100 % across all seeded experiments (see Table A1). This indicates that supersaturation, relative to Schlüter’s et al. solubility curve, was consistently consumed during seeding crystallization [29].
The product crystals from all experiments appeared visually similar with no apparent differences in crystal shape or size based on 20 microscope images for each experiment. Figure 6 shows examples of microscope images of the crystals after crystallization from the center point experiments (all other images are available in our data publication [41]). Based on the images, the PSD was assessed as broad, as both very small crystal fragments and larger crystals or agglomerates were visible. However, precise evaluation solely based on microscopy images was not feasible. Due to the highly anisotropic particle shape and the higher viscosity of the EG at 20 °C, it was not possible to determine the particle size and PSD in any other way within the scope of this work. The product crystals were predominantly similar in size to the seed crystals, indicating that no significant crystal growth occurred and supersaturation is consumed due to additional nucleation only. The observed crystal fragments may have resulted from abrasion caused by stirring or secondary nucleation processes. Therefore, it is plausible that the variable parameters had no significant effect on filtration time or filter cake resistance since these metrics are closely linked to product crystal size and its size distribution.

3.2. Gassing Crystallization

Figure 7 illustrates the effects of the gas volume flow rate V ˙ g a s (A) and gassing end temperature ϑ g a s , e n d (B) and their interaction (AB) on (a) the nucleation temperature ϑ n u c , (b) the relative crystallization yield Y r e l , c r y s t , (c) the filtration time t f i l t , and (d) the specific filter cake resistance α H along with their significance levels. Neither parameter A and parameter B, nor their interaction AB showed a significant influence on the target variables.
For ϑ n u c (a), we hypothesized (see Section 2.2.4) that an increased gas volume flow rate would promote earlier primary heterogeneous nucleation by expanding the phase boundary between gas and liquid. This earlier nucleation was anticipated to shift the PSD toward bigger crystals. However, no significant relationship was observed, likely due to larger gas bubbles forming at higher flow rates, which reduce specific surface area and limit any increase in phase boundary size. Similarly, prolonged gassing durations were assumed to favor nucleation over an extended period, potentially amplifying the surface effects. This may be explained by secondary nucleation overtaking primary heterogeneous nucleation once initial nuclei form, a process energetically favored at existing crystal surfaces, which limits the impact of gassing duration on overall PSD.
Concerning the Y r e l , c r y s t (b), there was also no significant effect of gassing parameters observed. We initially assumed that enhanced nucleation through longer gassing durations or higher gas volume flow rates would facilitate supersaturation reduction and improve yield. Nevertheless, the relative crystallization yield consistently remained high across all experiments (see Table A1), indicating nearly complete supersaturation consumption.
For filtration time (c) and specific filter cake resistance (d), respectively, there were either no significant effects of the gassing parameters found. Based on the results of the nucleation temperature (a), we could expect that. We would only expect a significant change in the particle size distribution, resulting in a filter cake with different specific resistance and filtration time, if nucleation is impaired.
Figure 8 shows examples of the product crystals from the center experiments using gassing (all other images are available in our data publication [41]). Similar to seeding, highly anisotropic crystals with a broad PSD can be seen. The images revealed homogeneity across all experiments with numerous small crystal fragments and comparable PSDs among trials. Consequently, variation in gassing parameters did not affect crystal properties or filtration characteristics.

3.3. Comparison of Nucleation Strategies with Benchmark

To contextualize the results, the different nucleation strategies, seeding and gassing, are compared to experiments conducted without nucleation strategy (see Figure 9).
Due to the insignificant influences of all variables, all DoE experiments were included in the comparison for each strategy.
The mean values with the quartiles and outliers of the experiments for (a) the nucleation temperature, (b) the relative crystallization yield, (c) the filtration time, and (d) the specific filter cake resistance is presented. The comparison between the nucleation strategies and the benchmark is first done for the crystallization parameters. The temperature at which the seeds are added corresponds to the nucleation temperature and is represented as a box plot, where the mean value corresponds to the mean temperature of the central point experiments, and the upper and lower “whiskers” correspond to the minimum and maximum temperatures, respectively. In the bench mark experiments without nucleation strategy, a mean nucleation temperature ϑ ¯ n u c of 23.1 ± 1.2 °C and a relative crystallization yield of Y ¯ r e l , c r y s t = 83.7 ± 5.2 % was achieved. This can be attributed to uncontrollable spontaneous nucleation in the absence of a nucleation strategy, resulting in variable nucleation times (see Section 1). This causes differences in the reduction of supersaturation and leads to smaller and more variable relative crystallization yields. Consequently, the time available for crystal growth undergoes fluctuations. In comparison to gassing the mean nucleation temperature was notably higher at 33.7 °C with similar variance compared to those without. Therefore, gassing successfully induced primary heterogeneous nucleation at lower supersaturation levels, proving to be an effective method for controlled nucleation. The relative crystallization yield remained consistently high with a small variance across all experiments equal to seeding as nucleation strategies. Both gassing and seeding emerged as reliable strategies for achieving reproducibly high crystallization yields. These approaches enhance process control while improving stability of crystallization outcomes.
A comparison for the filtration target parameters shows in the benchmark experiments, despite fluctuating yields, very short filtration times averaging 4.8 ± 3.9 min with low variance were achieved. Comparison with seeded crystallization shows a significant increase in mean filtration time to 27.1 ± 5.8 min with a significantly greater variance and for gassing an even longer time with 46.3 ± 10.3 and a much larger variance. This indicates smaller and more inhomogeneous pores in the filter cake caused by small particles with a broad PSD and is consistent with the results from (Section 3.1 and Section 3.2).
Although there is a clear trend in filtration time, this trend does not hold true to the same extent for the specific filter cake resistance. The shorter filtration time also leads to lower average specific filter cake resistances of around 1.3 1013 ± 1.6 1013 m-2 but with a large variance. As expected, the broad PSD in seeded crystallization with small crystal fragments (see Figure 5) leads to a high increase of approx. 340 % in specific filter cake resistances and for gassing up to 418 %. Contrary to expectations that seeding would promote crystal growth leading to larger product crystals and reduced filtration times with lower filter cake resistance, these outcomes were not achieved. Instead, no significant crystal growth occurred; product crystals displayed a broad PSD and remained relatively small overall. However, due to limited crystal growth and predominantly small product crystals with broad PSDs, filtration times were longer than those observed in crystallizations without nucleation strategy. This behavior was also observed during gassing crystallization The elevated specific filter cake resistance further contributed to inefficient filtration processes. These findings suggest that removing mother liquor during washing requires substantial amounts of washing liquid, potentially leading to dissolution of the filter cake and loss of crystal mass, which needs to be investigated in future work.
Overall, seeding and gassing is effective for increasing and controlling the crystallization yield, but not an effective nucleation strategy within this operating window if the goal is to increase the efficiency of solid-liquid separation. Raising questions about whether improved process control in the crystallization step for crystal shape and yield justifies extended filtration times. To improve filter cake properties in terms of shorter and reproducible filtration times and specific filter cake resistances, the PSD must be narrowed and the crystal size maximized. The existing growth limitation poses the greatest challenge here. This growth limitation results in small crystals only, whose fine fraction accounts for a large proportion. Only by solving this challenge a final evaluation of the nucleation strategies can be made. An initial hypothesis is a limitation of mass transport due to the high viscosity at low temperatures of the EG in the mother liquor, which can result in crystal growth limitation.

4. Conclusion

We investigated the influence of different nucleation strategies, namely seeding and gassing, on the crystallization of BHET directly from a PET glycolysis reaction mixture. However, neither the seeding parameters (seeding temperature and seed mass) nor the gassing parameters (gas flow rate and gassing duration) showed significant influence on the investigated target variables, namely nucleation temperature, relative crystallization yield, filtration time, and specific filter cake resistance. Microscopy images revealed that crystals produced under all conditions exhibited similar anisotropic shapes and broad particle size distributions. We observed a growth limitation of BHET crystals, which represents a major challenge, as the predominance of small particles leads to dense filter cakes with high resistance.
The strategies were compared with crystallization without nucleation strategy as benchmark. Both, seeding and gassing, enabled improved control of the nucleation process, resulted in consistently higher crystallization yields, but longer filtration times and higher specific filter cake resistances compared to crystallization without a nucleation strategy. Within the investigated operating window, these strategies do not improve the filtration performance of the resulting crystal suspensions due to the growth limitation, which is attributed to the high viscosity of the medium within the temperature range under investigation for crystallization. Consequently, while controlled nucleation improves the predictability of crystallization, it does not currently offer advantages for downstream solid-liquid separation in this regime.
Future research will focus on overcoming the observed crystal growth limitation to enable the formation of larger crystals with narrower particle size distributions. One potential explanation for the limited crystal growth is restricted mass transport caused by the high viscosity of ethylene glycol at lower temperatures. Investigating this hypothesis and exploring strategies to enhance crystal growth may lead to improved filtration properties. It must also be clarified whether the highly variable filter cake properties have an impact on product purity in the subsequent washing step or whether they can be accepted in order to achieve a higher crystallization yield. Addressing these challenges is essential for developing a robust and efficient process for BHET recovery in PET chemical recycling.

Supplementary Materials

All underlying data are available in our data publication doi: 10.17877/TUDODATA-2025-MHUDZ4QC.

Author Contributions

Conceptualization, Lukas Seppelfricke and Kerstin Wohlgemuth; methodology, Lukas Seppelfricke; investigation, Lukas Seppelfricke, Henning Loos, Leonard Sander and Louisa-Marie Möller; writing—original draft preparation, Lukas Seppelfricke; writing—review and editing, Kerstin Wohlgemuth; visualization, Lukas Seppelfricke; supervision, Kerstin Wohlgemuth. All authors have read and agreed to the published version of the manuscript.

Funding

This research was funded by Sulzer Chemtech AG Winterthur/Switzerland.

Data Availability Statement

Data are contained within the article or Supplementary Materials.

Acknowledgments

The authors thank on the one hand Sulzer Chemtech AG, Winterthur/ Switzerland for funding this project, and especially Mr. Martin Schwiderski and Ms. Laureline Marc for excellent scientific collaboration and, on the other hand, TU Dortmund University’s glass apparatus workshop, (especially Mr. Pascal Gotthardt) for excellent creative collaboration.

Conflicts of Interest

The authors declare no conflict of interest. The funders had no role in the design of the study; in the collection, analyses, or interpretation of data; in the writing of the manuscript; or in the decision to publish the results.:

Abbreviations

The following abbreviations are used in this manuscript:
PET polyethylene terephthalate
BHET bis(2-hydroxyethyl) terephthalate
EG ethylene glycol
ZnAc2 zinc acetate
HPLC high-performance liquid chromatography
GVL γ-valerolactone
PSD particle size distribution
Latin Symbols
ϑ temperature
α H hight specific filter cake resistance
κ cooling rate
η viscosity
β filter medium resistance
Greek Symbols
n amount of substance
m mass
M molar mass
c concentration
t time
Y yield
w concentration
p pressure
t time
V volume
A area
a slope
Indices
0 start
seed, add seed crystals addition
seed Seed crystals
filt filtration
rel,cryst relative crystallization
stir stirrer
gas,start gassing start
gas,end gassing end
gas gassing
cake filter cake
ML mother liquor

Appendix A

Table A1. Results of all experiments without a nucleation strategy, with gassing, and seeding, including the respective process variables and target values at κ = 0.17 K min−1, nstir = 350 rpm, ϑ s t a r t , c r y s t = 50 °C and ϑ e n d , c r y s t = 20 °C.
Nucleation strategy ϑ s e e d , a d d m s e e d V ˙ g a s ϑ g a s , e n d ϑ n u c Y r e l , c r y s t t f i l t α H
[°C] [g] [L min-1] [°C] [°C] [%] [min] [m-2 1012]
No - - - - 25.4 77.5 1.6 2.15
No - - - - 22.15 85.2 2.7 3.07
No - - - - 23.14 85.8 3.5 7.08
No - - - - 22.45 91.6 3.6 45.0
No - - - - 22.48 78.3 13.8 34.7
No - - - - 1) 1) 1.85 11.8
No - - - - 1) 1) 3.16 1.6
No - - - - 1) 1) 8.3 5.10
Mean 23.1 ± 1.2 83.7 ± 5.2 4.8 ± 3.9 13.8 ± 15.6
Seeding 29.3 0.015 - - - 100.0 18.1 38.4
Seeding 34.5 0.383 - - - 98.7 33.9 37.6
Seeding 29.3 0.750 - - - 99.0 20.6 37.8
Seeding 34.5 0.383 - - - 97.5 30.7 46.9
Seeding 39.7 0.750 - - - 98.1 27.3 53.9
Seeding 34.5 0.383 - - - 97.2 30.1 51.5
Seeding 39.7 0.015 - - - 95.8 21.7 32.6
Seeding 34.5 0.383 - - - 95.8 34.0 56.6
Mean 97.8 ± 1.4 27.1 ± 5.8 44.4 ± 8.4
Gassing - - 3 34 34.6 98.7 39.4 76.3
Gassing - - 2 31 32.3 98.2 34.2 36.3
Gassing - - 1 34 35.5 98.9 40.0 40.9
Gassing - - 2 31 33.5 98.0 53.6 58.9
Gassing - - 3 28 34.8 94.8 57.6 65.4
Gassing - - 2 31 33.8 98.4 64.9 139.3
Gassing - - 1 28 31.3 97.0 37.4 24.0
Gassing - - 2 31 34.1 96.5 43.0 20.7
Mean 33.7 ± 1.3 97.6 ± 1.3 46.3 ± 10.3 57.7 ±35.9
1)
No data available.
Figure A1. Illustration of the slope of the linear region for determining the specific filter cake resistance.
Preprints 211990 g0a1

References

  1. Nisticò, R. Polyethylene terephthalate (PET) in the packaging industry. Polym. Test. 2020, 90, 106707. [Google Scholar] [CrossRef]
  2. Muringayil, T.; Azat, S.; Ahmadi, Z.; Moini Jazani, O.; Esmaeili, A.; Kianfar, E.; Haponiuk, J.; Thomas, S. Polyethylene terephthalate (PET) recycling: A review. Case Stud. Chem. Environ. Eng. 2024, 9, 100673. [Google Scholar] [CrossRef]
  3. IEA, Production forecast of thermoplastics worldwide from 2020 to 2050 2020.
  4. Tournier, V.; Topham, C. M.; Gilles, A.; David, B.; Folgoas, C.; Moya-Leclair, E.; Kamionka, E.; Desrousseaux, M.-L.; Texier, H.; Gavalda, S.; Cot, M.; Guémard, E.; Dalibey, M.; Nomme, J.; Cioci, G.; Barbe, S.; Chateau, M.; André, I.; Duquesne, S.; Marty, A. An engineered PET depolymerase to break down and recycle plastic bottles. Nature 2020, 580(7802), 216–219. [Google Scholar] [CrossRef]
  5. Material Recycling - Trends and Perspectives; Achilias, D., Ed.; 2012. [Google Scholar]
  6. Geyer, B.; Lorenz, G.; Kandelbauer, A. Recycling of poly(ethylene terephthalate) – A review focusing on chemical methods. Express Polym. Lett. 2016, 10(7), 559–586. [Google Scholar] [CrossRef]
  7. Damayanti, H.-S. Wu, Strategic Possibility Routes of Recycled PET. Polymers 2021, 13(9), 1475. [Google Scholar] [CrossRef]
  8. Asueta; Arnaiz, S.; Miguel-Fernández, R.; Leivar, J.; Amundarain, I.; Aramburu, B.; Gutiérrez-Ortiz, J. I.; López-Fonseca, R. Viability of Glycolysis for the Chemical Recycling of Highly Coloured and Multi-Layered Actual PET Wastes. Polymers 2023, 15(20), 4196. [Google Scholar] [CrossRef]
  9. Javed, S.; Vogt, D. Development of Eco-Friendly and Sustainable PET Glycolysis Using Sodium Alkoxides as Catalysts. ACS Sustain. Chem. Eng. 2023, 11(31), 11541–11547. [Google Scholar] [CrossRef]
  10. Schlüter, M.; Enomoto, R.; Makino, S.; Weihs, L.; Stamm, C. L.; Wohlgemuth, K.; Held, C. Boosting the kinetics of PET glycolysis. React. Chem. Eng. 2024, 9(11), 3038–3046. [Google Scholar] [CrossRef]
  11. Babaei, M.; Jalilian, M.; Shahbaz, K. Chemical recycling of Polyethylene terephthalate: A mini-review. J. Environ. Chem. Eng. 2024, 12, 112507. [Google Scholar] [CrossRef]
  12. López-Fonseca, R.; Duque-Ingunza, I.; de Rivas, B.; Flores-Giraldo, L.; Gutiérrez-Ortiz, J. I. Kinetics of catalytic glycolysis of PET wastes with sodium carbonate. Chem. Eng. J. 2011, 168(1), 312–320. [Google Scholar] [CrossRef]
  13. Lalhmangaihzuala, S.; Laldinpuii, Z.; Lalmuanpuia, C.; Vanlaldinpuia, K. Glycolysis of Poly(Ethylene Terephthalate) Using Biomass-Waste Derived Recyclable Heterogeneous Catalyst. Polymers 2020, 13(1). [Google Scholar] [CrossRef] [PubMed]
  14. Khoonkari, M.; Haghighi, A. H.; Sefidbakht, Y.; Shekoohi, K.; Ghaderian, A. Chemical Recycling of PET Wastes with Different Catalysts. Int. J. Polym. Sci. 2015, 1–11. [Google Scholar] [CrossRef]
  15. Liu, B.; Lu, X.; Ju, Z.; Sun, P.; Xin, J.; Yao, X.; Zhou, Q.; Zhang, S. Ultrafast Homogeneous Glycolysis of Waste Polyethylene Terephthalate via a Dissolution-Degradation Strategy. Ind. Eng. Chem. Res. 2018, 57(48), 16239–16245. [Google Scholar] [CrossRef]
  16. Schlüter, M.; Bhutani, S.; Wohlgemuth, K.; Held, C. Predicting Kinetics of the PET Glycolysis Reaction Using an Activity-Based Model and Experimental Validation. Ind. Eng. Chem. Res. 2024, 63(35), 15458–15465. [Google Scholar] [CrossRef]
  17. Sert, E.; Yılmaz, E.; Atalay, F. S. Chemical Recycling of Polyethlylene Terephthalate by Glycolysis Using Deep Eutectic Solvents. J. Polym. Env. 2019, 27(12), 2956–2962. [Google Scholar] [CrossRef]
  18. Ngo, D. M.; Jang, M.; Noh, H.; Jung, H. M. Morphology control of waste polyesters for enhanced glycolysis reactivity and minimization of side reactions. Polym. Degrad. Stab. 2024, 220, 110649. [Google Scholar] [CrossRef]
  19. Mendiburu-Valor, E.; Mondragon, G.; González, N.; Kortaberria, G.; Eceiza, A.; Peña-Rodriguez, C. Improving the Efficiency for the Production of Bis-(2-Hydroxyethyl) Terephtalate (BHET) from the Glycolysis Reaction of Poly(Ethylene Terephtalate) (PET) in a Pressure Reactor. Polymers 2021, 13(9). [Google Scholar] [CrossRef]
  20. Luna, E.; Olazabal, I.; Roosen, M.; Müller, A.; Jehanno, C.; Ximenis, M.; de Meester, S.; Sardon, H. Towards a better understanding of the cosolvent effect on the low-temperature glycolysis of Polyethylene Terephthalate (PET). Chem. Eng. J. 2024, 482, 148861. [Google Scholar] [CrossRef]
  21. Güclü, G.; Kasgöz, A.; Özbudak, S.; Özgümüs, S.; Orbay, M. Glycolysis of poly(ethylene terephthalate) wastes in xylene. J. Appl. Polym. Sci. in press. [Google Scholar]
  22. Goh, H. W.; Salmiaton, A.; Abdullah, N.; Idris, A. Time, Temperature and Amount of Distilled Water Effects on the Purity and Yield of Bis(2-hydroxyethyl) Terephthalate Purification System. Bull. Chem. React. Eng. Catal. 2015, 10(2), 143–154. [Google Scholar] [CrossRef]
  23. Duque-Ingunza; López-Fonseca, R.; de Rivas, B.; Gutiérrez-Ortiz, J. I. Process optimization for catalytic glycolysis of post-consumer PET wastes. J. Chem. Tech Biotech. 2014, 89(1), 97–103. [Google Scholar] [CrossRef]
  24. Huang; Yan, D.; Dong, H.; Li, F.; Lu, X.; Xin, J. Removal of trace amount impurities in glycolytic monomer of polyethylene terephthalate by recrystallization. J. Environ. Chem. Eng. 2021, 9(5), 106277. [Google Scholar] [CrossRef]
  25. Lee, T.; Peng, Y.-K.; Lee, H. L.; Pratama, D. E. Chemical Recycling Development of Poly(ethylene terephthalate) by Glycolysis and Cooling Crystallization with Water. Ind. Eng. Chem. Res. 2023, 62(46), 19873–19883. [Google Scholar] [CrossRef]
  26. Goh, H.W.; Salmiaton, A.; Abdullah, N.; Idris, A. Process Simulation of Two-stage Evaporation and Crystallization Systems for Bis(2-hydroxyethyl) terephthalate Recovery. J. Appl. Sci. 2012, 12, 1547–1555. [Google Scholar] [CrossRef]
  27. Raheema, B.; Hassana, A. B.; Noora, Z. Z.; Samsudina, S. B.; Hamida, M. A.; Belloa, A.; Oladokuna, O.; Sabeena, A. H.; Shamiria, A. Process Simulation of Bis (2- hydroxyethyl) terephthalate and Its Recovery Using Two–stage Evaporation Systems; 2018; pp. 655–660. [Google Scholar] [CrossRef]
  28. Yuan, P.; Liu, B.; Sun, H. Optimization of the Crystallization Process of Bis(2-hydroxyethyl) Terephthalate. Cryst. Res. Technol. 2021, 56(11). [Google Scholar] [CrossRef]
  29. Schlüter, M.; Held, C.; Wohlgemuth, K. BHET Crystallization in Water-Free PET Glycolysis Systems. Ind. Eng. Chem. Res. 2024, 64(2), 1189–1201. [Google Scholar] [CrossRef]
  30. Schlüter, M.; Bhutani, S.; Bahr, J.; Wohlgemuth, K.; Held, C. Measurement and PC-SAFT Modeling of the Solubility of the BHET Monomer, the BHET Dimer, and PET in Single Solvents. J. Chem. Eng. Data 2024, 69(3), 1326–1334. [Google Scholar] [CrossRef]
  31. Zangana, H.; Fernandez, A.; Holmes, J. D. Simplified, fast, and efficient microwave assisted chemical recycling of poly (ethylene terephthalate) waste. Mater. Today Commun. 2022, 33, 104588. [Google Scholar] [CrossRef]
  32. Grause, G.; Sutton, J.; Dove, A. P.; Mitchell, N. A.; Wood, J. Crystallization of Bis(2-hydroxyethylene) Terephthalate as a Part of a Bottle-to-Bottle Recycling Concept for Poly(ethylene terephthalate). Cryst. Growth Des. 2024, 24(17), 7306–7321. [Google Scholar] [CrossRef]
  33. Wohlgemuth; Ruether, F.; Schembecker, G. Sonocrystallization and crystallization with gassing of adipic acid. Chem. Eng. Sci. 2010, 65(2), 1016–1027. [Google Scholar] [CrossRef]
  34. Wohlgemuth, K.; Kordylla, A.; Ruether, F.; Schembecker, G. Experimental study of the effect of bubbles on nucleation during batch cooling crystallization. Chem. Eng. Sci. 2009, 64(19), 4155–4163. [Google Scholar] [CrossRef]
  35. Kleetz, T.; Pätzold, G.; Schembecker, G.; Wohlgemuth, K. Gassing Crystallization at Different Scales: Potential to Control Nucleation and Product Properties. Cryst. Growth Des. 2017, 17(3), 1028–1035. [Google Scholar] [CrossRef]
  36. Kleetz, T.; Funke, F.; Sunderhaus, A.; Schembecker, G.; Wohlgemuth, K. Influence of Gassing Crystallization Parameters on Induction Time and Crystal Size Distribution. Cryst. Growth Des. 2016, 16(12), 6797–6803. [Google Scholar] [CrossRef]
  37. Myerson, S.; Erdemir, D.; Lee, A. Y. Handbook of Industrial Crystallization; Cambridge University Press, 2019. [Google Scholar]
  38. Beckmann, W. Crystallization: Basic Concepts and Industrial Applications; Wiley-VCH, 2013. [Google Scholar]
  39. He, Y.; Gao, Z.; Zhang, T.; Sun, J.; Ma, Y.; Tian, N.; Gong, J. Seeding Techniques and Optimization of Solution Crystallization Processes. Org. Process Res. Dev. 2020, 24(10), 1839–1849. [Google Scholar] [CrossRef]
  40. Müller, Hanser. Coloring of plastics: Fundamentals, colorants, preparations, 1st ed.; Distributed in the USA and Canada by Hanser Gardner Publications: Cincinnati Ohio, 2003. [Google Scholar]
  41. Seppelfricke, Lukas. Replication Data for: Understanding the impact of different nucleation strategies on bis(2-hydroxyethyl) terephthalate crystallization within a PET glycolysis recycling process. TUDOdata 2025. [Google Scholar] [CrossRef]
  42. Yu, W.; Xie, H.; Li, Y.; Chen, L.; Wang, Q. Experimental investigation on the heat transfer properties of Al2O3 nanofluids using the mixture of ethylene glycol and water as base fluid. Powder Technol. 2012, 230, 14–19. [Google Scholar] [CrossRef]
  43. Kakavandi; Akbari, M. Experimental investigation of thermal conductivity of nanofluids containing of hybrid nanoparticles suspended in binary base fluids and propose a new correlation. Int. J. Heat. Mass. Transf. 2018, 124, 742–751. [Google Scholar] [CrossRef]
  44. Seifert, I.; Simons, J.; Gutsch, J.; Wohlgemuth, K. Inert Gassing Crystallization for Improved Product Separation of Oleo-Chemicals toward an Efficient Circular Economy. Org. Process Res. Dev. 2023, 27(1), 136–147. [Google Scholar] [CrossRef]
  45. Wakeman, R. J.; Tarleton, E. S. Equipment Selection and Process Design; Elsevier, 2007. [Google Scholar]
  46. VDI; VDI-Richtlinie 2762 - Blatt 2. in press.
  47. Benz; Lösch, P.; Antonyuk, S. Influence of the Measurement Resolution on the Filtration Analysis: An Improved Test Setup According to VDI 2762 Guideline. Processes 2023, 11(2), 299. [Google Scholar] [CrossRef]
Figure 1. Block diagram of the integrated PET glycolysis recycling process. Only the process steps shown as solid boxes are considered in this work.
Preprints 211990 g001
Figure 2. Experimental setup showing the individual steps of the reaction (1), impurity filtration (2), crystallization (3), and BHET filtration (4).
Preprints 211990 g002
Figure 3. Example temperature profile in the crystallizer for a center point experiment during seeding crystallization with seeding temperature as dashed line.
Preprints 211990 g003
Figure 4. Example temperature profile in the crystallizer for a center point experiment during gassing crystallization with gassing start and end temperature as dashed lines.
Preprints 211990 g004
Figure 5. Effects of parameter A (seeding temperature), B (seed crystal mass) and their interaction AB on a) the relative crystallization yield Y r e l , c r y s t and b) the relative crystallization yield Y r e l , c r y s t , c) the filtration time t f i l t and d) the specific filter cake resistance α H with confidence intervals of 95 % (indifferent), 99 % (significant), and 99.9 % (highly significant) at κ = 0.17 K min−1 and nstir = 350 rpm.
Preprints 211990 g005
Figure 6. Microscope images of the product crystal suspension from the four center point experiments of seeding crystallization. The crystal suspension is diluted in a ratio of 1:5 with saturated EG.
Preprints 211990 g006
Figure 7. Effects of parameter A (gas volume flow rate), B (gassing end temperature) and their interaction AB on a) the nucleation temperature ϑ n u c , b) the filtration time t f i l t and c) the specific filter cake resistance α H with confidence intervals of 95 % (indifferent), 99 % (significant), and 99.9 % (highly significant) at κ = 0.17 K min−1 and nstir = 350 rpm.
Preprints 211990 g007
Figure 8. Microscope images of the product crystal suspension from the four center point experiments of gassing crystallization. The crystal suspension is diluted in a ratio of 1:5 with saturated EG.
Preprints 211990 g008
Figure 9. Box-Plots over all experiments without nucleation strategy (left), seeding (middle) and gassing (right) for a) the nucleation temperature ϑ n u c , b) the relative crystallization yield Y r e l , c r y s t , c) the filtration time t f i l t , and d) the specific filter cake resistance α H .
Preprints 211990 g009aPreprints 211990 g009b
Table 1. Overview of chemicals used in the process with CAS number, supplier, and purity.
Substance CAS-Number Supplier Purity
PET-Flakes (PET) - Veolia PET Germany GmbH -
Ethylene Glycol (EG) 107-21-1 Carl Roth ≥ 99.5 %
Zinc Acetate (ZnAc2) 557-34-6 Sigma-Aldrich 99.99 %
Table 2. Factors and levels investigated for the seeding crystallization using DoE. The constant process parameters within the crystallizer were nstir = 350 rpm, κ = 0.17 K min-1, and ϑcryst,end = 20 °C. During subsequent filtration the constant process parameters were ϑfilt = 20 °C and Δ pfilt = 950 mbar abs.
Process parameters Factor Factor level
-1 0 1
Seeding   temperature   ϑ s e e d , a d d / °C A 29.3 34.5 39.7
Seed   crystal   mass   m s e e d / g B 0.015 0.383 0.75
Table 3. Factors and levels investigated for the gassing crystallization using DoE. The constant process parameters within the crystallizer were nstir = 350 rpm, κ = 0.17 K min-1, and ϑcryst,end = 20 °C. During subsequent filtration the constant process parameters were ϑfilt = 20 °C and Δ pfilt = 950 mbar abs.
Process parameters Factor Factor level
-1 0 1
Gas   volume   flow   rate   V ˙ g a s / L min-1 A 1 2 3
Gassing   end   temperature   ϑ g a s , e n d / °C ( Gassing   duration   Δ t g a s / min) B 34(47) 31(64) 28(82)
Disclaimer/Publisher’s Note: The statements, opinions and data contained in all publications are solely those of the individual author(s) and contributor(s) and not of MDPI and/or the editor(s). MDPI and/or the editor(s) disclaim responsibility for any injury to people or property resulting from any ideas, methods, instructions or products referred to in the content.
Copyright: This open access article is published under a Creative Commons CC BY 4.0 license, which permit the free download, distribution, and reuse, provided that the author and preprint are cited in any reuse.
Prerpints.org logo

Preprints.org is a free preprint server supported by MDPI in Basel, Switzerland.

Subscribe

Disclaimer

Terms of Use

Privacy Policy

Privacy Settings

© 2026 MDPI (Basel, Switzerland) unless otherwise stated