
Preprint
Article

This version is not peer-reviewed.

Optimization of Electrospinning Parameters for Bead-free Morphology of Poly(vinyl alcohol) Nanofibers

Submitted:

04 May 2026

Posted:

05 May 2026

You are already at the latest version

Abstract
Electrospinning is a relatively easy and perspective method for producing polymeric, ceramic, and composite fibers, which may vary from several nanometers to several micrometers. Poly(vinyl alcohol) (PVA) is a water-soluble, non-toxic, and biocompatible polymer with good mechanical properties, making it widely used for electrospinning. In this study, the influence of PVA solution concentration, applied voltage, tip-to-collector distance, and needle size on the morphology and diameter of the obtained fibers was investigated in order to optimize the conditions for the production of bead-free nanofibers. For this purpose, PVA solutions with different concentrations (5, 7.5, and 10 wt.%) were prepared and electrospun by altering the parameters of the process. Fiber morphology and diameter distribution as a function of the studied parameters were evaluated by Scanning electron microscopy (SEM). The results demonstrated a strong dependence of fiber morphology on solution viscosity. At low concentration (5 wt.%), fibers with numerous bead defects were obtained. Increasing the concentration to 7.5 wt.% led to a significant reduction in bead defect. Further increasing the concentration up to 10 wt.% led to the production of smooth and homogeneous fibers under the optimized conditions. A non-linear relationship between fiber diameter and tip-to-collector distance was observed, with an optimal distance of 140 mm yielding the thinnest and most uniform fibers. Additionally, needle diameter was found to influence both fiber size and process stability. Smaller needle diameters (G22) enabled the production of finer fibers (~180 nm), but with increased sensitivity to processing conditions, whereas larger diameters (G20–G21) provided more stable jet behavior and narrower diameter distributions. The statistical analysis ANOVA confirmed these findings. The study provides useful insights for optimizing electrospinning parameters to obtain high-quality, bead-free PVA nanofibers.
Keywords: 
;  ;  ;  

1. Introduction

In recent years, nanofibrous materials have gained considerable interest due to their unique physicochemical properties and versatile application potential. There are various methods for producing nanofibers, including drawing, phase separation, template synthesis, interfacial polymerization, template melt extrusion, melt blowing, self-assembly, force spinning, and electrospinning [1]. However, many of these methods are complex, not scalable, time-consuming, or only applicable to a limited range of polymers [2,3]. Among these techniques, electrospinning has attracted significant attention due to its simplicity and versatility. The process involves the application of a high-voltage electric field, which drives a charged jet of polymer solution from a syringe toward a collector with opposite charge [4]. When the applied voltage exceeds the surface tension, a charged polymer jet is ejected and stretches as it moves toward the collector. Simultaneously, solvent evaporation leads to polymer solidification and the formation of a network of fine fibers [5]. The reduction of polymer fiber diameter from microscale to nanoscale results in numerous advantageous properties. These include a high surface area-to-volume ratio, enhanced surface functionalization, and improved mechanical performance. As a result, nanoscale polymer fibers appear as promising materials for a variety of applications, including filtration, reinforcement materials, wound dressings, tissue engineering, and drug delivery [6]. The parameters affecting the electrospinning process can be divided into three main categories: solution parameters (concentration, molecular weight, viscosity, surface tension, and conductivity), process parameters (voltage, flow rate, the distance between tip and collector, and the size of the spinneret), and ambient parameters (humidity, temperature, pressure, and type of atmosphere). By optimizing these parameters, it is possible to produce electrospun fibers with the desired morphologies and diameters [7]. Among the various polymers used for electrospinning, aqueous solutions of Poly(vinyl alcohol) (PVA) are particularly attractive due to their water solubility, biocompatibility, and ease of processing [8]. PVA is a non-toxic, odourless polymer that possesses effective oxygen and aroma barrier properties. Moreover, it exhibits good mechanical properties, including high tensile strength and flexibility, as well as excellent film-forming, emulsifying, and adhesive characteristics [9]. These characteristics make PVA a suitable material for various industrial applications, including biodegradable packaging, adhesives, textiles, paper, and coatings, as well as advanced medical uses such as drug delivery systems, contact lenses, and wound dressings [10].
Numerous studies have examined the impact of various parameters on the electrospinning of poly(vinyl alcohol) (PVA) fibers, including the inherent characteristics of the polymer and the processing conditions [11,12]. For example, Koski et al. [8] demonstrated that the molecular weight of polyvinyl alcohol (PVA) significantly affects the structure of electrospun polymers. Lower molecular weight PVA tends to produce beaded fibers due to jet instability. In contrast, increasing the molecular weight results in the formation of uniform, defect-free nanofibers with larger diameters. Similarly, increasing solution concentration results in a transition from beaded to uniform fiber structures [8]. The degree of hydrolysis also influences fiber morphology and diameter. It was observed that, at a constant concentration of PVA solution, the average diameter of the electrospun PVA fibers increased as the degree of hydrolysis increased. Furthermore, the morphology of the electrospun PVA fibers changed from ribbon-like structures to uniform fibers, and eventually to beaded fibers [8,11,12]. Processing parameters such as applied voltage, tip-to-collector distance, and flow rate are also known to significantly affect jet stability and PVA fiber formation during electrospinning [11]. Despite numerous studies, there is still limited research on the combined effects of multiple processing parameters. In particular, the interaction between PVA concentration, tip-to-collector distance and needle diameter under fixed voltage conditions has not been systematically investigated, despite its significant influence on fiber formation and diameter. Therefore, the aim of this study is to systematically investigate the influence of solution concentration, tip-to-collector distance, and needle diameter (G20, G21 and G22) on the morphology and diameter of electrospun PVA fibers at a constant applied voltage, providing insight into their role in controlling fiber diameter and uniformity. In addition, a statistical analysis based on two-way ANOVA is applied to evaluate the significance of the individual factors and their interaction, enabling a quantitative assessment of their contribution to fiber diameter variation.

2. Materials and Methods

Poly (vinyl alcohol) (PVA) with molecular weight 72 000 Da and 98% degree of hydrolysis was obtained by Valerus Ltd Bulgaria and used without further purification. Distilled water was used as the solvent.
PVA solutions with concentrations 5 wt. %, 7.5 wt.% and 10 wt.% were prepared by dissolving an appropriate amount of PVA in distilled water. The solutions were stirred for 4 hours at 85 °C. The obtained clear polymer solutions (10 ml) were then poured into the 50 ml syringe for further use.
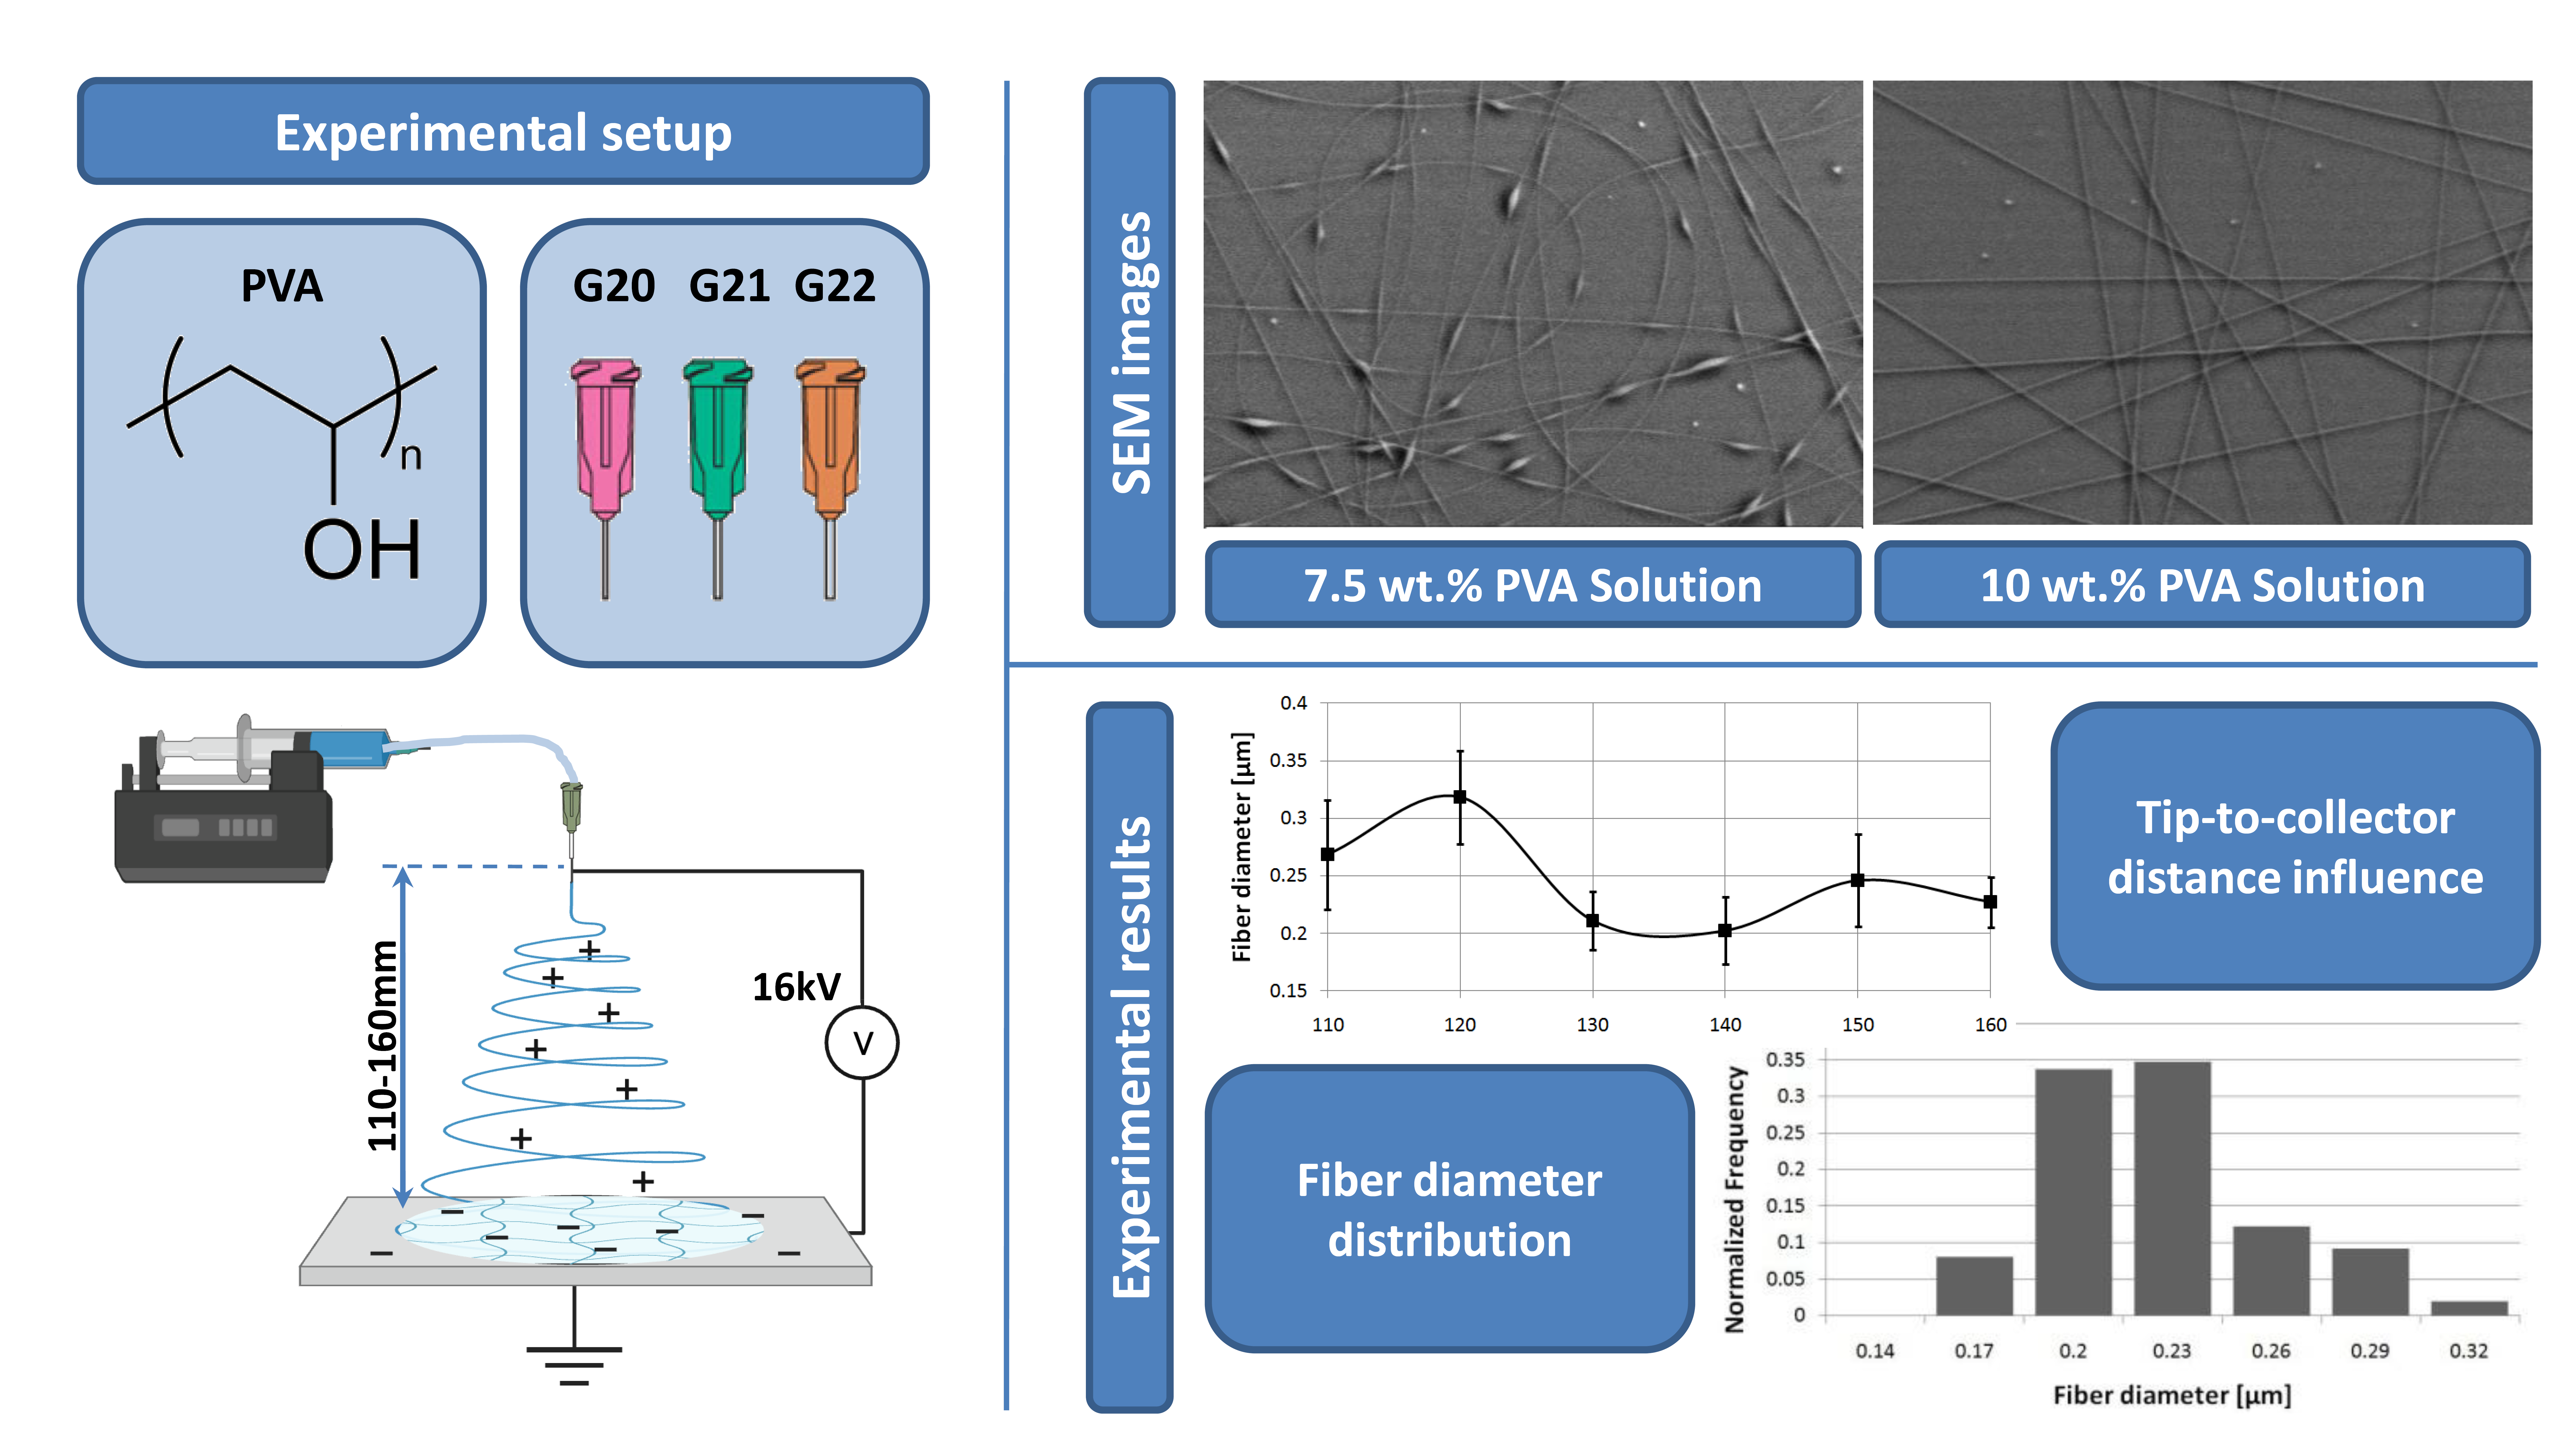
The experimental setup consisted of a 50-ml syringe fitted with a stainless-steel needle of varying diameters (G20 (OD-0.91 and ID-0.6), G21(OD-0.82 and ID-0.51), and G22 (OD-0.72 and ID-0.41), which were positioned vertically on a clamp, as illustrated in Figure 1. The syringe, filled with PVA solution at different concentrations (5, 7.5, and 10 wt.%), was placed on a syringe pump operating at a constant flow rate of 1.0 mL/h. A high-voltage DC power supply was used to generate an electric field of approximately 16 kV necessary for initiating fiber formation. The distance between the collector plate and the needle was adjusted from 110 to 160 mm. All experiments were conducted under controlled ambient conditions, maintained at 22 °C and 52% relative humidity.
The fiber morphology and diameter of the electrospun PVA fibers were determined using scanning electron microscopy (Model Zeiss, EVO 10, software SmartSem Version 7.05 with Service pack 3, Carl Zeiss Microscopy GmbH, Carl-Zeiss-Promenade 10, 07745 Jena). The diameters of the electrospun nanofibers were manually measured using the KERN VIS Lite microscope camera software (KERN & Sohn GmbH, Germany). High-resolution JPEG images were imported into the software, calibrated against a standard micrometer scale, and fiber diameters were quantified by drawing perpendicular lines across randomly selected nanofibers at multiple locations along their axes.

3. Results

3.1. Influence of PVA Concentration on the Nanofiber Formation

Among all the operational parameters, polymer concentration is one of the most important in the electrospinning process, as it significantly affects fiber production, as well as morphology and size of the obtained fibers [13]. The highly concentrated polymer solution leads to difficulties when flowing through the syringe needle during the electrospinning process, and the low solution viscosity can cause the formation of beads in nanofibers. Therefore, determining the optimal solution concentration is crucial for optimizing the final bead-free electrospun fibers. In this regard, one of the main purposes of this study was to investigate the effect of PVA concentration on nanofiber formation within the range of 5.0–10 wt.% (5.0, 7.5, and 10 wt.%). To evaluate this effect, the electrospinning process was carried out under fixed conditions, including a tip-to-collector distance of 140 mm, an applied voltage of 16 kV, and a G20 needle.
Under the established conditions, a 5 wt.% PVA solution was used for electrospinning. Fibers with diameters below 200 nm, along with numerous bead defects were observed by SEM analysis (Figure 2a). These observations can be attributed to the low solution viscosity, where the degree of polymer chain entanglement is insufficient to maintain jet stability during electrospinning. As a result, surface tension becomes dominant, tending to minimize the surface area of the fluid, resulting in the formation of fibers with bead defects.
Increasing the concentration of the PVA solution to 7.5 wt.% resulted in improved fiber morphology, with a reduction of bead defect. This was expected since the increased viscosity, lead to higher degree of polymer chain entanglement, which consequently stabilizes the electrospinning jet and allows it to be stretched into continuous fibers with less defects. SEM analysis revealed fibers with an average diameter of about 170 nm, along with spindle-like bead defects (Figure 2b). The average dimensions of the beads were approximately 343 nm in width and 1800 nm in length (Figure 2b). Further increase in PVA concentration to 10 wt.% solution resulted in the production of well-defined, smooth, and homogeneous electrospun nanofibers, with no beads or spindle-like defects observed along the fibers, as demonstrated by SEM analysis (Figure 2c). An average diameter of 200 nm was measured for bead-free nanofibers. This observation is a result of the higher concentration of solution, which leads to increased polymer chain entanglement that enhances the viscoelastic properties and resists stretching caused by the charges on the jet.

3.2. Influence of Tip-to-Collector Distance and Needle Diameter on the Morphology of PVA Nanofiber

The influence of distance from the tip-to-collector distance and needle diameter on the morphology and diameter of PVA nanofibers were further evaluated. The experiment was conducted using a PVA solution at 10 wt.%, keeping all other parameters constant while varying the distance from 110 to 160 mm and the needle diameter from G20 (OD 0.9mm), G21 (0. 82mm) to G22 (OD 0.72mm). It was established that the working distance significantly influenced the diameter of the produced nanofibers. The results demonstrated a non-linear dependence of fiber diameter on the tip-to-collector distance at a constant voltage of 16 kV, with a characteristic minimum observed around 140 mm. As the distance increased from 110 to 130 mm, the fiber diameter generally increased, followed by a decrease at 140 mm, and a subsequent increase at larger distances at 150-160 mm (Figure 3).
The results indicate that at shorter spinning distances, the polymer jet does not have sufficient time for elongation and solvent evaporation, which results in the formation of relatively thick fibers. However, as the distance increases, the jet undergoes enhanced stretching and more effective solvent evaporation, resulting in thinner and more uniform fibers. A minimum fiber thickness is reached at approximately 140 mm. Beyond this point, the strength of the electric field decreases, which reduces the stretching forces acting on the jet and leads to the formation of thicker fibers. The minimum observed fiber diameter at 140 mm indicates an appropriate electrospinning distance, where a balance between electrostatic forces, viscoelastic properties, and solvent evaporation is achieved. The previous studies also demonstrate that increasing the distance between the tip and the collector enhances fiber uniformity up to a critical point, beyond which the diameter of the fibers increases due to a reduction in electric field intensity [14].
Further, the influence of needle diameter on the morphology and diameter of electrospun poly(vinyl alcohol) (PVA) fibers was investigated. In all cases, a clear dependence on the average fiber diameter, tip to the collector distance and needle diameter was observed. For the G20 needle, the average fiber diameter initially increased from 0.268 µm at a distance of 110 mm to 0.292 µm at 120 mm. This was followed by a decrease to 0.211 µm at 130 mm, reaching a minimum of 0.203 µm at 140 mm. After 140 mm, a slight increase was noted at 160 mm, with a diameter of 0.227 µm. This behavior indicates the presence of an optimal spinning distance around 140 mm, where a balance between electrostatic stretching and solvent evaporation leads to the formation of the thinnest fibers (Figure 4).
A similar but more pronounced trend was observed for the G21 needle. The fiber diameter initially increased from 0.194 µm at a distance at 110 mm to 0.249 at a distance 130 mm, then decreased gradually with increasing distance of 140 mm, where a minimum of 0.197 µm is reached. After this, an increase again to 0.25 µm at a distance of 160 mm was observed (Figure 5).
For the G22 needle, a clear non-linear dependence of fiber diameter on tip-to-collector distance was also observed. The average diameter initially increased from 110 mm to 120–130 mm, followed by a sharp decrease to a minimum value of approximately 0.18 µm at 140 mm. Further increasing the distance resulted in a gradual increase in fiber diameter, reaching about 0.28 µm at 160 mm (Figure 6).
As seen, for the G20 and G21 needles, the fiber diameter showed a relatively smooth variation as the tip-to-collector distance increased, with an established distance at 140 mm. In contrast, the G22 needle exhibited a strong non-linear behavior, with a maximum at intermediate distances (120–130 mm) and a distinct minimum at 140 mm. This indicates that the G22 needle is more sensitive to changes in spinning distance, highlighting its greater dependence on processing conditions. Overall, these results indicate that the smaller needle diameters (G22) enable the formation of finer fibers due to enhanced jet stretching; however, they also increase sensitivity to processing conditions, resulting in greater variability in fiber diameter. In contrast, larger needle diameters (G20 and G21) contribute to more stable jet formation and uniform fibers, although they limit the ability to further reduce and precisely control fiber diameter.
The effect of needle diameter on fiber formation was evaluated by analyzing fiber diameter distribution histograms (Figure 7). For the G20 needle, a relatively broad distribution was obtained, as the most fibers ranging from 0.20 to 0.23 µm. Additionally, a tail extending towards larger diameters is evident, indicating moderate polydispersity. The G21 needle demonstrated a narrower distribution, with a distinct peak around 0.23 µm, which suggests improved uniformity and polydispersity compared to the G20. In contrast, the G22 needle produced finer fibers, as evidenced by the shift towards smaller diameters. However, a broader distribution was noted, indicating a greater sensitivity of the electrospinning jet to fluctuations in the processing conditions.

3.3. Statistical Analysis

To statistically evaluate the significance of these observation, a two-way analysis of variance (ANOVA) was performed on log-transformed fiber diameters to assess the effects of needle diameter (G20, G21, and G22) and collector distance (110–160 mm) and their interaction.
The fiber diameter data were log-transformed prior to statistical analysis because the raw measurements exhibited significant deviations from normality (Shapiro–Wilk test on residuals, p<0.0001) and homogeneity of variances (Levene’s test, p<0.0001). After log transformation, the assumptions of the two-way ANOVA were approximately satisfied, although mild deviations remained due to the large number of observations (n=556). The normality of the residuals from the two-way ANOVA performed on log-transformed fiber diameters was visually examined using a normal Q-Q plot (Figure 8). The majority of the data points closely followed the theoretical reference line, indicating that the residuals were approximately normally distributed. Only mild deviations were observed in the lower and upper tails, which is typical for fiber-diameter measurements even after logarithmic transformation. Although the Shapiro–Wilk test on the residuals yielded a statistically significant result, this is expected with a large sample size and does not compromise the validity of the ANOVA results, which are known to be robust to such minor departures from normality in electrospinning studies.
The analysis revealed statistically significant main effects of needle diameter (F2,538=8.70, p=0.0002) and collector distance (F5,538=6.62, p<0.0001), as well as a highly significant needle diameter × collector distance interaction (F10,538 =5.21, p<0.0001). These factors together accounted for 16.02% of the total variation in fiber diameter, while the residual (unexplained) variation was 83.98% - a level typical in electrospinning experiments and attributable to inherent process variability and measurement error.
Table 1. Two-way ANOVA on log-transformed fiber diameters.
Factor Sum of squares df F p-value % of total variation
Needle diameter 0.8223 2 8.70 0.0002 2.71%
Collector distance 1.5642 5 6.62 <0.0001 5.16%
Needle x Distance (interaction) 2.4642 10 5.21 <0.0001 8.14%
Residual 25.4376 538 - - 83.98%
Main effects plots (Figure 9a,b) showed a mild decrease in mean log fiber diameter as needle gauge increased from G20 to G21, followed by a slight increase at G22 (Figure 9a), and generally smaller diameters at intermediate collector distances (130–140 mm) compared with both shorter (110 mm) and longer (150–160 mm) distances (Figure 9b).
The statistical analysis confirmed the experimental observations. Two-way ANOVA performed on the log-transformed fiber diameters revealed statistically significant main effects of needle diameter (F2,538=8.70, p=0.0002) and collector distance (F5,538=6.62, p<0.0001), together with a highly significant interaction between these two factors (F10,538=5.21, p<0.0001). These parameters collectively accounted for 16.02% of the total variation in fiber diameter, with the remaining 83.98% representing residual (unexplained) variance that is typical for electrospinning processes due to inherent jet instability and measurement variability. The main effects plots further illustrated a mild decrease in mean log fiber diameter from G20 to G21 needles, followed by a slight increase at G22, while the smallest diameters were generally achieved at intermediate collector distances of 130–140 mm.
Taken together, the results demonstrate that bead-free, uniform PVA nanofibers with controlled diameters can be reliably produced by selecting an appropriate combination of 10 wt.% solution concentration, a collector distance of approximately 140 mm, and a suitable needle gauge. The strong interaction between needle diameter and collector distance highlights that the optimal spinning distance is not universal but depends on the needle size employed. These findings provide clear, practical guidance for the reproducible fabrication of high-quality PVA nanofibers tailored for specific applications.

5. Conclusions

In this study, the influence of solution concentration, tip-to-collector distance, and needle diameter on the morphology and diameter of electrospun poly(vinyl alcohol) (PVA) nanofibers was systematically investigated. At low concentration (5 wt.%), due to insufficient chain entanglement, bead defects are formed, while increasing the concentration to 10 wt.% leads to the formation of homogeneous and bead-free nanofibers. A non-linear dependence of fiber diameter on tip-to-collector distance was established with an optimal spinning distance of 140 mm, where the thinnest and uniform fibers were obtained because of the established balance between electrostatic stretching, jet stability, and solvent evaporation. It was found that the needle diameter has a significant influence on the fiber diameter and process sensitivity. A smaller needle diameter (G22) enhances jet stretching, leading to finer fiber formation, but with increased sensitivity to processing conditions and greater variability in fiber diameter. Larger diameters (G20–G21) provided more stable jet behavior and more uniform fibers, but with reduced sensitivity to parameter adjustments. Additionally, the identification of an optimal spinning distance common across different needle diameters provides practical guidance for process optimization. Statistical analysis (ANOVA) further confirmed that needle diameter, collector distance, and their interaction have a significant effect on fiber diameter. Overall, the results indicate that optimal fiber quality can be achieved by combining higher polymer concentration (10 wt.%), intermediate spinning distances (around 140 mm), and appropriately selected needle diameters. These results provide a useful framework for tailoring electrospinning conditions in applications where precise control over fiber diameter and uniformity is essential, such as filtration and biomedical materials.

Author Contributions

Conceptualization, D.G., K.S. and R.B.; methodology, R.B.; software, D.G.; validation, D.G., K.S. and R.B.; formal analysis, D.G.; investigation, I.O.; resources, I.O.; writing—original draft preparation, D.G., K.S. and R.B.; writing—review and editing, R.B. and K.S.; visualization, D.G.; All authors have read and agreed to the published version of the manuscript.”.

Funding

This research received no external funding.

Institutional Review Board Statement

Not applicable.

Data Availability Statement

Data are available within the article.

Acknowledgments

Not applicable.

Conflicts of Interest

The authors declare no conflicts of interest.

Abbreviations

The following abbreviations are used in this manuscript:
PVA Poly(vinyl alcohol)
SEM Scanning electron microscopy

References

  1. Ramakrishna, S.; Fujihara, K.; Teo, W.-E.; Lim, T.-C.; Ma, Z. An Introduction to Electrospinning and Nanofibers; World Scientific Publishing Co. Pte. Ltd.: Singapore, 2005. [Google Scholar]
  2. Luo, C.J.; Stoyanov, S.D.; Stride, E.; Pelan, E.; Edirisinghe, M.J. Electrospinning versus fibre production methods: from specifics to technological convergence. Chem. Soc. Rev. 2012, 41, 4708–4735. [Google Scholar] [CrossRef] [PubMed]
  3. Mehta, P.P.; Pawar, V.S. Electrospun nanofiber scaffolds: Technology and applications. In Applications of Nanocomposite Materials in Drug Delivery; Inamuddin, Asiri, A.M., Mohammad, A., Eds.; Woodhead Publishing: Cambridge, UK, 2018; pp. 509–573. [Google Scholar]
  4. Reneker, D.H.; Chun, I. Nanometre diameter fibres of polymer, produced by electrospinning. Nanotechnology 1996, 7, 216–223. [Google Scholar] [CrossRef]
  5. Li, Z.; Wang, C. One-dimensional Nanostructures: Electrospinning Technique and Unique Nanofibers; Springer: Berlin/Heidelberg, Germany, 2013; pp. 15–29. [Google Scholar]
  6. Supaphol, P.; Chuangchote, S. On the electrospinning of poly(vinyl alcohol) nanofiber mats: A revisit. J. Appl. Polym. Sci. 2008, 108, 969–978. [Google Scholar] [CrossRef]
  7. Elkasaby, M.; Hegab, H.A.; Mohany, A.; Rizvi, G.M. Modeling and optimization of electrospinning of poly(vinyl alcohol) (PVA). Adv. Polym. Technol. 2017, 37, 2114–2122. [Google Scholar] [CrossRef]
  8. Koski, A.; Yim, K.; Shivkumar, S. Effect of molecular weight on fibrous poly(vinyl alcohol) produced by electrospinning. Mater. Lett. 2004, 58, 493–497. [Google Scholar] [CrossRef]
  9. Aslam, M.; Kalyar, M.A.; Raza, Z.A. Poly(vinyl alcohol): A review of research status and use of poly(vinyl alcohol)-based nanocomposites. Polym. Eng. Sci. 2018, 58, 2119–2132. [Google Scholar] [CrossRef]
  10. Asano, S. Poly(vinyl alcohol): A comprehensive overview. Adv. Mater. Sci. Res. 2024, 7, 199–200. [Google Scholar] [CrossRef]
  11. Zhang, C.; Yuan, X.; Wu, L.; Han, Y.; Sheng, J. Study on morphology of electrospun poly(vinyl alcohol) mats. Eur. Polym. J. 2005, 41, 423–432. [Google Scholar] [CrossRef]
  12. Park, J.; Ito, T.; Kim, K.; Kim, K.W.; Kim, B.; Khil, M.S.; Kim, H.Y.; Kim, I.S. Electrospun poly(vinyl alcohol) nanofibers: Effects of degree of hydrolysis and enhanced water stability. Polym. J. 2010, 42, 273–276. [Google Scholar] [CrossRef]
  13. Phachamud, T.; Phiriyawirut, M. Physical properties of poly(vinyl alcohol) electrospun fiber mat. Res. J. Pharm. Biol. Chem. Sci. 2011, 2, 675–684. [Google Scholar]
  14. Ding, W.; Wei, S.; Zhu, J.; Chen, X.; Rutman, D.; Guo, Z. Manipulated electrospun poly(vinyl alcohol) nanofibers with inexpensive salts. Macromol. Mater. Eng. 2010, 295, 958–965. [Google Scholar] [CrossRef]
Figure 1. Schematic Diagram of the electrospinning process.
Preprints 211762 g001
Figure 2. SEM images of PVA nanofibers at a) 5 wt.%; b) 7.5 wt.% and c) 10 wt. % (needle G20, flow rate 1 ml/h and applied voltage 16 kV).
Preprints 211762 g002
Figure 3. Effect of applied tip-to-collector distance on fiber diameter (10 wt. % PVA solution, needle G22, flow rate 1 ml/h and applied voltage 16 kV).
Preprints 211762 g003
Figure 4. Effect of needle G20 and tip-to-collector distance on fiber diameter of 10 wt. % PVA solution.
Preprints 211762 g004
Figure 5. Effect of needle G21 and tip-to-collector distance on fiber diameter of 10 wt. % PVA solution.
Preprints 211762 g005
Figure 6. Effect of needle G22 and tip-to-collector distance on fiber diameter of 10 wt. % PVA solution.
Preprints 211762 g006
Figure 7. Fiber diameter distribution histograms for different needle diameters at a tip-to-collector distance of 140 mm: (a) G20; (b) G21; (c) G22.
Preprints 211762 g007
Figure 8. Q-Q Plot of residuals from two-way ANOVA on log(diameter) scale.
Preprints 211762 g008
Figure 9. Main effects plots showing the influence of (a) needle diameter and (b) collector distance on the log-transformed mean fiber diameter, averaged across levels of the other factor.
Preprints 211762 g009
Disclaimer/Publisher’s Note: The statements, opinions and data contained in all publications are solely those of the individual author(s) and contributor(s) and not of MDPI and/or the editor(s). MDPI and/or the editor(s) disclaim responsibility for any injury to people or property resulting from any ideas, methods, instructions or products referred to in the content.
Copyright: This open access article is published under a Creative Commons CC BY 4.0 license, which permit the free download, distribution, and reuse, provided that the author and preprint are cited in any reuse.
Prerpints.org logo

Preprints.org is a free preprint server supported by MDPI in Basel, Switzerland.

Subscribe

Disclaimer

Terms of Use

Privacy Policy

Privacy Settings

© 2026 MDPI (Basel, Switzerland) unless otherwise stated