Submitted:
16 April 2026
Posted:
17 April 2026
You are already at the latest version
Abstract
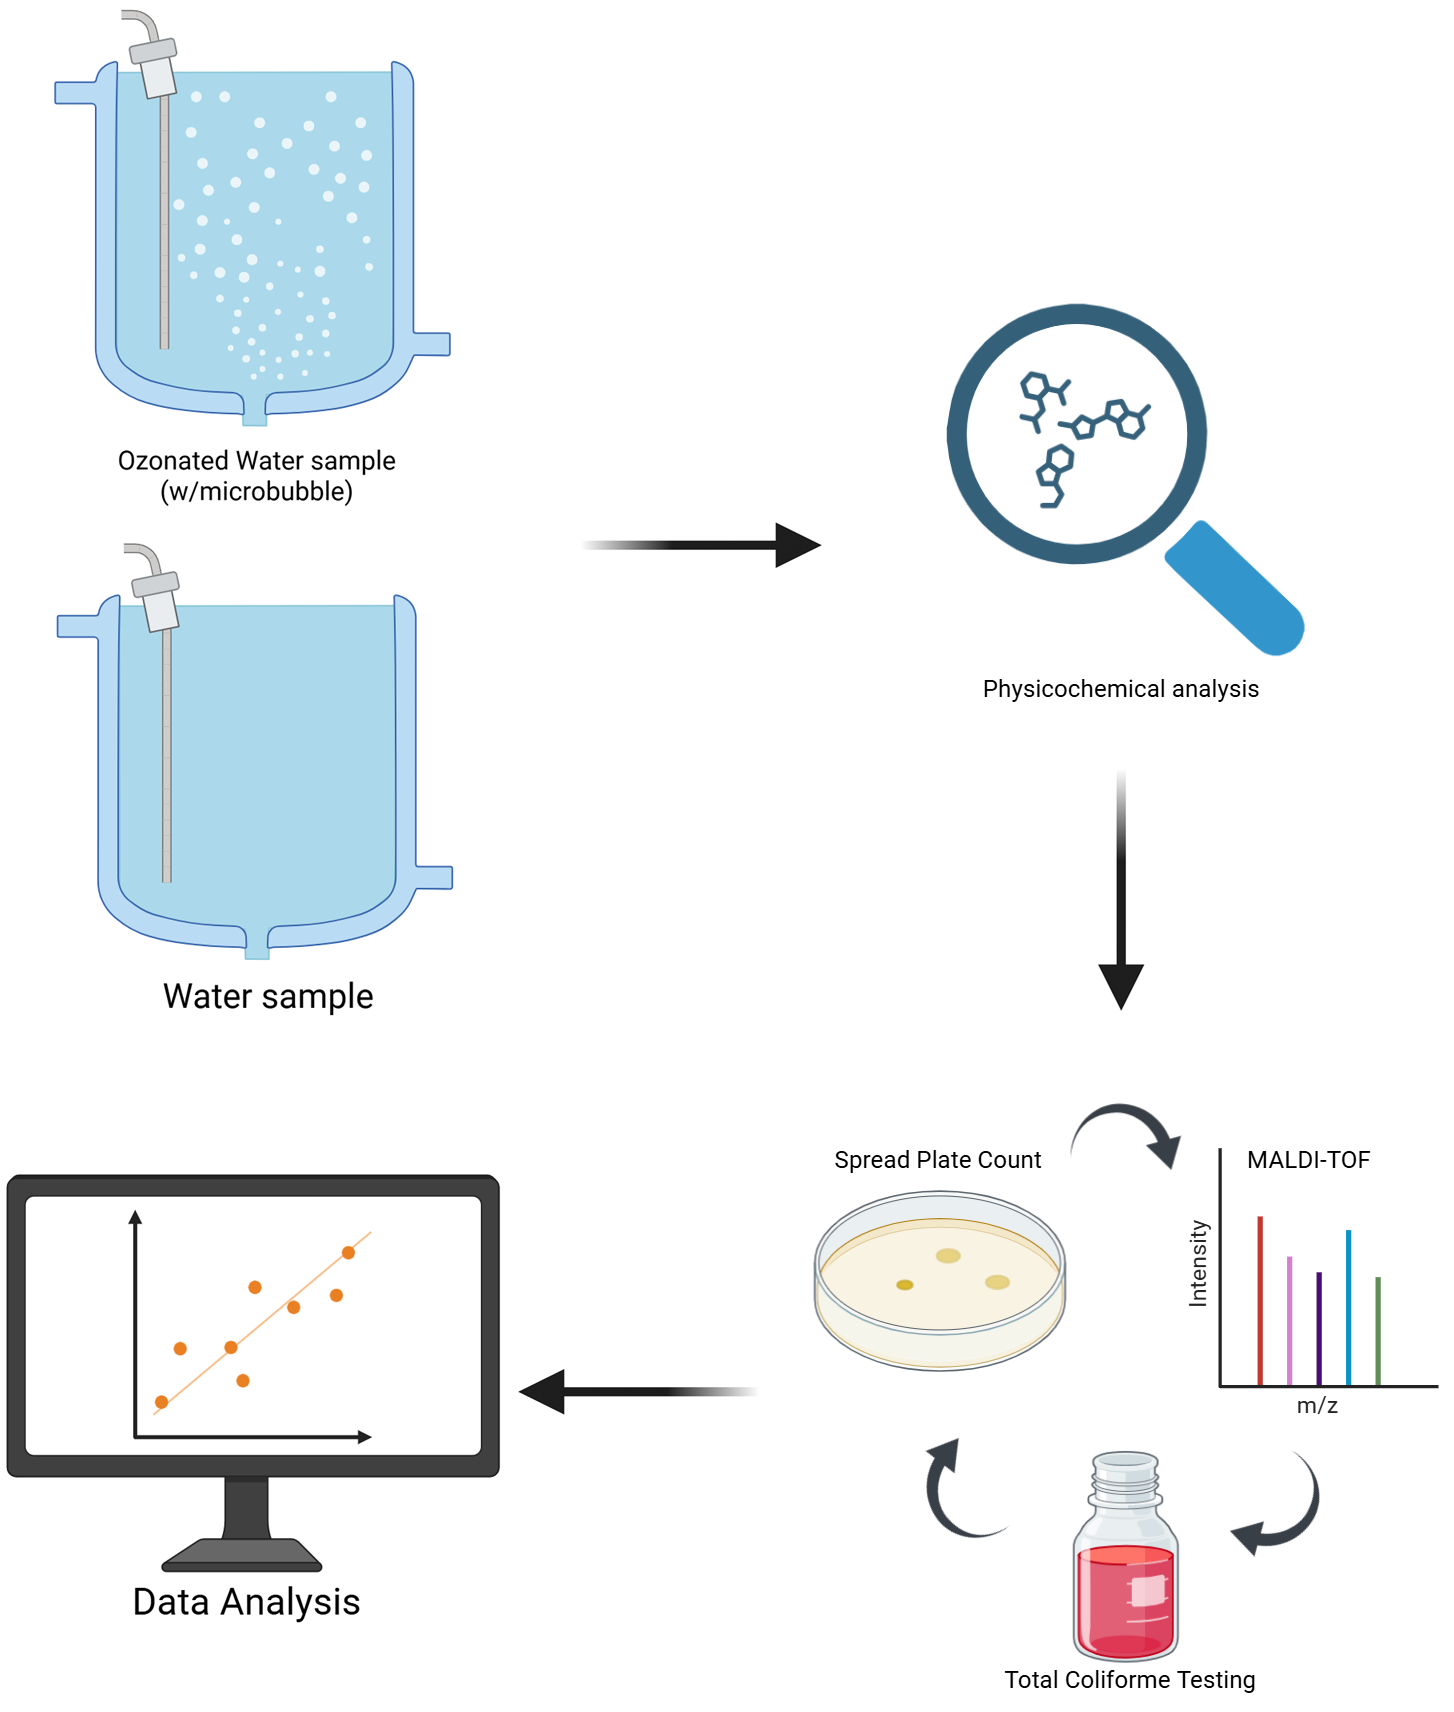
Ozone (O₃) is a potent disinfectant, yet its efficacy in environmentally complex waters can be inconsistent. This study investigated the effectiveness of ozonation across 14 water samples (wells, rainwater, ponds) and identified key success factors. Ozone exposure (1-20 min) significantly reduced colony-forming units (CFU) in most samples, achieving complete elimination in four. However, two high-organic-load samples showed minimal change. Physicochemical analyses revealed a strong correlation between increased Oxidation-Reduction Potential (ORP) and disinfection success. We observed that the efficient generation of ozone microbubbles was the critical factor in raising the ORP to lethal levels (> ~450 mV). A paradigmatic case was sample 2, where the elimination of total coliforms (98.7%) only occurred in replicates where microbubbles formed (ORP >520 mV), failing in the replicate without microbubbles (ORP 122 mV). Mass spectrometry (MALDI-TOF) identified genera such as Pseudomonas and Bacillus, indicating the presence of microbial diversity. We conclude that ozo-nation is highly effective, but its success depends on optimizing mass transfer via microbubbles, with ORP as a fundamental real-time indicator to ensure process reliability. This study offers a practical guideline for implementing more robust and safer ozone systems, overcoming limitations observed in waters with complex contamination.
Keywords:
ozone
; microbubbles
; oxidation-reduction potential (ORP)
; water disinfection
; water quality
; MALDI-TOF
1. Introduction
Growing concerns about water quality and the spread of diseases related to microbiological contamination have driven the search for effective and sustainable disinfection methods. Ozonation was introduced into water treatment in the early 20th century to replace chlorine in the disinfection of groundwater, which typically has a low dissolved organic carbon content and high alkalinity [1]. Despite this, the use of chlorination in water treatment remained dominant for several decades. A fundamental advantage of using chlorine in water treatment is its ability to generate a sufficiently long-lasting disinfectant residual that inhibits microbial growth in finished water. However, the need for alternatives became urgent after the identification of harmful disinfection by-products (DBPs) formed during chlorination, including carcinogenic substances such as trihalomethanes, bromophenols, and haloacetic acids [2,3,4,5,6,7,8]. Consequently, this has stimulated renewed interest in disinfectants like ozone as alternatives to minimize DBP formation. More recent discoveries regarding the resistance of certain pathogenic microorganisms, namely Giardia cysts and Cryptosporidium oocysts, to chlorination have further increased interest in more effective disinfectants [9].
Although disinfection is often the primary purpose of ozone in drinking water treatment, it has also come to be used at low doses for taste and odor control and to reduce watercolor, caused by the cleavage of carbon-carbon double bonds in long-chain organic compounds [10]. Other applications include the elimination of iron and manganese, the reduction of micropollutants (e.g., pesticides and phenolic compounds), increased biodegradability of dissolved organic matter, and a possible increase in coagulation and filtration efficiency [11,12,13].
As an alternative to water disinfection, ozone (O₃) stands out for its high oxidizing capacity, microbiological efficacy, and environmental characteristics. This method has been applied to various water sources, including drinking water, well water, river water, and even sewage, with promising results in eliminating pathogenic microorganisms, dissolved metals, and unwanted organic compounds [14]. Like other water treatment disinfectants, ozone is unstable in water and reacts with components of the aqueous matrix. However, ozone's unique characteristic is its decomposition into hydroxyl radicals (•OH), which are among the strongest oxidants in water [15]. Nevertheless, for different ozone applications, the two species have different importance. Although disinfection occurs predominantly through ozone, oxidation can also occur via oxidants, ozone, and OH radicals [13,16,17]. Ozone is a very selective oxidant; OH radicals react rapidly with many dissolved compounds and with the aqueous matrix. Ozone can react through two different mechanisms: direct oxidation by molecular ozone and indirect oxidation via hydroxyl radicals [18,19]. Disinfection occurs predominantly via direct reaction, whereas oxidation of organic and inorganic compounds can occur via both pathways [20]. The balance between these mechanisms varies according to water quality parameters such as pH, temperature, and the presence of radical initiators, promoters, or scavengers [20].
Despite the well-documented oxidizing power of ozone, its efficacy in environmentally relevant water samples characterized by complex matrices and diverse microbial loads can be unpredictable. Factors such as the presence of organic matter, the quality of gas dissolution, and the dynamics of ozone decomposition directly influence the final outcome [14]. Previous studies, while fundamental, have often employed controlled laboratory conditions that do not reflect the variability of real-world scenarios. In this context, the present study not only evaluated the overall efficacy of ozonation across a variety of natural waters but also investigated the underlying mechanisms governing its success or failure, with particular emphasis on the correlation among microbubble generation, increases in Oxidation-Reduction Potential (ORP), and microbial inactivation. The objective was to go beyond simple confirmation of efficacy and identify the critical parameters that enable more reliable and effective process control. Furthermore, access to safe drinking water remains a distant reality for millions of people in low- and middle-income countries, where inadequate sanitation infrastructure perpetuates a high burden of waterborne diseases [9]. In these settings, there is an urgent need for decentralized, low-cost, and easy-to-operate water treatment technologies. Ozone-based systems, particularly those utilizing microbubble technology, hold promise as a solution that can be deployed at the point of use or in small communities, empowering local populations to treat their own water safely and sustainably.
Crucially, the microbiological contamination of untreated water sources in such regions is not limited to classical indicator organisms like total coliforms and Escherichia coli. Environmental waters frequently harbor a diversity of opportunistic and emerging pathogens, including species of Pseudomonas, Aeromonas, and Acinetobacter that can cause a wide range of infections, particularly in vulnerable populations. The precise identification of these agents is essential for accurately assessing health risks and evaluating the true efficacy of any treatment technology. Therefore, this study employed MALDI-TOF MS to achieve species-level identification of the cultivable microbiota in untreated water samples, enabling us to determine whether ozone treatment can eliminate not only indicator organisms but also clinically relevant pathogens. In this context, the present study not only evaluated the overall effectiveness of ozonation across a variety of natural waters but also investigated the mechanisms underlying its success or failure, with particular emphasis on the correlation among microbubble generation, increased ORP, and microbial inactivation. The objective was to go beyond merely confirming ozone's effectiveness by identifying the critical parameters that enable more reliable and effective process control, and to contextualize these findings in the development of a simple, accessible, and scalable technology to bring potable water to communities lacking basic sanitation infrastructure. In doing so, this study provides the scientific basis for decentralized, environmentally friendly water treatment solutions adapted to the realities of vulnerable populations.
2. Results
2.1. Ozone Treatment
The results demonstrated statistically significant efficacy of ozone treatment in reducing colony-forming units (CFUs) in water samples across exposure times (1, 5, 10, 15, and 20 min), with one exception (Figure 1, Table 1). Notably, four samples (samples 5, 7, 8, and 12) achieved a 100% reduction in CFU, with sample 5 reaching this reduction after just 1 min of ozone exposure, followed by samples 7 (5 min), 8 (10 min), and 12 (15 min). Sample 2 exhibited a substantial reduction in CFU (96.8%) after just 1 minute of ozone exposure, with further reductions at 5 and 10 min (98.7% and 98.4%, respectively). However, these results lacked statistical significance due to the use of only two valid replicates. The third replicate exceeded 300 CFU, resulting in a high standard deviation. While a >100% reduction was observed at 15 min, efficacy decreased slightly to 98.7% after 20 min of exposure. Sample 1 began to show a reduction in CFU after 5 min (65.6%) and reached its maximum reduction at 20 min (92.9%). Sample 10 exhibited a smaller but still significant reduction in CFU at 20 min (45.6%), followed by sample 4 (44.4%). The latter sample maintained unchanged counts after 1 min of exposure, showed minimal reduction at 5 min (2.4%), increased to 37.5% at 10 min, but then decreased to 29.4% at 15 min. Among all samples, only samples 3 and 14 showed no reduction in CFU at any ozone exposure time. Samples 6, 9, 11, and 13 displayed no colony growth in the untreated controls.
2.2. Monitoring of Physicochemical Parameters (pH, Temperature, TDS, EC, and ORP)
The data presented in the table and figure analyze the parameters pH, temperature, TDS, EC, and ORP for water samples before (control) and after ozone treatment (20 minutes) (Figure 2, Table 2). pH measurements showed that control samples ranged from 4.78 to 7.39, with an overall mean of 6.3. Treated samples exhibited higher values, ranging from 6.0 to 7.94, with a mean of 7.2. Temperature measurements revealed that control samples had a lower mean temperature (23.6°C) compared to treated samples (26.7°C). For TDS monitoring, sample 14 was excluded from calculations due to atypical values. Control samples showed TDS levels ranging from 0.09 ppm to 178 ppm (mean: 35.9 ppm), while treated samples ranged from 3.4 ppm to 160 ppm (mean: 41.1 ppm). In EC measurements, sample 14 (µS/cm) was again excluded for consistency. Control samples exhibited EC values between 12 µS/cm and 346 µS/cm (mean: 73.4 µS/cm), whereas treated samples ranged from 21.3 µS/cm to 318.7 µS/cm (mean: 83 µS/cm). ORP values demonstrated that control samples ranged from 136 mV to 185 mV (mean: 206.4 mV). Treated samples showed significantly higher values, with a range of 119.7 mV to 554 mV and a mean of 281.4 mV (Figure 2, Table 2).
2.3. Total Coliform Testing
2.3.1. Presumptive/Confirmatory Analysis
In the PAB of control samples (C), we observed positive results (+) in all samples except four (6, 9, 11, and 13), indicating the likely presence of total coliforms as expected in untreated well water. For ozone-treated samples (T), we observed reduced positivity in the presumptive test, with several samples showing no signs of contamination (1, 5, 7, 8, and 12). However, some samples (3, 4, 10, and 14) remained fully positive (+), while sample 2 showed partial positivity (+) (Table 5). The confirmatory analysis (BGBLB) of control samples (C) validated the presumptive results for some samples (2, 3, 4, 8, 10, and 14), confirming the presence of total coliforms. Other samples (1, 5, 7, and 12) showed no confirmation of presumptive contamination, suggesting that the PAB test may have yielded false positives. Samples 6, 9, 11, and 13 confirmed the absence of total coliforms. In ozone-treated samples (T), the BGBLB test demonstrated complete elimination of total coliforms in samples 1, 5, 7, 8, and 12, while samples 6, 9, 11, and 13 remained negative. Sample 2 showed partial elimination, with positivity in only one of three replicates. For samples that were PAB-positive (3, 4, 10, and 14), the confirmatory analysis also indicated complete positivity (Table 3). A critical observation emerged from the triplicate analysis of sample 2. While the first two experimental replicates achieved 98.7% CFU reduction after 20 minutes of ozone exposure, with high ORP values (523 mV and 521 mV) and negative total coliform results, the third replicate showed no CFU reduction (0%), a low ORP value (122 mV), and a positive total coliform result. Notably, a visible foam-like layer indicative of efficient microbubble generation was observed only in the first two replicates (Table 3A).
2.4. Mass Spectrometry (MALDI-TOF)
We employed MALDI-TOF mass spectrometry to identify microorganisms isolated from non-ozone-treated water samples, including colony morphology classification, organism identification, equipment-derived scores, and consistency of results. Our analysis revealed substantial microbial diversity, with identification of various bacterial genera including Bacillus, Pseudomonas, Comamonas, Paenibacillus, Micrococcus, and others. The genera Pseudomonas and Bacillus predominated among isolated colonies, suggesting these groups exhibit greater adaptability to untreated water conditions. The most frequently identified species were Bacillus mycoides and Pseudomonas koreensis, which represented most of the characterized colonies. Regarding result quality (score and consistency), most colonies showed scores between 1.70 and 2.40, with a predominance of reliable results (Category A), indicating the method's suitability for this sample type (Table 4).
3. Discussion
Ozone is an unstable gas composed of three oxygen atoms, generated through processes such as corona discharge or UV radiation. It is widely used in water purification for its ability to oxidize both organic and inorganic compounds and effectively inactivate microorganisms. As a disinfectant, ozone acts by destroying the cell walls of bacteria, viruses, and protozoa, achieving rapid inactivation. Compared to chlorine, ozone is more potent, acts faster, and avoids the formation of chlorinated by-products such as trihalomethanes (THMs). Additionally, ozone oxidizes metals such as iron (Fe²⁺) and manganese (Mn²⁺), converting them into insoluble forms that can be easily removed by filtration. It also degrades organic compounds and eliminates unpleasant tastes and odors in water. The advantages of ozone treatment include high disinfection and oxidation efficiency, the absence of chemical residues (as ozone decomposes into oxygen), and broad-spectrum contaminant removal, including pesticides, heavy metals, and chlorine-resistant pathogens [14,15].
However, the present study reveals that the efficacy of ozone disinfection in environmentally complex waters is governed not only by the applied ozone concentration but fundamentally by the quality of its transfer to the liquid phase via microbubble generation. The most compelling evidence of this correlation emerges from the intra-sample variability observed in Sample 2 (Table 5A). Under identical experimental conditions, the same water sample, the same ozone generator, and the same exposure time of 20 minutes, the three replicates produced markedly different outcomes, determined exclusively by the presence or absence of microbubbles. In replicates 1 and 2, where efficient microbubble generation was visually confirmed by the formation of a foam-like layer on the water surface, ORP values reached 523 mV and 521 mV, respectively, correlating with 98.7% CFU reduction and complete elimination of total coliforms. In stark contrast, replicate 3 failed to generate microbubbles, resulting in low ORP (122 mV), no CFU reduction (0%), and persistence of total coliforms. This intra-sample variability provides direct experimental evidence that microbubble generation is the critical determinant of ozone mass transfer, its dissolution in water, and consequently, its disinfection efficacy. Reinforcing this conclusion, the comparison among highly contaminated samples (>300 CFU/mL) is equally illustrative: Samples 3 and 14, which did not achieve adequate microbubble conditions and exhibited low ORP values (119.7 mV and 127 mV, respectively), failed to reduce microbial load. Conversely, Sample 5, equally contaminated, achieved complete microbial elimination precisely because it reached optimal microbubble conditions, confirmed by its high ORP value (453.3 mV). These findings constitute the main contribution of this work: the demonstration that the quality of ozone application, mediated by microbubble formation, is as important as, or even more important than, the applied quantity, especially in complex aquatic matrices typical of untreated sources in regions lacking sanitation infrastructure.
Oxidation-Reduction Potential (ORP) emerged as a reliable, real-time proxy for the efficacy of the ozonation process. Our data demonstrate a significant mean increase in ORP from 206.4 mV (control) to 260.8 mV (treated), confirming the oxidizing activity of ozone [14]. The literature indicates that ORP values exceeding 650 mV are typically sufficient to eliminate total and fecal coliforms and significantly reduce CFUs [21]. However, our results reveal a more nuanced and contextualized picture. We observed that samples with moderately elevated ORP values, such as Sample 2 (523 mV) and Sample 8 (149 mV), achieved complete coliform elimination under ideal contact conditions provided by microbubbles. This finding demonstrates that the disinfectant efficacy depends not only on the final ORP value but also on the efficiency of ozone transfer and distribution throughout the water matrix. On the other hand, for samples with exceptionally high microbial loads, such as Sample 5, a higher ORP (453.3 mV) was necessary to achieve complete inactivation. These findings indicate that while there is no single absolute ORP value that guarantees disinfection across all aquatic matrices, real-time monitoring of this parameter, combined with observation of microbubble formation, offers a practical and accessible tool for process control. ORP directly reflects the concentration of available oxidizing species and, when correlated with mass-transfer efficiency, enables immediate operational adjustments, such as extending exposure time or increasing ozone concentration, to ensure treatment efficacy. The case of Sample 2 is particularly instructive: the replicate that failed to generate microbubbles and exhibited low ORP (122 mV) also failed to eliminate coliforms, while the replicates with high ORP (>520 mV) and microbubbles succeeded. This directly demonstrates that ORP serves as an effective indicator of proper ozone dissolution and, by extension, of disinfection potential.
The superiority of microbubbles in ozonation lies in fundamental physical and chemical principles. Due to their small diameter, microbubbles exhibit a significantly higher surface area-to-volume ratio than conventional bubbles, thereby maximizing the gas-liquid contact area and accelerating ozone transfer to the aqueous phase [22]. Additionally, microbubbles have a longer residence time in the water column and rise more slowly than larger bubbles, thereby extending the contact period between dissolved ozone and target microorganisms. An even more relevant phenomenon is the collapse of microbubbles under hydrostatic pressure, a process that generates localized energy sufficiently intense to produce hydroxyl radicals (•OH) in addition to those generated by spontaneous ozone decomposition [21]. This mechanism potentiates the Advanced Oxidation Process (AOP), increasing the capacity to mineralize persistent organic compounds and inactivate resistant microorganisms [23]. In our system, the observation of a foam-like layer on the water surface in successful replicates (Samples 2 and 5) indicates the presence of stable microbubbles and efficient mass transfer. The recirculation of ozonated water, another component of our system, complements this mechanism by ensuring uniform distribution of dissolved ozone and prolonging effective contact time, creating optimal conditions for reaction with contaminants and pathogens throughout the entire water volume [21]. Studies demonstrate that microbubble production enhances water disinfection by improving mass transfer efficiency, increasing dissolved ozone levels, and making the disinfection process more effective and faster [22]. Furthermore, the larger surface area of microbubbles facilitates ozone penetration into microbial cells, improving the destruction of these organisms. In contrast, larger ozone bubbles have a lower dissolution rate due to their smaller surface area relative to volume, which slows ozone dissociation in water. As a result, disinfection may be less efficient because less ozone dissolves and becomes available to oxidize microorganisms [22,24]. It is critical to emphasize that in our OGS, achieving optimal microbubble conditions was not always possible, as evidenced by a foam-like layer on the water surface, which formed only at the highest ORP values. This observation highlights a strong correlation between microbubble generation and both ORP elevation and microbial inactivation in the presence of contamination. The formation observed in successful treatments suggests that the system approached, but did not consistently maintain, ideal microbubble dispersion, explaining the variable disinfection outcomes across replicates. These results underscore that while microbubble technology enhances the efficacy of ozonation, its implementation requires precise control of bubble-size distribution and gas-liquid mixing dynamics.
The increase in pH observed in most samples (from a mean of 6.3 to 7.2) is consistent with ozone decomposition and the generation of hydroxyl radicals in an aqueous medium. When ozone decomposes, especially in the presence of organic compounds and ions such as hydroxide (OH⁻), it triggers chain reactions that can consume protons (H⁺) or generate alkaline species, such as bicarbonate and carbonate, thereby raising the final pH [14,25,26,27]. When dissolved in water, ozone reacts with compounds present in the medium, producing reactive species such as hydroxyl radicals, which are frequently associated with the generation of alkaline ions that increase pH. The more reactive the compounds in the medium, the greater the potential for a rise in pH. The case of Sample 11, whose pH jumped from 4.9 (acidic) to 7.1 (neutral), exemplifies intense reactions between ozone and acidic species present in the sample. This substantial change may indicate more intense reactions between ozone and acidic species present in the sample [14,25,26]. However, the magnitude of this increase and its impact on microbial inactivation were clearly mediated by mass transfer efficiency. Samples that achieved high ORP and microbubble conditions (2, 5, 9, 13) also exhibited the most pronounced pH elevations, indicating that efficient ozone dissolution promotes not only microbial oxidation but also chemical transformations in the aqueous matrix. The overall average pH increase suggests that ozonation increased water alkalinity in some samples, possibly due to the oxidation of organic or inorganic compounds, thereby releasing bases (such as bicarbonate). Although this change depends on the water's initial chemical composition, the increase is consistent with chemical processes promoted by ozone [27,28].
The minimal variations observed in mean Total Dissolved Solids (TDS) (35.9 ppm to 41.1 ppm) and Electrical Conductivity (EC) (73.4 µS/cm to 83 µS/cm) are within expected ranges for ozonation, since the process does not remove dissolved solids but rather oxidizes them, potentially converting them into soluble ionic forms [14,26]. Ozone treatment typically does not cause significant changes in TDS, as ozone itself does not remove dissolved solids. While its oxidative action may convert organic materials or dissolved metals into soluble compounds, it primarily improves other parameters, such as microbiological quality. The subtle increase in these parameters in most samples suggests the breakdown of complex organic molecules into smaller, ionized compounds that contribute to conductivity. The individual analysis revealed TDS increases in all samples except three (1, 8, and 14) after ozonation, suggesting that the process converted existing organic or inorganic compounds in the water into dissolved forms. This occurs because ozone's powerful oxidation breaks complex molecules into smaller, soluble components. Although increased TDS does not necessarily indicate poorer water quality, it may reflect higher dissolved ion concentrations that could influence taste, electrical conductivity, and even water corrosiveness [14,26].
The reduction in TDS and EC observed in Samples 1 and 8 is particularly interesting, as it may indicate the precipitation of oxidized metals (such as iron and manganese) or the conversion of ions into neutral or gaseous forms (such as CO₂), thereby removing them from solution and improving water purity [29]. Such a reduction may indicate effective water purification by removing contaminants or unwanted minerals. The decline in EC could result from the oxidation of acidic/basic compounds, the conversion of cations/anions into insoluble precipitates, and the removal of free ions from the solution. During treatment, ionized molecules may transform into neutral forms (e.g., organic acids becoming CO₂ and water) that no longer contribute to electrical conduction. Since the electric current in liquids is directly proportional to the available charge-carrying ions, the processes described reduce ion concentration, thereby lowering both conductivity and current [14,26,30]. Sample 14 remained an outlier, with exceptionally high TDS and EC values consistent with its known poor quality and elevated contaminant levels that compromise multiple safety aspects (taste, color, microbiological quality). This again reinforces the need for optimized microbubble and ORP conditions to handle complex matrices. These findings demonstrate that although ozonation is not a salt-removal process, it alters the ionic balance of water in a manner consistent with the oxidation of organic and inorganic compounds, thereby contributing to overall water quality improvement.
The investigation of total coliforms corroborated the CFU reduction findings and the correlation with microbubbles/ORP. Coliform bacteria are a group of gram-negative, non-spore-forming bacilli. Being aerobic or facultative anaerobic, these bacteria produce acids and gases through lactose fermentation in lactose broth and BGBLB. Enteric bacteria from the Enterobacteriaceae family, such as Escherichia, Citrobacter, Klebsiella, and Enterobacter, as well as Aeromonas, are included in this group. Due to the relative ease of culturing coliform bacteria, they have been used as an index of fecal contamination for assessing water quality since the early 20th century [31,32].
Ozone is highly effective at eliminating both total and fecal coliforms. Its disinfectant action is based on the oxidation of lipids and proteins in the cell membranes of coliforms, which breaks down cell walls and causes cell death and the inactivation of DNA and RNA, thereby preventing cellular replication and repair [27,33]. Testing for coliform bacteria involves using PAB for presumptive analysis and BGBLB for confirmatory analysis, a common approach for detecting and confirming total coliforms in water and food samples. PAB is a qualitative method used to verify the presence or absence of total coliforms in a sample and is frequently employed in drinking water quality control [33,34]. Lactose fermentation by coliforms generates acids that alter the pH, causing a color change in the pH indicator (typically bromocresol purple) present in the medium. Since this method is presumptive, positive results require confirmation to ensure that the detected microorganisms are indeed coliforms [35]. BGBLB is used to confirm the presence of total coliforms after a positive presumptive analysis. This medium is more selective because it contains inhibitory agents that restrict the growth of Gram-positive and other non-coliform microorganisms. Gas production in the Durham tube is the primary positive characteristic, confirming the presence of total coliforms, while the absence of gas indicates a false-positive presumptive result, demonstrating the sample's freedom from total coliforms. Consequently, BGBLB exhibits high specificity, making it ideal for result confirmation, particularly in situations requiring greater reliability in total coliform detection [34,35].
In our total coliform investigation, ozonation demonstrated high efficacy in eliminating total coliforms in most samples (1, 5, 7, 8, and 12), confirmed by negative results in both the presumptive (PAB) and confirmatory (BGBLB) tests. This result is consistent with ozone's mechanism of action, which oxidizes lipids and proteins in cell membranes and inactivates the genetic material of coliforms, thereby preventing their replication [27,33]. The persistence of coliforms in samples 3, 4, 10, and 14, all associated with low ORP and the absence of efficient microbubbles, reinforces the conclusion that treatment efficacy is contingent on application quality. The case of Sample 2 is again paradigmatic: the partial positivity (one of three replicates positive for coliforms) coincided exactly with the replicate that failed to form microbubbles and exhibited low ORP (122 mV). This finding underscores the importance of process control: even water with treatment potential can fail if operational conditions are not ideal. The presumptive analysis (PAB), while sensitive, exhibited some false positives in control samples (1, 5, 7, and 12), subsequently refuted by BGBLB, confirming the need for the confirmatory stage to ensure coliform detection specificity [35]. These results validate ozonation as an effective barrier against fecal contamination indicators, provided that process conditions are adequately controlled. Sample 2 showed partial positivity (in the third experiment), suggesting incomplete process efficiency under certain conditions. The negative results in both stages ensure that samples (6, 9, 11, and 13) meet acceptable microbiological standards and are suitable for consumption.
In recent years, the use of analytical equipment incorporating MALDI-TOF mass spectrometry has emerged as a novel approach for bacterial species identification [36,37]. The MALDI-TOF MS technique ionizes bacterial proteins and compares their mass spectral patterns with those in comprehensive databases for precise identification [38]. This method enables rapid and accurate identification of bacteria and fungi, proving particularly valuable in ecological studies, environmental biotechnology, agriculture, and plant sciences [39]. A study examining coliform bacterial isolates collected from sewage, river water, and groundwater demonstrated the technique's effectiveness, with specimens identified and classified using MALDI-TOF MS alongside conventional 16S rRNA gene analysis. By comparing the agreement rates between the two identification methods, researchers validated the reliability of MALDI-TOF MS for analyzing coliform bacteria in environmental water samples [40].
The use of MALDI-TOF mass spectrometry enabled a qualitative leap in assessing microbiological risk and treatment efficacy, going beyond traditional contamination indicators to precisely identify the bacterial species present in raw waters. Our untreated samples exhibited considerable microbial diversity, with a particular prevalence of environmentally adaptable genera such as Pseudomonas and Bacillus. Of critical relevance, we identified species with recognized clinical importance and pathogenic potential: Aeromonas bestiarum (Sample 2/11) and Aeromonas eucrenophila (Sample 14/2), a genus associated with gastroenteritis and wound infections; Acinetobacter junii (Sample 12/12), an emerging species in hospital-acquired and community infections; Bacillus cereus (Sample 10/1), known to cause food poisoning; and multiple Pseudomonas species with pathogenic potential, such as P. fluorescens (Sample 14/1) and P. libanensis (Samples 10/4 and 10/6) [40]. The presence of these microorganisms in water intended for human consumption or irrigation poses a public health risk that routine analyses often underestimate. Notably, we identified several clinically and environmentally significant species, such as Bacillus pumilus and Pseudomonas fluorescens, which are known biofilm formers that can complicate water treatment processes. In our investigation, the MALDI-TOF method demonstrated strong performance, generating reliable identification scores for most colonies. However, three distinct colonies remained unidentified, potentially due to limitations in the equipment's reference database or genetic specificity constraints for rare or unknown microorganisms.
The identification of potentially pathogenic species reinforces the need for effective treatments to ensure microbiological safety of water. The precise identification of these clinically relevant pathogens allows us to confidently state that ozone treatment, when optimized through microbubble generation and monitored by ORP, can eliminate not only indicator organisms but also infectious agents of direct importance to human health. Samples that achieved optimal microbubble conditions and high ORP (such as Samples 2 and 5) had their microbial load drastically reduced or eliminated, including the identified pathogens. This finding is crucial for the acceptance of technology by public health bodies and communities, as it demonstrates that ozonation provides protection against a broader spectrum of emerging and opportunistic pathogens commonly found in environmental waters in regions with precarious sanitation.
In our study, the detection of Aeromonas bestiarum and Aeromonas eucrenophila indicates the presence of potentially pathogenic bacteria, often associated with opportunistic infections, along with Acinetobacter junii, another clinically relevant organism that can cause healthcare-associated infections (HAIs). Although we observed positive results in both presumptive and confirmatory analyses for some control samples (experiments 2-3, 3, 4, 8, 10, and 14), none revealed microorganisms indicative of fecal contamination, typically represented by Gram-negative, aerobic or facultative anaerobic bacilli, predominantly from the E. coli, Citrobacter, and Enterobacter genera. It should be noted that while 1 mL of sample was inoculated for total coliform presumptive and confirmatory analysis, only 100 µL was used for MALDI-TOF analysis. This smaller volume likely resulted in fewer isolated microorganisms, explaining why we detected none of the fecal indicator organisms in this analysis. Nevertheless, the presence of Aeromonas spp. and Acinetobacter spp. is equally concerning from a sanitary perspective. The elimination of these organisms by ozone validates the technology as a robust barrier against waterborne disease transmission, positioning it not only as an environmentally friendly solution but also as a clinically relevant tool for decentralized water treatment in vulnerable communities. The identification of these microorganisms in untreated water samples underscores the importance of implementing effective treatment technologies, particularly in regions where water quality monitoring and sanitation infrastructure are limited.
4. Materials and Methods
4.1. Bacterial Strain
The standard strain from the American Type Culture Collection (ATCC) was used, as described below: E. coli (ATCC 8739/0483-CRM), purchased from Plastlabor (Plast Labor Ind e Com E H Lab Ltda-RJ). This bacterial strain was initially cultured according to ATCC instructions, then aliquoted and stored in cryotubes containing Tryptic Soy Broth (Himedia, India) with 20% glycerol (v/v) and kept in a freezer at -20°C for later use. For strain reactivation, it was removed from the freezer stock culture, inoculated into TSB, and incubated at 37°C for 24 h.
4.2. Water Sample
Fourteen water samples were collected from different locations. These samples were collected in sterile bottles with a volume of approximately 1.5 liters and kept refrigerated until analysis (Table 5).

Table 5.
Description of the 14 water samples collected from different locations.
| Strain | Sample description |
|---|---|
| 1 | Water collected from a private well in Praia Seca, Região dos Lagos - R.J. |
| 2 | Water used for irrigation supply in a vegetable garden in Corrêas, Petrópolis - R.J. |
| 3 | Water stored in a washing tank used for a vegetable garden in Corrêas, Petrópolis - R.J. |
| 4 | Rainwater collected in a tank with debris and foliage from a private property in Corrêas, Petrópolis - R.J. |
| 5 | Well water collected from a household tap in Corrêas, Petrópolis, RJ. |
| 6 | Water collected from Private Property 1 in Corrêas, Petrópolis - R.J. |
| 7 | Water collected from Private Property 2 in Corrêas, Petrópolis - R.J. |
| 8 | Water collected from a private cistern in Praia Seca, Região dos Lagos - R.J. |
| 9 | Water collected from the Alcobacinha spring in Cascatinha, Petrópolis - R.J. |
| 10 | Well water collected from a tap in Angra dos Reis, RJ. |
| 11 | Water collected from a well in the Kélé region, Middle-Ogooué Province, Gabon - Central Africa |
| 12 | Water collected from a well in the Eyouga region, Haut-Ogooué Province, Gabon - Central Africa |
| 13 | Water collected from a well in the Eyouga region, Haut-Ogooué Province, Gabon - Central Africa |
| 14 | Water collected directly from Marapendi Lagoon, Barra da Tijuca - RJ |
4.3. Ozone Generating System (OGS)
For the experiment, we used a commercially available ozone generator, named SANITECH MVO3, manufactured by PetroOzônio (Petrópolis, RJ, Brazil). This equipment has a maximum ozone concentration output of 3 g/m³ in water.
4.4. Ozone Treatment Procedure
For sample treatment, we used an OGS with recirculation, where the generated ozone was continuously infused into a plastic tubing connected to the outlet of a submersible aquarium water pump (Submersible Water Pump for Aquarium/Drinking Fountain Pet 220L/H Bivolt, Elo Imports) operating at a maximum flow rate of 150 L/H (Table 6).
This water pump was placed inside an open plastic container with a total volume of approximately 1,584 cm³ (length: 16 cm, width: 11 cm, height: 9 cm). The total volume of water sample used in each experiment was 300 mL, sufficient to cover the water pump. Before the analysis, the entire OGS was decontaminated with sodium hypochlorite (10%), followed by UVC light exposure. The whole experiment was conducted inside a laminar flow hood (Buzzatto’s – Model CFLV-IIA1-1200) to prevent external contamination.
Initially, we agitated the flask containing the sample to be analyzed, measured 300 mL into a sterile graduated cylinder, and transferred this volume to the open plastic container, part of the previously decontaminated OGS. The ozone-generating equipment requires a stabilization period to reach its maximum concentration (ppm). Therefore, we added a 1-min initialization period at the start of each experiment, with all subsequent readings being taken after this initial interval. The sample was exposed to ozone for 1, 5, 10, 15, and 20 min. For isolation and quantification of viable microorganisms in the liquid sample (Colony Forming Units per milliliter - CFU/mL), we withdrew a 1 mL aliquot after each exposure time. This aliquot was plated on TSB agar using the Pour Plate technique and incubated at 37°C for 24 h. As a positive control, we used TSB agar plates containing the same water sample without ozone exposure. These control plates were maintained at room temperature before being incubated at 37°C for 24 hours alongside the ozone-exposed samples. All assays were performed in triplicate. A plate containing only TSA served as the negative control. Colony counting was conducted exclusively on plates showing 0-300 colonies, as this range provides statistically reliable counts for quantitative analysis.
4.5. Statistical Analysis
Each experiment was performed in triplicate for each sample across all ozone treatments. The collected data were analyzed using the nonparametric Wilcoxon (Mann-Whitney U) test to assess the statistical significance between samples (with and without O₃ treatment). Significant differences were determined at p ≤ 0.05 and p ≤ 0.01.
4.6. Total Coliform Testing
4.6.1. Presumptive Analysis
This essay was performed only with samples exposed to ozone for 20 minutes. At the start of the test, we agitated the flask containing the water sample to be analyzed and aseptically transferred 100 mL of the sample to a flask containing 50 mL of triple-strength presence/absence broth (PAB). The flask was then homogenized once or more. The sample was incubated for up to 48 hours at 35.0°C ± 0.5°C. The assay was performed in triplicate. As a positive control, we followed the same procedure using a sample not exposed to ozone. As a negative control, we simultaneously incubated PAB without any sample. We performed a confirmatory analysis on samples that showed a color change from purple to yellow.
4.6.2. Confirmatory Analysis
For cultures showing growth with acid and/or acid and gas production in the presumptive analysis, we transferred a loopful to a tube containing 10 mL of Brilliant Green Bile Lactose Broth (BGBLB) with a Durham tube. The tube was incubated for up to 48 ± 3 hours at 35.0°C ± 0.5°C. The presence of gas in the Durham tube confirms the presence of total coliforms. The assay was performed in triplicate.
4.6.3. Culture Media Controls
We inoculated a loopful of Escherichia coli ATCC CRM-8739 culture into 50 mL of triple-strength PAB supplemented with 100 mL of sterile water, and the same medium without microorganisms (blank control) supplemented with 100 mL of sterile water. Additionally, we inoculated a tube containing 10 mL of BGBLB broth, and the same medium without microorganisms (blank control). All samples were incubated at 35.0°C ± 0.5°C for 18 to 24 h. After incubation, the media exhibited the following characteristics: 1) PAB (positive) - Turbidity and acidification, changing the medium color to yellow; 2). PAB (negative) - Medium color remained unchanged (purple); 3). BGBLB (positive) - Medium turbidity and gas presence in the Durham tube, and 4). BGBLB (negative) - No changes, medium retained original color.
4.7. Monitoring of pH, Temperature, TDS, EC, and ORP
The physicochemical characteristics of the water were monitored after 20 min, including hydrogen potential (pH), temperature, total dissolved solids (TDS), electrical conductivity (EC), and oxidation-reduction potential (ORP), for both untreated and ozone-treated water samples. All measurements were performed following the same protocol: first, the electrode was cleaned with distilled water, dried with filter paper, and then inserted directly into a 50 mL aliquot of the sample contained in a sterile beaker. For pH measurement and monitoring, we used a benchtop pH meter (Model SIMPLA-PH-140) with a measuring range of 0 to 14 pH, along with an electrode, probe, and holder. For temperature, TDS, and EC measurements, we used a portable TDS & EC conductivity meter (Knupp, KP-AA008, China), which measures in ppm and µS/cm and includes a thermometer function. ORP measurement and monitoring were performed using a portable water quality meter (ORP-2069), an open-type tester with a backlight and an ORP redox detector, suitable for aquaculture and pool applications, featuring a measurement range of 0 to ±1999 mV (Aliexpress).
4.8. Mass Spectrometry (MALDI-TOF)
This procedure was performed in collaboration with the Integrated Laboratory for Simuliids and Onchocerciasis and the Medical and Forensic Entomology unit at the Oswaldo Cruz Institute (IOC/Fiocruz). After agitating the flask containing each water sample, 100 µL aliquots were plated onto Tryptic Soy Agar (TSA) using the spread plate method. The plates were incubated at 35.0°C ± 0.5°C for 18–24 h. Colonies from each sample were identified by mass spectrometry after growth in Tryptic Soy Broth (TSB) and subculturing, followed by 24 h on Nutrient Agar (OXOID, UK). Identification was performed using Matrix-Assisted Laser Desorption/Ionization Time of Flight (MALDI-TOF MS) technology with a MALDI-TOF-MS MicroflexLT instrument (Bruker Daltonics, Bremen, Germany) at the Mass Spectrometry Microbial Diagnostic Platform of the Evandro Chagas National Institute of Infectious Diseases/Fiocruz. The MALDI-TOF-MS analysis was conducted using a Bruker MALDI Biotyper system, with instrument ID 8604674.04831 and server version 4.1.100 (PYTH) 174 2019-06-158_01-16-09. For identification, 1 µL of α-cyano-4-hydroxycinnamic acid matrix was added to all strains. Strains not identified or not identified to the species level underwent repeat MALDI-TOF-MS analysis with prior addition of 1 µL of formic acid. Result interpretation was based on score values: 1) Scores between 2.00 and 3.00 indicated high-confidence species identification, and 2). Scores between 1.70 and 1.99 indicated low-confidence identification (Table 6). Additionally, result consistency was evaluated: 1) Category A: High consistency and reliable identification; 2) Category B: Low consistency; and 3) Category C: No consistency (Table 7).
5. Conclusions
Access to clean and safe water is essential for human survival, community development, economic growth, and the maintenance of a balanced ecosystem. This study demonstrates that the efficacy of ozone water disinfection is intrinsically linked to the efficiency of its transfer to the liquid phase. Our results show that microbubble generation is the determining factor for achieving high Oxidation-Reduction Potential (ORP) and, consequently, robust and reliable microbial inactivation. The failure of microbubble formation, even under nominally identical operational conditions, resulted in low ORP and persistence of contaminants, including total coliforms. This finding is crucial for the development of ozonation systems for real-world applications, where water quality variability is the norm. We recommend that water treatment plant designs utilizing ozone prioritize technologies that maximize microbubble formation and incorporate continuous ORP monitoring not only as a quality parameter but as a real-time process control tool. By elucidating the critical mechanism governing the success of ozonation, this work provides a clear pathway to make this technology not only an ecological alternative to chlorine but also a consistently superior solution for producing safe water.
Author Contributions
Conceptualization, K.R.; methodology, K.R., Z.V., M.L.B.; validation, K.R.; data curation, K.R., G.C.L., and M.H.S.V.-B.; writing original draft preparation, K.R.; writing - review and editing, K.R. and S.G.D.-S.; visualization, M.H.S.V.-B.; project administration, K.R.; funding acquisition, S.G.D-S. All authors have read and agreed to the published version of the manuscript.
Funding
This research was funded by the Carlos Chagas Filho Foundation for Research Support of the State of Rio de Janeiro (FAPERJ #E-26 110.198-13; #E26 202.841-2018) and the Brazilian Council for Scientific Research (CNPq #3075732011; 3013322015-0).
Institutional Review Board Statement
Not applicable.
Data Availability Statement
The authors declare that the article file contains the data that support the study's conclusions.
Acknowledgments
We thank the Rudolf Barth Electron Microscopy Platform of the Oswaldo Cruz Institute/FIOCRUZ for the use of electron microscopy analysis facilities. K.R. and G.C.L. are post-doc fellows from CAPES/CDTS-FIOCRUZ. Conflicts of Interest: The authors declare no conflict of interest
Conflicts of Interest
The authors declare no conflicts of interest.
References
- Von Sonntag, C.; Von Gunten, U. Chemistry of Ozone in water and waste-water treatment: from basic principles to applications; IWA Publishing: London, 2012; 306 p, ISBN 9781780400839. [Google Scholar]
- Chen, S.; Qiao, Y.; Jiang, Y.; Qiu, W.; Zang, S.; Zhang, J.; Wang, X.; Ma, J. Trace analysis of 59 halogenated aromatic disinfection by-products through the SPE-LC-MS/MS method and their occurrence and transformation during chlorine disinfection. J Environ Sci (China). 2025, 157, 821–832. [Google Scholar] [CrossRef] [PubMed]
- Dhanda, N.; Kumar, S. Water disinfection and disinfection by-products. Environ Monit Assess. 2025, 197, 461. [Google Scholar] [CrossRef] [PubMed]
- Kruithof, J.C.; Masschelein, W.J. State-of-the-art of the application of ozonation in BENELUX drinking water treatment. Ozone: Science and Engineering 1999, 21, 139–152. [Google Scholar] [CrossRef]
- Sorlini, S.; Collivignarelli, C. Trihalomethane formation during chemical oxidation with chlorine, chlorine dioxide, and ozone of ten Italian natural waters. Desalination. 2005, 176, 103–111. [Google Scholar] [CrossRef]
- Zhang, B.; Xian, Q.; Lu, J.; Gong, T.; Li; A. Feng, J. Evaluation of DBPs formation from SMPs exposed to chlorine, chloramine, and ozone. J Water Health 2017, 15, 185–195. [Google Scholar] [CrossRef]
- Mazhar, M.A.; Khan, N.A.; Ahmed, S.; Khan, A.H.; Hussain, A.; Rahisuddin; Changani, F.; Yousefi, M.; Ahmadi, S.; Vambol, V. Chlorination disinfection by-products in municipal drinking water – A review. J Clean Prod. 2020, 10, 123159. [Google Scholar] [CrossRef]
- Forster, A.L.B.; Wiskur, S.L.; Richardson, S.D. Formation of eight classes of DBPs from chlorine, chloramine, and ozone: Mechanisms and formation Pathways. Environ Sci Technol 202521. [Google Scholar] [CrossRef]
- Karanis, P.; Kourenti, C.; Smith, H. Waterborne transmission of protozoan parasites: a worldwide review of outbreaks and lessons learnt. J Water Health. 2007, 5, 1–38. [Google Scholar] [CrossRef]
- Xu, H.; Yang, A.; Pang, Y.; Pei, H. Advances and challenges in the technologies for cyanobacterial cells removal in drinking water treatment. Chemosphere. 2024, 359, 142338. [Google Scholar] [CrossRef]
- Arana, I.; Santorum, P.; Muela, A.; Barcina, I. Chlorination and ozonation of waste-water: comparative analysis of efficacy through the effect on Escherichia coli membranes. J Appl Microbiol. 1989, 86, 883–8. [Google Scholar] [CrossRef]
- Camel, V.; Bermond, A. The use of ozone and associated oxidation processes in drinking water treatment. Water Res. 1998, 32, 3208–22. [Google Scholar] [CrossRef]
- Hoigné, J. Chemistry of aqueous ozone, and transformation of pollutants by ozonation and advanced oxidation processes. In The handbook of environmental chemistry, quality and treatment of drinking water; Hubrec, J., Ed.; Springer: Berlin, 1998. [Google Scholar]
- Von Gunten, U. Ozonation of drinking water: Part I. Oxidation kinetics and product formation. Water Res. 2003, 37, 1443–67. [Google Scholar] [CrossRef] [PubMed]
- Staehelin, J.; Hoigné, J. Decomposition of ozone in water in the presence of organic solutes acting as promoters and inhibitors of radical chain reactions. Environ Sci Technol. 1985, 19, 1206–13. [Google Scholar] [CrossRef] [PubMed]
- Facile, N.; Barbeau, B.; Prevost, M.; Koudjonou, B. Evaluating bacterial aerobic spores as a surrogate for Giardia and Cryptosporidium inactivation by ozone. Water Res. 2000, 34, 3238–46. [Google Scholar] [CrossRef]
- Mahmoodi, M.; Pishbin, E. Ozone-based advanced oxidation processes in water treatment: recent advances, challenges, and perspective. Environ Sci Pollut Res Int. 2005, 32, 3531–3570. [Google Scholar] [CrossRef]
- Hoigné, J.; Bader, H. Characterization of water quality criteria for ozonation processes. Part II: Lifetime of added ozone. Ozone: Sci Eng. 2013, 1994, 121–134. [Google Scholar] [CrossRef]
- Langlais, B.; Reckhow, D.A.; Brink, D.R. Ozone in water treatment: application and engineering; Lewis Publisher: Paris, 2019. [Google Scholar]
- Richardson, S.D. Water analysis: emerging contaminants and current issues. Anal Chem. 2009, 81, 4645–4677. [Google Scholar] [CrossRef]
- Liang, J.; Fei, Y.; Yin, Y.; Han, Q.; Liu, Y.; Feng, L.; Zhang, L. Advancements in waste-water treatment: A comprehensive review of ozone microbubbles technology. Environ Res. 2025, 266, 120469. [Google Scholar] [CrossRef]
- Seki, M.; Ishikawa, T.; Terada, H.; Nashimoto, M. Microbicidal Effects of stored aqueous ozone solution generated by nano-bubble technology. In Vivo. 2017, 31, 579–583. [Google Scholar] [CrossRef]
- Von Gunten, U. Ozonation of drinking water: Part II. Disinfection and by-product formation in presence of bromide, iodide or chlorine. Water Res. 2003, 37, 1469–87. [Google Scholar] [CrossRef]
- Holcomb, D.A.; Stewart, J.R. Microbial Indicators of Fecal Pollution: Recent Progress and Challenges in Assessing Water Quality. Curr Environ Health Rep. 2020, 7, 311–324. [Google Scholar] [CrossRef] [PubMed]
- Ershov, B.G.; Morozov, P.A. The kinetics of ozone decomposition in water, the influence of pH and temperature. Russ. J Phys Chem. 2009, 83, 1295–1299. [Google Scholar] [CrossRef]
- Galdeano, M.C.; Wilhelm, A.E.; Goulart, I.B.; Tonon, R.V.; Freitas-Silva, O.; Germani, R.; Chávez, D.W.H. Effect of water temperature and pH on the concentration and time of ozone saturation. Braz. J Food Technol. 2018, 21, e2017156. [Google Scholar] [CrossRef]
- Kalandarov, P.; Zhunussov, K.; Kassimov, A.; Baibolov, B.; Junussov, N.; Kaliyeva, K. Changes in pH during the ozonation process of surface water. E3S Web Conf. 2004, 563, 01020. [Google Scholar] [CrossRef]
- BRASIL; Ministério da Saúde. Portaria GM/MS nº 888, de 4 de maio de 2021. Dispõe sobre os padrões de qualidade para água potável. Available online: https://www.in.gov.br (accessed on 15 March 2025).
- Martinelli, M.; Giovannangeli, F.; Rotunno, S.; Trombetta, C.M.; Montomoli, E. Water and air ozone treatment as an alternative sanitizing technology. J Prev Med Hyg. 2017, 58, E48–E52. [Google Scholar] [CrossRef]
- Tanner, B.D.; Kuwahara, S.; Gerba, C.P.; Reynolds, K.A. Evaluation of electrochemically generated ozone for the disinfection of water and waste-water. Water Sci Technol. 2004, 50, 19–25. [Google Scholar] [CrossRef]
- Fox, G.E.; Stackebrandt, E.; Hespell, R.B.; Gibson, J.; Maniloff, J.; Dyer, T.A.; Wolfe, R.S.; Balch, W.E.; Tanner, R.S.; Magrum, L.J.; et al. The phylogeny of prokaryotes. Science 1980, 209, 457–63. [Google Scholar] [CrossRef]
- BRASIL. ANVISA (2002) Resolução RDC nº 275.; de 21 de outubro de 2002. Dispõe sobre o regulamento técnico de boas práticas para serviços de alimentação. Available online: https://www. (accessed on 15 July 2025).
- Manasfi, T. Chapter Four - Ozonation in drinking water treatment: an overview of general and practical aspects, mechanisms, kinetics, and by-product formation. Compr An Chem. 2021, 92, 85–116. [Google Scholar] [CrossRef]
- Feng, P.; Weagant, S.D.; Grant, M. A Enumeration of Escherichia coli and the coliform bacteria: Bacteriological analytical manual (BAM); U.S. Food and Drug Administration, 2022. [Google Scholar]
- Sauer, S.; Kliem, M. Mass spectrometry tools for the classification and identification of bacteria. Nat Rev Microbiol. 2010, 8, 74–82. [Google Scholar] [CrossRef]
- Liu, H.; Du, Z.; Wang, J.; Yang, R. Universal sample preparation method for characterization of bacteria by matrix-assisted laser desorption ionization-time of flight mass spectrometry. Appl Environ Microbiol. 2007, 73, 1899–907. [Google Scholar] [CrossRef]
- Sauer, S.; Freiwald, A.; Maier, T.; Kube, M.; Reinhardt, R.; Kostrzewa, M.; Geider, K. Classification and identification of bacteria by mass spectrometry and computational analysis. PLoS One 2008, 3, e2843. [Google Scholar] [CrossRef]
- Welker, M.; Moore, E.R. Applications of whole-cell matrix-assisted laser-desorption/ionization time-of-flight mass spectrometry in systematic microbiology. Syst Appl Microbiol. 2011, 34, 2–11. [Google Scholar] [CrossRef]
- Ashfaq, M.Y.; Da'na, D.A.; Al-Ghouti, M.A. Application of MALDI-TOF MS for identification of environmental bacteria: A review. J Environ Manage 2022, 305, 114359. [Google Scholar] [CrossRef]
- Suzuki, Y.; Niina, K.; Matsuwaki, T.; Nukazawa, K.; Iguchi, A. Bacterial flora analysis of coliforms in sewage.; river water.; and ground water using MALDI-TOF mass spectrometry. J Environ Sci Health A Tox Hazard Subst Environ Eng. 2018, 53, 160–173. [Google Scholar] [CrossRef]
Figure 1.
Reduction in the number of Colony Forming Units (CFU/mL) in water samples over different ozone exposure times (1, 5, 10, 15, and 20 min). The data illustrate the gradual effectiveness of the treatment in reducing or eliminating the microbiological load. Note: Samples 3 and 14 (not shown) did not show a reduction, correlating with low ORP values and the absence of microbubbles (see Discussion).

Figure 2.
Comparative monitoring of physical-chemical parameters (Temperature, pH, TDS, EC, and ORP) in water samples before (control) and after 20 min of ozone treatment. Mean and standard deviation by parameter.
Figure 2.
Comparative monitoring of physical-chemical parameters (Temperature, pH, TDS, EC, and ORP) in water samples before (control) and after 20 min of ozone treatment. Mean and standard deviation by parameter.

Table 1.
Colony count and percentage reduction of Colony-Forming Units (CFU/mL) in 10 out of the 14 analyzed water samples. Quantification was performed for both the control group (untreated) and samples treated with ozone at exposure times of 1, 5, 10, 15, and 20 minutes. Samples with values exceeding 300 CFU/mL were considered to be highly contaminated (*).
| Strain | Control (CFU/ML) |
Ozone Exposure Time | ||||
|---|---|---|---|---|---|---|
| 1’ | 5’ | 10’ | 15’ | 20’ | ||
| Count nº CFU/mL / % reduction | ||||||
| 1 | 18,3 | 19* | 6,3/65,6 | 5/72,7 | 4,3/76,5 | 1,3/92,9 |
| 2 | 155 | 5/96,8 | 2/98,7 | 2,5/98,4 | 0/100 | 2/98,7 |
| 3* | > 300 | > 300 | > 300 | > 300 | > 300 | > 300 |
| 4 | 29,3 | 29,3* | 28,6/2,4 | 18,3/37,5 | 20,7/29,4 | 16,3/44,4 |
| 5 | > 300 | 0/100 | 0/100 | 0/100 | 0/100 | 0/100 |
| 7 | 3,3 | 1/69,7 | 0/100 | 0/100 | 0/100 | 0/100 |
| 8 | 4,3 | 3/30,2 | 0,7/83,7 | 0/100 | 0/100 | 0/100 |
| 10 | 44,7 | 33,7/24,6 | 35,7/20,13 | 33/26,2 | 27,3/38,9 | 24,33/45,6 |
| 12 | 6,3 | 7* | 5,3/15,9 | 4/36,5 | 0/100 | 0/100 |
| 14* | > 300 | > 300 | > 300 | > 300 | > 300 | > 300 |
* No reduction (CFU).
Table 2.
Average of the physical-chemical parameters (Temperature, pH, TDS, EC, and ORP) of the water samples analyzed before (control) and after 20 min of ozone treatment. The overall averages are calculated excluding atypical values (*).
Table 2.
Average of the physical-chemical parameters (Temperature, pH, TDS, EC, and ORP) of the water samples analyzed before (control) and after 20 min of ozone treatment. The overall averages are calculated excluding atypical values (*).
| Strain | T (°C) C/T |
pH C/T |
TDS (ppm) C/T |
EC (µS/cm) C/T |
ORP (mV) C/T |
|||||
|---|---|---|---|---|---|---|---|---|---|---|
| 1 | 22,6 | 24,8 | 6,46 | 7,2 | 36 | 13,7 | 72 | 27,3 | 222 | 201,3 |
| 2 | 23,7 | 25,4 | 6,18 | 7,4 | 23 | 36 | 46 | 69,7 | 206 | 388,7 |
| 3 | 25,5 | 27,4 | 7,24 | 7,94 | 39 | 48,3 | 78 | 96,7 | 156 | 119,7 |
| 4 | 24,2 | 26,9 | 5,92 | 6,8 | 6 | 9,3 | 12 | 21,7 | 285 | 150,7 |
| 5 | 22 | 26,2 | 6,18 | 7,27 | 39 | 64,3 | 78 | 126,7 | 149 | 453,3 |
| 6 | 24,2 | 26,1 | 6,62 | 6,99 | 39 | 43,7 | 78 | 88,3 | 273 | 431 |
| 7 | 24,7 | 25,8 | 6,73 | 6,96 | 30 | 42 | 60 | 82 | 195 | 212,3 |
| 8 | 23 | 26 | 6,33 | 7,5 | 178 | 160 | 346 | 318,7 | 136 | 149 |
| 9 | 20 | 25,9 | 7,32 | 7,7 | 12 | 16,1 | 24 | 58 | 211 | 402,3 |
| 10 | 24,2 | 26,8 | 7,39 | 7,37 | 14 | 18,3 | 28 | 31 | 163 | 168,7 |
| 11 | 23,1 | 26,7 | 4,9 | 7,1 | 0,09 | 3,4 | 18 | 21,3 | 172 | 144,3 |
| 12 | 27,9 | 28,2 | 6,23 | 7,5 | 31 | 41,3 | 62 | 82,7 | 244 | 149,3 |
| 13 | 24,2 | 25,8 | 4,78 | 6 | 19 | 27 | 52 | 53,3 | 271 | 554 |
| 14 | 22,8 | 25,4 | 6,3 | 7,7 | 9999 * | 9999 * | 1999x10 * | 1999x10 * | 167 | 127 |
| Average | 23,7 | 26,3 | 6,3 | 7,2 | 35,9 | 41,1 | 73,4 | 83 | 206,4 | 260,8 |
C: Control (untreated); T: treated.
Table 3.
Interpretation of the results of the presumptive and confirmatory analysis for CPA and CVBBL of the control (untreated) and ozone-treated (20 min) samples.
Table 3.
Interpretation of the results of the presumptive and confirmatory analysis for CPA and CVBBL of the control (untreated) and ozone-treated (20 min) samples.
| Total Coliform Research | Strains | |||||||||
|---|---|---|---|---|---|---|---|---|---|---|
| 1, 5, 7, 12 | 2 | 3, 4, 10, 14 | 6, 9, 11, 13 | 8 | ||||||
| C | T 1ˢᵗ/2ⁿᵈ/3ʳᵈ |
C | T 1ˢᵗ/2ⁿᵈ/3ʳᵈ |
C | T 1ˢᵗ/2ⁿᵈ/3ʳᵈ |
C | T 1ˢᵗ/2ⁿᵈ/3ʳᵈ |
C | T 1ˢᵗ/2ⁿᵈ/3ʳᵈ |
|
| Presumptive (CPA) | + | −/−/− | + | −/−/+ | + | +/+/+ | − | −/−/− | + | −/−/− |
| Confirmatory (CVBBL) | − | −/−/− | + | −/−/+ | + | +/+/+ | − | −/−/− | + | −/−/− |
C: Control (untreated); T: Treated;1ˢᵗ/2ⁿᵈ/3ʳᵈ: First, second, and third experiments; PAB: Presence/Absence Broth; BGBLB: Brilliant Green Bile Lactose Broth.
Table 3A.
Experimental evidence of the critical role of microbubbles and ORP in determining ozone disinfection success: Replicate analysis of sample 2.
Table 3A.
Experimental evidence of the critical role of microbubbles and ORP in determining ozone disinfection success: Replicate analysis of sample 2.
| Experiment (Sample 2, 20 min) |
UFC reduction (%) | ORP (mV) |
Coliform result (BGBLB) |
Microbubbles observed |
|---|---|---|---|---|
| 1 | 98.7 | 523 | Negative | Yes |
| 2 | 98.7 | 521 | Negative | Yes |
| 3 | 0 | 122 | Positive | No |
Table 4.
MALDI-TOF mass spectrometry identification of microorganisms isolated from non-ozone-treated water samples.
Table 4.
MALDI-TOF mass spectrometry identification of microorganisms isolated from non-ozone-treated water samples.
| Sample/ Colony |
Morphotype | ID. MALDI-TOF | Score | Category |
|---|---|---|---|---|
| 1/1 | Small white colony | Bacillus mycoides | 2.40 | A |
| 1/2 | Flat white colony with central depression | Paenibacillus pabuli | 1.77 | B |
| 1/3 | White colony | Bacillus mycoides | 2.22 | A |
| 1/4 | Mucoid white colony | Pseudomonas chlororaphis | 1.94 | B |
| 1/5 | Rough white colony | Bacillus mycoides | 1.82 | B |
| 1/6 | Medium-sized mucoid white colony | Pseudomonas corrugata | 1.95 | B |
| 1/7 | Medium white colony | Pseudomonas chlororaphis | 1.91 | B |
| 1/8 | Medium white colony | Bacillus mycoides | 2.24 | A |
| 2/1 | Very small white colony | Pseudomonas extremorientalis | 2.20 | B |
| 2/2 | Medium-sized mucoid white colony | Pseudomonas koreensis | 1.94 | B |
| 2/3 | Medium white colony | Pseudomonas koreensis | 1.94 | B |
| 2/4 | Small white colony | Pseudomonas rhodesiae | 1.92 | B |
| 2/5 | Medium white colony | Pseudomonas koreensis | 2.00 | A |
| 2/6 | Medium white colony with irregular edge | Pseudomonas extremorientalis | 1.94 | B |
| 2/7 | Yellow colony with irregular, rough margin | Pseudomonas extremorientalis | 1.91 | B |
| 2/8 | Flat, irregular white colony | No Organism Identification Possible | 1.63 | C |
| 2/9 | Medium white colony | Pseudomonas koreensis | 1.97 | B |
| 2/10 | Small yellowish colony | Paenarthrobacter ilicis | 2.21 | A |
| 2/11 | Small white colony | Aeromonas bestiarum | 2,02 | A |
| 2/12 | Small white colony | Pseudomonas rhodesiae | 1.95 | B |
| 3/1 | Medium white colony adhering to the plate | Bacillus pumilus | 1.76 | B |
| 3/2 | Translucent gel-like colony with yellow-edged root-like projections | No Organism Identification Possible | 1.46 | C |
| 4/1 | Yellow colony with irregular, rough margin | Pseudomonas grimontii | 1.93 | B |
| 4/2 | Rough white colony with a cloud-like appearance | Pseudomonas koreensis | 2.13 | A |
| 4/3 | Medium irregular white colony | Bacillus pumilus | 1.90 | B |
| 4/4 | White/translucent irregular colony | Pseudomonas koreensis | 2,09 | A |
| 4/5 | Cracked white colony with cloud effect | Bacillus pumilus | 1.82 | B |
| 4/6 | Irregular translucent colony | Pseudomonas antarctica | 1.99 | B |
| 5/1 | Small translucent colony | No Organism Identification Possible | 1.36 | C |
| 5/2 | Small translucent colony | Cupriavidus basilensis | 1.76 | B |
| 5/4 | Tiny colony | Microbacterium testaceum | 1.73 | B |
| 5/5 | Small translucent colony | Microbacterium testaceum | 1.76 | B |
| 5/6 (PP) | Very small yellowish colony | Rhodococcus erythropolis | 2,03 | A |
| 5/6 (O) | "Fried egg"-like colony | Pseudomonas koreensis | 1.99 | B |
| 5/6 (M) | Medium translucent colony | Bacillus pumilus | 1.94 | B |
| 7/1 | Medium mucoid white colony | Pseudomonas koreensis | 1.88 | B |
| 7/2 | Medium mucoid white colony | Pseudomonas koreensis | 2.00 | A |
| 9/1 | Medium mucoid white colony | Pseudomonas koreensis | 1.84 | B |
| 9/2 | Medium mucoid white colony | Pseudomonas koreensis | 1.95 | B |
| 9/3 | Medium translucent "watery"-appearing colony | Pseudomonas corrugata | 2,01 | A |
| 9/4 | Medium translucent "watery"-appearing colony | Pseudomonas corrugata | 2,02 | A |
| 9/5 | Medium orange colony | Pseudomonas marginalis | 2,09 | B |
| 9/6 | Medium orange colony | Pseudomonas marginalis | 2.00 | A |
| 10/1 | Rough white colony | Bacillus cereus | 2,08 | A |
| 10/2 | Small yellowish colony | Paenarthrobacter nicotinovorans | 2.17 | B |
| 10/3 | Small yellowish colony | Paenarthrobacter nicotinovorans | 2.38 | B |
| 10/4 | Small yellowish colony with a central dot | Pseudomonas libanensis | 2.19 | A |
| 10/5 | Irregular white colony | Micrococcus luteus | 2,08 | A |
| 10/6 | Small yellowish colony | Pseudomonas libanensis | 2,11 | A |
| 12/1 | Small translucent colony | Comamonas testosteroni | 2.17 | A |
| 12/2 | Very small translucent colony | Pseudarthrobacter siccitolerans | 1.95 | B |
| 12/3 | Small translucent colony | Pseudarthrobacter oxydans | 1.92 | B |
| 12/4 | Very small translucent colony | Comamonas testosteroni | 2.11 | A |
| 12/5 | Very small translucent colony | Comamonas testosteroni | 2,07 | A |
| 12/6 | Medium translucent colony with irregular margin | Comamonas testosteroni | 2.15 | A |
| 12/8 | Small translucent colony | Comamonas testosteroni | 2.17 | A |
| 12/9 | Small translucent colony | Pseudarthrobacter oxydans | 1.95 | B |
| 12/10 | Translucent colony with irregular border | Comamonas testosteroni | 2,07 | A |
| 12/12 | Small translucent colony | Acinetobacter junii | 2.33 | A |
| 12/13 | Very small, watery, translucent colony | Pseudarthrobacter oxydans | 1.82 | B |
| 14/1 | Rough yellowish colony | Pseudomonas fluorescens | 1.94 | B |
| 14/2 | Medium white/yellowish colony | Aeromonas eucrenophila | 2,03 | A |
Table 6.
Pump Specifications.
| Parameters | Measure |
|---|---|
| Dimensions | 3,5 x 3,5 x 4 cm |
| Weight | 64g |
| Power | 3W |
| Maximum flow rate | 150L/H |
| Water column (Maximum height) | 60cm |
| Outlet diameter | 8mm |
| Voltage | 110-240V |
| Power cord length | 1.47 meters |
Table 6.
Meaning of Score Values.
| Range | Interpretation | Symbols | Color |
|---|---|---|---|
| 2.00 - 3.00 | High-confidence identification | (+++) | green |
| 1.7 – 1.99 | Low-confidence identification | (+) | yellow |
| 0.00 – 1.69 | No Organism Identification Possible | (−) | red |
Table 7.
Meaning of Consistency Categories (A-C).
| Category | Interpretation |
|---|---|
| (A) | High consistency: The best match is a high-confidence identification. The second-best match is (1) a high-confidence identification in which the species is identical to the best match, (2) a low-confidence identification in which the species or genus is identical to the best match, or (3) a non-identification. |
| (B) | Low consistency: The requirements for high consistency are not met. The best match is a high- or low- confidence identification. The second-best match is (1) a high- or low-confidence identification in which the genus is identical to the best match or (2) a non-identification. |
| (C) | No consistency: The requirements for high or low consistency are not met. |
Disclaimer/Publisher’s Note: The statements, opinions and data contained in all publications are solely those of the individual author(s) and contributor(s) and not of MDPI and/or the editor(s). MDPI and/or the editor(s) disclaim responsibility for any injury to people or property resulting from any ideas, methods, instructions or products referred to in the content. |
© 2026 by the authors. Licensee MDPI, Basel, Switzerland. This article is an open access article distributed under the terms and conditions of the Creative Commons Attribution (CC BY) license (http://creativecommons.org/licenses/by/4.0/).
Copyright: This open access article is published under a Creative Commons CC BY 4.0 license, which permit the free download, distribution, and reuse, provided that the author and preprint are cited in any reuse.


