
Preprint
Article

This version is not peer-reviewed.

A Blueprint for Connection: Mapping Pathways of Relationship Change in Couples Using the Agapé App

Submitted:

15 April 2026

Posted:

16 April 2026

You are already at the latest version

Abstract
Agapé is a light-touch relationship enhancement smartphone app. This study used data from a longitudinal study couples using the Agapé app to link change in an array of behavioral processes into mechanistic chains, thereby providing some of the first quantitative insights into how various relationship processes might be linked as they shape the course of relationships. A sample of 405 couples in long-term relationships (810 partners, 50% women, 75% white, together M=4.5yrs, 50% living together, 33% currently dissatisfied) completed assessments across their first month of using Agapé. Men and women significantly improved on 15 of the 16 relationship processes assessed. Network analyses highlighted increases on three processes (quality time spent together, perceived partner responsiveness, and gratitude toward partner) as the processes most proximally linked to increases in relationship quality. The network findings also uncovered a number of indirect mechanistic pathways to be explored in future studies (e.g., increases in couples talking about their relationships to increases in awareness within those relationships to increases in gratitude and quality time to increases in relationship quality). Thus, the results offer a tentative blueprint for the inner workings of relationship dynamics and guidance toward optimizing the benefits of Agapé.
Keywords: 
;  ;  ;  ;  ;  
Subject: 
Social Sciences  -   Psychology
Marital discord and divorce are significant social issues that disrupt the lives of families and children (Amato, 2000), costing billions of dollars per year in the United States alone (Schramm, 2006). Despite decades of research developing a host of effective relationship enhancement programs to improve relationship functioning (Rolffs & Rogge, 2016), limited work has examined processes of change in these programs (Markman et al., 2022), creating a critical gap in our understanding. Basic research into relationship functioning has identified several key relationship processes associated with relationship satisfaction and longevity (Karney & Bradbury, 1995) and intervention research suggests that many of these processes can change simultaneously (Le et al., 2020). However, further theory development and refinement of interventions will require a more cohesive understanding of how these different processes may work in concert with one another, potentially organizing themselves into mechanistic chains to shape relationship quality.

1. The Agapé Smartphone App

The Agapé smartphone app is a light-touch relationship wellness intervention that is intrinsically engaging. Agapé combined (1) app content grounded in couples research with (2) a central focus on user-feedback-driven design to maximize engagement. The core functionality of the Agapé app is sending daily prompts to both partners of a couple and then showing them one another’s responses when they both have answered the prompt. The process of developing the Agapé daily conversation prompts includes topic areas covering a wide range of key processes linked to relationship functioning in the social psychological couples literature and couples treatment literature with particular emphasis on processes common to other relationship enhancement programs (e.g., Markman et al., 2022; Rogge et al., 2002; Doss et al., 2016, 2019) . Thus, the 2000+ daily prompts developed and piloted for the Agapé app over the last 4 years include prompts promoting relationship maintenance behaviors (e.g., Acitelli, 2002): (1) learning new things about one’s partner, (2) reflecting on one’s own behavior as a partner, (3) talking with one another about your relationship, (4) spending quality time with one another, and (5) saying “I love you.” The pool also includes prompts addressing key connective relationship processes: (1) providing emotional support (e.g., Sullivan et al., 1998), (2) mindful attentive awareness within relationships (Daks et al., 2021), (3) gratitude toward a romantic partner (e.g., Algoe et al., 2010), and (4) perceptions of a partner’s responsiveness to your feelings and needs (Reis et al., 2004). Prompts were also developed to encourage reflection on a set of detaching relationship processes: (1) failing to express gratitude (e.g., Lambert & Fincham, 2011), (2) negative conflict behavior (e.g., Rogge & Bradbury, 1999), (3) being distracted from or inattentive toward one’s relationship (e.g., Daks et al., 2021), and (4) a perception that one’s partner is insensitive to one’s own feelings and emotional needs (e.g., Crasta et al., 2021). Finally, a set of prompts were developed (and made available on an opt-in basis) to address key sexual functioning processes (e.g., Shaw & Rogge, 2016): (1) sexual activity, (2) physical affection, and (3) sexual satisfaction. Given the benefits of assessment-based interventions like the Relationship Checkup (Fentz & Trillingsgaard, 2017), the Agapé app also offers users 120-item (8-12min) wellness checks that provide ongoing feedback on individual and relationship outcomes and a range of relationship processes. The first results published out of the current project linked app use over the first month to improvements in relationship and individual functioning, demonstrating robust feasibility, acceptability, and user-engagement (Rogge et al., 2024).
The current manuscript seeks to examine the key relationship processes targeted within Agapé’s content to help identify the processes most proximally linked to improvements in relationship wellbeing. Those findings could not only inform our theoretical understanding of close relationship dynamics but could also help optimize Agapé. The app uses a freemium business model, allowing users and couples to use most of its functionality free of charge with the option to purchase an annual subscription to unlock additional content, features, and user control.

2. A Network Analysis Approach to Examining Processes of Change

As this study is one of the first of its kind to examine such a wide range of relationship processes as possible treatment mechanisms, we wanted to model change across the 16 relationship processes and change on the 8 outcomes simultaneously. Such analyses would allow us to identify which specific constructs might be more proximally (i.e., directly) or distally (i.e., indirectly) related to one another and to specific outcomes, potentially yielding a more parsimonious, multivariate understanding of the relationship dynamics. Given the novelty of examining so many competing processes to explain changes in relationship functioning, we also wanted to run the analyses in an exploratory manner as it was unclear which sequences of indirect pathways might emerge as dominant. To address these goals, we deviated from the more traditional treatment mechanism analyses (i.e., correlation & regression) that we preregistered and were inspired by emerging efforts to identify chains of associations between different processes of change using network analyses (Belli et al., 2026).
Duocentric Network Analyses to Develop Couple-Level Insights. Psychological network analyses extends techniques originally developed for modeling social networks to evaluate the unique links between pairs of variables within a larger set of variables (Epskamp & Fried, 2018). The variables being examined are called nodes (represented as circles in network graphs) and their unique pair-wise associations (i.e., the partial correlations between each pair of variables controlling for all other variables in the model) are called edges. Thus, network analysis represents a method of examining patterns of unique association among a set of variables.
Within social network analyses, researchers have also developed the concept of a duocentric networks, an extension of individual networks (“egocentric”) that combines the reports of a common community from two reporters (Coromina et al., 2008), including extensions to romantic couples reporting on their social networks, which are expected to overlap and connect as both partners are describing a common social community (Kennedy et al., 2015). While each individual network captures individuals’ separate perceptions, integrating the networks has the potential to reveal overlaps and connections between individual perceptions and comparisons between these duocentric networks and egocentric networks may reveal unique relationship processes outside of each individual partner’s awareness (Kennedy et al., 2015). This logic can be extended from social networks to psychological networks by integrating information on relationship dynamics from separate partners (which are expected to be correlate and connect as they describe a common relationship) to create a duocentric psychological network. Extending the logic of duocentric social networks, it would be expected that integrating psychological networks might reveal new associations outside of each partner’s awareness (e.g., one partner’s processes on the other) and that comparing a duocentric network to an individual psychological networks will place individual relationship processes in their dyadic context.

3. The Current Study

The current manuscript explored potential processes underlying the relationship enrichment observed in couples using Agapé. Drawing upon multi-wave data collected from 405 couples during their first month of using Agapé, the analyses examined the 16 key relationship processes targeted by the daily prompts (detailed above) linked to change on 8 outcomes: 4 dimensions of relationship functioning (relationship satisfaction, positive and negative relationship qualities, and dedication) and 4 dimensions of individual functioning (vitality, quality of life, psychological distress, depressive symptoms). Thus, we hypothesized that over a month of using Agapé, relationship maintenance, connective processes, and sexual functioning would increase whereas detaching processes would decrease (Hypothesis/Aim 1). We further hypothesized that – consistent with decades of research into relationship maintenance processes – improvements on those 16 key relationship processes would show unique links to corresponding improvements on the 8 outcomes examined (Hypothesis/Aim 2). Although exploratory, the network analyses on could also be expected to uncover a series of possible indirect pathways to be tested in future studies (Aim 3) as well as a handful of relationship processes that seemed to function in a more central manner (showing stronger links to outcomes) which suggest points of intervention to be targeted with daily prompts (Aim 4).

4. Method

4.1. Transparency and Openness

All study materials and procedures were evaluated and approved by a university IRB(Rogge et al., 2024). The study materials are available on the osf.io listing for this project (https://osf.io/vfgke/). The osf.io project listing also includes: (1) a pre-registration for this manuscript (the 2nd paper proposed), (2) our SPSS syntax, (3) our HLM 6.0 syntax and outputs, (4) our R syntax, and (5) our corresponding SPSS, HLM, and R datasets (due to stipulations from the IRB, they are only made available upon reasonable request). Within those materials, we report how we determined our sample size, all data exclusions, all manipulations, and all measures in the study.

4.2. Procedure

The Agapé Smartphone App. Agapé was developed over the last 4 years and remains under continuous development to this day (releasing new features and new content to promote sustained engagement). Briefly summarized, the developers took a holistic approach to maximize user experience and engagement (e.g., van Gemert-Pijnen et al., 2011) by using: (1) participatory development methods (grounded in intensive user feedback throughout the development process), (2) persuasive design techniques (finding out what users liked and disliked, what key pain points the app addressed or failed to address, how people typically used the app, what kept super-users engaged, what new features users most wanted, what prompted people to stop using the app – all to maximize user engagement and retention via user feedback), and (3) business modeling (to find the most effective pay structure).
Assessments. Partners were sent up to 4 emails and/or provided a link within the app (for the baseline survey only) to complete comprehensive (roughly 30 minute) baseline and 1-month surveys (hosted on Qualtrics.com) assessing outcomes as well as the 16 relationship processes addressed by the daily prompts. The baseline survey also collected demographic data, screened for eligibility, and obtained informed consent. All 810 partners completed the baseline survey and 350 partners (43%) completed the 1-month follow-up survey roughly 5.3 weeks after enrollment, providing outcome data for 222 of the 405 couples (55%). In addition to those two primary assessments, partners were sent up to 2 emails every seven days inviting them to complete shorter wellness checks within the Agapé app (120 questions taking 8-12min). These wellness checks were piloted in over 20,000 Agapé users and functioned as weekly diaries. They were created either by using shorter versions of the scales within the baseline and 1-month surveys (when available) or by identifying the 2-4 items showing the strongest links to the constructs (assessed by EFAs). A total of 611 partners (75%) completed 1617 wellness checks in the 6-7 weeks following baseline, providing longitudinal data for 352 (87%) of couples.
Attrition. Given that the baseline and 1-month assessments contained the most comprehensive assessment of relevant constructs, ANOVA and Chi-Squared analyses were run to identify possible attrition biases between partners completing and those not completing the 1-month assessment. These analyses failed to find significant differences on baseline levels of 7 of our 8 outcomes (Cohen’s ds from -.03 to .12), suggesting highly similar levels of baseline individual and relationship and individual functioning between partners completing the 1-month follow-up and those not completing it. However, partners completing the 1-month survey had significantly lower depressive symptoms (d = .17). The attrition analyses also failed to identify significant demographic differences (Cohen’s ds from .01 to .13) on proportions of: (1) couples in long distance relationships, (2) couples with children in the home, (3) black partners, (4) Latinx partners, and (5) Asian partners. However, respondents completing the 1-month assessment were more likely to be: (1) white (d = .17), (2) assigned female at birth (d = .20), (3) older (d = .50), (4) married (d = .40), (5) living together (d = .29), (6) currently in couples counseling (d = .16), and (7) had more years of education (d = .68), and (8) higher household incomes (d = .45).

4.3. Participants

To be eligible for the study, couples had to: (1) be at least 18 years old, (2) currently in a romantic relationship, and (3) both partners had to be willing to install the Agapé app, pair their accounts, complete a baseline survey, and allow their app use to be linked to their survey responses. The study was presented as the “Connecting with Your Partner Study” and 405 couples were recruited from March to June, 2022. Two thirds of the couples were recruited from within the Agapé app itself by presenting a button in the daily feed of new users (representing an effectiveness sample of couples naturally drawn to using the app outside of a research context). The remaining couples were recruited via emails to individuals in research participant registries (e.g., ResearchMatch). Couples were considered enrolled once both partners had: (1) completed the baseline survey, (2) installed the app on their phones, and (3) paired their Agapé accounts. Couples were given one month of premium access (a $15 value) for enrolling and were offered a year of premium access (a $50 value) for completing the 1-month assessment.
Fifty four percent of the 810 partners had been assigned female at birth (46% assigned male) with 50% identifying as female, 45% as male, 2.3% as non-binary, and 2.7% as other gender identities with lower frequencies. Although partner ages ranged from 18 to 67 (M = 29.2, SD = 10.5), 84% of the partners were in their 20s and 30s. The partners were primarily white (75%, including Latinx/Hispanic), with 7.3% black, 6.6% Asian / Pacific Islander, 6.4% biracial, and 4.3% other / unknown. When asked about Latin/Hispanic ethnicity in a separate question, 14% reported identified as Latinx / Hispanic. Although 28% of the partners had bachelors’ degrees and 19% had graduate degrees, 35% of the partners had some college, associate degrees, or trade school certificates and 17% had only high-school level educations. Turning to couple demographics, relationship lengths ranged from 0 to 45 years (M = 4.6, SD = 6.4) with 38% married or engaged, 36% in long-term committed relationships, 25% dating their partners exclusively, and 1% dating their partners casually. Consistent with this, 50% were currently living together (with another 31% living separately in the same city and 19% in long-distance relationships) and 33% had children living in the home (M = 2.2 children, SD = 1.8). Although average baseline levels of relationship satisfaction were reasonably high (M = 30.4, SD = 8.7 on the 0 to 41 scale of the 8-item Couples Satisfaction Index), 33% of the partners were notably dissatisfied in their relationships, 18% had attended couples counseling with their partners, and 8% were currently in couples counseling, highlighting a wide range of relationship quality.

4.4. Measures

Unless otherwise indicated, these items used the stem, “In the last week, how often have you…”, were rated on a 6-point scales (e.g., Not at all to Completely; Never to All of the time), responses were averaged such that higher scores reflected higher levels of the respective construct, and Cronbach’s alphas were calculated in the current data to evaluate internal consistency.

4.4.1. Relationship and Individual Outcomes

Relationship Satisfaction. The 8-item version of the Couples Satisfaction Index (CSI; Funk & Rogge, 2007) was used to assess relationship satisfaction on the original 6 and 7-point response scales. Responses were summed so that higher scores reflect higher levels of satisfaction (a = .957) and a cutoff of 27.5 or less (on a 0 to 41 scale) identified dissatisfied individuals.
Positive & Negative Relationship Qualities. The 16-item Positive-Negative Relationship Quality scale (PNRQ; Rogge et al., 2017) assessed positive and negative relationship qualities. Items were rated on the original 7-point response scale (apos = .968; aneg = .904).
Relationship Dedication. The dedication subscale of the Commitment Inventory (CI; Owen et al., 2011) assessed long-term commitment to the relationship (a = .739).
Vitality. The 6-item Vitality in Life Scale (VLS; Pollard & Rogge, 2022) assessed daily energy and vitality toward life on a 7-point scale (Not at all to Extremely; a = .966).
Quality of Life. Nine items of the Quality-of-Life Inventory (QOLI; Frisch et al., 1992) assessed satisfaction with life (health, relationships with relatives, close friends, understanding yourself, work, expressing yourself creatively, socializing, participating in active recreation, independence) on a 7-point response scale (Terrible to Delighted; a = .863).
Psychological Distress. Six strongly loading items (“felt discouraged,” “felt worthless,” “felt dissatisfied with everything,” “felt depressed,” “felt hopeless,” “felt sad”) of the Mood and Anxiety Symptom Questionnaire (MASQ; Watson et al., 1995) assessed distress (a = .944).
Depressive Symptoms. The 9-item Patient Health Questionnaire (PHQ-9; Kroenke et al., 2001) assessed symptoms of depression over the last two weeks on a 4-point response scale (“not at all,” to “nearly every day”). Responses were summed, creating scores ranging from 0 to 27 (a = .944).

4.4.2. Relationship Maintenance Processes

A larger pool of items assessing basic relationship processes (likely to be impacted by Agapé) were piloted in over 20,000 app users. This pool focused on common everyday behaviors distinct from relationship processes like social support, relational awareness, and gratitude. The sets of items used in the current study had straightforward item content and demonstrated high internal consistencies, stable factor structures, and moderate levels of correlation with another and with the other targeted relationship processes being assessed, all of which suggest that they are appropriate for multivariate analyses.
Spending Quality Time Together. Quality time was assessed with five items developed for the study (“prioritized time with your partner,” “set aside time to do something fun with your partner,” “had fun with your partner,” “actively put your relationship at the top of your priority list,” “enjoyed your partner’s company,” & “gotten each other laughing”; a = .906).
Reflecting on Own Behavior. Two items assessed reflection on own behavior (“reflected on your own behavior in your relationship” & “taken time to think about how you could be a better partner in your relationship”; a = .803).
Talking about Your Relationship. Five items assessed this construct (“talk about your relationship with your spouse ,” “tell your spouse what you want from the relationship,” “talk about the quality of your relationship; for example, how good it is, how satisfying it is, or how to improve it,” “discuss and try to work out problems between the two of you,” & “reveal very intimate things about yourself or your personal feelings”; a = .910).
Learning New Things about Your Partner. Two items assessed this construct (“I grew to understand my partner better” & “I learned something about my partner’s thoughts and feelings”; a = .876).
Saying, “I love you.” Two items assessed this construct (“did you tell your partner that you love him/her” & “did your partner tell you that they love you”; (a = .910).

4.4.3. Connective Relationship Processes

Providing Emotional Support. Using the stem, “IN THE LAST WEEK, when your partner was feeling upset, stressed or hassled by some problem or difficult situation, how often did you…” six items of the Support in Intimate Relationships Rating Scale (SIRRS; Dehle et al., 2001) assessed providing emotional support and validation (e.g., “take his/her side when discussing his/her situation,” “say you would feel the same way in his/her situation,” “say you thought he/she handled a situation well”) on a 6-point scale (“Never” to “Always”). Responses were averaged such that higher scores reflected higher support provided (a = .865).
Mindful Attentive Awareness of Relationship. The four items of the awareness subscale of the Attentive Awareness In Relationships Scale (AAIRS; Daks et al., 2021) assessed mindfully attending to one’s relationship (a = .911).
Gratitude toward Partner. Using the stem, “THINKING OF THE LAST WEEK” the four items of the Gratitude in Relationships Scale (GRS; Rasmussen et al., 2024) assessed feeling gratitude toward a romantic partner (e.g., “I found myself filled with gratitude for my partner”; a = .929).
Perceived Partner Responsiveness. The 4-item responsiveness subscale of the Partner Responsiveness and Insensitivity scale (PRI; Crasta et al., 2021) assessed the respondents’ perceptions of the responsiveness of their romantic partners (a = .915).

4.4.5. Detaching Relationship Processes

Negative Conflict Behavior. Using the stem, “IN THE LAST WEEK, when discussing a problem with your partner, how often did you…” six items of the negative conflict subscale of the Aversive Interaction Scale (AIS; Rodrigues, 2010) assessed common negative behaviors (e.g., “yell or scream at your partner,” “swear at your partner,” “mock your partner,” “purposefully insult your partner”). Responses were averaged such that higher scores reflected greater negative conflict behavior (a = .802).
Distraction / Inattention toward Relationship. The four items of the AAIRS (Daks et al., 2021) distraction subscale assessed being distracted and inattentive toward one’s relationship (a = .911).
Failing to Express Gratitude. Four items of the GRS (Rasmussen et al., 2024) assessed failing to express gratitude toward a partner (e.g., “I did not show how thankful I am to my partner”) on a 6-point scale (“Never” to “All of the time”). Responses were averaged (a = .898).
Perceived Partner Insensitivity. A 4-item subscale of the PRI (Crasta et al., 2021) assessed the respondents’ perceptions of their partners insensitivity; a = .886).

4.4.6. Sexual Functioning

As 19% of the couples were in long-distance relationships and 31% lived separately in the same metro areas, the sexual functioning questions within the weekly wellness checks were only shown when individuals indicated on a branching question that they had spent time with their partner in-person within the last week (to allow for physical affection and intimacy).
Frequency of Sexual Activity. Three items assessed common (e.g., Shaw & Rogge, 2016) sexual activities (stem: “IN THE LAST WEEK, how often did you do this with your partner…” items: “oral sex,” “vaginal and/or anal sex,” & “other sexual activities”) on a 6-point scale (“Did not happen” to “4+ times per day”). Responses were averaged (a = .812).
Frequency of Physical Affection. Seven items assessed non-sexual physical affection (stem: “IN THE LAST WEEK, how often did you do this with your partner…” items: “cuddling,” “holding one another,” “kissing,” “hugging,” “holding hands,” “touching or caressing,” & “showing affection”) on a 6-point scale (“Did not happen” to “4+ times per day”). Responses were averaged such that higher scores reflected greater affection (a = .961).
Sexual Satisfaction. The six items of a subscale from the Quality of Sex Inventory (QSI; Shaw & Rogge, 2016) assessed sexual satisfaction with a primary partner (a = .977).

4.5. Analytic Strategy

Our analyses follows an emerging approach of using network analyses where changes on key processes are themselves represented as nodes (e.g., Belli et al., 2026), explored both at the individual level and at the duocentric level (Kennedy et al., 2015). First, we conducted within-sex analyses using individual male and female networks. Then to explore dyadic effects we contrasted the patterns of edge weights produced by these models with two “duocentric” networks that treated all couples as mixed-sex dyads, randomly assigning partners of same-sex dyads to different sex groups. This strategy also aligned our analyses with the majority of the sample as 91% of our couples were mixed-sex couples. Data was cleaned and variables were created in SPSS 29. Network analyses were conducted in R (version 4.0.3). The estimateNetwork function in the bootnet package (Epskamp & Fried, 2021) was used to estimate partial (spearman) correlation networks with the glasso EBIC approach and LASSO regularization. Finally, we generated visualizations of our models by using the qgraph package (Epskamp et al., 2021; version 1.9). We used the HLM program (version 6.0) to obtain slope estimates for each of the constructs.

4.5.1. Network Analyses

Our network analyses were conducted following current best practices (Epskamp & Fried, 2018). Spearman’s rank-correlations were utilized to account for the ordinal nature of Likert-response data. As network analyses are at risk of having elevated rates of Type I error (Brunner & Austin, 2009) leading to lower stability of model estimates (Babyak, 2004), regularization with the Least Absolute Shrinkage and Selection Operator (LASSO; Tibshirani, 1996) is recommended to focus the network analyses on stronger and more stable links, leading to more parsimonious solutions. LASSO regularization applies increasing adjustments to models with larger numbers of parameters and sets notably small edge weights to zero, thereby helping to minimize the interpretation of spurious associations. LASSO regularization was utilized with the Extended Bayesian Information Criterion (EBIC; Chen & Chen, 2008) selection method being used to select the most parsimonious network among them, thereby limiting spurious associations (Epskamp & Fried, 2018). The EBIC hyperparameter, γ, was set to a reasonably conservative 0.3 to favor finding a more parsimonious model.
Following guidance for interpretation of psychological networks (Bringmann et al., 2019), we favored measures of node relevance that accounted for magnitude of edge weights (i.e., strength centrality; expected influence) over measures that emphasized number of connections (e.g., betweenness) that are more suitable to social network analysis. Node-specific centrality metrics have also been used in duocentered social network models without modification (Coromina et al., 2008).

4.5.2. Accuracy and Stability of Edge-Estimates

To evaluate the power and relative stability of the network results (i.e., edge weights and indices of centrality), we compared the network results to 1,000 simulations (from the netSimulator function of the bootnet package) using varying sample sizes to determine how consistent the results were and the level of sensitivity and specificity offered by various sample sizes for detecting edge weights. We also used 1000 nonparametric bootstrapped samples obtained via the bootnet (Epskamp & Fried, 2021; version 1.5) package to obtain confidence intervals for the edge weights estimated in our models. Finally, we used 1000 case-dropping bootstrapped samples (obtained with the bootnet package) to investigate the stability of the indices of centrality within our network models.

3. Results

3.1. Pre-Post Change

We ran repeated measures Analysis of Variance (rm-ANOVAs) on the 24 constructs examined to look for significant pre-post change. As seen in Figure 1 and the first set of columns of Supplemental Table S1, a series of 2 by 2 rm-ANOVAs treating time (pre vs post) and partner sex (male vs female) as within-couple repeated measures identified significant pre-post change on all 8 outcomes and on 15 of the 16 processes (failing to uncover significant change on sexual satisfaction). Notably, only two time by sex interactions emerged as marginally significant, suggesting that men and women experienced comparable average change across a majority of the constructs examined. Taken together, these results offer partial support for Hypothesis 1 and suggesting that using Agapé led to changes on the processes targeted by its daily prompts.

3.2. Linking Pre-Post Change

3.2.1. Collinearity and Accuracy/Stability Checks

We ran network analyses on the raw change scores for our 24 constructs, including baseline scores on relationship satisfaction to help control for baseline differences in relationship quality. The network analyses in men and women notably simplified the correlation matrix by uncovering a far smaller set of unique links (called edge weights) between pairs of variables (i.e., partial correlations between pairs of variables, controlling for all other variables in the analysis, Supplemental Figure S5). Simulation analyses suggested that with a sample size of 220 for the pre-post network analyses in men and women, the edge weights generated in the simulated datasets correlated extremely strongly (i.e., average correlations of roughly .80 to .90) with the estimates in our data (Supplemental Online Figures S1A & S1B), as did the estimates of centrality (Supplemental Online Figures S2A & S2B). The bootstrapped confidence intervals for the edge weights (Supplemental Online Figures S3A & S3B) suggested reasonable precision of the network solutions, and case-dropping bootstrapping analyses further suggested that dropping as much as 30% of the sample still yielded estimates of centrality that, on average, correlated .80 or higher with the centrality estimates in the full sample (Supplemental Online Figures S4A & S4B). These analyses demonstrated similar support for the dyadic models tested.

3.2.2. Network Visualization – Spring Plots

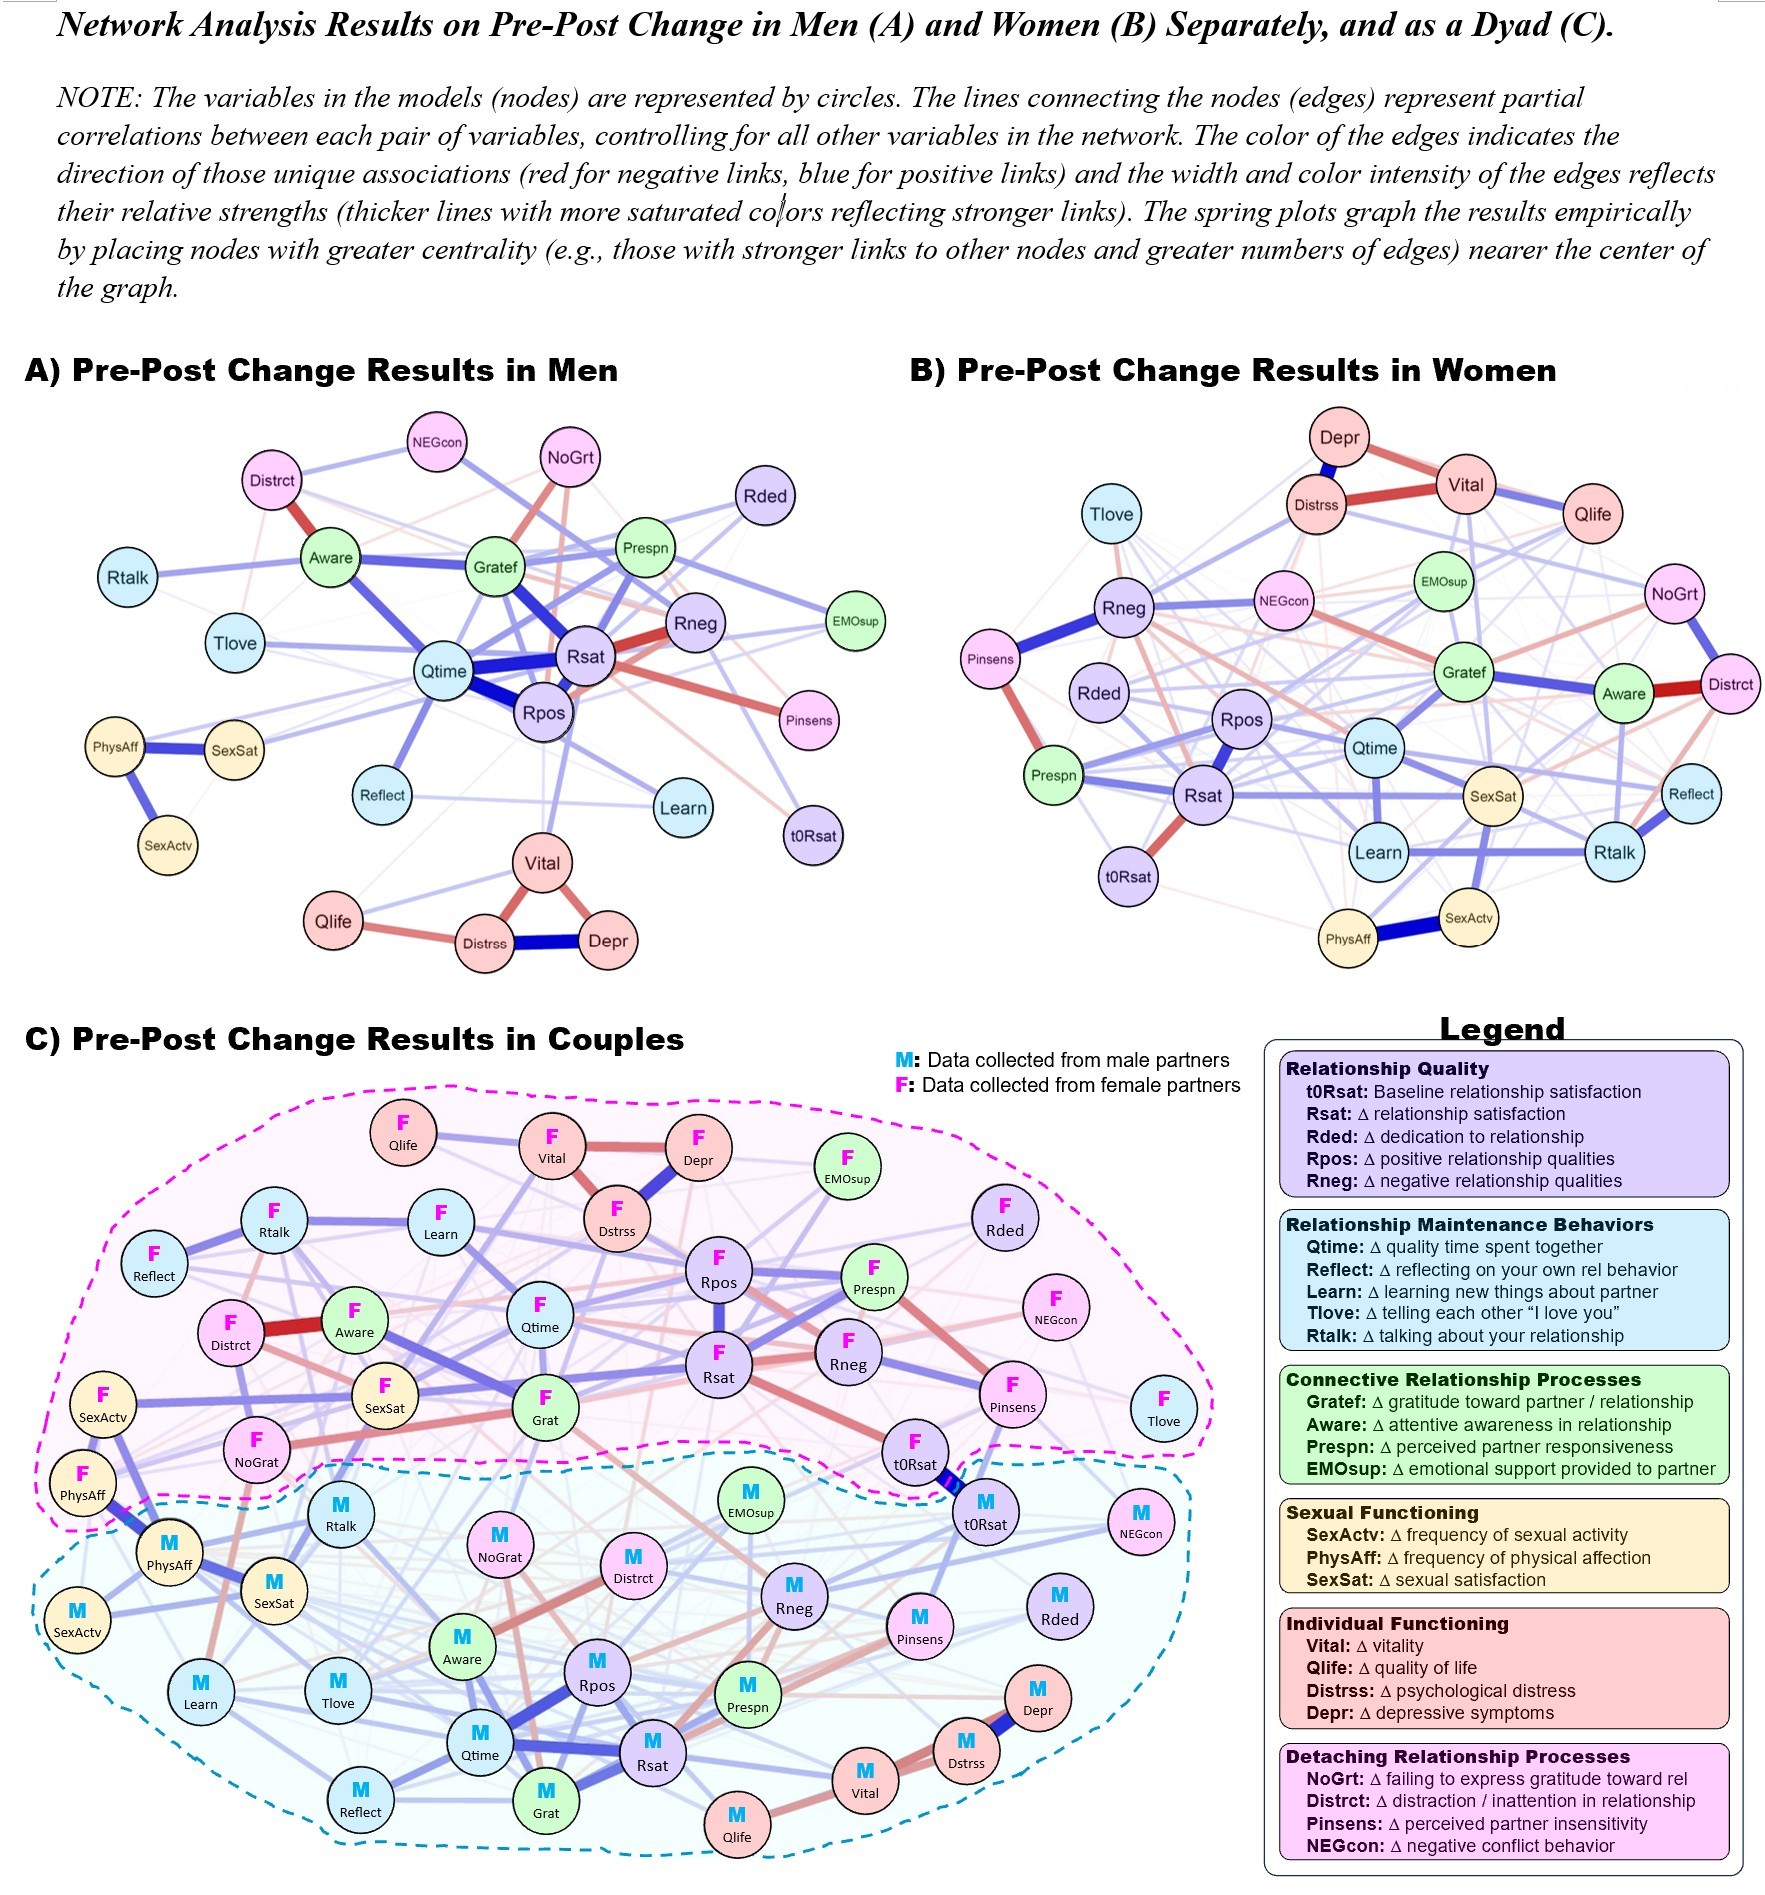
When plotting network analysis results as spring plots, variables (or nodes) are represented as circles and their unique associations with other variables (i.e., their edges) are represented as lines. The thickness and color depth/intensity of the lines reflect the strength of those unique associations (i.e., the relative edge weights), and the color of the lines reflect the directions of association (i.e., blue – positive associations; red – negative associations). Finally, spring plots use an algorithm to arrange the nodes in order of centrality with more central nodes being placed closer to the center of the diagram.

3.2.3. Results in Individual Spring Plots

The spring-plot in men (Figure 2A) and women (Figure 2B) suggested that pre-post change on the relationship outcomes of satisfaction and positive relationship qualities emerged as some of the most central outcomes in the network. Notably, change on those outcomes demonstrated proximal links to change on quality time spent together, gratitude toward partner, and perceived partner responsiveness (constructs also emerging as notably central to both networks). This begins to suggest that improvement on those specific processes serve as intermediary steps between improvements in more distal processes assessed in the current model. Tracing some of the strongest unique links edge weights) in the model show similar patterns in men/women that in turn highlight possible indirect pathways to be explored in future studies. For example, increases in relationship talk and reductions in distraction/inattention from the relationship were both associated with mindful attentive awareness, which in turn strengthened feelings of gratitude toward those partners. In contrast, saying, “I love you” to partners demonstrated a simple direct link to relationship satisfaction. Possible differences also emerged in the patterns of association between men and women’s models. For example, while change in the four individual functioning measures and on the three sexual functioning measures showed stronger links within each of sets of variables, change on those sets of variables only displayed a small handful of unique links to the rest of the model in men while being more integrated within women.

3.2.4. Dyadic Results

Given the dyadic nature of the sample, we ran a third (couple-level) network model examining unique links among change on the constructs in men and women simultaneously (see Supplemental Online Figure S6 for the full correlation matrix across the change scores and the resulting edge weights from the network analysis). As seen in the spring plot Figure 2C, both men and women’s patterns of associations were reasonably replicated as two parallel “communities” of variables. However, in these duocentric models, we also found important points of connection between the two spring plots that notably alter interpretation of the model. To highlight these differences further and focus on variables that substantially impact relationships to other variables, we overlaid the standardized centrality estimates from the two individual models onto the estimates from the duocentric model (Figure 3). For example, men’s physical affection showed shows a standard deviation higher of strength centrality and expected influence in the duocentric model than the individual models, highlighting the strong connections between increases in men’s affection and associated increases in women’s sexual activity. Similarly, men telling their partner “I love you,” while rather non-central in their individual model, had higher levels of strength and expected influence in the duocentric model to many diffuse, low-magnitude links to varied components of women’s relationship functioning components including women’s perceptions of quality time, their own gratitude, and physical affection. Finally, baseline satisfaction for both partners had higher levels of centrality in the duocentric model, representing the strong correlations between couples’ “starting points” in their relationship before they begin their Agapé process. In contrast, individual functioning variables within both men and women retained roughly the same, lower levels of centrality in the duocentric model, reflecting that changes in each partner’s individual functioning were associated with changes in their own individual experience of that relationship.

3.3. Linking Linear Trajectories of Change

3.3.1. Strategy

To make full use of all of the 2777 distinct waves of longitudinal data collected (including those from the weekly wellness checks) thereby including nearly the full sample, we ran 3-level (repeated assessments nested within individual partners, nested within couples) Hierarchical Linear Modeling (HLM) analyses estimating liner slopes of change across the month of the study (setting linear change as a random effect at level 2 – the level of individual partners) on the smaller set of 15 constructs assessed within those wellness checks (3 outcomes and 12 possible mechanistic processes). We then ran network analyses on those slope estimates to identify unique links between change processes, building one comprehensive duocentric model examining weekly change in men and women simultaneously.

3.3.2. Results

As seen in the spring plot (Figure 4) and in the edge weights (Supplemental Online Figure S7), although a few stronger partner effects (i.e., linking change over time between partners) emerged in the final model, a majority of the retained edges were actor effects (i.e., occurring within men or within women), resulting in male and female networks that were somewhat independent of each other. Linear changes in relationship satisfaction continued to emerge as the central constructs in both men and women, showing robust proximal links to changes in quality time spent together, feeling grateful toward a partner, and perceived partner responsiveness. Although these analyses contained a slightly smaller number of mechanistic processes, they continued to suggest roughly similar indirect pathways to be explored in future studies. Specifically, they continued to highlight that changes in connective processes were more central to relationship satisfaction within individuals, fluctuations in individual functioning processes were less central to satisfaction, and that sexual functioning and conflict served as a notable “bridges” between men’s and women’s changing experiences over the course of their relationship.

4. Discussion

Decades of research has developed a wide range of effective relationship strengthening interventions (Markman et al., 2022; Rolffs & Rogge, 2016) to help prevent marital discord and divorce. Unfortunately, the social impact of those interventions has been limited by our narrow understanding of the specific mechanisms underlying the observed benefits of those programs (Markman et al., 2022). The current findings addressed these challenges through the evaluation of Agapé – a smartphone app that represents a novel, consumer-based approach to relationship wellness interventions. With content grounded in couples research, its light-touch framework (taking only a few minutes each day), and its engaging and enjoyable design, Agape has broken through many of the barriers that have limited the scope of previous relationship strengthening programs, gaining over 2.1 million unique users in the last 2 years and demonstrating benefits from as little as 1-month of use (Rogge et al., 2024). The current findings extend this work by linking improvement on a broad range of relationship processes targeted by Agapé prompts (supporting Aim/Hypothesis 1) to corresponding improvements to relationship quality (supporting Aim/Hypothesis 2) within a novel multivariate framework (network analysis), thereby uncovering the processes most proximally linked to relationship improvement (Aim 4) as well as potential mechanistic pathways amongst a fairly comprehensive set of relationship processes (Aim 3).

4.1. Implications

The Central Role of Quality Time and Gratitude. Quality time spent together emerged across all analyses as a core (i.e., central) relationship process and increases in quality time showed strong links to corresponding increases in relationship quality. This echoes findings with positive relationship maintenance strategies (e.g., Canary & Stafford, 1992) and previous work identifying quality time as a putative mediator of relationship education (Carlson et al., 2022). From a practical standpoint, simply prioritizing romantic relationships by setting aside time to have fun provides room for other processes to shine. Or alternatively, as other relationship processes improve over the course of the Agapé program, couples may be more willing to spend their quality time together in contrast to other competing demands. Further work should explore the exact functioning of quality time as it may be the easiest variable to manipulate with minimal interventions.
Consistent with a growing body of work (e.g., Algoe et al., 2010; Barton et al., 2024), the current findings also highlighted the importance of cultivating gratitude within relationships. The shifts in gratitude observed from one month of using the Agapé app and the strong unique links those changes demonstrated to changes in so many other relationship processes highlight its central role in Agapé’s potential benefits. It is likely that the daily prompt structure of Agapé, many of which have couples simply take a few minutes each day to appreciate and value one another, places gratitude in the center.
Responsiveness as an “Organizing Construct.” The current analyses also identified perceived partner responsiveness as a key relationship process proximally linked to relationship quality for both men and women and “bridges” the impact of many other communication behaviors. This finding aligns with responsiveness theory (Reis et al., 2004), which posits that our perception of our partners’ responsiveness is an integrative evaluation that “organizes” our view of many behaviors to ultimately influence our satisfaction. The current results suggest that while Agapé prompts address many different domains of relationship functioning, mutually completing the Agapé prompts may help align these behaviors to each partner’s thoughts, feelings, concerns, & values.
Key dynamics “linking” experiences. Notably, in the duocentric models, change in many components of men’s and women’s relationship functioning variables only demonstrated “actor links” to other within-person variables in the network. For example, while changes in quality time were quite central to both the male and female models of relationship functioning, these factors were weakly related across partners. This would suggest partners might not be describing the same shared experiences when responding to these questions. In contrast, physical affection and sexual activity both showed strong cross-partner links. Similarly, partners’ reports of conflict also showed strong cross-partner links with one another’s reports of conflict or insensitivity (though not always in expected directions). This would suggest that while these concrete behaviors may be less important in intra-individual models, they are more likely to represent a shared reality between partners. While change in conflict behaviors has been studied extensively in behavioral intervention research, further study using randomized trials is needed to understand how minimal interventions shape these criticial interactions between partners.
Potential Mechanistic Pathways. Increases in talking about one’s relationship were not directly linked to corresponding changes in relationship satisfaction for both men and women, but were instead linked by a cascade of stronger (and likely bi-directional) indirect paths. Thus, the results suggested that increases in talking about one’s relationship (outside of the app) might have promoted greater mindful awareness in that relationship, leading to more gratitude and spending more quality time together, thereby increasing relationship satisfaction and quality. The network analysis findings offer a number of more nuanced and specific mechanistic pathways like this example to be explored in future models and studies of relationship functioning.

4.2. Limitations

Though encouraging, the interpretation of the current findings is limited by a number of factors. First, the current study lacked a randomized no-treatment (e.g., waitlist) condition to control for possible placebo effects and demand characteristics that could have amplified the changes observed. Second, although Agapé users experienced significant improvements on nearly all of the dimensions examined, a handful of the pre-post gains only slightly exceeded the gains typically seen in waitlist conditions of marital therapy trials (g = .12; Roddy et al., 2020), suggesting those changes could possibly have been due (in part) to anticipatory effects. Third, as the network analyses examined correlated change across the same time period, the directions of causality underlying the links observed remain unclear and it is likely that many of those links represent bidirectional (reciprocal) causal links between processes. Fourth, there was substantial attrition at the 1-month follow-up, rendering the pre-post analyses dependent on slightly older respondents with greater resources. Fifth, as this was a dyadic study, insisting upon dyadic participation could have discouraged the participation of racial minority, lower socio-economic status, and distressed couples (Barton et al., 2020). Finally, the current study was restricted to romantic dyads, but since the study was conducted, the functionality of Agapé has been expanded to allow for its use in other close relationships (family, friends, parent-child) and to allow for group conversations (e.g., a group of friends sharing prompts). Future work can explore how well the current findings generalize to a broader range of relationships and how use of Agapé across multiple close relationships might yield stronger benefits. Despite these limitations, the current study offers unique and nuanced insights into key processes and mechanistic pathways underling the relationship benefits linked to using the Agapé app.

Supplementary Materials

Table S1. Repeated Measures ANOVAs Testing Pre-Post Change; Figure S1. Simulations for detecting observed network edges at different sample sizes. Figure S2. Simulations for detecting stability of centrality estimates in different sample;Figure S3. Simulations for estimating precision of edge-weight estimates. Figure S4. Simulations for detecting observed networks at different sample sizes. Figure S5. Bivariate Correlations (A) and Edge Weights (B) Estimated in Men and Women; Figure S6. Bivariate Correlations (below diagonal) and Edge Weights (above diagonal) among 2-wave Pre-Post Change Scores Estimated Dyadically. Figure S7. Bivariate Correlations (below diagonal) and Edge Weights (above diagonal)among HLM Linear Slopes Estimated Dyadically.

Author Contributions

Conceptualization, RDR and KO; Methodology, RDR; Software, RDR and KO; Formal Analysis, RDR; Investigation, RDR and JM; Resources, KO; Data Curation, JM and RDR; Writing – Original Draft Preparation, RDR and DC; Writing – Review & Editing, RDR, KO, JM, and DC; Visualization, RDR and DC; Supervision, RDR; Project Administration, RDR and KO; Funding Acquisition, KO”.

Funding

The development of the Agape app and RDR and KO’s contributions to the study were supported by investment funds from Launch NY, Y-Combinator, Harlem Capital, Samsung Next, and Acrew. DC’s manuscript preparation activities are supported by the Department of Veterans Affairs Office of Rehabilitation Research Development and Translation (IK2-RX-003823). The views in this article are those of the authors and do not reflect the views or official policy of the Department of Veterans Affairs or other departments of the U.S. government.

Acknowledgments

We would like to thank the couples who participated in our study and all of the couples providing feedback over the last 4 years. We would also like to thank other members of the Agapé team, including: Larry McKenzie, Caley Davis, Riley Fitzpatrick, and Sabrina Maciariello. Finally, we would like to thank our investors, including: Launch NY, Y-Combinator, Harlem Capital, Samsung Next, and Acrew.

Conflicts of Interest

Both RDR and KO are stockholders in Agapé Wellness Inc. As a result, the study was conducted, and the manuscript developed under a conflict-of-interest plan overseen by the conflict of interest office of the University of Rochester. DC and JM do not have any conflicts of interest to declare.
Author Note: A previous manuscript was published out of this data examining the feasibility, acceptability, and effectiveness of the Agapé smartphone app and a subset of the findings in this manuscript were presented in talks by the first author at the 2022, 2023, and 2025 conferences of the Association of Behavioral and Cognitive Therapies. Study materials, a pre-registration for the current manuscript, syntax files, and data (upon reasonable request) are available in the osf.io listing for this study: (https://osf.io/vfgke/). Correspondence should be directed to Ron Rogge at ronald.rogge@rochester.edu or at the University of Rochester, Department of Psychology, 462 Meliora Hall - RC Box 270266, Rochester, NY, 14627-0266. The views in this article are those of the authors and do not necessarily reflect the views or official policy of the Department of Veterans Affairs or other departments of the U.S. government.

References

  1. Acitelli, L. K. Relationship Awareness: Crossing the bridge between cognition and communication. Communication Theory 2002, 12(1), 92–112. [Google Scholar] [CrossRef]
  2. Algoe, S. B.; Gable, S. L.; Maisel, N. C. It's the little things: Everyday gratitude as a booster shot for romantic relationships. Personal Relationships 2010, 17(2), 217–233. [Google Scholar] [CrossRef]
  3. Amato, P. R. The consequences of divorce for adults and children. Journal of Marriage and Family 2000, 62(4), 1269–1287. [Google Scholar] [CrossRef]
  4. Babyak, M. A. What you see may not be what you get: A brief, nontechnical introduction to overfitting in regression-type models. Psychosomatic Medicine 2004, 66(3), 411–421. [Google Scholar] [CrossRef]
  5. Barton, A. W.; Gong, Q.; Guttman, S.; Doss, B. D. Trajectories of perceived gratitude and change following relationship interventions: a randomized controlled trial with lower-income, help-seeking couples. Behavior therapy 2024, 55(2), 401–411. [Google Scholar] [CrossRef]
  6. Barton, A. W.; Hatch, S. G.; Doss, B. D. If you host it online, who will (and will not) come? Individual and partner enrollment in a web-based intervention for distressed couples. Prevention Science 21 2020, 830–840. [Google Scholar] [CrossRef]
  7. Belli, S. R.; Hoekstra, R. H.; Pilling, S.; Saunders, R.; Stott, J.; Suh, J. W.; O’Driscoll, C. Using network analysis to identify processes of change in low-intensity CBT interventions for depression and anxiety disorders. Journal of Affective Disorders 2026, 396, 120937. [Google Scholar] [CrossRef]
  8. Bringmann, L. F.; Elmer, T.; Epskamp, S.; Krause, R. W.; Schoch, D.; Wichers, M.; Wigman, J. T. W.; Snippe, E. What do centrality measures measure in psychological networks? Journal of Abnormal Psychology 2019, 128(8), 892–903. [Google Scholar] [CrossRef]
  9. Brunner, J.; Austin, P. C. Inflation of Type I error rate in multiple regression when independent variables are measured with error. Canadian Journal of Statistics 2009, 37(1), 33–46. [Google Scholar] [CrossRef]
  10. Carlson, R. G.; Barden, S. M.; Locklear, L.; Dillman Taylor, D.; Carroll, N. Examining quality time as a mediator of dyadic change in a randomized controlled trial of relationship education for low-income couples. Journal of Marital and Family Therapy 2022, 48(2), 484–501. [Google Scholar] [CrossRef]
  11. Chen, J.; Chen, Z. Extended Bayesian information criteria for model selection with large model spaces. Biometrika 2008, 95(3), 759–771. [Google Scholar] [CrossRef]
  12. Coromina, L.; Guia, J.; Coenders, G.; Ferligoj, A. Duocentered networks. Social networks 2008, 30(1), 49–59. [Google Scholar] [CrossRef]
  13. Crasta, D.; Rogge, R. D.; Maniaci, M. R.; Reis, H. T. Toward an optimized measure of perceived partner responsiveness: Development and validation of the perceived responsiveness and insensitivity scale. Psychological Assessment 2021, 33(4), 338–355. [Google Scholar] [CrossRef]
  14. https. Available online: //psycnet.apa.org/doi/10.1037/pas0000986.
  15. Daks, J. S.; Rogge, R. D.; Fincham, F. D. Distinguishing the correlates of being mindfully vs. mindlessly coupled: Development and validation of the Attentive Awareness in Relationships Scale (AAIRS). Mindfulness 2021, 12(6), 1361–1376. [Google Scholar] [CrossRef]
  16. Dehle, C.; Larsen, D.; Landers, J. E. Social Support in Marriage. The American Journal of Family Therapy 29 2001, 307–324. [Google Scholar] [CrossRef]
  17. Doss, B. D.; Benson, L. A.; Georgia, E. J.; Christensen, A. Translation of Integrative Behavioral Couple Therapy to a web-based intervention. Family Process 2013, 52(1), 139–153. [Google Scholar] [CrossRef]
  18. Doss, B. D.; Cicila, L. N.; Georgia, E. J.; Roddy, M. K.; Nowlan, K. M.; Benson, L. A.; Christensen, A. A randomized controlled trial of the web-based OurRelationship program: Effects on relationship and individual functioning. Journal of Consulting and Clinical Psychology 2016, 84(4), 285. Available online: https://psycnet.apa.org/doi/10.1037/ccp0000063. [CrossRef]
  19. Doss, B. D.; Roddy, M. K.; Nowlan, K. M.; Rothman, K.; Christensen, A. Maintenance of gains in relationship and individual functioning following the online OurRelationship program. Behavior Therapy 2019, 50(1), 73–86. [Google Scholar] [CrossRef]
  20. Epskamp, S.; Fried, E. I. A tutorial on regularized partial correlation networks. Psychological Methods 2018, 23(4), 617–634. [Google Scholar] [CrossRef]
  21. Epskamp, S.; Fried, E. I. Package ‘bootnet’. R package version 2021, 1.5. [Google Scholar]
  22. Epskamp, S.; Costantini, G.; Haslbeck, J.; Isvoranu, A.; Cramer, A.O.J.; Waldorp, L.J.; Schmittman, V.D.; Borsboom, D. Package ‘qgraph’. R package version 2021, 1.9. [Google Scholar]
  23. Fentz, H. N.; Trillingsgaard, T. Checking up on couples: A meta-analysis of the effect of assessment and feedback on marital functioning and individual mental health in couples. Journal of Marital and Family Therapy 2017, 43, 31–50. [Google Scholar] [CrossRef] [PubMed]
  24. Frisch, M. B.; Cornell, J.; Villanueva, M.; Retzlaff, P. J. Clinical validation of the Quality of Life Inventory: A measure of life satisfaction for use in treatment planning and outcome assessment. Psychological Assessment 1992, 4(1), 92–101. Available online: https://psycnet.apa.org/doi/10.1037/1040-3590.4.1.92. [CrossRef]
  25. Funk, J. L.; Rogge, R. D. Testing the ruler with item response theory: Increasing precision of measurement for relationship satisfaction with the Couples Satisfaction Index. Journal of Family Psychology 2007, 21(4), 572–583. [Google Scholar] [CrossRef]
  26. Hawkins, A. J.; Amato, P. R.; Kinghorn, A. Are government-supported healthy marriage initiatives affecting family demographics? A state-level analysis. Family Relations 2013, 62(3), 501–513. [Google Scholar] [CrossRef]
  27. Karney, B. R.; Bradbury, T. N. The longitudinal course of marital quality and stability: A review of theory, methods, and research. Psychological Bulletin 1995, 118(1), 3–34. Available online: https://psycnet.apa.org/doi/10.1037/0033-2909.118.1.3. [CrossRef]
  28. Kennedy, D. P.; Jackson, G. L.; Green, H. D.; Bradbury, T. N.; Karney, B. R. The analysis of duocentric social networks: A primer. Journal of Marriage and Family 2015, 77(1), 295–311. [Google Scholar] [CrossRef]
  29. Kroenke, K.; Spitzer, R. L.; Williams, J. B. The PHQ-9: validity of a brief depression severity measure. Journal of General Internal Medicine 2001, 16(9), 606–613. [Google Scholar] [CrossRef]
  30. Lambert, N. M.; Fincham, F. D. Expressing gratitude to a partner leads to more relationship maintenance behavior. Emotion 2011, 11(1), 52–60. Available online: https://psycnet.apa.org/doi/10.1037/a0021557. [CrossRef]
  31. Le, Y.; Roddy, M. K.; Hatch, S. G.; Doss, B. D. Mechanisms of improvements and maintenance in online relationship programs for distressed low-income couples. Journal of Consulting and Clinical Psychology 2020, 88(12), 1091–1104. [Google Scholar] [CrossRef]
  32. Markman, H. J.; Hawkins, A. J.; Stanley, S. M.; Halford, W. K.; Rhoades, G. Helping couples achieve relationship success: A decade of progress in couple relationship education research and practice, 2010–2019. Journal of Marital and Family Therapy 2022, 48(1), 251–282. [Google Scholar] [CrossRef] [PubMed]
  33. Owen, J.; Rhoades, G. K.; Stanley, S. M.; Markman, H. J. The Revised Commitment Inventory: Psychometrics and use with unmarried couples. Journal of Family Issues 2011, 32(6), 820–841. [Google Scholar] [CrossRef] [PubMed]
  34. Pollard, A. E.; Rogge, R. D. Love in the time of COVID-19: A multi-wave study examining the salience of sexual and relationship health during the COVID-19 pandemic. Archives of Sexual Behavior 2022, 51(1), 247–271. [Google Scholar] [CrossRef] [PubMed]
  35. Rasmussen, B. D.; Daks, J. S.; Rogge, R. D. Thanks, unspoken: The critical roles of feeling grateful and expressing gratitude in romantic relationships. In Manuscript in preparation.; 2026. [Google Scholar]
  36. Reis, H. T.; Clark, M. S.; Holmes, J. G. Perceived partner responsiveness as an organizing construct in the study of intimacy and closeness. In Handbook of Closeness and Intimacy; Psychology Press, 2004; pp. 211–236. [Google Scholar]
  37. Rodrigues, A. E. Examining Moderating and Mediating Effects of Aversive Behavior in Romantic Relationships. Doctoral dissertation, ProQuest, Pub. No. 3430810 University of Rochester, 2010. [Google Scholar]
  38. Roddy, M. K.; Walsh, L. M.; Rothman, K.; Hatch, S. G.; Doss, B. D. Meta-analysis of couple therapy: Effects across outcomes, designs, timeframes, and other moderators. Journal of Consulting and Clinical Psychology 2020, 88(7), 583–596. [Google Scholar] [CrossRef]
  39. Rogge, R. D.; Bradbury, T. N. Till violence does us part: the differing roles of communication and aggression in predicting adverse marital outcomes. Journal of Consulting and Clinical Psychology 1999, 67(3), 340–351. [Google Scholar] [CrossRef]
  40. Rogge, R. D.; Cobb, R. M.; Johnson, M. D.; Lawrence, E. E.; Bradbury, T. N. The CARE Program: A Preventive Approach to Marital Intervention. In Clinical Handbook of Couple Therapy; Gurman, A., Jacobson, N., Eds.; Guilford: New York, 2002; pp. 420–435. [Google Scholar]
  41. Rogge, R. D.; Fincham, F. D.; Crasta, D.; Maniaci, M. R. Positive and negative evaluation of relationships: Development and validation of the Positive–Negative Relationship Quality (PN-RQ) scale. Psychological Assessment 2017, 29(8), 1028–1043. Available online: https://psycnet.apa.org/doi/10.1037/pas0000392. [CrossRef]
  42. Rogge, R. D.; Macri, J. A.; Okwudili, K. Connection at your fingertips: A first look at the Agapé app’s contributions to healthy relationships. Journal of Family Psychology 2024, 38(1), 1–16. [Google Scholar] [CrossRef]
  43. Rolffs, J.L.; Rogge, R.D. Brief Interventions to Strengthen Relationships and Prevent Dissolution. In Positive Approaches to Optimal Relationship Development; Knee, C. R., Reis, H. T., Eds.; Cambridge University Press: Cambridge, UK, 2016. [Google Scholar]
  44. Rothman, K.; Roddy, M. K.; Doss, B. D. Completion of a stand-alone versus coach-supported trial of a web-based program for distressed relationships. Family Relations 2019, 68(4), 375–389. [Google Scholar] [CrossRef]
  45. Schramm, D. G. Individual and social costs of divorce in Utah. Journal of Family and Economic Issues 2006, 27(1), 133–151. [Google Scholar] [CrossRef]
  46. Shaw, A. M.; Rogge, R. D. Evaluating and refining the construct of sexual quality with item response theory: Development of the Quality of Sex Inventory. Archives of Sexual Behavior 45 2016, 249–270. [Google Scholar] [CrossRef]
  47. Sullivan, K. T.; Pasch, L. A.; Eldridge, K. A.; Bradbury, T. N. Social support in marriage: Translating research into practical applications for clinicians. The Family Journal 1998, 6(4), 263–271. [Google Scholar] [CrossRef]
  48. Tibshirani, R. Regression shrinkage and selection via the LASSO. Journal of the Royal Statistical Society. Series B (Methodological) 1996, 58(1), 267–288. [Google Scholar] [CrossRef]
  49. van Gemert-Pijnen, J. E.; Nijland, N.; van Limburg, M.; Ossebaard, H. C.; Kelders, S. M.; Eysenbach, G.; Seydel, E. R. A holistic framework to improve the uptake and impact of eHealth technologies. Journal of Medical Internet Research 2011, 13(4), e1672. [Google Scholar] [CrossRef]
  50. Wadsworth, M. E.; Markman, H. J. Where’s the action? Understanding what works and why in relationship education. Behavior Therapy 43 2012, 99–112. [Google Scholar] [CrossRef] [PubMed]
  51. Watson, D.; Clark, L. A.; Weber, K.; Assenheimer, J. S.; Strauss, M. E.; McCormick, R. A. Testing a tripartite model: II. Exploring the symptom structure of anxiety and depression in student, adult, and patient samples. Journal of Abnormal Psychology 1995, 104(1), 15–25. [Google Scholar] [CrossRef]
Figure 1. Repeated-Measures Cohen’s d Effect Sizes for 1-month Pre-Post Change NOTE: Rel = relationship; Pos = positive; Neg = negative; Psych = psychological; Sx = symptoms; Emo = emotional; PP = perceived partner; To facilitate interpretation, effects that emerged as significant at p < .05 from within-person repeated measures ANOVAs (see Supplemental Table S1) have been highlighted teal (in men) and pink (in women).
Preprints 208602 g001
Figure 2. Network Analysis Results on Pre-Post Change in Men (A) and Women (B) Separately, and as a Dyad (C). NOTE: The variables in the models (nodes) are represented by circles. The lines connecting the nodes (edges) represent partial correlations between each pair of variables, controlling for all other variables in the network. The color of the edges indicates the direction of those unique associations (red for negative links, blue for positive links) and the width and color intensity of the edges reflects their relative strengths (thicker lines with more saturated colors reflecting stronger links). The spring plots graph the results empirically by placing nodes with greater centrality (e.g., those with stronger links to other nodes and greater numbers of edges) nearer the center of the graph.
Preprints 208602 g002
Figure 3. Estimates from the Pre-Post Network Models of Node Strength (A) and Expected Influence (B). NOTE: Strength is the sum of absolute edge weights and therefore reflects the overall magnitude of unique associations with other variables for each construct. Expected influence is the sum of the direct/indirect paths between a given node and all other nodes (multiplying node signs through each of these paths), thereby representing the overall activation or deactivation of the model driven by change in a single node. These are estimated both for individual networks of variables within women (pink lines, corresponding to Fig 2B) and men (blue lines, corresponding to Fig 2A), and in the dyadic networks (black lines, Fig 2C).
Preprints 208602 g003
Figure 4. Dyadic Network Analysis HLM Slopes of Linear Change (A) and Strength Centrality Indices (B). Notes. The variables in the models (nodes) are represented by circles. The lines connecting the nodes (edges) represent partial correlations between each pair of variables, controlling for all other variables in the network. The color of the edges indicates the direction of those unique associations (red for negative links, blue for positive links) and the width and color intensity of the edges reflects their relative strengths (thicker lines with more saturated colors reflecting stronger links). The spring plots graph the results empirically by placing nodes with greater centrality (e.g., those with stronger links to other nodes and greater numbers of edges) nearer the center of the graph.
Preprints 208602 g004
Disclaimer/Publisher’s Note: The statements, opinions and data contained in all publications are solely those of the individual author(s) and contributor(s) and not of MDPI and/or the editor(s). MDPI and/or the editor(s) disclaim responsibility for any injury to people or property resulting from any ideas, methods, instructions or products referred to in the content.
Copyright: This open access article is published under a Creative Commons CC BY 4.0 license, which permit the free download, distribution, and reuse, provided that the author and preprint are cited in any reuse.
Prerpints.org logo

Preprints.org is a free preprint server supported by MDPI in Basel, Switzerland.

Subscribe

Disclaimer

Terms of Use

Privacy Policy

Privacy Settings

© 2026 MDPI (Basel, Switzerland) unless otherwise stated