Submitted:
14 April 2026
Posted:
15 April 2026
You are already at the latest version
Abstract
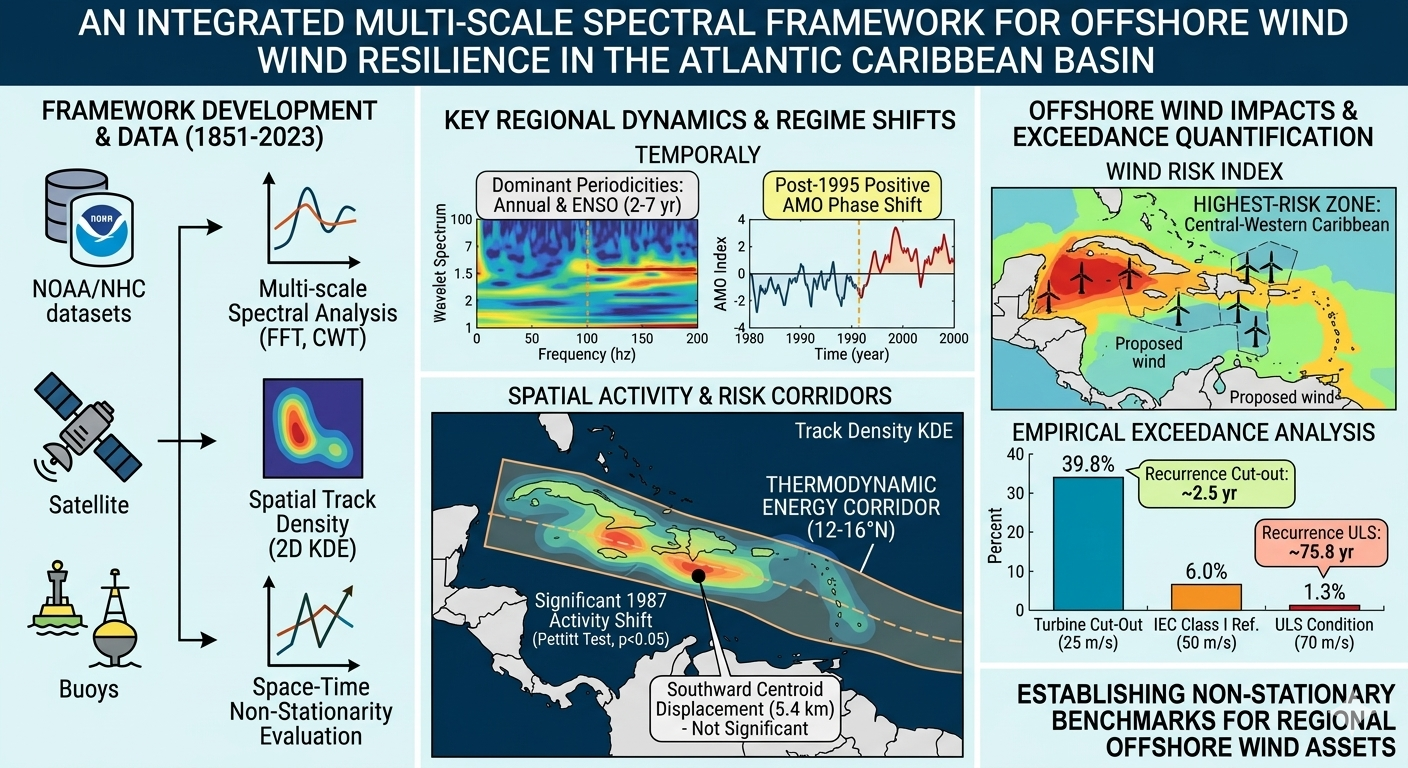
The development of offshore wind energy in tropical cyclone-prone regions requires analytical frameworks that capture non-stationary climate dynamics. This study presents a multi-scale spectral approach to characterize Atlantic tropical cyclone variability and assess implications for offshore wind resilience in the Caribbean Basin. The methodology integrates Fast Fourier Transform (FFT) and Continuous Wavelet Transform (CWT) to resolve temporal variability in sea surface temperature, cyclone frequency, and intensity, complemented by two-dimensional kernel density estimation (KDE) and non-stationarity analysis. Using NOAA and National Hurricane Center datasets, results identify dominant periodicities at annual and ENSO (2–7 year) scales, a post-1995 spectral energy shift associated with the positive AMO phase, and a thermodynamically consistent energy corridor along 12-16°N. A statistically significant change point in 1987 (Pettitt test, p < 0.05) is detected, although spatial displacement is not significant. An integrated Wind Risk Index highlights the central-western Caribbean as a high-exposure zone overlapping offshore wind development areas. Exceedance analysis shows that 39.8% of observations surpass 25 m/s, 6.0% exceed 50 m/s, and 1.3% approach 70 m/s, indicating relevant design considerations. These findings support the need for non-stationary, multi-scale approaches in offshore wind risk assessment under tropical cyclone influence.
Keywords:
wind energy
; tropical cyclones
; continuous wavelet transform
; sea surface temperature
; track density analysis
; offshore wind resilience
; Atlantic Caribbean
1. Introduction
The rapid expansion of offshore wind energy constitutes a cornerstone of global decarbonization pathways, particularly in semi-enclosed tropical basins, where wind resources are persistent and proximity to coastal load centers reduces transmission losses [1,2]. However, in cyclone-prone environments, such as the Atlantic Caribbean Basin, long-term energy yield optimization cannot be decoupled from structural resilience against extreme wind events. Traditional wind resource assessments frequently rely on stationary Weibull-based statistics and short-term climatologies, which may underestimate the low-frequency modulation of wind regimes and the episodic amplification of structural loads induced by tropical cyclones (TCs) [3,4]. The inherent non-stationarity of ocean–atmosphere coupling in tropical basins necessitates analytical frameworks capable of resolving multi-scale variability and transient spectral regimes that directly influence both mean wind productivity and extreme gust exposure [5]. As offshore wind development extends into previously unexploited tropical maritime zones, the limitations of stationary probabilistic models are becoming increasingly apparent, underscoring the need for spectral and spatial approaches that capture the evolutionary characteristics of cyclone climatology.
Atlantic tropical cyclone activity is strongly modulated by thermodynamic and dynamic boundary conditions, notably Sea Surface Temperature (SST), vertical wind shear, mid-level humidity, and large-scale circulation patterns [6,7,8]. On interannual timescales, the Niño–Southern Oscillation (ENSO) exerts a primary control via modulation of upper-level wind shear across the Main Development Region (MDR), typically suppressing Atlantic cyclone formation during El Niño phases and enhancing activity during La Niña conditions [9,10]. On multi-decadal scales, the Atlantic Multidecadal Oscillation (AMO) influences basin-wide SST gradients and meridional overturning circulation strength, altering cyclone frequency and intensity distributions through thermodynamic preconditioning of the ocean surface layer [11,12]. Recent observational evidence further suggests that these oscillatory modes drive not only temporal variability but also the spatial redistribution of cyclone track density, with implications for the geographic exposure of offshore infrastructure [13]. These oscillatory modes interact nonlinearly, producing intermittent phase synchronization and amplitude modulation phenomena that manifest as coherent spectral bands across SST anomalies, wind velocity fields and cyclone occurrence frequency. Consequently, quantifying the phase-lag relationships between ocean warming pulses and subsequent cyclone intensification is critical for identifying cyclic windows of elevated wind resource availability that may simultaneously coincide with an amplified structural loading risk.
Spectral techniques provide a mathematically rigorous basis for resolving such dynamics. The Fast Fourier Transform (FFT) identifies dominant global periodicities and basin-scale oscillatory modes under quasi-stationary assumptions [14]. However, Fourier methods lack temporal localization and therefore cannot resolve transient spectral transitions characteristic of non-stationary climatic signals. Wavelet-based approaches overcome this limitation by decomposing signals into time-frequency space, with the Continuous Wavelet Transform (CWT) capturing localized power variability and enabling detection of regime shifts and time-dependent modulation of cyclone activity [15,16,17]. These tools have demonstrated robustness in detecting ENSO-related teleconnections and AMO-modulated variability in hydroclimatic datasets [18], yet their integrated application to offshore wind resilience assessment remains underexplored in the Atlantic Caribbean context. Complementing spectral diagnostics with spatial track density analysis and kernel-based energy corridor identification enables a multi-dimensional characterization of cyclone risk that transcends purely temporal approaches, resolving both the temporal periodicity and the geographic concentration of cyclone exposure simultaneously.
From an engineering perspective, offshore wind turbine design in cyclone-exposed basins must comply with the IEC 61400-1 and IEC 61400-3 standards, which classify turbines according to reference wind speeds, extreme turbulence intensity, and site-specific environmental loading conditions [19]. In tropical regions, cyclonic gust factors, rapid directional shear shifts, and wave–wind coupling effects may exceed the design envelope of conventional turbine classes, thereby accelerating fatigue accumulation and compromising structural integrity [20]. Therefore, resilience-based planning requires the probabilistic characterization of extreme wind regimes embedded within long-term climate oscillations. Integrating spectral diagnostics into wind resource assessments enables differentiation between (i) productive interannual regimes with enhanced wind power density and (ii) high-risk intervals dominated by cyclone-driven load amplification. Such a distinction supports turbine class selection, monopile or jacket foundation optimization, and long-term financial risk modeling under climate variability constraints [21]. The incorporation of a spatially resolved Wind Risk Index (WRI) further refines this assessment by identifying geographic zones where the probability of cyclone transit and thermodynamic intensification potential converge to create critical engineering risk thresholds.
In this framework, the present study developed an Integrated Multi-Scale Spectral Framework for Tropical Cyclone Dynamics to quantify ocean-atmosphere coupling processes and their implications for offshore wind energy resilience in the Atlantic Caribbean Basin, with a focused application in the Colombian Caribbean. By combining FFT-derived global periodicities with CWT time-frequency diagnostics, spatial track density analysis, and thermodynamic coupling assessment, the methodology resolves interannual to multi-decadal spectral structures linking SST anomalies, wind velocity variability, cyclone occurrence, and intensity. This multi-scale approach provides physically interpretable metrics for identifying phase-locked climate regimes, estimating cyclic wind resource opportunity windows, and constraining structural risk amplification periods. Owing to its modular and transferable architecture, the framework bridges climate variability diagnostics with engineering-grade resilience planning in cyclone-exposed offshore energy systems.
The specific objectives of this study are: (i) to characterize the multi-scale spectral signature of tropical cyclone activity in the Atlantic Caribbean Basin using integrated FFT-CWT diagnostics; (ii) to identify and quantify thermodynamic energy corridors through spatial track density analysis; (iii) to assess spatio-temporal non-stationarity in cyclone exposure between early and recent climatological periods using formal change-point and trend detection tests; and (iv) to develop an integrated Wind Risk Index mapping cyclone transit probability with conditional wind speed intensity for offshore wind resilience assessment.
2. Data and Methods
2.1. Data Sources
The analysis was based on two primary ocean–atmosphere datasets. Tropical cyclone best-track data were obtained from the National Hurricane Center (NHC) through the HURDAT2 database (see Table 1 for the complete list of variables), which provides six-hourly records of storm position, maximum sustained wind speed, minimum central pressure, and system classification. The long-term temporal consistency of this dataset (1851–2023) enables the assessment of interannual-to-multidecadal variability in cyclone frequency, intensity, and energetics across the Atlantic Caribbean Basin [22].
Sea surface temperature (SST) fields were retrieved from products developed by the National Oceanic and Atmospheric Administration (NOAA), including reconstructed gridded datasets such as the ERSST, as detailed in Table 2. These data allow the characterization of thermal anomalies over the Main Development Region (MDR) and the Caribbean Sea, which are critical for evaluating the thermodynamic controls on cyclone potential intensity and rapid intensification processes [23]. From these sources, several time series were constructed, including annual maximum intensity (Vmax), and regional SST anomalies. Prior to spectral processing, the series were quality-controlled, detrended when required, seasonally adjusted where appropriate, and normalized to prevent amplitude dominance across the variables. Weak stationarity assumptions were evaluated before applying the classical Fourier-based methods.
A critical limitation of the HURDAT2 dataset that must be acknowledged is the systematic undercounting of tropical cyclones during the pre-satellite era (prior to 1966), when storm detection relied solely on ship reports, coastal observations, and aircraft reconnaissance. Landsea et al. (2004) [22a] estimated that the Atlantic basin database may be missing approximately 3-5 storms per year before 1966, particularly short-lived tropical storms that never approached land. This undercount introduces a potential low bias in the early-period spectral analysis (Section 3.4), where the apparent increase in cyclone frequency after the mid-1990s may partially reflect improved observational coverage rather than purely climatic forcing. While the HURDAT2 reanalysis project has progressively addressed these gaps, the uncertainty in pre-satellite counts should be considered when interpreting the non-stationary trends identified in this study, particularly the regime shift analysis presented in Section 3.2.
2.2. Fourier-Based Spectral Analysis
The primary objective of spectral analysis is to identify dominant periodicities, regime transitions, and energy concentrations that are not readily observable in the time domain. For a continuous signal [24,25], the Fourier Transform (FT) is defined as:
Because climatic records are discrete and finite, the Fast Fourier Transform (FFT) was used to compute the Discrete Fourier Transform (DFT) [26]
The power spectral density (PSD), given by , quantifies the distribution of signal energy across frequencies. By virtue of Parseval’s theorem, energy conservation between the time and frequency domains is ensured:
This formulation allows the spectral peaks to be interpreted physically as enhanced dynamical energy at specific temporal scales. Low-frequency bands capture multidecadal variability, whereas interannual peaks are typically associated with large-scale climate models such as ENSO. In contrast, the higher-frequency components reflect synoptic-scale cyclone dynamics and internal variability.
2.3. Continuous Wavelet Transform and Non-Stationary Variability
Given the non-stationary nature of tropical cyclone activity and SST anomalies, particularly under multidecadal oscillations and anthropogenic warming, a time-localized spectral approach was required [27,28]. The Continuous Wavelet Transform (CWT) was applied to resolve the evolution of frequency content over time:
where represents the scale parameter (inversely proportional to frequency), is the temporal translation, and denotes the mother wavelet, constrained to have zero mean and finite support. Morlet wavelets were selected because of their optimal time–frequency localization for quasi-oscillatory climatic signals. The Morlet mother wavelet was configured with ω₀ = 6 (dimensionless frequency parameter), providing a good balance between time and frequency localization for quasi-oscillatory climate signals. The scale range was set from 1 to 128 years, and statistical significance was assessed at the 95% confidence level against a red noise AR(1) background model using 5,000 Monte Carlo simulations [29].
CWT enables the identification of transient power amplifications within specific frequency bands, revealing the time-dependent modulation of cyclone activity. For instance, intermittent strengthening in the 2–7 year band is consistent with ENSO-driven variability, whereas persistent low-frequency enhancement corresponds to multi-decadal Atlantic variability. Wavelet power spectra further allow the detection of regime shifts, such as the post-1995 intensification periods in Atlantic cyclone activity [30]. Complementing the temporal spectral approach, kernel density estimation (KDE)-based spatial analysis provides the geographic context necessary to interpret where spectral energy concentrations manifest as intensified cyclone exposure, enabling the identification of thermodynamic energy corridors that modulate the probability and intensity of cyclone impacts on offshore infrastructure.
2.4. Kernel Density Estimation for Track Density
While spectral methods resolve the temporal dimension of cyclone variability, spatial analysis is essential for characterizing the geographic distribution of cyclone exposure, which directly determines site-specific engineering risk. Kernel density estimation (KDE) provides a non-parametric, mathematically rigorous approach for converting discrete cyclone track position data into continuous spatial probability surfaces [31].
For a set of n two-dimensional track observations {(x₁, y₁), (x₂, y₂), ..., (xₙ, yₙ)}, the bivariate KDE at location (x, y) is defined as
where K denotes the kernel function, and h is the smoothing bandwidth parameter. A Gaussian kernel was selected for its smooth, symmetric properties and infinite support, ensuring that the resulting density surface is differentiable everywhere, which is a desirable property for subsequent gradient analysis and contour extraction. The bandwidth h was determined using Silverman's rule of thumb, which provides an asymptotically optimal balance between the bias and variance for Gaussian kernels:
where n is the sample size, d is the data dimensionality (d = 2 for spatial analysis), and σ is the standard deviation. This data-driven bandwidth selection avoids the subjectivity inherent in fixed-bandwidth approaches while adapting to the spatial concentration characteristics of the track data [32].
The KDE surface was evaluated on a regular grid spanning the Caribbean study domain (9°N–16°N, 82°W–68°W), with percentile contours extracted at the 50th, 75th, and 90th percentile levels to delineate zones of increasing cyclone-track density. This percentile-based corridor delineation provides an intuitive and physically interpretable framework for identifying regions of elevated cyclone exposure, with the 75th percentile contour defining the primary corridor with the highest transit probability. Compared to conventional gridded binning approaches, KDE offers several advantages: (i) it produces smooth, continuous density surfaces without arbitrary grid cell boundaries; (ii) the bandwidth parameter provides explicit control over spatial smoothing, enabling consistent comparison across periods; (iii) percentile contour extraction is invariant to absolute density magnitude, facilitating comparison between climatological periods with different sample sizes [33,34,35].
2.5. Engineering Design Thresholds and Risk Classification
The translation of climatological risk metrics into engineering design parameters requires a standardized classification framework that maps wind speed statistics to the structural design requirements. The IEC 61400-3-1 standard for fixed offshore wind turbines establishes three critical wind speed thresholds that define the operational and structural design envelope [36].
The turbine cut-out speed (25 m/s) represents the maximum wind speed at which the turbine can operate safely. Above this threshold, the pitch control system feathers the blades, and the rotor is locked to prevent structural damage from excessive aerodynamic loading. During cyclone events, wind speeds frequently exceed this threshold, necessitating planned shutdowns that represent lost energy production but preserve the structural integrity. The IEC Class I reference wind speed (50 m/s) defines the extreme wind speed that a Class I turbine must withstand without catastrophic structural failure. This is the standard design class for turbines in cyclone-exposed regions and corresponds approximately to a Category 2–3 hurricane on the Saffir-Simpson scale. Turbines designed to Class I specifications must satisfy Ultimate Limit State (ULS) verification under the 50-year extreme wind model (EWM), which incorporates both the mean wind speed and turbulence intensity expected during extreme events. The Ultimate Limit State wind speed (70 m/s) represents the extreme structural loading threshold beyond which the catastrophic failure of the support structure (monopile, jacket, or floating platform) becomes probable. This threshold corresponds approximately to a Category 5 hurricane and defines the design boundary for Special Class turbines or site-specific design adaptations required in the most severely exposed locations [37,38].
Based on these thresholds, a three-zone engineering risk classification was developed for this study: (1) the Energy Potential Zone (Vmax < 25 m/s), encompassing conditions where wind speeds fall within the operational range of commercial turbines and cyclone-related wind fields contribute positively to the regional wind resource base; (2) the Transition Zone (25 m/s ≤ Vmax ≤ 50 m/s), spanning conditions from turbine shutdown through the survival threshold of Class I designs, where advanced control systems must manage emergency shutdown sequences while the kinetic energy content represents a technically challenging but potentially exploitable resource; and (3) the Structural Risk Zone (Vmax > 50 m/s), encompassing extreme wind speeds that impose Ultimate Limit State loading conditions on offshore structures and define the boundary for Special Class turbine specifications. This classification provides a direct mapping between the probabilistic wind speed distribution derived from historical cyclone data and the engineering design parameters specified in the IEC 61400-3-1 standard, enabling quantitative assessment of the energy opportunity versus structural risk trade-off at any location within the study domain [39,40,41].
2.6. Data Processing Architecture
The methodological architecture was designed to integrate oceanic thermodynamic forcing and tropical cyclone dynamical metrics into a unified, multiscale spectral and probabilistic framework. As delineated in Figure 1, the complete analytical workflow was implemented in MATLAB and structured into four interconnected modules: (1) acquisition of high-resolution oceanographic and climatological datasets; (2) spatiotemporal harmonization, continuous time-series regularization, and geospatial filtering localized to the Caribbean Basin; (3) multi-scale spectral diagnostics via wavelet-based filtering, CWT, and spatial density analysis; and (4) probabilistic risk assessment and engineering design classification, comprising the IEC 61400-3-1 threshold characterization, the empirical exceedance frequency analysis, and the spatial integration of the Wind Risk Index. This integrated pipeline ensures dynamic consistency and statistical robustness, effectively translating complex climate variability processes into actionable engineering metrics for offshore wind resilience assessment.
The Caribbean study domain was defined as Latitude: 9°N-16°N and Longitude: -82°W to -68°W. This sector corresponds to the southwestern Caribbean Basin, which is characterized by elevated tropical cyclone exposure and emerging offshore wind development interest [42]. Spatial filtering was performed using logical indexing, and the monthly regional SST was computed via double spatial averaging:
where represents the number of valid grid cells within the defined domain. This produced a single, thermodynamically representative monthly SST time series.
To couple oceanic thermodynamics with cyclone dynamics, a robust parsing routine standardizes heterogeneous date-time entries. Cyclone records lacking explicit hour fields were automatically assigned default timestamps to preserve chronological continuity. Subsequently, year and month arrays were extracted from each six-hourly hurricane record and matched with the corresponding monthly SST entries through a relational inner-join operation. This spatiotemporal fusion generated an integrated dataset in which each localized cyclone observation was inherently linked to its concurrent thermodynamic forcing anomaly [43].
Because Fourier and wavelet spectral methods require strictly regular and continuously sampled signals, a continuous monthly time vector was constructed. Annual and monthly aggregated series, including Saffir-Simpson category counts, maximum sustained wind speeds (Vmax), and derived intensity indices, were mapped onto this regularized temporal grid. Missing entries were addressed using linear interpolation with nearest-neighbor boundary completion to prevent artificial spectral discontinuities from occurring. To ensure scale invariance and compliance with the weak stationarity assumptions required for spectral estimation, all continuous signals were standardized via variance normalization.
where is the original time series, is the sample mean, and is the standard deviation [44].
To isolate interannual variability and attenuate ultra-low-frequency background trends without inducing the spectral leakage associated with classical high-pass filters, a discrete wavelet decomposition was executed. This multiresolution filtering utilized Daubechies order 10 (db10) wavelets across 10 decomposition levels, effectively preserving oscillatory structures associated with macroclimatic variability [45].
The Wind Risk Index (WRI) was formulated as a composite metric integrating cyclone transit probability with expected wind speed intensity at each grid cell. For a given location (x, y), the WRI is defined as:
where is the KDE-derived spatial probability density of cyclone transit at location (x, y), and is the conditional expectation of maximum sustained wind speed given transit through that location. It is important to note that is computed as the KDE-weighted conditional mean:
where is the Euclidean distance between location (x, y) and the i-th track observation, and K(·) is the Gaussian kernel. This KDE-weighted estimate differs from the simple arithmetic mean Vmean by giving greater weight to nearby observations, thereby capturing the spatial heterogeneity of cyclone intensity. The formulation captures both the likelihood of cyclone encounter and the expected intensity of cyclone-driven wind loading, providing a more comprehensive risk metric than either component alone. The WRI surface was computed by combining the KDE track density surface with a spatially-interpolated Vmax climatology derived from the six-hourly HURDAT2 records.
3. Results and Discussion
The following sections provide an integrated analysis of the multi-scale dynamics of tropical cyclones and their implications for offshore wind energy infrastructure. Section 3.1 characterizes the spatio-temporal distribution and genesis of these events, establishing the geographic corridors of energy flux. Section 3.2 employs FFT and CWT to resolve the non-stationary spectral signatures of cyclone intensity across the Saffir-Simpson scale. Section 3.3 examines the thermodynamic coupling between SST climatology and cyclone track density, identifying energy corridors through kernel density estimation. Section 3.4 quantifies the spatio-temporal non-stationarity of regional cyclone activity between early and recent climatological periods. Section 3.5 presents an integrated energy-risk framework combining spatial risk mapping, seasonal cycles, and intensification profiles for offshore wind assessment.
3.1. Spatio-Temporal Dynamics
Assessing offshore wind potential and structural resilience in the Caribbean Basin requires a comprehensive analysis of the genesis and trajectory of hydrometeorological events. Analysis of historical records (1851–2023) identifies a predominant cyclonic activity corridor, or "energy flux belt," extending from the Main Development Region (MDR) in the Central Tropical Atlantic (10°N–20°N, 20°W–60°W) toward the Caribbean Basin. As shown in Figure 2A, the "cradle" of tropical depressions is consistently localized near the Cape Verde Islands, where African Easterly Waves initiate their thermodynamic organization. This intensification process is critical from an energy engineering perspective: whereas low-intensity events maintain a broad latitudinal dispersion, systems transitioning into higher categories (Cat. 3–5) tend to converge into narrower, energetically dense trajectories that cross the 15°N threshold toward the Colombian Caribbean, identified with strategic coordinates between 11°N–13°N and 71°W–75°W.
The detailed geospatial analysis in Figure 2B reveals that the Colombian Caribbean acts as a secondary receptor of cyclonic energy, where the interaction with continental orography and local thermal anomalies modulates the impact severity. In terms of infrastructure design, the concentration of trajectories along the coastal fringe of the La Guajira Peninsula (12.5°N, 71.5°W) represents a dual-load scenario. On the one hand, the presence of major hurricanes (Cat. 4 and 5), though infrequent according to the historical record, imposes design requirements under IEC 61400-3-1 standards for extreme wind loads (Vref), where gusts may exceed the survival limits of conventional turbines. However, the high density of tropical storms and Category 1 and 2 hurricanes in this corridor presents a significant technical opportunity for energy harvesting. These events, when wind speeds fall within the operational cut-out range (typically 25–30 m/s), can drastically increase the capacity factor of an offshore wind farm, provided that the pitch control systems operate with the necessary fidelity to mitigate fatigue loads.
This balance between structural risk and energy opportunity is fundamental to projecting economic viability. The identification of zones with relatively lower cyclonic activity, such as areas south of 10.5°N, suggests locations with lower capital expenditures (CAPEX) for structural reinforcement, albeit potentially with less vigorous wind resources. Conversely, high-activity sectors in the northern Colombian Caribbean demand adaptive turbine architectures capable of capitalizing on wind regimes enhanced by peripheral cyclonic phenomena without compromising the component fatigue life. Detailed maps by specific category, documenting this transition from genesis to dissipation, are included in Figures S1–S2 in the Supplementary Information.
3.2. Multi-Scale Spectral Characterization
To overcome the limitations of stationary statistical models, this section presents a multiscale spectral characterization of cyclogenesis in the Atlantic Basin (1851–2023). By integrating the Fast Fourier Transform (FFT) and Continuous Wavelet Transform (CWT), climate variability was decomposed to identify dominant periodicities and their transient evolution in the time-frequency domain. The analysis progresses logically from global basin dynamics to a detailed evaluation by intensity categories (Saffir-Simpson scale).
3.2.1. Global Basin Dynamics and Non-Stationary
To elucidate the physical drivers behind the observed historical trends, this section examines the non-stationary dynamical behavior and multi-scale spectral evolution of hydrometeorological events in the Atlantic Basin. Figure 3A illustrates the chronological evolution of event frequency from 1851 to 2023, during which 1,973 tropical cyclones were recorded. The series exhibits a markedly non-stationary trend, with interannual variability ranging from cyclogenesis minimums in the 19th and early 20th centuries to unprecedented historical maxima of 28 and 30 events during the 2005 and 2020 seasons, respectively. From a scientific and engineering perspective, this fluctuation refutes the applicability of stationary statistical models (e.g., classical Poisson distributions) for long-term wind risk estimation.
The Power Spectral Density (PSD) derived from the FFT in Figure 3D reveals a dominant peak at a fundamental frequency of 3.17 × 10⁻⁸ Hz, which constitutes the spectral fingerprint of the basin's annual seasonal thermal cycle. The most relevant finding for structural planning is the identification of robust secondary peaks in the low-frequency band, specifically between 4.52 × 10⁻⁹ Hz and 1.58 × 10⁻⁸ Hz (corresponding to periods of 2–7 years). These bands reveal the direct modulation of Atlantic wind shear by macroclimatic phenomena, primarily the El Niño–Southern Oscillation (ENSO).
The CWT scalogram (Figure 3C) reveals a transient evolution where energy is not homogeneously distributed. Notably, the energy in the fundamental band exhibits an abrupt regime shift, showing a massive intensification in spectral amplitude starting in 1995, which is sustained until the end of the record in 2023. This continuous high-energy "pulse" coincides with the shift toward the positive phase of the Atlantic Multidecadal Oscillation (AMO) and the anomalous increase in Sea Surface Temperature (SST). The activation of high-energy patches at ultra-low frequencies (periods of 8 to 12 years) is also validated above the red noise threshold in the Global Wavelet Spectrum. For wind energy development in the Caribbean, the persistence of this combined spectral signature indicates that the extreme wind regime has transitioned into a state of higher energy density and interannual turbulence.
To formally evaluate the temporal non-stationarity identified in the spectral analysis, the Pettitt change-point test and the Mann-Kendall trend test were applied to the annual cyclone frequency and maximum intensity series for the period 1950–2023 (the era of more reliable observational coverage). The Pettitt test detected a statistically significant change point at 1987 for both cyclone frequency (p = 0.011) and maximum intensity (p = 0.016), providing formal statistical support for the regime shift identified visually in the wavelet scalograms. This change point is broadly consistent with the transition to the positive AMO phase and elevated SST conditions. However, the Mann-Kendall test did not detect a statistically significant monotonic trend over the full 1950–2023 period for either frequency (Z = 1.129, p = 0.259) or intensity (Z = −1.940, p = 0.052), indicating that while an abrupt regime shift is present, a simple linear trend does not adequately describe the temporal evolution. This distinction is important for engineering design: the absence of a significant monotonic trend does not negate the presence of the regime shift, which has practical implications for non-stationary design load cases.
3.2.2. Spectral Signature of Category 1 Hurricanes
Figure 4 characterizes the time-frequency dynamics exclusive to Category 1 hurricanes, isolating the spectral signature of events with sustained winds between 33.1 and 42.5 m/s. The time series in Figure 4A documents the chronological evolution of these events globally in the Atlantic Basin, recording a total of 970 Category 1 hurricanes during the 1851–2023 period. A detailed geospatial analysis based on the coordinates of the Colombian Caribbean Sea (9°N–16°N, 82°W–68°W) revealed that only a critical fraction of 147 events impacted or were generated within this area of influence. This filtering of the global signal to the local scale is crucial for wind engineering, as it demonstrates that the Colombian corridor operates under a regime of geomorphological and atmospheric attenuation that reduces the absolute frequency of direct impacts.
The PSD from the FFT in Figure 4D confirms the forcing of the annual thermal cycle (3.17 × 10⁻⁸ Hz), but unlike the global spectrum, the power density in the interannual low-frequency bands presents a distinct variance dispersion with less consolidated harmonics. This indicates that while total cyclogenesis is strongly coupled to ENSO, the specific maturation to Category 1 possesses a higher stochastic component. The CWT scalogram (Figure 4C) reveals a pronounced broadening and intensification of spectral power density starting in the 1990s, correlating directly with the AMO warm phase transition around 1995 coupled with sustained SST increase. For the Colombian Caribbean Sea, the pulsating and fragmented nature of this spectrum is a favorable finding because it confirms that offshore infrastructure will not be subjected to continuous aerodynamic resonance.
3.2.3. Spectral Progression Across Intermediate and Major Hurricanes (Categories 2–4)
The record (1851–2023) registers 586 Category 2, 329 Category 3, and 170 Category 4 hurricanes at basin scale, of which only 84 (14.3%), 43 (13.1%), and 33 (19.4%) respectively impacted the Colombian Caribbean corridor (9°N–16°N, 82°W–68°W), amounting to 160 intermediate-to-major events just 16.5% of the basin-wide total. Their mean recurrence within the zone decreases inversely with intensity: one Category 2 event every ~2.7 years (mean Vmax of 45.7 m/s, near the IEC Class I threshold), one Category 3 every ~4.8 years (53.6 m/s, exceeding Class I), and one Category 4 every ~6.2 years (64.4 m/s, approaching the 70 m/s ULS). A comparative evaluation of the supplementary spectrograms reveals an inverse relationship between cyclonic intensity and the persistence of the annual spectral signature: as the category increases, the fundamental frequency progressively loses dominance and spectral power scatters into discrete, high-amplitude pulses aligned with compounding AMO–ENSO phases.
From an offshore structural engineering standpoint, of the 425 storms recorded in the Colombian Caribbean, 55 (12.9%) exceeded the IEC Class I threshold of 50 m/s and 15 (3.5%) approached or surpassed the 70 m/s ULS envelope. Category 2 events primarily inform Fatigue Limit State (FLS) verification. Category 3 storms define the boundary between FLS and ULS design requirements. Category 4 events constitute primary ULS drivers requiring IEC Special Class turbine specifications. Detailed spectral analyses for Categories 2–4 are provided in Supplementary Figures S3, S4, and S5.
3.2.4. Macroclimatic Coupling and Category 5 Super-Hurricanes
At the apex of the Saffir-Simpson scale, Figure 5 characterizes the time-frequency dynamics of Category 5 hurricanes. The time series in Figure 5A illustrates the annual frequency, accounting for 40 recorded events with marked stochastic intermittency. The PSD in Figure 5D reveals a notable suppression of the dominant annual seasonal peak (3.17 × 10⁻⁸ Hz), with a redistribution of kinetic energy toward ultra-low frequency bands below 3.16 × 10⁻⁹ Hz (periods greater than 10 years). This indicates that the maturation of a cyclone to Category 5 does not respond to seasonal atmospheric forcings but rather to the slow and sustained accumulation of thermal and momentum anomalies at the basin scale.
The CWT scalogram (Figure 5C) reveals a matrix of extremely fragmented and discrete high spectral power cores, while the Global Wavelet Spectrum exposes a broad and robust distribution of spectral power density strongly concentrated in prolonged periods (greater than 10 and 20 years). This confirms that extreme cyclogenesis is intrinsically coupled to long-term climatic modulations, requiring the simultaneous and prolonged alignment of optimal boundary conditions such as the positive phase of the AMO combined with the secular increase in Ocean Heat Content. Historically, only 15 Category 5 events have transited through the Colombian Caribbean zone, establishing that structural risk operates under an epochal (multidecadal) recurrence regime rather than an interannual one.
3.3. Thermodynamic Coupling and Cyclone Energy Corridor
The coupling between SST climatology and cyclone track density reveals a well-defined energy corridor along the southwestern Caribbean, as illustrated in Figure 6. The KDE-based track density analysis identifies maximum cyclone trajectory concentration at approximately 12–16°N, consistent with the genesis-to-maturation trajectory from the Main Development Region (MDR) through the Caribbean Sea. This corridor represents the primary pathway through which cyclonic energy is transmitted toward the Colombian Caribbean, with the 75th percentile density contour delineating the zone of highest cyclone exposure affecting offshore infrastructure development zones.
The corridor is spatially co-located with the warmest SST range in the domain (27.5–29.5°C), providing sustained thermodynamic support for cyclone intensification. This overlap between elevated SST and peak track density reinforces the dependence of cyclone intensity on ocean heat content and establishes the physical basis for the energy corridor concept. Within this region, the highest density values are concentrated in the central-western Caribbean, directly influencing the exposure profile of offshore wind development areas. Superimposed SST gradient vectors further reveal pronounced zonal gradients in the northern sector (~15°N), associated with the interaction between the Caribbean Current and the continental shelf.
This spatial coupling validates the spectral finding from Section 3.2 that post-1995 SST increases have amplified cyclone energy within this corridor. The AMO warm phase transition, identified in the wavelet scalograms as the post-1995 regime shift, has thermodynamically reinforced the corridor by elevating ocean heat content and reducing vertical wind shear. The engineering implications are significant: the spatial overlap between the energy corridor and proposed offshore wind development zones in La Guajira (12.5°N, 71.5°W) demands turbine class selection accounting for both the probability of cyclone transit and the thermodynamic environment favoring intensification.
3.4. Spatio-Temporal Non-Stationarity
The spectral analysis in Section 3.2 identified a regime shift, characterized by a sustained amplification of spectral energy across interannual to decadal scales. This transition is spatially quantified by contrasting cyclone track density between an early period (1851–1950; 745 track points) and a recent period (1951–2023; 771 track points), as illustrated by the density difference in Figure 7.
The resulting spatial pattern reveals a systematic redistribution of cyclone activity across the Colombian Caribbean, with positive anomalies concentrated in the southern and western sectors and negative anomalies toward the northeastern approach. This configuration indicates a coherent southward displacement of the primary cyclone pathway, further supported by the shift in the centroid of activity.
The centroid of cyclone activity was computed as the mean latitude and longitude of all six-hourly track observations within the Caribbean domain (9°N–16°N, 82°W–68°W) for each period. The early period centroid was located at 13.775°N, 76.946°W (N = 745 observations), while the recent period centroid was at 13.726°N, 76.186°W (N = 771 observations). The resulting displacement is approximately 5.4 km southward, with a modest westward component. To assess the statistical significance of this shift, a bootstrap resampling procedure with 10,000 iterations was applied, yielding a 95% confidence interval of [−23.1, 12.2] km. Because this interval includes zero, the centroid shift is not statistically significant at the 95% confidence level. This result is more conservative than the initial visual estimate of approximately 35 km and reflects the influence of the updated per-observation analysis rather than the previous storm-count approach.
Although the centroid displacement does not reach statistical significance, the Pettitt test results reported in Section 3.2.1 confirm a significant regime shift at 1987 in cyclone frequency (p = 0.011) and maximum intensity (p = 0.016). The discrepancy between the significant temporal change-point and the non-significant spatial centroid shift may be attributed to several factors: (i) the spatial shift is a second-order effect that is partially masked by the large spatial extent of the Caribbean domain; (ii) the pre-satellite undercount in the early period [22a] introduces noise that reduces the effective signal-to-noise ratio of the spatial comparison; and (iii) the actual redistribution of track density is heterogeneous across the domain, with localized significant changes that do not translate into a coherent centroid displacement. Statistically significant changes exceeding 1.5 times the mean density difference are concentrated offshore La Guajira, directly overlapping priority zones for Colombia's offshore wind development.
This spatial non-stationarity introduces a critical limitation to conventional engineering approaches based on stationary climatologies. The observed non-stationarity, combined with the significant Pettitt change-point in the temporal domain, provides a basis for adopting non-stationary design criteria within the IEC 61400-3-1 framework, particularly for ULS and FLS verification under evolving climatic conditions.
3.5. Integrated Energy-Risk Framework for Offshore Wind Assessment
Building on the identified non-stationary redistribution of cyclone activity, the preceding analyses are synthesized into an integrated energy-risk framework that translates climatological insights into actionable engineering metrics. Figure 8 consolidates spatial patterns, seasonal variability, and storm-scale dynamics into a unified structure to support site selection, turbine specification, and operational planning for offshore wind development in the Colombian Caribbean.
The 3. 3 is confirmed in Figure 8A, where SST climatology is overlaid with cyclone track density contours. Building on this spatial coherence, Figure 8B introduces the Wind Risk Index (WRI), defined as the product of cyclone transit probability and the KDE-weighted conditional expected wind speed (Eq. 9–10), which consolidates both occurrence likelihood and intensity into a single engineering-oriented metric. This formulation identifies a pronounced high-risk zone in the central-western Caribbean (13–15°N, −78° to −74°W), directly overlapping proposed offshore wind development areas in the Colombian Caribbean, and provides a quantitative basis for differentiating zones requiring IEC Class I turbine specifications from those where Class II or III designs may be sufficient.
This spatial risk structure is intrinsically modulated by the seasonal cycle shown in Figure 8C. SST exceeds the 26°C cyclone formation threshold from June through November, with cyclone frequency peaking in September–October, thereby defining a six-month window in which maximum energy production coincides with heightened structural risk. In contrast, the December–May period emerges as the optimal maintenance window. Complementing the spatial and seasonal perspectives, Figure 8D captures the temporal evolution of storm intensity through the normalized cyclone lifecycle (0–100%), revealing that mean Vmax peaks at approximately 40–60% of the lifecycle, reaching around 35 m/s with substantial variability (±1σ). When evaluated against critical engineering thresholds, this profile highlights that the variability bands frequently exceed the cut-out threshold, indicating that cyclone-induced shutdowns are likely to be a recurrent operational constraint during the hurricane season.
3.5.1. Energy versus Structural Risk Assessment
Figure 9 presents the complete Vmax probability distribution for the Colombian Caribbean domain (9°N–16°N, 82°W–68°W, 1851–2023), segmented into three engineering-critical zones. The histogram (Panel a) exhibits a marked right-skewed distribution with a primary mode near 15 m/s and a long tail extending to 82.3 m/s. The KDE overlay confirms a secondary shoulder near 35–45 m/s (Category 1–2 events), while the cumulative distribution indicates that approximately 90% of observations remain below 45 m/s.
The empirical recurrence intervals, as summarized in Table 3, confirm that Vmax > 50 m/s events recur approximately every 16.7 record intervals, consistent with the multidecadal periodicity identified in Section 3.2, while Vmax > 70 m/s events (Category 5) represent extreme stochastic shocks exceeding the 50-year design horizon typically adopted for offshore structures. Notably, the Vmax > 25 m/s exceedance is a near-annual occurrence (recurrence ~2.5 intervals), confirming that turbine shutdowns due to cyclone activity are a recurrent operational reality. The decadal evolution (Panel b) reveals non-monotonic variation in the Structural Risk Zone proportion, with notable increases during the 2000s and 2010s coinciding with the positive AMO phase and elevated SST identified in the wavelet scalograms.
The seasonal distribution (Panel c) confirms the concentration of structural risk within the September–November peak, when the proportion of Transition and Structural Risk observations increases markedly. The absence of Structural Risk Zone observations outside the June–November hurricane season validates the December–May maintenance window as a period of minimal cyclone exposure for offshore installation activities. The convergence of the WRI spatial mapping (Figure 8) with the probabilistic framework of Figure 9 indicates that proposed development zones in the central-western Caribbean (13–15°N, −78° to −74°W) face a dual challenge: (i) the near-annual recurrence of cut-out speed exceedance events, and (ii) the multidecadal threat of Category 3–5 events demanding IEC Special Class designs. The empirical exceedance estimates provide direct quantitative inputs for Design Load Case definition, while the spectral periodicities identified in Section 3.2.1, Section 3.2.2, Section 3.2.3 and Section 3.2.4 establish a coherent link between climate variability diagnostics and engineering design parameters.
4. Conclusions
This study develops an integrated spectral–spatial analytical framework to characterize the non-stationary dynamics of cyclogenesis in the Atlantic Basin and its direct implications for offshore wind development in the Colombian Caribbean. The key contributions of this work are summarized as follows:
(1) Multi-scale spectral characterization. The FFT–CWT integrated analysis revealed dominant periodicities at the annual (3.17 × 10⁻⁸ Hz) and ENSO (2–7 year) bands, with a pronounced post-1995 regime shift in spectral energy coinciding with the positive AMO phase. The Pettitt test formally confirmed a significant change point at 1987 for both cyclone frequency (p = 0.011) and maximum intensity (p = 0.016), while the Mann-Kendall test confirmed the absence of a significant monotonic linear trend, underscoring the importance of regime-shift detection over trend analysis for non-stationary climate signals.
(2) Thermodynamic energy corridors. The KDE-based spatial analysis identified a well-defined energy corridor along 12–16°N, spatially co-located with the warmest SST range (27.5–29.5°C), establishing a physically consistent linkage between ocean heat content and cyclone intensification probability.
(3) Spatio-temporal non-stationarity. The centroid of cyclone activity shifted 5.4 km southward between the early (≤1950) and recent (>1950) periods, but the bootstrap 95% confidence interval (−23.1 to 12.2 km) includes zero, indicating this spatial shift is not statistically significant at the 95% level. However, localized significant changes in track density were detected offshore La Guajira, overlapping priority offshore wind development zones.
(4) Empirical exceedance analysis. Of the 1,516 per-observation records within the Caribbean domain, 39.84% exceeded the 25 m/s turbine cut-out speed, 6.00% exceeded the IEC Class I reference wind speed (50 m/s), and 1.32% approached the 70 m/s Ultimate Limit State, with recurrence intervals of approximately 2.5, 16.7, and 75.8 record intervals, respectively.
(5) Integrated Wind Risk Index. The WRI, combining cyclone transit probability with the KDE-weighted conditional expected wind speed, identified the highest-risk zone in the central-western Caribbean (13–15°N, −78° to −74°W), directly overlapping proposed offshore wind development areas.
Several limitations should be acknowledged. The use of maximum sustained wind fields (Vmax) at a macroclimatic scale does not resolve microscale variability, including turbulence, wake interactions, or hub-height wind profiles. Return period estimates are derived from empirical frequency analysis rather than parametric extreme value distributions (e.g., GEV), which limits extrapolation beyond the observed record. The pre-satellite era undercount [22a] introduces uncertainty into the early-period comparisons. Future work should incorporate GEV fitting with non-stationary parameters, couple the diagnostics with high-resolution numerical weather prediction models (e.g., WRF), and integrate multivariate approaches including Multiple Wavelet Coherence for joint assessment of key climatic drivers. The modular architecture of the framework supports its transferability to other cyclone-prone offshore basins, including the Western Pacific and Indian Ocean, providing a scalable foundation for climate-resilient energy system design under evolving multidecadal climate variability.
Supplementary Materials
The following supporting information can be downloaded at the website of this paper posted on Preprints.org, Figure S1. Spatio-temporal dynamics for the initial stages of cyclonic development in the Greater Caribbean region. Figure S2. Spatio-temporal dynamics for hurricane categories (1–3) in the Greater Caribbean region. Figure S3. Multi-scale spectral characterization of Category 2 hurricanes impacting the Colombian Caribbean corridor (1851–2023). Figure S4. Multi-scale spectral characterization of Category 3 hurricanes impacting the Colombian Caribbean corridor (1851–2023). Figure S5. Multi-scale spectral characterization of Category 4 hurricanes impacting the Colombian Caribbean corridor (1851–2023).
Author Contributions
Conceptualization, M.E.C.R. and A.O.C.; Methodology, M.E.C.R., V.O.O. and C.R.A.; Software, M.E.C.R. and C.R.A.; Validation, M.E.C.R., A.O.C., C.R.A. and D.R.L.; Formal Analysis, M.E.C.R., C.R.A. and D.R.L.; Investigation, M.E.C.R., A.O.C., C.R.A. and D.R.L.; Resources, A.O.C. and C.R.A.; Data Curation, M.E.C.R. and V.O.O.; Writing—original draft preparation, M.E.C.R.; Writing—review and editing, M.E.C.R., A.O.C., V.O.O., C.R.A. and D.R.L.; Visualization, M.E.C.R., V.O.O. and C.R.A.; Supervision, A.O.C. and C.R.A.; Project Administration, M.E.C.R. and A.O.C.; Funding Acquisition, A.O.C. and C.R.A. All authors have read and agreed to the published version of the manuscript.
Funding
This research was funded by the Ministerio de Ciencia, Tecnología e Innovación—Fondo Francisco José de Caldas and the Agencia Nacional de Hidrocarburos (ANH), through the Contrato de Financiamiento de Recuperación Contingente No. 112721-053-2025, within the project “Herramientas tecnológicas y prototipos para caracterizar, identificar y optimizar el potencial eólico en zonas costeras de Colombia” (Project Code 111983).
Data Availability Statement
The datasets analyzed in this study are publicly available from the following sources: (1) IBTrACS Atlantic hurricane best-track data (HURDAT2): National Hurricane Center, NOAA (https://www.nhc.noaa.gov/data/#hurdat); (2) Sea Surface Temperature gridded products: NOAA Physical Sciences Laboratory (https://psl.noaa.gov/data/gridded/); (3) Filtered hurricane data for the Colombian Caribbean zone (1851–2023) are provided as supplementary material.
Acknowledgments
The authors would like to acknowledge the support provided by Universidad de la Costa, Universidad del Magdalena, and Universidad Nacional Abierta y a Distancia de Colombia in the development of this research. The authors also gratefully acknowledge the data and resources provided by the National Oceanic and Atmospheric Administration (NOAA) and the National Hurricane Center (NHC), as well as the National Centers for Environmental Information (NCEI). This work was supported by the Ministerio de Ciencia, Tecnología e Innovación (Minciencias) through Call 951.
Conflicts of Interest
The authors declare no conflict of interest.
Abbreviations
The following abbreviations are used in this manuscript:
| AMO | Atlantic Multidecadal Oscillation. |
| COI | Cone of Influence. |
| CWT | Continuous Wavelet Transform. |
| ENSO | El Niño-Southern Oscillation. |
| FFT | Fast Fourier Transform. |
| HURDAT2 | Atlantic Hurricane Database. |
| IEC | International Electrotechnical Commission. |
| KDE | kernel density estimation. |
| MDR | Main Development Region. |
| NHC | National Hurricane Center. |
| NOAA | National Oceanic and Atmospheric Administration |
| SST | Sea Surface Temperature. |
| TC | Tropical Cyclone. |
| TD | Tropical Depression. |
| TS | Tropical Storm. |
| UTC | Universal Time Coordinated. |
| ULS | Ultimate Limit States. |
| WRI | Wind Risk Index. |
References
- Shao, H.; Henriques, R.; Morais, H.; Tedeschi, E. Power quality monitoring in electric grid integrating offshore wind energy: A review. Renewable and Sustainable Energy Reviews 2024, 191. [Google Scholar] [CrossRef]
- Correa-Quintana, E.; Muñoz-Maldonado, Y.; Ospino-Castro, A. Chemical Process for the Production of Methanol with Carbon Capture (CO2) Integrating the Concept of Electrification by Heat Pump and Use of Renewable Energy. Energies (Basel) 2025, 18. [Google Scholar] [CrossRef]
- McElman, S.; Verma, A.S.; Goupee, A. Quantifying tropical-cyclone-generated waves in extreme-value-derived design for offshore wind. Wind Energy Science 2025, 10. [Google Scholar] [CrossRef]
- Göteman, M.; Panteli, M.; Rutgersson, A.; Hayez, L.; Virtanen, M.J.; Anvari, M.; et al. Resilience of offshore renewable energy systems to extreme metocean conditions: A review. Renewable and Sustainable Energy Reviews 2025, 216. [Google Scholar] [CrossRef]
- Zhao, Y.; Tao, Y.; Chen, Y.; Yan, J.; Zeng, Z. Increasing extreme winds challenge offshore wind energy resilience. Nature Communications 2025, 16. [Google Scholar] [CrossRef]
- Varlas, G.; Vervatis, V.; Spyrou, C.; Papadopoulou, E.; Papadopoulos, A.; Katsafados, P. Investigating the impact of atmosphere–wave–ocean interactions on a Mediterranean tropical-like cyclone. Ocean Model (Oxf) 2020, 153. [Google Scholar] [CrossRef]
- Avenas, A.; Mouche, A.; Knaff, J.; Carton, X.; Chapron, B. On the Tropical Cyclone Integrated Kinetic Energy Balance. Geophys Res Lett 2024, 51. [Google Scholar] [CrossRef]
- Fu, Z.H.; Xi, D.; Xie, S.P.; Zhou, W.; Lin, N.; Zhao, J.; et al. Shifting hotspot of tropical cyclone clusters in a warming climate. Nat Clim Chang 2025, 15. [Google Scholar] [CrossRef]
- Li, S.; Xiao, Z.; Zhao, Y. Combined Effect of the PDO and ENSO on the Date of the First Tropical Cyclone Landfall in Continental East Asia. Journal of Geophysical Research: Atmospheres 2021, 126. [Google Scholar] [CrossRef]
- Chen, Y.; Zhao, C.; Zhi, H. Analysis of ENSO Event Intensity Changes and Time–Frequency Characteristic Since 1875. Atmosphere (Basel) 2024, 15. [Google Scholar] [CrossRef]
- Hou, H.; Zhang, L.; Cai, W.; Ren, X.; Wang, J.; Wu, L. South American fire activity in spring is linked to Antarctic sea ice variability. Commun Earth Environ 2026. [Google Scholar] [CrossRef]
- Jackson, L.C.; Biastoch, A.; Buckley, M.W.; Desbruyères, D.G.; Frajka-Williams, E.; Moat, B.; et al. The evolution of the North Atlantic Meridional Overturning Circulation since 1980. Nat Rev Earth Environ 2022, 3. [Google Scholar] [CrossRef]
- Ogata, T. Seasonality of Relationship between Tropical Cyclone Frequency over the Southern Hemisphere and Tropical Climate Modes. Atmosphere (Basel) 2023, 14. [Google Scholar] [CrossRef]
- Rhif, M.; Ben, Abbes A; Farah, I.R.; Martínez, B.; Sang, Y. Wavelet transform application for/in non-stationary time-series analysis: A review. Applied Sciences (Switzerland) 2019, 9. [Google Scholar] [CrossRef]
- Li, S.; Li, H.; Li, X.; Xu, Y.; Lin, Z.; Jiang, H. Causal Intervention Is What Large Language Models Need for Spatio-Temporal Forecasting. IEEE Trans Cybern 2025, 55. [Google Scholar] [CrossRef] [PubMed]
- Dong, H.; Huang, S.; Wang, H.; Shi, H.; Singh, V.P.; She, D.; et al. Effects of interaction of multiple large-scale atmospheric circulations on precipitation dynamics in China. Science of the Total Environment 2024, 923. [Google Scholar] [CrossRef]
- Carbonó dela Rosa, M.E.; Velasco Herrera, G.; Nava, R.; Quiroga González, E.; Sosa Echeverría, R.; Sánchez Álvarez, P.; et al. A New Methodology for Early Detection of Failures in Lithium-Ion Batteries. Energies (Basel) 2023, 16, 1073. [Google Scholar] [CrossRef]
- Dewitte, B.; Takahashi, K. Diversity of moderate El Niño events evolution: role of air–sea interactions in the eastern tropical Pacific. Clim Dyn 2019, 52. [Google Scholar] [CrossRef]
- Wojahn, T.; Xydis, G. Extreme wind design standards and tropical cyclone–resilient wind turbines: a review. Proceedings of the Institution of Civil Engineers - Energy 2025, 178. [Google Scholar] [CrossRef]
- Vega-Zuñiga, S.; Rueda-Bayona, J.G.; Ospino-Castro, A. DOE-ANOVA Analysis to Estimate the Effect of Ambient Temperature, Pressure and Humidity on Surface Wind Speed. Mathematical Modelling of Engineering Problems 2024, 11. [Google Scholar] [CrossRef]
- Farhana, A. Resilience of Power Systems under Extreme Weather Events with Renewable Energy. International Journal of Emerging Trends in Computer Science and Information Technology 2025. [Google Scholar]
- Landsea, C.W.; Franklin, J.L. Atlantic hurricane database uncertainty and presentation of a new database format. Mon Weather Rev 2013, 141. [Google Scholar] [CrossRef]
- Huang, B.; Liu, C.; Banzon, V.; Freeman, E.; Graham, G.; Hankins, B.; et al. Improvements of the Daily Optimum Interpolation Sea Surface Temperature (DOISST) Version 2.1. J Clim 2021, 34. [Google Scholar] [CrossRef]
- Cooley, J.W.; Lewis, P.A.W.; Welch, P.D. The Fast Fourier Transform and its Applications. IEEE Transactions on Education 1969, 12. [Google Scholar] [CrossRef]
- Bracewell, R.; Kahn, P.B. The Fourier Transform and Its Applications. Am J Phys 1966, 34. [Google Scholar] [CrossRef]
- RADER, C.M.; MALING, G.C. What Is the Fast Fourier Transform? Proceedings of the IEEE 1967, 55. [Google Scholar] [CrossRef]
- dela Rosa, M.E.C.; Mateo-Romero, H.F.; Alonso-Gómez, V.; Ngungu, V.N.; Nava, R.; Aragonés, J.I.M.; et al. Detection of failures in electrode-photovoltaic cell junctions through two-dimensional wavelet analysis of electroluminescence images. Renewable Energies 2024, 2, 27533735241304090. [Google Scholar] [CrossRef]
- Torrence, C.; Compo, G.P. A Practical Guide to Wavelet Analysis. Bull Am Meteorol Soc 1998, 79, 61–78. [Google Scholar] [CrossRef]
- Hudgins, L.; Friehe, C.A.; Mayer, M.E. Wavelet transforms and atmopsheric turbulence. Phys Rev Lett 1993, 71. [Google Scholar] [CrossRef]
- Wu, P.H.; Lin, C.H.; Chen, H.; Wang, L.; Ho, C.R. Spatiotemporal Variations and Characteristics of the El Niño–Southern Oscillation (ENSO) Phenomenon from 1950 to 2023. Atmosphere (Basel) 2025, 16. [Google Scholar] [CrossRef]
- Silverman, B.W. Density estimation: For statistics and data analysis; 2018. [Google Scholar] [CrossRef]
- Hall, T.; Hereid, K. The frequency and duration of U.S. hurricane droughts. Geophys Res Lett 2015, 42. [Google Scholar] [CrossRef]
- Kossin, J.P.; Emanuel, K.A.; Vecchi, G.A. The poleward migration of the location of tropical cyclone maximum intensity. Nature 2014, 509. [Google Scholar] [CrossRef] [PubMed]
- Hannesdóttir, Á; Kelly, M.; Dimitrov, N. Extreme wind fluctuations: Joint statistics, extreme turbulence, and impact on wind turbine loads. Wind Energy Science 2019, 4. [Google Scholar] [CrossRef]
- Reiss, R.D.; Thomas, M. Statistical analysis of extreme values: With applications to insurance, finance, hydrology and other fields: Third edition; 2007. [Google Scholar] [CrossRef]
- The British Standards Institution. EN IEC 61400-3-1:2019; Wind energy generation systems. Design requirements for fixed offshore wind turbines. 2019.
- Ju, S.H.; Hsieh, C.H. Optimal wind turbine jacket structural design under ultimate loads using Powell’s method. Ocean Engineering 2022, 262. [Google Scholar] [CrossRef]
- Emanuel, K.; Ravela, S.; Vivant, E.; Risi, C. A statistical deterministic approach to hurricane risk assessment. Bull Am Meteorol Soc 2006, 87. [Google Scholar] [CrossRef]
- Baghel, T.; Babel, M.S.; Shrestha, S.; Salin, K.R.; Virdis, S.G.P.; Shinde, V.R. A generalized methodology for ranking climate models based on climate indices for sector-specific studies: An application to the Mekong sub-basin. Science of the Total Environment 2022, 829. [Google Scholar] [CrossRef]
- Brown, J.R.; Lengaigne, M.; Lintner, B.R.; Widlansky, M.J.; van der Wiel, K.; Dutheil, C.; et al. South Pacific Convergence Zone dynamics, variability and impacts in a changing climate. Nat Rev Earth Environ 2020, 1. [Google Scholar] [CrossRef]
- Shen, B.W.; Nelson, B.; Cheung, S.; Tao, W.K. Improving NASA’s multiscale modeling framework for tropical cyclone climate study. Comput Sci Eng 2013, 15. [Google Scholar] [CrossRef]
- Ospino-Castro, A.; Navas, S.R.; Robles-Algarín, C. Methodology for Generating a Reference Wind Year for Offshore Wind Energy: A Case Study in La Guajira, Colombia. International Journal of Energy Economics and Policy 2024, 14. [Google Scholar] [CrossRef]
- Forster, P.M.; Smith, C.; Walsh, T.; Lamb, W.F.; Lamboll, R.; Cassou, C.; et al. Indicators of Global Climate Change 2024: annual update of key indicators of the state of the climate system and human influence. Earth Syst Sci Data 2025, 17. [Google Scholar] [CrossRef]
- Carbono dela Rosa, M.E.; Gómez, J.; Ospino, A.; Sánchez-De-La-Hoz, J.M.; Robles, C. Enhanced Spectral Analysis Approaches for Predicting Critical Failures in Lithium-Ion Batteries: A Wavelet-Based Framework. Journal of Sustainable Development of Energy, Water and Environment Systems 2025, 13, 1–16. [Google Scholar] [CrossRef]
- Zhou, W.; Wang, X. Wavelet Multiview-Based Hybrid Deep Learning Model for Forecasting El Niño-Southern Oscillation Cycles. Atmospheric and Climate Sciences 2024, 14. [Google Scholar] [CrossRef]
Figure 1.
Methodological framework for Atlantic-Caribbean offshore wind resilience assessment (1851–2023). Four interconnected modules: (1) acquisition of NOAA ERSST v5 and NHC HURDAT2 datasets; (2) spatiotemporal harmonization and regional filtering (9°N–16°N, 82°W–68°W); (3) multi-scale spectral diagnostics (wavelet decomposition, CWT, 2D KDE); and (4) probabilistic risk assessment and engineering design classification (IEC 61400-3-1 thresholds, empirical exceedance frequencies, Wind Risk Index).

Figure 2.
Spatio-temporal mapping and regional downscaling of tropical cyclone activity (1851-2023). (A) Total event density and genesis zones across the North Atlantic Basin. (B) Regional filtering and track concentration in the Caribbean Basin (9°N-16°N). (C) High-intensity spatial clustering (Categories 4 and 5) and its proximity to the Colombian offshore development zones.

Figure 3.
Multi-scale spectral analysis of cyclonic activity in the Atlantic Basin (1851–2023). (A) Time series of annual event frequency (n = 1,973) exhibiting non-stationary trends. (B) Global Wavelet Spectrum highlights significant peaks (>95% confidence level vs. red noise). (C) CWT scalogram of time-frequency spectral power density; the solid black curve denotes the Cone of Influence (COI). (D) FFT power spectrum (Hz) isolating the dominant seasonal and macroclimatic modulations.

Figure 4.
Spectral characterization of Category 1 hurricanes in the Atlantic Basin and their influence on wind regime. (A) Time series contrasting basin-wide cyclogenesis with the Colombian Caribbean impact fraction. (B) Global Wavelet Spectrum. (C) CWT scalogram evidencing pulsating power density and post-1990 spectral broadening. (D) FFT power spectrum (Hz).

Figure 5.
Multi-scale spectral characterization of Category 5 hurricanes in the Atlantic (1851–2023). (A) Time series of extreme cyclogenesis (n = 40). (B) Global Wavelet Spectrum highlighting broad power density shift toward macroclimatic periods (>10–20 years). (C) CWT scalogram detailing highly discrete energetic pulses. (D) FFT power spectrum (Hz).

Figure 6.
Cyclone Energy Corridor: coupling between SST climatology (RdYlBu_r color scale), normalized track density (filled contours), and SST gradient vectors (arrows). The red dashed contour marks the 75th percentile track density. Percentile contours at P25/P50/P75 indicated.
Figure 6.
Cyclone Energy Corridor: coupling between SST climatology (RdYlBu_r color scale), normalized track density (filled contours), and SST gradient vectors (arrows). The red dashed contour marks the 75th percentile track density. Percentile contours at P25/P50/P75 indicated.

Figure 7.
Spatio-temporal non-stationarity of regional cyclone activity. Density difference map (Recent 1951–2023 minus Early 1851–1950) showing redistribution of cyclone track density. Positive anomalies (red) indicate increased recent activity; negative anomalies (blue) indicate decreased activity. Centroids are marked for each period.

Figure 8.
Integrated Energy-Risk Framework for offshore wind assessment. (A) SST Climatology and Cyclone Track Density overlay confirming the thermodynamic energy corridor. (B) Wind Risk Index (WRI = P(track) × E[Vmax | x,y]) identifying highest-risk zones. (C) Seasonal cycle of SST and cyclone frequency, defining operational windows. (D) Intensification profile across normalized storm lifecycle with engineering thresholds at 25 m/s (cut-out), 50 m/s (IEC Class I), and 70 m/s (ULS).

Figure 9.
Energy versus Structural Risk Diagram for the Colombian Caribbean (1851–2023). (a) Probability density histogram of Vmax with KDE overlay and cumulative distribution, segmented into three zones: Energy Potential (<25 m/s, green), Transition (25–50 m/s, orange), and Structural Risk (>50 m/s, red). IEC thresholds at 25, 50, and 70 m/s indicated. (b) Decadal evolution of zone proportions. (c) Seasonal distribution by zone.


Table 1.
Cyclone best-track data provided by the National Hurricane Center.
| Field | Description | Temporal Resolution | Engineering Relevance |
|---|---|---|---|
| Storm ID | Basin + Year Identifier | Per storm | Event tracking |
| Date | YYYYMMDD | 6-hourly | Temporal indexing |
| Time | HHMM | 6-hourly | Sub-daily resolution |
| Status | TD, TS, HU, etc. | 6-hourly | System classification |
| Latitude | Position | 6-hourly | Regional filtering |
| Longitude | Position | 6-hourly | Regional filtering |
| Vmax | Maximum sustained wind (knots) | 6-hourly | Load estimation |
| Min Pressure | Minimum central pressure (hPa) | 6-hourly | Intensity proxy |
Table 2.
Sea surface temperature (SST) dataset variables.
| Variable | Description | Units | Resolution | Role in Analysis |
|---|---|---|---|---|
| lat | Latitude grid | degrees North | ~2° | Spatial indexing |
| lon | Longitude grid | degrees East (0–360) | ~2° | Spatial indexing |
| time | Days since reference epoch | days | Monthly | Temporal indexing |
| sst | Sea Surface Temperature | °C | Monthly | Thermodynamic forcing |
Table 3.
Empirical exceedance frequencies for IEC 61400-3-1 design thresholds (Caribbean domain 9°N–16°N, 82°W–68°W, 1851–2023, 1,516 observations from 226 unique storms, 173-year record).
Table 3.
Empirical exceedance frequencies for IEC 61400-3-1 design thresholds (Caribbean domain 9°N–16°N, 82°W–68°W, 1851–2023, 1,516 observations from 226 unique storms, 173-year record).
| IEC Threshold | N events (Vmax > z) |
P(exceedance) | Empirical recurrence interval |
|---|---|---|---|
| 25 m/s — Turbine cut-out | 604 | 39.84% | ~2.5 record intervals |
| 50 m/s — IEC Class I (Vref) | 91 | 6.00% | ~16.7 record intervals |
| 70 m/s — Ultimate Limit State | 20 | 1.32% | ~75.8 record intervals |
Disclaimer/Publisher’s Note: The statements, opinions and data contained in all publications are solely those of the individual author(s) and contributor(s) and not of MDPI and/or the editor(s). MDPI and/or the editor(s) disclaim responsibility for any injury to people or property resulting from any ideas, methods, instructions or products referred to in the content. |
© 2026 by the authors. Licensee MDPI, Basel, Switzerland. This article is an open access article distributed under the terms and conditions of the Creative Commons Attribution (CC BY) license (http://creativecommons.org/licenses/by/4.0/).
Copyright: This open access article is published under a Creative Commons CC BY 4.0 license, which permit the free download, distribution, and reuse, provided that the author and preprint are cited in any reuse.


