Submitted:
09 April 2026
Posted:
13 April 2026
You are already at the latest version
Abstract
To investigate the effects of graphene soil conditioner on nitrogen forms, nitrogen cycling enzyme activities of rhizosphere soil, and maize (Zea mays L.) yield and quality, a pot experiment with five treatments was conducted. Soil samples were collected at the jointing (V6), tasseling (VT), milking (R3), and maturing (R6) stages to determine soil physical properties, nitrogen forms, and nitrogen cycling enzyme activities, while maize yield and kernel protein components were also measured. The results showed that graphene application significantly reduced soil bulk density and increased the content of soil aggregates >0.25 mm. Medium-rate treatments (G2, G3) notably improved the geometric mean diameter (GMD), mean weight diameter (MWD), and water-stable aggregate (WSA) content, while decreasing the unstable aggregate index (ELT) and fractal dimension (D), confirming improved soil structure. Graphene regulated soil nitrogen pools (total N, alkaline-hydrolyzable N, ammonium N, and nitrate N) in a dose-dependent and stage-specific manner through adsorption, slow release, and catalytic mechanisms. Low-to-moderate concentrations consistently enhanced nitrogen availability during most growth stages, whereas excessive application showed diminished or inhibitory effects at later stages. Moderate graphene application (G2, G3) also effectively enhanced the activities of key nitrogen-metabolizing enzymes—including nitrate reductase (NR), nitrite reductase (NiR), protease, urease, and hydroxylamine reductase (HAR)—during critical growth periods, thereby promoting soil nitrogen transformation and maize nitrogen utilization. The G3 treatment achieved the highest yield, increasing by 10.81% compared with the CF treatment. Kernel protein components (albumin, glutelin, and prolamin) exhibited an initial increase followed by a decrease with rising graphene rates, indicating an optimal response at moderate application levels. Considering the comprehensive improvements in soil structure, nitrogen regulation, enzyme activities, and crop performance, a graphene application rate of 2 g·kg⁻¹ is recommended as the most effective for achieving sustainable soil quality improvement and high maize productivity.
Keywords:
graphene
; nitrogen form
; enzyme activities
; soil conditioner
; maize
1. Introduction
Black soil (Mollisol) is a valuable and non-renewable natural resource distinguished by high organic matter content, strong inherent fertility, and well-developed granular structure, providing an optimal environment for crop production. The Northeast Plain of China, one of the world’s three major contiguous black soil regions, is a critical maize (Zea mays L.) production area that contributes approximately 30% of China’s total maize output and is widely recognized as the “Golden Maize Belt” [1,2]. However, decades of intensive cultivation, continuous monoculture, and excessive application of synthetic fertilizers have severely degraded the ecological quality of this black soil. Degradation is manifested as progressive topsoil thinning, deterioration of aggregate stability, nutrient imbalances, and soil acidification, collectively threatening crop productivity and long-term agricultural sustainability [3,4]. Given the inherent limitations of conventional agrochemical approaches, the integration of advanced functional nanomaterials into agricultural systems has emerged as a promising strategy for sustainable soil management and ecological restoration [5].
Graphene-based nanomaterials (GBNs) have demonstrated considerable potential in agriculture, including promoting plant growth, enhancing nutrient uptake, and improving stress tolerance at appropriate concentrations. GBNs have been shown to stimulate seed germination, root development, and biomass accumulation in crops such as maize, wheat, coriander, and watermelon by improving soil structure and nutrient availability [6]. The large specific surface area and chemical stability of graphene render it an effective nano-delivery platform for agrochemicals, enabling controlled release and reducing environmental pollution [7]. Additionally, graphene derivatives produced from agricultural waste can support circular agriculture by converting biomass into functional carbon materials [8]. However, GBNs exhibit biphasic dose–response effects: optimal concentrations promote growth and physiological functions such as photosynthesis and nitrogen metabolism, whereas excessive concentrations may induce phytotoxicity through oxidative stress and cellular damage [9]. Challenges persist in defining safe concentration thresholds across crop species and in developing cost-effective, scalable production methods for agricultural deployment.
Nitrogen (N) is an essential macronutrient that governs photosynthetic capacity, dry matter accumulation, and ultimately determines crop yield and kernel nutritional quality, particularly protein composition [10]. In the soil, nitrogen cycles dynamically among organic complexes, plant-available inorganic forms (ammonium, NH4+; nitrate, NO3−), and gaseous species. Global nitrogen use efficiency (NUE) in agriculture remains critically low, with crops assimilating only 30–40% of applied nitrogen. The unabsorbed surplus is lost through nitrate leaching into groundwater, ammonia volatilization, and denitrification-driven nitrous oxide emissions, causing both environmental pollution and greenhouse gas accumulation [11,12].
To address these inefficiencies, nanotechnology has introduced new possibilities for fertilizer formulation. Graphene, a two-dimensional carbon allotrope consisting of a single atomic layer of sp2-hybridized carbon atoms arranged in a hexagonal lattice, has attracted extensive research attention [13]. Its exceptional physicochemical properties—including high electrical and thermal conductivity, large theoretical specific surface area (~2630 m2·g−1), superior mechanical strength, abundant nanoporosity, and tunable surface chemistry—make it a versatile functional material [14,15]. In agricultural contexts, low concentrations of graphene derivatives have been reported to act as biostimulants. For instance, hydrated graphene ribbons at 200 mg·L−1 promoted seed germination and root development in aged wheat seeds [16], while graphene quantum dots accelerated vegetative growth in coriander and garlic, and sulfonated graphene mitigated oxidative stress in maize by enhancing reactive oxygen species (ROS) scavenging [17].
Importantly, incorporating graphene as soil conditioner into conventional fertilizer matrices offers significant potential for improving soil nitrogen management. Graphene’s extensive surface area and electron-rich structure can modify soil colloidal interactions, enhance clay particle adhesion, and improve aggregate structure. It also serves as a nutrient reservoir, adsorbing transient nutrient ions via electrostatic interactions and buffering them against leaching and runoff [18]. The coupling of graphene with conventional fertilizers can impart slow-release characteristics that synchronize nitrogen availability with crop phenological demand, thereby reducing nutrient losses and supporting sustainable agricultural production [19].
The effects of graphene soil conditioner on soil nitrogen cycling and enzymatic processes are complex and multifaceted. Structurally, graphene’s functional groups can form stable complexes with soil NH4+-N, reducing ammonia volatilization and stabilizing the total nitrogen pool [20]. Biologically, graphene modulates extracellular enzyme activities in a dose-dependent manner. Certain concentrations can inhibit excessive nitrate reductase and urease activities, thereby slowing urea hydrolysis and nitrification to prevent NO3− accumulation and leaching [20,21]. Conversely, low-dose graphene has been shown to stimulate soil protease activity, facilitating steady mineralization of organic nitrogen into plant-available forms. These dual effects highlight a critical dose-dependent threshold: moderate applications tend to optimize soil microecology and nutrient retention, whereas excessive concentrations may induce microbial toxicity and disrupt nitrogen-cycling processes [22].
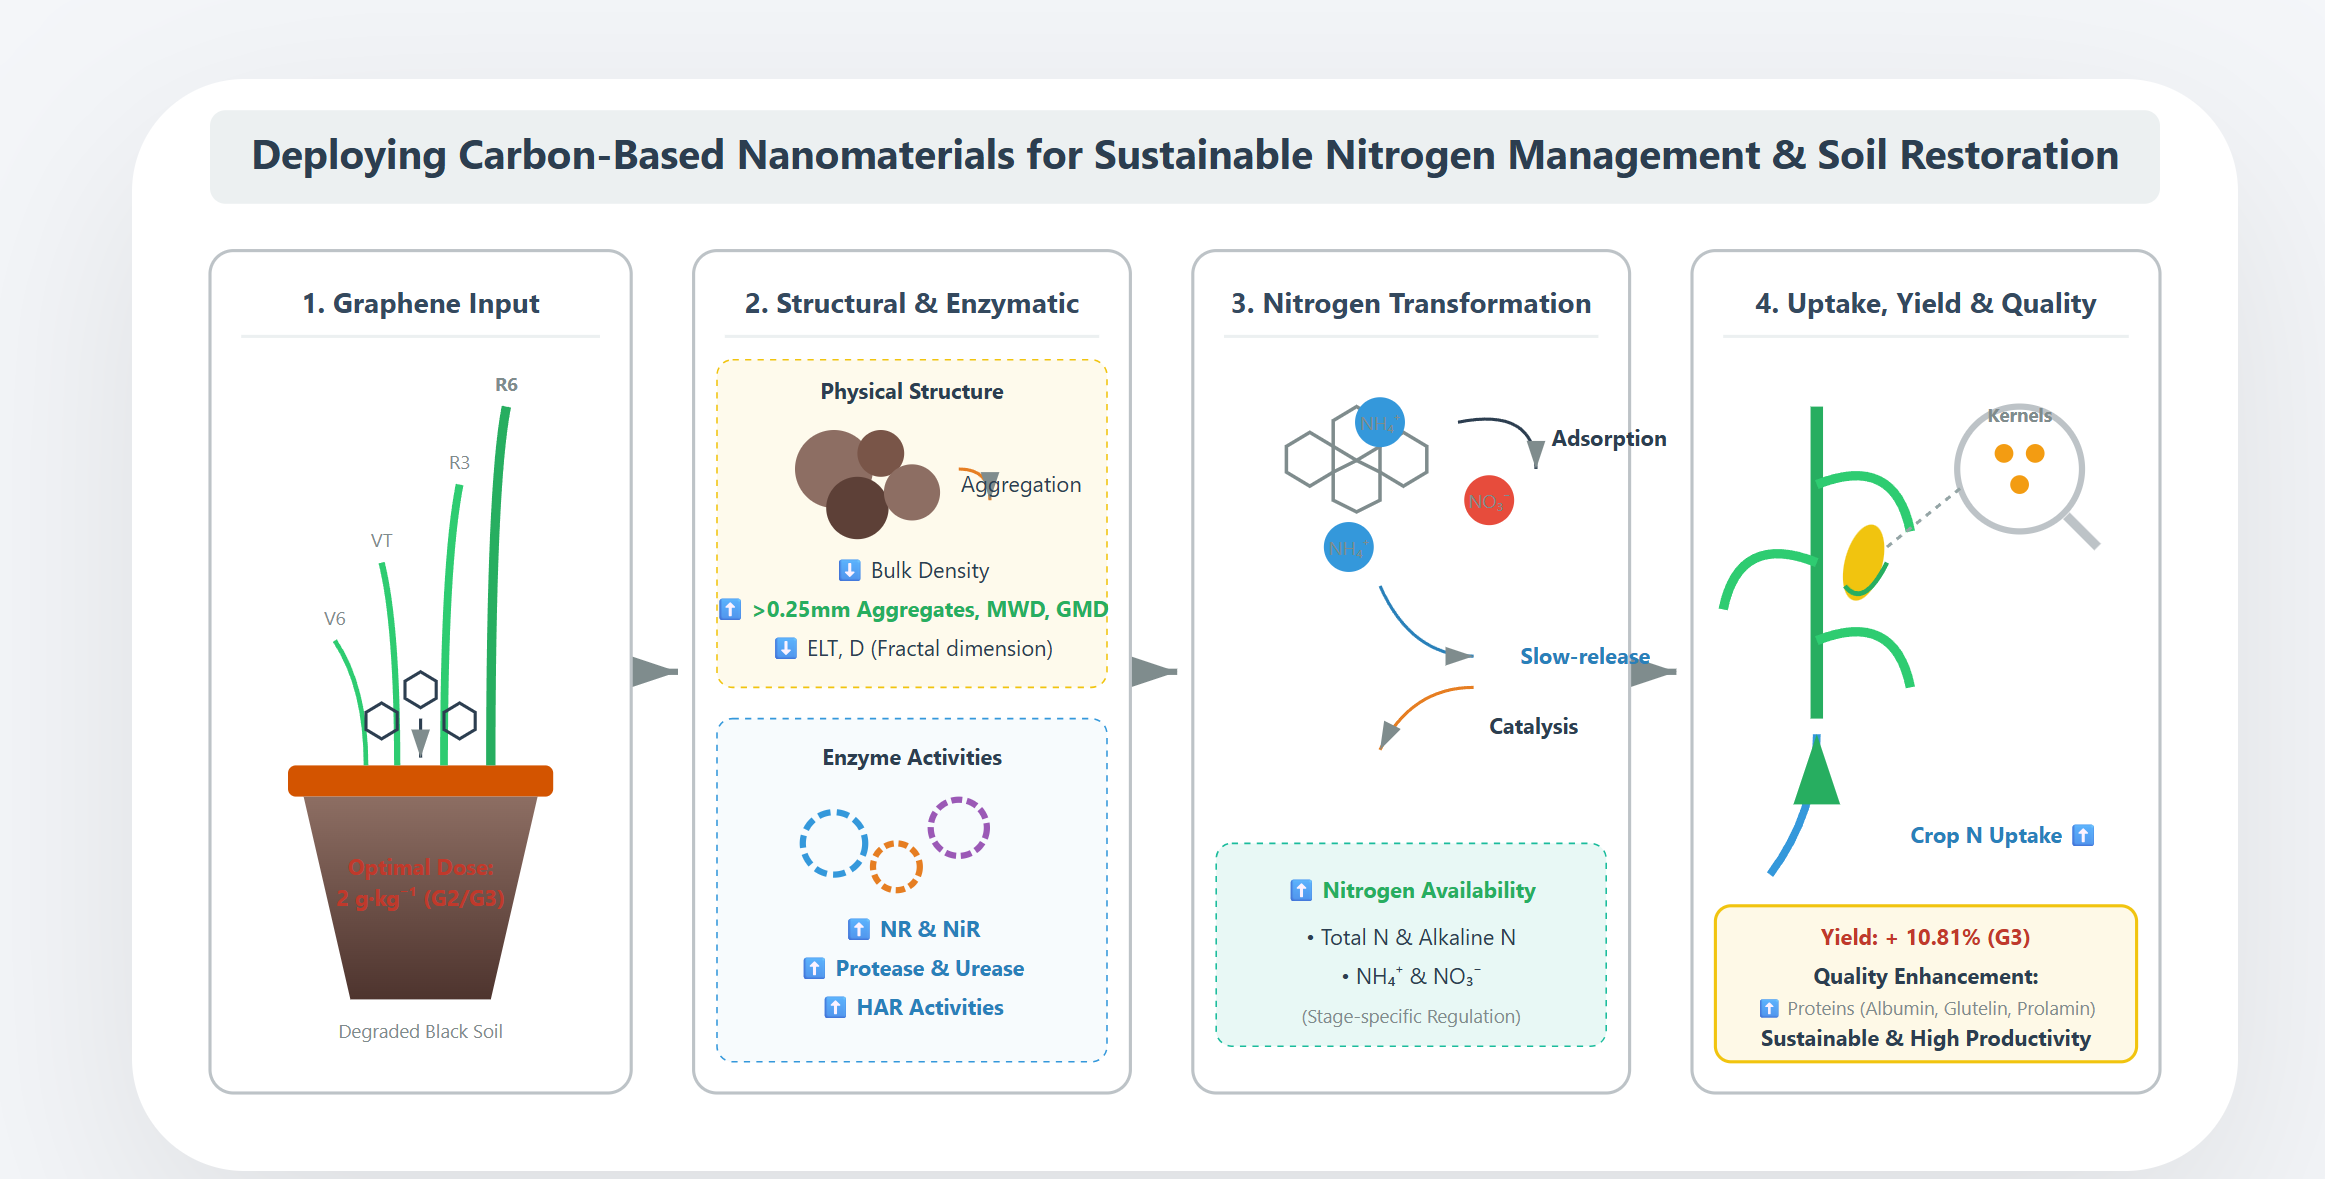
Despite accumulating evidence of graphene’s agricultural potential, significant knowledge gaps remain. Specifically, systematic investigations tracking how graphene influence the temporal dynamics of distinct nitrogen forms and nitrogen-cycling enzymes across the complete phenological lifecycle of a major crop are lacking. Moreover, research linking these microscopic soil-level changes to macroscopic outcomes—including maize yield components and grain nutritional quality in degraded black soils—remains scarce. Therefore, this study was designed to systematically evaluate the effects of varying graphene application rate on soil physical properties, nitrogen form transformations, nitrogen-cycling enzyme activities, and maize productivity and kernel quality. By establishing a coherent research framework—”graphene input → soil structural and enzymatic modulation → nitrogen transformation → crop nitrogen uptake → yield and quality improvement”—this work aims to elucidate the underlying agronomic mechanisms and provide a theoretical basis and practical guidance for deploying carbon-based nanomaterials in sustainable nitrogen management and soil restoration.
2. Materials and Methods
2.1. Experimental Condition and Material
Pot experiments were conducted in a controlled greenhouse at Heilongjiang Bayi Agricultural University during the 2023 and 2024 growing seasons. The maize (Zea mays L.) cultivar ‘Zhenjin 8’ was used as the experimental crop. The test soil was a typical chernozem (Mollisol) collected from the 0–20 cm topsoil layer in Suihua, Heilongjiang Province, China (126.98° E, 46.63° N). The baseline physicochemical properties of the air-dried soil were: available nitrogen (AN) 229.0 mg·kg−1, available phosphorus (AP) 33.3 mg·kg−1, available potassium (AK) 179.2 mg·kg−1, soil organic matter (SOM) 17.1 g·kg−1, and pH 7.5.
Graphene was purchased from Shuncheng Chemical Products Co., Ltd. (Zhengzhou, China). The graphene flakes had diameters of 10–20 μm and an average thickness of 1–3 nm. Morphological characterization was performed using a Field Emission Scanning Electron Microscope (FE-SEM, Model SU8010), and structural integrity was verified using a Renishaw inVia Reflex micro-Raman spectrometer. The characterization results are presented in Figure 1. Conventional basal fertilizers included urea (46% N), diammonium phosphate (18% N, 46% P2O5), and potassium sulfate (50% K2O), procured from the Yuntianhua Group (Heilongjiang, China).
2.2. Experimental Design
Prior to sowing, maize seeds were surface-sterilized with 5% hydrogen peroxide (H2O2) for 5 minutes, rinsed three times with sterile distilled water, and soaked in distilled water for 10 hours to ensure uniform imbibition and synchronize germination.
For soil substrate preparation, designated quantities of graphene were thoroughly homogenized with a basal fertilizer mixture formulated to supply 220 kg·hm−2 of N, 150 kg·hm−2 of P2O5, and 90 kg·hm−2 of K2O. The graphene–fertilizer blend was then mixed with 1.0 kg of air-dried soil. Plastic pots (28 cm diameter × 30 cm height) were pre-filled with approximately 9.0 kg of air-dried soil, and the prepared graphene–soil mixture was uniformly layered on top. An additional 4.0 kg of air-dried soil was added to cover the mixture, and the surface was leveled.
Five uniformly sized seeds were sown per pot and covered with 1.0 kg of topsoil. Throughout the experiment, soil moisture was maintained at an optimal level using a daily weighing method, avoiding both water stress and waterlogging. After germination, seedlings were thinned to retain one healthy, uniformly growing plant per pot.
The experiment was arranged in a randomized block design. with five treatments: 0 g·kg−1 (CF, control), 1 g·kg−1 (G1), 2 g·kg−1 (G2), 5 g·kg−1 (G3), and 10 g·kg−1 (G4). Each treatment consisted of three biological replicates, with five pots per replicate. The experimental design is summarized in Table 1.
2.3. Sample Collection and Processing
Rhizosphere soil samples were collected at four key phenological stages: jointing (V6), tasseling (VT), milking (R3), and physiological maturity (R6). At each sampling event, soils from the 0–10 cm layer were collected using a three-point random sampling method. Subsamples were homogenized, cleared of visible root debris, and air-dried at room temperature for subsequent analysis of soil chemical properties and enzymatic activities.
Maize plants were harvested at the R6 stage. Six representative ears per treatment were randomly selected for agronomic evaluation. A 200 g subsample of fresh kernels was oven-dried at 85 °C to constant weight for moisture determination. Final grain yield was calculated and adjusted to 14% standard moisture content.
2.4. Measurements and Analytical Methods
2.4.1. Soil Bulk Weight
At the maturity stage, undisturbed soil cores from the 0–10 cm topsoil layer were extracted using standard stainless-steel ring samplers (volume known). The cores were immediately sealed and transported to the laboratory to record their fresh weight. Subsequently, they were oven-dried at 105 ℃ to a constant weight. Soil bulk density (BD, g·cm−3) was calculated using equation (1):
where Ws represents the absolute dry weight of the soil (g), and V is the internal volume of the ring sampler (cm3).
2.4.2. Soil Aggregate Analysis
Following the identical sampling protocol used for bulk density, undisturbed soil cores were collected, carefully extruded, and air-dried to an optimal workable moisture content. A 150 g homogenized aggregate subsample was then subjected to wet-sieving using a DM200-II aggregate analyzer (Shanghai, China). The subsample was passed through a descending series of sieves (5.00, 2.00, 1.00, 0.50, and 0.25 mm). The sieve stack was vertically agitated in distilled water at a constant frequency of 30 strokes per minute for 30 minutes. Water-stable aggregates retained on each respective sieve were carefully washed into aluminum weigh boxes, allowed to precipitate, oven-dried, and weighed. The structural stability indices of the aggregates—including mean weight diameter (MWD), geometric mean diameter (GMD), water-stable aggregate (WSA) proportion, unstable aggregate index (ELT), and fractal dimension (D)—were calculated utilizing standard pedological equations (2) through (6) [23].
(Note: Equations 2-6 remain structurally as represented in your original manuscript, with variables defined as: mi is the mass of aggregate fraction i (g), di is the mean diameter of aggregate fraction i (mm), n denotes the number of aggregate size fractions, M (r≤mi ) is the cumulative mass of aggregates with diameters less than or equal to mi, MT is total weight of aggregates, and R0.25 is macroaggregates with diameters greater than>0.25 mm.)
2.4.3. Determination of Different Forms Nitrogen Content in Soil
Total nitrogen (TN) in the soil was quantified using the classic micro-Kjeldahl digestion and distillation method [24]. Alkaline-hydrolyzable nitrogen (AN), representing the readily plant-available N pool, was assessed via the alkaline diffusion method [25]. To determine inorganic nitrogen forms, soil samples were extracted using a 2 M potassium chloride (KCl) solution; the extract was then analyzed for ammonium nitrogen (NH4+-N) via indophenol blue colorimetry. Nitrate nitrogen (NO3−-N) content was determined using the phenol disulfonic acid colorimetric assay [26].
2.4.4. Determination of Enzyme Activities in Soil
Soil enzymatic activities were measured using standard colorimetric techniques. Urease and protease activities were determined via indophenol blue colorimetry and ninhydrin colorimetry, respectively [27]. Nitrate reductase (NR) activity was quantified using phenol disulfonic acid colorimetry [28], while nitrite reductase (NiR) activity was evaluated using visible spectrophotometry at specific absorbance wavelengths [29]. Hydroxylamine reductase (HAR) activity was analyzed employing the ammonium ferric sulfate-phenanthroline reduction method [30].
2.4.5. Determination of Maize Kernel Quality Indicators
Kernel sucrose content was analyzed according to the extraction and colorimetric protocol described by Nayyar et al. [31]. Soluble sugar and total starch contents were quantified utilizing the anthrone-sulfuric acid colorimetric method, with absorbance read at 620 nm . Crude fat content was extracted and measured using standard Soxhlet extraction [9]. Total kernel protein and its specific storage components (albumin, globulin, prolamin, and glutelin) were systematically fractionated and quantified utilizing the Kjeldahl nitrogen method and the Coomassie brilliant blue G-250 dye-binding assay, respectively [32].
2.5. Data Analysis
All data were compiled and pre-processed using Microsoft Excel 2013. Statistical analyses were performed using SPSS version 25.0 (IBM Corp., Armonk, NY, USA). One-way analysis of variance (ANOVA) was used to evaluate treatment effects. When significant differences were detected, means were compared using Duncan’s Multiple Range Test at p < 0.05. Data were graphically presented to illustrate treatment differences and dynamic trends.
3. Results
3.1. Characterization of Graphene
To The microstructural and chemical properties of the graphene used in this study were confirmed through high-resolution morphological and spectroscopic analyses. Field Emission Scanning Electron Microscopy (FE-SEM) (Figure 1A) revealed that the graphene samples exhibited a uniform, ultra-thin, two-dimensional sheet-like morphology. Overlapping and slightly folded sheet margins characteristic of high-quality graphene were clearly observed, indicating a large specific surface area favorable for soil nutrient adsorption and microbial interaction. Micro-Raman spectroscopy (Figure 1B) displayed two characteristic bands of carbonaceous nanomaterials: the D band at approximately 1343 cm−1 and the G band at approximately 1580 cm−1. The G band corresponds to the in-plane vibrational modes of sp2-hybridized carbon atoms, reflecting graphitic structural integrity, whereas the D band indicates structural defects, edge effects, and lattice vacancies. The co-existence of both bands confirmed that the material retains a well-ordered graphitic framework while possessing sufficient edge defects and active sites for functional interactions within the soil–rhizosphere environment.
3.2. Effects of Graphene on Bulk Density and Aggregate Size Distribution of Soil
The incorporation of graphene induced significant alterations in the physical properties of rhizosphere soil at the maturity stage. As shown in Figure 2A, graphene application consistently reduced soil compaction. Compared with the chemical fertilizer (CF) control, soil bulk density was significantly lowered across all graphene treatments, with reductions of 12.80%, 8.43%, 10.89%, and 7.18% for G1, G2, G3, and G4, respectively. Differences among the moderate-to-high application rates (G2, G3, and G4) were statistically non-significant, suggesting that a saturation point for physical loosening is reached at medium dosages.
Graphene also substantially remodeled soil aggregate size distribution (Figure 2B). Macroaggregates (>0.25 mm), which are a primary indicator of soil structural health and erosion resistance, were significantly enriched by all graphene treatments (G1–G4) relative to the CF control. Specifically, the G1, G2, and G3 treatments increased the 0.25-0.5 mm fraction by 14.45%, 28.28%, and 28.36%, respectively. For the 0.5-1 mm category, the G1 and G4 treatments showed significant increases of 14.76% and 15.95%. The most pronounced improvements were observed in the 1-2 mm macroaggregate class, with sequential increases of 24.39%, 28.13%, 41.75%, and 53.22% for G1 through G4, displaying a clear dose-dependent trend. For larger aggregates (2-5 mm and >5 mm), the medium-to-high treatments (G2, G3, G4) were particularly effective. The 2-5 mm fraction increased by 25.07%, 38.72%, and 46.75% for G2, G3, and G4, while the >5 mm fraction expanded by 32.60%, 39.18%, and 18.87%, respectively, identifying G3 as the optimal treatment for promoting large aggregate formation.
These structural changes were quantitatively validated through aggregate stability indices (Table 2). The G2 and G3 treatments significantly increased the geometric mean diameter (GMD) by 29.82% and 46.41%, and the mean weight diameter (MWD) by 18.25% and 21.16%, respectively, relative to the CF baseline. The water-stable aggregate (WSA) proportion increased by 45.68% to 91.77% across G1–G4 treatments. Correspondingly, the unstable aggregate index (ELT) and fractal dimension (D) decreased significantly, with ELT declining by 1.72%–2.94% and D declining by 3.05%–8.49% under graphene application.
Correlation analysis (Figure 3) further clarified these physical interdependencies. Soil bulk density (BD) showed a significant positive correlation with fractal dimension (D), and significant negative correlations with GMD and WSA. MWD was positively correlated with WSA and GMD, and negatively correlated with ELT and D. These results collectively demonstrate that graphene improves soil physical quality by reducing structural instability (ELT and D) while enhancing aggregate stability indices (WSA, GMD, MWD), thereby promoting better soil aeration and root penetrability.
3.3. Effects of Graphene on Different Forms Soil Nitrogen
Graphene soil conditioner exerted dynamic, stage-specific, and dose-dependent regulatory effects on diverse soil nitrogen pools throughout the maize lifecycle (Figure 4).
Total nitrogen (TN) content (Figure 4A) exhibited a general temporal decline from the jointing stage (V6) to the tasseling stage (VT), followed by gradual stabilization through the maturing stage (R6). Throughout this period, TN levels under the G2 and G3 treatments were consistently and significantly higher than those under CF and G4, indicating that moderate graphene concentrations effectively retain total soil nitrogen and prevent premature depletion.
Alkaline-hydrolyzable nitrogen (AN), an indicator of readily available nitrogen for plant uptake, displayed marked stage-dependence (Figure 4B). During the early (V6) and terminal (R6) stages, low-to-medium graphene treatments (G1–G3) significantly increased soil AN by 6.11%–16.12% compared with the control, demonstrating effective nutrient preservation. The high-concentration G4 treatment did not differ significantly from CF at these stages. During the critical reproductive phases (VT and R3), all graphene treatments significantly increased AN content by 6.57%–11.01% without significant intra-group differences, ensuring elevated nitrogen availability during the period of peak biological demand.
Ammonium nitrogen (NH4+-N) displayed a parabolic “rise-then-decline” trajectory across the four sampling periods (Figure 4C). At the V6 stage, all graphene treatments significantly elevated NH4+-N relative to CF. At the VT stage, G1 and G2 maintained significant promotion of NH4+-N accumulation, while the efficacy of G4 began to attenuate. By the R6 stage, the G4 treatment had completely lost its promoting effect and exhibited an inhibitory trend on NH4+-N retention, underscoring the risks of excessive graphene application.
Nitrate nitrogen (NO3−-N), the primary mobile nitrogen source for upland crops, followed an “initial surge followed by gradual depletion” pattern (Figure 4D). The VT stage represented the critical window for NO3−-N accumulation, during which all graphene treatments (G1–G4) significantly increased the NO3−-N pool by 28.42%–32.85% over the CF baseline. During the late-season R3 and R6 stages, the medium doses (G2, G3) maintained a stable promoting effect on NO3−-N, whereas the regulatory capacity of G4 diminished significantly. These findings suggest that moderate graphene effectively buffers nitrate against mid-season leaching while sustaining its steady release.
3.4. Effects of Graphene on Soil Enzyme Activity
Soil extracellular enzymes serve as the catalytic drivers of nitrogen cycling. Graphene introduction induced stage-specific modulations of these biocatalysts (Figure 5).
Nitrate reductase (NR) activity displayed a single-peak dynamic, rising to a maximum at VT and declining toward maturity (Figure 5A). Relative to CF, graphene consistently elevated NR activity, with the most notable enhancements during the vegetative and early reproductive phases. At V6, all graphene treatments significantly increased NR activity. At the VT stage, the G3 treatment induced the highest NR activity, significantly exceeding all other treatments and providing strong metabolic support for reproductive development. During R3, despite an overall physiological decline, G1, G2, and G3 continued to exceed CF significantly. By R6, graphene-mediated NR enhancement effectively ceased, mirroring the physiological decline in crop nitrogen demand.
Nitrite reductase (NiR) activity closely paralleled the NR dynamics (Figure 5B). The V6 stage showed significant enzymatic activation under G1–G3, with G3 exhibiting the maximum activity. At VT, G2 and G3 maintained optimal NiR performance, facilitating nitrogen reduction and preventing localized nitrite accumulation. This advantage persisted through R3 but diminished by R6, confirming that graphene’s enzymatic modulation is responsive to the crop’s physiological rhythms.
Urease activity exhibited a more complex response (Figure 5C). At V6, G2 and G3 were significantly higher than CF. The VT stage revealed pronounced dose-dependent divergence: G1–G3 significantly elevated urease activity above the baseline, whereas G4 drastically inhibited urease function, falling below the CF level. This suggests potential nanotoxicity or steric blockage of enzyme active sites at high graphene concentrations. Throughout R3 and R6, moderate graphene treatments (G2, G3) consistently maintained a functional advantage over CF.
Protease activity, which drives organic nitrogen decomposition, also followed a single-peak trajectory (Figure 5D). At VT, G1–G3 significantly increased protease activity by 7.33%–23.90% over CF. During R3, G2 retained the highest residual activity. By R6, G1–G3 maintained protease activity 13.91%–22.30% above CF, while G4 was indistinguishable from the control.
Hydroxylamine reductase (HAR) activity followed similar trends (Figure 5E). At VT, G3 achieved the highest HAR activity. The most pronounced residual effects were at R3, where G2–G4 maintained levels 57.89%–88.20% higher than CF. By R6, the G4 effect had dissipated, while G2 and G3 sustained prolonged enzymatic enhancement.
3.5. Effects of Graphene on Ear Traits and Yield of Maize
As shown in Table 3, graphene application induced targeted morphological enhancements in the maize ear. While ear length remained statistically uniform across treatments, ear diameter was significantly increased by 11.54% and 11.35% under the G2 and G3 treatments, respectively, compared with CF. The bald tip length, an indicator of poor apical pollination or nutrient insufficiency, was significantly reduced by 19.15% and 15.14% under G2 and G3.
Yield components were similarly improved. The number of kernels per row increased significantly by 7.71% under G3, and cob diameter expanded by 21.19% under G3. Collectively, these improvements resulted in a definitive yield advantage: the G3 treatment achieved the highest maize yield per plant, with a significant increase of 10.81% over CF.
Path analysis was conducted to elucidate the relationships between yield (Y) and its primary components: ear row number (X1), kernels per row (X2), and 100-kernel weight (X3) (Table 4). Ear row number (X1) was identified as the primary driver of yield, with the highest significant positive correlation coefficient (0.589*) and the largest direct path coefficient (0.417), supplemented by a positive indirect effect (0.138) through 100-kernel weight. The 100-kernel weight (X3) emerged as the second most important factor, with a correlation of 0.572* and a direct path coefficient of 0.428. The number of kernels per row (X2) had minimal direct influence (0.085) and a non-significant correlation (0.298). These results indicate that graphene enhances maize yield primarily through increasing ear row number and 100-kernel weight.
3.6. Effects of Graphene on Protein Components and Quality Index of Kernel
The nutritional composition of maize kernels was significantly influenced by graphene-mediated nitrogen dynamics. Analysis of storage protein fractions (Figure 6) revealed that albumin, glutelin, and prolamin contents followed a parabolic response curve, initially increasing to a peak at moderate graphene levels before declining at high application rates. Globulin content showed no significant variation across treatments.
Assessment of kernel quality indices (Figure 7) confirmed substantial biochemical changes. Soluble sugar content (Figure 7A) increased significantly by 23.08%, 23.98%, and 17.69% under G2, G3, and G4 treatments, respectively. Total crude protein content (Figure 7B) increased by 7.81%–16.33% across all graphene treatments, linking enhanced soil nitrogen retention to kernel protein synthesis. Crude fat (Figure 7C) showed moderate, significant elevations of 3.49%–9.62%, following the parabolic trend. Sucrose content (Figure 7D) responded selectively to moderate graphene application, with only G2 and G3 achieving significant increases of 27.7% and 29.1%.
Carbohydrate composition within the kernel was markedly restructured. Graphene treatments universally increased amylose content by 10.28%–19.16% (Figure 7E). In contrast, amylopectin content declined dose-dependently, with significant reductions of 11.38%–29.89% across G1–G4. Total starch content (Figure 7F) also decreased significantly by 4.22%–14.39% across treatments. This pattern indicates a metabolic trade-off in which graphene-enhanced nitrogen availability preferentially supports protein and soluble sugar synthesis at the expense of starch accumulation.
4. Discussion
4.1. Mechanisms of Graphene on Soil Physical Restructuring
Soil structural integrity, governed by bulk density and aggregate stability, establishes the fundamental physical environment for root growth, gas exchange, and water dynamics. Owing to its porous nano-architecture and large specific surface area, graphene functions as an active soil conditioner rather than a passive additive [33,34]. Our results demonstrated that graphene application systematically reduced soil bulk density by 7.18%–12.80% and improved soil aggregate stability. Although the physical dilution effect—arising from the much lower bulk density of graphene (~0.12 g·cm−3) compared with native chernozem (1.20–1.40 g·cm−3)—may partly account for bulk density reduction, the mechanisms are more complex [35].
The primary mechanism involves graphene acting as a biogeochemical nucleating agent for aggregate formation. Water-stable macroaggregates (>0.25 mm) are essential for root penetration, aerobic respiration, and moisture regulation [36]. Our results showed that graphene promoted the formation and stabilization of macroaggregates, with peak GMD and MWD values under the G3 treatment indicating optimal structural enhancement [22]. When dispersed within the soil matrix, graphene’s vast surface area and oxygen-containing functional groups adsorb dissolved organic compounds, humic acids, and free inorganic cations, initiating the formation of organic–inorganic composite complexes that bind dispersed mineral particles into water-stable macroaggregates [37]. Additionally, carbon-rich nanomaterial inputs stimulate microbial proliferation, and the resulting extracellular polymeric substances (EPS) further bind soil particles, reducing both fractal dimension (D) and the unstable aggregate index (ELT) [38]. Consequently, graphene constructs an optimized porous soil matrix that provides favorable hydrothermal and gaseous conditions for maize root development [39].
4.2. Regulatory Dynamics of Graphene on the Soil Nitrogen Cycle
Beyond physical improvement, graphene serves as soil conditioner for nitrogen fertilizers, addressing the chronic problems of rapid nutrient leaching and ammonia volatilization associated with conventional fertilization [30]. Standard application of urea and diammonium phosphate frequently produces acute nitrogen spikes that exceed immediate crop uptake capacity [41]. When graphene is incorporated into the fertilization regime, its cation/anion exchange capacity and large electrostatic surface area effectively trap nitrogenous ions and water molecules [4,42].
In our study spanning the V6 to R6 stages, total nitrogen exhibited a natural temporal decline consistent with crop extraction and continuous consumption of the available nitrogen pool. However, the critical differentiation emerged within bioavailable fractions. Low-to-medium graphene treatments consistently maintained significantly higher concentrations of alkaline-hydrolyzable nitrogen (AN), ammonium (NH4+-N), and nitrate (NO3−-N) during key physiological windows. This is attributed to a slow-release effect: graphene physically sequesters NH4+ through electrostatic interactions with its negatively charged surface functional groups and retains NO3− within nanoscale pores, protecting these ions from leaching [43] and volatilization [44].
Importantly, this retention is kinetically synchronized with crop demand rather than permanent. The targeted surge of NO3−-N during the VT stage illustrates a delayed release mechanism that matches the peak nitrogen requirement for inflorescence development and kernel initiation [41]. Increased NH4+-N is further supported by graphene’s indirect stimulation of ammonifying microbial communities, accelerating organic nitrogen conversion to plant-available ammonium [45]. However, the extreme application rate (G4) frequently exhibited functional attenuation or inhibition of bioavailable nitrogen in late stages (R6). This suggests that excessive graphene may cause irreversible physical adsorption of nutrients, rendering them biologically inaccessible, or induce mild nanotoxicity that suppresses microbial nitrogen mineralization [46]. Thus, moderate graphene application optimizes the kinetic transformation, spatial distribution, and lifecycle-synchronized availability of the soil nitrogen pool rather than simply increasing total nitrogen reserves [47].
4.3. Graphene’s Scaffolding Effect on Nitrogen-Metabolizing Enzymes Activities
Extracellular soil enzymes are the biological mediators of organic matter decomposition and nutrient cycling, and their activities reflect soil ecological health [48]. Within the nitrogen cycle, nitrate reductase (NR) and nitrite reductase (NiR) serve as rate-limiting enzymes, while urease and protease govern the mineralization of applied urea and native proteins [49]. Our results demonstrated stage-specific enhancement of NR, NiR, urease, protease, and hydroxylamine reductase (HAR) activities under moderate graphene (G2, G3) treatments .
The mechanism underlying this enzymatic enhancement relates to graphene’s function as a nanoscale immobilization scaffold [22]. Free extracellular enzymes in soil are susceptible to proteolytic degradation, thermal denaturation, and irreversible binding to clay minerals. The two-dimensional planar structure of graphene provides an extensive, chemically active surface for enzyme adsorption [50]. Enzymes bind to graphene sheets via hydrogen bonding, van der Waals forces, and electrostatic interactions mediated by oxygenated functional groups. This immobilization stabilizes the enzyme’s active conformation, shielding it from denaturation, while simultaneously concentrating substrates (such as urea or nitrate) at the active site, thereby increasing enzyme–substrate collision frequency and catalytic efficiency [51].
Concurrently, by alleviating soil compaction and improving aeration, graphene creates favorable micro-habitats for the proliferation of aerobic microorganisms that synthesize these enzymes [22]. However, consistent with the hormesis principle commonly observed in nanomaterial ecotoxicology, a “low-dose stimulation, high-dose inhibition” biphasic response was evident [52]. At the VT and R6 stages, the G4 treatment significantly suppressed urease and HAR activities. This high-concentration inhibition likely results from nanoparticle agglomeration, whereby aggregated graphene sheets physically block enzyme active sites, or from excessive nanomaterial loads inducing oxidative stress and membrane damage in microbial cells, inhibiting enzyme biosynthesis [53]. Therefore, precise calibration of graphene dosage is essential to realize its biocatalytic benefits without disrupting soil micro-ecological equilibrium.
4.4. Linking Soil Micro-Environmental Optimization Into Maize Yield and Quality
Crop yield and kernel quality represent the macroscopic outcomes of optimized subterranean conditions. Yield formation depends on the continuous accumulation and strategic partitioning of photosynthetic dry matter, which is fundamentally constrained by sustained nitrogen availability [54]. Previous studies have indicated that nanocarbon amendments can enhance cereal yields [55]. Our path analysis revealed that ear row number and 100-kernel weight are the primary determinants of yield improvement.
The G2 and G3 treatments significantly increased cob diameter, kernel row count, and ultimately achieved a 10.81% increase in per-plant yield. This improvement is directly linked to graphene-mediated soil changes: structural loosening facilitated broader and deeper root proliferation for enhanced nutrient foraging [56]. Concurrently, the synchronized slow-release of NO3− and NH4+, coupled with elevated NR and NiR activities during the critical VT-to-R3 transition, ensured that maize plants experienced no transient nitrogen deficiency during the high-demand grain-filling period.
The biochemical composition of maize kernels also underwent significant restructuring. Our quality analysis showed that graphene application significantly increased glutelin and total crude protein content, along with substantial increases in soluble sugars and sucrose. Conversely, amylopectin accumulation was markedly suppressed. This indicates metabolic reprioritization: the enhanced nitrogen supply mediated by graphene selectively promoted amino acid and protein synthesis pathways, channeling carbon skeletons toward protein and sucrose production at the expense of starch polymerization [57]. Consequently, graphene not only enhances yield but also improves the nutritional quality of maize grain.
This study acknowledges certain limitations. The experimental period covers a single growing cycle; therefore, the long-term fate of graphene in soil—including its degradation dynamics and persistent effects on microbial community structure—requires extended field-scale investigation. Future research should integrate advanced transcriptomic and stable isotope probing (SIP) technologies to elucidate the molecular mechanisms and gene regulatory networks through which graphene influences functional nitrogen-cycling microbial communities, supporting the validation of this nanotechnology for commercial agricultural application [56].
5. Conclusions
Appropriate application rate of graphene reduces soil bulk density, enhances the stability of soil aggregates, and increases the mean weight diameter (MWD), water-stable aggregate (WSA) content, and geometric mean diameter (GMD). These improvements lead to better soil aeration and water retention. Moreover, graphene activates nitrogen in the soil and strengthens its nitrogen supply capacity. It also significantly boosts the activity of nitrogen metabolism-related enzymes, promotes soil nitrogen transformation, and further enhances nitrogen availability. These changes provide a material basis for increasing maize yield and improving kernel quality. As a promising nano-carbon material for agricultural application, The graphene application rate of 2 g·kg−1 exhibited the most pronounced effects in this study.
Author Contributions
W Guo designed and supervised this study. H Y Sun and W Guo wrote and revised the manuscript. All authors participated in the review process. All authors have read and agreed to the published version of the manuscript.
Funding
This research received no external funding.
Data Availability Statement
The original contributions presented in this study are included in the article. Further inquiries can be directed to the corresponding author.
Acknowledgments
We would like to thank the editor and reviewers for their suggestions for improving the framework and language within this manuscript.
Conflicts of Interest
The authors declare that the research was conducted in the absence of any commercial or financial relationships that could be construed as potential conflicts of interest.
References
- Li, R.; Hu, W.Y.; Jia, Z.J.; Liu, H.Q.; Zhang, C.; Huang, B.; Yang, S.H.; Zhao, Y.G.; Zhao, Y.C.; Shukla, M.K.; Taboada, M.N. Soil degradation: a global threat to sustainable use of black soils. Pedosphere 2024, 35, 264–279. [Google Scholar] [CrossRef]
- Wu, Z.X.; Jiang, J.Y.; Dong, W.C.; Cui, S. The Spatiotemporal characteristics and driving factors of soil degradation in the black soil region of Northeast China. Agronomy 2024, 14, 2870. [Google Scholar] [CrossRef]
- Ma, R.; Tian, Z.; Zhao, Y.; Wu, Y.; Liang, Y. Response of soil quality degradation to cultivation and soil erosion: A case study in a mollisol region of Northeast China. Soil and Tillage Res. 2024, 10, e106159. [Google Scholar] [CrossRef]
- Zhao, C.; Li, Y.; Huang, W.; He, N.; Borham, A.; Wang, J. Soil nutrient changes in black soil of Northeastern China under long-term cultivation with different fertilizer applications and tillage patterns: A meta-analysis. Commun. Soil Sci. Plant Anal. 2024, 56, 894–910. [Google Scholar] [CrossRef]
- Usman, M.; Farooq, M.; Wakeel, A.; Nawaz, A.; Cheema, S.; Rehman, H.; Ashraf, I.; Sanaullah, M. Nanotechnology in agriculture: Current status, challenges and future opportunities. Sci. Total Environ. 2020, 721, 137778. [Google Scholar] [CrossRef]
- Sharma, S.; Kundu, P.; Tyagi, D.; Shanmugam, V. Graphene-based nanomaterials applications for agricultural and food sector. Adv. Colloid Interface Sci. 2024, 336, 103377. [Google Scholar] [CrossRef]
- Bhattacharya, N.; Cahill, D.; Yang, W.; Kochar, M. Graphene as a nano-delivery vehicle in agriculture-current knowledge and future prospects. Crit.Revi. Biotechnol. 2022, 43, 851–869. [Google Scholar] [CrossRef]
- Li, L.J.; Tang, Y.M.; Bao, Z.J.; Tu, W.Y.; Peng, L.X.; Zou, L.; Zhao, C.S.; Li, Q. When graphene meets circular agriculture: Insights into agricultural sustainable development. Biosyst. Engin 2024, 237, 92–117. [Google Scholar] [CrossRef]
- Qiao, J.; Chen, Z.W.; Zhao, J.G.; Ren, J.; Wang, H.; Zhi, C.Y.; Li, J. W.; Xing, B.Y.; Nie, H. Graphene promotes the growth of Vigna angularis by regulating nitrogen metabolism and photosynthesis. Plos one 2024, 19, e0297892. [Google Scholar] [CrossRef] [PubMed]
- Luo, L.; Zhang, Y.; Xu, G. How does nitrogen shape plant architecture? J. Exp. Bot. 2020, 71, 4415–4427. [Google Scholar] [CrossRef] [PubMed]
- Anas, M.; Liao, F.; Verma, K.; Sarwar, M.; Mahmood, A.; Chen, Z.; Li, Q.; Zeng, X.; Liu, Y.; Li, Y. Fate of nitrogen in agriculture and environment: agronomic, eco-physiological and molecular approaches to improve nitrogen use efficiency. Biol. Res. 2020, 53, 47–66. [Google Scholar] [CrossRef] [PubMed]
- Bhatt, R.; Kunal; Moulick, D.; Barek, V.; Brestic, M.; Gaber, A.; Skalicky, M.; Hossain, A. Sustainable strategies to limit nitrogen loss in agriculture through improving its use efficiency—aiming to reduce environmental pollution. J. Agric. Food Res. 2025, 22, 101957. [Google Scholar] [CrossRef]
- Geim, A. K.; Novoselov, K.S. The rise of graphene. Nat. Mater. 2007, 6, 183–191. [Google Scholar] [CrossRef]
- Avouris, P. Graphene: electronic and photonic properties and devices. Nano Lett. 2010, 11, 4285–4294. [Google Scholar] [CrossRef]
- Xiu, L.Q.; Zhang, W.M.; Wu, D.; Sun, Y.Y.; Zhang, H.H.; Gu, W.Q.; Wang, Y.N.; Meng, J.; Chen, W.F. Biochar can improve biological nitrogen fixation by altering the root growth strategy of soybean in Albic soil. Sci. Total Environ. 2021, 773, 144564. [Google Scholar] [CrossRef]
- Hu, X.G.; Zhou, Q.X. Novel hydrated graphene ribbon unexpectedly promotes aged seed germination and root differentiation. Sci. Rep. 2014, 4, 3782–3790. [Google Scholar] [CrossRef]
- Chen, Z.; Guo, Z.; Xu, N.; Cao, X.; Niu, J. Graphene nanoparticles improve alfalfa (Medicago sativa L.) growth through multiple metabolic pathways under salinity-stressed environment. J. Plant Physiol. 2023, 289, 154092. [Google Scholar] [CrossRef]
- Andelkovic, I.B.; Kabiri, S.; Tavakkoli, E. Graphene oxide-Fe(III) composite containing phosphate-a novel slow release fertilizer for improved agriculture management. J. Clean. Prod. 2018, 185, 977–1004. [Google Scholar] [CrossRef]
- Sun, Y.; Zhu, G.K.; Zhao, W.C. Engineered nanomaterials for improving the nutritional quality of agricultural products: A review. Nanomater. 2022, 12, 4219–4237. [Google Scholar] [CrossRef]
- Fang, J; Weng, Y.N.; Li, B.E.; Liu, H.J.; Liu, L.J.; Tian, Z.L.; Du, S.T. Graphene oxide decreases the abundance of nitrogen cycling microbes and slows nitrogen transformation in soils. Chemosphere 2022, 309, 136642. [Google Scholar] [CrossRef] [PubMed]
- Wang, Q.; Li, X.; Zhang, J. Effects of nitrogen application on soil pH, bacterial community, and available nitrogen in a wheat-maize rotation system. Eur. J. Soil Sci. 2022, 73, 1115–1126. [Google Scholar]
- Das, P.; Barker, C.; Park, Y.; Perreault, F.; Westerhoff, P.; Penton, C. Impact of graphite nano amendments on soil enzyme activities, functional genes and microbiome composition in a soil-plant system. Soil Biol. Biochem. 2025, 109714. [Google Scholar] [CrossRef]
- Yang, C.D.; Lu, S.G. Effects of five different biochars on aggregation, water retention and mechanical properties of paddy soil: A field experiment of three-season crops. Soil Tillage Res. 2021, 205, 104798. [Google Scholar] [CrossRef]
- Bremner, J.M.; Mulvaney, C.S. Methods of soil analysis. Part 2; American Society of Agronomy, Soil Science Society of America: Madison, 1996; pp. 1085–1121. [Google Scholar]
- Song, J.F.; Cao, K.; Duan, C.W.; Luo, N.; Cui, X.Y. Effects of graphene on Larix olgensis seedlings and soil properties of Haplic Cambisols in Northeast China. Forests 2020, 11, 258. [Google Scholar] [CrossRef]
- Cataldo, D.A.; Maroon, M.; Schrader, L.E. Phenol-disulfonic acid determination of nitrate-nitrogen in water extracts of plant tissue. Commun. Soil Sci. Plant Anal. 1973, 4, 717–778. [Google Scholar]
- Rong, Y.; Wang, Y.; Guan, Y.; Cai, Z.; Yang, G.; Zhao, X. Pyrosequencing reveals soil enzyme activities and bacterial communities impacted by graphene and its oxides. J. Agric. Food Chem. 2017, 65, 9191–9199. [Google Scholar] [CrossRef] [PubMed]
- Abdelmagid, H.M.; Tabatabai, M.A. Nitrate reductase activity of soils. Soil Biol. Biochem. 1987, 19, 421–427. [Google Scholar] [CrossRef]
- Cleemput, O.; Samater, A. Nitrite in soils: accumulation and role in the formation of gaseous N compounds. Fertil. Res. 1995, 45, 81–89. [Google Scholar] [CrossRef]
- Zhao, Y.; Wang, Y.; Sun, S.; Liu, W.; Zhu, L.; Yan, X. Different forms and proportions of exogenous nitrogen promote the growth of alfalfa by increasing soil enzyme activity. Plants 2022, 11, 1057. [Google Scholar] [CrossRef]
- Nayyar, H.; Bains, T.; Kumar, S. Low temperature induced floral abortion in chickpea: relationship to abscisic acid and cryoprotectants in reproductive organs. Environ. Exp. Bot. 2005, 53, 39–47. [Google Scholar] [CrossRef]
- Weegels, P.L.; Pijpekamp, A.M.; Graveland, A.; Hamer, L.J.; Schofield, J.D. Depolymerisation and repolymerisation of wheat glutenin during dough processing. I. Relationships between glutenin macropolymer content and quality parameters. J. Cereal Sci. 1996, 23, 103–111. [Google Scholar] [CrossRef]
- Liu, R.Q.; Lal, R. Potentials of engineered nanoparticles as fertilizers for increasing agronomic productions. Sci. Total Environ. 2015, 514, 131–139. [Google Scholar] [CrossRef]
- Liu, Z.Y.; Zhou, M.; Liao, W.F.; Liu, J.Y.; Luo, C.G.; Lu, C.Y.; Chen, Z.W.; Zhu, H.W. Fertilizer-holding performance of graphene on soil colloids based on double electric layer theory. Mater. 2023, 16, 2578. [Google Scholar] [CrossRef]
- Alessandrino, L.; Eusebi, A.L.; Aschonitis, V.; Mastrocicco, M.; Colombani, N. Variation of the hydraulic properties in sandy soils induced by the addition of graphene and classical soil improvers. J. Hydrol. 2022, 612, 128256. [Google Scholar] [CrossRef]
- Zhou, M.; Liu, C.Z.; Wang, J.; Meng, Q.F.; Yuan, Y.; Ma, X.F.; Liu, X.B.; Zhu, Y.X.; Ding, G.W.; Zhang, J.Z.; Zeng, X.N.; Du, W.L. Soil aggregates stability and storage of soil organic carbon respond to cropping systems on black soils of Northeast China. Sci. Rep. 2020, 10, 265–277. [Google Scholar] [CrossRef]
- Wang, Q.H.; Li, C.; Wang, Y.; Que, X.E. Phytotoxicity of graphene family nanomaterials and its mechanisms: A review. Front. Chem. 2019, 7, 292–298. [Google Scholar] [CrossRef]
- Costa, O.; Raaijmakers, J.; Kuramae, E. Microbial extracellular polymeric substances: ecological function and impact on soil aggregation. Front. Microbiol. 2018, 9, 1636–1649. [Google Scholar] [CrossRef]
- Wang, S.Y.; Liu, Y.; Wang, X.Y.; Xiang, H.T.; Kong, D.Y.; Wei, N.; Guo, W.; Sun, H.Y. Effects of graphene amendment on nutrient content, maize growth, and soil physicochemical parameters. Sci. Rep. 2023, 13, 2650–2662. [Google Scholar] [CrossRef] [PubMed]
- Verma, K.K.; Song, X.P.; Degu, D.H.; Guo, D. J.; Joshi, A.; Huang, H.R.; Xu, L.; Singh, M.; Huang, D.L.; Rajput, V.D.; Li, Y.R. Recent advances in nitrogen and nano-nitrogen fertilizers for sustainable crop production: a mini-review. Chem. Biol. Technol. Agric. 2023, 10, 111–124. [Google Scholar] [CrossRef]
- Haydar, M.; Ghosh, D.; Roy, S. Slow and controlled release nanofertilizers as an efficient tool for sustainable agriculture: Recent understanding and concerns. Plant NanoBiol. 2024, 7, 100058. [Google Scholar] [CrossRef]
- Zhao, F.L.; Xin, X.P.; Cao, Y.E.; Su, D.; Ji, P.H.; Zhu, Z.Q.; He, Z.L. Use of carbon nanoparticles to improve soil fertility, crop growth and nutrient uptake by corn (Zea mays L.). Nanomater. 2021, 11, 2717–2731. [Google Scholar] [CrossRef]
- Das, P.; Penton, C.R.; Bi, Y.Q.; Westerhoff, P. Unraveling mechanisms behind reduced nitrate leaching with graphite nanomaterials addition with fertilizers in soil column experiments. Chemosphere 2023, 337, 139417. [Google Scholar] [CrossRef] [PubMed]
- Guo, H.Y.; White, J.C.; Wang, Z.Y.; Xing, B.S. Nano-enabled fertilizers to control the release and use efficiency of nutrients. Cur. Opin. Environ. Sci. Health 2018, 6, 77–83. [Google Scholar] [CrossRef]
- Das, P.; Davis, K.; Penton, C.R.; Westerhoff, P.; Bi, Y.Q. Impacts of graphitic nanofertilizers on nitrogen cycling in a sandy, agricultural soil. J. Nanopart. Res. 2022, 24, 120. [Google Scholar] [CrossRef]
- Saraiva, R.; Ferreira, Q.; Rodrigues, G.; Oliveira, M. Graphene oxide and its viability as a constituent in nanofertilizers. Front. Nanotechnol. 2025, 7, 1580066. [Google Scholar] [CrossRef]
- Fincheira, P.; Hoffmann, N.; Tortella, G.; Ruíz, A.; Cornejo, P.; Diez, M.C; Seabra, A.B.; Benavides-Mendoza, A.; Rubilar, O. Eco-efficient systems based on nanocarriers for the controlled release of fertilizers and pesticides: toward smart agriculture. Nanomater. 2023, 13, 1978–1989. [Google Scholar] [CrossRef] [PubMed]
- Datta, R.; Anand, S.; Moulick, A.; Baraniya, D.; Pathan, S.; Rejšek, K.; Vranová, V.; Sharma, M.; Sharma, D.; Kelkar, A.; Formánek, P. How enzymes are adsorbed on soil solid phase and factors limiting its activity: A Review. Int. Agrophys 2017, 31, 287–302. [Google Scholar] [CrossRef]
- Syshchykov, D.; Berezovskiy, A.; Agurova, I. The influence of degradation processes on enzymatic activity and the content of forms of mineral nitrogen in agricultural soils. Dokuchaev Soil Bull. 2024, 121, 28–46. [Google Scholar] [CrossRef]
- Adeel, M.; Bilal, M.; Rasheed, T.; Sharma, A.; Iqbal, H. Graphene and graphene oxide: Functionalization and nano-bio- catalytic system for enzyme immobilization and biotechnological perspective. Int. J. Biol. Macromol. 2018, 120, 1430–1440. [Google Scholar] [CrossRef]
- Jin, L.X.; Son, Y.; Yoon, T.K.; Kang, Y.J.; Kim, W.; Chung, H. High concentrations of single-walled carbon nanotubes lower soil enzyme activity and microbial biomass. Ecotoxicol..Environ. Saf. 2013, 88, 9–15. [Google Scholar] [CrossRef]
- Fang, J.; Weng, Y.N.; Li, B.E.; Liu, H.J.; Liu, L.J.; Tian, Z.L.; Du, S.T. Graphene oxide decreases the abundance of nitrogen cycling microbes and slows nitrogen transformation in soils. Chemosphere 2022, 309, 136642. [Google Scholar] [CrossRef]
- Chung, H.; Kim, M.J.; Ko, K.; Kim, J.H.; Kwon, H.A.; Hong, I.; Park, N.; Lee, S.W.; Kim, W. Effects of graphene oxides on soil enzyme activity and microbial biomass. Sci. Total Environ. 2015, 514, 307–313. [Google Scholar] [CrossRef]
- Fan, P.P.; Ming, B.; Evers, J.B.; Li, Y.Y; Li, S.K.; Xie, R.Z.; Anten, N.P.R. Nitrogen availability determines the vertical patterns of accumulation, partitioning, and reallocation of dry matter and nitrogen in maize. Field Crops Res. 2023, 297, 108927. [Google Scholar] [CrossRef]
- Hatakeyama, Y.; Araki, T.; Hatakeyama, K. Effects of prolonged graphene oxide treatment on biomass production and grain yield in hydroponically grown rice. ACS Agric. Sci. Technol. 2024, 11, 1184–1193. [Google Scholar] [CrossRef]
- Chen, Z.W.; Zhao, J.G.; Song, J.; Han, S.H.; Du, Y.Q.; Qiao, Y.Y.; Liu, Z.H.; Qiao, J.; Li, W.J.; Li, J.W.; Wang, H.Y.; Xing, B.Y.; Pan, Q.L. Influence of graphene on the multiple metabolic pathways of Zea mays roots based on transcriptome analysis. Plos One 2021, 16, e0244856. [Google Scholar] [CrossRef] [PubMed]
- Shewry, P.R.; Halford, N.G. Cereal seed storage proteins: structures, properties and role in grain utilization. J. Exp. Bot. 2002, 53, 947–958. [Google Scholar] [CrossRef]
Figure 1.
Characterization of graphene. (A) Scanning electron microscope images of graphene; (B) Raman spectra of graphene.
Figure 1.
Characterization of graphene. (A) Scanning electron microscope images of graphene; (B) Raman spectra of graphene.

Figure 2.
Effect of graphene on soil bulk density and aggregate size distribution. Different lowercase letters above error bars indicate significant difference among treatments (p<0.05, LSD test).
Figure 2.
Effect of graphene on soil bulk density and aggregate size distribution. Different lowercase letters above error bars indicate significant difference among treatments (p<0.05, LSD test).

Figure 3.
Correlation analysis among soil physical properties indicators.

Figure 4.
Effect of graphene on different forms nitrogen content in soil. Different lowercase letters above error bars indicate significant difference among treatments (p<0.05, LSD test).
Figure 4.
Effect of graphene on different forms nitrogen content in soil. Different lowercase letters above error bars indicate significant difference among treatments (p<0.05, LSD test).

Figure 5.
Effect of graphene on soil enzyme activities. Different lowercase letters above error bars indicate significant differences among treatments (p<0.05, LSD test).
Figure 5.
Effect of graphene on soil enzyme activities. Different lowercase letters above error bars indicate significant differences among treatments (p<0.05, LSD test).

Figure 6.
Effects of graphene on protein components in maize kernel. Different lowercase letters above error bars indicate significant difference between treatment (p<0.05, LSD test).
Figure 6.
Effects of graphene on protein components in maize kernel. Different lowercase letters above error bars indicate significant difference between treatment (p<0.05, LSD test).

Figure 7.
Effect of graphene on quality of maize kernel. Different lowercase letters above error bars indicate significant difference between treatment (p<0.05, LSD test).
Figure 7.
Effect of graphene on quality of maize kernel. Different lowercase letters above error bars indicate significant difference between treatment (p<0.05, LSD test).


Table 1.
Experimental design.
| Test code | Graphene amount (g·kg−1) |
| CF | 0 |
| G1 | 1 |
| G2 | 2 |
| G3 | 5 |
| G4 | 10 |
Table 2.
Effect of different graphene treatments on soil water-stable aggregate stability indexes. Data are represented the mean ± SE. Different lowercase letters above error bars indicate significant difference among treatments (p<0.05, LSD test).
Table 2.
Effect of different graphene treatments on soil water-stable aggregate stability indexes. Data are represented the mean ± SE. Different lowercase letters above error bars indicate significant difference among treatments (p<0.05, LSD test).
| Treatment | GMD (mm) | MWD (mm) | WSA (%) | ELT (%) | D |
| CF | 0.235±0.008cd | 0.378±0.024b | 0.243±0.015d | 91.384±2.510b | 3.452±0.074a |
| G1 | 0.258±0.012c | 0.363±0.043b | 0.402±0.028b | 92.558±2.277a | 3.279±0.125bc |
| G2 | 0.305±0.023b | 0.447±0.023a | 0.428±0.014b | 89.172±2.630d | 3.203±0.065c |
| G3 | 0.343±0.028a | 0..458±0.023a | 0.466±0.012a | 89.114±2.148d | 3.181±0.103c |
| G4 | 0.250±0.015c | 0.340±0.028bc | 0.354±0.011c | 90.293±1.307c | 3.355±0.198b |
Table 3.
Effects of graphene on yield and ear characteristics in maize in maturity. Data represent the mean±SE. Different lowercase letters above error bars indicate significant difference between treatment (p<0.05, LSD test).
Table 3.
Effects of graphene on yield and ear characteristics in maize in maturity. Data represent the mean±SE. Different lowercase letters above error bars indicate significant difference between treatment (p<0.05, LSD test).
| Treatments | CF | G1 | G2 | G3 | G4 |
| Ear length (cm) | 20.00±1.00 a | 20.67±0.29 a | 20.78±0.29 a | 21.45±0.32a | 19.88±1.00 a |
| Ear diameter(mm) | 47.22±0.77 b | 46.78±1.58 b | 52.67±2.08 a | 52.58±1.84a | 47.47±2.25 b |
| Bald length (cm) | 3.50±0.50 a | 3.50±0.50 a | 2.83±0.76 b | 2.97±0.42b | 3.50±0.50 a |
| Kernels number of row | 35.67±0.58 b | 35.33±0.58 b | 38.00±0.24 a | 38.42±0.68a | 36.67±1.15 b |
| Row number of ear | 16.37±2.06 a | 15.33±1.15 b | 16.24±0.13 a | 16.78±0.82a | 16.67±3.16 a |
| Cob diameter (mm) | 24.30±1.57 b | 25.47±1.42 b | 29.07±0.83 a | 29.45±0.76a | 27.20±2.36 ab |
| Cob weight (g) | 38.94±0.68 a | 37.48±0.44 b | 37.78±0.61 b | 38.34±0.42a | 36.99±0.58 b |
| Yield (g·plant-1) | 179.35±6.31 b | 183.66±3.16 ab | 191.65±4.47 a | 198.74±5.41a | 184.57±3.38 ab |
Table 4.
Path analysis on yield and yield components in maize.
| Index | Correlation coefficient | Direct path coefficient | Indirect path coefficient | ||
| X1-Y | X2-Y | X3-Y | |||
| Ear row number (X1) | 0.589* | 0.417 | - | 0.034 | 0.138 |
| Kernel number per row (X2) | 0.298 | 0.085 | 0.168 | - | 0.045 |
| 100-kernel weight (X3) | 0.572* | 0.428 | 0.135 | 0.009 | - |
Disclaimer/Publisher’s Note: The statements, opinions and data contained in all publications are solely those of the individual author(s) and contributor(s) and not of MDPI and/or the editor(s). MDPI and/or the editor(s) disclaim responsibility for any injury to people or property resulting from any ideas, methods, instructions or products referred to in the content. |
© 2026 by the authors. Licensee MDPI, Basel, Switzerland. This article is an open access article distributed under the terms and conditions of the Creative Commons Attribution (CC BY) license (http://creativecommons.org/licenses/by/4.0/).
Copyright: This open access article is published under a Creative Commons CC BY 4.0 license, which permit the free download, distribution, and reuse, provided that the author and preprint are cited in any reuse.


